Embed Size (px)
Citation preview
THESISFORTHEDEGREEOFDOCTOROFPHILOSOPHY
Electron Microscopy of Oxide Formed on Nickel Alloy X-750 in Simulated Boiling Water Reactor Environment
SILVIATUZI
Department of Physics CHALMERS UNIVERSITY OF TECHNOLOGY
Gothenburg, Sweden 2017

II
ElectronMicroscopyofOxideFormedonNickelAlloyX-750inSimulatedBoilingWaterReactorEnvironmentSilviaTuziãSilviaTuzi,2017.ISBN: 978-91-7597-654-9 Löpnummer: 4335 i serien Doktorsavhandlingar vid Chalmers tekniska högskola. Ny serie (ISSN 0346-718X) MaterialsMicrostructureDepartmentofPhysicsChalmersUniversityofTechnologySE-41296GothenburgSwedenTelephone+46(0)31-7721000Cover:STEMEDXmapsofspecimenofnon-pre-oxidizedalloyX-750exposedfor840h.Printedby:ChalmersReproserviceGothenburg,Sweden2017
III
Electron Microscopy of Oxide Formed on Nickel Alloy X-750 in Simulated Boiling Water Reactor Environment Silvia Tuzi Department of Physics Chalmers University of Technology Göteborg, Sweden 2017
Abstract The environment of a nuclear reactor is hostile and the materials used have to withstand harsh and corrosive working conditions. Nickel alloy X-750 has been extensively used in the nuclear industry for the last 30 years. The good corrosion properties and the high strength at elevated temperatures made this material a good choice for springs, bolts, guide pins and spacer grids in boiling water reactors (BWRs). The focus of this thesis is on the spacer grid corrosion. A spacer grid is a metal lattice that holds the nuclear fuel in position. It is critical to limit the corrosion of the spacer grids so that the fuel is held stable for safety purposes and also since corrosion and dissolution of the alloy can lead to spread of radiation in the closed water system and consequently an increased risk of radiation exposure for maintenance workers at nuclear plants. A BWR operates at 286°C under a pressure of 70 bar, and the radiation induces radiolysis of the water, making it corrosive. Significant corrosion of alloy X-750 has been observed under these conditions. In order to study the high temperature water corrosion of alloy X-750, this aggressive environment was simulated in an autoclave system. In this thesis, the connection between the corrosion performance and the effect of pretreatments and the impact of iron content of the alloy is studied. The evolution of the oxide growth was studied by exposing the specimens in a temporal range from 2 h to 840 h. The samples have been studied with a set of complementary characterization techniques (mainly electron microscopy, but also X-ray diffraction and atom probe tomography), and focused ion beam milling has been used for sample preparation. Pre-oxidation treatment results in the formation of a thin multi-layer oxide, which improves the corrosion properties of the alloy, leading to contained dissolution of the metal. The oxide formed is composed of an outer layer of trevorite (NiFe2O4), a Cr-rich middle layer which is Ni-chromite in the outer part and chromia with some titania in the inner part. Of these oxides only trevorite is stable in BWR water and when comparing the 5 wt% Fe alloy with 8 wt% Fe, the latter performs better (i.e. dissolves and oxidizes less) as a result of a higher quality (thicker and compact) trevorite layer created by pre-oxidation. Since the pre-oxide layer could be lost during operation, it is important to know what will happen to the corrosion of alloy X-750 in this condition. In order to answer this question, the oxide evolution of non-pre-oxidized alloy X-750 has also been studied by comparing samples exposed for different times. During exposures in an autoclave, trevorite layer consisting of blocky crystals forms on the surface by re-precipitation of the dissolved metal. At the same time underlying metal is oxidized, forming a nano-grained and porous oxide layer. It has been shown that the dissolution rate and the growth rate of the oxides decrease with time, indicating that the formed oxides offer some degree of protection. Moreover, the alloy with higher Fe content corrodes less when exposed to longer exposure time, which makes it a preferable candidate for reactor operations. This thesis constitutes a step on the way to understand BWR corrosion of alloy X-750, which eventually will make it possible to develop improved spacer grid materials. Keywords: Corrosion, oxidation, alloy X-750, boiling water reactors, nickel alloys, electron microscopy.
IV
PREFACE
This thesis work was conducted at the division of Materials Microstructure Chalmers University of Technology, department of Physics at Chalmers University of Technology, Goteborg, Sweden, during the period April 2013 to December 2017, under the supervision of Associate Professor Mattias Thuvander and Professor Krystyna Stiller.
LIST OF APPENDEND PAPERS
1. Oxide evolution on alloy X-750 in Simulated BWR Environment Silvia Tuzi, Kenneth Göransson, Seikh M.H. Rahman, Sten G. Eriksson, Fang Liu, Mattias Thuvander, and Krystyna Stiller Journal of Nuclear Materials 482 (2016) 19–27. doi:10.1016/j.jnucmat.2016.09.026.
2. The influence of Fe content on the oxidation evolution on alloy X-750, in simulated BWR environment Silvia Tuzi, Krystyna Stiller and Mattias Thuvander In manuscript
3. Corrosion of pre-oxidized nickel alloy X-750 in simulated BWR environment Silvia Tuzi, Haiping Lai, Kenneth Göransson, Mattias Thuvander, Krystyna Stiller Journal of Nuclear Materials 486 (2017) 350–360. doi:10.1016/j.jnucmat.2017.01.051.
4. The impact of Fe content on the oxide growth of pre-oxidized alloy
X-750 Silvia Tuzi, Krystyna Stiller and Mattias Thuvander In manuscript
5. On the effect of preoxidation of Nickel alloy X-750
Silvia Tuzi, Kenneth Göransson, Fang Liu, Mattias Thuvander, and Krystyna Stiller Proceedings of the 18th International Conference on Environmental Degradation of Materials in Nuclear Power Systems – Water Reactors, Eds. J.H. Jackson, D. Paraventi, M.Wright The Metallurgical Society, Vol 2 pp. 413-422, August 13-17 2017 Portland,Oregon,USA
V
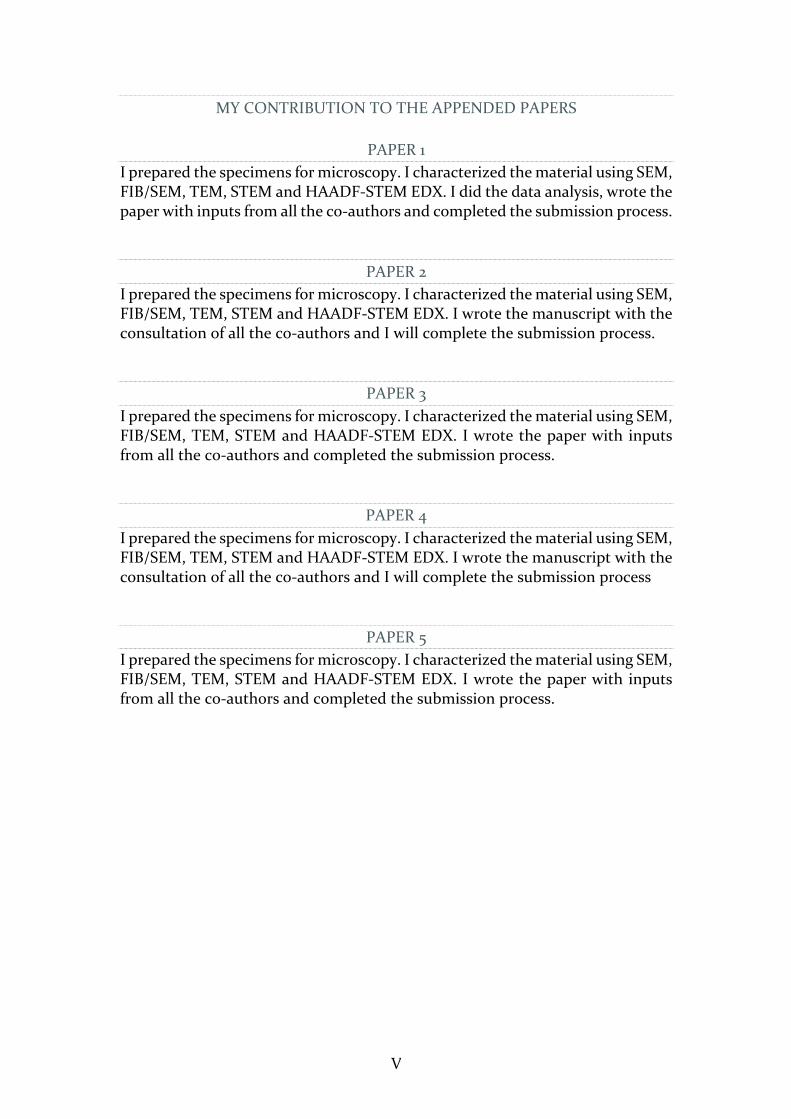
MY CONTRIBUTION TO THE APPENDED PAPERS
PAPER 1 I prepared the specimens for microscopy. I characterized the material using SEM, FIB/SEM, TEM, STEM and HAADF-STEM EDX. I did the data analysis, wrote the paper with inputs from all the co-authors and completed the submission process.
PAPER 2 I prepared the specimens for microscopy. I characterized the material using SEM, FIB/SEM, TEM, STEM and HAADF-STEM EDX. I wrote the manuscript with the consultation of all the co-authors and I will complete the submission process.
PAPER 3 I prepared the specimens for microscopy. I characterized the material using SEM, FIB/SEM, TEM, STEM and HAADF-STEM EDX. I wrote the paper with inputs from all the co-authors and completed the submission process.
PAPER 4 I prepared the specimens for microscopy. I characterized the material using SEM, FIB/SEM, TEM, STEM and HAADF-STEM EDX. I wrote the manuscript with the consultation of all the co-authors and I will complete the submission process
PAPER 5 I prepared the specimens for microscopy. I characterized the material using SEM, FIB/SEM, TEM, STEM and HAADF-STEM EDX. I wrote the paper with inputs from all the co-authors and completed the submission process.
VI
In addition to the above papers, I contributed to the following papers which are not included in this thesis:
• Investigation of effects of pickling and Fe contents on the corrosion resistance of Ni based alloy X-750 in BWRs
Haiping Lai, Kenneth Göransson, Yu Cao, Silvia Tuzi, Mattias Thuvander and Krystyna Stiller, Conference Proceeding, 16th International Conference on Environmental Degradation of Material in Nuclear Power Sistem-Water Reactors, 11-15 August 2013, Asheville, North Carolina, USA
• Corrosion behaviour of alloy X-750 in BWR fuel at high flow rates
K. Göransson, L. Hallstadius, C. Gustafsson, H. Lai, S. Tuzi, M. Thuvander, K. Stiller, A. Kucuk and B. Josefsson, Conference proceeding Top Fuel 2015, 13-17 September 2015 Zurich, Switzerland
• Cryogenic W-band LNA for ALMA Band 2+3 with Average Noise Temperature of 24K
Yulung Tang, Niklas Wadefalk, Jacob Kooi, Joel Schleeh, Giuseppe Moschetti, Per-Åke Nilsson, Arsalan Pourkabirian, Eunjung Cha, Silvia Tuzi, Jan Grahn, Microwave Symposium (IMS), 2017 IEEE MTT-S International, 4-9 June 2017, Honololu, Hawai, Doi: 10.1109/MWSYM.2017.8058981
TABLE OF CONTENTS
1.Introduction 3 1.1 Background 3 1.2 Aim of Research 4
2.Materials 5 2.1 Nickel-based Alloy X-750: Production and Properties 5 2.2 Alloy X-750 in the Nuclear Industry 8
3 General Corrosion 11 3.1 Boiling Water Reactor Environment 12 3.2 The Point Defect Model for Corrosion in Aqueous Solutions 15 3.3 Oxidation Kinetics 16 3.4 Pre-oxidation of Nickel alloys 18 3.5 Nickel Alloys in High Temperature Water 19
4 Characterization Techniques 21 4.1 Electron Microscopy 21 4.2 Scanning Electron Microscopy - SEM 21 4.3 Energy Dispersive X-ray-EDX 23 4.4 Focused Ion Beam - FIB/SEM 25 4.5 FIB-Sample Preparation 26
4.5.1 Cross sections 26 4.5.2 Thin foil lamella for TEM 27
4.6 Transmission Electron Microscopy - TEM 28 4.7 Atom Probe Tomography - APT 29 4.8 X-ray Diffraction-XRD 30 4.9 Autoclave Exposure 31
5 Results and Discussion 33 5.1 The oxide growth evolution of non-pre-oxidized specimens 34 5.2 The corrosion behavior of pre-oxidized Alloy X-750 37 5.3 Comparison of pre-oxidized and non-pre-oxidized 8FE specimens 39 5.4 Future work 39
References 43

2
3
1.INTRODUCTION
1.1 BACKGROUND
The sustainability of the fossil fuel based energy society is questioned by the growing concerns over global warming effects. In order to fight climate change, many different energy technologies have been developed as valid alternatives to fossil fuels. While solar, wind, geothermal and hydro energy based technologies have been easily accepted by the majority of the population, nuclear based energy has often been the object of discussion. Undoubtedly, nuclear energy is a crucial means to battle the greenhouse effect, together with the other sustainable energy sources. Nuclear energy produces low emissions of CO2, in terms of emission for a life-cycle, comparable to the renewable sources [1]. Furthermore, the increased interested in building new nuclear power plants is boosted by the fact that the new sources of energy as photovoltaic, biomass combustion and wind power are still distant from totally replacing fossil fuel. Generation III type plants are being built around the world and Generation IV is, currently, the object of research and development in many countries. However, the large majority of reactors in operation today are of Generation II type. There are over 440 commercial nuclear power reactors operable in 30 countries and they provide about 11% of the world’s electricity, reliable power to meet base-load demands without carbon dioxide emissions [2,3]. Sweden has eight nuclear reactors which provide 40% of the electricity demand [4].
The working conditions of nuclear reactors are severe, and they put high demands on what the materials have to withstand, as irradiation, high temperature and a chemically aggressive coolant. General corrosion of the materials is a common problem, and a big challenge, since the longer the materials safely endure the nuclear reactor environment the less waste is produced. The materials' aging and degradation have been a major challenge for water cooled reactors. Many studies have been conducted in order to improve and prolong the life-cycle of nuclear materials[5].
Nickel alloys have been used in nuclear power plants for very long time thanks to their excellent corrosion resistance; different kinds of Ni alloys have been used for different purposes based on their properties[5]. Alloy X-750 has been employed as spacer grids, springs, bolts and welds in boiling water reactors (BWRs), in Sweden, for more than 30 years. This Ni-Cr-Fe precipitation hardened superalloy has good creep strength and oxidation resistance at high temperatures. Nonetheless, in high temperature water like under BWR conditions, the superalloy suffers general corrosion and mass-loss. Furthermore, the radioactive isotope 58Co could be released by neutronic
4
activation of 58Ni, which upon corrosion can enter the water and lead to spread of radioactivity in the entire closed water circuit.
The object of study of this thesis is the corrosion of Alloy x-750 spacer grids, these grids are employed as fuel rod holders. They keep the rods in position under the oxidative BWR environment, which include a two-phase flow of steam and water at typically 286 °C. Pretreatments, as pre-oxidation and pickling, are performed on Alloy X-750, in order to improve the corrosion resistance. Pre-oxidation has a double action: it leads to the formation of γ’-Ni3(Ti, Al), a secondary phase that will strengthen the alloy, and it will create a thin protective oxide on the surface.
1.2 AIM OF RESEARCH
This thesis is part of a collaboration with Sandvik AB, Studsvik AB, Vattenfall AB and Westinghouse Electric Sweden AB. The autoclave exposures have been performed by Studsvik, at their facility. The work at Chalmers was concentrated on microstructure studies of the oxide products formed on Alloy X-750 after exposure in simulated boiling water reactor environment.
The objectives of the project are:
• Investigation of pretreatment processes, as pre-oxidation and pickling and the resulting improvements on the corrosion behavior of Alloy X-750
• Investigation of different iron contents of the base Alloy X-750 (5 and 8 wt%)
• Growth evolution of the oxide on specimens exposed for different times
5
2.MATERIALS
2.1 NICKEL-BASED ALLOY X-750: PRODUCTION AND PROPERTIES
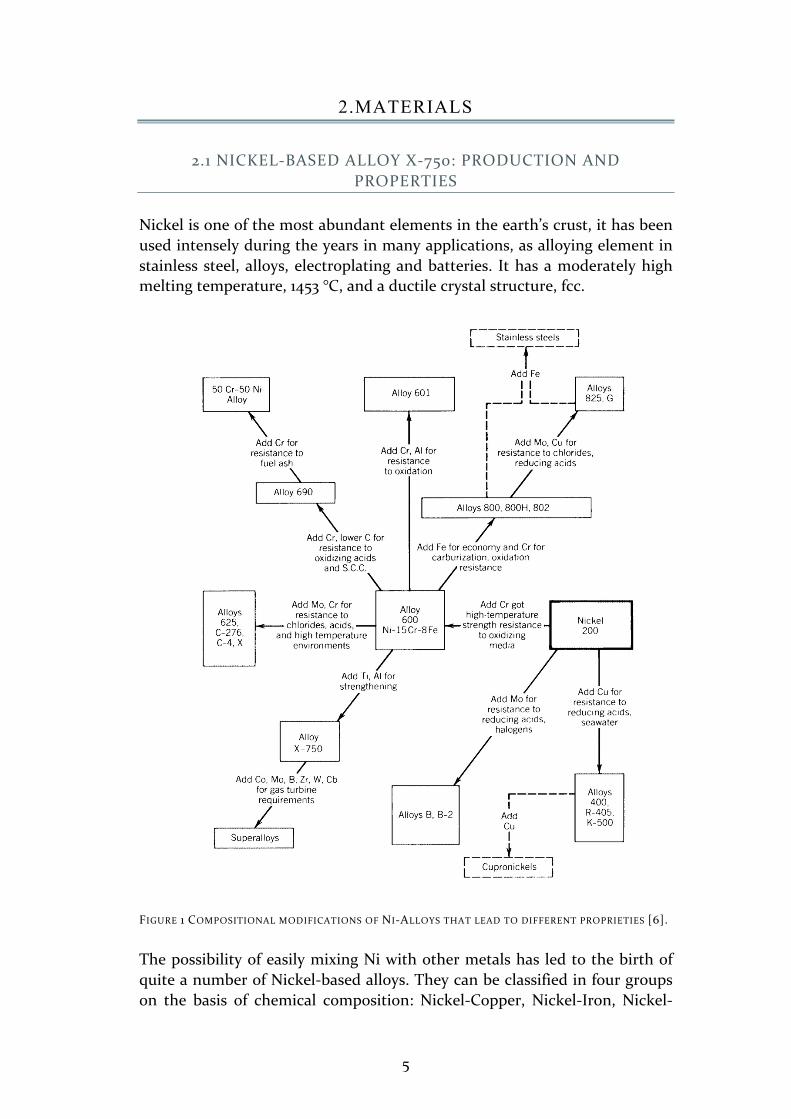
Nickel is one of the most abundant elements in the earth’s crust, it has been used intensely during the years in many applications, as alloying element in stainless steel, alloys, electroplating and batteries. It has a moderately high melting temperature, 1453 °C, and a ductile crystal structure, fcc.
FIGURE 1 COMPOSITIONAL MODIFICATIONS OF NI-ALLOYS THAT LEAD TO DIFFERENT PROPRIETIES [6].
The possibility of easily mixing Ni with other metals has led to the birth of quite a number of Nickel-based alloys. They can be classified in four groups on the basis of chemical composition: Nickel-Copper, Nickel-Iron, Nickel-
6
Iron-Chromium, and Nickel-Chromium-Molybdenum-Iron alloys [6]. Among other alloys containing Nickel we can mention hardenable steels, stainless steels, corrosion resistant and high temperature alloys. By adding elements like Cr, Mo, Al etc. to the alloy composition, increase of service temperature or increase in resistance to oxidation is achievable.
In Figure 1 is shown how adding different elements results in new alloys with different proprieties, for example by adding Ti and Al to the Ni alloy 600, the alloy X-750 is created. Applications suitable for these kinds of alloys are automotive components, aircraft and ship components, electronics and components in electric power facilities [6]. The alloy X-750 is a precipitation hardened commercial Ni-Cr-Fe alloy used for its good corrosion properties and resistance to oxidation and for high creep rupture strength up to about 800 °C. Its properties can be enhanced by heat treatment, e.g. by age hardening the alloy at around 700 °C for times like 20 hours. After this heat treatment, the secondary phase γ’-Ni3(Ti, Al) is formed by precipitation in the matrix. The fine precipitates prevent the movement of dislocations, or defects, in the matrix of the alloy, increasing the mechanical strength of the material [7]. According to the specification, the Fe content shall be in the range of 5-9 at.%.
TABLE 1 COMPOSITION OF ALLOY X-750, IN ATOMIC % AND IN WEIGHT %.
At.% C Si Mn Cr Ni Nb+Ta Ti Al Fe
5Fe 0.10 0.69 0.56 17.0 71.2 0.34 2.94 1.89 5.3
8Fe 0.10 0.71 0.59 17.6 68.5 0.34 2.82 1.27 8.2
wt% C Si Mn Cr Ni Nb+Ta Ti Al Fe
5Fe 0.021 0.34 0.54 15.6 73.9 0.8 2.48 0.9 5.4
8Fe 0.02 0.35 0.57 16 70.8 0.8 2.37 0.6 8.3
The chemical composition of alloy X-750 investigated in this work is reported in table 1. Two different materials have been investigated, the main difference between the two set of samples is the iron content. The set of samples called 5Fe has an iron content of 5.3 at.% while the set of samples called 8Fe has an
7
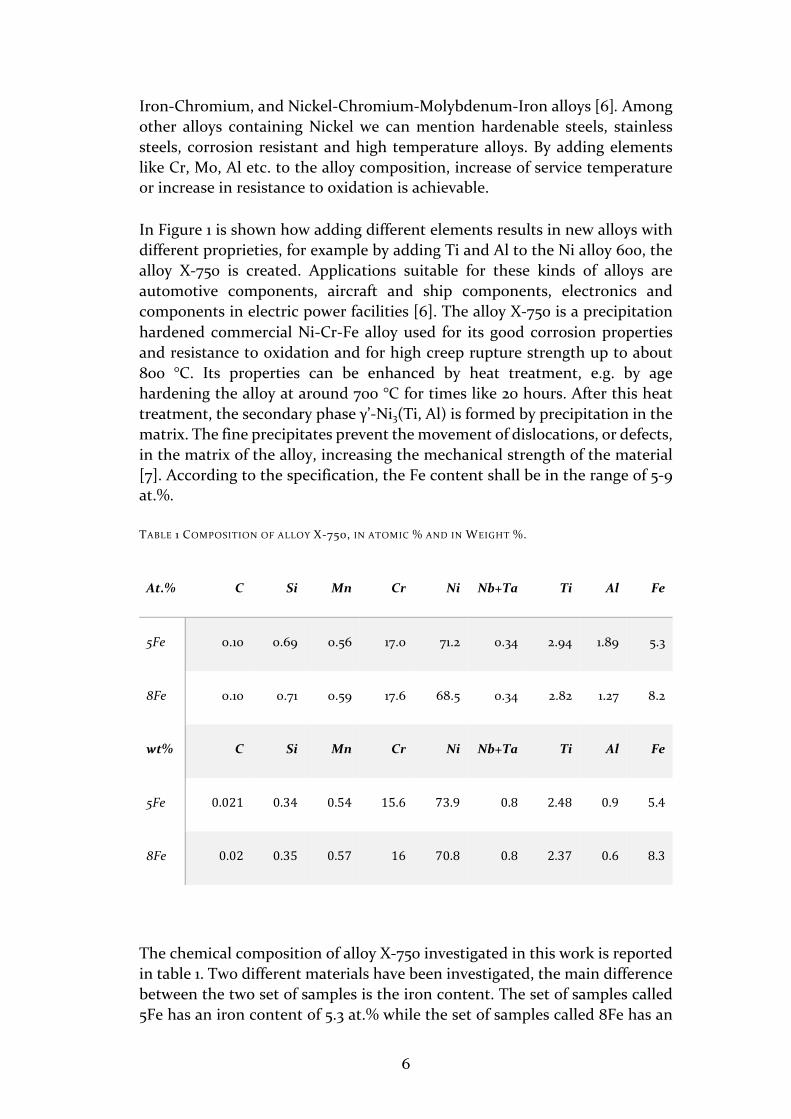
iron content of 8.2 at.%. A schematic of alloy X-750 production routes is shown below in Figure 2. The manufactured strips are polished and then shaped into spacer grids, afterward the grids are chemically etched; the so-called ‘pickling’ procedure. At this stage, the product is ready to be heat treated. The final heat treatment is performed at 700°C for 20 h in moist air. Samples that have been pre-oxidized and samples that have not, have been studied in this work. The purpose of the final heat treatment is both to harden the material by forming γ’-Ni3(Ti, Al) precipitates and to improve the in-reactor corrosion performance by forming a protective oxide (pre-oxidization). To summarize, specimens with different iron content have been investigated: one set of non-pre-oxidized, one set of pre-oxidized, and one set that has not received the pickling treatment.
FIGURE 2 PRODUCTION ROUTES.
8
2.2 ALLOY X-750 IN THE NUCLEAR INDUSTRY
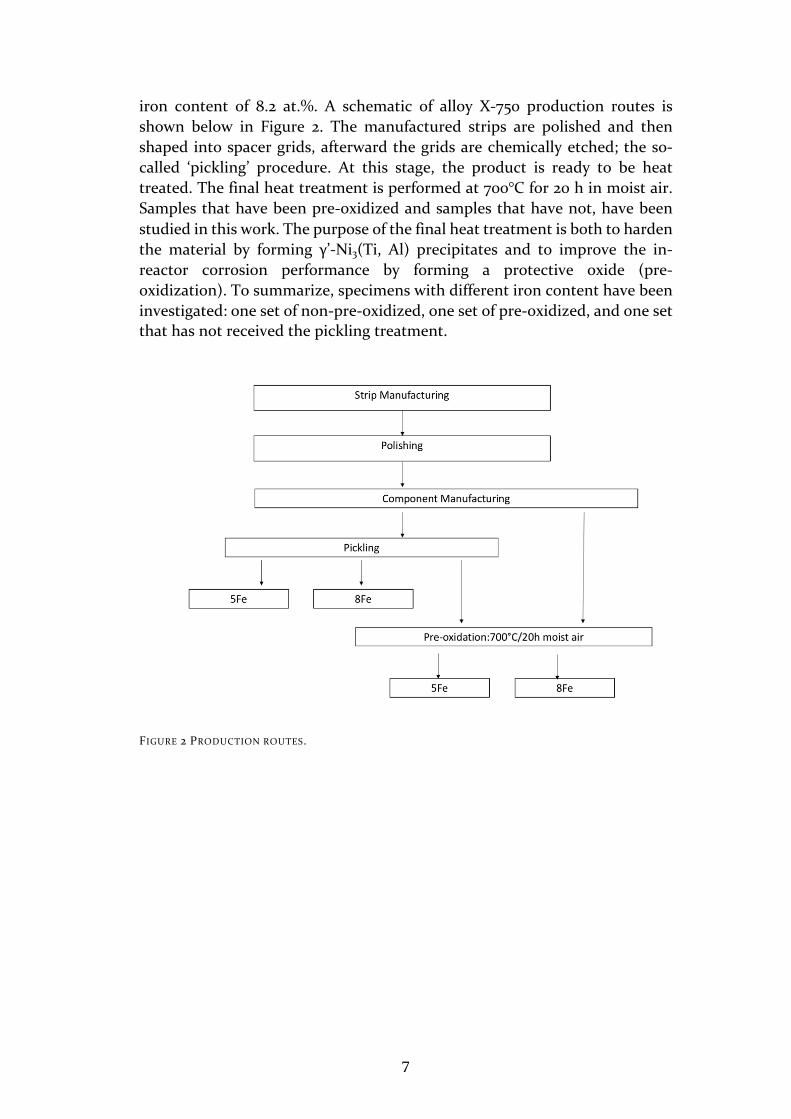
Nuclear power plants produce energy through nuclear fission, which takes place inside a reactor pressure vessel [8]. The process consists of a series of nuclear chain reactions, which lead to production of heat. The heat is passed on to a coolant, usually water, and it is converted into electricity by a thermodynamic water-steam process. The fission events are caused by thermal neutrons in the water-cooled system, this kind of reactor is called Light Water Reactor (LWR). At least 80% of the operating reactors are of the LWR type. The LWRs are of two different types: the pressurized water reactor (PWR), and the boiling water reactor (BWR) [9]. In the PWR, the heat from the reactor-core is transferred to the primary system. The water is circulated by coolant pumps under high-pressure of about 158 bar and in the reactor there is a temperature gradient from 292 to 326 °C. Then the heat is transferred into a steam generator and later to the turbine and the generator.
FIGURE 3 BWR SCHEME [10].
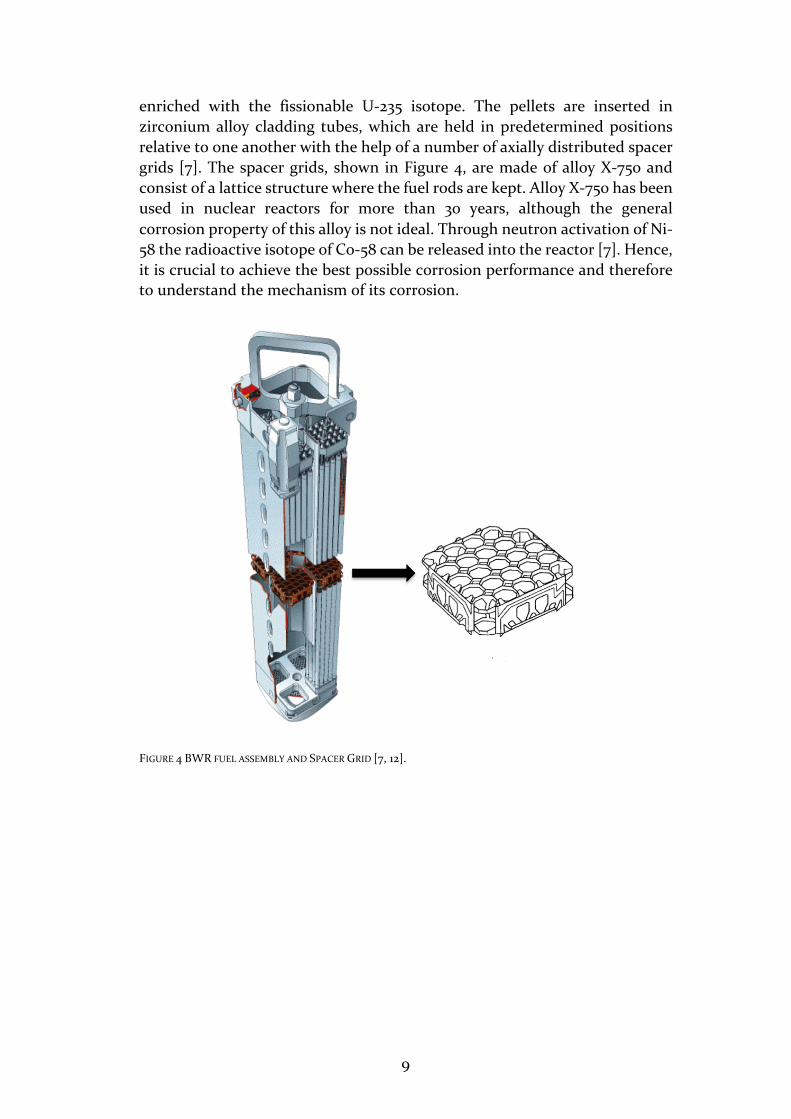
In the BWR, the steam for the turbo generator system is produced directly in the reactor core by a boiling process and the saturated steam flows from the reactor pressure vessel into the turbine [11]. A BWR schematic is shown in Figure 3. The operating temperature for a BWR is 286 °C, the environment is very oxidative. A flow of steam and water at 10 m/s and 70 bar, where the steam contains water droplets and oxygen (0.4 ppm) and hydrogen peroxide (< 1 ppm), passes from the bottom to the top of the reactor [7]. A detailed schematic illustration of the fuel assembly of a BWR is shown in Figure 4. The fuel used in the Swedish nuclear facilities is made of uranium dioxide pellets
9
enriched with the fissionable U-235 isotope. The pellets are inserted in zirconium alloy cladding tubes, which are held in predetermined positions relative to one another with the help of a number of axially distributed spacer grids [7]. The spacer grids, shown in Figure 4, are made of alloy X-750 and consist of a lattice structure where the fuel rods are kept. Alloy X-750 has been used in nuclear reactors for more than 30 years, although the general corrosion property of this alloy is not ideal. Through neutron activation of Ni-58 the radioactive isotope of Co-58 can be released into the reactor [7]. Hence, it is crucial to achieve the best possible corrosion performance and therefore to understand the mechanism of its corrosion.
FIGURE 4 BWR FUEL ASSEMBLY AND SPACER GRID [7, 12].

10
11
3 GENERAL CORROSION
Corrosion is a process that affects us in our everyday life; everything corrodes, from the pot we use to cook to our car, or bike and even us. Corrosion has been defined as the undesirable deterioration of materials, i.e. an interaction with its environment that adversely affects those proprieties of the material that are to be preserved [13]. Corrosion is an electrochemical reaction, that involves electrons and charge transfers. Redox reactions regulate the process, and the set of reactions can be very large. In general, it can be a dry reaction like:
𝑥𝑀 +12𝑦𝑂( = 𝑀*𝑂+
Where M is the metal and O is the oxygen, for example [13]:
4𝐹𝑒 + 3𝑂( = 2𝐹𝑒(𝑂1
While if water is involved the reaction is:
𝑥𝑀 + 𝑦𝐻(𝑂 = 𝑀*𝑂+ + 𝑦𝐻(
For example [13]:
4𝐹𝑒 + 2𝐻(𝑂 + 3𝑂( = 2𝐹𝑒(𝑂1�𝐻(𝑂
This last reaction expresses something we are very familiar with, the formation of rust. Rust is formed when Fe is in contact with a water droplet; Fe is ionized (it loses electrons), while the cathodic reaction involves a reaction whereby electrons are consumed. This can be either the oxygen reaction or the hydrogen reaction, in general:
Anode:𝑀 = 𝑀45 + 𝑛𝑒7
Cathode: 8(𝑂( + 𝐻(𝑂 + 2𝑒7 = 2𝑂𝐻7
Cathode: 2𝐻9 + 2𝑒7 = 𝐻(
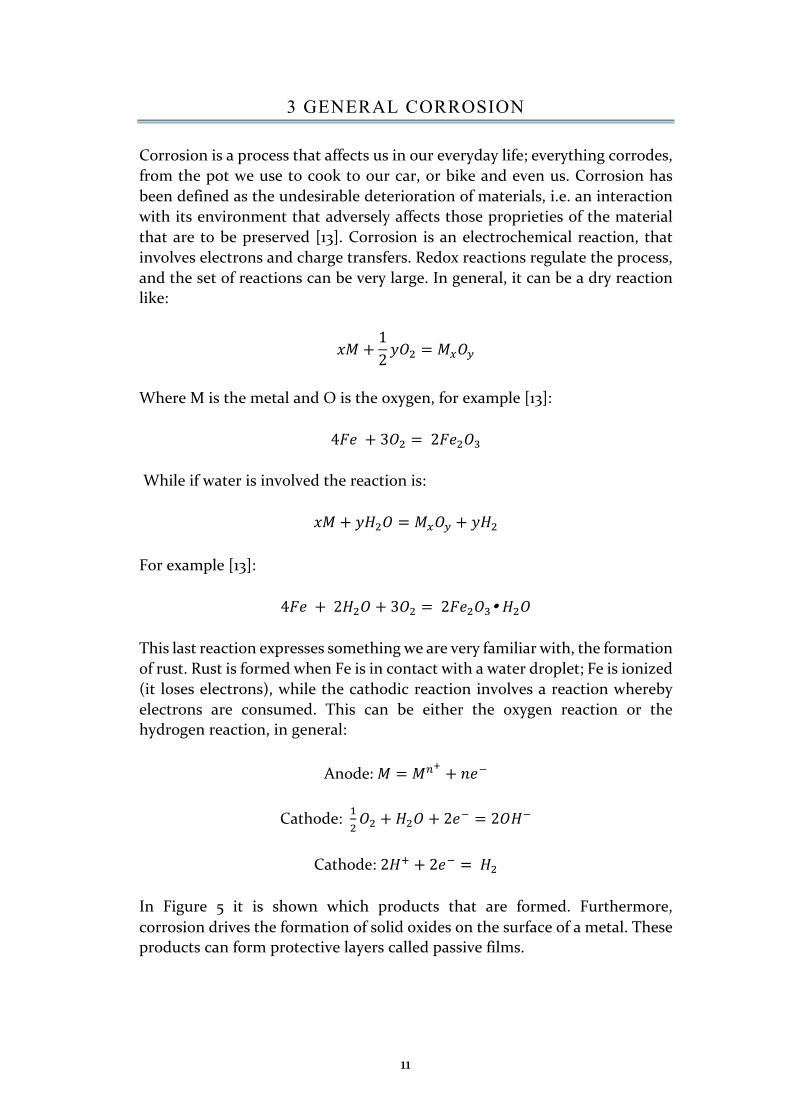
In Figure 5 it is shown which products that are formed. Furthermore, corrosion drives the formation of solid oxides on the surface of a metal. These products can form protective layers called passive films.
12
FIGURE 5. A GENERAL SCHEMATIC OF METAL CORROSION IN WATER (A) AND THE CREATION OF A PASSIVE
LAYER IN AN AQUEOUS SOLUTION (B) [14].
3.1 BOILING WATER REACTOR ENVIRONMENT
BWR primary water is a highly corrosive environment including high temperature steam and water, oxidizing radiolysis products such as H2O2 and O2 , operating at a temperature of 286 °C under a pressure of 70 bar. Using thermodynamics, it is sometimes possible to predict if a chemical reaction would take place, in a similar environment. Metals tend to form insoluble oxides and hydroxides under certain conditions of potential E and pH. If these products form a protective layer that can slow down the corrosion process, the layer is called a passive layer. The tendency of a metal to passivate in an aqueous solution can be shown in E/pH diagrams, also known as Pourbaix diagrams - so called after their inventor in the 1950's. The diagrams predict the corrosion behavior of a metal, using equilibrium reactions between the different species and phases for that metal. The thermodynamic domains of different phases are plotted in a graph where the pH is expressed as function of electrochemical potential. Beverskog has studied intensively the thermodynamics of the ternary system Ni-Cr-Fe in BWR environment [15], [16], considering that the water is kept in a condition of high purity in LWRs, so the concentration of all the species dissolved are considered to be {[Fe(aq)]=[Ni(aq)]=[Cr(aq)]}=10-8 molal. The electrochemical potential for normal water chemistry (NWC) is usually said to be about 200 mV SHE (standard hydrogen electrode), while for hydrogen water chemistry (HWC) it is about -200 to -400 mV SHE, however, our case represents the first condition, the NWC. The pH is typically 5.8, as indicated by the vertical dotted lines in Figures 7-9.
13
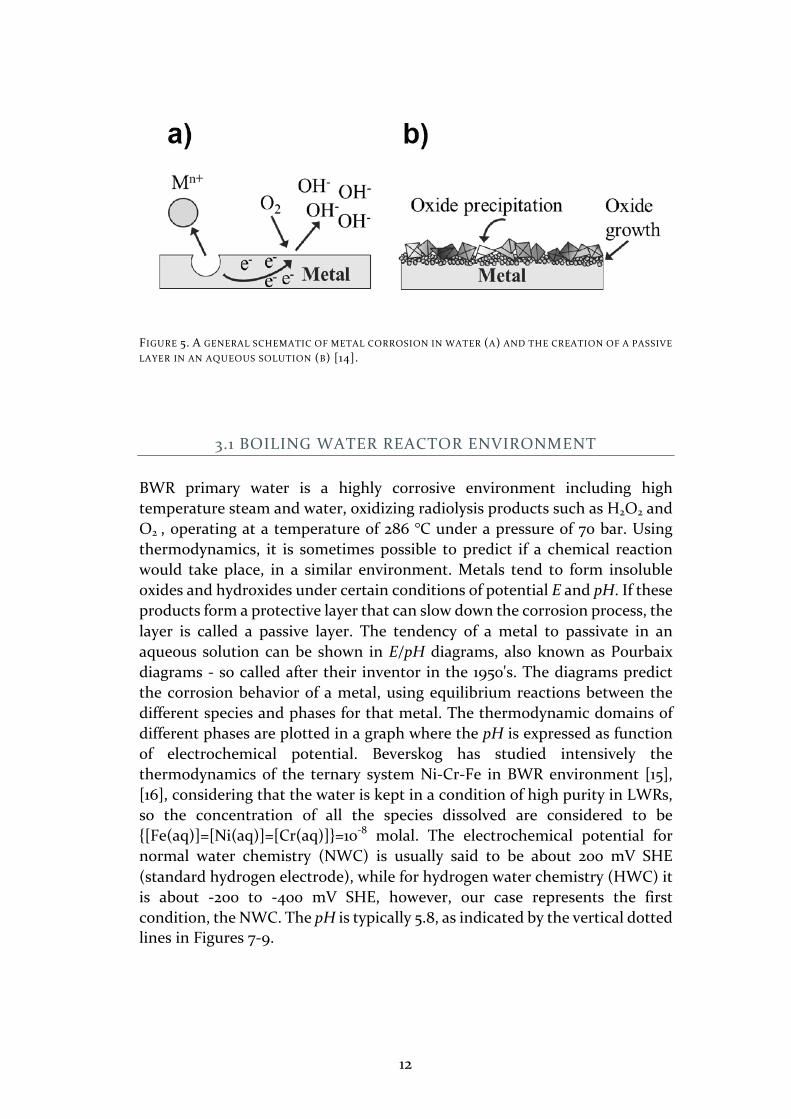
FIGURE 6 NICKEL POURBAIX DIAGRAM AT 300 °C, 10 MPA AND 10−8 MOL/KG [17].
In a Pourbaix diagram, as in Figure 6, the two parallel dotted lines represent the stability zone where water and the gaseous species are in equilibrium. The upper line represents the oxygen equilibrium line and at potentials above this line we will oxidize water with oxygen evolution. The lower line represents the hydrogen line and at potentials below this line we will get hydrogen evolution. The diagram shows where the metal would be immune, corroding or passive. In the immune area, the metal would not react and it would be the most stable species, in the region where the metal oxidizes, passivation can occur, slowing down or stopping the corrosion reaction.
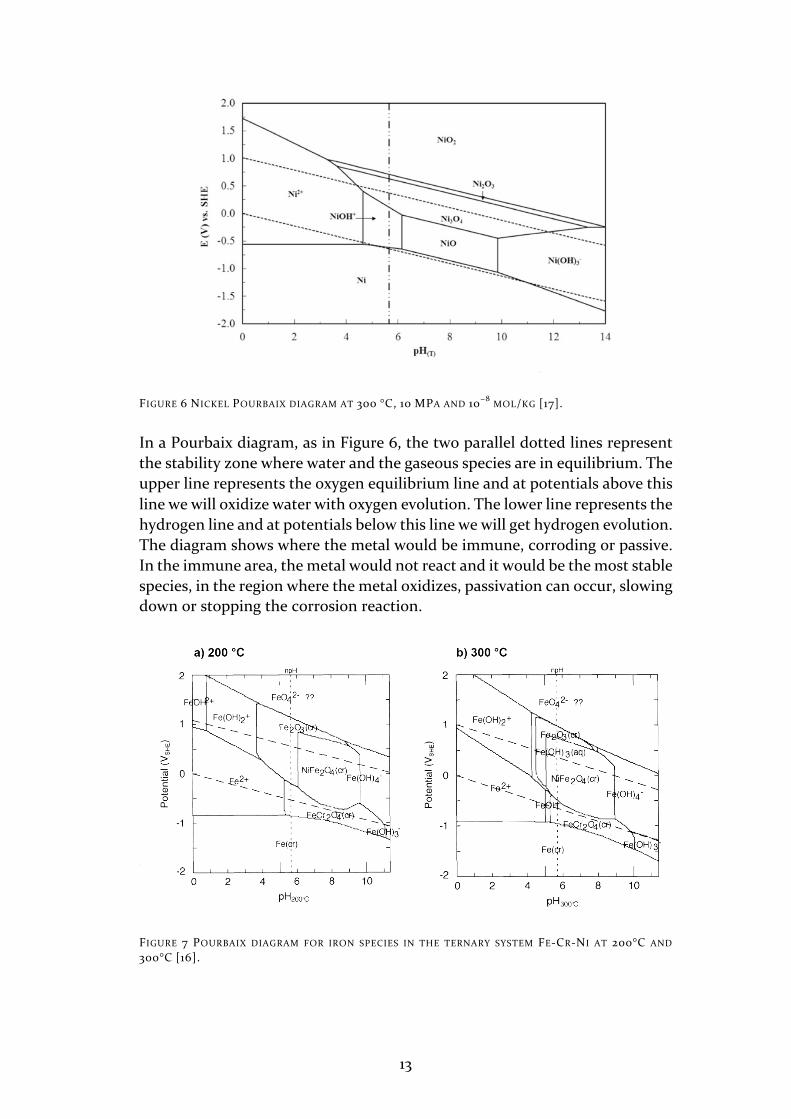
FIGURE 7 POURBAIX DIAGRAM FOR IRON SPECIES IN THE TERNARY SYSTEM FE-CR-NI AT 200°C AND
300°C [16].
14
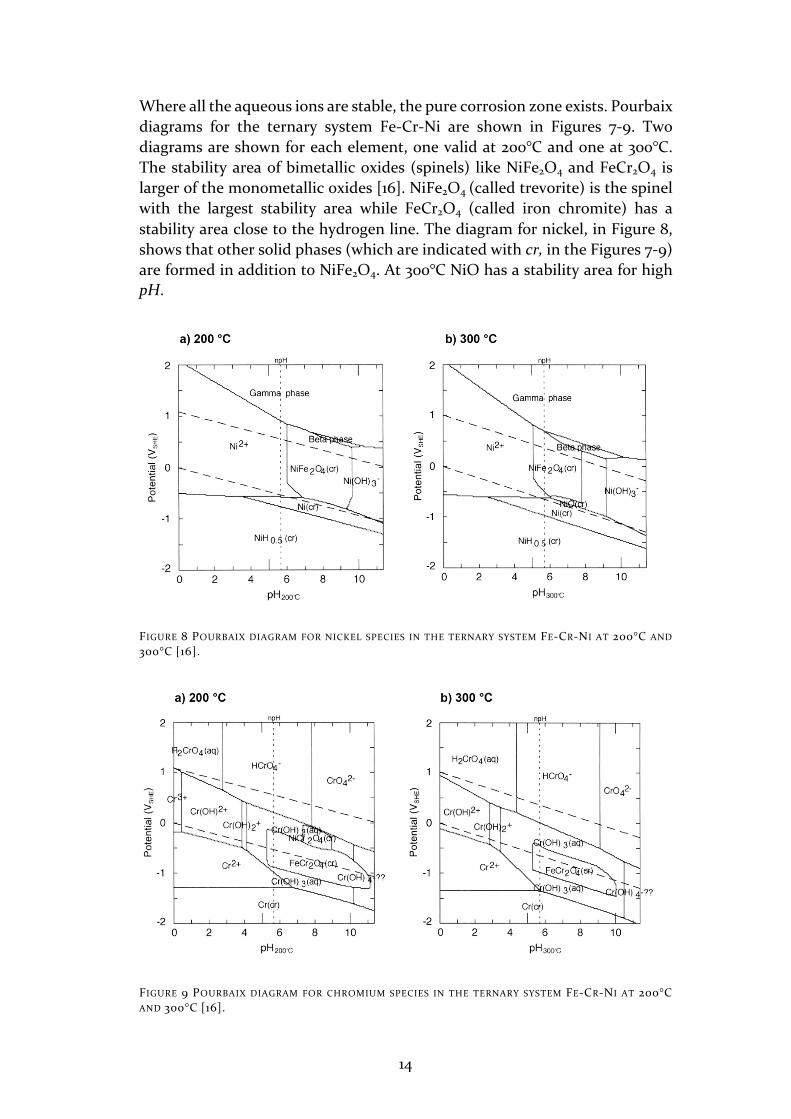
Where all the aqueous ions are stable, the pure corrosion zone exists. Pourbaix diagrams for the ternary system Fe-Cr-Ni are shown in Figures 7-9. Two diagrams are shown for each element, one valid at 200°C and one at 300°C. The stability area of bimetallic oxides (spinels) like NiFe2O4 and FeCr2O4 is larger of the monometallic oxides [16]. NiFe2O4 (called trevorite) is the spinel with the largest stability area while FeCr2O4 (called iron chromite) has a stability area close to the hydrogen line. The diagram for nickel, in Figure 8, shows that other solid phases (which are indicated with cr, in the Figures 7-9) are formed in addition to NiFe2O4. At 300°C NiO has a stability area for high pH.
FIGURE 8 POURBAIX DIAGRAM FOR NICKEL SPECIES IN THE TERNARY SYSTEM FE-CR-NI AT 200°C AND
300°C [16].
FIGURE 9 POURBAIX DIAGRAM FOR CHROMIUM SPECIES IN THE TERNARY SYSTEM FE-CR-NI AT 200°C
AND 300°C [16].
15
3.2 THE POINT DEFECT MODEL FOR CORROSION IN AQUEOUS SOLUTIONS
Understanding the nature of passivation layers has fascinated the scientific community for a long time, leading to the production of quite a number of studies. However, the mechanism is rather complex, since it involves diffusion processes, defect chemistry, oxidation, precipitation, dissolution, and processes that strictly depend on the boundary conditions, such as temperature, pressure and solvent concentrations. Unlike corrosion in gaseous environment, metal corrosion in aqueous solutions at high temperature appears to be even more complicated, as the dissolution of corrosion products in the solution is more challenging to evaluate and the oxide films formed are often porous in high temperature water. The Point Defect Model (PDM) by Macdonald is a model to characterize mechanistically various corrosion processes in aqueous environment [18-20].
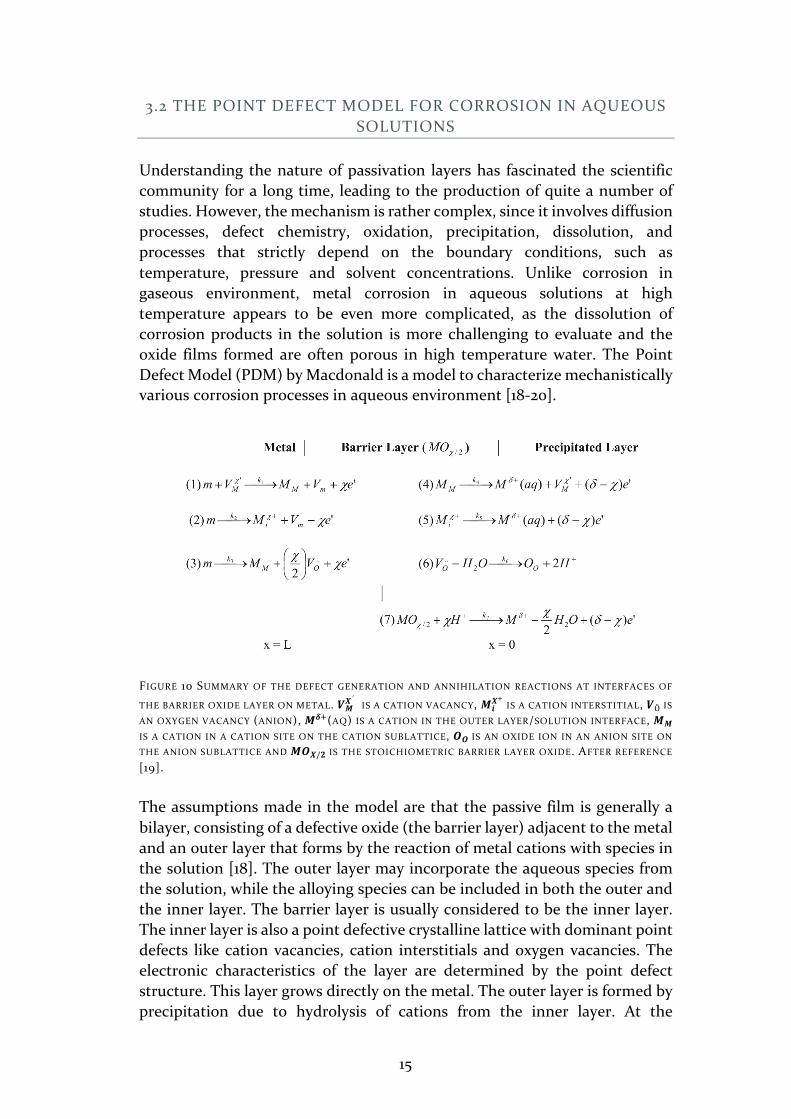
FIGURE 10 SUMMARY OF THE DEFECT GENERATION AND ANNIHILATION REACTIONS AT INTERFACES OF
THE BARRIER OXIDE LAYER ON METAL. 𝑽𝑴𝑿′
IS A CATION VACANCY, 𝑴𝒊𝑿5 IS A CATION INTERSTITIAL, 𝑽Ö IS
AN OXYGEN VACANCY (ANION), 𝑴𝜹9(AQ) IS A CATION IN THE OUTER LAYER/SOLUTION INTERFACE, 𝑴𝑴
IS A CATION IN A CATION SITE ON THE CATION SUBLATTICE, 𝑶𝑶 IS AN OXIDE ION IN AN ANION SITE ON
THE ANION SUBLATTICE AND 𝑴𝑶𝑿/𝟐 IS THE STOICHIOMETRIC BARRIER LAYER OXIDE. AFTER REFERENCE
[19].
The assumptions made in the model are that the passive film is generally a bilayer, consisting of a defective oxide (the barrier layer) adjacent to the metal and an outer layer that forms by the reaction of metal cations with species in the solution [18]. The outer layer may incorporate the aqueous species from the solution, while the alloying species can be included in both the outer and the inner layer. The barrier layer is usually considered to be the inner layer. The inner layer is also a point defective crystalline lattice with dominant point defects like cation vacancies, cation interstitials and oxygen vacancies. The electronic characteristics of the layer are determined by the point defect structure. This layer grows directly on the metal. The outer layer is formed by precipitation due to hydrolysis of cations from the inner layer. At the
16
metal/film and film/solution interfaces, the defects are generated and annihilated where each interface acts as either a source or a sink for the defects. It is also assumed that the rate controlling region is placed at the metal barrier layer interface, since the electric field strength is independent of the applied voltage [19]. In Figure 10, a schematic of several defect chemistry reactions that occur at the metal surface/aqueous solution is shown. The PDM model states that at the metal/film interface and film/solution interface the reactions take place. The seven reactions include the process of generation and annihilation of metal interstitials (reactions 2 and 5) and the dissolution of the barrier layer (reaction 7). Reactions 1, 2, 4 and 5 correspond to the dissolution of the metal, while reactions 3 and 6 correspond to the growth of the barrier layer [19].
3.3 OXIDATION KINETICS
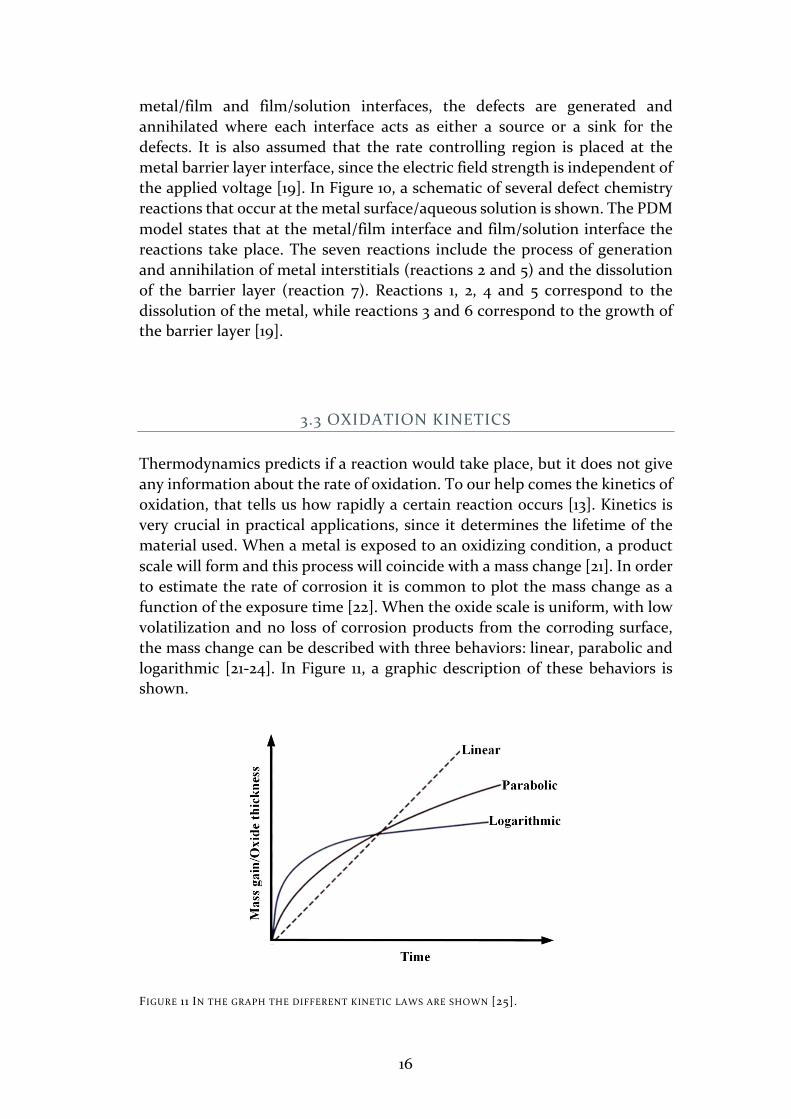
Thermodynamics predicts if a reaction would take place, but it does not give any information about the rate of oxidation. To our help comes the kinetics of oxidation, that tells us how rapidly a certain reaction occurs [13]. Kinetics is very crucial in practical applications, since it determines the lifetime of the material used. When a metal is exposed to an oxidizing condition, a product scale will form and this process will coincide with a mass change [21]. In order to estimate the rate of corrosion it is common to plot the mass change as a function of the exposure time [22]. When the oxide scale is uniform, with low volatilization and no loss of corrosion products from the corroding surface, the mass change can be described with three behaviors: linear, parabolic and logarithmic [21-24]. In Figure 11, a graphic description of these behaviors is shown.
FIGURE 11 IN THE GRAPH THE DIFFERENT KINETIC LAWS ARE SHOWN [25].
17
At very high temperatures, the oxide grows very fast at the beginning until it reaches a steady state because the transport of the reacting species through the scale is rate controlling [26]. When the rate-controlling step is the diffusion of reactants through the oxide, the kinetic law is described by a parabolic behavior:
𝒙𝟐 = 𝒌𝒑𝒕 + 𝑪
where the kp is the parabolic rate constant, t is the time, x is the thickness and C is the thickness at t=0 [13, 24]. The scale thickness increases with time, and the diffusion distance increases as well, limiting the amount of reactants. Almost all metals under high temperature oxidation conditions follow the parabolic law.
When the oxidation of a metal is proceeding at a constant rate following a linear rate law, the scale thickness x can be expressed as:
𝒙 = 𝒌𝒍𝒕 + 𝑪
where kl is the linear rate constant and C is the thickness at t=0. Linear kinetics means that the oxidation never reaches a steady state, it never slows down and this usually results in short time usage of the material. It is typical when the oxidation is driven by surface reactions instead of transport. Linear kinetics can also occur when the oxide scale spalls, cracks, is volatilized or when a porous, not adherent, scale is formed [13].
If the temperature is low, oxidation is usually inversely proportional to time and it follows the logarithmic rate law:
𝒙 = 𝒌𝒂𝒍𝒐𝒈(𝒌𝒃𝒕 + 𝟏)
Where ka and kb are constants [13]. This kind of oxidation occurs for relatively thin oxides at low temperatures. The scale grows fast initially and then the growth slows down. Most likely the mechanism is governed by electron and ion transport from the alloy.
18
3.4 PRE-OXIDATION OF NICKEL ALLOYS
The oxidation behavior of Ni alloys has been the object of numerous studies. Since these alloys are suitable for high temperature operation conditions and corrosive environments, the interest to improve aging conditions has always been very high. Furthermore, the pretreatment has a duplex action: strengthening of the alloy and formation of a protective oxide. Here a summary of results coming from studies relative to pre-oxidation and high temperature corrosion of Ni alloys is presented.
Oxidation of alloy 600 in the temperature interval of 100-700 °C was studied by McIntyre et al. [27]. At a temperature of 100°C, the formation of a duplex oxide made of NiO-Cr2O3 was observed, while at 280 °C a duplex oxide made of NiFe2O4 and Cr2O3 (chromia) was found. Different temperatures and oxygen concentration were discussed.
The initial stage of oxidation (1-60 min.) of alloy 718 in air in the temperature range of 100-1000 °C was investigated by Lenglet et al. [28]. It was found that the primary oxide consists of Cr2O3 and two nickel spinels (NiCr2O4 and NiFe2−xCrxO4 0<x<1). Fe2O3 phase was observed, and also some other mixed oxides with trivalent iron. A thick chromia layer was formed at the temperature of 1000 °C.
Iconel 625 was studied by Kumar et al., and it was found that at early stages (<150 min.), for a range of temperatures between 600-1250°C and with oxygen pressures of 0.12 and 101.3 kPa, the enrichment of Cr2O3 oxide film was maximum at around 950 °C [29]. At temperatures above 1000 °C, Nb and Ti oxides were found. Chen et al. examined different commercial Ni superalloys exposed isothermally in air at temperatures of 750 °C and 1000 °C, and also under cyclic conditions at 1000 °C [30]. Adherent chromia-rich scales were observed at 750 °C after 100o hours. Waspaloy was the alloy that showed the deepest internal corrosion due to the grain boundary carbides, but it was the lowest in terms of weight-gain. Titanium in the alloy oxidized and diffused through the chromia scale to form titanium dioxide at the surface as well as internally. Alumina was found as discrete internal oxide particles below the chromia scale [30].
Moreover, the addition of Nb, Ta, Ti and Al as minor components in superalloys induces changes in their surface reactivity [31] and in mechanical properties [32]. The addition of Al and Ti, as for the case of alloy X-750, improves the mechanical properties thanks to the formation of γʹ[Ni3 (Al, Ti)] precipitates that will harden the alloy. This effect was studied by Elliot and Hampton [33]. In their study, it is reported that for Ni-10%Cr binary alloy with additions of Nb and Ta behave better under cyclic and isothermal oxidation than alloys with W and Mo.
19
3.5 NICKEL ALLOYS IN HIGH TEMPERATURE WATER
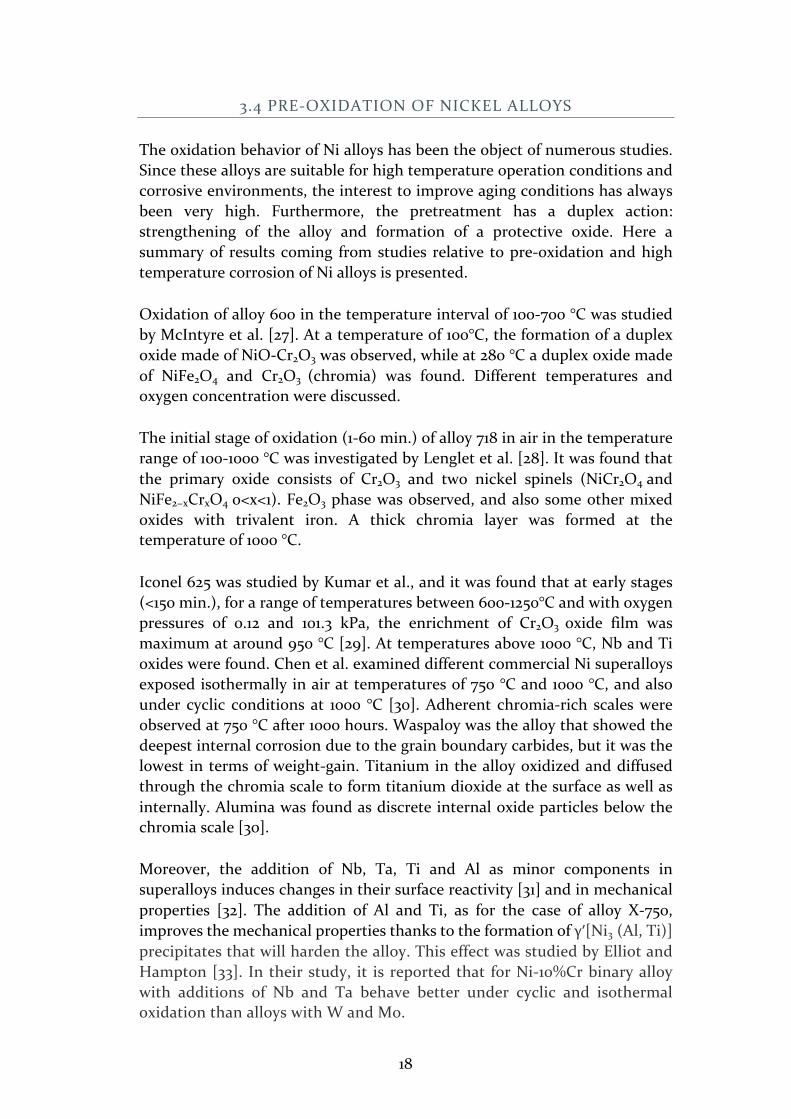
Understanding the microstructure of the oxide scale is crucial since the corrosion mechanism is strictly bound with the nature of the oxide and the structure formed. Most of the studies that have been carried out on Ni base alloys show similar morphology with an outer layer made of spinels [34-37].The study of Zhang et al. on the corrosion behavior of Ni alloys in supercritical water (500 °C, 250 bar) shown in Figure 12, is in agreement with the morphology we have observed, made of large grains of NiFe2O4 (trevorite). In this case the, for the exposed specimens, outer layer is found to consist of coarse Fe-rich (NiFe2O4) crystals, while the inner layer is a fine-grained Cr-rich oxide layer (NiCr2O4) [38].
FIGURE 12 SURFACE MORPHOLOGIES FOR ALLOYS EXPOSED IN SUPERCRITICAL WATER FOR DIFFERENT
TIMES A) HASTELLOY C-276, B) ALLOY 625 C) ALLOY X750. FROM REFERENCE [38].
The number of studies on high temperature water corrosion of alloy X-750 is rather limited; here follows a small resume of the early results. Hemmi et al. [39] postulated the presence of (Ni,Co)O, FexOy, TiO2, (Ni,Co)Fe2O4, FeCr2O4 or Cr2O3 in the oxide scale, using SEM and Auger Electron Spectroscopy measurements. The presence of a Cr2O3 layer at the alloy/oxide interface is suggested by Ahlberg and Rebensdorff in ref [40], where a study of three different samples (with different heat treatments) exposed in autoclave was made. Chen et al. made a study with high resolution transmission electron microscopy of non-pre-oxidized alloy X-750 with 7.5 wt% Fe content exposed in simulated BWR environment with a water jet flow of 18 m/s. [41]. Tiny
20
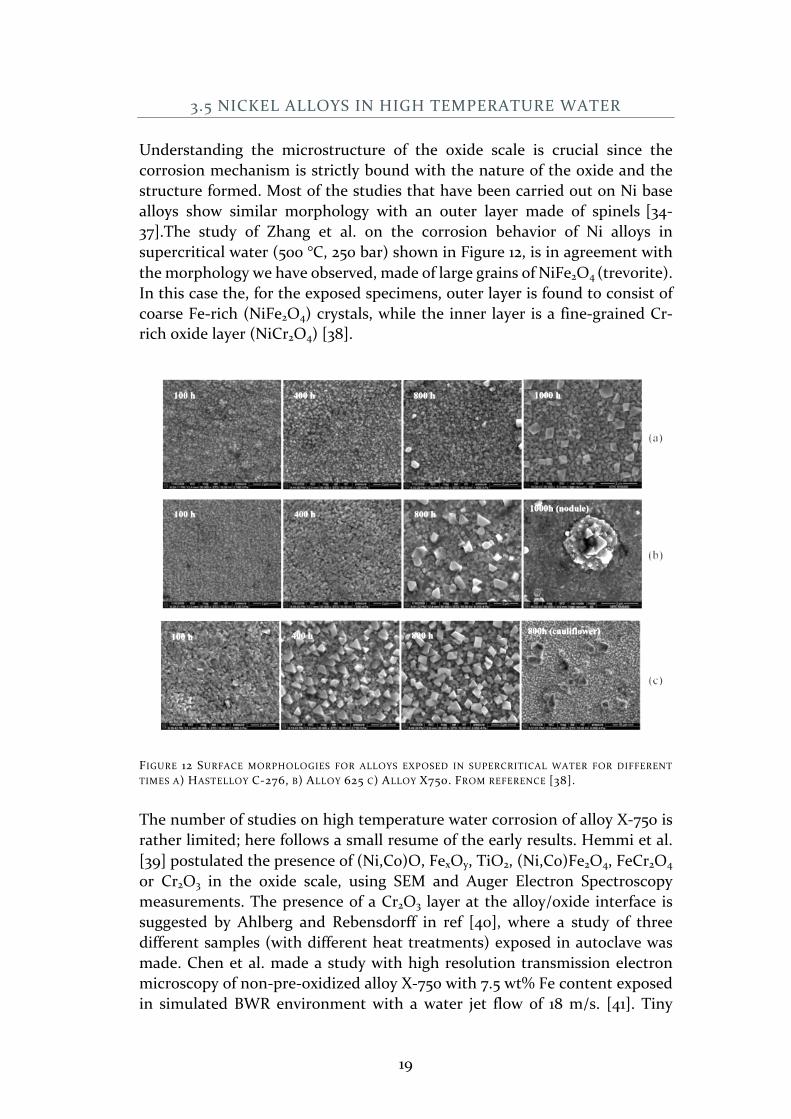
hematite (Fe2O3) oxide grains were found above large oxide grains of NiFe2O4. Two different oxides, NiCrO3 (oxide I in Figure 13) and NiO (oxide II in Figure 13), were found under the trevorite layer, see Figure 13. The total thickness of oxide I and oxide II was found to be 0.8 µm, while the thickness of the NiFe2O4 layer is 7 µm.
FIGURE 13 TEM BRIGHT FIELD (BF) AND DARK FIELD (DF) IMAGES SHOWING TWO ADDITIONAL OXIDE
LAYERS BETWEEN THE LARGE GRAINS OF TREVORITE IN ALLOY X-750. AFTER REF [41].
21
4 CHARACTERIZATION TECHNIQUES
4.1 ELECTRON MICROSCOPY
The smallest distance between two points that can be resolved with our eyes is about 0.1-0.2 mm with good illumination. This distance is the resolution of our eyes. To resolve details smaller than 0.1 mm it is necessary to use lenses, a microscope [42]. The resolution of visible light microscopes is proportional to the wavelength of the light beam used. Optical microscopes reach a resolution of about 0.2 μm. To see things with a smaller size it is necessary to use electron microscopes. An electron microscope can reach a resolution of a few tenths of Ångströms.In order to investigate the fine-scale microstructure of materials it is highly important to achieve the highest resolution possible. In this sense, electron microscopes are powerful tools. In this work, scanning electron microscopy (SEM), transmission electron microscopy and focused ion beam/scanning electron microscopy (FIB/SEM) have been used.
4.2 SCANNING ELECTRON MICROSCOPY - SEM
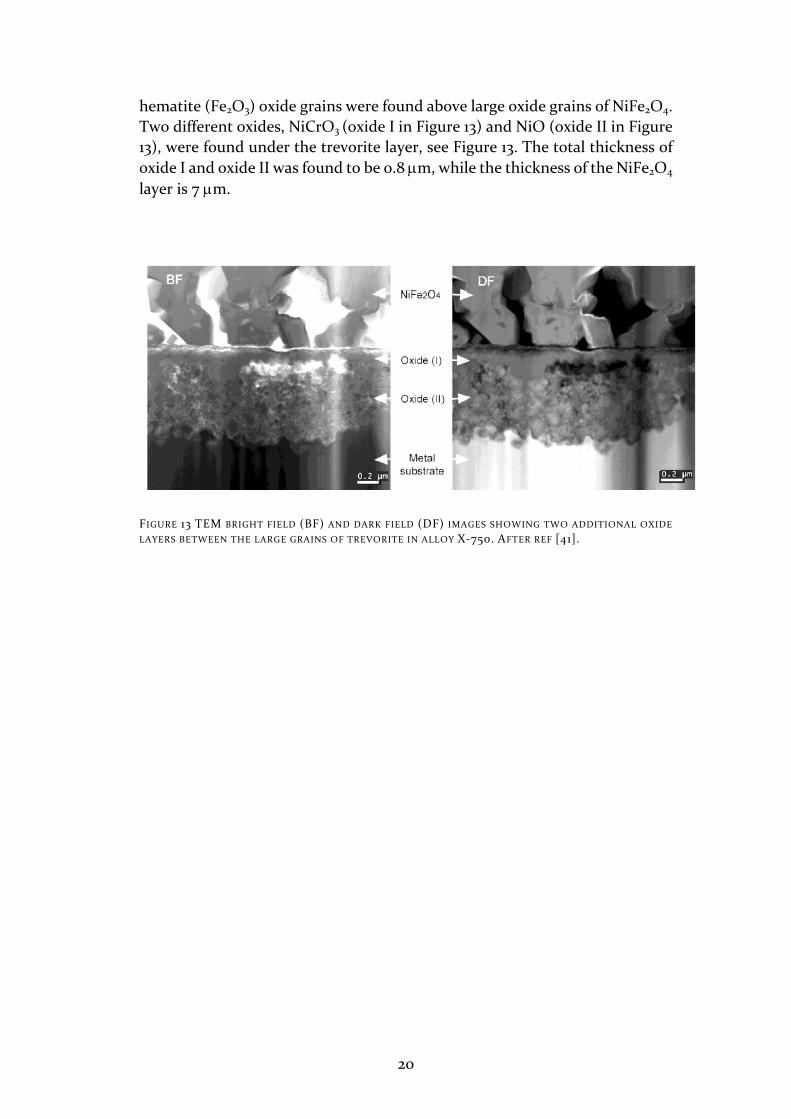
The scanning electron microscope is one of the most useful and adaptable instruments used for characterization of materials.
FIGURE 14 SIMPLE SCHEMATIC OF A SCANNING ELECTRON MICROSCOPE [43].
22
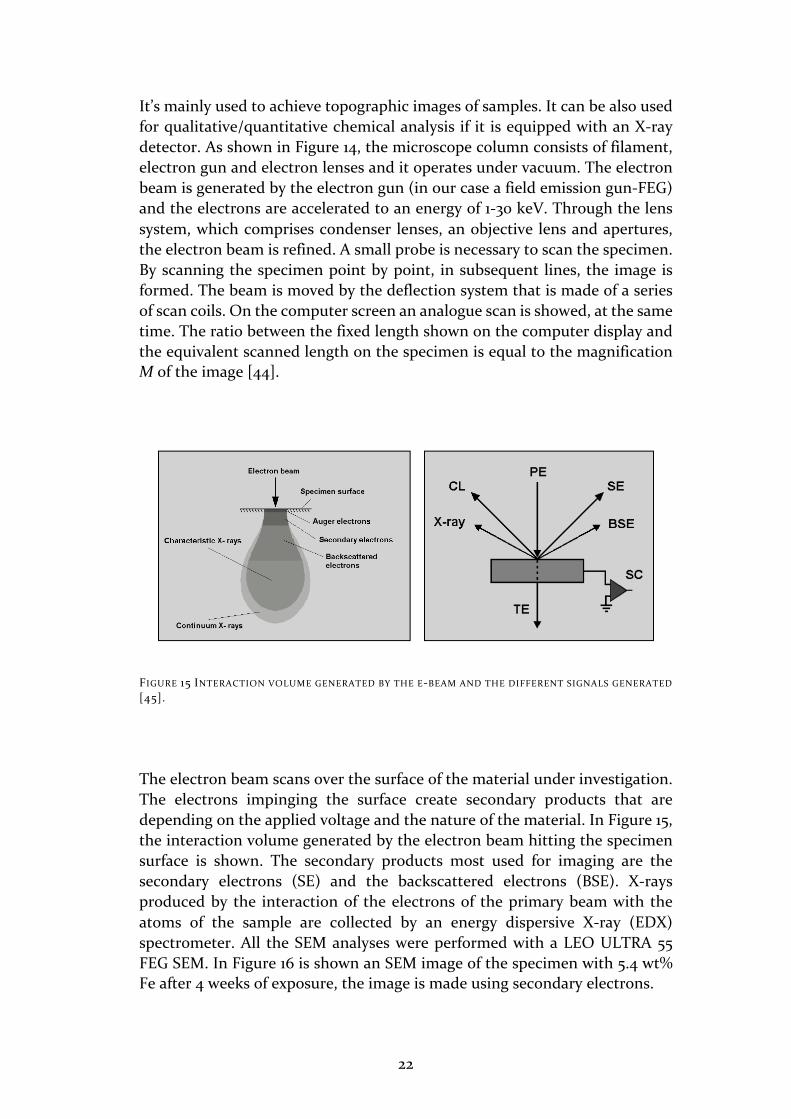
It’s mainly used to achieve topographic images of samples. It can be also used for qualitative/quantitative chemical analysis if it is equipped with an X-ray detector. As shown in Figure 14, the microscope column consists of filament, electron gun and electron lenses and it operates under vacuum. The electron beam is generated by the electron gun (in our case a field emission gun-FEG) and the electrons are accelerated to an energy of 1-30 keV. Through the lens system, which comprises condenser lenses, an objective lens and apertures, the electron beam is refined. A small probe is necessary to scan the specimen. By scanning the specimen point by point, in subsequent lines, the image is formed. The beam is moved by the deflection system that is made of a series of scan coils. On the computer screen an analogue scan is showed, at the same time. The ratio between the fixed length shown on the computer display and the equivalent scanned length on the specimen is equal to the magnification M of the image [44].
FIGURE 15 INTERACTION VOLUME GENERATED BY THE E-BEAM AND THE DIFFERENT SIGNALS GENERATED
[45].
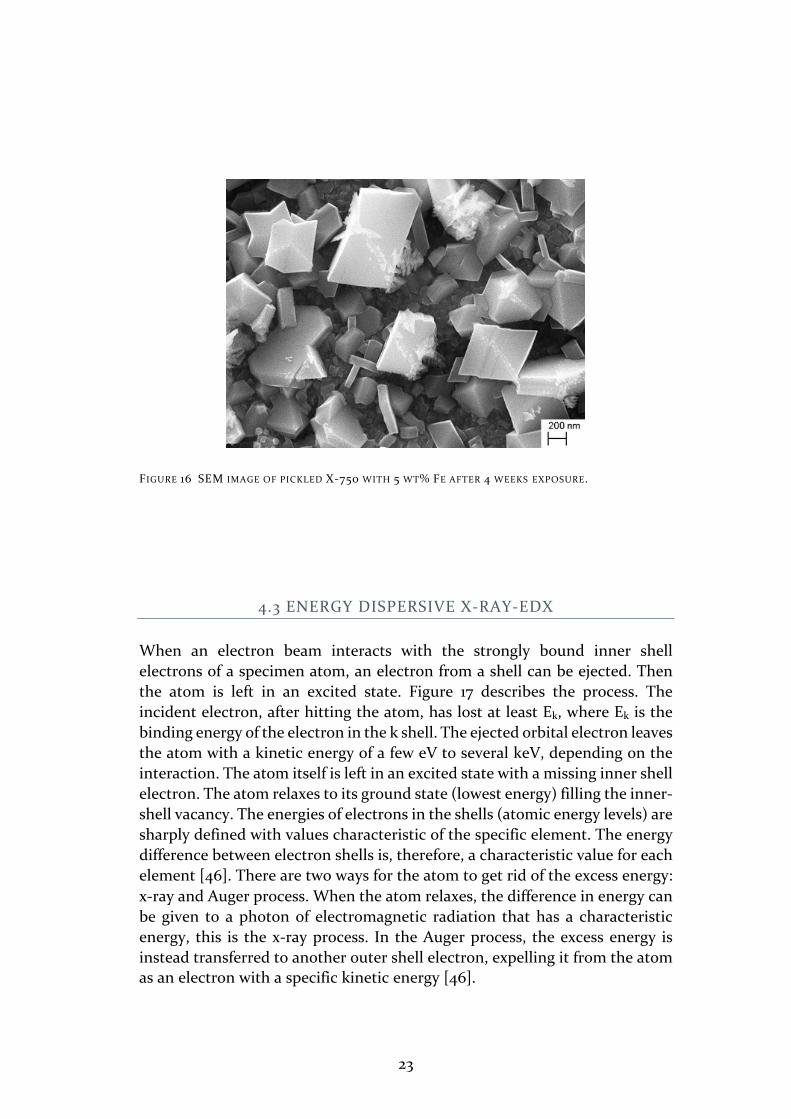
The electron beam scans over the surface of the material under investigation. The electrons impinging the surface create secondary products that are depending on the applied voltage and the nature of the material. In Figure 15, the interaction volume generated by the electron beam hitting the specimen surface is shown. The secondary products most used for imaging are the secondary electrons (SE) and the backscattered electrons (BSE). X-rays produced by the interaction of the electrons of the primary beam with the atoms of the sample are collected by an energy dispersive X-ray (EDX) spectrometer. All the SEM analyses were performed with a LEO ULTRA 55 FEG SEM. In Figure 16 is shown an SEM image of the specimen with 5.4 wt% Fe after 4 weeks of exposure, the image is made using secondary electrons.
23
FIGURE 16 SEM IMAGE OF PICKLED X-750 WITH 5 WT% FE AFTER 4 WEEKS EXPOSURE.
4.3 ENERGY DISPERSIVE X-RAY-EDX
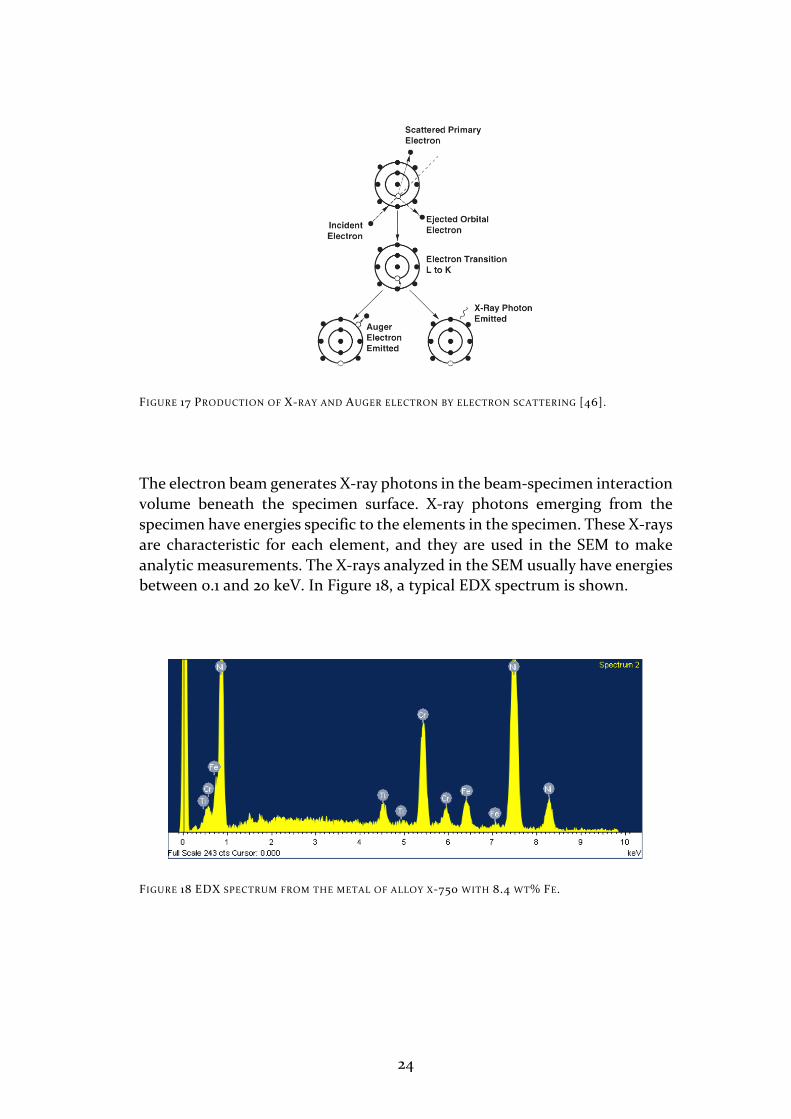
When an electron beam interacts with the strongly bound inner shell electrons of a specimen atom, an electron from a shell can be ejected. Then the atom is left in an excited state. Figure 17 describes the process. The incident electron, after hitting the atom, has lost at least Ek, where Ek is the binding energy of the electron in the k shell. The ejected orbital electron leaves the atom with a kinetic energy of a few eV to several keV, depending on the interaction. The atom itself is left in an excited state with a missing inner shell electron. The atom relaxes to its ground state (lowest energy) filling the inner-shell vacancy. The energies of electrons in the shells (atomic energy levels) are sharply defined with values characteristic of the specific element. The energy difference between electron shells is, therefore, a characteristic value for each element [46]. There are two ways for the atom to get rid of the excess energy: x-ray and Auger process. When the atom relaxes, the difference in energy can be given to a photon of electromagnetic radiation that has a characteristic energy, this is the x-ray process. In the Auger process, the excess energy is instead transferred to another outer shell electron, expelling it from the atom as an electron with a specific kinetic energy [46].
24
FIGURE 17 PRODUCTION OF X-RAY AND AUGER ELECTRON BY ELECTRON SCATTERING [46].
The electron beam generates X-ray photons in the beam-specimen interaction volume beneath the specimen surface. X-ray photons emerging from the specimen have energies specific to the elements in the specimen. These X-rays are characteristic for each element, and they are used in the SEM to make analytic measurements. The X-rays analyzed in the SEM usually have energies between 0.1 and 20 keV. In Figure 18, a typical EDX spectrum is shown.
FIGURE 18 EDX SPECTRUM FROM THE METAL OF ALLOY X-750 WITH 8.4 WT% FE.
25
4.4 FOCUSED ION BEAM - FIB/SEM
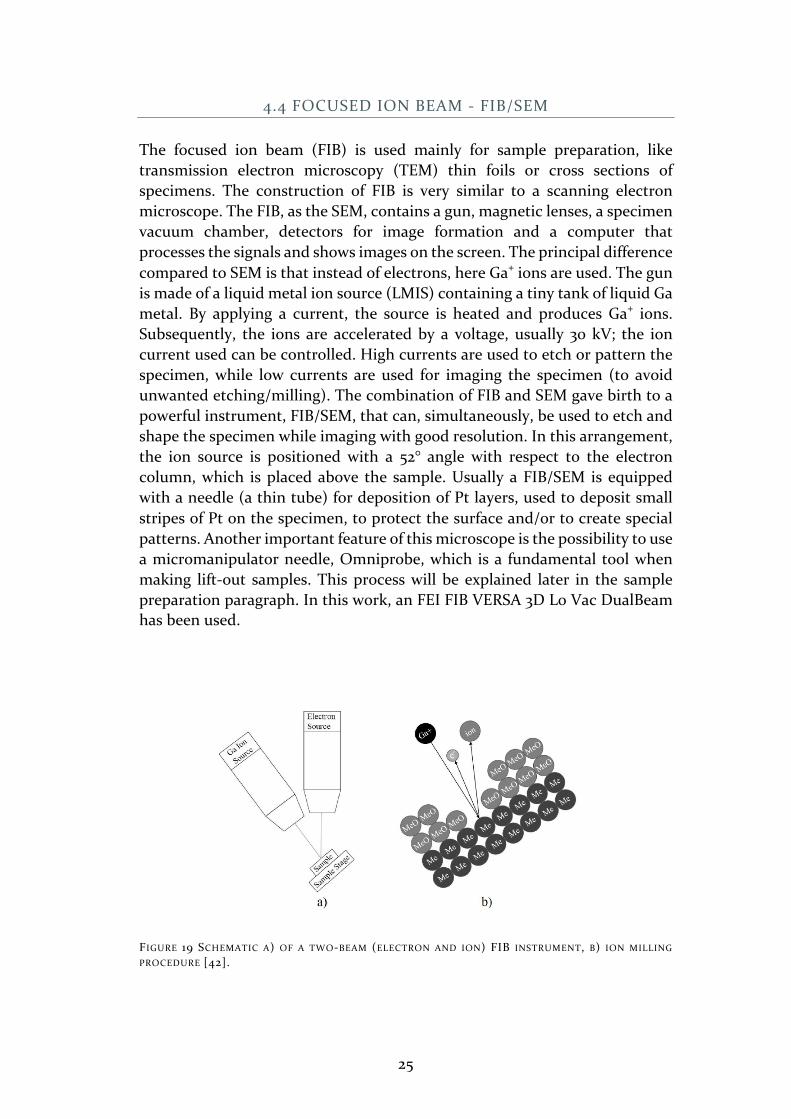
The focused ion beam (FIB) is used mainly for sample preparation, like transmission electron microscopy (TEM) thin foils or cross sections of specimens. The construction of FIB is very similar to a scanning electron microscope. The FIB, as the SEM, contains a gun, magnetic lenses, a specimen vacuum chamber, detectors for image formation and a computer that processes the signals and shows images on the screen. The principal difference compared to SEM is that instead of electrons, here Ga+ ions are used. The gun is made of a liquid metal ion source (LMIS) containing a tiny tank of liquid Ga metal. By applying a current, the source is heated and produces Ga+ ions. Subsequently, the ions are accelerated by a voltage, usually 30 kV; the ion current used can be controlled. High currents are used to etch or pattern the specimen, while low currents are used for imaging the specimen (to avoid unwanted etching/milling). The combination of FIB and SEM gave birth to a powerful instrument, FIB/SEM, that can, simultaneously, be used to etch and shape the specimen while imaging with good resolution. In this arrangement, the ion source is positioned with a 52° angle with respect to the electron column, which is placed above the sample. Usually a FIB/SEM is equipped with a needle (a thin tube) for deposition of Pt layers, used to deposit small stripes of Pt on the specimen, to protect the surface and/or to create special patterns. Another important feature of this microscope is the possibility to use a micromanipulator needle, Omniprobe, which is a fundamental tool when making lift-out samples. This process will be explained later in the sample preparation paragraph. In this work, an FEI FIB VERSA 3D Lo Vac DualBeam has been used.
FIGURE 19 SCHEMATIC A) OF A TWO-BEAM (ELECTRON AND ION) FIB INSTRUMENT, B) ION MILLING
PROCEDURE [42].
26
4.5 FIB-SAMPLE PREPARATION
The FIB/SEM is a very convenient tool, since it permits machining the specimen, while simultaneously having a high-quality SEM image of the sample. Cross sections of the samples and TEM lift-outs could be achieved in this project thanks to the FIB/SEM.
4.5.1 CROSS SECTIONS
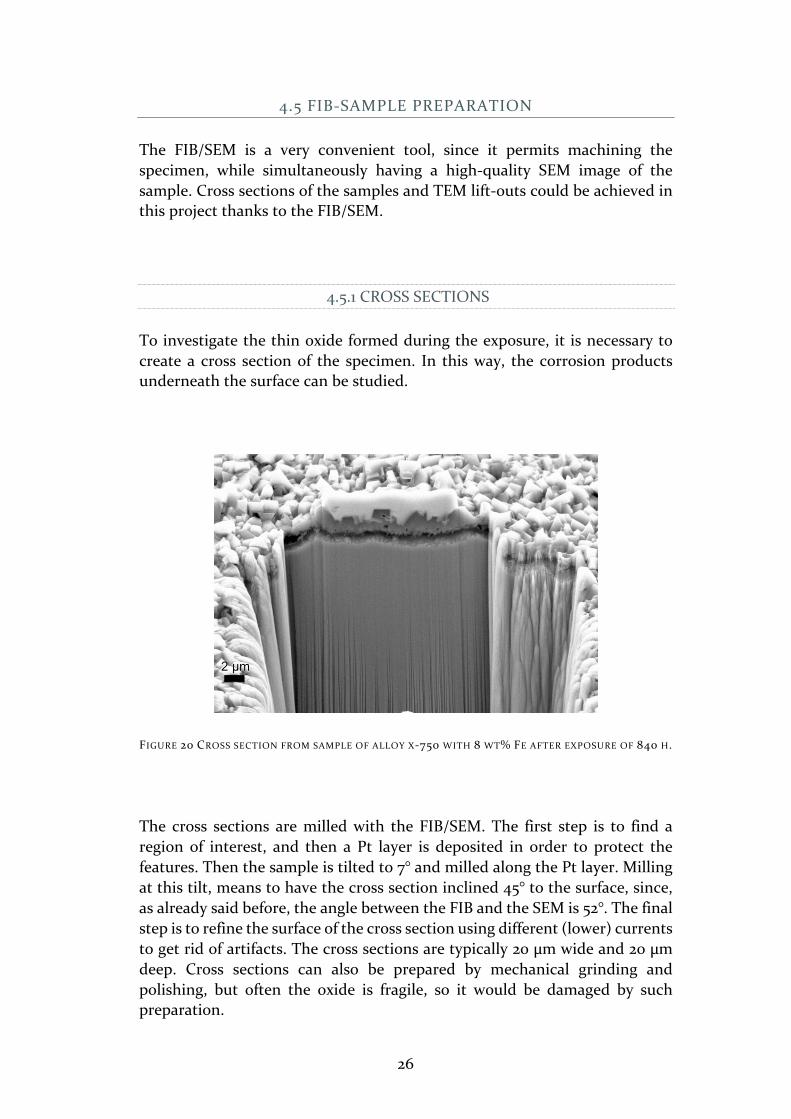
To investigate the thin oxide formed during the exposure, it is necessary to create a cross section of the specimen. In this way, the corrosion products underneath the surface can be studied.
FIGURE 20 CROSS SECTION FROM SAMPLE OF ALLOY X-750 WITH 8 WT% FE AFTER EXPOSURE OF 840 H.
The cross sections are milled with the FIB/SEM. The first step is to find a region of interest, and then a Pt layer is deposited in order to protect the features. Then the sample is tilted to 7° and milled along the Pt layer. Milling at this tilt, means to have the cross section inclined 45° to the surface, since, as already said before, the angle between the FIB and the SEM is 52°. The final step is to refine the surface of the cross section using different (lower) currents to get rid of artifacts. The cross sections are typically 20 µm wide and 20 µm deep. Cross sections can also be prepared by mechanical grinding and polishing, but often the oxide is fragile, so it would be damaged by such preparation.
27
4.5.2 THIN FOIL LAMELLA FOR TEM
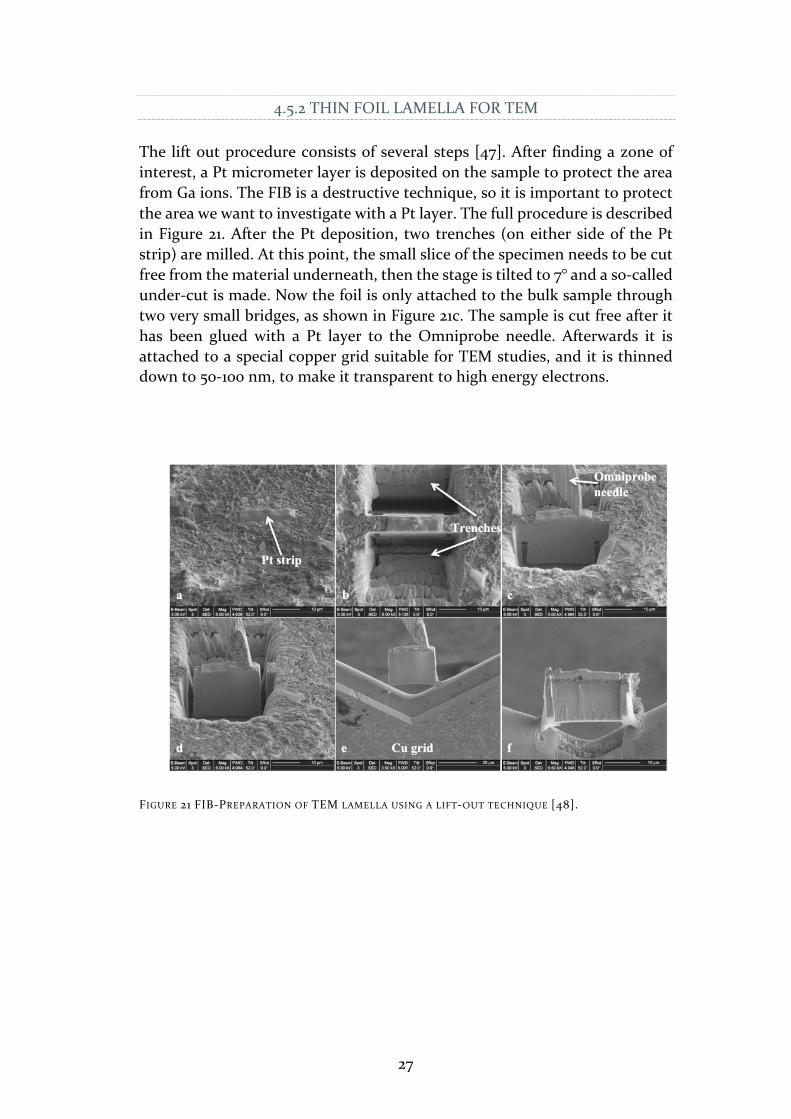
The lift out procedure consists of several steps [47]. After finding a zone of interest, a Pt micrometer layer is deposited on the sample to protect the area from Ga ions. The FIB is a destructive technique, so it is important to protect the area we want to investigate with a Pt layer. The full procedure is described in Figure 21. After the Pt deposition, two trenches (on either side of the Pt strip) are milled. At this point, the small slice of the specimen needs to be cut free from the material underneath, then the stage is tilted to 7° and a so-called under-cut is made. Now the foil is only attached to the bulk sample through two very small bridges, as shown in Figure 21c. The sample is cut free after it has been glued with a Pt layer to the Omniprobe needle. Afterwards it is attached to a special copper grid suitable for TEM studies, and it is thinned down to 50-100 nm, to make it transparent to high energy electrons.
FIGURE 21 FIB-PREPARATION OF TEM LAMELLA USING A LIFT-OUT TECHNIQUE [48].
28
4.6 TRANSMISSION ELECTRON MICROSCOPY - TEM
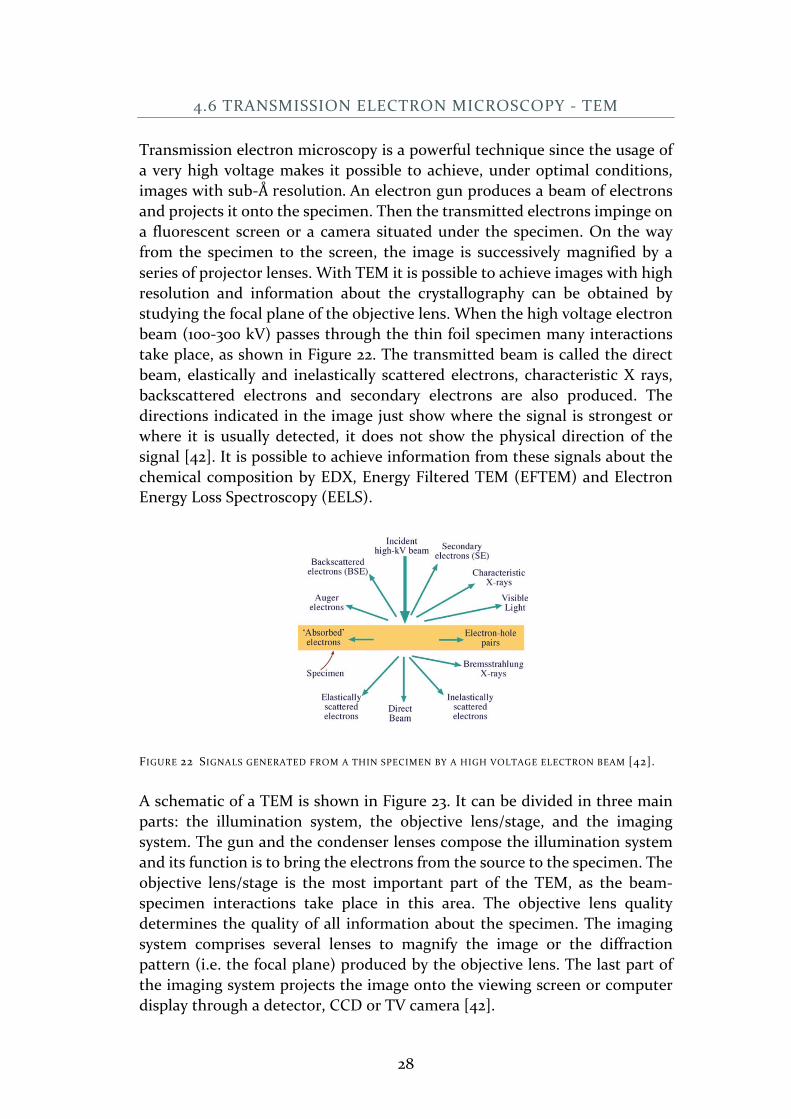
Transmission electron microscopy is a powerful technique since the usage of a very high voltage makes it possible to achieve, under optimal conditions, images with sub-Åresolution.An electron gun produces a beam of electrons and projects it onto the specimen. Then the transmitted electrons impinge on a fluorescent screen or a camera situated under the specimen. On the way from the specimen to the screen, the image is successively magnified by a series of projector lenses. With TEM it is possible to achieve images with high resolution and information about the crystallography can be obtained by studying the focal plane of the objective lens. When the high voltage electron beam (100-300 kV) passes through the thin foil specimen many interactions take place, as shown in Figure 22. The transmitted beam is called the direct beam, elastically and inelastically scattered electrons, characteristic X rays, backscattered electrons and secondary electrons are also produced. The directions indicated in the image just show where the signal is strongest or where it is usually detected, it does not show the physical direction of the signal [42]. It is possible to achieve information from these signals about the chemical composition by EDX, Energy Filtered TEM (EFTEM) and Electron Energy Loss Spectroscopy (EELS).
FIGURE 22 SIGNALS GENERATED FROM A THIN SPECIMEN BY A HIGH VOLTAGE ELECTRON BEAM [42].
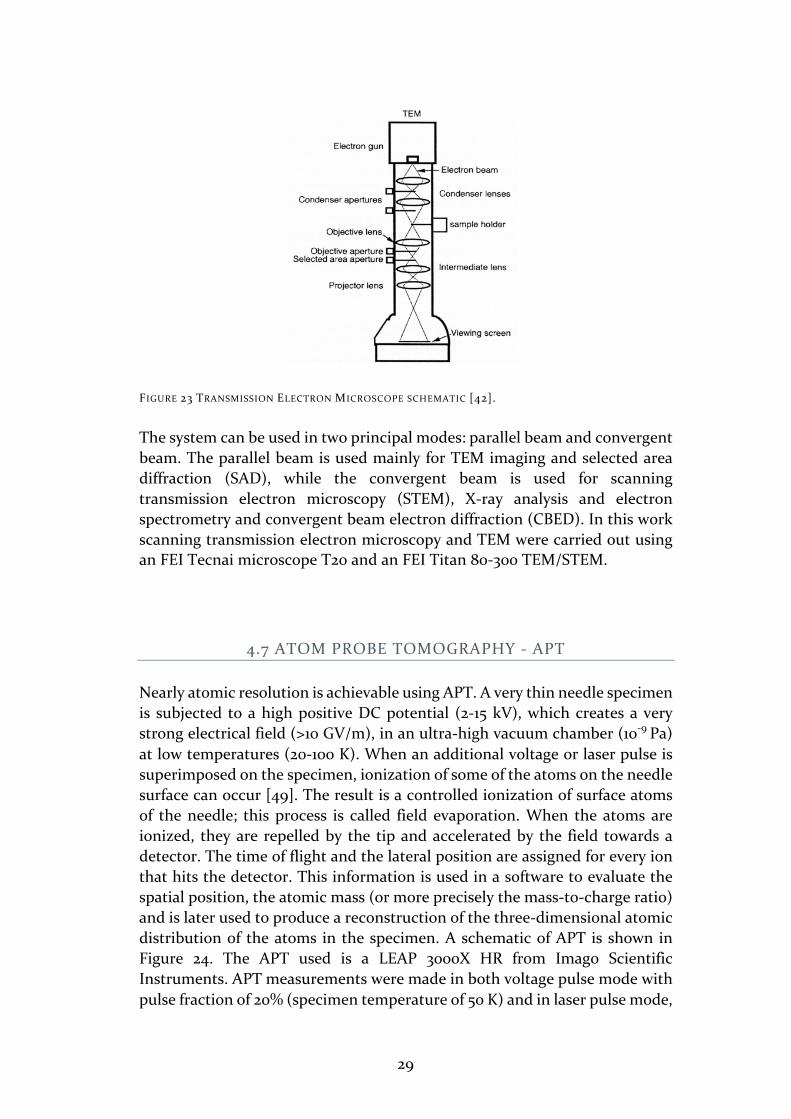
A schematic of a TEM is shown in Figure 23. It can be divided in three main parts: the illumination system, the objective lens/stage, and the imaging system. The gun and the condenser lenses compose the illumination system and its function is to bring the electrons from the source to the specimen. The objective lens/stage is the most important part of the TEM, as the beam-specimen interactions take place in this area. The objective lens quality determines the quality of all information about the specimen. The imaging system comprises several lenses to magnify the image or the diffraction pattern (i.e. the focal plane) produced by the objective lens. The last part of the imaging system projects the image onto the viewing screen or computer display through a detector, CCD or TV camera [42].
29
FIGURE 23 TRANSMISSION ELECTRON MICROSCOPE SCHEMATIC [42].
The system can be used in two principal modes: parallel beam and convergent beam. The parallel beam is used mainly for TEM imaging and selected area diffraction (SAD), while the convergent beam is used for scanning transmission electron microscopy (STEM), X-ray analysis and electron spectrometry and convergent beam electron diffraction (CBED). In this work scanning transmission electron microscopy and TEM were carried out using an FEI Tecnai microscope T20 and an FEI Titan 80-300 TEM/STEM.
4.7 ATOM PROBE TOMOGRAPHY - APT
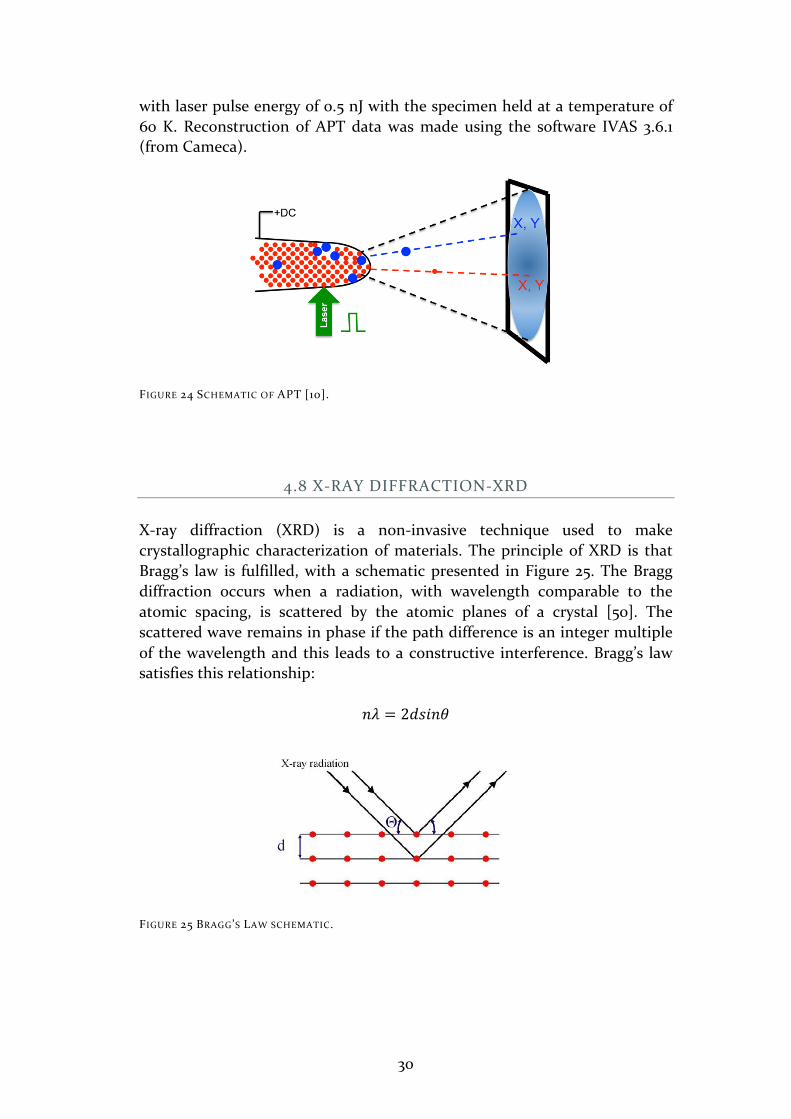
Nearly atomic resolution is achievable using APT. A very thin needle specimen is subjected to a high positive DC potential (2-15 kV), which creates a very strong electrical field (>10 GV/m), in an ultra-high vacuum chamber (10-9 Pa) at low temperatures (20-100 K). When an additional voltage or laser pulse is superimposed on the specimen, ionization of some of the atoms on the needle surface can occur [49]. The result is a controlled ionization of surface atoms of the needle; this process is called field evaporation. When the atoms are ionized, they are repelled by the tip and accelerated by the field towards a detector. The time of flight and the lateral position are assigned for every ion that hits the detector. This information is used in a software to evaluate the spatial position, the atomic mass (or more precisely the mass-to-charge ratio) and is later used to produce a reconstruction of the three-dimensional atomic distribution of the atoms in the specimen. A schematic of APT is shown in Figure 24. The APT used is a LEAP 3000X HR from Imago Scientific Instruments. APT measurements were made in both voltage pulse mode with pulse fraction of 20% (specimen temperature of 50 K) and in laser pulse mode,
30
with laser pulse energy of 0.5 nJ with the specimen held at a temperature of 60 K. Reconstruction of APT data was made using the software IVAS 3.6.1 (from Cameca).
FIGURE 24 SCHEMATIC OF APT [10].
4.8 X-RAY DIFFRACTION-XRD
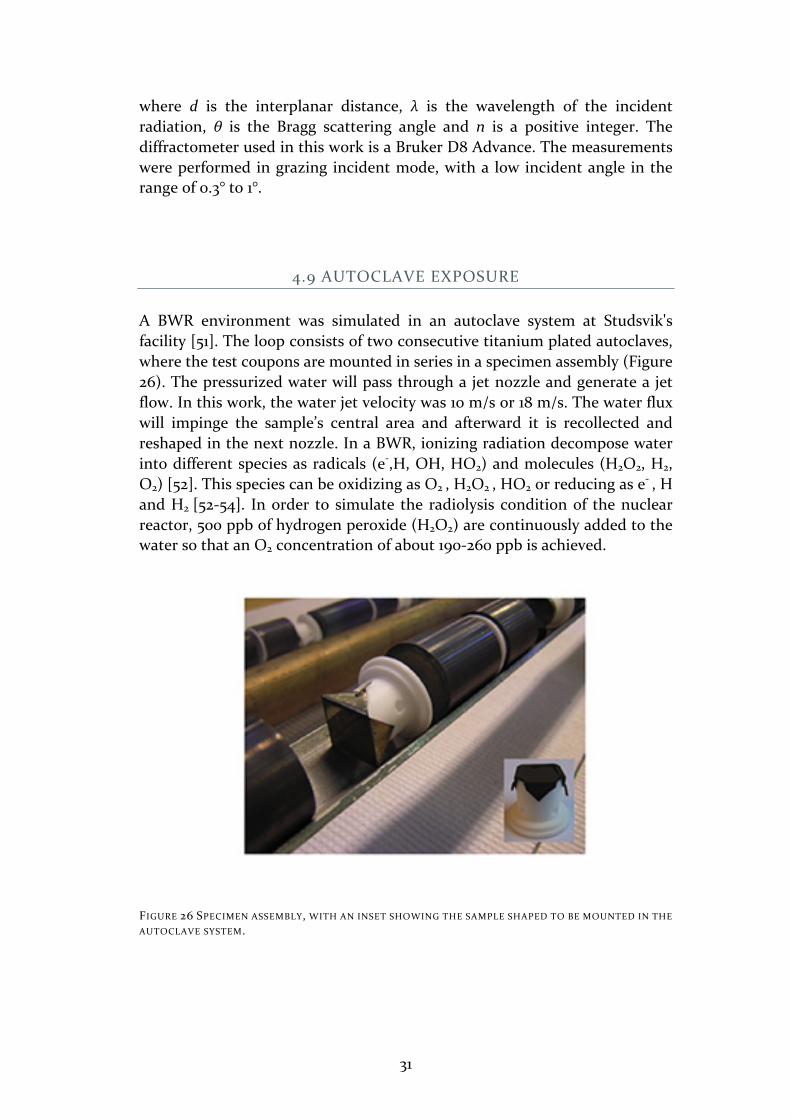
X-ray diffraction (XRD) is a non-invasive technique used to make crystallographic characterization of materials. The principle of XRD is that Bragg’s law is fulfilled, with a schematic presented in Figure 25. The Bragg diffraction occurs when a radiation, with wavelength comparable to the atomic spacing, is scattered by the atomic planes of a crystal [50]. The scattered wave remains in phase if the path difference is an integer multiple of the wavelength and this leads to a constructive interference. Bragg’s law satisfies this relationship:
𝑛𝜆 = 2𝑑𝑠𝑖𝑛𝜃
FIGURE 25 BRAGG’S LAW SCHEMATIC.
31
where d is the interplanar distance, λ is the wavelength of the incident radiation, θ is the Bragg scattering angle and n is a positive integer. The diffractometer used in this work is a Bruker D8 Advance. The measurements were performed in grazing incident mode, with a low incident angle in the range of 0.3° to 1°.
4.9 AUTOCLAVE EXPOSURE
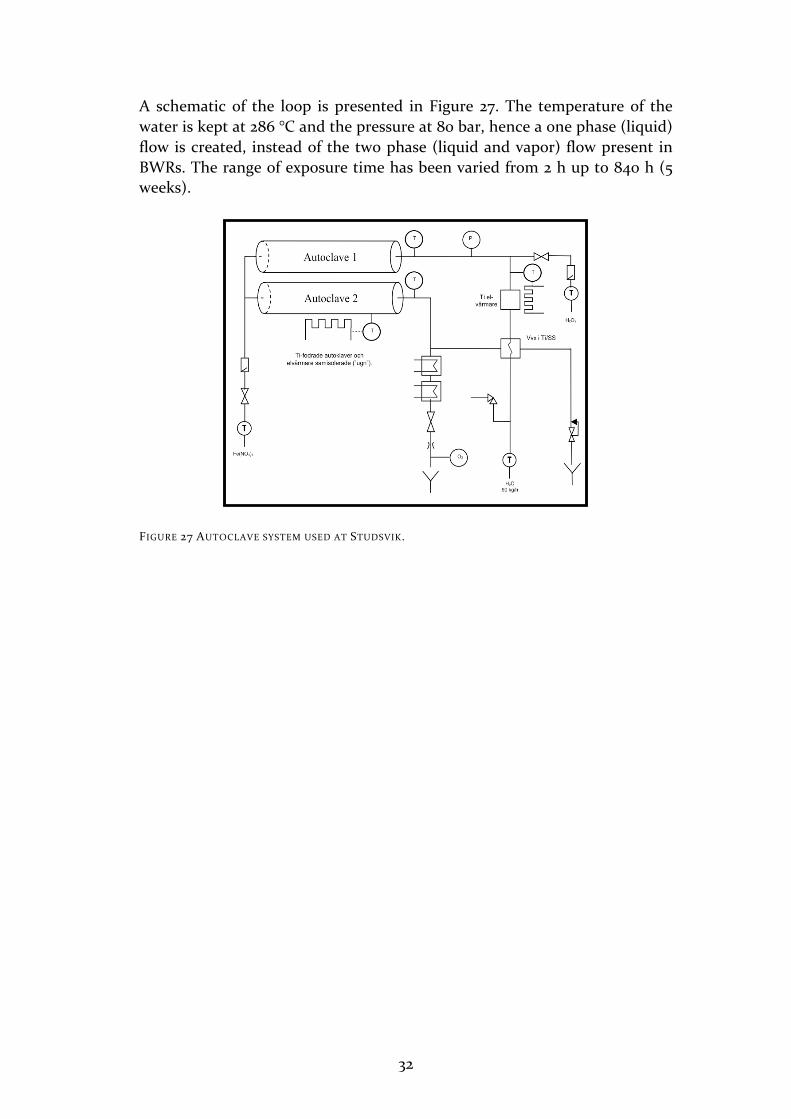
A BWR environment was simulated in an autoclave system at Studsvik's facility [51]. The loop consists of two consecutive titanium plated autoclaves, where the test coupons are mounted in series in a specimen assembly (Figure 26). The pressurized water will pass through a jet nozzle and generate a jet flow. In this work, the water jet velocity was 10 m/s or 18 m/s. The water flux will impinge the sample’s central area and afterward it is recollected and reshaped in the next nozzle. In a BWR, ionizing radiation decompose water into different species as radicals (e-,H, OH, HO2) and molecules (H2O2, H2, O2) [52]. This species can be oxidizing as O2 , H2O2 , HO2 or reducing as e- , H and H2 [52-54]. In order to simulate the radiolysis condition of the nuclear reactor, 500 ppb of hydrogen peroxide (H2O2) are continuously added to the water so that an O2 concentration of about 190-260 ppb is achieved.
FIGURE 26 SPECIMEN ASSEMBLY, WITH AN INSET SHOWING THE SAMPLE SHAPED TO BE MOUNTED IN THE
AUTOCLAVE SYSTEM.
32
A schematic of the loop is presented in Figure 27. The temperature of the water is kept at 286 °C and the pressure at 80 bar, hence a one phase (liquid) flow is created, instead of the two phase (liquid and vapor) flow present in BWRs. The range of exposure time has been varied from 2 h up to 840 h (5 weeks).
FIGURE 27 AUTOCLAVE SYSTEM USED AT STUDSVIK.
33
5 RESULTS AND DISCUSSION
The aim of this thesis is to understand high temperature water corrosion of alloy X-750 in simulated BWR environment. The main focus was on investigating the evolution of the growth of the oxide formed on the surface of the alloy after the exposures. Different pretreatments have been studied and specifically the effect of pickling and pre-oxidation. The main experimental tools used are advanced microscopy and microanalyses, i.e. SEM and TEM combined with EDX.
When the project started it was known from field experience [55, 56] that higher iron content and a pickling surface treatment are beneficial. However the literature was very limited [39, 40, 57] since the majority of studies performed on alloy X-750 concerned stress corrosion cracking [58-62] or the microstructure and optimization of the aging treatment [63-67]. This work tries to make up for the lack of microscopy studies of high temperature water corrosion of alloy X-750. Specimens of alloy X-750 with different iron content (5 and 8 at.%) have been exposed in autoclave simulating BWR environment for different times, ranging from 2 h to 840 h. This thesis is based on five papers that are summarized in this chapter.
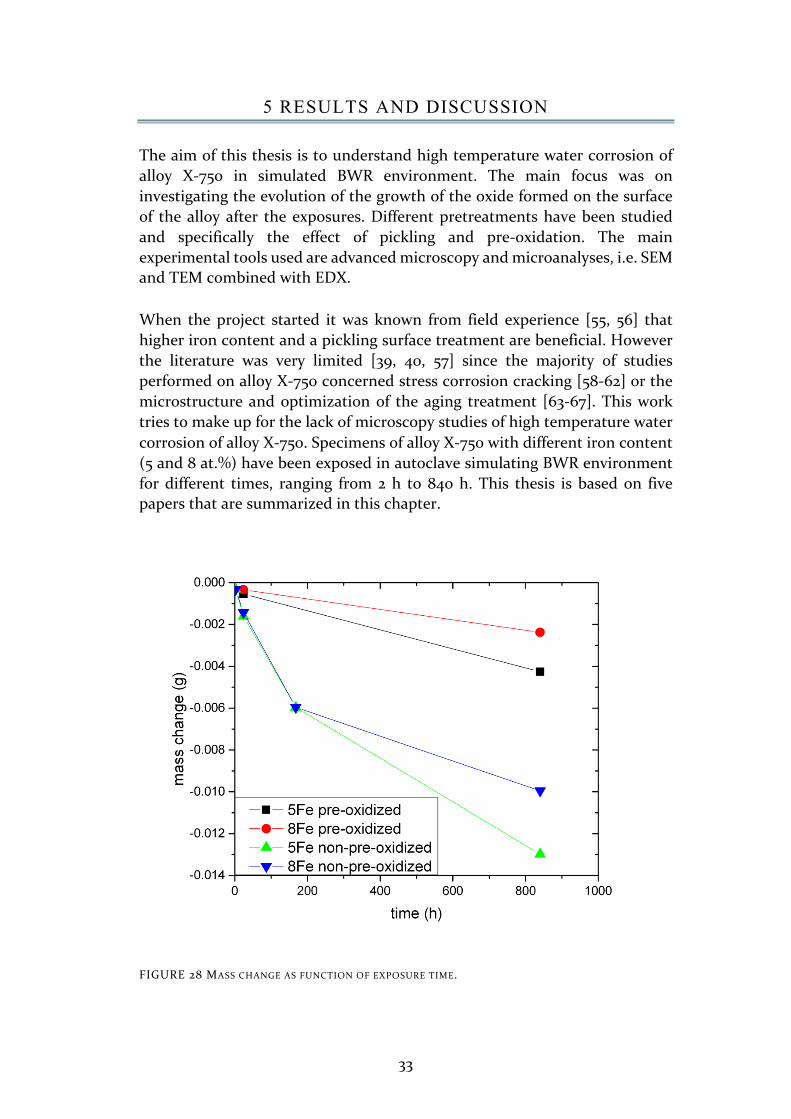
FIGURE 28 MASS CHANGE AS FUNCTION OF EXPOSURE TIME.
34
The mass change of pre-oxidized and non-pre-oxidized pickled samples is shown in Figure 28. It is clear that pre-oxidation is crucial for limiting the mass loss. Mass loss occurs for each set of specimens, and it is clear that pre-oxidation is crucial for limiting the mass loss. The formation of the oxide involves dissolution of metal and re-precipitation of ions on the surface.
The results obtained can be divided into two groups: results on non-pre-oxidized samples, and results on pre-oxidized samples. Paper I and Paper II are focused on the oxide growth evolution of non-pre-oxidized specimens, specifically 8Fe specimens (the blue line in Figure 28) are investigated in Paper I, while 5Fe is studied and compared with 8Fe in Paper II (the green and the blue lines in Figure 28). Paper III and Paper IV concern investigations of pre-oxidized specimens with different Fe content, and the focus is on pickling and short exposure times, respectively. These two papers treat samples corresponding to the black and red lines in Figure 28. Paper V presents a comparison of the oxidation of 8Fe specimens that have and have not been pre-oxidized.
5.1 THE OXIDE GROWTH EVOLUTION OF NON-PRE-OXIDIZED SPECIMENS
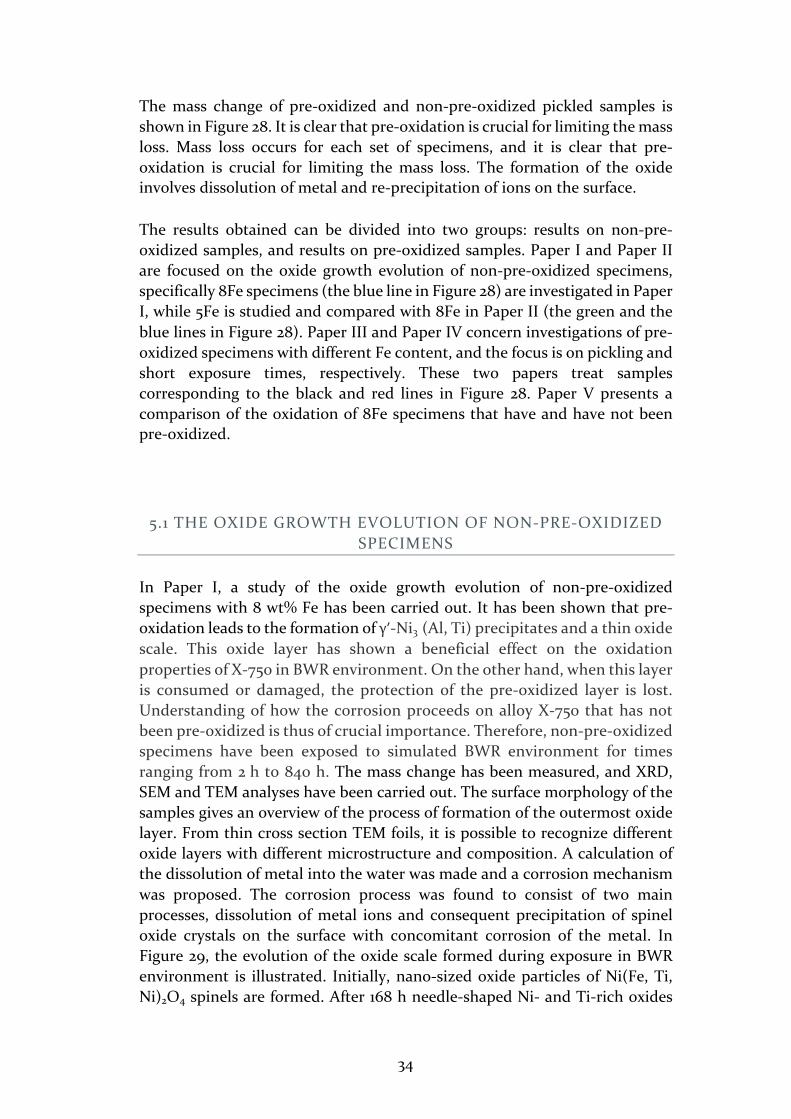
In Paper I, a study of the oxide growth evolution of non-pre-oxidized specimens with 8 wt% Fe has been carried out. It has been shown that pre-oxidation leads to the formation of γʹ-Ni3 (Al, Ti) precipitates and a thin oxide scale. This oxide layer has shown a beneficial effect on the oxidation properties of X-750 in BWR environment. On the other hand, when this layer is consumed or damaged, the protection of the pre-oxidized layer is lost. Understanding of how the corrosion proceeds on alloy X-750 that has not been pre-oxidized is thus of crucial importance. Therefore, non-pre-oxidized specimens have been exposed to simulated BWR environment for times ranging from 2 h to 840 h. The mass change has been measured, and XRD, SEM and TEM analyses have been carried out. The surface morphology of the samples gives an overview of the process of formation of the outermost oxide layer. From thin cross section TEM foils, it is possible to recognize different oxide layers with different microstructure and composition. A calculation of the dissolution of metal into the water was made and a corrosion mechanism was proposed. The corrosion process was found to consist of two main processes, dissolution of metal ions and consequent precipitation of spinel oxide crystals on the surface with concomitant corrosion of the metal. In Figure 29, the evolution of the oxide scale formed during exposure in BWR environment is illustrated. Initially, nano-sized oxide particles of Ni(Fe, Ti, Ni)2O4 spinels are formed. After 168 h needle-shaped Ni- and Ti-rich oxides
35
are formed underneath the spinel crystals, and a large number of voids are created. As the exposure proceeds, the outer layer of spinels becomes continuous, and the amount of voids decreases. The inner oxide layer consists of small grains, and is rather porous.
FIGURE 29 PROPOSED OXIDE FORMATION, STARTING FROM NANOPARTICLES TO A COMPLEX FOUR
LAYER STRUCTURE
The inner layer is the oxidized base metal. Compared to the alloy composition, it becomes enriched in Cr, and to some extent Ti, whereas the Fe content decreases. This means that Ni and Fe are dissolved preferentially into the water, resulting in an increase in Cr and Ti in the inner layer. Considering the large volume of spinel crystals and the relatively low Fe content of the alloy, it is clear that a large amount of Ni must be dissolved and disappear with the flowing water. A large part of the Fe, on the other hand, stays by the precipitation of the Fe-rich spinels. As the thickness of the inner layer does not change very much between 168 h and 840 h of exposure, and the fact that the layer is rather porous, it is suggested that transport through this layer is probably not rate limiting. Rather it seems likely that the protection comes from the outer compact layer of spinel crystals. There is a drastic change in appearance of the oxide after 840 h compared to after 168 h, which is very interesting. This is probably related to the start of the formation of pure NiO between the inner oxide and the original spinel crystals, effectively filling up the voids. It seems reasonable to suggest that what happens is that when the spinel coverage becomes complete, the processes slow down, and the other
36
stable phases are formed. This also agrees with the observation that the innermost oxide (close to the oxide/metal interface) becomes depleted in Cr, i.e. the slow process allows for some diffusion and the more stable pure NiO has time to form. The oxide growth evolution of 5Fe has been examined in Paper II, and it is rather similar to the 8Fe. However, the scale on 5Fe is poorly adherent, and after 168 h exposure it is attached to the surface only at a small fraction of the interface areas, in contrast to 8Fe. Furthermore, in order to estimate the amount of metal dissolution, equation 1 from references [41, 68, 69] was used.
𝛥𝑚 = 𝑚 0 −𝑚 𝑡 Z[\]^ − 𝑚(𝑡)_*`a[ (Eq. 1)
Here𝛥𝑚 is the mass change, 𝑚 0 is the mass of the specimen before the exposure, 𝑚(𝑡)Z[\]^ is the mass of the metal left after exposure, and 𝑚(𝑡)_*`a[ is the mass of the total oxide scale gained at time t. The oxide mass is calculated as 𝑚(𝑡)_*`a[ = 𝑥_*`a[𝐴𝜌_*`a[, where 𝜌_*`a[ is the density of the oxide, 𝑥_*`a[ is the oxide thickness, and A is the surface area of the test coupon. The thickness of the dissolved metal, h, after an exposure time t is calculated as:
ℎ = 8efghij
(Δ𝑚 + 0.27𝑥n`o[pqr𝐴𝜌n`o[pqr + 0.21𝑥n`q𝐴𝜌n`q) (Eq. 2)
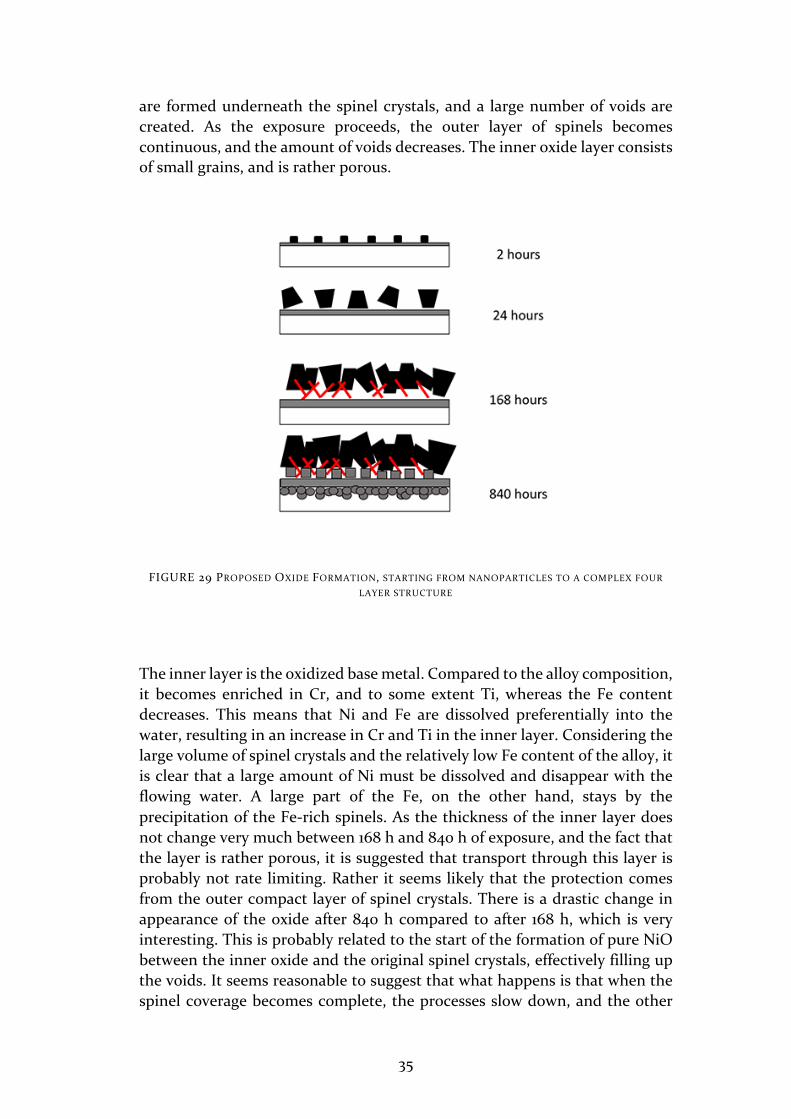
Here 𝜌stuv = 8.2𝑔/𝑐𝑚1 [70] and 𝑥is the measured average thickness from TEM analyses, with a reduction for porosity, and 0.27 is the oxygen mass fraction if NiFe2O4 has an ideal composition, and 0.21 is the oxygen mass fraction if NiO has an ideal composition. For the calculations, the scales have been considered to be made up of two layers: a NiFe2O4 ( 𝜌n`o[pqr =5.3𝑔/𝑐𝑚1) [71] outer layer and a NiO (𝜌n`q = 6.67𝑔/𝑐𝑚1) [72] inner layer. The calculated thickness of the dissolved metal as function of exposure time is shown in Figure 30. The rate of dissolution decreases with time, which means that the oxide formed provides some degree of protection. It should be noted that this is the equivalent thickness of the amount of metal that has been transported away from the specimen. In Paper II, it is also observed that the speed with which the oxide grows and the speed with which metal dissolves both decrease with time, and that the metal thinning is a sub-parabolic process. The three processes are slower on the material with higher Fe content, 8 wt%, proving the importance of this element for limiting the degradation of alloy X-750 in BWR environment.
37
FIGURE 30 DISSOLVED METAL THICKNESS INTO THE WATER AS FUNCTION OF THE TIME EXPOSURE.
5.2 THE CORROSION BEHAVIOR OF PRE-OXIDIZED ALLOY X-750
The effect of the commercial surface pretreatment, so called pickling, and the effect of Fe content on specimens exposed for four weeks in simulated BWR condition was investigated in Paper III. XRD, SEM and TEM analyses have been carried out. Additionally, APT has been used to study one of the materials. The effect of iron content has been investigated by comparing samples with 5 wt% and 8 wt%. The pre-oxidation results in a multi-layer oxide scale which consist of an outermost part made of thin (50-60 nm) primary NiFe2O4 spinel covering a relatively thick (150-200 nm) Cr-rich layer and a non-continuous inner layer of Al2O3 and SiO2 at the interface to the base alloy. The Cr-rich layer was observed, in Paper IV, made of two parts: an outer part of NiCr2O4 and an innermost part made of Cr2O3 and interspersed TiO2.The presence of a chromia layer is presumably beneficial, as it will restrict the outward diffusion of metallic elements, because generally Cr2O3 has low diffusion coefficients for metal ions [73]. However, Cr2O3 is not stable in reactor water, and its dissolution rate is rather high if the oxide is in direct contact with high temperature water under oxidizing conditions (as in the case of NWC) [57, 74].
38
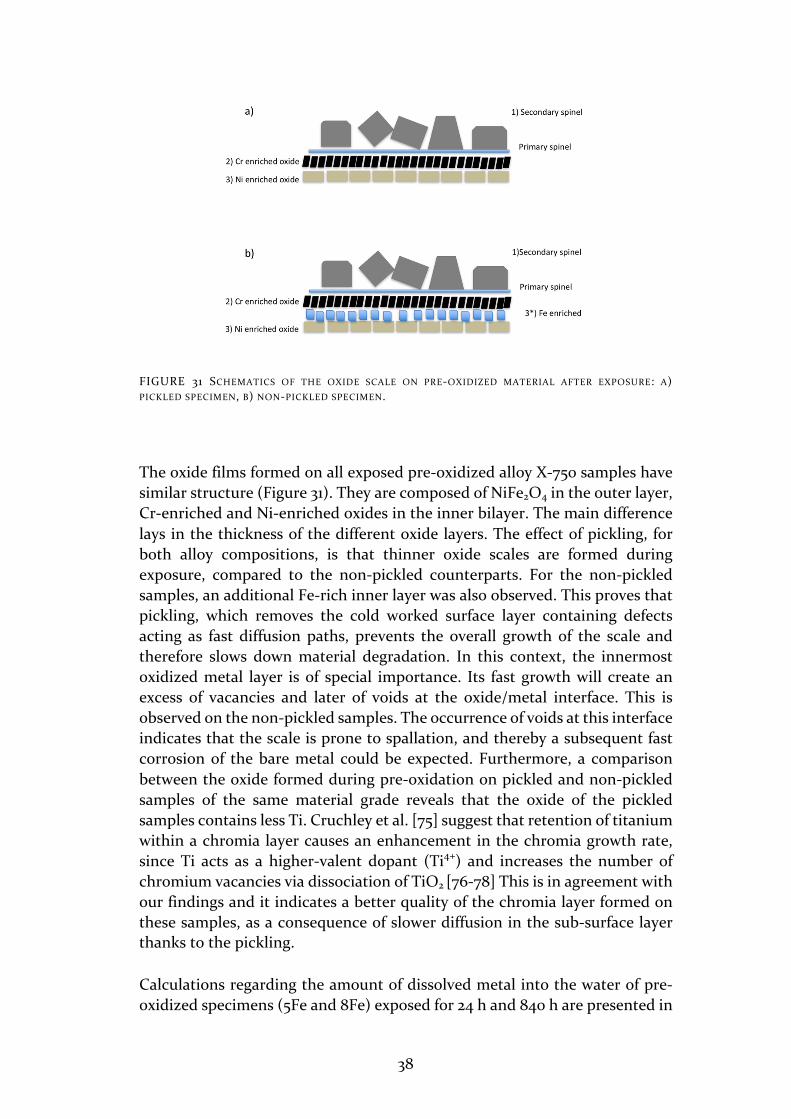
FIGURE 31 SCHEMATICS OF THE OXIDE SCALE ON PRE-OXIDIZED MATERIAL AFTER EXPOSURE: A)
PICKLED SPECIMEN, B) NON-PICKLED SPECIMEN.
The oxide films formed on all exposed pre-oxidized alloy X-750 samples have similar structure (Figure 31). They are composed of NiFe2O4 in the outer layer, Cr-enriched and Ni-enriched oxides in the inner bilayer. The main difference lays in the thickness of the different oxide layers. The effect of pickling, for both alloy compositions, is that thinner oxide scales are formed during exposure, compared to the non-pickled counterparts. For the non-pickled samples, an additional Fe-rich inner layer was also observed. This proves that pickling, which removes the cold worked surface layer containing defects acting as fast diffusion paths, prevents the overall growth of the scale and therefore slows down material degradation. In this context, the innermost oxidized metal layer is of special importance. Its fast growth will create an excess of vacancies and later of voids at the oxide/metal interface. This is observed on the non-pickled samples. The occurrence of voids at this interface indicates that the scale is prone to spallation, and thereby a subsequent fast corrosion of the bare metal could be expected. Furthermore, a comparison between the oxide formed during pre-oxidation on pickled and non-pickled samples of the same material grade reveals that the oxide of the pickled samples contains less Ti. Cruchley et al. [75] suggest that retention of titanium within a chromia layer causes an enhancement in the chromia growth rate, since Ti acts as a higher-valent dopant (Ti4+) and increases the number of chromium vacancies via dissociation of TiO2 [76-78] This is in agreement with our findings and it indicates a better quality of the chromia layer formed on these samples, as a consequence of slower diffusion in the sub-surface layer thanks to the pickling.
Calculations regarding the amount of dissolved metal into the water of pre-oxidized specimens (5Fe and 8Fe) exposed for 24 h and 840 h are presented in
39
Paper IV. In order to estimate the dissolved metal thickness (h) the equation in Paper I was used. While after 24 h the amount of dissolution of the specimens with different iron content is rather similar, the dissolution of 5Fe is about two times larger than the dissolution of 8Fe after 840 h. The oxides found on the specimens, exposed for 24 h and 840 h, are in agreement with the Fe-Cr-Ni Pourbaix diagram presented by Beverskog [15], where the stability of the different oxides under normal water chemistry conditions is presented. It is shown that the NiFe2O4 is the most stable oxide at BWR conditions (200 mV, pH=5.8, 286°C). Therefore, the formation of a dense NiFe2O4 layer is necessary for the survival of the Cr2O3 layer formed during the pre-oxidation. The spinel layer will protect chromia from dissolving into the water and enable Cr2O3 to stay on the surface of the alloy.
In Paper IV, it is also found that a higher iron content will enable the formation of a primary trevorite with superior quality. In fact, signs of dissolution of the NiCr2O4 layer (formed during pre-oxidation) together with the thicker layer of oxidized metal observed on 5Fe after only 24 h exposure, suggest that the primary trevorite formed on this specimen is not protective enough. Instead, on 8Fe, the NiCr2O4 is still present within the oxide scale and the oxidation of the alloy beneath the pre-oxide is also less severe. This is also experienced by the specimens exposed for 840 h, where the NiCr2O4 layer is still present on 8Fe, but it is completely degraded on 5Fe. After 840 h, large parts of the dissolved material has re-precipitated in a second layer of large separated crystals of trevorite. The fact that this layer is not fully covering the surface indicates that it cannot be the one giving protection in this case. Consequently, it must be the oxide formed during pre-oxidation, that can still be found on the surface, that gives protection, together with the thin continuous layer of trevorite that is developed during the early stage of the exposure.
5.3 COMPARISON OF PRE-OXIDIZED AND NON-PRE-OXIDIZED 8FE SPECIMENS
In order to draw conclusions on the effect of pre-oxidation, in Paper V, pre-oxidized and non-pre-oxidized specimens with 8 wt% Fe were compared. The specimens were exposed for 24 h and 840 h in an autoclave, mimicking the BWR environment. It was found that pre-oxidized specimens show thinner and more homogenous oxides than non-pre-oxidized ones. They lose less mass and build thinner oxides. It is found that during the pre-oxidation, a primary spinel layer is formed on top of a chromia layer. As chromia is not stable in high temperature reactor water [16], the primary spinel is needed to protect the chromia from dissolution. After the long exposure (840 h), crystals
40
of NiFe2O4 are formed by re-precipitation on both sample types. To form this layer, Ni and Fe have to diffuse and then dissolve into the water. In the case of the pre-oxidized specimen, a thin layer is built-up. Instead, for the non-pre-oxidized specimen a non-continuous layer of rather large spinel crystals is formed on the surface. Since between the crystals there is only a fine-grained, porous layer of oxidized base metal, it is easier for Ni and Fe to move towards the water and then dissolve. Eventually, Ni and Fe will re-precipitate to form the blocky spinels. When the chromia layer is dense, as in the pre-oxidized specimens, it causes a limited flux of ions in both directions [79]. The small flux gives rise to a thin secondary blocky spinel layer, since the amount of Ni and Fe in the water is less than in the non-pre-oxidized case.
5.4 FUTURE WORK
During the course of this project, many ideas have been proposed to further improve the understanding of the corrosion behavior of alloy X-750 in BWR environment. The identification of the crystallography of the phases of the thin inner oxide could be relevant for acquiring more information about the oxidation process. Electron diffraction techniques in TEM, as convergent beam electron diffraction, could be the main tool in the identification of this very fine-grained oxide. Longer exposure times in the autoclave would shine some light on the correlation between mass loss and oxide growth. In this thesis, it is proposed that a steady state will be reached, in the sense that the mass loss rate (and dissolution rate) will become constant, as perhaps also the oxide thickness. In order to verify our hypothesis, it would be necessary to increase the length of the autoclave exposures beyond the 840 h. Since the autoclave exposure is only a simulation of the complex reactor environment the results of this thesis would need to be complemented by studies of spacer grids from BWR in order to improve the understanding and facilitate development of spacer grids with better performance. The comparison with irradiated specimens of alloy X-750 taken from reactors would give the possibility to verify and confirm the results of this thesis.

41
ACKNOWLEDGEMENTS
There are many people that have contributed to the realization of this thesis, first of all, I would like to express my profound gratitude and deep regards to my supervisors Krystyna Stiller and Mattias Thuvander for giving me the possibility to work on this project, their guidance and constant encouragement throughout my work. I am very grateful to my cosupervisor Fang Liu for all the TEM help and for her kindness and support during my time at Chalmers.
My sincere gratitude is dedicated to Jiaxin Chen, your kindness and your knowledge in the field is a big inspirational source for me!
I would also express my deepest thankfulness to Pascale Sotto Vangeli, Bertil Josefsson, Kenneth Göransson, Tomas Forsman, for the discussion regarding the project and all the help they provide during my PhD at Chalmers.
Extraordinary thanks to Ola, Ander Kvist and Stefan Gustanfsson for all the help with the technical support. To Lena, to be such caring director of material science graduate study. To my officemate, Anand and Nooshin, it has been a pleasure to share the office with you. To Kristina and Masoud, I will miss our coffee together and the chit-chat. Antiope, it has been very funny to work together! Haiping, thank you very much to teach me so many instrumentations. A special thanks to all the people of Material Microstructure, CMAL group and Eva Olsson group for having such nice lunch and fika time, for all the fun and the laugh we had together, to make such nice working environment. I will miss you all!
Thank you to all my friends met in Sweden, that have make this journey very enjoyable :D Thank you for the fun and the different experience together!
Finally, I would like to express my gratitude to my parents, for their endless love and support.
Last but not least, Pier, thank you for all the time you dedicated to me, to push me to do better, for your honesty and your endless help, I couldn’t imagine a better life companion!

42
43
REFERENCES
[1] E. Warner and G. Heath, ‘Life Cycle Greenhouse Gas Emissions of Nuclear Electricity Generation’, Journal of Industrial Ecology, vol. 16, pp. 73–92, Apr. 2012.
[2] ‘www.iaea.org/pris’. .
[3] ‘www.world-nuclear.org’. .
[4] ‘[IEA2015] International Energy Agency, Technology Roadmap, Nuclear Energy, OECD/IEA 2015.’ .
[5] W. Hoffelner, ‘Materials’, in Materials for Nuclear Plants: From Safe Design to Residual Life Assessments, London: Springer London, 2013, pp. 65–134.
[6] Gaylord D. Smith and Brian A. Baker, Mechanical Engineers Handbook: Materials and Mechanical Design. Chapter 6 Nickel and Its Alloys, vol. 1. 2006.
[7] E. Calota, L. Hallstadius, M. Dahlback, C. Onneby, and B. Helmersson, ‘Spacer Grid. United States Patent Application Publication’, 2011.
[8] R. Prince, Radiation Protection at Light Water Reactors, 1st ed. Springer-Verlag Berlin Heidelberg, 2012.
[9] K. Heinloth, Energy Technologies · Nuclear Energy Group VIII Advanced Materials and Technologies Volume 3B 2005. Landolt-Börnstein.
[10] G. Sundell, ‘Atomic scale degradation of zirconium alloys for nuclear applications’, Chalmers university of technology, Sweden, 2015.
[11] B. Pershagen and M. Bowen, Light Water Reactor Safety. Pergamon, 1989.
[12] ‘http://proteus.web.psi.ch/LWR-PROTEUS/?forprint’. .
[13] L. L. Shreir, Corrosion Volume I, Third Edition, vol. 1. Elsevier B.V., 2010.
[14] O. Palazhchenko, ‘Pourbaix Diagrams at Elevated Temperatures ~ A Study of Zn and Sn’, University of Ontario Institute of Technology, Canada, 2012.
[15] B. Beverskog and I. Puigdomenech, ‘Revised Pourbaix diagrams for iron
44
at 25-300C’, Corrosion Science, vol. 38, no. 12, pp. 2121–2135, 1996.
[16] B. Beverskog and I. Puigdomenech, ‘Pourbaix diagrams for the ternary system of iron-chromium-nickel’, Corrosion, vol. 55, no. 11, pp. 1077–1087, 1999.
[17] W. G. Cook and R. P. Olive, ‘Pourbaix diagrams for the nickel-water system extended to high-subcritical and low-supercritical conditions’, Corrosion Science, vol. 58, pp. 284–290, May 2012.
[18] D. D. Macdonald, ‘Passivity–the key to our metals-based civilization’, Pure and Applied Chemistry, vol. 71, no. 6, pp. 951–978, 1999.
[19] D. D. Macdonald, ‘The Passive State in Our Reactive Metals-Based Civilization’, Arabian Journal for Science and Engineering, vol. 37, no. 5, pp. 1143–1185, 2012.
[20] D. D. Macdonald, ‘The Point Defect Model for the Passive State’, Journal of The Electrochemical Society, vol. 139, no. 12, p. 3434, 1992.
[21] H. Alves and U. Heubner, Shreir’s Corrosion. Elsevier, 2010.
[22] P. Kofstad, High temperature corrosion. Elsevier, 1988.
[23] A. S. Khanna, Introduction to High Temperature Oxidation and Corrosion. ASM International, 2002.
[24] R. H. Jones, ASM Handbook, Volume 13A: Corrosion: Fundamentals, Testing, and Protection. Vol. 13. ASM International®, 2003.
[25] Denny A. Jones, Principles and Prevention of Corrosion, 2. ed. 1996.
[26] B. Neil, G. H. Meier, and F. S. Pettit, Introduction to the High Temperature Oxidation of Metals, 2nd Editio. Cambridge University Press.
[27] N. S. McIntyre, D. G. Zetaruk, and D. Owen, ‘XPS study of the initial growth of oxide films on Inconel 600 alloy’, Applications of Surface Science, vol. 2, no. 1, pp. 55–73, Nov. 1978.
[28] M. Lenglet, R. Guillamet, J. Lopitaux, and B. Hannoyer, ‘Caracterisation des premieres etapes de l’oxydation de l’alliage inconel 718 par spectrometrie I.R.F.T.’, Materials Research Bulletin, vol. 25, no. 6, pp. 715–722, Jun. 1990.
[29] L. Kumar, R. Venkataramani, M. Sundararaman, P. Mukhopadhyay, and
45
S. P. Garg, ‘Studies on the oxidation behavior of Inconel 625 between 873 and 1523 K’, Oxidation of Metals, vol. 45, no. 1, pp. 221–244, Feb. 1996.
[30] J. H. Chen, P. M. Rogers, and J. A. Little, ‘Oxidation behavior of several chromia-forming commercial nickel-base superalloys’, Oxidation of Metals, vol. 47, no. 5, pp. 381–410, Jun. 1997.
[31] O. Altin and S. Eser, ‘Pre-oxidation of Inconel Alloys for Inhibition of Carbon Deposition from Heated Jet Fuel’, Oxidation of Metals, vol. 65, no. 1, pp. 75–99, Feb. 2006.
[32] C. Sims, N. Stoloff, and W. Hagel, Superalloys II. John Wiley & Sons, Inc., 1987.
[33] P. Elliott and A. F. Hampton, ‘The influence of ternary additions of W, Mo, Ti, Ta, and Nb on the isothermal and cyclic oxidation of Ni-10Cr alloy’, Oxidation of Metals, vol. 14, no. 5, pp. 449–468, Oct. 1980.
[34] J. Chen, C. Obitz, F. Lindberg, J. Lejon, J. Hägg, M. Tanse-larsson, A. Johansson, S. N. Ab, S. K. Ab, O. K. G. Ab, and R. Ab, ‘On The Interation of Injected Zinc With Oxide Films Formed On Stainless Steel Under Cyclic Oxidising and Reducing Conditions’, in Nuclear Plant Chemistry ConferenceNPC2014-26th October 2014 - 31st October 2014, Sapporo, Japan, 2014.
[35] J. Kim, K. J. Choi, C. B. Bahn, and J. H. Kim, ‘In situ Raman spectroscopic analysis of surface oxide films on Ni-base alloy/low alloy steel dissimilar metal weld interfaces in high-temperature water’, Journal of Nuclear Materials, vol. 449, no. 1–3, pp. 181–187, 2014.
[36] S. E. Ziemniak and M. Hanson, ‘Corrosion behavior of NiCrMo Alloy 625 in high temperature, hydrogenated water’, Corrosion Science, vol. 45, no. 7, pp. 1595–1618, 2003.
[37] S. E. Ziemniak and M. Hanson, ‘Corrosion behavior of NiCrFe Alloy 600 in high temperature, hydrogenated water’, Corrosion Science, vol. 48, no. 7, pp. 498–521, 2006.
[38] Q. Zhang, R. Tang, C. Li, X. Luo, C. Long, and K. Yin, ‘Corrosion behavior of ni-base alloys in supercritical water’, Nuclear Engineering and Technology, vol. 41, no. 1, pp. 107–112, 2009.
[39] N. I. Y. Hemmi, Y. Uruma, ‘General Corrosion of Materials under Simulated BWR Primary Water Conditions’, Journal of Nuclear Science and Technology, vol. 455, no. November, pp. 443–455, 1994.
46
[40] Ahlberg and Rebensdorff, ‘General corrosion of alloy X-750 under BWR conditions’, in BNES Conf. Water Chem. Nucl. Reactor Syst, 6, Bournemouth, UK, 1992, pp. 278–285.
[41] J. Chen, F. Lindberg, L. Belova, B. Forssgren, K. Gott, J. Lejon, and A. Jasiulevicius, ‘High Resolution Electron Microscopy Study on Oxide Films Formed on Nickel-Base Alloys X-750 , 182 and 82 in Simulated High Flow Velocity Bwr Water’, in 15th International Conference on Environmental Degradation of Materials in Nuclear Power Systems-Water Reactors (eds J. T. Busby, G. Ilevbare and P. L. Andresen), John Wiley & Son1s, Inc., Hoboken, New Jersey, Canada., 2012.
[42] D. B. Williams and C. B. Carter, The Transmission electron microscope. Springer, 2009.
[43] ‘http://nau.edu/cefns/labs/electron-microprobe/glg-510-class-notes/instrumentation/’. .
[44] W. Zhou, R. P. Apkarian, and Z. L. Wang, ‘Fundamentals of Scanning Electron Microscopy’, Scanning Microscopy for Nanotechnology, pp. 1–40, 2007.
[45] A. World, ‘Manual for the SUPRA (VP) and ULTRA Scanning Electron Microscopes’, no. September, 2005.
[46] S. L. and M. J. Goldsteun J, Newbury D, Joy D, Lyman C, Echlin P, Lifshin E, Scanning Electron Microscopy and X-Ray Microanalysis, Third., vol. 40, no. 6. 2001.
[47] J. Ayache, L. Beaunier, J. Boumendil, G. Ehret, and D. Laub, Sample Preparation Handbook for Transmission Electron Microscopy. Springer, New York, NY, 2010.
[48] H. Lai, ‘High Temperature Oxidation and Corrosion of Ni-Based Superalloys for Industrial Gas Turbines’, Chalmers University of Technology, 2014.
[49] M. K. Miller and R. G. Forbes, Atom-Probe Tomography. Springer, Boston, MA, 2014.
[50] J. Law and R. Rennie, Eds., A Dictionary of Physics (6 ed). Oxford University Press, 2009.
[51] S. Tuzi, K. Göransson, S. M. H. Rahman, S. G. Eriksson, F. Liu, M. Thuvander, and K. Stiller, ‘Oxide evolution on Alloy X-750 in simulated BWR environment’, Journal of Nuclear Materials, vol. 482, 2016.
47
[52] G. S. Was, Fundamentals of Radiation Materials Science, 1st ed. Springer-Verlag Berlin Heidelberg, 2010.
[53] W. G. Burns and P. B. Moore, ‘Water radiolysis and its effect upon in-reactor zircaloy corrosion’, Radiation Effects, vol. 30, no. 4, pp. 233–242, 1976.
[54] C. Lia and D. R. Olander, ‘Steam radiolysis by alpha-particle irradiation’, Radiation Physics and Chemistry, vol. 54, no. 4, pp. 361–371, 1999.
[55] A. Strasser and P. Ford, ‘ZIRAT17 SPECIAL TOPIC REPORT- High Strength Nickel Alloys for Fuel Assemblies’, 2012.
[56] K. Göransson, L. Hallstadius, C. Gustafsson, H. Lai, S. Tuzi, M. Thuvander, K. Stiller, A. Kucuk, and B. Josefsson, ‘Corrosion behaviour of alloy X-750 in BWR fuel at high flow rates’, in Conference proceeding Top Fuel 2015, Zurich 13-17 September 2015.
[57] Y. Hemmi and N. Ichikawa, ‘Protective oxide film on alloy X750 formed in air at 973 K’, Journal of Nuclear Science and Technology, vol. 31, no. 6, pp. 552–561, 1994.
[58] P. L. Andresen, P. W. Emigh, M. M. Morra, and R. M. Horn, ‘Alloy X-750 Stress Corrosion Crack Growth Rate Behaviour In High Temperature Water’, in Proceedings of Eleventh International Conference on Environmental Degradation in Nuclear Power Systems–Water Reactors, Skamania Lodge, Eds. G. Was, L. Nelson, American Nuclear Society, pp. 787-804, August 5-9, 2003.
[59] P. L. Andresen, J. Flores-Preciado, M. M. Morra, and R. Carter, ‘Microstructure and SCC of Alloy X-750’, in Proceedings of Fifteenth International Symposium on Environmental Degradation in Nuclear Power Systems–Water Reactors, Colorado Springs, Eds. Busby J, Ilevbare G. and Andresen P. L. The Metallurgical Society, pp. 719-740, August 1-5, 2011.
[60] R. Bajaj, W. J. Mills, M. R. Lebo, B. Z. Hyatt, and M. G. Burke, ‘Irradiation Assisted Stress Corrosion Cracking of HTH Alloy X-750 and Alloy 625’, in 7th Symposium on the Environmental Degradation of Materials in Nuclear Power Systems – Water Reactors, Breckenridge, Colorado, NACE, August, 1995.
[61] D. Baty, G. Hayner, G. Clevinger, and G. Garner, ‘Metallurgical Factors Affecting the Failure of Alloy X-750 Holddown Springs’, in 1st Symposium on the Environmental Degradation of Materials in Nuclear Power Systems, Myrtle Beach, South Carolina, August, 1983.
48
[62] S. Floreen and J. L. Nelson, ‘The effects of heat treatment and composition on the stress corrosion cracking resistance of inconel alloy X-750’, Metallurgical Transactions A, vol. 14, no. 1, pp. 133–139, Jan. 1983.
[63] D. Ferreno, I. Gorrochategui, L. Sanchez, and F. Gutierrez-Solana, ‘Optimisation of heat treatment for improvement of IGSCC properties of an X-750 alloy’, Engineering Failure Analysis, vol. 11, no. 5, pp. 799–810, Oct. 2004.
[64] J. A. del Valle, A. C. Picasso, I. Alvarez, and R. Romero, ‘Age-hardening behavior of Inconel X-750 superalloy’, Scripta Materialia, vol. 41, no. 3, pp. 237–243, Jul. 1999.
[65] M. G. Burke, T. R. Mager, and I. L. W. Wilson, ‘The effect of cooling rate on precipitate morphology in Alloy X-750’. 1992.
[66] M. K. Miller and M. G. Burke, ‘An APFIM/AEM characterization of alloy X750’, Applied Surface Science, vol. 67, no. 1–4, pp. 292–298, Apr. 1993.
[67] T. Kekkonen and H. Hänninen, ‘The effect of heat treatment on the microstructure and corrosion resistance of inconel X-750 alloy’, Corrosion Science, vol. 25, no. 8–9, pp. 789–803, Jan. 1985.
[68] C. Gustafsson, J. Chen, H. Arwin, and B. Forssgren, ‘Corrosion Kinetics of Nickel-Base allys in simulated BWR conditions under high flow velocity’, in 16th International Conference on Environmental Degradation of Materials in Nuclear Power System, August 11-15, 2013, Asheville, NC, USA.
[69] J. Chen, C. Obitz, H. Arwin, and B. Forssgren, ‘Corrosion Kinetics of Nickel-base alloys with high chromium contents under simulated BWR normal water chemistry conditions and high flow velocity’, in 17th International Conference on Environmental Degradation of Materials in Nuclear Power Systems Water Reactors August 9-12, 2015, Ottawa, Ontario, Canada, 2015.
[70] Staff and ASMInternational, ASM Handbook: Properties and Selection: Nonferrous Alloys and Special-Purpose Materials. Vol. 2. 1991.
[71] Deer, Howie, and Zussman, Rock-Forming Minerals: Non-Silicates: Oxides, Hydroxides and Sulphides Volume 5 of Rock-forming minerals. Geological Society of London.
[72] CRC Handbook of Chemistry and Physics: 1974-1975, 55th ed. CRC Press, 1974.
49
[73] A. C. S. Sabioni, A. M. Huntz, F. Silva, and F. Jomard, ‘Diffusion of iron in Cr2O3: polycrystals and thin films’, Materials Science and Engineering: A, vol. 392, no. 1, pp. 254–261, 2005.
[74] J. Chen, B. Forssgren, J. Lejon, and K. Fritioff, ‘On the stability of oxides formed under BWR conditions: some observations on a stainless steel and nickel-base alloys’, Nuclear Plant Chemistry Conference, Paris, France. 2012.
[75] S. Cruchley, H. E. Evans, M. P. Taylor, M. C. Hardy, and S. Stekovic, ‘Chromia layer growth on a Ni-based superalloy: Sub-parabolic kinetics and the role of titanium’, Corrosion Science, vol. 75, pp. 58–66, 2013.
[76] A. N. Blacklocks, A. Atkinson, R. J. Packer, S. L. P. Savin, and A. V. Chadwick, ‘An XAS study of the defect structure of Ti-doped α-Cr2O3’, Solid State Ionics, vol. 177, no. 33, pp. 2939–2944, 2006.
[77] A. Holt and P. Kofstad, ‘Electrical conductivity of Cr2O3 doped with TiO2’, Solid State Ionics, vol. 117, no. 1, pp. 21–25, 1999.
[78] A. Atkinson, M. R. Levy, S. Roche, and R. A. Rudkin, ‘Defect properties of Ti-doped Cr2O3’, Solid State Ionics, vol. 177, no. 19, pp. 1767–1770, 2006.
[79] S. Tuzi, H. Lai, K. Göransson, M. Thuvander, and K. Stiller, ‘Corrosion of pre-oxidized nickel alloy X-750 in simulated BWR environment’, Journal of Nuclear Materials, vol. 486, pp. 350–360, 2017.


![Databaseforahighperformanceandstability demanding command ...publications.lib.chalmers.se/records/fulltext/127516.pdf · Chapter 1 Introduction TraditionallySaab[3]hasstoredapplicationdatainadistributeddatastructure](https://img.pdfslide.us/doc/110x75/5f283e290d51ca22422dad96/databaseforahighperformanceandstability-demanding-command-chapter-1-introduction.jpg)


![Thesis Report Final[1] - Chalmers Publication Library (CPL)publications.lib.chalmers.se/records/fulltext/156053.pdf · TableofContents’ Acknowledgements](https://img.pdfslide.us/doc/110x75/5a9dbda47f8b9a96438beebd/thesis-report-final1-chalmers-publication-library-cpl-acknowledgements.jpg)