Embed Size (px)
Citation preview

Electron impact excitation of Mg VIII: Collision strengths, transitionprobabilities and theoretical EUV and soft X-ray line intensities for MgVIIIGrieve, M. F. R., Ramsbottom, C. A., & Keenan, F. P. (2013). Electron impact excitation of Mg VIII: Collisionstrengths, transition probabilities and theoretical EUV and soft X-ray line intensities for Mg VIII. Astronomy andAstrophysics, 556, [A24]. https://doi.org/10.1051/0004-6361/201321594
Published in:Astronomy and Astrophysics
Document Version:Publisher's PDF, also known as Version of record
Queen's University Belfast - Research Portal:Link to publication record in Queen's University Belfast Research Portal
Publisher rightsReproduced with permission from Astronomy & Astrophysics, © ESO
General rightsCopyright for the publications made accessible via the Queen's University Belfast Research Portal is retained by the author(s) and / or othercopyright owners and it is a condition of accessing these publications that users recognise and abide by the legal requirements associatedwith these rights.
Take down policyThe Research Portal is Queen's institutional repository that provides access to Queen's research output. Every effort has been made toensure that content in the Research Portal does not infringe any person's rights, or applicable UK laws. If you discover content in theResearch Portal that you believe breaches copyright or violates any law, please contact [email protected].
Download date:23. Feb. 2022

A&A 556, A24 (2013)DOI: 10.1051/0004-6361/201321594c© ESO 2013
Astronomy&
Astrophysics
Electron impact excitation of Mg VIII
Collision strengths, transition probabilities and theoretical EUV and soft X-rayline intensities for Mg VIII?
M. F. R. Grieve1,2, C. A. Ramsbottom1, and F. P. Keenan2
1 Centre for Theoretical Atomic, Molecular and Optical Physics, School of Mathematics and Physics, Queen’s University Belfast,Belfast, BT7 1NN, UKe-mail: [email protected]
2 Astrophysics Research Centre, School of Mathematics and Physics, Queen’s University Belfast, Belfast, BT7 1NN, UK
Received 28 March 2013 / Accepted 14 June 2013
ABSTRACT
Context. Mg emission lines are observed in a range of astronomical objects such as the Sun, other cool stars and in the coronal lineregion of Seyfert galaxies. Under coronal conditions Mg emits strongly in the extreme ultraviolet (EUV) and soft X-ray spectralregions which makes it an ideal ion for plasma diagnostics.Aims. Two theoretical atomic models, consisting of 125 fine structure levels, are developed for the Mg ion. The 125 levels arisefrom the 2s22p, 2s2p2, 2p3, 2s23s, 2s23p, 2s23d, 2s2p3s, 2s2p3p, 2s2p3d, 2p23s, 2p23p and 2p23d configurations. Electron impactexcitation collision strengths and radiative transition probabilities are calculated for both Mg models, compared with existingdata, and the best model selected to generate a set of theoretical emission line intensities. The EUV lines, covering 312–790 Å, arecompared with existing solar spectra (SERTS–89 and SUMER), while the soft X-ray transitions (69–97 Å) are examined for potentialdensity diagnostic line ratios and also compared with the limited available solar and stellar observational data.Methods. The R-matrix codes Breit-Pauli RMATRXI and RMATRXII are utilised, along with the PSTGF code, to calculate the col-lision strengths for two Mg models. Collision strengths are averaged over a Maxwellian distribution to produce the correspondingeffective collision strengths for use in astrophysical applications. Transition probabilities are also calculated using the CIV3 atomicstructure code. The best data are then incorporated into the modelling code CLOUDY and line intensities generated for a range ofelectron temperatures and densities appropriate to solar and stellar coronal plasmas.Results. The present effective collision strengths are compared with two previous calculations. Good levels of agreement are foundwith the most recent, but there are large differences with the other for forbidden transitions. The resulting line intensities comparefavourably with the observed values from the SERTS-89 and SUMER spectra. Theoretical soft X-ray emission lines are presentedand several density diagnostic line ratios examined, which are in reasonable agreement with the limited observational data available.
Key words. atomic data – atomic processes – plasmas – scattering – Sun: UV radiation – Sun: X-rays, gamma rays
1. Introduction
Emission lines of Mg are observed from a wide variety ofastronomical objects ranging from the Sun to active galactic nu-clei (AGN). For example, the Solar Ultraviolet Measurementsof Emitted Radiation (SUMER) spectrograph on board Solarand Heliospheric Observatory (SOHO) detected emission linesof Mg lying within the extreme-ultraviolet (EUV) spectralregion (Curdt et al. 2001), while the 1989 and 1997 Solar EUVRocket Telescope and Spectrograph (SERTS) active region spec-tra contain several Mg features in the 300–450 Å region(Thomas & Neupert 1994; Brosius et al. 2000). Measurementsof solar Mg lines have also been obtained with the S-055 andS082A instruments on Skylab (Vernazza & Reeves 1978; Fosteret al. 1997a). As well as being an important solar density di-agnostic ion it can also be employed as a temperature indicatorwhen combined with another ionisation stage of Mg. For ex-ample, Mg 315 Å/Mg × 624 Å forms a useful temperature
? The effective collision strength data are only available at the CDSvia anonymous ftp to cdsarc.u-strasbg.fr (130.79.128.5) or viahttp://cdsarc.u-strasbg.fr/viz-bin/qcat?J/A+A/556/A24
sensitive line ratio (Landi et al. 2002). The Mg 3.02 µmfeature arising from the transition within the ground state(2s22p 2P1/2–2s22p 2P3/2) has been observed in the spectrum ofthe high excitation planetary nebula NGC 6302 (Reconditi &Oliva 1993), and in the coronal line region of AGN (Prieto &Viegas 2000).
Previously, Zhang et al. (1994) performed an R-matrix cal-culation for Mg which encompassed the lowest 15 fine-structure levels arising from the 2s22p, 2s2p2 and 2p3 config-urations. Transitions amongst the n = 2 complex give rise to thelines of Mg observed in the EUV region. However, Dwivedi(1990) has highlighted the potential of soft X-ray emission linessuch as 75.03 and 74.86 Å as density diagnostics, which havebeen detected in solar spectra (Malinovsky & Heroux 1973;Acton et al. 1985). Soft X-ray lines of Mg have also beenobserved by the Chandra satellite in absorption in the spectrumof the white dwarf H 1504+65 and in emission in Procyon plusα Cen A and B (Werner & Drake 2005). However, these linesarise from transitions between the n = 2 and 3 levels which werenot included in the calculation of Zhang et al. (1994). A sub-sequent distorted-wave calculation by Bhatia & Thomas (1998)incorporated the 20 fine-structure levels arising from the 2s22p,
Article published by EDP Sciences A24, page 1 of 9
A&A 556, A24 (2013)
2s2p2, 2p3, 2s23s, 2s23p and 2s23d configurations. These au-thors noted some discrepancies between their theoretical intensi-ties and the SERTS-89 measurements for the lines at 430.44 and436.73 Å, which they suggested may have been due to the lack ofresonances in the calculation. However, in a subsequent analysisof the SERTS–89 active region spectrum by Young et al. (1998),concerns were raised regarding the calibration of the 430–450 Åregion. Also, Brosius et al. (2000) studied the line intensitiesfrom the SERTS–97 spectrum for a range of ions, and in mostcases good agreement was found between theoretical and ob-served values. However, the authors noted that improvementsmay be required in the theory for Mg , which showed someslight discrepancies.
As soft X-ray emission lines have been observed from lev-els lying above those considered by Bhatia & Thomas (1998),it is essential to incorporate additional levels in the current cal-culation. In the present work the number of fine-structure lev-els has been extended to 125 to include all of the n = 3 levels.Collision strengths and transition probabilities have been calcu-lated for Mg using the R-matrix and CIV3 (Hibbert 1975)codes, respectively.
Following the completion of our calculations, the recentwork of Liang et al. (2012) was kindly brought to our at-tention by the referee. Liang et al. (2012) performed a seriesof intermediate-coupling frame transformation (ICFT) R-matrixcalculations for the B-like iso-electronic sequence, includingMg . The calculation incorporated the additional n = 3 andn = 4 complexes, giving rise to a total of 204 fine structurelevels.
In the present calculation, two different models were devel-oped for the collision strength calculation, both including all 125fine-structure levels arising from the 2s22p, 2s2p2, 2p3, 2s23s,2s23p, 2s23d, 2s2p3s, 2s2p3p, 2s2p3d, 2p23s, 2p23p and 2p23dconfigurations. The two different models were designed to en-able an examination of the effects of including varying amountsof CI in the target wavefunctions and to permit a comparisonbetween the Breit-Pauli and RMATRXII codes. The two mod-els are described in detail in Sect. 2, where the energy levelsand transition probabilities are presented. Section 2 also con-tains a detailed description of the collision calculation. In Sect. 3a selection of collision strengths and effective collision strengthsare presented for both models and compared with the results ofZhang et al. (1994) and Liang et al. (2012). Theoretical lineintensities are calculated using CLOUDY C13 (Ferland et al.2013) in Sect. 4 and compared with existing observational data.Also, several diagnostic line ratios are presented which involvesoft X-ray features. Section 5 is dedicated to several concludingremarks.
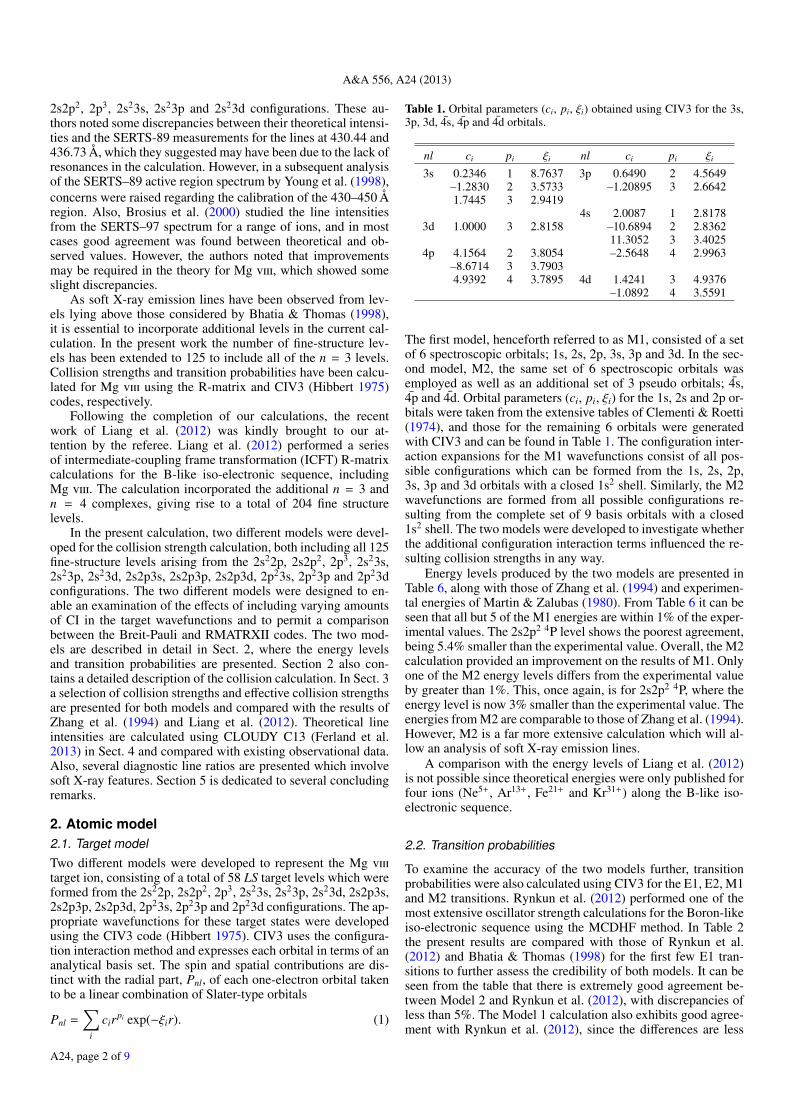
2. Atomic model2.1. Target modelTwo different models were developed to represent the Mg target ion, consisting of a total of 58 LS target levels which wereformed from the 2s22p, 2s2p2, 2p3, 2s23s, 2s23p, 2s23d, 2s2p3s,2s2p3p, 2s2p3d, 2p23s, 2p23p and 2p23d configurations. The ap-propriate wavefunctions for these target states were developedusing the CIV3 code (Hibbert 1975). CIV3 uses the configura-tion interaction method and expresses each orbital in terms of ananalytical basis set. The spin and spatial contributions are dis-tinct with the radial part, Pnl, of each one-electron orbital takento be a linear combination of Slater-type orbitals
Pnl =∑
i
cirpi exp(−ξir). (1)
Table 1. Orbital parameters (ci, pi, ξi) obtained using CIV3 for the 3s,3p, 3d, 4s, 4p and 4d orbitals.
nl ci pi ξi nl ci pi ξi
3s 0.2346 1 8.7637 3p 0.6490 2 4.5649–1.2830 2 3.5733 –1.20895 3 2.66421.7445 3 2.9419
4s 2.0087 1 2.81783d 1.0000 3 2.8158 –10.6894 2 2.8362
11.3052 3 3.40254p 4.1564 2 3.8054 –2.5648 4 2.9963
–8.6714 3 3.79034.9392 4 3.7895 4d 1.4241 3 4.9376
–1.0892 4 3.5591
The first model, henceforth referred to as M1, consisted of a setof 6 spectroscopic orbitals; 1s, 2s, 2p, 3s, 3p and 3d. In the sec-ond model, M2, the same set of 6 spectroscopic orbitals wasemployed as well as an additional set of 3 pseudo orbitals; 4s,4p and 4d. Orbital parameters (ci, pi, ξi) for the 1s, 2s and 2p or-bitals were taken from the extensive tables of Clementi & Roetti(1974), and those for the remaining 6 orbitals were generatedwith CIV3 and can be found in Table 1. The configuration inter-action expansions for the M1 wavefunctions consist of all pos-sible configurations which can be formed from the 1s, 2s, 2p,3s, 3p and 3d orbitals with a closed 1s2 shell. Similarly, the M2wavefunctions are formed from all possible configurations re-sulting from the complete set of 9 basis orbitals with a closed1s2 shell. The two models were developed to investigate whetherthe additional configuration interaction terms influenced the re-sulting collision strengths in any way.
Energy levels produced by the two models are presented inTable 6, along with those of Zhang et al. (1994) and experimen-tal energies of Martin & Zalubas (1980). From Table 6 it can beseen that all but 5 of the M1 energies are within 1% of the exper-imental values. The 2s2p2 4P level shows the poorest agreement,being 5.4% smaller than the experimental value. Overall, the M2calculation provided an improvement on the results of M1. Onlyone of the M2 energy levels differs from the experimental valueby greater than 1%. This, once again, is for 2s2p2 4P, where theenergy level is now 3% smaller than the experimental value. Theenergies from M2 are comparable to those of Zhang et al. (1994).However, M2 is a far more extensive calculation which will al-low an analysis of soft X-ray emission lines.
A comparison with the energy levels of Liang et al. (2012)is not possible since theoretical energies were only published forfour ions (Ne5+, Ar13+, Fe21+ and Kr31+) along the B-like iso-electronic sequence.
2.2. Transition probabilities
To examine the accuracy of the two models further, transitionprobabilities were also calculated using CIV3 for the E1, E2, M1and M2 transitions. Rynkun et al. (2012) performed one of themost extensive oscillator strength calculations for the Boron-likeiso-electronic sequence using the MCDHF method. In Table 2the present results are compared with those of Rynkun et al.(2012) and Bhatia & Thomas (1998) for the first few E1 tran-sitions to further assess the credibility of both models. It can beseen from the table that there is extremely good agreement be-tween Model 2 and Rynkun et al. (2012), with discrepancies ofless than 5%. The Model 1 calculation also exhibits good agree-ment with Rynkun et al. (2012), since the differences are less
A24, page 2 of 9

M. F. R. Grieve et al.: Electron impact excitation of Mg VIII
Table 2. Transition probabilities (in s−1) for E1 transitions in Mg from Model 1 and Model 2 calculations.
Lower level Upper level M1 M2 Rynkun et al. Bhatia and Thomas
2s22p 2Po1/2 2s2p2 2D3/2 1.57e+09 1.45e+09 1.42e+09 1.53e+09
2s2p2 2S1/2 3.44e+09 3.27e+09 3.20e+09 3.48e+092s2p2 2P1/2 9.30e+09 8.60e+09 8.24e+09 9.88e+092s2p2 2P3/2 2.50e+09 2.34e+09 2.25e+09 2.62e+092s23s 2S1/2 2.51e+10 2.52e+10 2.63e+10 1.94e+102s23s 2D3/2 3.59e+11 3.66e+11 3.61e+11 3.70e+11
2s22p 2Po3/2 2s2p2 2D5/2 1.76e+09 1.61e+09 1.58e+09 1.72e+09
2s2p2 2D3/2 2.60e+08 2.38e+08 2.32e+08 2.55e+08
than 15%. Finally, we note that the results of Bhatia & Thomasare within 20% of those of Rynkun et al. (2012).
2.3. Collision calculation
The electron impact excitation collision strengths for both mod-els were calculated using the R-matrix codes. In both calcula-tions, the R-matrix boundary radius was taken to be 5 au andthe number of continuum orbitals per value of total angular mo-mentum was set at 15. For M1 the internal region informationwas calculated in intermediate jK coupling by employing theRMATRXI Breit-Pauli suite of codes. Where available, the the-oretical energies were shifted to the appropriate experimentalvalues. Calculations were performed for all partial waves with2J ≤ 36. The code PSTGF (Balance & Griffin 2004) was utilisedto perform the external region calculations and to determinethe final set of collision strengths. When running PSTGF theCoulomb-Bethe approximation was also included, which takesinto account the contribution of partial waves with 2J > 36.
M2 was developed to examine if having a larger CI expan-sion, and thus slightly better energies, provided a substantial im-provement over M1. Internal region information for M2 was ob-tained in LS coupling, through use of the RMATRXII (Burkeet al. 1994) suite of codes (ANG, RAD and HAM). The codeFINE (Burke, priv. comm.) was then adopted to transform theinternal region information from LS to intermediate coupling.To take account of term splitting in the target, FINE transformsthe R-matrix in pair coupling by employing term coupling co-efficients (TCCs). The TCCs are the mixing coefficients for theindividual LiS iπi states and govern the formation of the appro-priate Jiπi states. Results were obtained for all partial waves with2J ≤ 16. The external region code PSTGF was once again em-ployed to obtain the final set of collision strengths.
In both calculations the same fine mesh of energy points wasadopted throughout the resonance region up to 16.9 Ryd. A con-stant mesh spacing of 2×10⁻⁴ Ryd was utilised in the resonanceregion, similar to the 2.45 × 10⁻⁴ Ryd mesh employed by Lianget al. (2012). A total of 250 points were used in the coarse meshregion from 16.9–50 Ryd.
The collision strength, Ωi j, is related to the cross-section,σi j,through the relation
Ωi j =(2Ji + 1)k2
i
πσ ji· (2)
Collision strengths were averaged over a Maxwellian distribu-tion of electron energies to yield the corresponding effective col-lision strengths for a range of electron temperatures (Te). Theeffective collision strength Υi j is defined as
Υi j(Te) =
∫ ∞0
Ωi j(E j) exp(−E j/kTe)d(E j/kTe) (3)
4 5 6 7Log Electron Temperature (K)
0
0.5
1
1.5
2
2.5
Eff
ecti
ve
Co
llis
ion
Str
eng
th
M1M2Zhang (1994)
Liang (2012)
Fig. 1. Effective collision strength as a function of logarithmic electrontemperature (Te in K) for the 2s22p 2P1/2–2s22p 2P3/2 transition. A solidblack line is used for M1, a red line with triangles for M2, a green linewith circles for Zhang et al. (1994) and a blue line with squares forLiang et al. (2012).
where k is Boltzmann’s constant and E j is the final energy of theelectron after scattering. The temperature of maximum fractionalabundance for Mg in ionisation equilibrium is Te = 105.9 K(Falconer et al. 1997). A total of 30 temperature points wereemployed to cover the range from Te = 104–107 K. The effectivecollision strengths will be presented and discussed in the nextsection.
3. Results
In this section a variety of effective collision strengths are pre-sented for low-lying transitions. Only transitions amongst thelowest 15 fine-structure levels will be examined as these are themost important and give rise to the large number of observedcoronal spectral lines. The forbidden transitions will be pre-sented first, followed by an examination of the dipole-allowedtransitions.
First, it is convenient to examine the important transitionbetween the fine-structure levels of the ground state doublet.Figure 1 presents the effective collision strength as a function ofelectron temperature for this forbidden 2s22p 2P1/2–2s22p 2P3/2transition. A comparison of the effective collision strengths fromM1 and M2 indicates that the additional CI terms included in M2play a negligible role for this particular transition. From Fig. 1 itcan also be seen that the present results compare favourably withthose of Zhang et al. (1994). However, the results of Liang et al.(2012) display significant differences with the present work inthe low temperature region.
A24, page 3 of 9

A&A 556, A24 (2013)
0 0.2 0.4 0.6 0.8 1 1.2 1.4Incident Electron Energy (Ryd)
0
4
8
12
Co
llis
ion
Str
eng
th
Liang (2012)
M2M1
Fig. 2. Collision strength as a function of incident electron energy forthe 2s22p 2P1/2–2s22p 2P3/2 transition. A black line is used for M1, ared line for M2 and green curve for Liang et al. (2012).
In an attempt to investigate these differences further, the cor-responding collision strengths for the 2s22p 2P1/2–2s22p 2P3/2transition are presented in Fig. 2 for near-threshold energies,where the source of the discrepancy in the effective collisionstrength profiles can be readily identified. The results of Lianget al. (2012) show several large resonant features at energiesjust above threshold (0.03–0.1 Ryd), which are absent in M1,M2 and the work of Zhang et al. (1994). The threshold energyfor this transition amongst the fine structure split levels of theground state has been shifted to the experimental value in boththe present work and the work of Liang et al. (2012) so the differ-ences do not arise from differing thresholds. As mentioned pre-viously, a similar mesh increment was adopted in the present cal-culations and the work of Liang et al. (2012), thus there shouldbe no issues with unresolved resonances. The only main differ-ence between the calculations is the inclusion of the n = 4 levels.However, it seems unlikely that these levels would affect suchlow-energy resonances for only a single transition. The sourceof the discrepancy remains unclear, although we stress that at thehigher temperatures of astrophysical importance there is excel-lent agreement between the effective collision strength profiles.After a thorough analysis, this was found to be the only transi-tion where noticeable differences were evident in the effectivecollision strengths produced by the present work and those ofLiang et al. (2012).
In general, for the remaining transitions amongst the5 lowest-lying levels, the M1, M2, Zhang et al. (1994) andLiang et al. (2012) calculations show a good level of agree-ment. An examination of transitions to levels higher than2s2p2 4P5/2 (i.e. level 5) indicate large differences between thepresent results and those of Zhang et al. (1994). An exampleis 2s2p2 4P1/2−2s2p2 2P1/2, presented in Fig. 3, where it canbe seen that the M1, M2 and Liang et al. (2012) calculationsare in excellent agreement, but there are major differences withZhang et al. At the temperature of maximum fractional abun-dance (Te = 105.9 K) the effective collision strength of Zhanget al. (1994) is 57% lower than the present results. These dif-ferences are due to the inclusion of more target states in boththe current and Liang et al. (2012) calculations. The Rydbergresonances which converge on the higher target levels, such as2s23s, 2s23p and 2s23d, give rise to the apparent peak in thepresent effective collision strengths at 105.9 K. Corresponding
4 5 6 7Log Electron Temperature (K)
0
0.005
0.01
0.015
0.02
0.025
0.03
Eff
ecti
ve
Coll
isio
n S
tren
gth
M1M2Zhang (1994)
Liang (2012)
Fig. 3. Effective collision strength as a function of logarithmic elec-tron temperature (Te in K) for the forbidden 2s2p2 4P1/2–2s2p2 2P1/2transition.
4 6 8 10 12Incident Electron Energy (Ryd)
0
0.2
0.4
0.6
0.8C
oll
isio
n S
tren
gth
Liang (2012)
M2M1
Fig. 4. Collision strength as a function of incident electron energy forthe 2s2p2 4P1/2–2s2p2 2P1/2 transition.
collision strengths for the 2s2p2 4P1/2−2s2p2 2P1/2 transition arepresented in Fig. 4. For this transition, the location and size ofthe resonances are identical between M1, M2 and Liang et al.(2012). This highlights the high levels of consistency achievedby employing the various R-matrix codes and transformationmethods. The good levels of agreement obtained in the com-parison also help to verify the accuracy of employing an iso-electronic approach for the B-like sequence.
The peak in the effective collision strengths, due to the addi-tional resonances at higher incident electron energies, is a com-mon difference between the present results and those of Zhanget al. (1994). In Fig. 5 we plot results for the forbidden 2s22p2P1/2–2p3 2P3/2 transition, where it is clear that M1 and M2show a substantial peak at the temperature of maximum frac-tional abundance, which is absent from the data of Zhang et al.At this temperature, the M1 calculation is 98% larger than Zhanget al., while M2 is 62% larger. The corresponding results ofLiang et al. (2012) are in perfect agreement with M1 but resideslightly higher than the M2 effective collision strengths.
A final example of a forbidden transition is 2s2p2 4P5/2–2p3
2P1/2, presented in Fig. 6. Again, the M1 and M2 calculationsexhibit a large peak in the effective collision strengths. At thetemperature of maximum fractional abundance M1 and M2 are
A24, page 4 of 9

M. F. R. Grieve et al.: Electron impact excitation of Mg VIII
4 5 6 7Log Electron Temperature (K)
0.005
0.01
0.015
0.02
Eff
ecti
ve
Coll
isio
n S
tren
gth
M1M2Zhang (1994)
Liang (2012)
Fig. 5. Effective collision strength as a function of logarithimic electrontemperature (Te in K) for the 2s22p 2P1/2–2p3 2P3/2 transition.
4 5 6 7Log Electron Temperature (K)
0
0.005
0.01
0.015
0.02
Eff
ecti
ve
Coll
isio
n S
tren
gth
M1M2Zhang (1994)
Liang (2012)
Fig. 6. Effective collision strength as a function of logarithmic electrontemperature (Te in K) for the 2s2p2 4P5/2–2p3 2P1/2 transition.
240% and 180% larger, respectively, than the value predictedby Zhang et al. (1994). The effective collision strengths of Lianget al. (2012) agree well with M1 and lie slightly above the valuespredicted by M2.
An examination of the forbidden transitions highlightedsome significant differences between the present results andthose of Zhang et al. (1994). However, excellent agreement wasgenerally found between the present results and Liang et al.(2012). Hence it is now prudent to examine the dipole-allowedtransitions. As a first example we consider 2s22p 2P1/2–2s2p2
2D3/2, presented in Fig. 7. As expected, in the vicinity of the tem-perature of maximum fractional abundance the present resultsare higher than those of Zhang et al. (1994). Another example,also shown in Fig. 7, is the 2s22p 2P1/2–2s2p2 2S1/2 transition,for which there is relatively good agreement between all threesets of results, with differences of less than 30%. The remainingdipole-allowed transitions exhibit similar levels of agreementwith the results of Zhang et al. For these, the resonant featuresplay a slightly less important role and it is the high backgroundlevel of the collision strengths which becomes the dominantfactor in determining the resulting effective collision strengths.Once again, exceptionally high levels of agreement are found
4 5 6 7Log Electron Temperature (K)
0
0.5
1
1.5
Eff
ecti
ve
Co
llis
ion
Str
eng
th
M1Zhang (1994)
Liang (2012)
Fig. 7. Upper plot: effective collision strength as a function of logarith-mic electron temperature (Te in K) for the 2s22p 2P1/2–2s2p2 2D3/2 tran-sition, lower plot: same for 2s22p 2P1/2–2s2p2 2S1/2. The solid black linerepresents the results of M1, the green line with circles is the effectivecollision strengths of Zhang et al. (1994) and the blue line with squaresillustrates the results of Liang et al. (2012).
between the present results and those of Liang et al. (2012). Ingeneral, the differences between the aforementioned two sets ofresults are less than 5% for the dipole-allowed transitions.
Typically, the differences between the M1 and M2 calcula-tions are found to be relatively small. Due to the good agreementbetween the two models it is hence believed that the additionalCI terms included in M2 play a minor role in the determinationof the collision strengths. A disadvantage of M2 is the presenceof pseudo-resonances for transitions amongst higher levels, al-though transitions amongst the lowest 20 levels are unaffected.Thus, on balance, it is believed that the M1 calculations providethe most reliable set of effective collision strengths for use inastrophysical modelling. The effective collision strengths for all7750 forbidden and allowed lines are presented in Table 7.
4. Emission line intensities
Strong Mg emission occurs predominantly in the EUV andsoft X-ray regions of the solar spectrum, with the former hostto some of the most prominent lines. For example, many emis-sion features have been detected and extensively studied in the311–437 Å region by the SERTS rocket spectrograph (Thomas& Neupert 1994), while the S082A and S–055 instruments onSkylab found several Mg transitions spanning 315−783 Å ina number of solar features including a sunspot, active region andflares (Foster et al. 1997a). Also, SUMER spectra have high-lighted the existence of Mg lines lying in the 762−790 Åwavelength region (Landi et al. 2002). However, less well-studied is the soft X-ray region (∼50–100 Å) for which fewersolar observations exist. Some Mg lines have been detected(e.g. Acton et al. 1985), and the present theoretical results indi-cate that more may be present in this region. Hence our emphasisis on the soft X-ray region and forms the basis of this section.
The present line intensities were calculated using CLOUDYC13 (Ferland et al. 2013). Effective collision strengths weretaken from the M1 calculation and transition probabilities fromRynkun et al. (2012) where available. For all other transitionprobabilities, the M2 calculations were adopted. Excitation by
A24, page 5 of 9

A&A 556, A24 (2013)
Table 3. Relative intensities of Mg lines detected in the SERTS–89 active region spectrum.
Transition Wavelength (Å) SERTS–89 Present theory B&T
2s22p 2Po1/2–2s2p2 2P3/2 311.80 ...a 0.20 0.20
2s22p 2Po1/2–2s2p2 2P1/2 313.75 0.32 0.36 0.38
2s22p 2Po3/2–2s2p2 2P3/2 315.04 1.00 1.00 1.00
2s22p 2Po3/2–2s2p2 2P1/2 317.04 0.23 0.23 0.22
2s22p 2Po1/2–2s2p2 2S1/2 335.25 ...b 0.19 0.18
2s22p 2Po3/2–2s2p2 2S1/2 339.01 0.21 0.22 0.26
2s22p 2Po1/2–2s2p2 2D3/2 430.47 0.16 0.38 0.33
2s22p 2Po3/2–2s2p2 2D5/2 436.74 0.27 0.65 0.57
Notes. All intensities are listed relative to I(315.04 Å). B&T indicates the theoretical results of Bhatia & Thomas (1998). (a) Blend with Ni .(b) Masked by Fe .
Table 4. Relative intensities of Mg lines in a SUMER spectrum of the quiet Sun.
Transition Wavelength (Å) SUMER Present theory CHIANTI
2s22p 2Po1/2–2s2p2 4P3/2 762.66 0.07 0.07 0.08
2s22p 2Po1/2–2s2p2 4P1/2 769.38 0.23 0.19 0.18
2s22p 2Po3/2–2s2p2 4P5/2 772.28 1.00 1.00 1.00
2s22p 2Po3/2–2s2p2 4P3/2 782.36 0.53 0.56 0.59
2s22p 2Po3/2–2s2p2 4P1/2 789.43 0.15 0.15 0.14
Notes. Intensities listed relative to I(772.28 Å).
proton impact, which is important for fine-structure transitionswithin the 2s22p 2P and 2s2p2 4P multiplets, were taken fromFoster et al. (1997b). Unless otherwise specified, an electrondensity of Ne = 109.8 cm−3 and an electron temperature ofTe = 105.9 K were adopted in the subsequent line intensitycalculations.
4.1. The EUV region
The strong EUV lines observed by SERTS are due to E1 tran-sitions amongst the lowest 10 fine-structure levels. As a checkon the accuracy of the present collision strength and transitionprobability data, the observational and theoretical line intensi-ties are compared in Table 3. Only four of the lines in Table 3have reliable observed intensities. For these, the present theoret-ical results are all within 12% of the observed values. Also listedin Table 3 are the results predicted by Bhatia & Thomas (1998),which are all within 24% of the observed values.
Young et al. (1998) raised concerns over the calibration ofthe 430–450 Å region of the SERTS–89 spectrum. It had beenproposed that the observed intensities could be too small by afactor of approximately two. This is supported by the presentresults, which indicate that the SERTS–89 intensities need to beincreased by a factor of around 2.1 in this region.
In Table 4 the present theoretical line intensities are alsocompared with SUMER measurements of an off-disk region ofthe quiet Sun (Landi et al. 2002), as well as the predictions fromCHIANTI v7.0 (Dere et al. 1997; Landi et al. 2012). The presentresults are all within 17% of the SUMER measurements and pro-vide a slight improvement compared to the CHIANTI values.
Due to the extremely high levels of agreement between thepresent set of effective collision strengths and those of Lianget al. (2012) it is not expected that there should be any differ-ence between the resultant line intensities. However, as a check,the effective collision strengths of Liang et al. (2012) were also
included in CLOUDY, and the line intensities calculated for theEUV region. As expected, these were found to be within 2% ofthe present results.
4.2. The soft X-ray region
Dwivedi (1990) has highlighted the possible potential of softX-ray emission lines from ions such as Mg as a diagnos-tic of the electron density in solar plasmas. In Table 5 someof the strongest soft X-ray lines are listed for a plasma withTe = 105.9 K and Ne = 108–1010 cm−3. Only lines which have anintensity relative to I(75.03 Å) of ≥0.05 are listed in the table. Inparticular, the I(75.03 + 75.04 Å)/I(74.86 Å) intensity ratio pro-vides an excellent density diagnostic, as noted by Brown et al.(1986) and illustrated in Fig. 8. The ratio shows little sensitiv-ity to Te but varies by a factor of 4 over the density intervalNe = 106–109 cm−3. Also shown in Fig. 8 is the measured lineratio of 1.9 for an M-class flare (Acton et al. 1985). This is closeto the high density limit, in agreement with other density diag-nostics for this flare which indicate Ne > 1010 cm−3 (Brown et al.1986).
Another potentially useful density diagnostic is I(86.84 Å)/I(87.02 Å), shown in Fig. 9. Raassen et al. (2002) found an ex-perimental value for this ratio of 1.2 from the Chandra spec-trum of Procyon. From Fig. 9 this indicates Ne ' 108 cm−3, farlower than the characteristic coronal density of Procyon whichis ∼3 × 109 cm−3 (Schmitt et al. 1996). However, Raassen et al.note that the 87.02 Å feature of Mg is blended with anFe transition, which a theoretical spectrum generated fromCHIANTI indicates should contribute ∼20% to the total mea-sured line intensity. Correcting for this, we determine a re-vised I(86.84 Å)/I(87.02 Å) ratio of ∼1.5 which implies Ne '
109 cm−3, in better agreement with the density derived fromother diagnostics by Schmitt et al. (1996).
A24, page 6 of 9

M. F. R. Grieve et al.: Electron impact excitation of Mg VIII
Table 5. Theoretical soft X-ray emission lines of Mg .
Electron density (cm−3)Transition Wavelength (Å) 108 109 1010
2s22p 2P1/2–2s2p3p 2D3/2 69.42a 0.08 0.06 0.052s22p 2P3/2–2s2p3p 2D5/2 69.47a 0.10 0.10 0.102s22p 2P1/2–2s23d 2D3/2 74.86a,b 0.79 0.57 0.552s22p 2P3/2–2s23d 2D5/2 75.03a,b 1.00 1.00 1.002s22p 2P3/2–2s23d 2D3/2 75.04a,b 0.16 0.12 0.112s2p2 2D5/2–2s2p3d 2F7/2 78.45 0.13 0.13 0.132s2p2 2D3/2–2s2p3d 2F5/2 78.57 0.13 0.10 0.092s2p2 2D5/2–2s2p3d 2D5/2 80.23a 0.06 0.05 0.052s2p2 2D3/2–2s2p3d 2D3/2 80.25a 0.05 0.04 0.042s2p2 4P5/2–2s2p3s 4P5/2 81.84a 0.05 0.05 0.052s22p 2P3/2–2s23s 2S1/2 82.82a 0.24 0.21 0.202s2p2 2D5/2–2s2p3s 2P3/2 86.84a 0.24 0.25 0.252s2p2 2D3/2–2s2p3s 2P1/2 87.02a 0.23 0.15 0.142s2p2 2S1/2–2s2p3s 2P3/2 92.13a 0.08 0.08 0.082s2p2 2S1/2–2s2p3s 2P1/2 92.32a 0.07 0.05 0.052s2p2 2D5/2–2s23p 2P3/2 96.79 0.29 0.27 0.272s2p2 2D3/2–2s23p 2P1/2 96.87 0.21 0.15 0.15
Notes. Intensities listed relative to I(75.03 Å). (a) Lines identified in the Chandra spectra of Procyon and α Cen A+B by Raassen et al. (2002) andWerner & Drake (2005). (b) Lines identified in solar spectra by Behring et al. (1972), Malinovsky & Heroux (1973) and Acton et al. (1985).
6 7 8 9 10 11
Log Electron Density (cm-3
)
0
0.5
1
1.5
2
Inte
nsi
ty R
atio
I(7
5.0
3+
75.0
4)/
I(74.8
6)
log(T)=5.7
log(T)=5.9
log(T)=6.1
Fig. 8. The I(75.03 + 75.04 Å)/I(74.86 Å) line intensity ratio plotted asa function of logarithmic electron density (Ne in cm−3) at logarithmicelectron temperatures (Te in K) of log Te = 5.7, 5.9 and 6.1. The blackdashed line represents the observed value, from the solar flare spectrumof Acton et al. (1985).
5. Conclusions
Collision strengths have been produced using two models (M1and M2) for all 7750 transitions amongst 125 fine-structure lev-els of Mg . These were averaged over a Maxwellian distribu-tion of electron velocities to produce the corresponding effectivecollision strengths. A comparison of the two models indicatedthat, in general, the differences were relatively small. The addi-tional CI terms in M2 did not influence the effective collisionstrengths in any significant manner. As pseudo-resonances werepresent in some of the higher-lying transitions in M2, it wasassessed that the M1 calculation was overall the best. A com-parison of the present results with Zhang et al. (1994) for thedipole-allowed transitions indicated generally good agreementbetween the two calculations. However, a comparison of forbid-den transitions highlighted large differences of up to 240%. The
6 7 8 9 10 11
Log Electron Density (cm-3
)
0
0.5
1
1.5
2
Inte
nsi
ty R
atio
I(8
6.8
4)/
I(87.0
2)
log(T)=5.7
log(T)=5.9
log(T)=6.1
Fig. 9. The I(86.84 Å)/I(87.02 Å) line intensity ratio plotted as a func-tion of logarithmic electron density (Ne in cm−3) at logarithmic electrontemperatures (Te in K) of log Te = 5.7, 5.9 and 6.1. The experimentalratio of 1.2 from the Chandra spectrum of Procyon (Raassen et al. 2002)is plotted as a dashed line, while the ratio corrected for the presence ofan Fe blend in the 87.02 Å feature (1.5) is shown as a dashed-dot line.
present results for both dipole-allowed and forbidden transitionscompared very favourably with Liang et al. (2012). Typically,any differences were less than 15% for the forbidden transitionsand 5% for the dipole-allowed transitions. The present transitionprobabilities were also compared with the extensive calculationof Rynkun et al. (2012), and very good agreement was found.
Effective collision strengths from M1 were chosen for thecalculation of relative Mg emission line strengths, and in-corporated into the CLOUDY C13 code along with the tran-sition probabilities of Rynkun et al. (2012) and heavy particleexcitation rates of Foster et al. (1997b). Good agreement wasfound between the theoretical EUV line intensities and SUMERand SERTS–89 solar measurements, with differences of lessthan 17%. Intensities for the strongest soft X-ray lines were
A24, page 7 of 9

A&A 556, A24 (2013)
Table 6. Energies for Mg in Rydberg.
Energy (Ryd)Index Level M1 M2 Zhang NIST
1 2s22p 2Po 0.000000 0.000000 0.0000 0.0000002 2s2p2 4P 1.115628 1.142647 1.1332 1.1798963 2s2p2 2D 2.116177 2.088916 2.0842 2.0966954 2s2p2 2S 2.729664 2.700065 2.7000 2.6980835 2s2p2 2P 2.956146 2.901252 2.8980 2.8965006 2p3 4So 3.694618 3.699407 3.7196 3.7490297 2p3 2Do 4.250072 4.190653 4.2188 4.2243848 2p3 2Po 4.817040 4.737380 4.8018 4.7620659 2s23s 2S 10.988803 11.003538 11.01255110 2s23p 2Po 11.583939 11.589529 ...11 2s23d 2D 12.152557 12.160003 12.15411212 2s2p(3Po)3s 4Po 12.258183 12.271338 12.31256313 2s2p(3Po)3s 2Po 12.586227 12.548836 12.58266214 2s2p(3Po)3p 2P 12.775854 12.777588 12.82019915 2s2p(3Po)3p 4D 12.799153 12.807828 ...16 2s2p(3Po)3p 4S 12.901712 12.911760 ...17 2s2p(3Po)3p 4P 13.008420 13.001050 ...18 2s2p(3Po)3p 2D 13.107198 13.083678 13.11987219 2s2p(3Po)3p 2S 13.277355 13.269543 13.29272120 2s2p(3Po)3d 4Fo 13.305640 13.278854 ...21 2s2p(3Po)3d 4Do 13.393866 13.399818 ...22 2s2p(3Po)3d 2Do 13.429284 13.421935 13.45346923 2s2p(3Po)3d 4Po 13.450713 13.458822 13.50437824 2s2p(1Po)3s 2Po 13.564147 13.516579 13.53019725 2s2p(3Po)3d 2Fo 13.718738 13.701696 13.70508226 2s2p(3Po)3d 2Po 13.781146 13.761264 13.77183527 2s2p(1Po)3p 2D 14.144670 14.075030 ...28 2s2p(1Po)3p 2P 14.126744 14.081067 14.10794029 2s2p(1Po)3p 2S 14.308789 14.192665 14.16462130 2p2(3P)3s 4P 14.425500 14.431927 14.46902931 2s2p(1Po)3d 2Fo 14.627765 14.576266 ...32 2s2p(1Po)3d 2Do 14.700057 14.638901 14.63370433 2p2(3P)3s 2P 14.797849 14.722698 ...34 2s2p(1Po)3d 2Po 14.816229 14.746386 14.65743435 2p2(3P)3p 2So 14.780638 14.800982 ...36 2p2(1D)3s 2D 14.939192 14.869868 14.91368237 2p2(3P)3p 4Do 14.892266 14.904757 ...38 2p2(3P)3p 4Po 14.962567 14.968283 ...39 2p2(3P)3p 2Do 15.053948 15.037941 ...40 2p2(3P)3p 2Po 15.195771 15.164029 ...41 2p2(3P)3p 4So 15.187612 15.173337 15.23472142 2p2(3P)3d 4F 15.325725 15.338733 ...43 2p2(1D)3p 2Fo 15.412214 15.350060 15.38765744 2p2(3P)3d 2P 15.427853 15.437632 ...45 2p2(3P)3d 4D 15.429702 15.444252 ...46 2p2(3P)3d 2F 15.502982 15.489904 ...47 2p2(1D)3p 2Do 15.589047 15.506446 ...48 2p2(3P)3d 4P 15.551404 15.563471 15.62071849 2p2(1D)3p 2Po 15.766171 15.641187 ...50 2p2(1S)3s 2S 15.750225 15.699285 ...51 2p2(1D)3d 2G 15.838061 15.805571 ...52 2p2(3P)3d 2D 15.829487 15.811435 ...53 2p2(1D)3d 2D 15.964227 15.929796 ...54 2p2(1D)3d 2F 15.997738 15.945299 ...55 2p2(1D)3d 2P 16.136734 16.066789 15.96725856 2p2(1D)3d 2S 16.212790 16.150337 ...57 2p2(1S)3p 2Po 16.350427 16.270496 ...58 2p2(1S)3d 2D 16.804099 16.748031 ...
Notes. Also listed are the theoretical results of Zhang et al. (1994) and the experimental energies (Martin & Zalubas 1980) from the NIST database.
A24, page 8 of 9

M. F. R. Grieve et al.: Electron impact excitation of Mg VIII
also calculated and several density sensitive line ratios presented,which compared favourably with the limited observational dataavailable. However, it is hoped that the present work will encour-age further examination of the Mg lines in soft X-ray solarand stellar spectra.
Acknowledgements. The authors acknowledge the years of work and dedicationof V. M. Burke and C. J. Noble of Daresbury Laboratory (UK) in developingthe RMATRXII suite of codes used in the internal region calculation. The au-thors also wish to acknowledge G. J. Ferland and M. Lykins of the Universityof Kentucky (USA) for extending CLOUDY to facilitate direct inclusion of ouratomic data. The authors would like to thank the referee for bringing the work ofLiang et al. (2012) directly to our attention. Our thanks is also extended to G. Y.Liang for the provision of collision strengths for comparative purposes. The workpresented in this paper is supported by STFC and the Leverhulme Trust. M. F.R. Grieve is funded by a DEL studentship. CHIANTI is a collaborative projectinvolving George Mason University, the University of Michigan (USA) and theUniversity of Cambridge (UK).
ReferencesActon, L. W., Bruner, M. E., Brown, W. A., et al. 1985, ApJ, 291, 865Ballance, C. P., & Griffin, D. C. 2004, J. Phys. B, 37, 2943Behring, W. E., Cohen, L., & Feldman, U. 1972, ApJ, 175, 493Bhatia, A. K., & Thomas, R. J. 1998, ApJ, 497, 483Brosius, J. W., Thomas, R. J., & Davila, J. M. 2000, ApJ, 543, 1016Brown, W. A., Bruner, M. E., Acton, L. W., & Mason, H. E. 1986, ApJ, 301, 981Burke, P. G., Burke, V. M., & Dunseath, K. M. 1994, J. Phys. B At. Mol. Opt.
Phys., 27, 5341Clementi, E., & Roetti, C. 1974, At. Data Nucl. Data Tables, 14, 3Curdt, W., Landi, E., & Feldman, U. 2004, A&A, 427, 1045
Dere, K. P., Landi, E., Mason, H. E., Monsignori Fossi, B. C., & Young, P. R.1997, A&AS, 125, 149
Dwivedi, B. N. 1990, High Resolution X-ray Spectroscopy of Cosmic Plasmas,IAU Colloq., 115, 40
Dwivedi, B. N., & Mohan, A. 1995, Sol. Phys., 156, 81Falconer, D. A., Davila, J. M., & Thomas, R. J. 1997, ApJ, 482, 1050Ferland, G. J., Porter, R. L., van Hoof, P. A. M., et al. 2013, Rev. Mex. Astron.
Astrophys., 49, 137Foster, V. J., Keenan, F. P., Reid, R. H. G., et al. 1997a, Sol. Phys., 170, 217Foster, V. J., Keenan, F. P., & Reid, R. H. G. 1997b, ADNDT, 67, 99Hibbert, A. 1975, Comput. Phys. Commun., 9, 141Landi, E., Feldman, U., & Dere, K. P. 2002, ApJ Suppl., 139, 281Landi, E., Del Zanna, G., Young, P. R., Dere, K. P., & Mason, H. E. 2012, ApJ,
744, 99Liang, G. Y., Badnell, N. R., & Zhao, G. 2012, A&A, 547, A87Malinovsky, L., & Heroux, M. 1973, ApJ, 181, 1009Martin, W. C., & Zalubas, R. 1980, J. Phys. Chem. Ref. Data, 9, 1Prieto, M. A., & Viegas, M. 2000, ApJ, 532, 238Raassen, A. J. J., Mewe, R., Audard, M., et al. 2002, A&A, 389, 228Ralchenko, Y., Jou, F.-C., Kelleher, D. E., et al. 2011, NIST Atomic Spectra
Database, version 4.1.0., National Institute of Standards and Technology,Gaithersburg, MD, http://physics.nist.gov/asd
Reconditi, M., & Oliva, E. 1993, A&A, 274, 662Rynkun, P., Jonsson, P., Gaigalas, G., & Froese Fischer, C. 2012, At. Data Nucl.
Data Tables, 98, 481Schmitt, J. H. M. M., Drake, J. J., Haisch, B. M., & Stern, R. A. 1996, ApJ, 467,
841Thomas, R. J., & Neupert, W. M. 1994, ApJS, 91, 461Vernazza, J. E., & Reeves, E. M. 1978, ApJS, 37, 485Werner, K., & Drake, J. J. 2005, A&A, 434, 707Young, P. R., Landi, E., & Thomas, R. J. 1998, A&A, 329, 291Zhang, H. L., Graziani, M., & Pradhan, A. K. 1994, A&A, 283, 319
A24, page 9 of 9


![Journal of Pharmaceutical Analysis · 12.5–400 15.0 Pharmacokinetic study with 200 mg metoprolol in healthy subjects; NR [12] HPLC-fluorescenceb (excitation-272 nm, emission-306](https://img.pdfslide.us/doc/110x75/60f75cc90c4cf50672185419/journal-of-pharmaceutical-analysis-125a400-150-pharmacokinetic-study-with-200.jpg)