Embed Size (px)
Citation preview

1
Electromyography Study of Muscle Pre and Post Warm-Up
Louis G Baeseman, Alex S. Conway, Christine S. Fukuda, Briana A. Rozivka, Miles S. Russell Lab 601 Group 14

2
Abstract Athletic performance and prevention of injury plays a key role in today’s sporting events,
with the “warming-up” of muscular tissues a primary objective. The study aims to more broadly include the effects of warming up to not just the muscle’s output in performance, but also the nervous system’s input to the muscle. While the subject of warm-up on muscular tissue is well documented, the effects of the activities on the nervous system are not, and our work will be adding to a field with little research. The goal of the project is to identify the primary effect of a whole body warm up on a specific muscle group (triceps) via EMG. This research could provide an increased knowledge of to what extent a “warm-up routine” affects the body as well as its ability to function. Moreover, it could provide insight into the types of routines done across different sports or for the length of time they are executed. The p-values for the integral and maximum muscle activity were 0.1156 and 0.787, respectively. These values were not found to be statistically significant, suggesting that the warm-up did not have an effect on muscle activity.
Keywords: action potential, blood pressure, EMG, exercise, heart rate, muscle activity, performance, sympathetic nervous system, triceps, warm-up
Introduction
Background
The process of warming up can be described in a variety of ways. To start, there is a general distinction between passive and active warm ups. According to Woods et al., passive warm ups cause an increase in core body or muscle temperature through things like saunas or heating pads, active warm ups involve actual physical activity in order to produce the desired change. Furthermore, active warm ups can be divided into the categories of general and specific; with general warm ups involving aerobic activities like calisthenics and jogging and specific ones working the exact area or muscle group of concern. It has been proposed that warming up provides a number of physiological benefits. Woods et al. go on to state that an increase in temperature leads to the dissociation of oxygen from hemoglobin at higher plasma oxygen concentrations, resulting in increased oxygen to muscles. Additionally, the temperature increase associated with warm ups may lead to an increase in the actual speed, force, and smoothness of muscle contractions by speeding up metabolic processes and decreasing internal viscosity. Lastly, there is even a possibility that the speed of nerve transmission may increase as result of the warm up process. In order to understand the implications of warming up and its effects on muscle function, one must first understand the processes and major components of muscle contraction.
There are various studies and literature regarding physical activity and exercise, however, those with a focus on warming up are not as common. These studies manipulate different aspects of the pairing of the electrical and muscular activity procedure in order to reach maximal efficiency in priming our bodies for action. Among those that investigate the effects of warming

3
up, there are a variety of variables including the target muscle, the type of warm up exercise and the type of exercise used to test the response. A study by Sotiropoulos et al. examined the impacts of low versus moderate intensity warm ups. Half-squats were performed as the warm up and muscles in the leg were tested for EMG (electromyography) activity while performing a counter movement jump. This study found that in both low and moderate intensity warm up groups, the performance and mechanical power of the muscles improved (Sotiropoulos, 2010). This suggests that there may be measurable effects of warming up on muscle performance. Another study by Altamirano et al. examined the effects of warming up on peak torque and the rate of torque development. The warm up consisted of 10 minutes of stationary cycling. Muscles in the leg were tested for peak torque and rate of torque development as well as EMG and MMG (mechanomyography) activity. The results showed no difference between the warm up and non-warm up conditions for EMG frequency and amplitude and MMG frequency. There was, however a significant increase in MMG amplitude between conditions suggesting that the warm up activity may have affected the mechanics of the muscled by reducing stiffness or relieving fluid pressure (Altamirano, 2012). However, the results suggested that these impacts were not sufficient to impact muscle performance. While no change was observed in overall performance, there was still an observed effect of warming up on the muscle. While these studies reveal contradicting results on the effects of warming up, it is important to note that the variables are inconsistent. The types and intensities of the warm up activity are different as well as the activity being used to test the response of the muscles. This suggests that there are gaps in the research that require further investigation. Furthermore these, like many other studies, only investigate muscles of the legs, while research on the effects of warming up on muscles in the arm are less prevalent. Objective
The object of this study is to determine the effectiveness of a warm up routine on the action potentials that can be observed during muscle activity, specifically the extension of the triceps muscle. The specific question this study plans to answer is as follows: what effect will warming up have on the action potentials created during triceps extensions? The question was developed through discussing exercise and its effects on the body. All members of the group discussed that warming up was a major aspect of athletic endeavors, but there was never much explanation for why it was so important. The premise of the experiment is determined on the difference in action potentials between an individual who had warmed up and one who had not. The study hopes to provide valuable information on how a warm up routine affects the peripheral nervous system and its function. It is hypothesized by all members of the group that the warm up routine will in some way prime or prepare the muscles for activity and thus will cause an increase in action potentials observed during the extension of the tricep. Methods

4
Materials
● Omron Automatic Blood Pressure Monitor ● Schwinn Dual-Action Airdyne Stationary Bicycle ● 10lb dumbbell ● Biopac Electromyography Device Kit ● Metronome
Pre-Experimental Data Collection
The participants’ demographics and self -evaluation of general health and exercise habits will be collected prior to reading baseline vitals. The Electromyography (EMG) electrodes are placed on the participants’ dominant arm. The ground and positive nodes are placed proximal to the insertion of the triceps muscle with the ground placed closer to the elbow. The negative node is placed proximal to the origin. Baseline vitals include resting heart rate and resting blood pressure, which will be assessed with the Omron Automatic Blood Pressure Monitor on the non-dominant arm. An initial calibration is taken for the Biopac Electromyography Device to normalize the electrical inputs from the muscle. Following calibration, the baseline electrical activity is assessed for each participant.
Experimental Data Collection
The assessment is a triceps kick-back exercise using a 10lb dumbbell in the dominant hand. The baseline is measured for one set of five repetitions at a rate of 60 repetitions per minute (as determined by a metronome). Participants will then “warm up” on the Schwinn Dual-Action Airdyne Stationary Bicycle for 90 seconds at a rate of at least 50 revolutions per minute (as determined by bike read out). For the purposes of this study, a “warm up” consists of an activity that successfully and significantly raises both heart rate and blood pressure. Immediately after the warm up, blood pressure, heart rate and EMG readings are taken simultaneously. The same triceps kick-back is used to record EMG results. Each subject will serve as his own control by having the action potentials during triceps extension measured from rest as well as after a warm up routine.

5
Procedural Outline
Figure 1: Example EMG Data. This figure demonstrates the “max” and “area” measurements that are referenced in the results section. The “integral area” measures the area under the curves of the EMG peaks. The “max” is the highest EMG value recorded during a data recording session.
6
Results
Table 1: Positive Control Raw Data. The data shows the results from an experiment that illustrates if our equipment was able to detect a physiological change in response to a stimulus.
Table 2: Positive Control T-Test Data. The data presented here shows the mean, standard deviation (SD), and p-value (p < .05) of each parameter. The p-value shows that the measured response was significant.
Figure 2: Positive Control Systolic BP. This shows the change of blood pressure over time.
Positive Control
EMG data Initial HR Initial BP
EMG
Integral EMG Max Test HR Test BP
EMG
integral EMG Max Final HR Final BP
Final
EMG
1 74 123/82 0 0 79 134/75 0.58 3.06 76 125/76 0
2 71 137/76 0 0 78 151/98 0.41 2.7 72 133/66 0
3 81 143/98 0 0 93 147/73 0.348 2.916 77 135/72 0
Postive Control P value Data
Pre mean post mean pre sd post sd p value
Area 0 0.446 0 0.12 0.0233
Max 0 2.89 0 0.181 0.001

7
Figure 3: Positive Control Heart Rate. This shows the change in heart rate due to the warm-up.
Figure 4: Positive Control EMG Area. This shows the EMG during muscle activity.

8
Table 3: Complete Data Set. This table shows all of the useable data from the experiment.
Participant Initial HR Initial BP
Initial
EMG Area
Initial EMG
Max
Experimental
HR
Experimental
BP
Experimental
EMG Area
Experimental
EMG Max
1 80 123/93 0.305 0.827 110 147/89 0.313 1.22
2 63 138/73 0.345 1.78 72 130/70 0.407 1.68
3 74 134/84 0.26 2.26 105 130/79 0.357 2.9
4 118 135/96 0.458 1.9 114 143/99 0.441 1.57
5 105 144/95 0.383 0.945 135 168/91 0.219 0.756
7 92 117/80 0.55 1.85 101 134/78 0.441 1.89
8 103 135/70 0.535 1.74 103 115/95 0.431 1.56
9 90 161/106 0.181 0.739 104 173/105 0.197 0.656
10 90 97/74 0.577 1.75 127 123/72 0.473 1.64
11 73 116/71 0.198 0.831 125 151/68 0.164 0.857
12 80 138/80 0.19 0.636 140 127/91 0.358 1.51
13 72 139/66 0.197 0.407 84 142/75 0.164 0.732
14 93 125/88 0.687 2.58 130 158/75 0.329 1.62
15 80 117/75 0.556 2.42 119 119/71 0.417 1.79
16 77 152/92 0.347 1.58 121 185/90 0.374 1.44
18 87 130/84 0.362 1.18 129 130/82 0.36 1.36
19 84 126/88 0.3 0.496 99 137/84 0.226 0.385
20 89 136/79 0.15 1.06 126 110/63 0.119 1.1
21 82 120/78 0.278 1.35 144 124/74 0.469 2.06
22 68 130/65 0.6 1.95 75 150/78 0.502 1.66
23 87 120/76 0.578 3.06 93 125/71 0.689 3.13
24 74 122/79 0.198 1.14 94 151/75 0.185 1.01
25 85 136/85 0.55 1.77 96 159/62 0.409 1.84
27 64 127/71 0.917 2.4 97 172/105 0.678 2.57
28 84 145/99 0.485 2.09 94 154/98 0.456 1.83
29 89 117/67 0.174 0.665 124 128/90 0.207 0.778
30 93 122/82 0.369 2.01 129 151/89 0.35 1.3

9
Figure 5: Max EMG Difference. This graph shows the difference between the pre and post warm-up EMG max difference in target muscle tissue. The data presented is not statistically significant.
Figure 6: EMG Area Difference: Total Area Difference vs. Participant Number. This graph shows the difference between the pre and post warm-up EMG area difference in target muscle.
‐2
‐1.5
‐1
‐0.5
0
0.5
1
1.5
1 2 3 4 5 6 7 8 9 10 11 12 13 14 15 16 17 18 19 20 21 22 23 24 25 26
Max M
v‐sec
Participant Number
Max EMG Difference Pre/Post warm‐up

10
Table 4: EMG Area Differences Statistical Data. This shows the statistical data for representative activity level.
Table 5: EMG Max Differences Statistical Data. This shows the statistical data for representative activity level.
Discussion
Statistical and Graphical Analysis
Using a paired t-test, it was found that there was no significant difference between the subjects’ muscle activation before the warm-up and after despite the participants being significantly “warmed up”. The p-value for systolic blood pressure was 0.0019 while the p-value for diastolic blood pressure was 0.790 and the p-value for pulse was 0.0001. Those values provided support for the claim that the participants were significantly warmed up as defined by this study, but the paired t-tests for the differences in area under the EMG (integral) and maximum muscle activation of the participants yielded p-values of 0.1156 and 0.787, respectively. The data was then split into subgroups based on sex and activity level (very active, moderately active, slightly active, and not active), as well as whether the individual exercised within the last 24 hours or not. When comparing the data between sexes, the data of the male group provided a p-value of 0.710
EMG Area Differences
Demographic Pre Mean Post mean Pre SD Post SD P value
Male 0.315 0.4 0.107 0.2 0.4317
Female 0.385 0.41 0.17 0.2 0.3732
Very active 0.38558 0.4283 0.14185 0.1995 0.181
Moderately Active 0.39 0.425 0.15 0.2 0.384
Slightly Active 0.422 0.389 0.215 0.16 0.4099
Not Active 0.517 0.49 0.141 0.15 0.8335
EMG Max Differences
Demographic
Pre
Mean
Post
Mean Pre SD Post SD p value
Male 1.6 1.62 0.84 0.81 0.878
Female 1.28 1.39 0.54 0.45 0.382
Very Active 1.82 1.87 0.47 0.63 0.651
Moderately Active 1.66 1.42 0.77 0.73 0.053
Slightly Active 1.24 1.33 0.94 0.54 0.758
Not Active 0.99 1.26 0.27 0.59 0.236
11
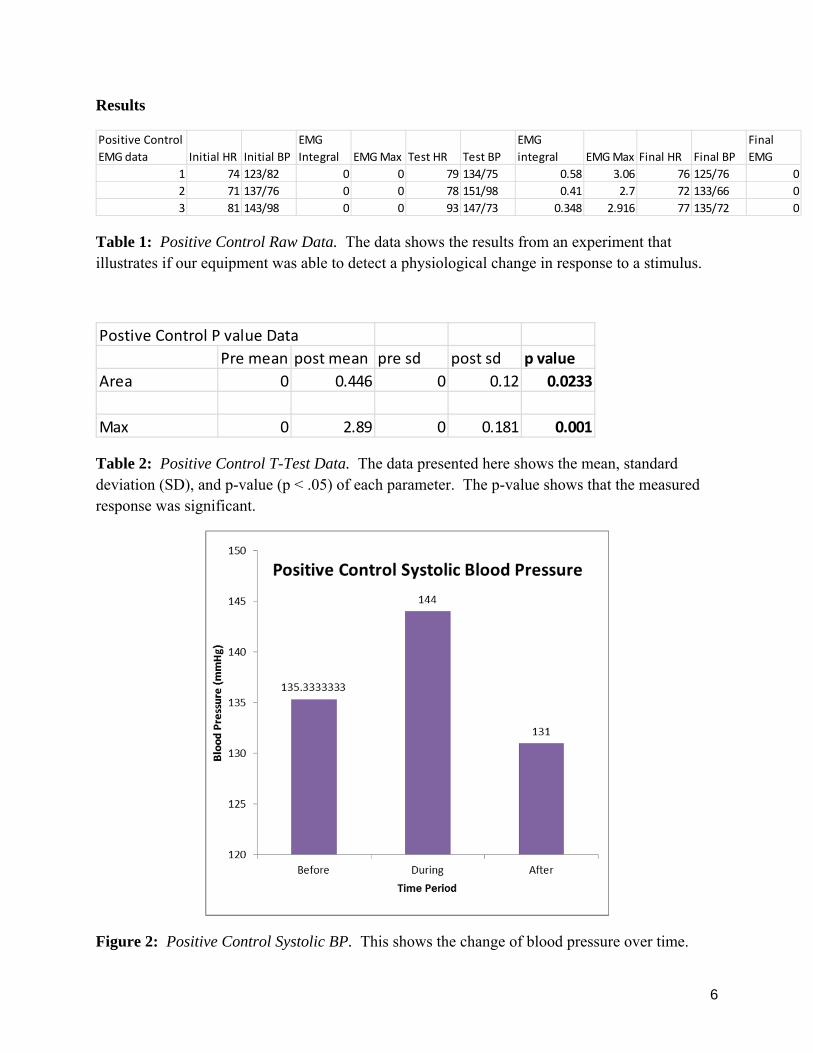
for the area under the EMG and 0.878 for the max EMG value. The critical values for the female group were 0.088 for the integral and 0.550 for the max EMG value. When analyzing the data between the groups based on activity level, the very active group included individuals that exercised at least five times per week. Their data generated p-values of 0.110 for the EMG integral and 0.550 for maximum muscle activation. The slightly active group (exercise 1-2 times per week) gave an EMG integral p-value of 1.00 and a max muscle activation p-value of 0.758. For the not active group that did not exercise, or did so inconsistently, the p-values were 0.710 and 0.236 for the integral and maximum readout, respectively. The moderately active group (exercise 3-4 times per week) exhibited a p-value that was closest to the critical value of 0.05 for the EMG max value (0.0535). However, they exhibited a p-value of 0.164 for the area under the EMG.
Assessment of Potential Confounding Variables
The initial challenge we encountered was the experimental warm-up. The original idea was to have participants perform body weight push-ups for an allotted time, but it was determined that this was too difficult. This was resolved by changing the warm-up to a whole body exercise through the use of a dual-action stationary bike. The next problem was how to test the muscle electrical activity. The preliminary method was to have the participant throw a weighted object a set distance with a chest pass. This was found to be inconsistent, and the electrodes detached frequently. The experimental exercise was changed to a more consistent and targeted triceps kick-back using a 10 pound weight. Both of these changes were made to better control for variables. The pre-exercise data collection includes a demographic analysis. This was included to assess each participant’s general health (although this will likely be skewed in some cases) and also to determine their exercise routine. This was done because it was hypothesized that people who exercise likely will not produce similar results to those who are sedentary.
A potential problem that has not been solved yet is the premise of “warming-up”. Within the constraints of the lab, we cannot represent a true warm-up, as most warm-ups are done about 20 minutes before the event, where-as this study is merely minutes before. This leaves room for potentially further research into proper timing of warm-ups in relation to electrical activity of muscles. Along with this issue is the problem of determining a warm up routine that will provide consistent results across all fitness levels. It is very difficult to provide a standardized activity that will result in similar changes in blood pressure in heart rate. In order to try to compensate for this issue, the survey regarding their activity levels was developed and their data will be grouped for data analysis. However, this may still cause an issue in the overall parameters and setup of the study. Another problem is caffeine intake. This lab is in the morning, and some participants will have ingested caffeinated drinks or other fitness supplements, which may artificially

12
increase blood-pressure and heart rate.
After working out the problems listed above, we are feeling optimistic about potential results. Furthermore, based on the rapport of the group, we are expecting the remaining duration of the experiment to run smoothly and efficiently.
Future Research
The outcome of the experiment seemed to reiterate the difficulty in determining what constitutes a proper warm-up. Although we increased the blood pressure and heart rates significantly, muscle activity was not shown to be significantly different. This leaves room for further experimentation. As discussed, a potential problem was the warm-up intensity. A small subset of three subjects performed an additional trial in which the length of the warm-up on the Airdyne was extended to five minutes and another 20 repetitions of a “burpee” (shown in the images below) were done. They then performed the same triceps kickback exercise with the 10 pound weight. As measured before, the pre- and post-EMG’s, heart rates, and blood pressures were compared by a paired t-test. It was determined that the EMG results were not significant, as shown in the table below. This may reiterate that a specific warm-up may not be suitable for everyone, as one subject displayed an EMG area and max that doubled in value after the warm-up whereas the other two subjects did not see uniform changes in muscle activity. Potential variances of the experiment could be the alteration of the weight used and the implementation of a different exercise to work the triceps.

13

14
Images 1-4: Demonstration of a “Burpee”. This exercise was used to fully warm up the entire body.
Figure 7: Future Research EMG Max Differences. This shows the data of the updated warm-up.

15
Figure 8: Future Research EMG Area Differences. This shows the data of the updated warm-up.

16
References
Altamirano, K., et al. (2012). Effects of warm-up on peak torque, rate of torque development, and electromyographic and mechanomyographic signals. Journal of Strength and Conditioning Research. 26. 5: 1296-1301. Web.
Raff, H., & Levitzky, M. (2011). Chapter 9: Skeletal muscle structure and function, p. 83-86, & 90; Chapter 12: Introduction to the nervous system, p. 105-106. Medical physiology: A systems approach. New York, NY: McGraw-Hill.
Sotiropoulos, K., et al. (2010). Effects of warm up on vertical jump performance and muscle electrical activity using half-squats at low and moderate intensity. Journal of Sports Science and Medicine. 9: 326-331. Web.
Woods, K., Bishop, P., Jones, E. (2007). Warm-up and stretching in the prevention of muscular injury. Sports Med. 37. 12: 1089-1099. Web.