Embed Size (px)
Citation preview

University of Illinois at Urbana-Champaign • Metals Processing Simulation Lab • R Chaudhary • 1
ANNUAL REPORT 2009UIUC, August 5, 2009
R. Chaudhary, Brian G. ThomasDepartment of Mechanical Science and Engineering,
University of Illinois at Urbana-Champaign
Seong-Mook Cho, Go-Gi Lee, Seon-Hyo KimDepartment of Materials Science and Engineering,
Pohang University of Science and Technology, Pohang, Kyungbuk 790-784, South Korea
Electromagnetic effects on multi-phase flow in the slab
casting nozzle and mold
University of Illinois at Urbana-Champaign • Metals Processing Simulation Lab • R Chaudhary • 2
Project outline• To investigate the effect of argon gas and magnetic field on turbulent nozzle
& mold flow:– 3-D, turbulent, single-phase steel flow model– 3-D, turbulent, multiphase flow model (Eulerian-mixture & Eulerian-
Eulerian models)– 3-D, Single-phase steel flow and multiphase steel-argon flow models
with MHD (based on measured magnetic fields)– 3-D, VOF model to investigate the effect of slag-steel interface on
single-phase steel flow
• Experiments were performed in real caster with Nail-board measurements (with & without magnetic field)
– To measure free surface velocity at 10 locations along two lines parallel to wide faces at 55 mm from mid-plane
– Surface level variations were also measured at same locations
• Perform one way coupled inclusion transport and entrapment studies. (with Rui Liu )• Based upon knowledge gained from above modeling and experimental work, flow
parameters will be fine tuned to optimize multiphase turbulent flow in real caster to minimize inclusion defects in the final steel product.
University of Illinois at Urbana-Champaign • Metals Processing Simulation Lab • R Chaudhary • 5
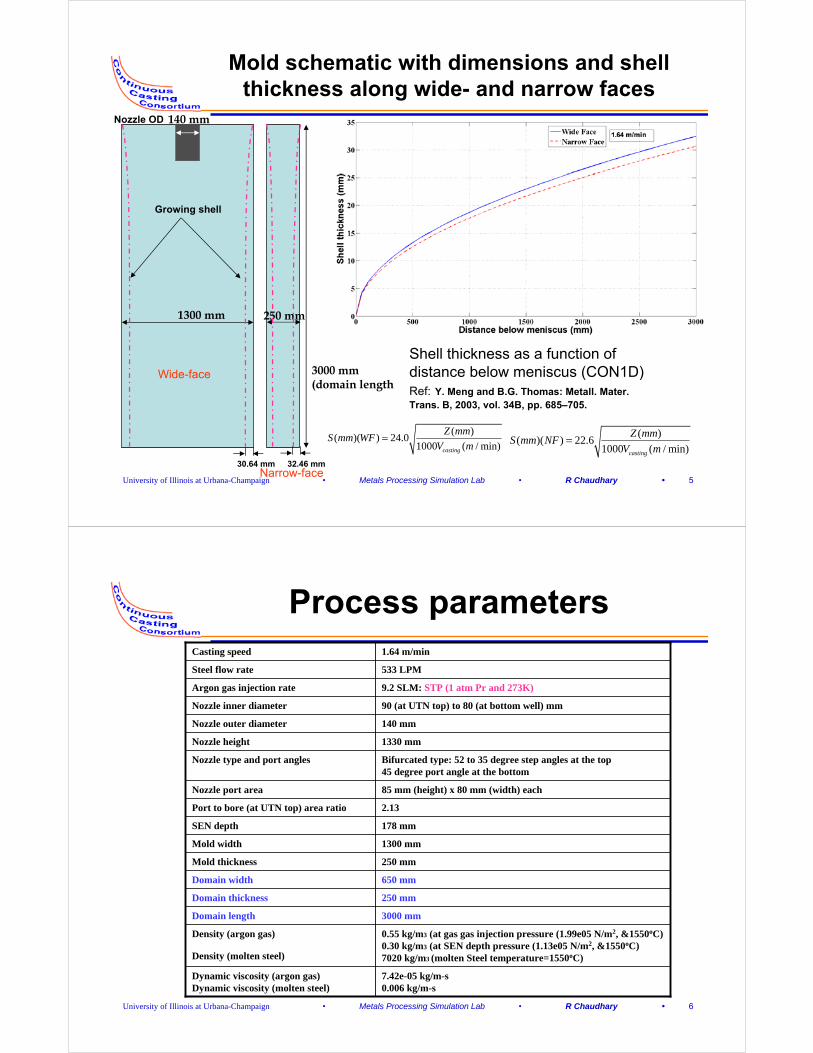
Mold schematic with dimensions and shell thickness along wide- and narrow faces
3000 mm (domain length
Shell thickness as a function of distance below meniscus (CON1D) Ref: Y. Meng and B.G. Thomas: Metall. Mater. Trans. B, 2003, vol. 34B, pp. 685–705.
140 mm
1300 mm 250 mm
30.64 mm 32.46 mm
Growing shell
Nozzle OD
Wide-face
Narrow-face
( )( )( ) 24.01000 ( / min)casting
Z mmS mm WF
V m= ( )( )( ) 22.6
1000 ( / min)casting
Z mmS mm NF
V m=
University of Illinois at Urbana-Champaign • Metals Processing Simulation Lab • R Chaudhary • 6
Process parameters
7.42e-05 kg/m-s0.006 kg/m-s
Dynamic viscosity (argon gas)Dynamic viscosity (molten steel)
0.55 kg/m3 (at gas gas injection pressure (1.99e05 N/m2, &1550oC)0.30 kg/m3 (at SEN depth pressure (1.13e05 N/m2, &1550oC) 7020 kg/m3 (molten Steel temperature=1550oC)
Density (argon gas)
Density (molten steel)
3000 mmDomain length
250 mmDomain thickness
650 mmDomain width
250 mmMold thickness
1300 mmMold width
178 mmSEN depth
2.13Port to bore (at UTN top) area ratio
85 mm (height) x 80 mm (width) eachNozzle port area
Bifurcated type: 52 to 35 degree step angles at the top45 degree port angle at the bottom
Nozzle type and port angles
1330 mmNozzle height
140 mmNozzle outer diameter
90 (at UTN top) to 80 (at bottom well) mmNozzle inner diameter
9.2 SLM: STP (1 atm Pr and 273K)Argon gas injection rate
533 LPMSteel flow rate
1.64 m/minCasting speed
University of Illinois at Urbana-Champaign • Metals Processing Simulation Lab • R Chaudhary • 7
Calculation of steel velocity and pressure at gas injection
, _ , 1.725s tun level s UTNh h H m− = =
,s UTNv
castingv
, ,
2,
, 2
( )
( )
s mold s UTN
casting m m s UTN UTN
casting m ms UTN
UTN
Q Q
v w t v R
v w tv
R
π
π
=
× × = ×
× ×=
1) Steel velocity in UTN (at gas injection point)
2, _ , _ , _
2, , ,
2, , _ ,
12
12
12
s tun level s s tun level s s tun level
s UTN s s UTN s s UTN
s UTN s tun level s s s UTN
P v gh
P v gh
P P gH v
ρ ρ
ρ ρ
ρ ρ
+ +
= + +
= + −
2) Estimated Steel pressure in UTN (at gas injection point)
37020 /kg m
< Slide-gate system >
Gas injection point
, _ 1s tu n lev e lP a tm=
Height of steel level in UTN (gas injection point)
Gravity acceleration
Height of steel level in tundish
1725mm
Steel density
Pressure in UTN
250mmThickness of mold
43mmInner radius of UTN
1atmPressure at tundish steel
level
1300mmWidth of mold
1.52 m/sSteel velocity in UTN
0
Steel velocity at tundish
level
1.64m/minCasting speed
Steel flow rate in UTN
Steel flow rate in mold,s moldQ
,s UTNQ
castingv
mw
mt
, _s tun levelv
,s UTNv
UTNR
, _s tun levelP
, ( )s UTNP abs
sρg
, _ ,s tun level sUTNh h−,s UTNh
29.8 / secm
H
, _s tun levelh
5 22.118 10 /x N m
1531.7 mm
1.3963 m/s
Static pressure at UTN
entry=1.9985654x1005 N/m2
Molten Steel temperature=1550 degree C
University of Illinois at Urbana-Champaign • Metals Processing Simulation Lab • R Chaudhary • 8
Calculation of gas flow rate at gas injection point
s m m castQ w t v= × ×
@
@ @
273g STP g g
g g STP g STP
Q P
Q P T
ρρ
⎛ ⎞⎛ ⎞= = ⎜ ⎟⎜ ⎟⎜ ⎟⎝ ⎠⎝ ⎠
@
2@, _ ,
3.21 2732
g STPg
g STPs tun level s s s UTN
PQ T
Q P gH vρ ρ
⎛ ⎞⎜ ⎟⎛ ⎞= =⎜ ⎟⎜ ⎟
⎝ ⎠⎜ ⎟+ −⎝ ⎠
1005.22%g
gm m cast g
QF
w t v Q
×= =
× × +
1725mm
Distance between
tundish steel level and UTN
Gravity acceleration
1atmSteel pressure at tundish steel level
91.75m/minSteel velocity in UTN
Gas density
Steel density
1atmGas pressure
Temperature
1.64m/minCasting speed
250mmThickness of mold
1300mmWidth of mold
533LPMSteel flow rate
9.2SLPM(273K)
30LPM(1823K, i.e. at injection)
55LPM(1823K, i.e. at SEN depth)
Gas flow rate
5.22%Gas volume fraction
mw
mt
castv
sQ
T
gF
gρ
gp
g
sρ
H
gQ
,s UTNv
, _s tun levelp
29.8 / secm
37020 /kg m
SLM: STP (1 atm Pr and 273K)Argon density=1.7837 kg/m3 @ STPArgon density=0.55 kg/m3 @ injection, 1823 K(1550 oC)Argon density=0.30 kg/m3 @ SEN depth, 1823 K(1550 oC)
Average argon gas % in nozzle:
University of Illinois at Urbana-Champaign • Metals Processing Simulation Lab • R Chaudhary • 9
Calculation of gas velocity profile at UTN
0
32 2 (1 ) 42
L
g UTN g UTN g UTN g
xQ R L v R v dx R Lv
Lπ π π= × × + − =∫
47mmDistance between gas injection point
and UTN bottom
Average gas velocity
0.01928 m/s
(1823 K &@ injection)
0.036 m/s
(1823K & @ SEN depth)
Vg (lower part of injection area)
Distance from gas injection point (mm)
Distance between gas injection point and steel surface of UTN
Inner radius of UTN
Gas flow rate
1725mm
43mm
9.2SLPM(273K)
30LPM(1823K@ injection)
55LPM (1823 @SEN depth
gQ
gv
UTNR
L
H
< Gas flow rate near steel flow = Total gas flow rate calculated from gas profile >
Gas flow rate of constant gas velocity part Gas flow rate of linearly decreasing gas velocity part
( / sec) 0.01928( 47 23.5 )gv m mm x mm= − ≤ <
( / sec) 0.01928 1.5 (23.5 70.5 )47g
xv m mm x mm⎛ ⎞= − ≤ ≤⎜ ⎟
⎝ ⎠
x
/ 2L
L
L
gv profile
gv
H
Refractory
UTN of slide-gate system
steel
( / sec)gv m
Dis
tan
ce f
rom
gas
inje
ctio
n p
oin
t (m
m)
We can calculate the gas velocity at injection point( ) by this equationvGas injection point
(0,0)
47 mm
gv
University of Illinois at Urbana-Champaign • Metals Processing Simulation Lab • R Chaudhary • 10
Computational models (single-phase) (Flow in combined nozzle and mold)
• Single-phase flow:– 3-D steady state Navier-stokes equations with mass
conservation– RANS approach to model turbulence, k-ε turbulence model
was used.– Mass and momentum sink terms to model shell solidification
were implemented using a User-Defined Function (UDF).
• VOF (volume of fluid) model for slag-steel interface:– VOF model has been used without any argon gas injection
to track steel-slag interface.– Energy equation was solved in slag layer and viscosity of the
slag was considered to be a function of temperature. Within steel a constant temperature of 1550 degree C was considered.
– RANS approach with k-ε turbulence model was used.– Mass and momentum sink terms to model shell solidification
were implemented using a User-Defined Function (UDF).
University of Illinois at Urbana-Champaign • Metals Processing Simulation Lab • R Chaudhary • 11
Multiphase computational models(combined nozzle & mold)
• Multiphase flow:– Gas was injected at UTN based upon gas velocity profile shown in
previous slides using a UDF.– This gas was removed by creating mass, and momentum sink in
the cells below free surface.– Eulerian-Eulerian model (E-E model)
• Two sets of governing equations for the field variables (i.e. mass, x-,y- and z- momentum equations for each phase).
• Two-equation mixture k-ε model for turbulence• Schiller-Naumann drag formulation for steady phase coupling
after modifying it for three-way coupling (i.e. bubble-bubble fluid dynamic interaction) using a UDF.
– Eulerian-Mixture model (E-M model)• One set of governing equation for the field variables (i.e. mass, x-, y-
and z-momentum equation for mixture phase).• Volume-fraction equation and algebraic relative velocity expression for
gas phase• Assuming smaller response time of gas bubbles in steel, relative
velocity expression was simplified to terminal velocity and after modifications with three way coupling effect was implemented using a UDF.
University of Illinois at Urbana-Champaign • Metals Processing Simulation Lab • R Chaudhary • 12
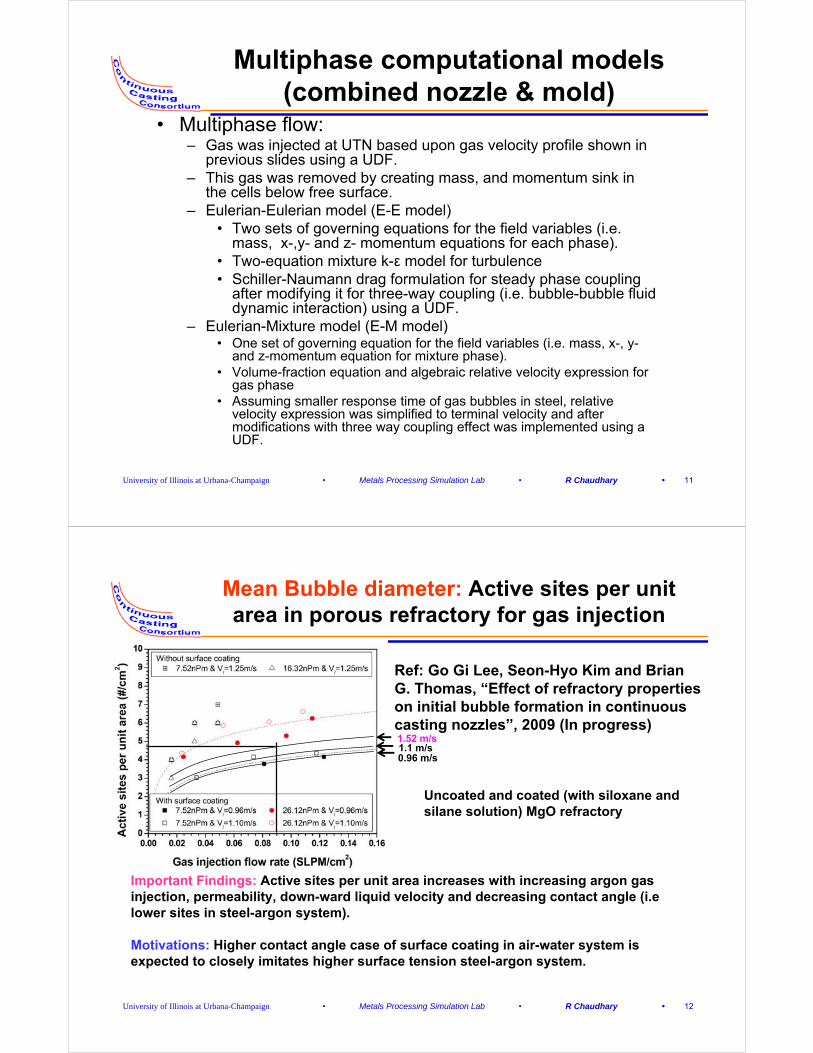
Mean Bubble diameter: Active sites per unit area in porous refractory for gas injection
Important Findings: Active sites per unit area increases with increasing argon gas injection, permeability, down-ward liquid velocity and decreasing contact angle (i.elower sites in steel-argon system).
Motivations: Higher contact angle case of surface coating in air-water system is expected to closely imitates higher surface tension steel-argon system.
Ref: Go Gi Lee, Seon-Hyo Kim and Brian G. Thomas, “Effect of refractory properties on initial bubble formation in continuous casting nozzles”, 2009 (In progress)
Uncoated and coated (with siloxane and silane solution) MgO refractory
1.52 m/s1.1 m/s0.96 m/s

University of Illinois at Urbana-Champaign • Metals Processing Simulation Lab • R Chaudhary • 13
Mean bubble diameter: Steel-argon vs water-air analogy
• Water model experiments have been used to measure active sites per unit area in surface coated Mgo refractory.
• Because of the higher contact angle in steel-argon systems (~100 degree), they behave much like water-air system with surface coated porous refractory.
University of Illinois at Urbana-Champaign • Metals Processing Simulation Lab • R Chaudhary • 14
Mean bubble diameter: In steel-argon system predicted by H. Bai and B. G. Thomas (2001)
Ref: Hua Bai and Brian G Thomas, “Bubble formation during horizontal gas injection into downward-flowing liquid”, Metallurgical and materials Transactions B, Volume 32, Number 6/ December, 2001
-Analytical model was developed and verified in water-air experiments.
-Analytical model was further extended to be used to predict average bubble size in steel-argon system.
-Mean bubble diameter was found independent of injection hole size.
0.32 ml/sGas flow rate per pore
2.4 mm mean bubble diameter
University of Illinois at Urbana-Champaign • Metals Processing Simulation Lab • R Chaudhary • 15
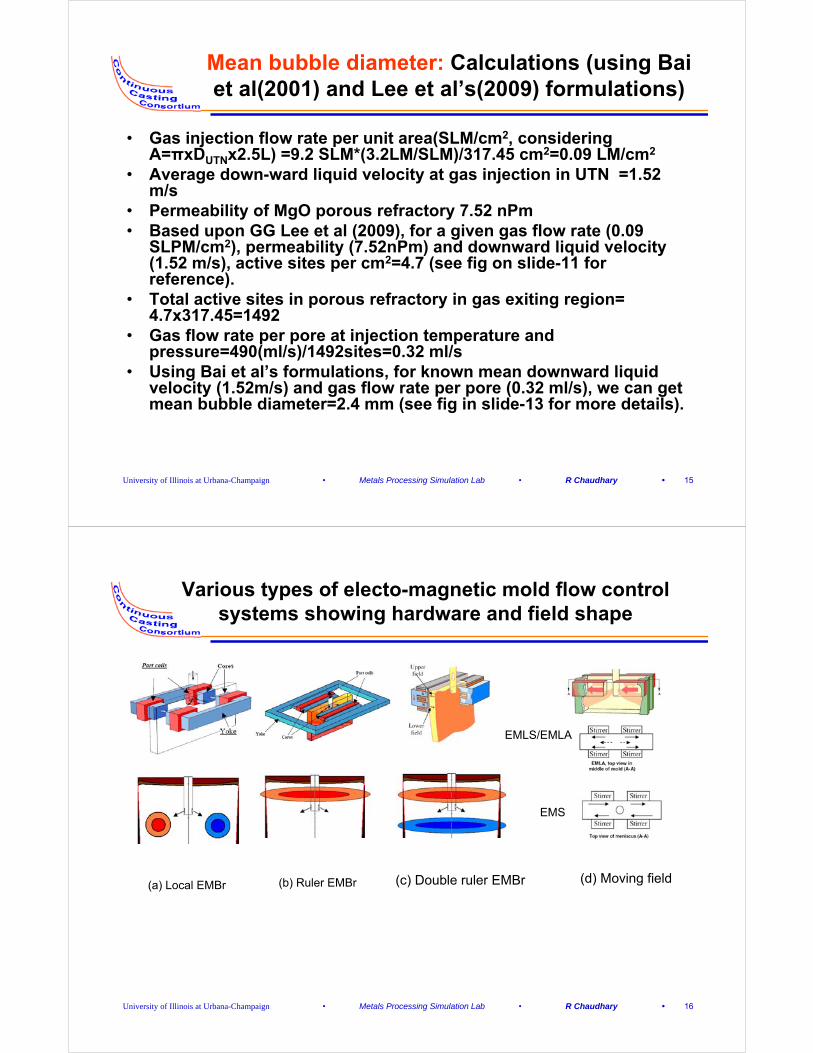
Mean bubble diameter: Calculations (using Bai et al(2001) and Lee et al’s(2009) formulations)
• Gas injection flow rate per unit area(SLM/cm2, considering A=πxDUTNx2.5L) =9.2 SLM*(3.2LM/SLM)/317.45 cm2=0.09 LM/cm2
• Average down-ward liquid velocity at gas injection in UTN =1.52 m/s
• Permeability of MgO porous refractory 7.52 nPm• Based upon GG Lee et al (2009), for a given gas flow rate (0.09
SLPM/cm2), permeability (7.52nPm) and downward liquid velocity (1.52 m/s), active sites per cm2=4.7 (see fig on slide-11 for reference).
• Total active sites in porous refractory in gas exiting region= 4.7x317.45=1492
• Gas flow rate per pore at injection temperature and pressure=490(ml/s)/1492sites=0.32 ml/s
• Using Bai et al’s formulations, for known mean downward liquid velocity (1.52m/s) and gas flow rate per pore (0.32 ml/s), we can get mean bubble diameter=2.4 mm (see fig in slide-13 for more details).
University of Illinois at Urbana-Champaign • Metals Processing Simulation Lab • R Chaudhary • 16
Various types of electo-magnetic mold flow control systems showing hardware and field shape
(a) Local EMBr (b) Ruler EMBr (c) Double ruler EMBr (d) Moving field
EMLS/EMLA
EMS
University of Illinois at Urbana-Champaign • Metals Processing Simulation Lab • R Chaudhary • 17
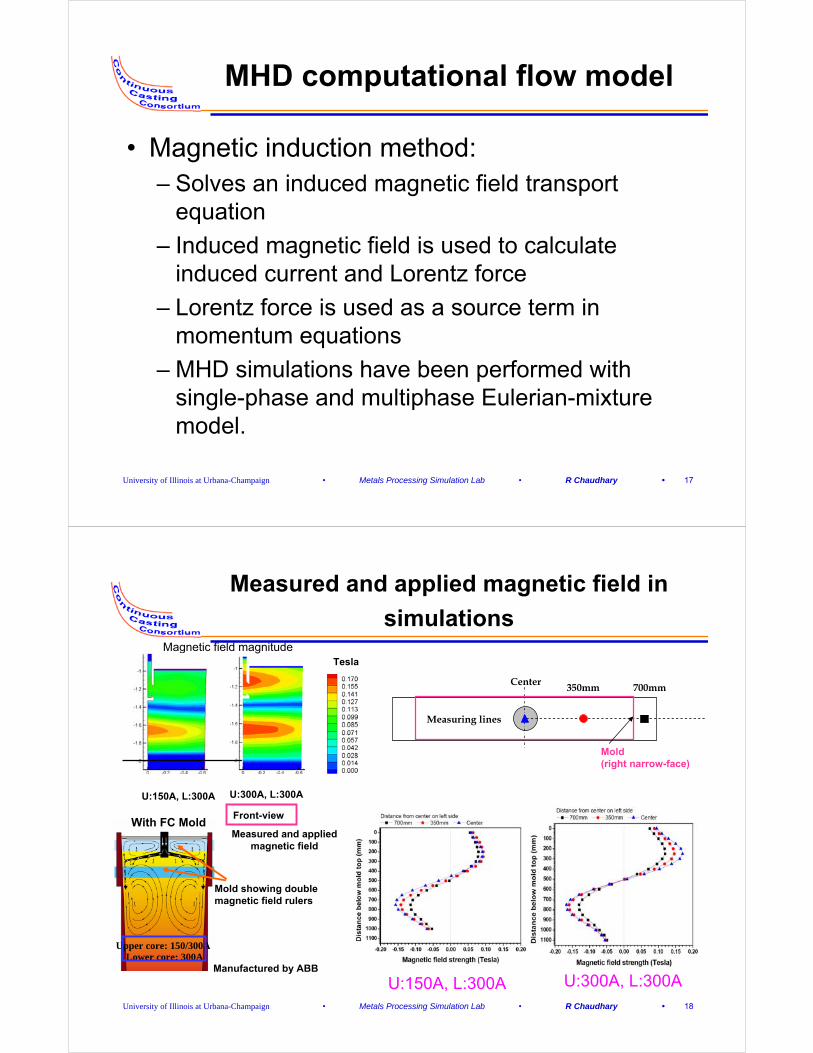
MHD computational flow model
• Magnetic induction method:– Solves an induced magnetic field transport
equation
– Induced magnetic field is used to calculate induced current and Lorentz force
– Lorentz force is used as a source term in momentum equations
– MHD simulations have been performed with single-phase and multiphase Eulerian-mixture model.
University of Illinois at Urbana-Champaign • Metals Processing Simulation Lab • R Chaudhary • 18
Measured and applied magnetic field in
simulations
With FC Mold
Center 350mm 700mm
Measuring lines
Upper core: 150/300ALower core: 300A
Tesla
Mold (right narrow-face)
Measured and applied magnetic field
Mold showing double magnetic field rulers
Manufactured by ABB
Front-view
Magnetic field magnitude
U:150A, L:300A U:300A, L:300A
U:150A, L:300A U:300A, L:300A
University of Illinois at Urbana-Champaign • Metals Processing Simulation Lab • R Chaudhary • 19
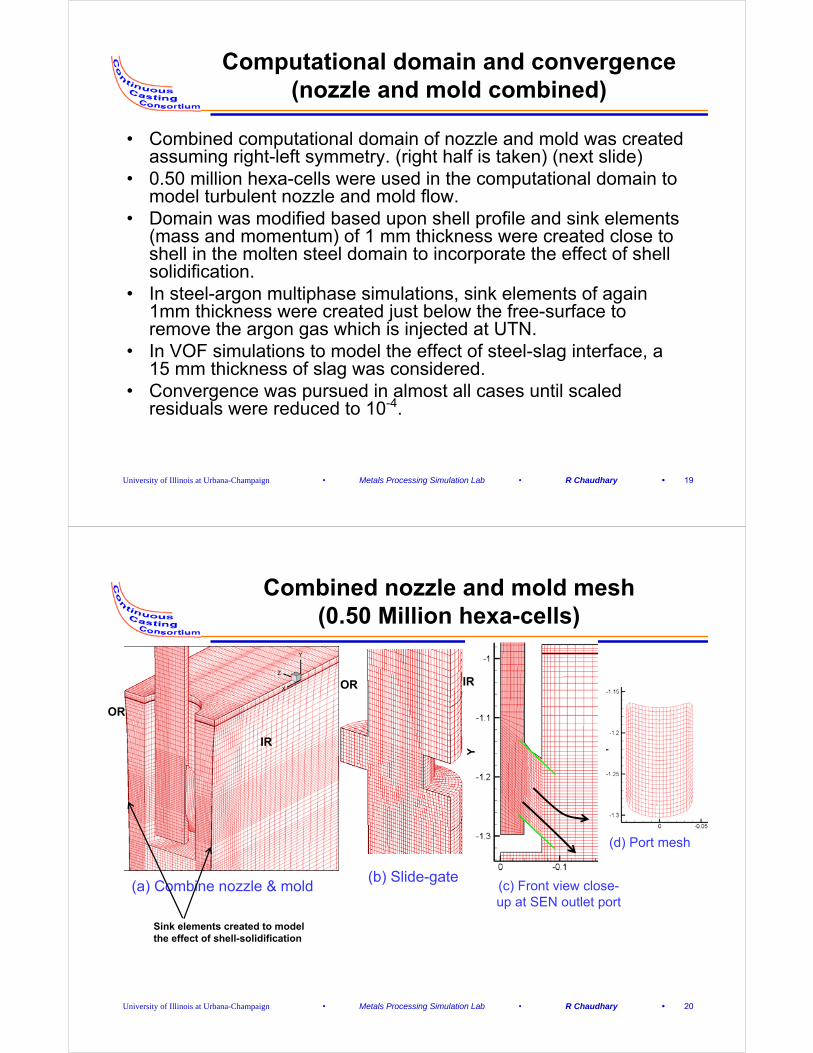
Computational domain and convergence(nozzle and mold combined)
• Combined computational domain of nozzle and mold was created assuming right-left symmetry. (right half is taken) (next slide)
• 0.50 million hexa-cells were used in the computational domain to model turbulent nozzle and mold flow.
• Domain was modified based upon shell profile and sink elements (mass and momentum) of 1 mm thickness were created close to shell in the molten steel domain to incorporate the effect of shell solidification.
• In steel-argon multiphase simulations, sink elements of again 1mm thickness were created just below the free-surface to remove the argon gas which is injected at UTN.
• In VOF simulations to model the effect of steel-slag interface, a 15 mm thickness of slag was considered.
• Convergence was pursued in almost all cases until scaled residuals were reduced to 10-4.
University of Illinois at Urbana-Champaign • Metals Processing Simulation Lab • R Chaudhary • 20
Combined nozzle and mold mesh(0.50 Million hexa-cells)
IR
OR
IROR
(c) Front view close-up at SEN outlet port
(b) Slide-gate(a) Combine nozzle & mold
(d) Port mesh
Sink elements created to model the effect of shell-solidification
University of Illinois at Urbana-Champaign • Metals Processing Simulation Lab • R Chaudhary • 21
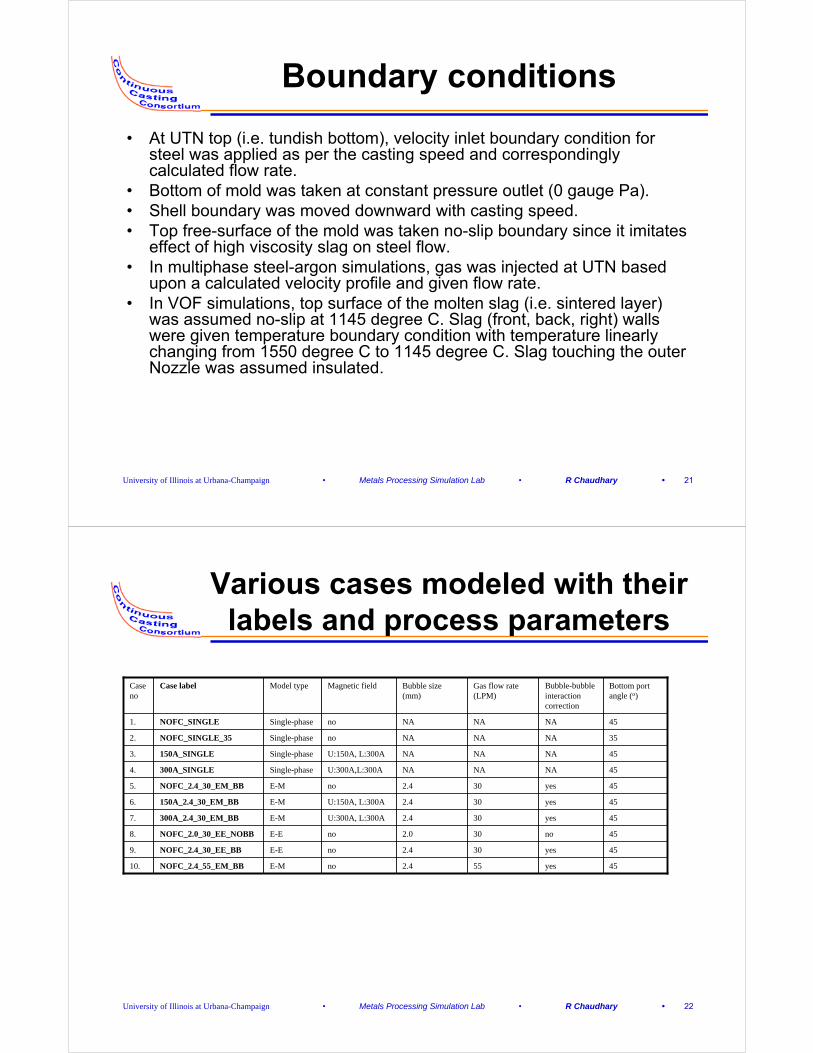
Boundary conditions
• At UTN top (i.e. tundish bottom), velocity inlet boundary condition for steel was applied as per the casting speed and correspondingly calculated flow rate.
• Bottom of mold was taken at constant pressure outlet (0 gauge Pa).• Shell boundary was moved downward with casting speed.• Top free-surface of the mold was taken no-slip boundary since it imitates
effect of high viscosity slag on steel flow.• In multiphase steel-argon simulations, gas was injected at UTN based
upon a calculated velocity profile and given flow rate.• In VOF simulations, top surface of the molten slag (i.e. sintered layer)
was assumed no-slip at 1145 degree C. Slag (front, back, right) walls were given temperature boundary condition with temperature linearly changing from 1550 degree C to 1145 degree C. Slag touching the outer Nozzle was assumed insulated.
University of Illinois at Urbana-Champaign • Metals Processing Simulation Lab • R Chaudhary • 22
Various cases modeled with their labels and process parameters
45yes552.4noE-MNOFC_2.4_55_EM_BB10.
45yes302.4noE-ENOFC_2.4_30_EE_BB9.
45no302.0noE-ENOFC_2.0_30_EE_NOBB8.
45yes302.4U:300A, L:300AE-M300A_2.4_30_EM_BB7.
45yes302.4U:150A, L:300AE-M150A_2.4_30_EM_BB6.
45yes302.4noE-MNOFC_2.4_30_EM_BB5.
45NANANAU:300A,L:300ASingle-phase300A_SINGLE4.
45NANANAU:150A, L:300ASingle-phase150A_SINGLE3.
35NANANAnoSingle-phaseNOFC_SINGLE_352.
45NANANAnoSingle-phaseNOFC_SINGLE1.
Bottom port angle (o)
Bubble-bubbleinteraction correction
Gas flow rate (LPM)
Bubble size (mm)
Magnetic fieldModel typeCase labelCase no
University of Illinois at Urbana-Champaign • Metals Processing Simulation Lab • R Chaudhary • 23
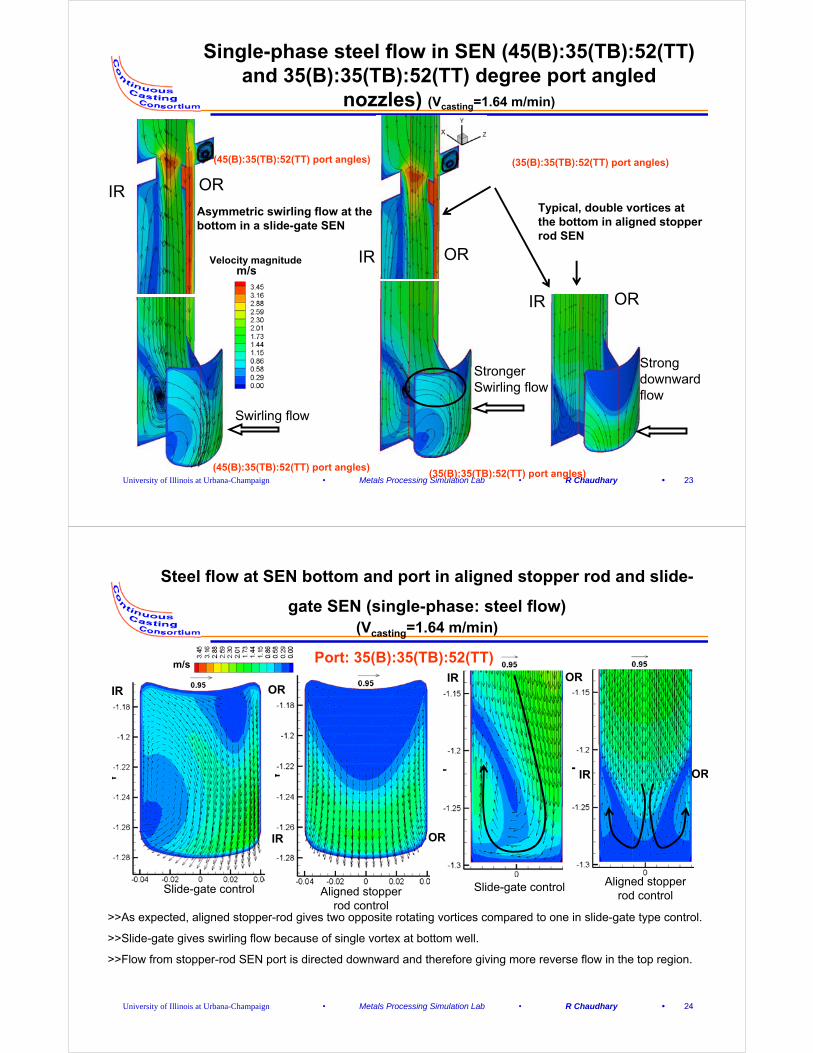
Single-phase steel flow in SEN (45(B):35(TB):52(TT) and 35(B):35(TB):52(TT) degree port angled
nozzles) (Vcasting=1.64 m/min)
Asymmetric swirling flow at the bottom in a slide-gate SEN
Typical, double vortices at the bottom in aligned stopper rod SEN
m/s
Strong downward flow
Swirling flow
IR OR
IR OR
IR OR
(45(B):35(TB):52(TT) port angles)
(35(B):35(TB):52(TT) port angles)(45(B):35(TB):52(TT) port angles)
Stronger Swirling flow
(35(B):35(TB):52(TT) port angles)
Velocity magnitude
University of Illinois at Urbana-Champaign • Metals Processing Simulation Lab • R Chaudhary • 24
Steel flow at SEN bottom and port in aligned stopper rod and slide-
gate SEN (single-phase: steel flow)(Vcasting=1.64 m/min)
Slide-gate control Aligned stopper rod control
Slide-gate control Aligned stopper rod control
m/s Port: 35(B):35(TB):52(TT)
>>As expected, aligned stopper-rod gives two opposite rotating vortices compared to one in slide-gate type control.
>>Slide-gate gives swirling flow because of single vortex at bottom well.
>>Flow from stopper-rod SEN port is directed downward and therefore giving more reverse flow in the top region.
IR OR
IR OR
IR OR
IR OR
University of Illinois at Urbana-Champaign • Metals Processing Simulation Lab • R Chaudhary • 25
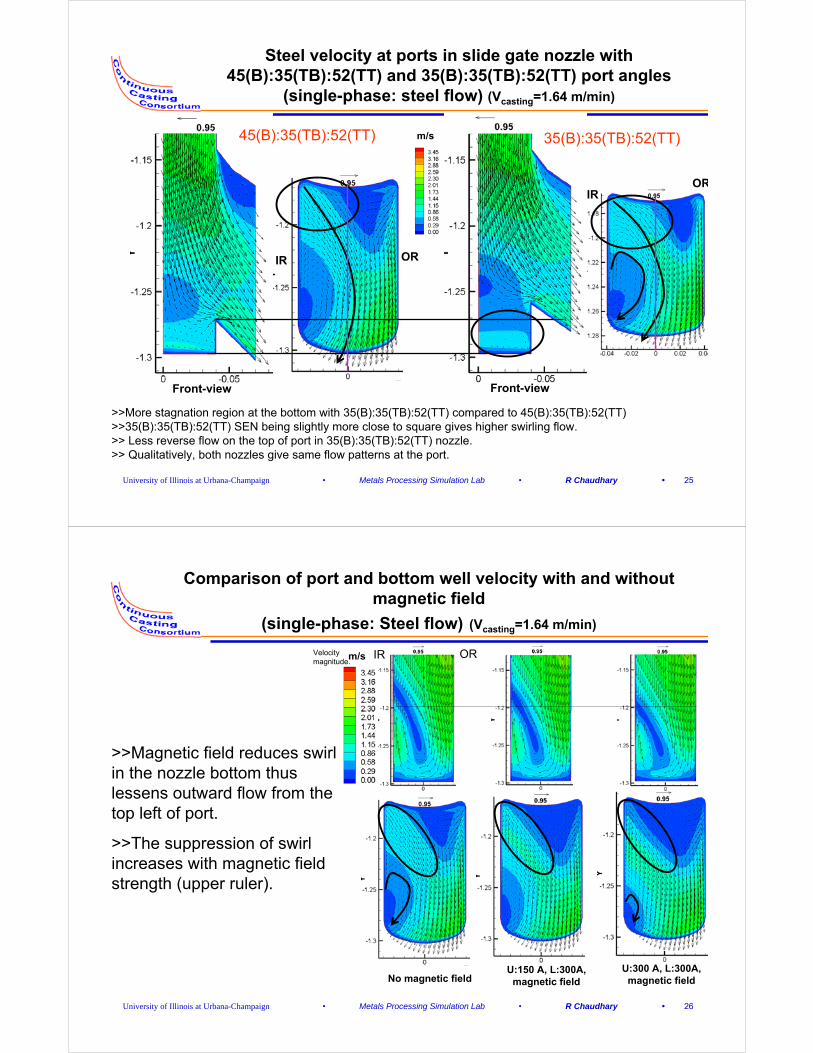
Steel velocity at ports in slide gate nozzle with 45(B):35(TB):52(TT) and 35(B):35(TB):52(TT) port angles
(single-phase: steel flow) (Vcasting=1.64 m/min)
m/s 35(B):35(TB):52(TT)
>>More stagnation region at the bottom with 35(B):35(TB):52(TT) compared to 45(B):35(TB):52(TT)>>35(B):35(TB):52(TT) SEN being slightly more close to square gives higher swirling flow.>> Less reverse flow on the top of port in 35(B):35(TB):52(TT) nozzle.>> Qualitatively, both nozzles give same flow patterns at the port.
45(B):35(TB):52(TT)
Front-view
IR OR
IROR
Front-view
University of Illinois at Urbana-Champaign • Metals Processing Simulation Lab • R Chaudhary • 26
Comparison of port and bottom well velocity with and without magnetic field
(single-phase: Steel flow) (Vcasting=1.64 m/min)
No magnetic fieldU:300 A, L:300A,
magnetic fieldU:150 A, L:300A,
magnetic field
m/s
>>Magnetic field reduces swirl in the nozzle bottom thus lessens outward flow from the top left of port.
>>The suppression of swirl increases with magnetic field strength (upper ruler).
IR ORVelocity magnitude.
University of Illinois at Urbana-Champaign • Metals Processing Simulation Lab • R Chaudhary • 27
Comparison of port and SEN symmetry plane velocities in single-phase steel flow with FC on(U:300A, L:300A) and FC off conditions
(Vcasting=1.64 m/min)
FC offFC on
>>>More flow from left upward region in FC-off case thus causing nose to jet.
>>>FC off shows bigger swirl at symmetry planeat the well of the SEN
More flow region compared to FC on
m/s
IR OR
More swirling jet
(from left-top to bottom-right)Less swirling and more diffusive jet
Vortex region reduces with FC on
IR OR
IR OR ORIR
FC-offFC-on
m/s
University of Illinois at Urbana-Champaign • Metals Processing Simulation Lab • R Chaudhary • 28
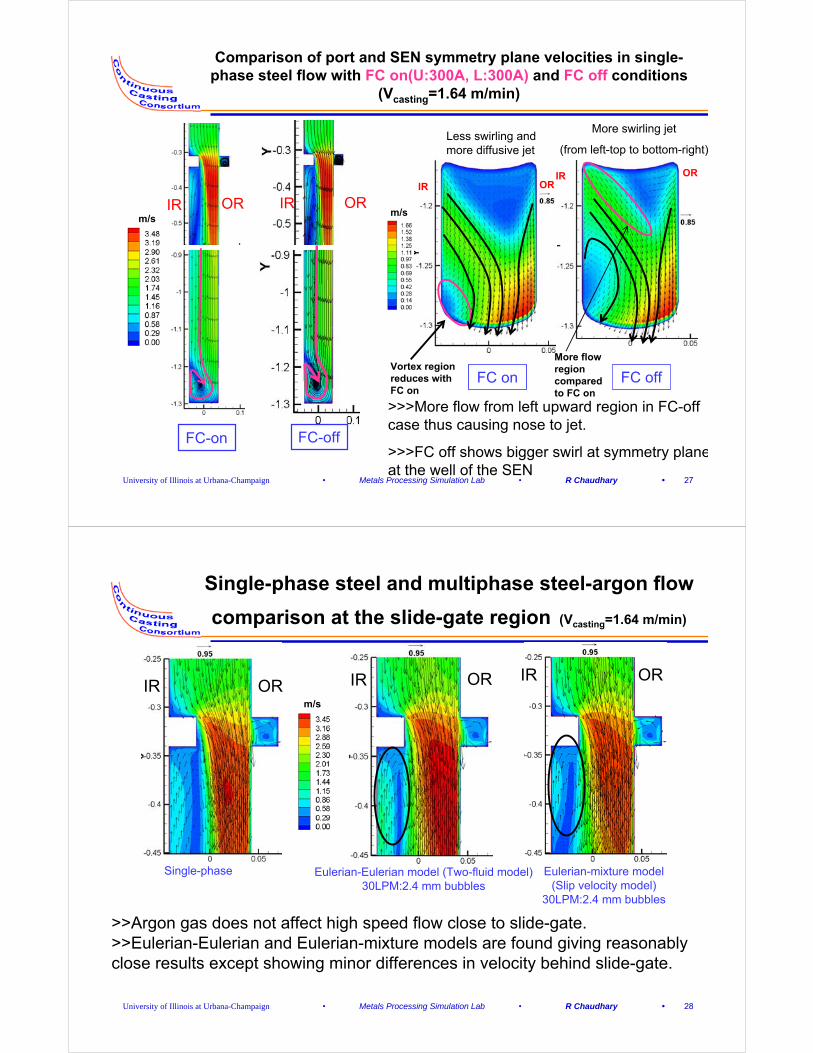
Single-phase steel and multiphase steel-argon flow
comparison at the slide-gate region (Vcasting=1.64 m/min)
Single-phase Eulerian-Eulerian model (Two-fluid model)30LPM:2.4 mm bubbles
Eulerian-mixture model (Slip velocity model)
30LPM:2.4 mm bubbles
m/s
>>Argon gas does not affect high speed flow close to slide-gate.>>Eulerian-Eulerian and Eulerian-mixture models are found giving reasonably close results except showing minor differences in velocity behind slide-gate.
IR OR IR OR IR OR
University of Illinois at Urbana-Champaign • Metals Processing Simulation Lab • R Chaudhary • 29
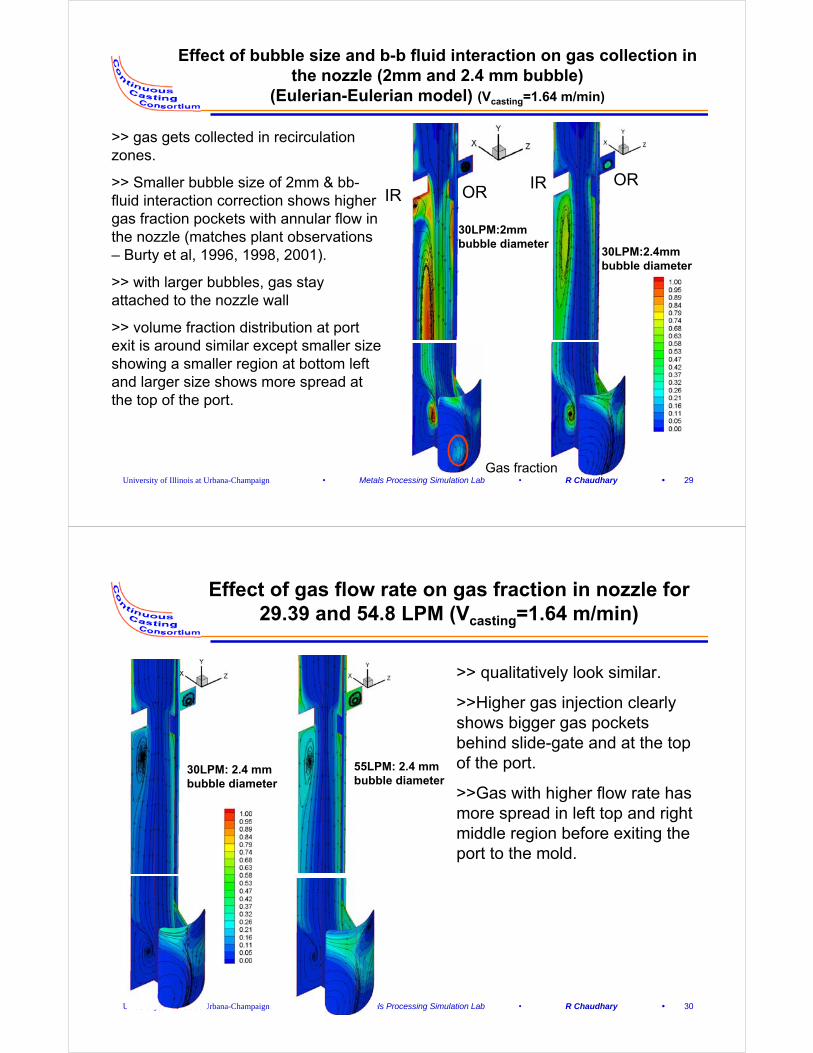
Effect of bubble size and b-b fluid interaction on gas collection in the nozzle (2mm and 2.4 mm bubble)
(Eulerian-Eulerian model) (Vcasting=1.64 m/min)
30LPM:2mm bubble diameter
30LPM:2.4mm bubble diameter
>> gas gets collected in recirculation zones.
>> Smaller bubble size of 2mm & bb-fluid interaction correction shows higher gas fraction pockets with annular flow in the nozzle (matches plant observations – Burty et al, 1996, 1998, 2001).
>> with larger bubbles, gas stay attached to the nozzle wall
>> volume fraction distribution at port exit is around similar except smaller size showing a smaller region at bottom left and larger size shows more spread at the top of the port.
IR ORIR OR
Gas fraction
University of Illinois at Urbana-Champaign • Metals Processing Simulation Lab • R Chaudhary • 30
Effect of gas flow rate on gas fraction in nozzle for 29.39 and 54.8 LPM (Vcasting=1.64 m/min)
30LPM: 2.4 mm bubble diameter
55LPM: 2.4 mm bubble diameter
>> qualitatively look similar.
>>Higher gas injection clearly shows bigger gas pockets behind slide-gate and at the top of the port.
>>Gas with higher flow rate has more spread in left top and right middle region before exiting the port to the mold.
University of Illinois at Urbana-Champaign • Metals Processing Simulation Lab • R Chaudhary • 31
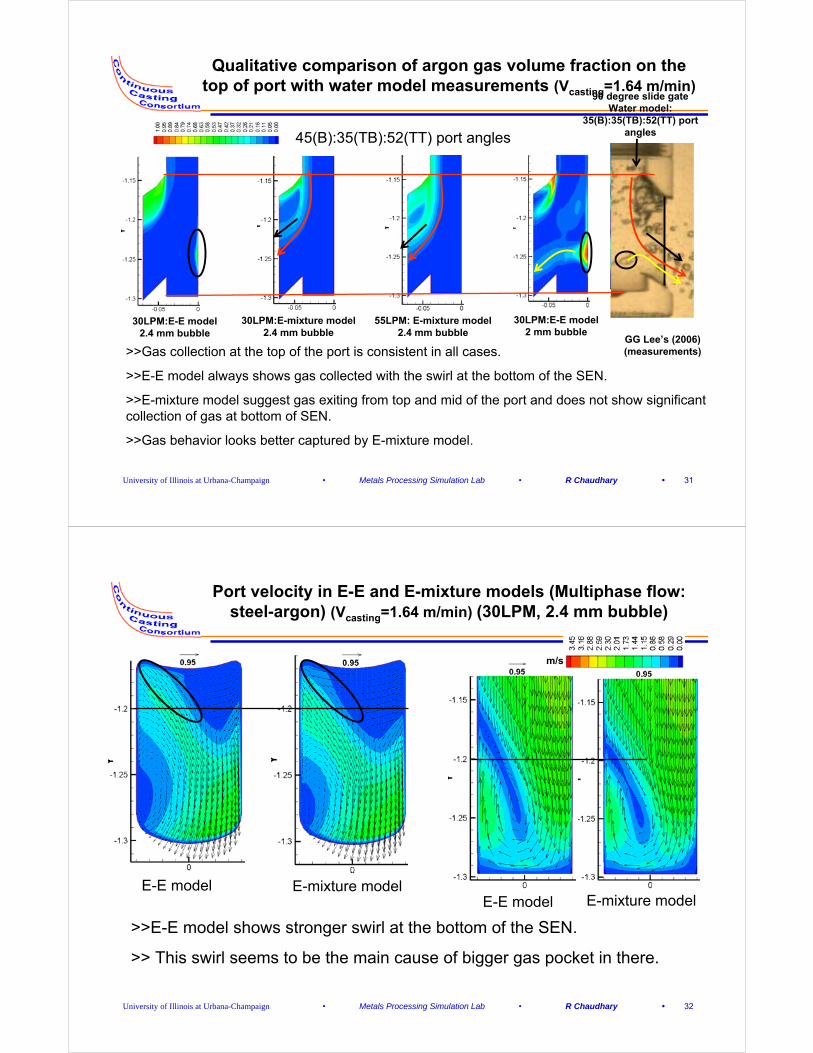
Qualitative comparison of argon gas volume fraction on the top of port with water model measurements (Vcasting=1.64 m/min)
55LPM: E-mixture model2.4 mm bubble
30LPM:E-E model2 mm bubble
30LPM:E-E model2.4 mm bubble
30LPM:E-mixture model2.4 mm bubble
45(B):35(TB):52(TT) port angles
90 degree slide gate Water model:
35(B):35(TB):52(TT) port angles
GG Lee’s (2006)(measurements)>>Gas collection at the top of the port is consistent in all cases.
>>E-E model always shows gas collected with the swirl at the bottom of the SEN.
>>E-mixture model suggest gas exiting from top and mid of the port and does not show significant collection of gas at bottom of SEN.
>>Gas behavior looks better captured by E-mixture model.
University of Illinois at Urbana-Champaign • Metals Processing Simulation Lab • R Chaudhary • 32
Port velocity in E-E and E-mixture models (Multiphase flow: steel-argon) (Vcasting=1.64 m/min) (30LPM, 2.4 mm bubble)
E-E model E-mixture modelE-E model E-mixture model
m/s
>>E-E model shows stronger swirl at the bottom of the SEN.
>> This swirl seems to be the main cause of bigger gas pocket in there.
University of Illinois at Urbana-Champaign • Metals Processing Simulation Lab • R Chaudhary • 33
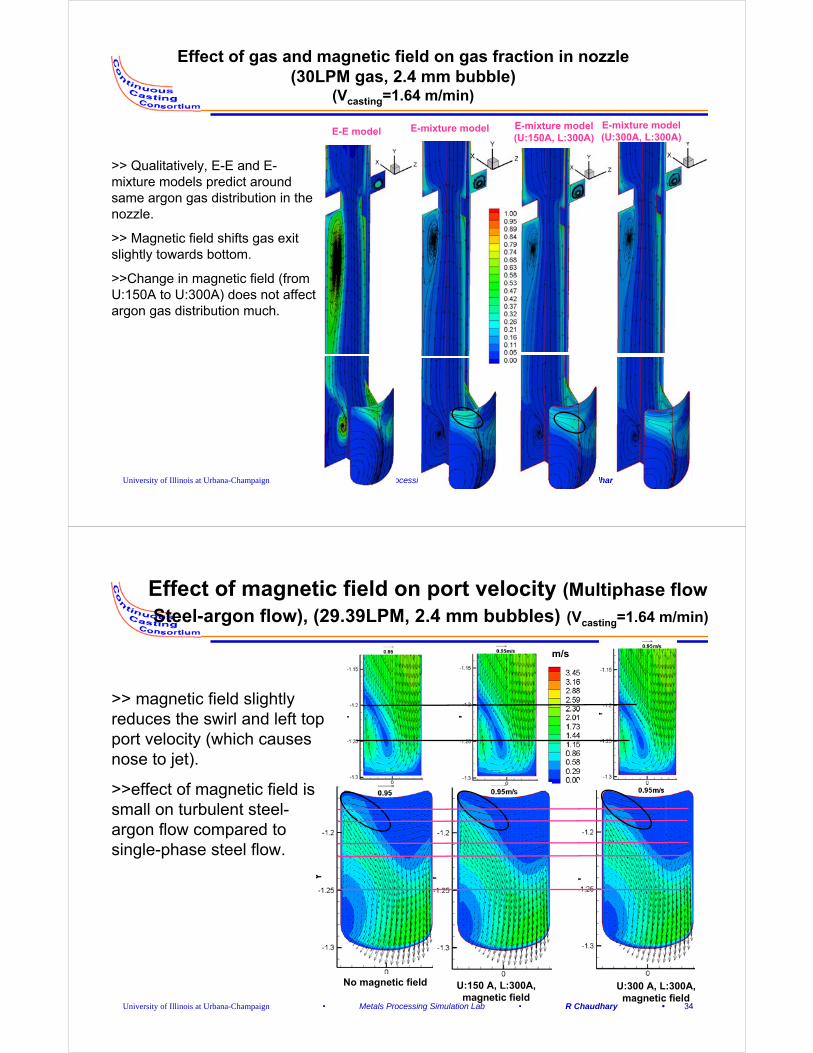
Effect of gas and magnetic field on gas fraction in nozzle (30LPM gas, 2.4 mm bubble)
(Vcasting=1.64 m/min)
E-E model E-mixture model E-mixture model (U:300A, L:300A)
E-mixture model (U:150A, L:300A)
>> Qualitatively, E-E and E-mixture models predict around same argon gas distribution in the nozzle.
>> Magnetic field shifts gas exit slightly towards bottom.
>>Change in magnetic field (from U:150A to U:300A) does not affect argon gas distribution much.
University of Illinois at Urbana-Champaign • Metals Processing Simulation Lab • R Chaudhary • 34
Effect of magnetic field on port velocity (Multiphase flow
Steel-argon flow), (29.39LPM, 2.4 mm bubbles) (Vcasting=1.64 m/min)
No magnetic field U:300 A, L:300A, magnetic field
U:150 A, L:300A, magnetic field
m/s
>> magnetic field slightly reduces the swirl and left top port velocity (which causes nose to jet).
>>effect of magnetic field is small on turbulent steel-argon flow compared to single-phase steel flow.
University of Illinois at Urbana-Champaign • Metals Processing Simulation Lab • R Chaudhary • 35
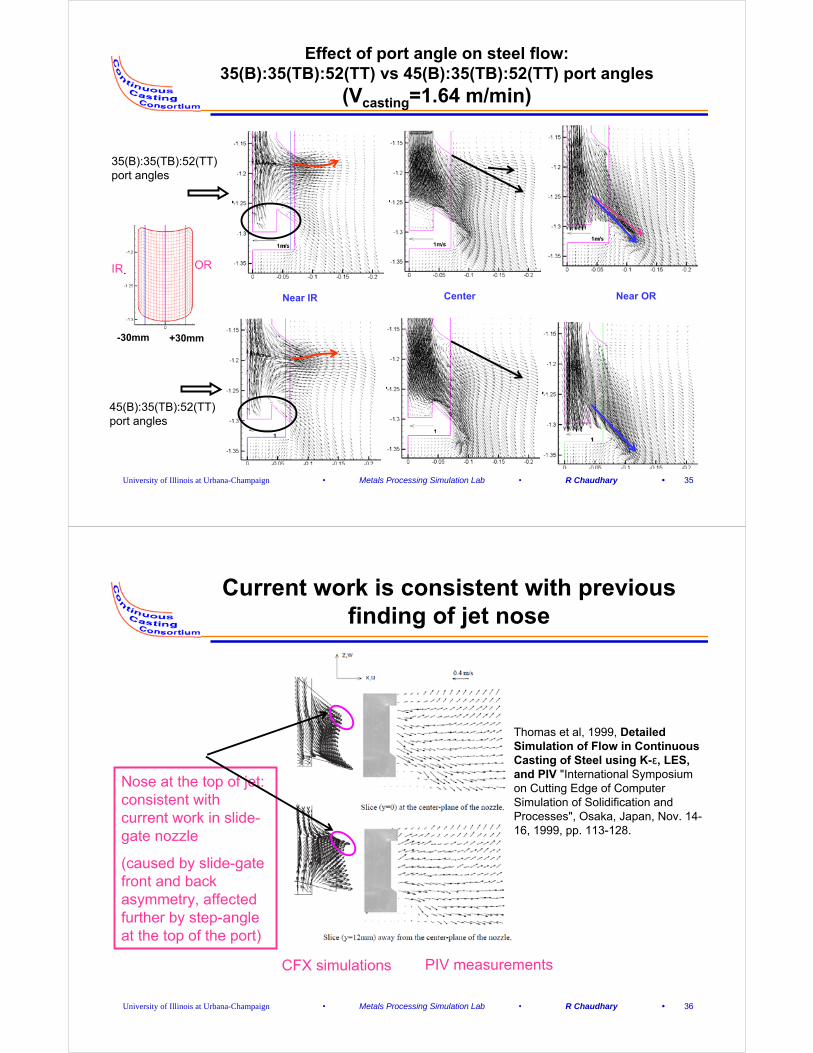
Effect of port angle on steel flow: 35(B):35(TB):52(TT) vs 45(B):35(TB):52(TT) port angles
(Vcasting=1.64 m/min)
Near IR Near ORCenter
+30mm-30mm
IR OR
35(B):35(TB):52(TT) port angles
45(B):35(TB):52(TT) port angles
University of Illinois at Urbana-Champaign • Metals Processing Simulation Lab • R Chaudhary • 36
Current work is consistent with previous finding of jet nose
PIV measurementsCFX simulations
Nose at the top of jet: consistent with current work in slide-gate nozzle
(caused by slide-gate front and back asymmetry, affected further by step-angle at the top of the port)
Thomas et al, 1999, Detailed Simulation of Flow in Continuous Casting of Steel using K-ε, LES, and PIV "International Symposium on Cutting Edge of Computer Simulation of Solidification and Processes", Osaka, Japan, Nov. 14-16, 1999, pp. 113-128.
University of Illinois at Urbana-Champaign • Metals Processing Simulation Lab • R Chaudhary • 37
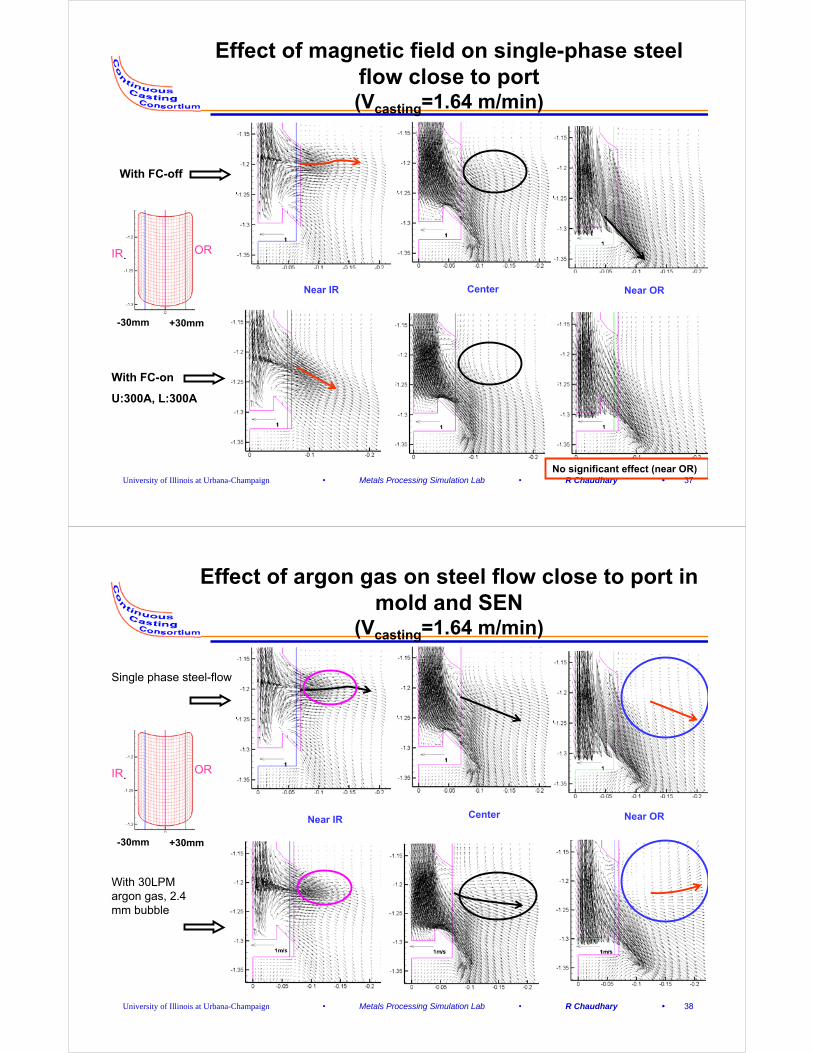
Effect of magnetic field on single-phase steel flow close to port(Vcasting=1.64 m/min)
+30mm-30mm
IR OR
With FC-off
With FC-on
U:300A, L:300A
Near IR Near ORCenter
No significant effect (near OR)
University of Illinois at Urbana-Champaign • Metals Processing Simulation Lab • R Chaudhary • 38
Effect of argon gas on steel flow close to port in mold and SEN
(Vcasting=1.64 m/min)
+30mm-30mm
IR OR
Near IR Near ORCenter
With 30LPM argon gas, 2.4 mm bubble
Single phase steel-flow
University of Illinois at Urbana-Champaign • Metals Processing Simulation Lab • R Chaudhary • 39
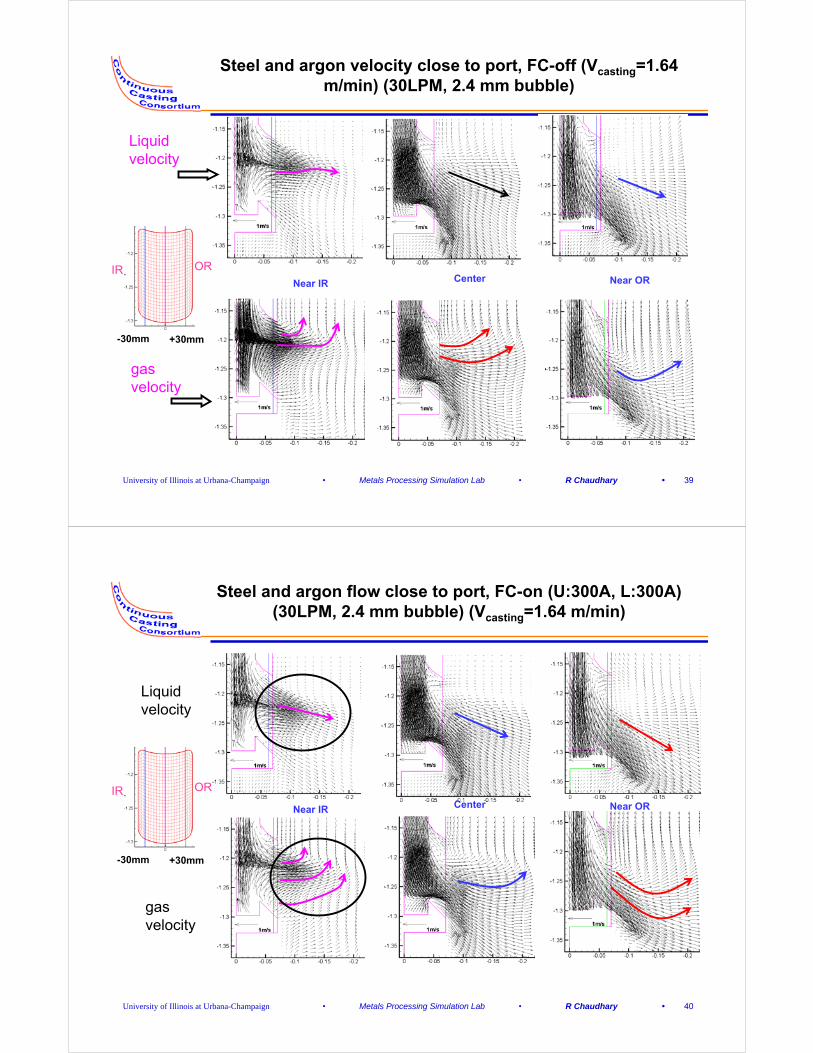
Steel and argon velocity close to port, FC-off (Vcasting=1.64 m/min) (30LPM, 2.4 mm bubble)
+30mm-30mm
IR OR
Liquid velocity
gas velocity
Near IR Near ORCenter
University of Illinois at Urbana-Champaign • Metals Processing Simulation Lab • R Chaudhary • 40
Steel and argon flow close to port, FC-on (U:300A, L:300A) (30LPM, 2.4 mm bubble) (Vcasting=1.64 m/min)
+30mm-30mm
IR OR
Liquid velocity
gas velocity
Near IR Near ORCenter
University of Illinois at Urbana-Champaign • Metals Processing Simulation Lab • R Chaudhary • 41
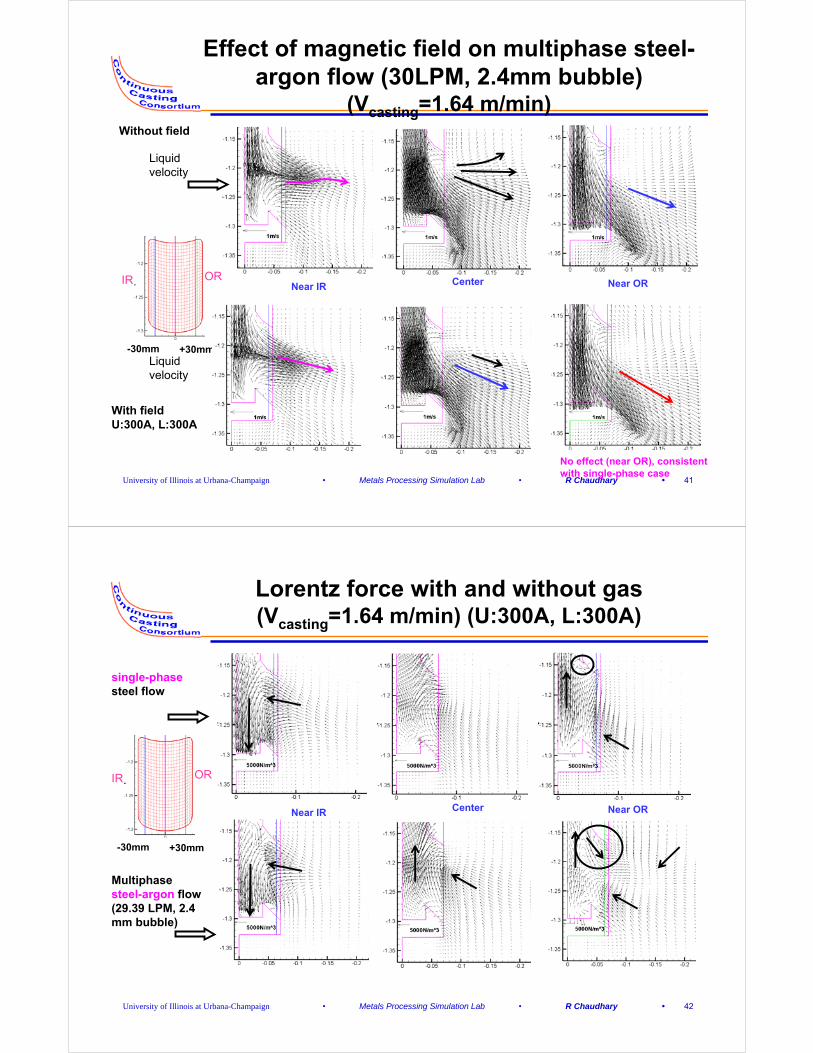
Effect of magnetic field on multiphase steel-argon flow (30LPM, 2.4mm bubble)
(Vcasting=1.64 m/min)
+30mm-30mm
IR OR
Liquid velocity
With fieldU:300A, L:300A
Liquid velocity
No effect (near OR), consistent with single-phase case
Near IR Near ORCenter
Without field
University of Illinois at Urbana-Champaign • Metals Processing Simulation Lab • R Chaudhary • 42
Lorentz force with and without gas (Vcasting=1.64 m/min) (U:300A, L:300A)
+30mm-30mm
IR OR
single-phasesteel flow
Multiphase steel-argon flow (29.39 LPM, 2.4 mm bubble)
Near IR Near ORCenter
University of Illinois at Urbana-Champaign • Metals Processing Simulation Lab • R Chaudhary • 43
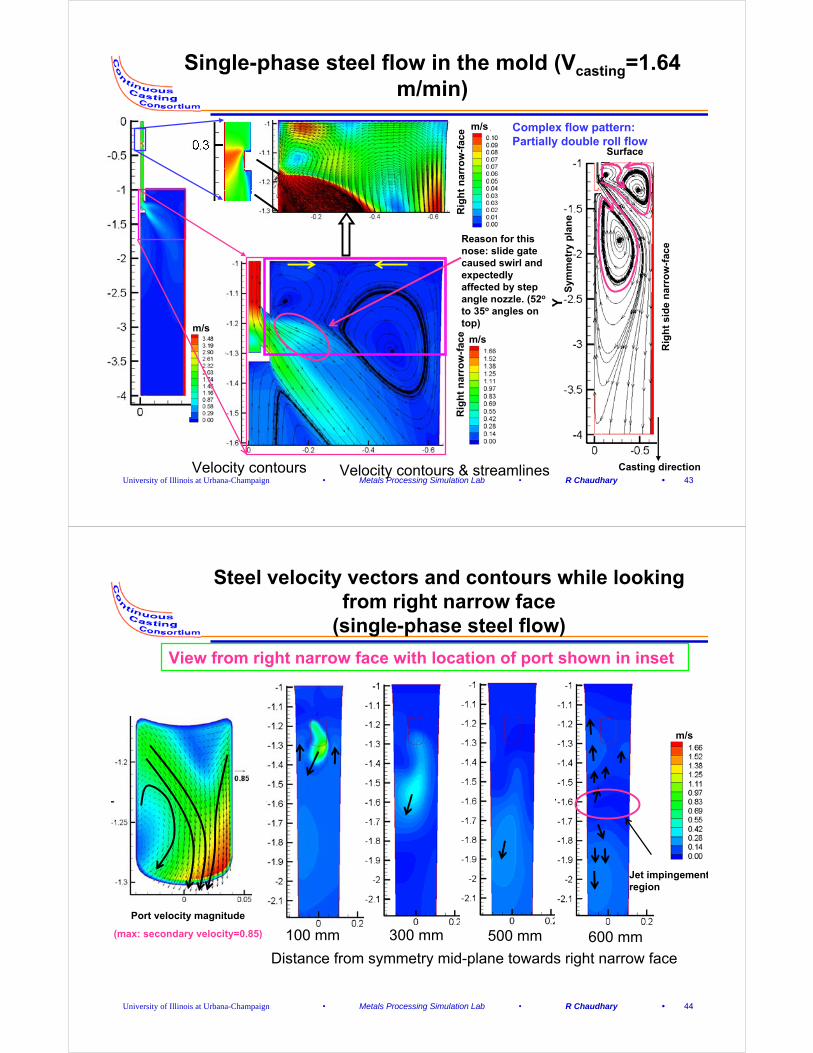
Single-phase steel flow in the mold (Vcasting=1.64 m/min)
m/s
Velocity contours Velocity contours & streamlines
Reason for this nose: slide gate caused swirl and expectedly affected by step angle nozzle. (52o
to 35o angles on top)
Rig
ht
nar
row
-fac
eR
igh
t n
arro
w-f
ace m/s
m/s
Complex flow pattern: Partially double roll flow
Surface
Rig
ht
sid
e n
arro
w-f
ace
Sym
met
ry p
lan
e
Casting direction
University of Illinois at Urbana-Champaign • Metals Processing Simulation Lab • R Chaudhary • 44
Steel velocity vectors and contours while looking from right narrow face
(single-phase steel flow)
View from right narrow face with location of port shown in inset
Port velocity magnitude
(max: secondary velocity=0.85) 100 mm 300 mm 500 mm 600 mm
Distance from symmetry mid-plane towards right narrow face
Jet impingementregion
m/s
University of Illinois at Urbana-Champaign • Metals Processing Simulation Lab • R Chaudhary • 45
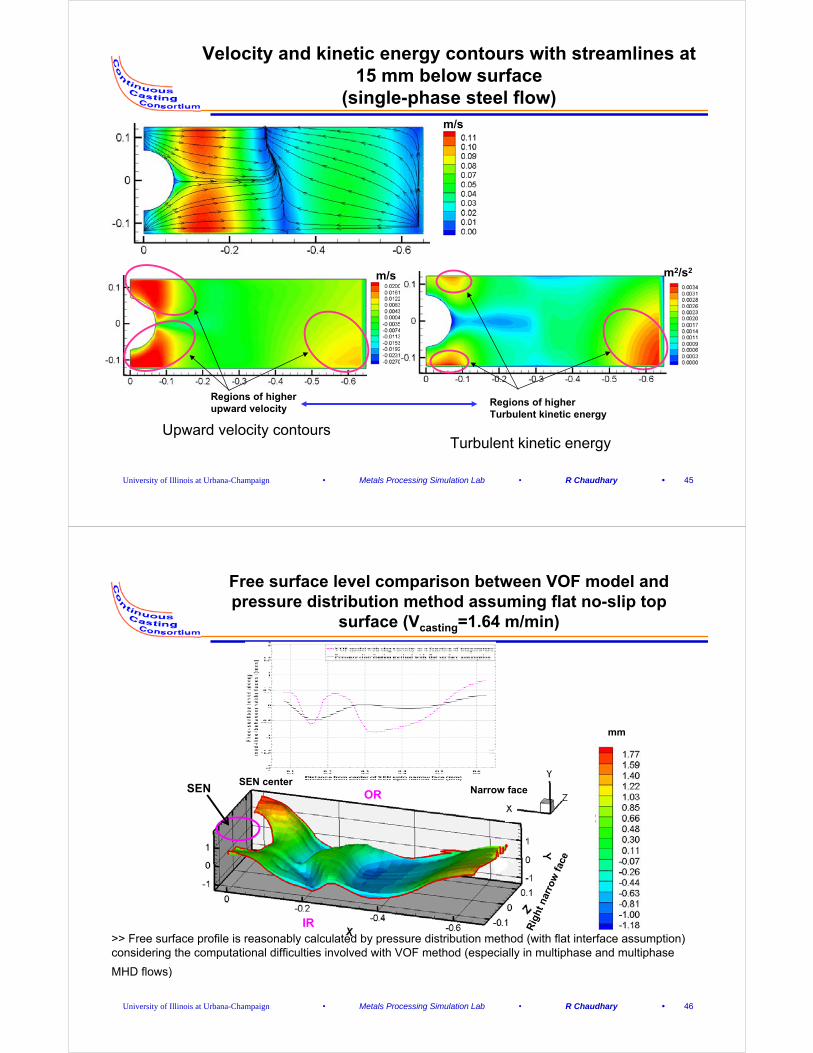
Velocity and kinetic energy contours with streamlines at 15 mm below surface
(single-phase steel flow)
Upward velocity contoursTurbulent kinetic energy
m/s
m/s
Regions of higher upward velocity
Regions of higher Turbulent kinetic energy
m2/s2
University of Illinois at Urbana-Champaign • Metals Processing Simulation Lab • R Chaudhary • 46
Free surface level comparison between VOF model and pressure distribution method assuming flat no-slip top
surface (Vcasting=1.64 m/min)
mm
IR
OR
>> Free surface profile is reasonably calculated by pressure distribution method (with flat interface assumption) considering the computational difficulties involved with VOF method (especially in multiphase and multiphase
MHD flows)
Narrow faceSEN center
SEN
Rig
ht n
arro
w f
ace
University of Illinois at Urbana-Champaign • Metals Processing Simulation Lab • R Chaudhary • 47
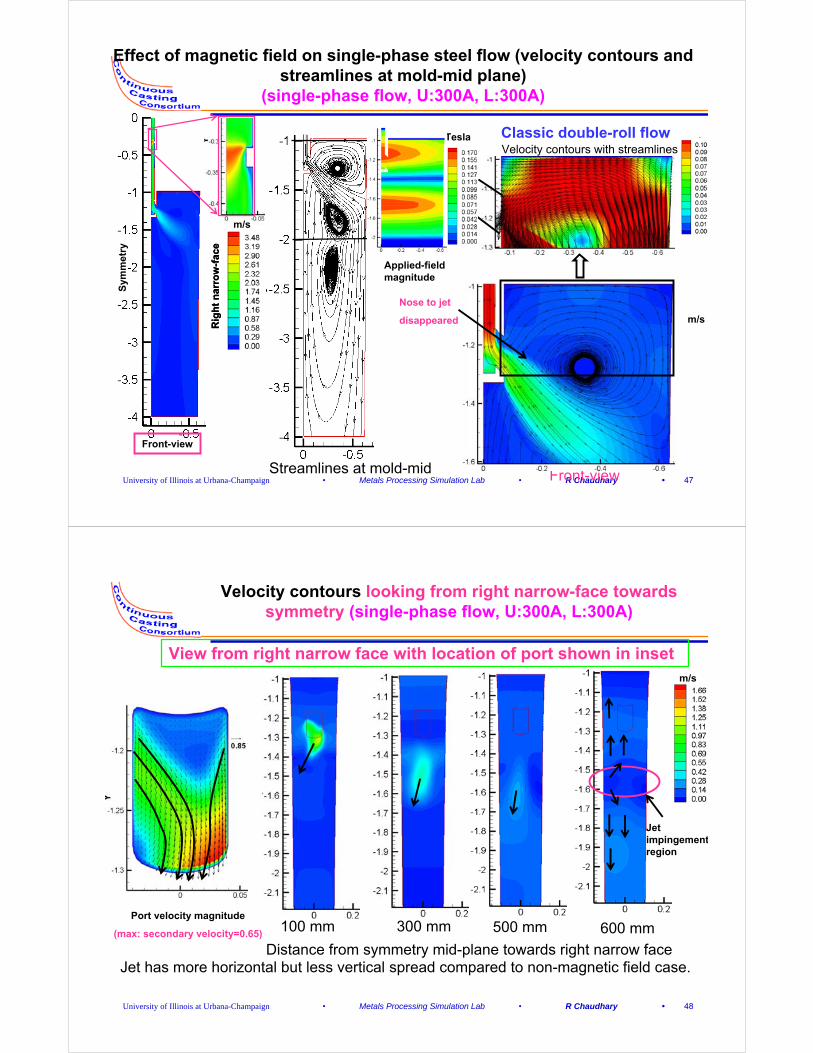
Effect of magnetic field on single-phase steel flow (velocity contours and streamlines at mold-mid plane)
(single-phase flow, U:300A, L:300A)
Nose to jet
disappeared
Velocity contours with streamlines
m/s
Streamlines at mold-mid Front-view
Front-view
Rig
ht
nar
row
-fac
eR
igh
t n
arro
w-f
ace
Sym
met
ry
Applied-field magnitude
m/s
Tesla Classic double-roll flow
University of Illinois at Urbana-Champaign • Metals Processing Simulation Lab • R Chaudhary • 48
Velocity contours looking from right narrow-face towards symmetry (single-phase flow, U:300A, L:300A)
View from right narrow face with location of port shown in inset
Port velocity magnitude
(max: secondary velocity=0.65)100 mm 300 mm 500 mm 600 mm
Distance from symmetry mid-plane towards right narrow face
Jet impingementregion
m/s
Jet has more horizontal but less vertical spread compared to non-magnetic field case.
University of Illinois at Urbana-Champaign • Metals Processing Simulation Lab • R Chaudhary • 49
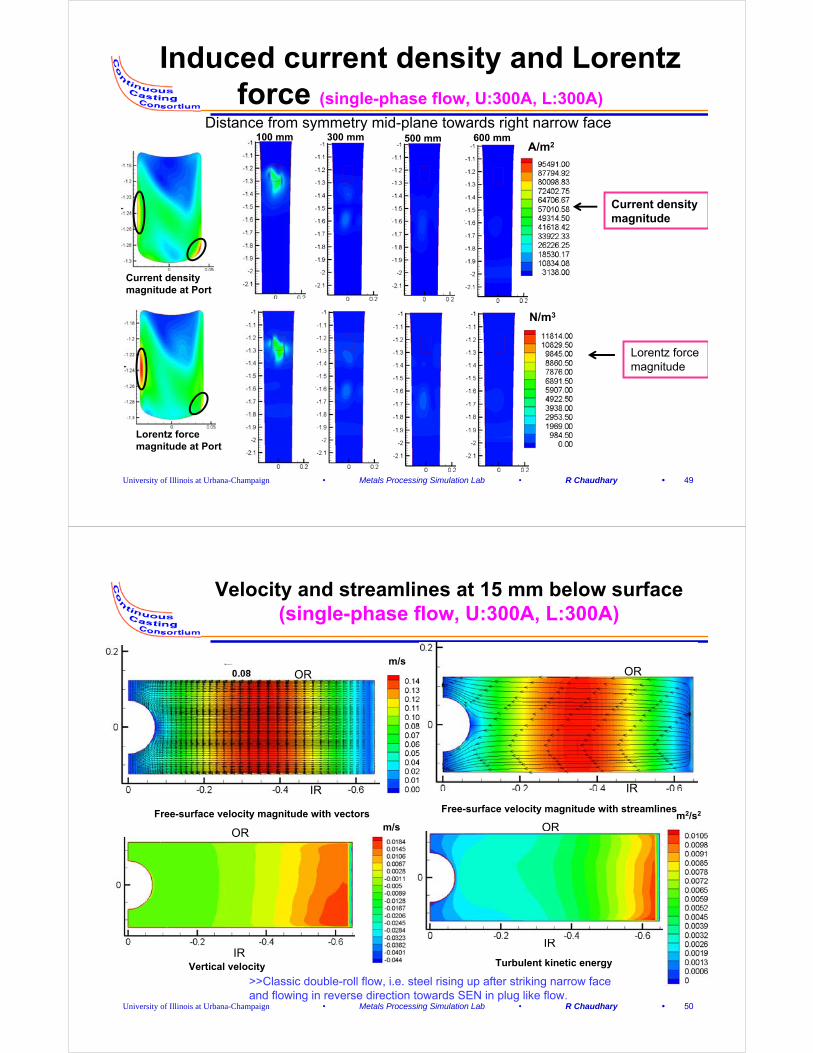
Induced current density and Lorentz force (single-phase flow, U:300A, L:300A)
N/m3
A/m2100 mm 300 mm 500 mm 600 mm
Distance from symmetry mid-plane towards right narrow face
Current density magnitude
Lorentz force magnitude
Current density magnitude at Port
Lorentz force magnitude at Port
University of Illinois at Urbana-Champaign • Metals Processing Simulation Lab • R Chaudhary • 50
Velocity and streamlines at 15 mm below surface (single-phase flow, U:300A, L:300A)
m/s
m/sm2/s2Free-surface velocity magnitude with vectors Free-surface velocity magnitude with streamlines
Vertical velocity Turbulent kinetic energyIR
OR
IR
OR
IR
OR
IR
OR
>>Classic double-roll flow, i.e. steel rising up after striking narrow face and flowing in reverse direction towards SEN in plug like flow.
University of Illinois at Urbana-Champaign • Metals Processing Simulation Lab • R Chaudhary • 51
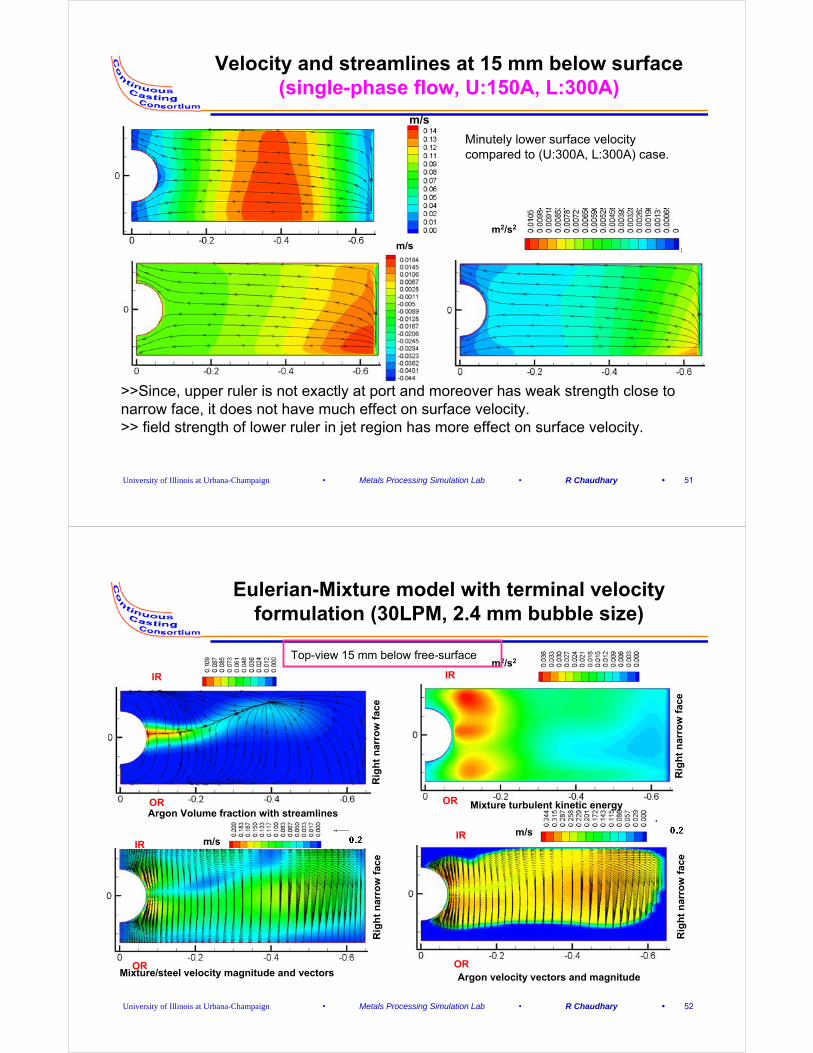
Velocity and streamlines at 15 mm below surface (single-phase flow, U:150A, L:300A)
m/s
m2/s2
m/s
>>Since, upper ruler is not exactly at port and moreover has weak strength close to narrow face, it does not have much effect on surface velocity.>> field strength of lower ruler in jet region has more effect on surface velocity.
Minutely lower surface velocity compared to (U:300A, L:300A) case.
University of Illinois at Urbana-Champaign • Metals Processing Simulation Lab • R Chaudhary • 52
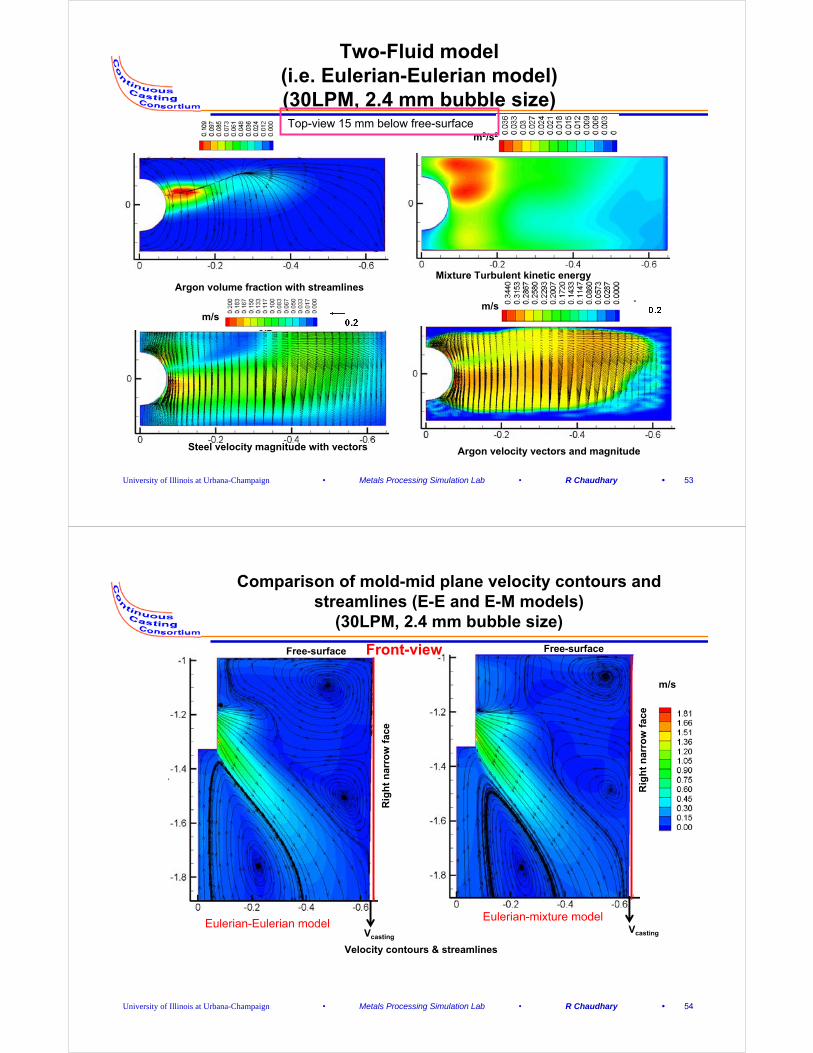
Eulerian-Mixture model with terminal velocity formulation (30LPM, 2.4 mm bubble size)
Mixture/steel velocity magnitude and vectors
Rig
ht
nar
row
fac
eR
igh
t n
arro
w f
ace
m2/s2Top-view 15 mm below free-surface
IR
OR
IR
OR
Rig
ht
nar
row
fac
e
m/s
Rig
ht
nar
row
fac
e
IR
OR
m/s
Argon Volume fraction with streamlines
IR
ORArgon velocity vectors and magnitude
Mixture turbulent kinetic energy
University of Illinois at Urbana-Champaign • Metals Processing Simulation Lab • R Chaudhary • 53
Two-Fluid model (i.e. Eulerian-Eulerian model) (30LPM, 2.4 mm bubble size)
Steel velocity magnitude with vectors
Argon volume fraction with streamlinesMixture Turbulent kinetic energy
m2/s2
m/sm/s
Top-view 15 mm below free-surface
Argon velocity vectors and magnitude
University of Illinois at Urbana-Champaign • Metals Processing Simulation Lab • R Chaudhary • 54
Comparison of mold-mid plane velocity contours and streamlines (E-E and E-M models)
(30LPM, 2.4 mm bubble size)
m/s
Front-view
VcastingVcasting
Free-surface Free-surface
Velocity contours & streamlines
Eulerian-Eulerian modelEulerian-mixture model
Rig
ht
nar
row
fac
e
Rig
ht
nar
row
fac
e
University of Illinois at Urbana-Champaign • Metals Processing Simulation Lab • R Chaudhary • 55
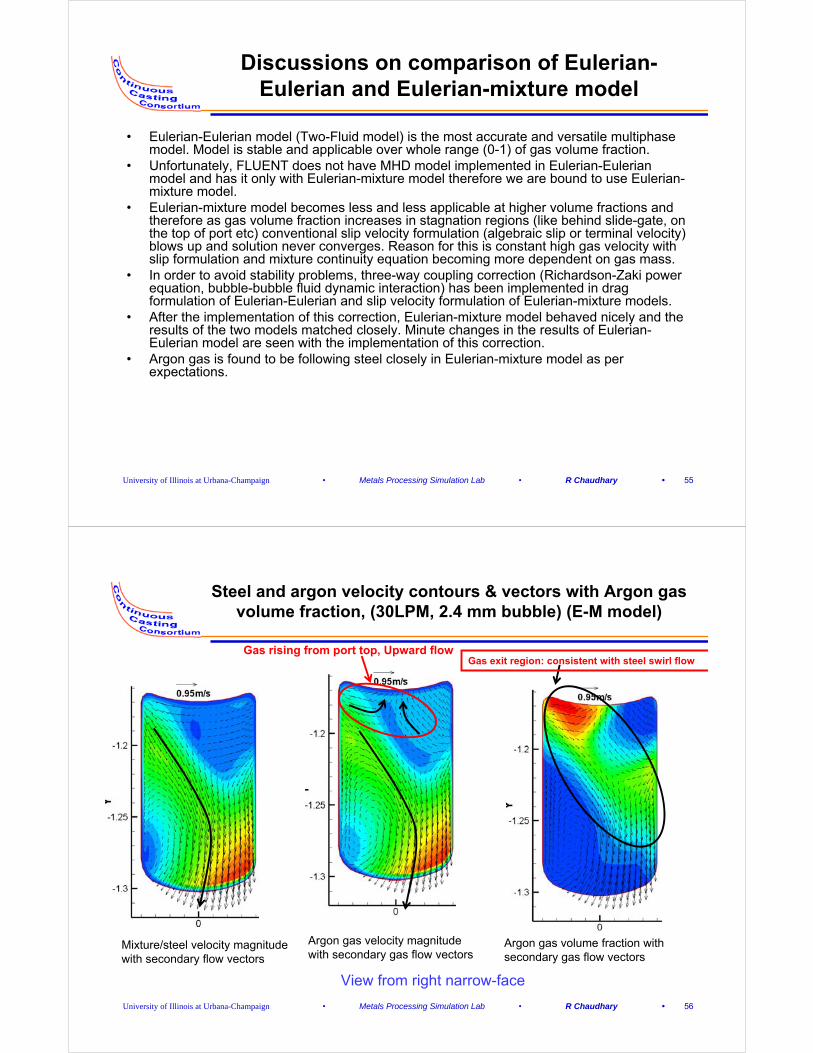
Discussions on comparison of Eulerian-Eulerian and Eulerian-mixture model
• Eulerian-Eulerian model (Two-Fluid model) is the most accurate and versatile multiphase model. Model is stable and applicable over whole range (0-1) of gas volume fraction.
• Unfortunately, FLUENT does not have MHD model implemented in Eulerian-Eulerian model and has it only with Eulerian-mixture model therefore we are bound to use Eulerian-mixture model.
• Eulerian-mixture model becomes less and less applicable at higher volume fractions and therefore as gas volume fraction increases in stagnation regions (like behind slide-gate, on the top of port etc) conventional slip velocity formulation (algebraic slip or terminal velocity) blows up and solution never converges. Reason for this is constant high gas velocity with slip formulation and mixture continuity equation becoming more dependent on gas mass.
• In order to avoid stability problems, three-way coupling correction (Richardson-Zaki power equation, bubble-bubble fluid dynamic interaction) has been implemented in drag formulation of Eulerian-Eulerian and slip velocity formulation of Eulerian-mixture models.
• After the implementation of this correction, Eulerian-mixture model behaved nicely and the results of the two models matched closely. Minute changes in the results of Eulerian-Eulerian model are seen with the implementation of this correction.
• Argon gas is found to be following steel closely in Eulerian-mixture model as per expectations.
University of Illinois at Urbana-Champaign • Metals Processing Simulation Lab • R Chaudhary • 56
Steel and argon velocity contours & vectors with Argon gas volume fraction, (30LPM, 2.4 mm bubble) (E-M model)
Mixture/steel velocity magnitude with secondary flow vectors
Argon gas velocity magnitude with secondary gas flow vectors
Argon gas volume fraction with secondary gas flow vectors
View from right narrow-face
Gas rising from port top, Upward flowGas exit region: consistent with steel swirl flow
University of Illinois at Urbana-Champaign • Metals Processing Simulation Lab • R Chaudhary • 57
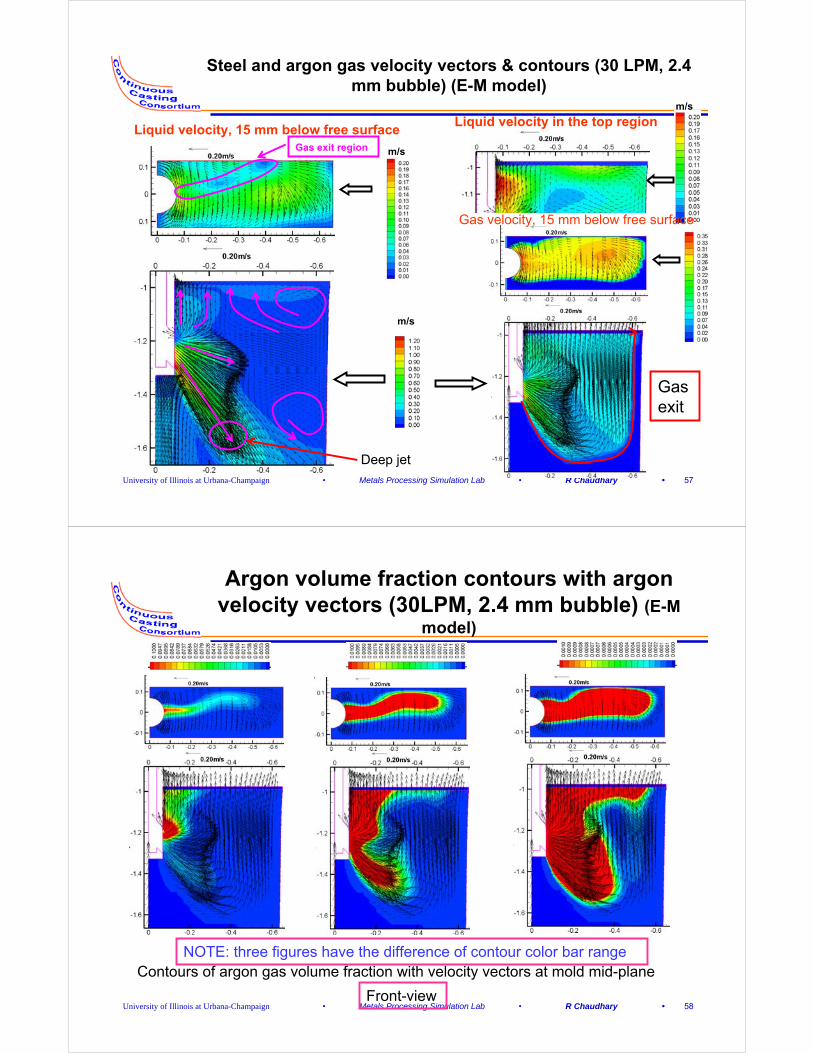
Steel and argon gas velocity vectors & contours (30 LPM, 2.4 mm bubble) (E-M model)
m/s
m/s
Liquid velocity in the top regionLiquid velocity, 15 mm below free surface
Gas velocity, 15 mm below free surface
m/s
Deep jet
Gas exit
Gas exit region
University of Illinois at Urbana-Champaign • Metals Processing Simulation Lab • R Chaudhary • 58
Argon volume fraction contours with argon velocity vectors (30LPM, 2.4 mm bubble) (E-M
model)
Contours of argon gas volume fraction with velocity vectors at mold mid-planeNOTE: three figures have the difference of contour color bar range
Front-view
University of Illinois at Urbana-Champaign • Metals Processing Simulation Lab • R Chaudhary • 59
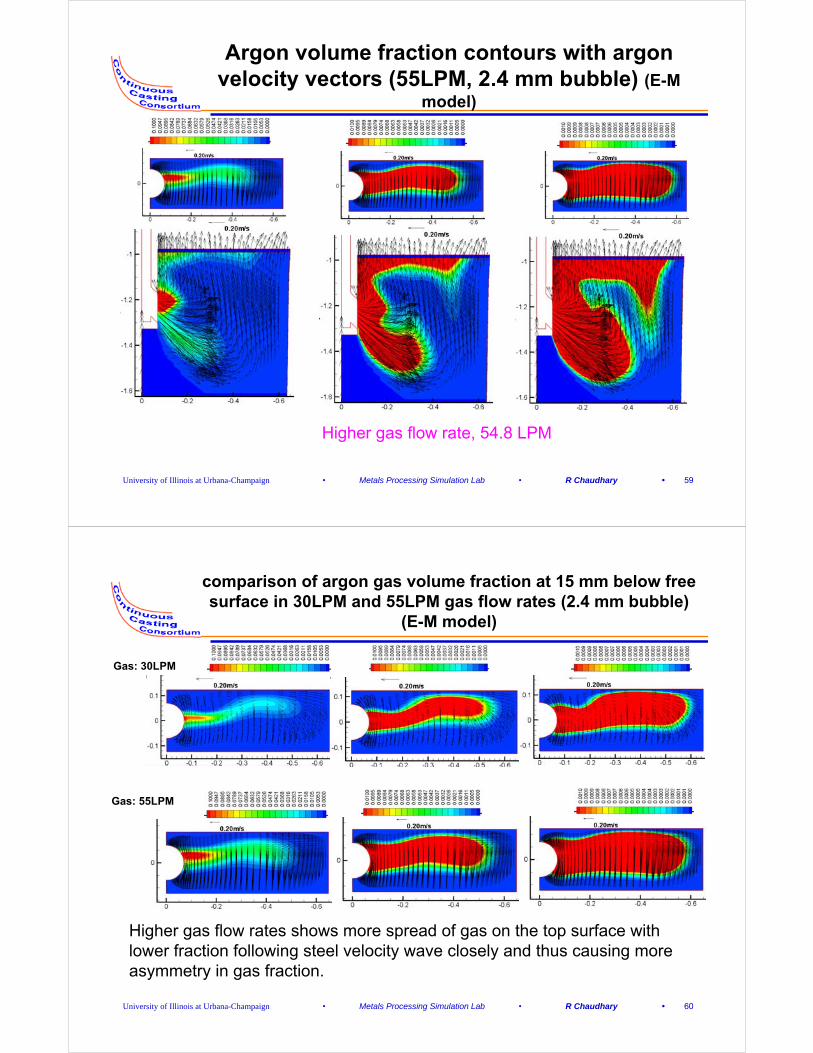
Argon volume fraction contours with argon velocity vectors (55LPM, 2.4 mm bubble) (E-M
model)
Higher gas flow rate, 54.8 LPM
University of Illinois at Urbana-Champaign • Metals Processing Simulation Lab • R Chaudhary • 60
comparison of argon gas volume fraction at 15 mm below free surface in 30LPM and 55LPM gas flow rates (2.4 mm bubble)
(E-M model)
Gas: 30LPM
Gas: 55LPM
Higher gas flow rates shows more spread of gas on the top surface with lower fraction following steel velocity wave closely and thus causing more asymmetry in gas fraction.
University of Illinois at Urbana-Champaign • Metals Processing Simulation Lab • R Chaudhary • 61
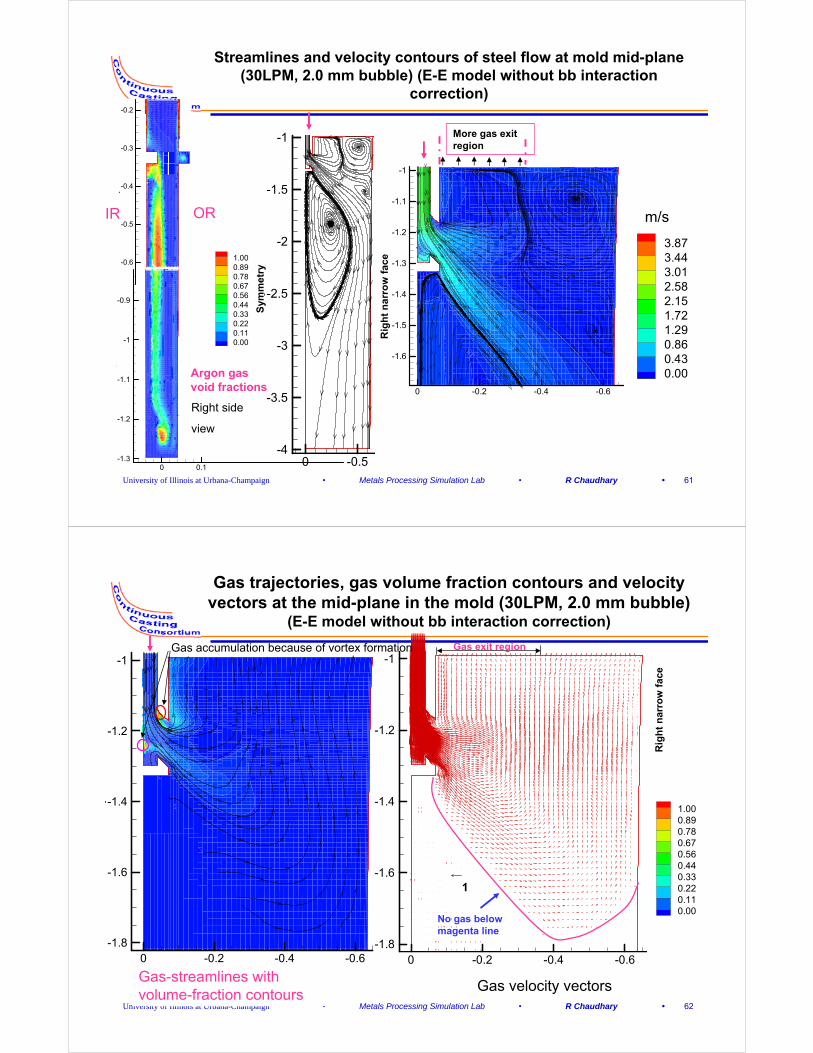
Streamlines and velocity contours of steel flow at mold mid-plane (30LPM, 2.0 mm bubble) (E-E model without bb interaction
correction)
More gas exit region
Y
-0.50-4
-3.5
-3
-2.5
-2
-1.5
-1
-0.6-0.4-0.20
-1.6
-1.5
-1.4
-1.3
-1.2
-1.1
-1
3.873.443.012.582.151.721.290.860.430.00
m/s
Rig
ht
nar
row
fac
e
Sym
met
ry
Y
0 0.1-1.3
-1.2
-1.1
-1
-0.9
IR OR
Y
-0.6
-0.5
-0.4
-0.3
-0.2
1.000.890.780.670.560.440.330.220.110.00
Argon gas void fractions
Right side
view
University of Illinois at Urbana-Champaign • Metals Processing Simulation Lab • R Chaudhary • 62
Gas trajectories, gas volume fraction contours and velocity vectors at the mid-plane in the mold (30LPM, 2.0 mm bubble)
(E-E model without bb interaction correction)
1.000.890.780.670.560.440.330.220.110.00
Y
-0.6-0.4-0.20-1.8
-1.6
-1.4
-1.2
-1
-0.6-0.4-0.20-1.8
-1.6
-1.4
-1.2
-1
1
Gas-streamlines with volume-fraction contours
Gas velocity vectors
Gas accumulation because of vortex formationR
igh
t n
arro
w f
ace
No gas below magenta line
Gas exit region
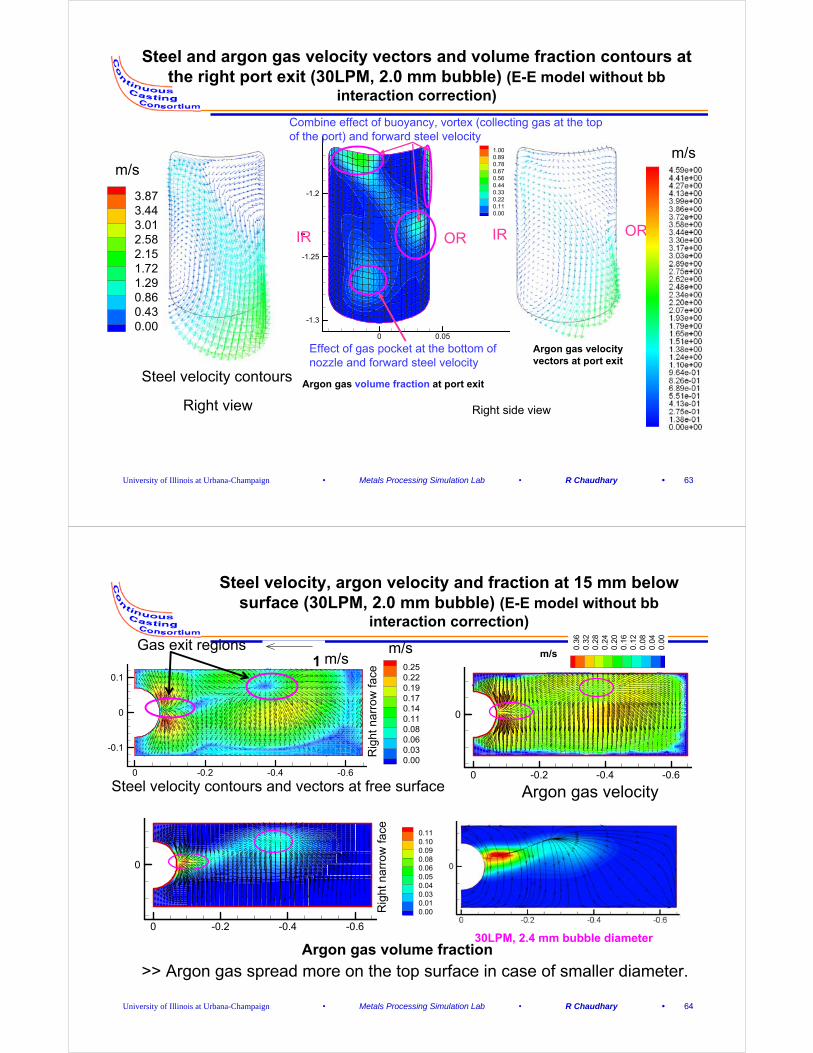
University of Illinois at Urbana-Champaign • Metals Processing Simulation Lab • R Chaudhary • 63
Steel and argon gas velocity vectors and volume fraction contours at the right port exit (30LPM, 2.0 mm bubble) (E-E model without bb
interaction correction)
Y
0 0.05
-1.3
-1.25
-1.2
m/s1.000.890.780.670.560.440.330.220.110.00
Argon gas volume fraction at port exit
Argon gas velocity vectors at port exit
IR OR
Right side view
IR OR
Combine effect of buoyancy, vortex (collecting gas at the top of the port) and forward steel velocity
Effect of gas pocket at the bottom of nozzle and forward steel velocity
Right view
Steel velocity contours
3.873.443.012.582.151.721.290.860.430.00
m/s
University of Illinois at Urbana-Champaign • Metals Processing Simulation Lab • R Chaudhary • 64
Steel velocity, argon velocity and fraction at 15 mm below surface (30LPM, 2.0 mm bubble) (E-E model without bb
interaction correction)
m/s
Steel velocity contours and vectors at free surface
Rig
ht n
arro
w fa
ce
Gas exit regions0.250.220.190.170.140.110.080.060.030.00
-0.6-0.4-0.20
-0.1
0
0.1
m/s
0.110.100.090.080.060.050.040.030.010.00
-0.6-0.4-0.20
0
1
Rig
ht n
arro
w fa
ce
m/s
0.3
60
.32
0.2
80
.24
0.2
00
.16
0.1
20
.08
0.0
40
.00
-0.6-0.4-0.20
0
Argon gas velocity
30LPM, 2.4 mm bubble diameter
>> Argon gas spread more on the top surface in case of smaller diameter.Argon gas volume fraction
Argon gas velocity
University of Illinois at Urbana-Champaign • Metals Processing Simulation Lab • R Chaudhary • 65
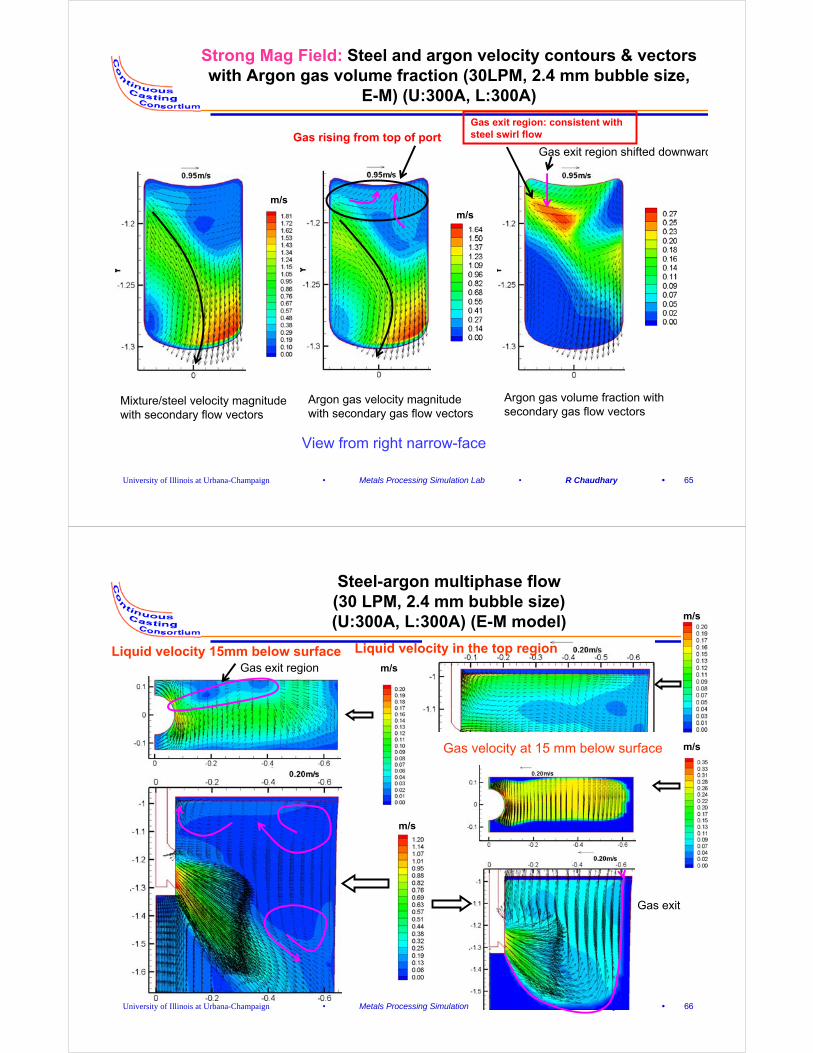
Strong Mag Field: Steel and argon velocity contours & vectors with Argon gas volume fraction (30LPM, 2.4 mm bubble size,
E-M) (U:300A, L:300A)
m/s
Mixture/steel velocity magnitude with secondary flow vectors
m/s
Argon gas velocity magnitude with secondary gas flow vectors
Argon gas volume fraction with secondary gas flow vectors
View from right narrow-face
Gas rising from top of portGas exit region: consistent with steel swirl flow
Gas exit region shifted downward
University of Illinois at Urbana-Champaign • Metals Processing Simulation Lab • R Chaudhary • 66
Steel-argon multiphase flow (30 LPM, 2.4 mm bubble size) (U:300A, L:300A) (E-M model)
Liquid velocity in the top regionLiquid velocity 15mm below surface
m/s
m/s
m/s
m/s
Gas velocity at 15 mm below surface
Gas exit region
Gas exit
University of Illinois at Urbana-Champaign • Metals Processing Simulation Lab • R Chaudhary • 67
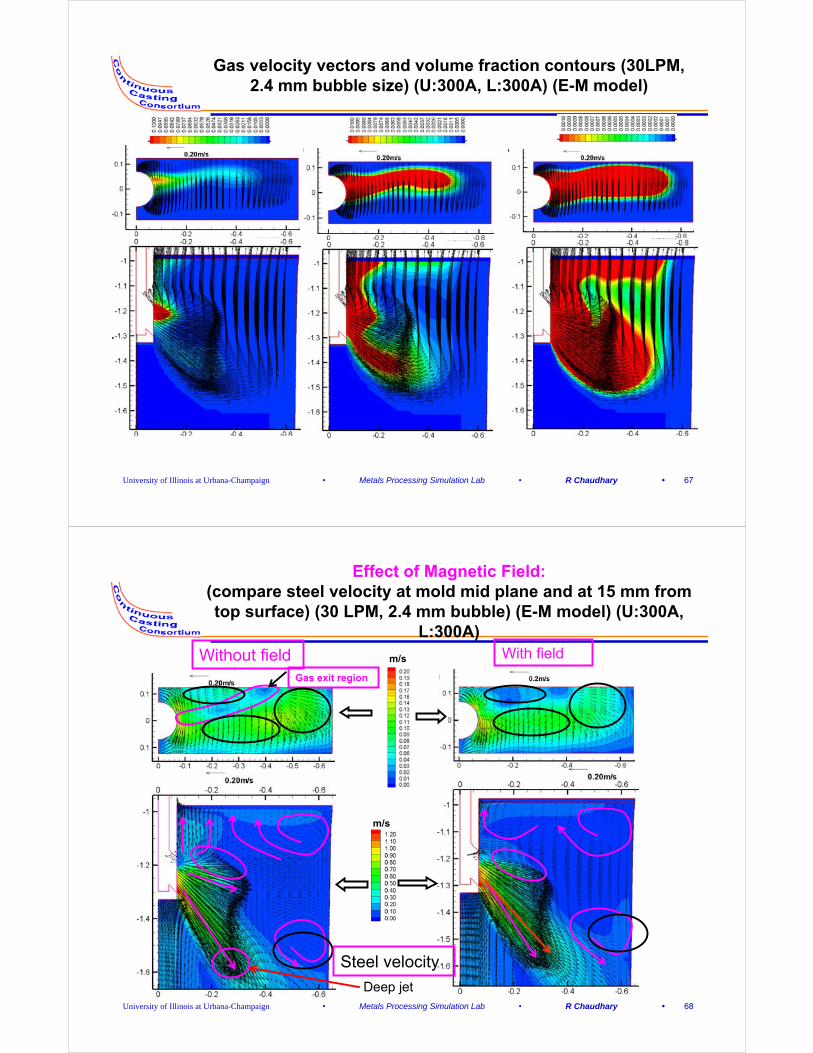
Gas velocity vectors and volume fraction contours (30LPM, 2.4 mm bubble size) (U:300A, L:300A) (E-M model)
University of Illinois at Urbana-Champaign • Metals Processing Simulation Lab • R Chaudhary • 68
Effect of Magnetic Field:(compare steel velocity at mold mid plane and at 15 mm from top surface) (30 LPM, 2.4 mm bubble) (E-M model) (U:300A,
L:300A)
Deep jet
m/sWithout field With field
Gas exit region
m/s
Steel velocity
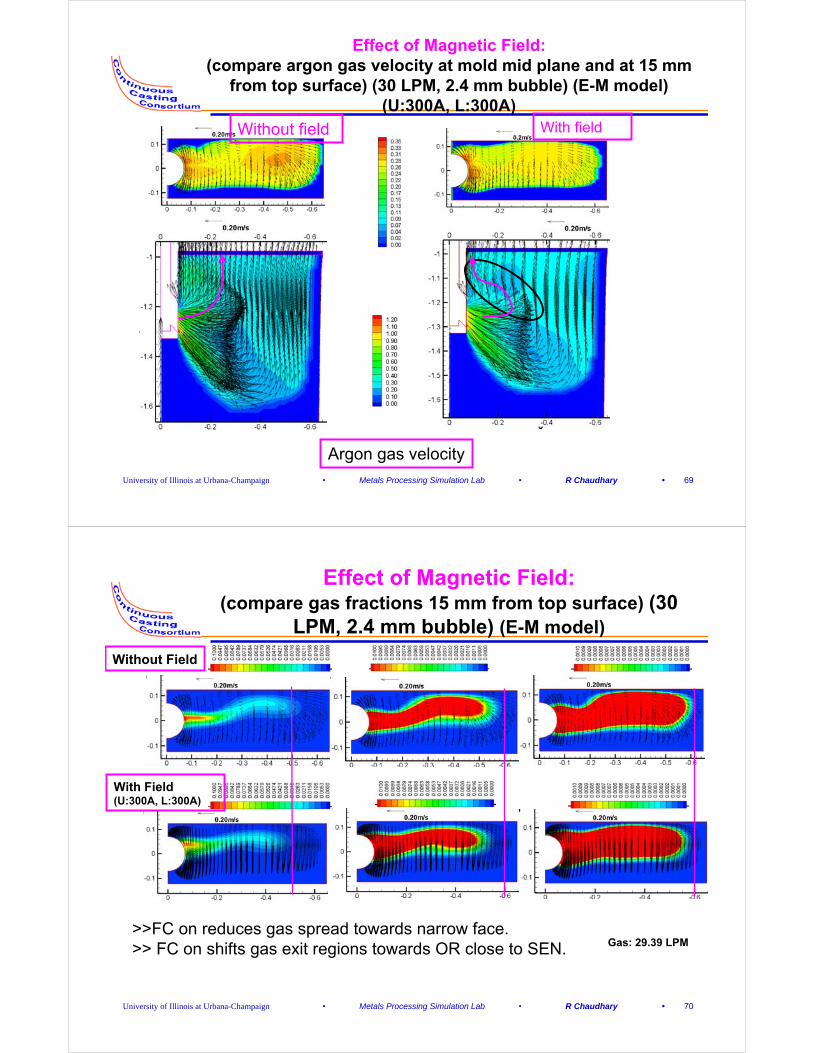
University of Illinois at Urbana-Champaign • Metals Processing Simulation Lab • R Chaudhary • 69
Effect of Magnetic Field:(compare argon gas velocity at mold mid plane and at 15 mm
from top surface) (30 LPM, 2.4 mm bubble) (E-M model) (U:300A, L:300A)
Argon gas velocity
Without field With field
University of Illinois at Urbana-Champaign • Metals Processing Simulation Lab • R Chaudhary • 70
Effect of Magnetic Field:(compare gas fractions 15 mm from top surface) (30
LPM, 2.4 mm bubble) (E-M model)
Gas: 29.39 LPM
With Field(U:300A, L:300A)
>>FC on reduces gas spread towards narrow face.>> FC on shifts gas exit regions towards OR close to SEN.
Without Field
University of Illinois at Urbana-Champaign • Metals Processing Simulation Lab • R Chaudhary • 71
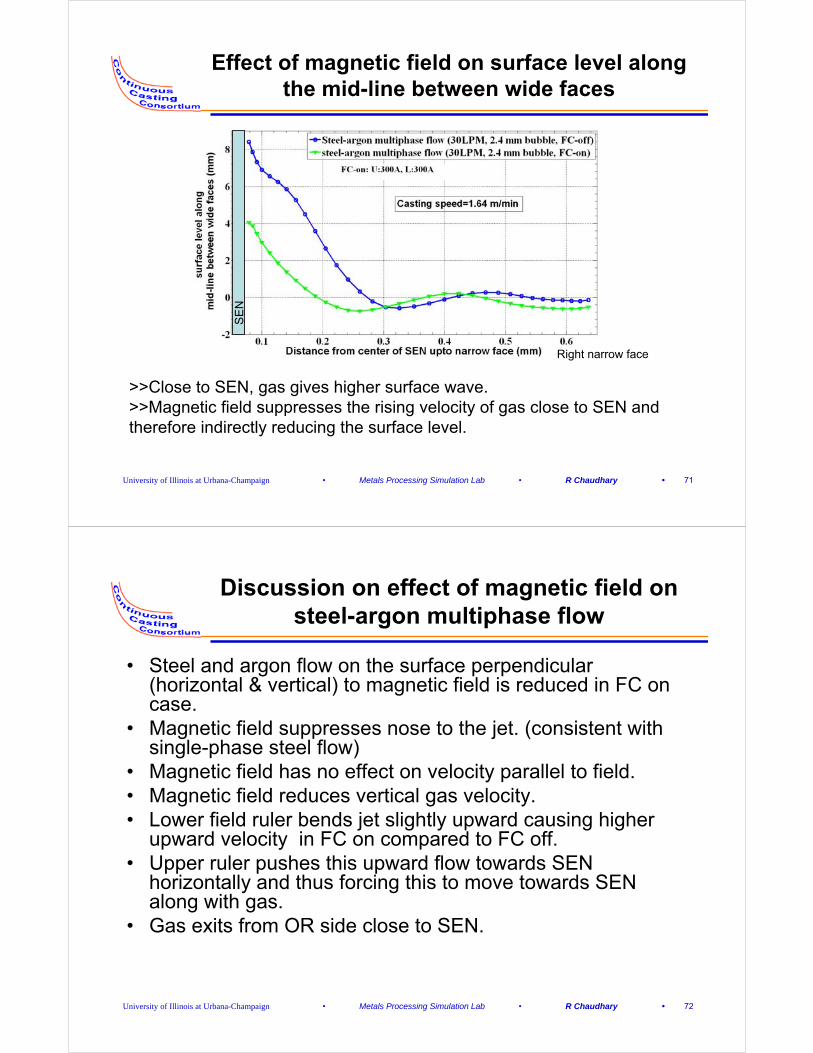
Effect of magnetic field on surface level along the mid-line between wide faces
Right narrow face
SE
N
>>Close to SEN, gas gives higher surface wave.>>Magnetic field suppresses the rising velocity of gas close to SEN and therefore indirectly reducing the surface level.
University of Illinois at Urbana-Champaign • Metals Processing Simulation Lab • R Chaudhary • 72
Discussion on effect of magnetic field on steel-argon multiphase flow
• Steel and argon flow on the surface perpendicular (horizontal & vertical) to magnetic field is reduced in FC on case.
• Magnetic field suppresses nose to the jet. (consistent with single-phase steel flow)
• Magnetic field has no effect on velocity parallel to field.• Magnetic field reduces vertical gas velocity.• Lower field ruler bends jet slightly upward causing higher
upward velocity in FC on compared to FC off. • Upper ruler pushes this upward flow towards SEN
horizontally and thus forcing this to move towards SEN along with gas.
• Gas exits from OR side close to SEN.
University of Illinois at Urbana-Champaign • Metals Processing Simulation Lab • R Chaudhary • 73
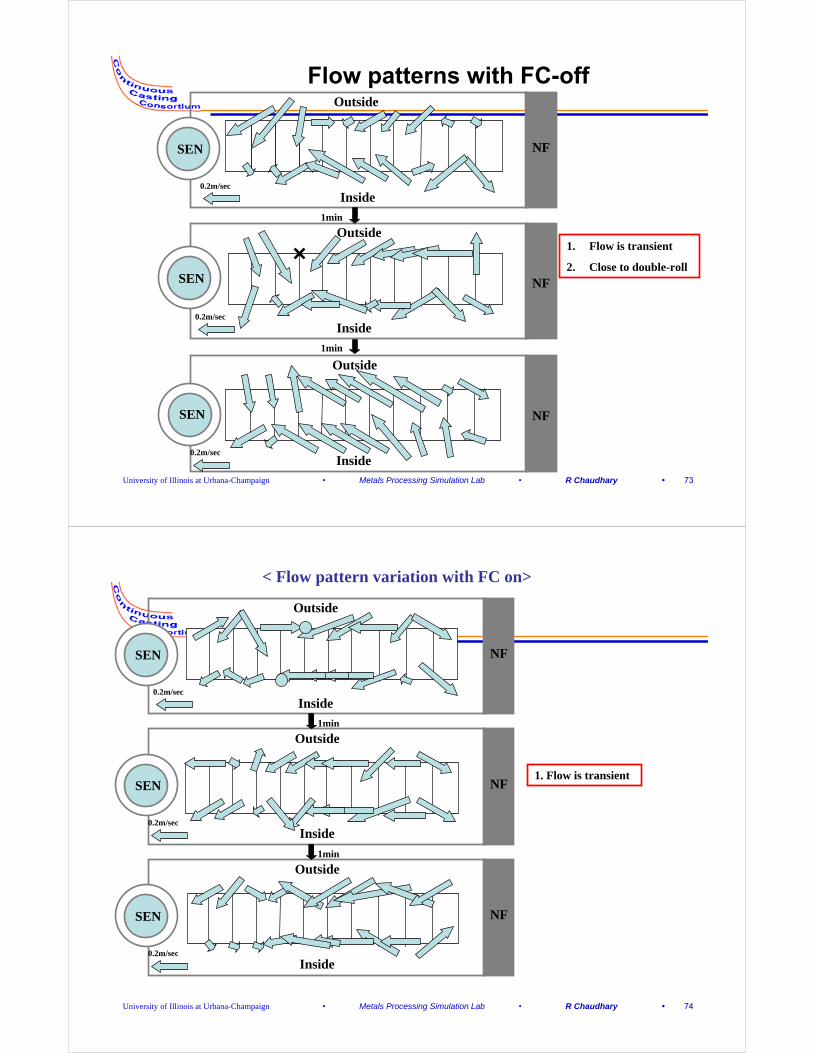
1. Flow is transient
2. Close to double-roll
Outside
Inside
NFSEN
Inside
Outside
NFSEN
Outside
Inside
NFSEN
0.2m/sec
0.2m/sec
0.2m/sec
1min
1min
Flow patterns with FC-off
University of Illinois at Urbana-Champaign • Metals Processing Simulation Lab • R Chaudhary • 74
NFSEN
Outside
Inside0.2m/sec
NFSEN
Inside
Outside
0.2m/sec
NFSEN
Outside
Inside0.2m/sec
< Flow pattern variation with FC on>
1. Flow is transient
1min
1min
University of Illinois at Urbana-Champaign • Metals Processing Simulation Lab • R Chaudhary • 75
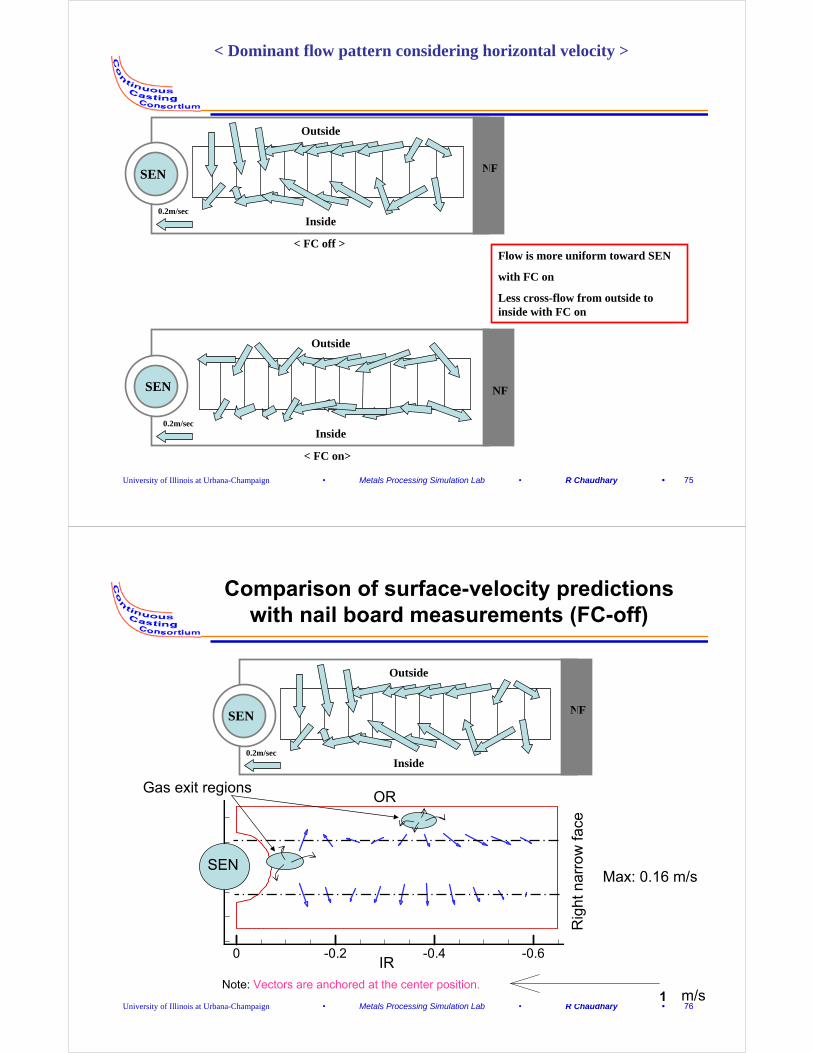
Flow is more uniform toward SEN
with FC on
Less cross-flow from outside to inside with FC on
< Dominant flow pattern considering horizontal velocity >
Inside
Outside
0.2m/sec
< FC off >
NFSEN
Inside
Outside
< FC on>
SEN NF
0.2m/sec
University of Illinois at Urbana-Champaign • Metals Processing Simulation Lab • R Chaudhary • 76
Comparison of surface-velocity predictions with nail board measurements (FC-off)
Inside
Outside
0.2m/sec
NFSEN
Rig
ht n
arro
w fa
ce
m/s
-0.6-0.4-0.20
0
IR
OR
1
Max: 0.16 m/sSEN
Note: Vectors are anchored at the center position.
Gas exit regions
University of Illinois at Urbana-Champaign • Metals Processing Simulation Lab • R Chaudhary • 77
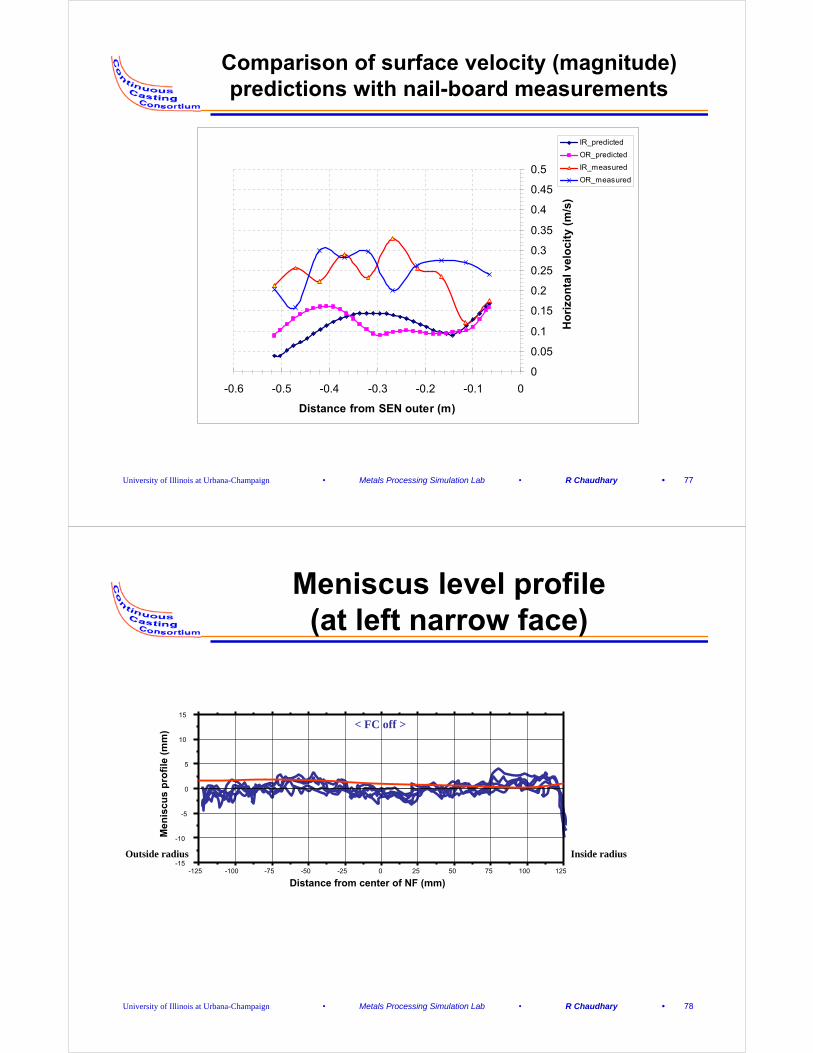
Comparison of surface velocity (magnitude) predictions with nail-board measurements
0
0.05
0.1
0.15
0.2
0.25
0.3
0.35
0.4
0.45
0.5
-0.6 -0.5 -0.4 -0.3 -0.2 -0.1 0
Distance from SEN outer (m)
Ho
rizo
nta
l vel
oci
ty (
m/s
)
IR_predicted
OR_predicted
IR_measured
OR_measured
University of Illinois at Urbana-Champaign • Metals Processing Simulation Lab • R Chaudhary • 78
Meniscus level profile (at left narrow face)
< FC off >
Inside radiusOutside radius
-125 -100 -75 -50 -25 0 25 50 75 100 125-15
-10
-5
0
5
10
15
Men
iscu
s p
rofi
le (
mm
)
Distance from center of NF (mm)
University of Illinois at Urbana-Champaign • Metals Processing Simulation Lab • R Chaudhary • 79
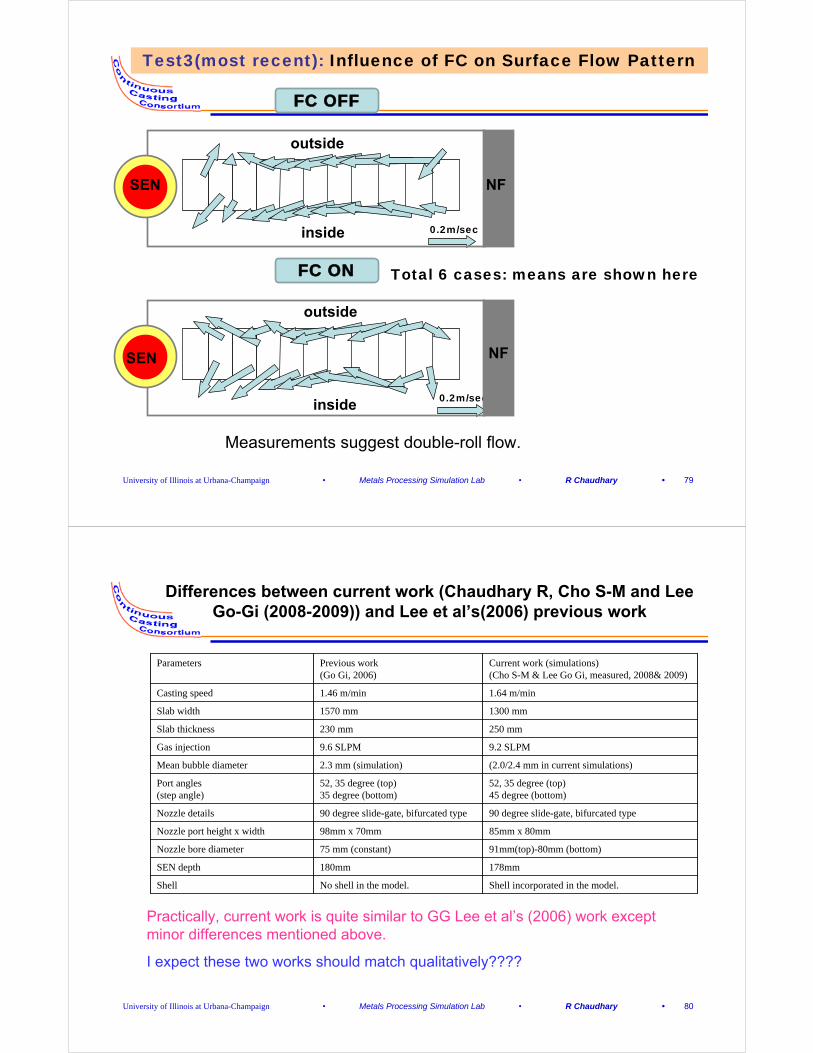
Test3(most recent): Influence of FC on Surface Flow Pattern
FC OFF
FC ON Total 6 cases: means are shown here
0.2m/sec
SEN
outside
inside
NF
0.2m/sec
NFSEN
outside
inside
Measurements suggest double-roll flow.
University of Illinois at Urbana-Champaign • Metals Processing Simulation Lab • R Chaudhary • 80
Differences between current work (Chaudhary R, Cho S-M and Lee Go-Gi (2008-2009)) and Lee et al’s(2006) previous work
Shell incorporated in the model.No shell in the model.Shell
178mm180mmSEN depth
91mm(top)-80mm (bottom)75 mm (constant)Nozzle bore diameter
85mm x 80mm98mm x 70mmNozzle port height x width
90 degree slide-gate, bifurcated type90 degree slide-gate, bifurcated typeNozzle details
52, 35 degree (top)45 degree (bottom)
52, 35 degree (top)35 degree (bottom)
Port angles (step angle)
(2.0/2.4 mm in current simulations)2.3 mm (simulation)Mean bubble diameter
9.2 SLPM9.6 SLPMGas injection
250 mm230 mmSlab thickness
1300 mm1570 mmSlab width
1.64 m/min1.46 m/minCasting speed
Current work (simulations)(Cho S-M & Lee Go Gi, measured, 2008& 2009)
Previous work(Go Gi, 2006)
Parameters
Practically, current work is quite similar to GG Lee et al’s (2006) work except minor differences mentioned above.
I expect these two works should match qualitatively????
University of Illinois at Urbana-Champaign • Metals Processing Simulation Lab • R Chaudhary • 81
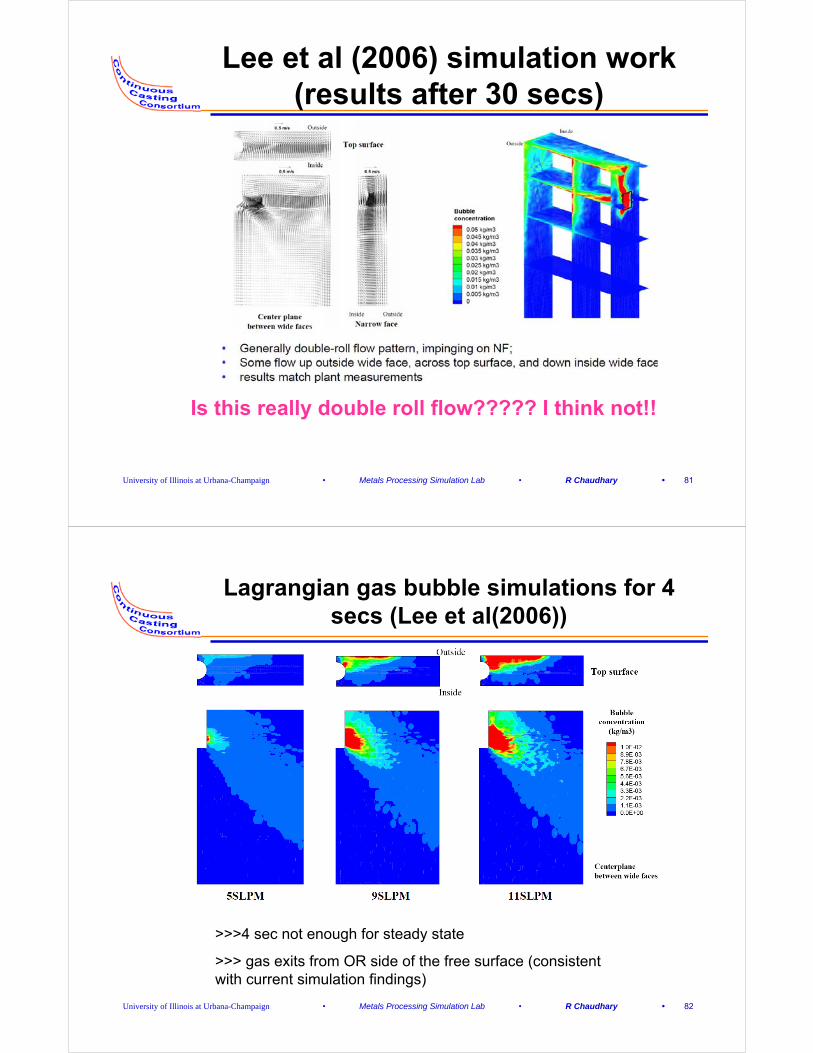
Lee et al (2006) simulation work (results after 30 secs)
Is this really double roll flow????? I think not!!
University of Illinois at Urbana-Champaign • Metals Processing Simulation Lab • R Chaudhary • 82
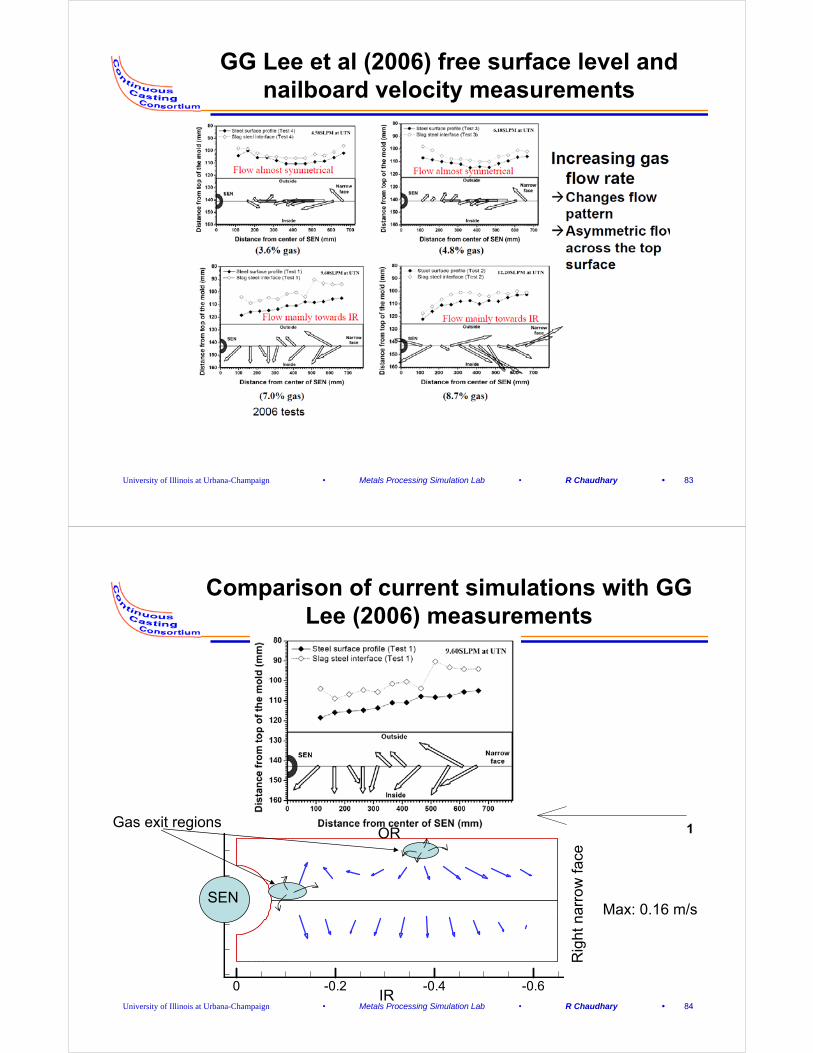
Lagrangian gas bubble simulations for 4 secs (Lee et al(2006))
>>>4 sec not enough for steady state
>>> gas exits from OR side of the free surface (consistent with current simulation findings)
University of Illinois at Urbana-Champaign • Metals Processing Simulation Lab • R Chaudhary • 83
GG Lee et al (2006) free surface level and nailboard velocity measurements
University of Illinois at Urbana-Champaign • Metals Processing Simulation Lab • R Chaudhary • 84
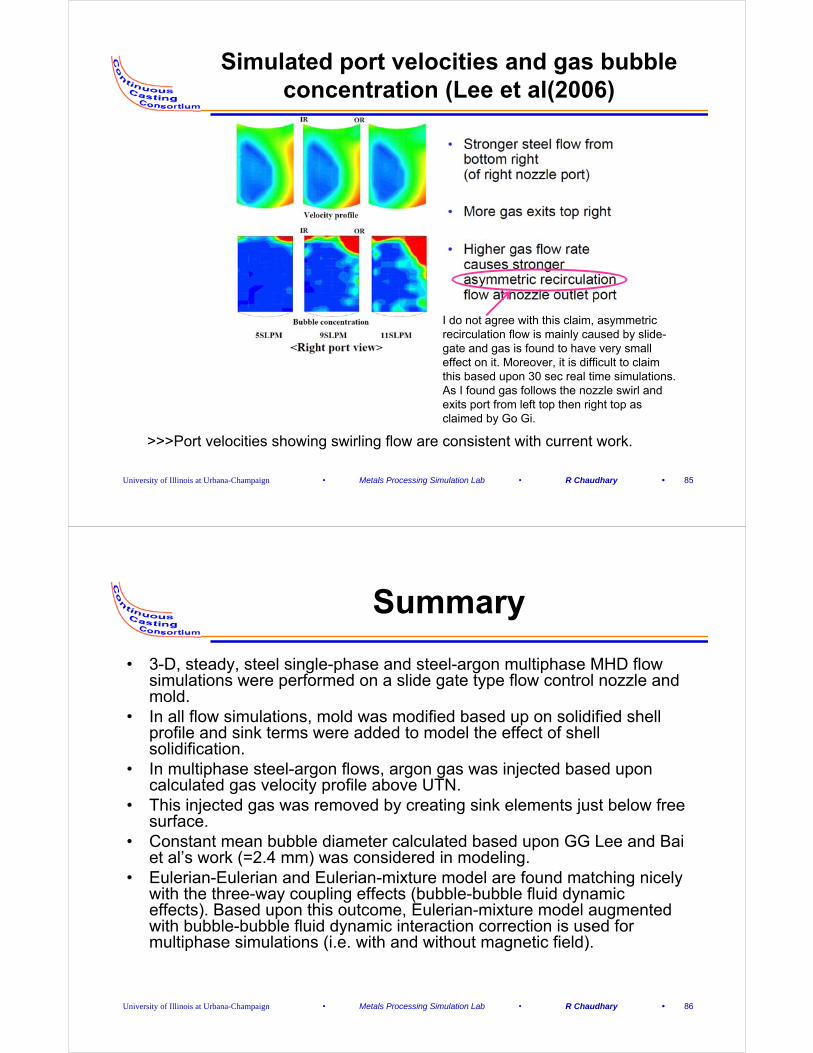
Comparison of current simulations with GG Lee (2006) measurements
Rig
ht n
arro
w fa
ce
-0.6-0.4-0.20
0
IR
OR 1
Max: 0.16 m/sSEN
Gas exit regions
University of Illinois at Urbana-Champaign • Metals Processing Simulation Lab • R Chaudhary • 85
Simulated port velocities and gas bubble concentration (Lee et al(2006)
>>>Port velocities showing swirling flow are consistent with current work.
I do not agree with this claim, asymmetric recirculation flow is mainly caused by slide-gate and gas is found to have very small effect on it. Moreover, it is difficult to claim this based upon 30 sec real time simulations. As I found gas follows the nozzle swirl and exits port from left top then right top as claimed by Go Gi.
University of Illinois at Urbana-Champaign • Metals Processing Simulation Lab • R Chaudhary • 86
Summary
• 3-D, steady, steel single-phase and steel-argon multiphase MHD flow simulations were performed on a slide gate type flow control nozzle and mold.
• In all flow simulations, mold was modified based up on solidified shell profile and sink terms were added to model the effect of shell solidification.
• In multiphase steel-argon flows, argon gas was injected based upon calculated gas velocity profile above UTN.
• This injected gas was removed by creating sink elements just below free surface.
• Constant mean bubble diameter calculated based upon GG Lee and Bai et al’s work (=2.4 mm) was considered in modeling.
• Eulerian-Eulerian and Eulerian-mixture model are found matching nicely with the three-way coupling effects (bubble-bubble fluid dynamic effects). Based upon this outcome, Eulerian-mixture model augmented with bubble-bubble fluid dynamic interaction correction is used for multiphase simulations (i.e. with and without magnetic field).
University of Illinois at Urbana-Champaign • Metals Processing Simulation Lab • R Chaudhary • 87
Conclusions on single-phase steel flow
• Slide gate causes swirl in the nozzle bottom and therefore jet gives higher velocity at the bottom right of the port directed towards inner radius. With stopper rod type SEN, flow shows front and back symmetry with more flow coming out from nozzle bottom.
• Slide gate also causes nose to the jet with the swirl. With the nose and steeper jet, flow is directed downward and jet looses momentum faster and thus giving weak upward reverse surface flow towards SEN after hitting narrow face. Reporting of nose in the jet is consistent with the findings of Thomas et al (1999) in 90 degree slide-gate nozzle.
• This weak upward flow in the upper roll from narrow face to SEN fights upward flow from around jet close to SEN and ends up causing two rolls in the upper region. (partially double-roll flow)
• Port with 35(B):35(TB):52(TT) angles showed stronger swirling flow with more stagnation region at the bottom of the SEN well and smaller reverse flow zone at the top of the port.
• With magnetic field, upper magnetic ruler kills nose and lower ruler bends the jet towards upward and thus promoting classic double roll flow.
University of Illinois at Urbana-Champaign • Metals Processing Simulation Lab • R Chaudhary • 88
Conclusions on Multiphase flow (steel-argon flow)
• Argon gas collects in stagnation regions behind slide-gate, and on the top of port. More gas exits from the top of the port thus buoyancy effect are evident.
• Argon gas has minor effects on high speed steel flow in the nozzle. E-E and E-M models match nicely except behind the slide-gate where gas collects.
• In mold, maximum gas comes out from OR side close to SEN. As expected, buoyancy force is high in steel-argon system which forces gas to leave mold domain through the shortest path. Remaining gas flows with steel momentum because of drag force towards OR and exit mold mid-way the SEN and narrow face towards OR. On the top surface, mixture/steel flow is directed away from the gas exit regions (mostly from OR side towards IR). This finding is consistent with Go Gi’s (2006) measurements and simulations on step-angle slide gate nozzle.
University of Illinois at Urbana-Champaign • Metals Processing Simulation Lab • R Chaudhary • 89
Conclusions on effect of magnetic field on multiphase steel-argon flow
• With magnetic field, more gas exits closer to SEN towards OR due to decelerating effects of Lorentz force on the jet.
University of Illinois at Urbana-Champaign • Metals Processing Simulation Lab • R Chaudhary • 90
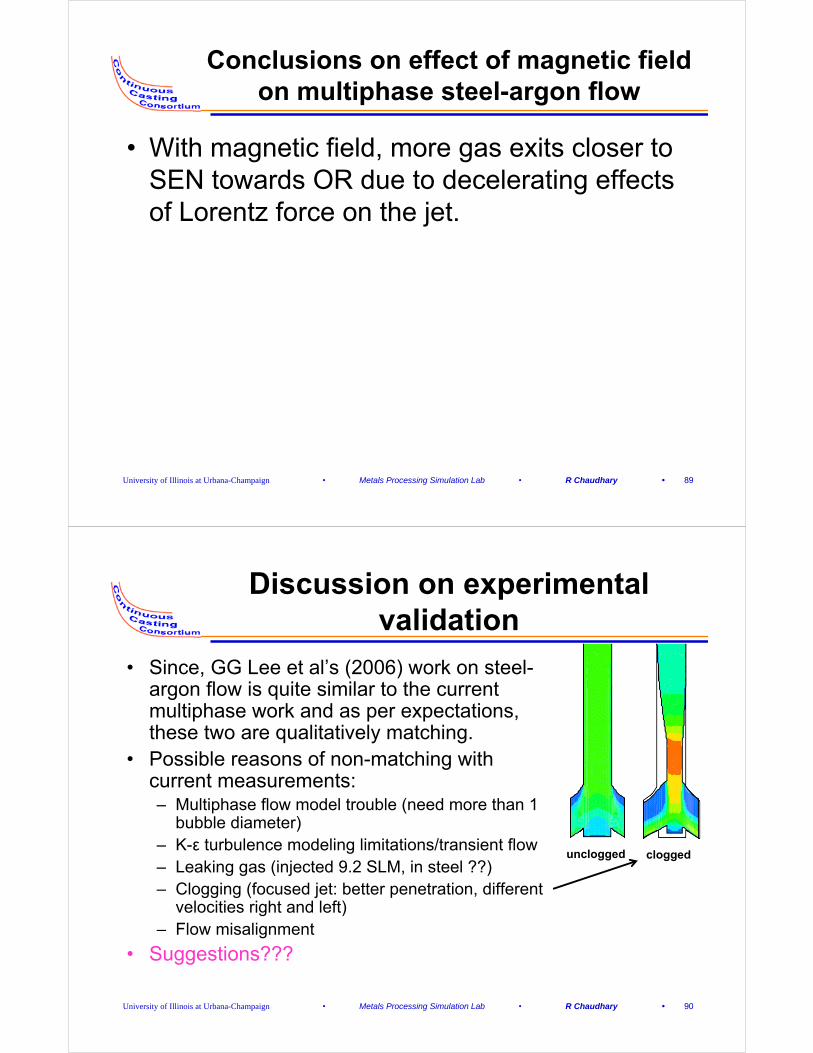
Discussion on experimental validation
• Since, GG Lee et al’s (2006) work on steel-argon flow is quite similar to the current multiphase work and as per expectations, these two are qualitatively matching.
• Possible reasons of non-matching with current measurements:– Multiphase flow model trouble (need more than 1
bubble diameter)– K-ε turbulence modeling limitations/transient flow– Leaking gas (injected 9.2 SLM, in steel ??)– Clogging (focused jet: better penetration, different
velocities right and left)– Flow misalignment
• Suggestions???
unclogged clogged

University of Illinois at Urbana-Champaign • Metals Processing Simulation Lab • R Chaudhary • 91
Acknowledgements
• Continuous Casting Consortium Members(ABB, Arcelor-Mittal, Baosteel, Corus, Delavan/Goodrich, LWB Refractories, Nucor, Nippon Steel, Postech, Steel Dynamics, ANSYS-Fluent)
• National Center for Supercomputing Applications (NCSA) at UIUC
• Hyun Na Bae, Hyoung Jun Lee from POSTECH, South Korea.
• Lance Hibbeler, Varun Singh and Other Graduate students at Metal Processing Lab.


![Phase transitions of harzburgite and buckled slab under ... · Chinese Academy of Geological Sciences, Beijing, China [1] Phase relations in harzburgite have been determined between](https://img.pdfslide.us/doc/110x75/5f05ada67e708231d41427ea/phase-transitions-of-harzburgite-and-buckled-slab-under-chinese-academy-of-geological.jpg)