Embed Size (px)
Citation preview
4
Electromagnetic Absorption and Emission byAtoms and Molecules
4.1 Photochemistry
In a photochemical process a molecule denoted AB is promotedinto a usually shortlived intermediate excited (highly reactive) state AB∗. Possible processes for themolecule to attaining thermochemical equilibrium are
photolysis AB∗ → A + B (4.1)
ionization AB∗ → AB+ + e (4.2)
luminescence AB∗ → AB + hν′ (4.3)
intramolecular transfer AB∗ + AB → AB + AB∗∗ (4.4)
intermolecular transfer AB∗ +M → AB +M∗ (4.5)
collisional deactivation AB∗ +M → AB +M (4.6)
photochemical reaction AB∗ +M → C1 + C2 (4.7)
where B, B1, B2, C1, C2 and M denote other molecules. Following the absorptionof a photon there is the possibility that more than one pathway may occur. For eachprocess this is represented by the quantum yield which denotes the probability of aprocesses occurring when a photon is absorbed. The sum of thequantum yields ofall process is unity. If a single process occurs then the quantum yield for that processis one.
The bond energies of several atmospheric gases whose are shown in Table 4.1along with the photon wavelength that has the equivalent energy of the bond. Forphotolysis the photon must have at least enough energy to break a bond. The lowestenergies capable of producing photolysis occur in the visible. Only solar photons areavailable in sufficient number to generate significant atmospheric photolysis.
Photolysis is usually treated as a first order process so thatthe rate at which amolecule is split into fragments is the product of a photolysis frequency,J, and theconcentration of the molecule. Hence the rate of loss of a molecule A is expressed
Loss Rate=d [A]
dt= J [A]
where [A] denotes the concentration in molecules per unit volume. The photolysisrate is calculated by integrating over the portion of the solar spectrum whose photons
81

82 An Atmospheric Radiative Transfer Primer
TABLE 4.1Bond Energies of Some Atmospheric Gases
Bond Energy Equivalent Photon WavelengthkJ mol−1 nm
C≡C 812 147.3C=O 728 164.3C=C 615 194.5O=O 498 240.2H-H 436 274.4H-O 464 257.8C-H 414 289.0C-O 360 332.3C-C 347 344.7
Cl-Cl 244 490.3F-F 158 757.1
TABLE 4.2Principal Photolitic and Associated Reactions in the Earth’sAtmosphere
Reaction Location CommentO2 + hν→ O+O stratosphere the creation of ozoneO3 + hν→ O2 +O stratosphere the balance of atomic oxy-
gen and ozoneO3 + hν→ O2 +O1D
O1D + H2O→ 2OHtroposphere the creation of the hydroxyl
radicalNO2 + hν→ NO+O
O+O2 + N2→ O3 + N2troposphere the creation of ozone
have sufficient energy to dissociate the molecule.
J =∫ λ2
λ1
q(λ)σ(λ)ǫ(λ) dλ
whereq(λ) is the photon flux,σ(λ) is the absorption cross-section,ǫ(λ) is the quan-tum yield. All the terms inside the integral are dependent onwavelength but addi-tionally the absorption cross-section is dependent on pressure and temperature; thequantum yield is dependent on temperature. The photon flux isdependent not juston the solar input but on the absorption and scattering abovethe level of interest and,in some case, on the light reflected back from the atmosphere/surface below.
Ionization becomes possible at shorter wavelengths e.g. NOat 135 nm.
The principal photolysis reactions are shown in Table 4.2.

Electromagnetic Interaction with Atoms and Molecules 83
4.2 Atomic Absorption
In general a molecule may carry translational, electronic,vibrational and rotationalenergy. As atoms in a simple monatomic gas cannot vibrate or rotate they can onlycarry translational energy or electronic excitation.
4.2.1 The Bohr Atom
To understand how light interacts with matter we must first recall the atomic descrip-tion. In the case of the hydrogen atomBohr [1913] presented a simple picture ofa single electron of massm and charge−e moving in a circular orbit about a posi-tively charged nucleus of massM (≫ m) and charge+e. Balancing the forces on theelectron gives
mv2
r=
ke2
r(4.8)
wherer is the radius of the electron’s orbit,v its velocity andk = 1/4πǫ0. Bohrassumed that the angular momentum of the electron was quantized such that
mvr =nh2π= n~ (4.9)
wheren is an integer≥ 1, h is Planck’s constant and~ = h/2π. The quantization ofangular momentum means that an electron is not free to move inany orbit but mustadopt given quantized orbits whose radii are given by combining equations 4.8 and4.9, i.e.
r = n2 h2πme2k
(4.10)
In consequence the total energy of the electron, given by thesum of its electrostaticpotential energy and its kinetic energy is also quantized, i.e.
Etot = Epot + Ekin (4.11)
= −ke2
r+ k
e2
2r(4.12)
= −me4k2
2n2~2(4.13)
The lowest energy state is the ground state of the atom. When the atom gainsenergy through the absorption of a photon the electron movesto a higher energylevel and the atom is said to be in an excited state. For energyto be conserved thefrequency of light,ν, absorbed by atom is
hν = Ei − E f (4.14)
whereEi is the total energy in the initial orbit andE f is the total energy in the finalorbit. As Ei andE f can only have specific values their differences are can also only

84 An Atmospheric Radiative Transfer Primer
higher energy
state
absorption emission
lower
energy
state
higher energy
state
lower
energy
state
photon
photon
FIGURE 4.1Electronic transitions occur through absorption or emission of a photon whose en-ergy matches the change in energy state of the atom.
have certain values. These quantized values result in the emitted light having discretefrequencies called an emission spectrum. Conversely an atom is absorbs photons atspecific frequencies corresponding to the energy change in exciting the atom from thelower to the higher energy sate. Figure 4.1 summarises the processes of absorptionand emission.
4.2.2 Wave Functions
The Bohr model of an atom has long been superseded by a description that uses wavemechanics. In this approach the probability of finding the electron at coordinate(r , t)[= (r, θ, φ, t)] is proportional to the squared magnitude of the wave function,ψ(r , t). The wave function is a solution of Schrodinger’s equation
− ~2m∇2ψ + Vψ = i~
∂ψ
∂t(4.15)
whereV is the potential energy of the electron. The solution to thisequation for thehydrogen atom is
ψn = f
(
ra0
)
exp
(
− rna0
)
(4.16)
wherer is the radial distance from the nucleus,f(
ra0
)
is a power series,a0 is aconstant andn is the principal quantum number. The value ofn is an integer in therange [1,∞]. The principal quantum number governs the approximate energy andsize of the orbital. The complete state of the atom is described by a further threequantum numbersl, m ands.
The orbital quantum numberl determines the shape of the orbital and so the angu-lar momentum of the electron. It can only take integer valuesup to one less than theprincipal quantum number.
The magnetic quantum numberm denotes the behaviour of the electron when theatom is in a magnetic field. It can only take integral values from - l to+ l.
The spin quantum numbers measure the angular momentum an electron pos-sesses. It has magnitude 1/2.
This is an example of what is called aselection rule. Transitions that break aselection rule are calledforbidden transitions.
Electromagnetic Interaction with Atoms and Molecules 85
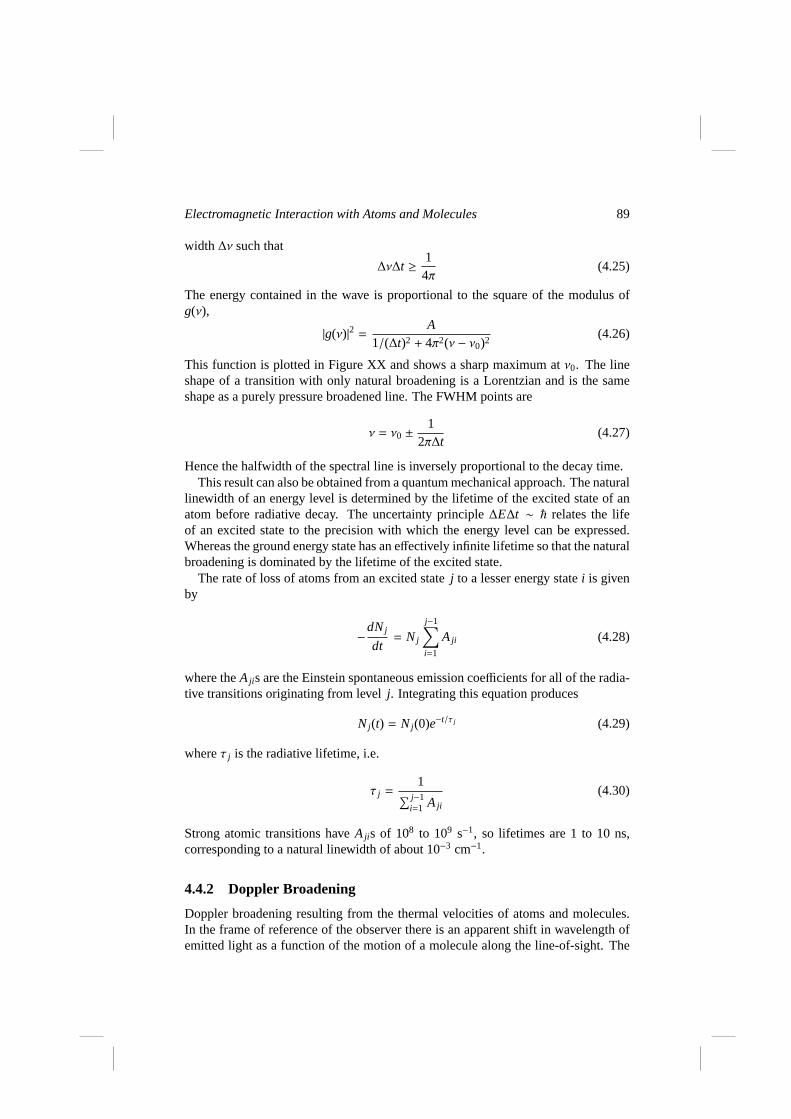
TABLE 4.3Atomic Quantum Numbers
Name Designation ValuesPrincipal n 1,2,3 . . .Orbital l 0, . . . (n − 2), (n − 1)Magnetic m −l,−(l − 1), . . . ,0, . . . , (l − 1), lSpin s 1
2
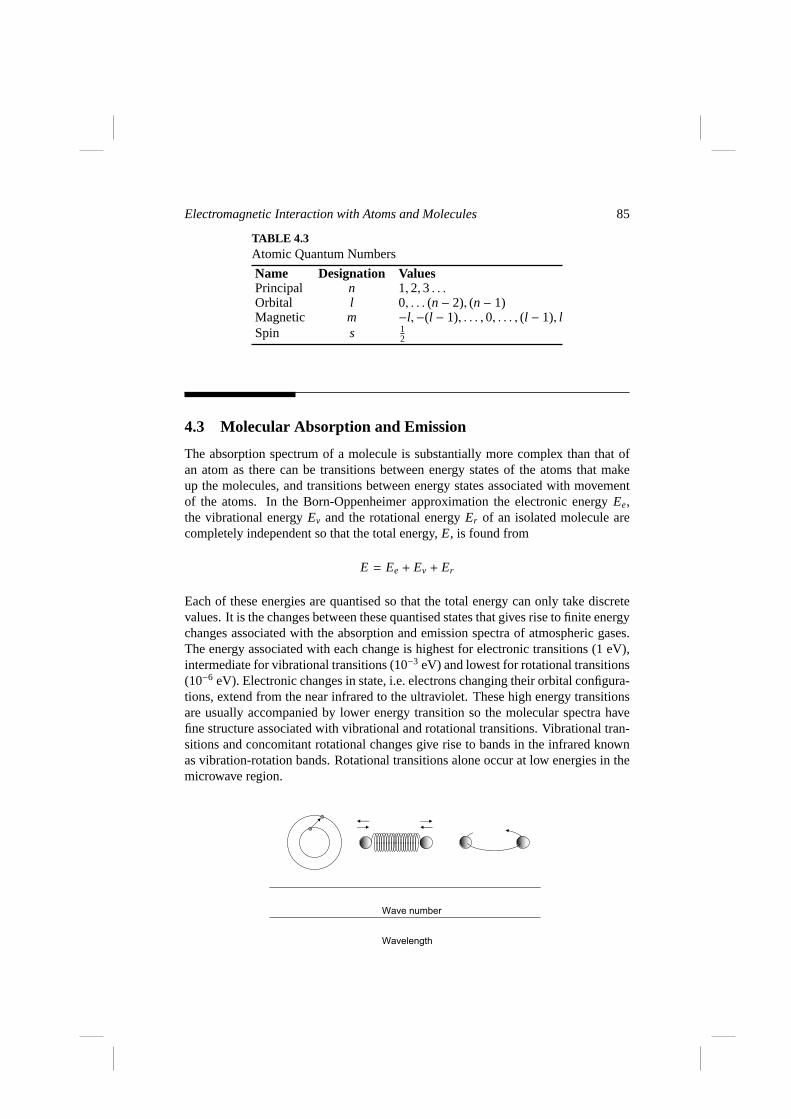
4.3 Molecular Absorption and Emission
The absorption spectrum of a molecule is substantially morecomplex than that ofan atom as there can be transitions between energy states of the atoms that makeup the molecules, and transitions between energy states associated with movementof the atoms. In the Born-Oppenheimer approximation the electronic energyEe,the vibrational energyEv and the rotational energyEr of an isolated molecule arecompletely independent so that the total energy,E, is found from
E = Ee + Ev + Er
Each of these energies are quantised so that the total energycan only take discretevalues. It is the changes between these quantised states that gives rise to finite energychanges associated with the absorption and emission spectra of atmospheric gases.The energy associated with each change is highest for electronic transitions (1 eV),intermediate for vibrational transitions (10−3 eV) and lowest for rotational transitions(10−6 eV). Electronic changes in state, i.e. electrons changing their orbital configura-tions, extend from the near infrared to the ultraviolet. These high energy transitionsare usually accompanied by lower energy transition so the molecular spectra havefine structure associated with vibrational and rotational transitions. Vibrational tran-sitions and concomitant rotational changes give rise to bands in the infrared knownas vibration-rotation bands. Rotational transitions alone occur at low energies in themicrowave region.
Wavelength
Wave number

86 An Atmospheric Radiative Transfer Primer
TABLE 4.4Types of Rotator
Moments of Inertia ExamplesLinear Molecules
IA = 0, IB = IC HCl, OCS, CO2, N2O, all di-atomic molecules
Symmetric TopsProlateIB = IC > IA, IA , 0 CH3F, NH3, CH3Cl, CF3Cl
OblateIB = IC < IA, IA , 0 BCl3Spherical Tops
IA = IB = IC CH4Asymmetric Tops
IA , IB , IC H2O, O3
FIGURE 4.1needs caption, check oblate & prolate
For absorption to take place the molecule must interact withthe incident field ofelectromagnetic radiation. The gas must possess an electric dipole moment which ispermanent due to the configuration of the molecule or is induced by vibration. Themajority gases in the atmosphere, N2 and O2, do not possess electric dipole moments,nor are they generated by distortion of the molecule during vibration. Hence thereare no absorption spectra due to these gases in the infrared.The trace gases H2O,CO2 and O3 are more complex and possess permanent electric dipole moments orvibrationally induced ones.

Electromagnetic Interaction with Atoms and Molecules 87
4.3.1 Molecular Shape
The rotational kinetic energy of a freely rotating moleculeis
Er =12
Ixω2x +
12
Iyω2y +
12
Izω2z (4.17)
wherex, y, andz are the principal axes of rotation andIx, Iy Iz are the moments ofinertia about each of these axes respectively. Molecules are classified according totheir three moments of inertia into four categories shown inTable 4.4 and describedas follows:.
Linear molecules For these molecules the moment of inertia along the inter nuclearaxis is zero and is equal about the other two axes.
Symmetric top moleculesThese possess two moments of inertia that are equal.
Spherical symmetric top moleculesOne in which all three principal moments ofinertia are equal.
Asymmetric top molecules Possess three different moments of inertia.
Using angular momentum about each axis instead of inertia gives
E =L2
x
2Ix+
L2y
2Iy+
L2z
2Iz(4.18)
The Hamiltonian for a freely rotating molecule is accomplished by replacing theangular momenta with the corresponding quantum mechanicaloperators. Moleculescan be divided into four types of rotators based on their geometric structure andresulting moment of inertia:
4.4 Line Shape
The three factors that characterise line absorption — position ν0, strengthS andshapef (x)— combine to define themass absorption coefficient, as
kabs(ν) = S f (ν − ν0), (4.19)
whereν is the frequency of absorbed radiation and the strength of the line is definedby
S =∫ ∞
0kabs(ν) dν. (4.20)
88 An Atmospheric Radiative Transfer Primer
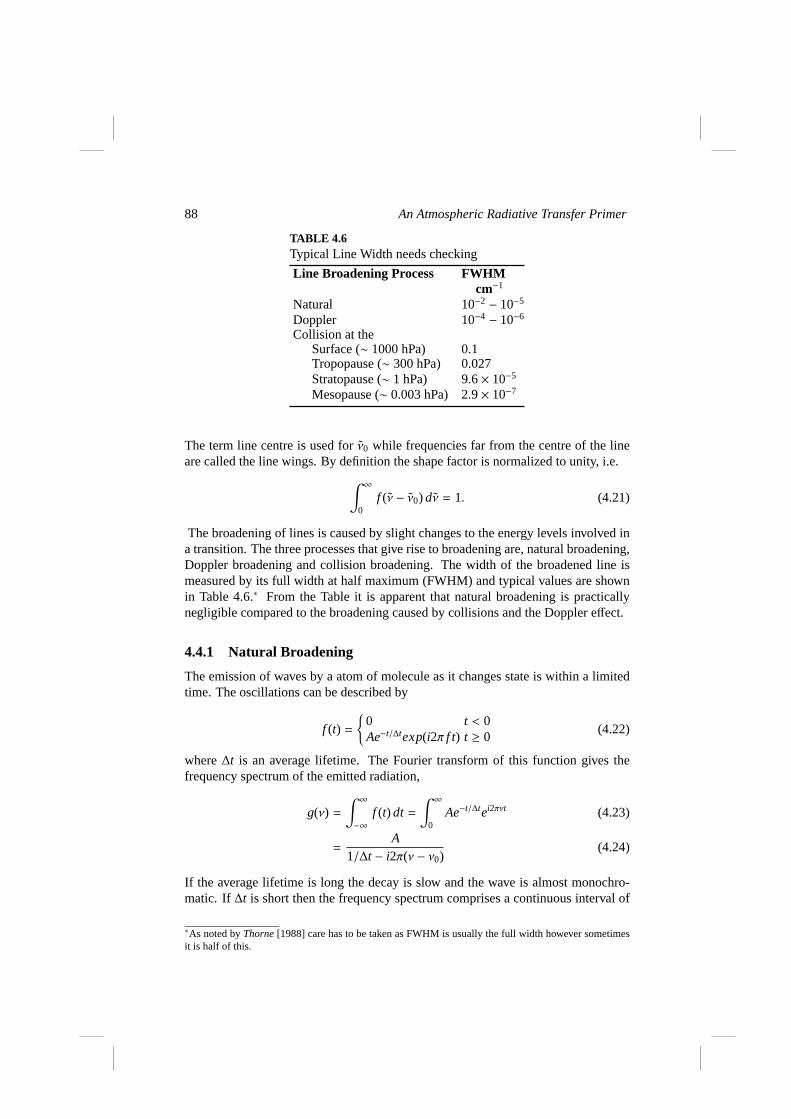
TABLE 4.6Typical Line Width needs checking
Line Broadening Process FWHMcm−1
Natural 10−2 − 10−5
Doppler 10−4 − 10−6
Collision at theSurface (∼ 1000 hPa) 0.1Tropopause (∼ 300 hPa) 0.027Stratopause (∼ 1 hPa) 9.6× 10⁻⁵
Mesopause (∼ 0.003 hPa) 2.9× 10⁻⁷
The term line centre is used for ˜ν0 while frequencies far from the centre of the lineare called the line wings. By definition the shape factor is normalized to unity, i.e.
∫ ∞
0f (ν − ν0) dν = 1. (4.21)
The broadening of lines is caused by slight changes to the energy levels involved ina transition. The three processes that give rise to broadening are, natural broadening,Doppler broadening and collision broadening. The width of the broadened line ismeasured by its full width at half maximum (FWHM) and typical values are shownin Table 4.6.∗ From the Table it is apparent that natural broadening is practicallynegligible compared to the broadening caused by collisionsand the Doppler effect.
4.4.1 Natural Broadening
The emission of waves by a atom of molecule as it changes stateis within a limitedtime. The oscillations can be described by
f (t) =
{
0 t < 0Ae−t/∆texp(i2π f t) t ≥ 0
(4.22)
where∆t is an average lifetime. The Fourier transform of this function gives thefrequency spectrum of the emitted radiation,
g(ν) =∫ ∞
−∞f (t) dt =
∫ ∞
0Ae−t/∆tei2πνt (4.23)
=A
1/∆t − i2π(ν − ν0)(4.24)
If the average lifetime is long the decay is slow and the wave is almost monochro-matic. If∆t is short then the frequency spectrum comprises a continuousinterval of
∗As noted byThorne [1988] care has to be taken as FWHM is usually the full width however sometimesit is half of this.
Electromagnetic Interaction with Atoms and Molecules 89
width ∆ν such that
∆ν∆t ≥ 14π
(4.25)
The energy contained in the wave is proportional to the square of the modulus ofg(ν),
|g(ν)|2 = A1/(∆t)2 + 4π2(ν − ν0)2
(4.26)
This function is plotted in Figure XX and shows a sharp maximum atν0. The lineshape of a transition with only natural broadening is a Lorentzian and is the sameshape as a purely pressure broadened line. The FWHM points are
ν = ν0 ±1
2π∆t(4.27)
Hence the halfwidth of the spectral line is inversely proportional to the decay time.This result can also be obtained from a quantum mechanical approach. The natural
linewidth of an energy level is determined by the lifetime ofthe excited state of anatom before radiative decay. The uncertainty principle∆E∆t ∼ ~ relates the lifeof an excited state to the precision with which the energy level can be expressed.Whereas the ground energy state has an effectively infinite lifetime so that the naturalbroadening is dominated by the lifetime of the excited state.
The rate of loss of atoms from an excited statej to a lesser energy statei is givenby
−dN j
dt= N j
j−1∑
i=1
A ji (4.28)
where theA jis are the Einstein spontaneous emission coefficients for all of the radia-tive transitions originating from levelj. Integrating this equation produces
N j(t) = N j(0)e−t/τ j (4.29)
whereτ j is the radiative lifetime, i.e.
τ j =1
∑ j−1i=1 A ji
(4.30)
Strong atomic transitions haveA jis of 108 to 109 s−1, so lifetimes are 1 to 10 ns,corresponding to a natural linewidth of about 10−3 cm−1.
4.4.2 Doppler Broadening
Doppler broadening resulting from the thermal velocities of atoms and molecules.In the frame of reference of the observer there is an apparentshift in wavelength ofemitted light as a function of the motion of a molecule along the line-of-sight. The

90 An Atmospheric Radiative Transfer Primer
higher the temperature of the gas, the larger the velocity range and the broader theline.
The line shape can be derived by considering a gas that is sufficiently rarefied sothat collision are infrequent. If a molecule which has a velocity component,vz, alongthe line-of-sight radiates at a frequencyν0, then the frequencyν seen by a stationaryobserver is:
ν = ν0
(
1+vz
c
)
(4.31)
which has the same form when expressed in terms of wavenumbers
ν = ν0
(
1+vz
c
)
(4.32)
Let p(v) dv represent the probability that the velocity of the moleculealong the lineof sight lies betweenv andv + dv. If the translational states are in thermodynamicequilibrium thenp(v) is given by the Maxwell-Boltzmann distribution accordingto
p(vz) dvz = (m/2πkBT )1/2 exp(−mv2z/2kBT ) dvz, (4.33)
wherem is the mass of the molecule,kB is the Boltzmann constant,T is the tem-perature. The shape of a Doppler broadened line is proportional to the probabilityof an emitted photon having a wavenumber in the range ˜ν + dν which is found bysubstituting in Equation 4.32 to give
fD(ν − ν0) ∝ p(ν) dν =cν0
(
m2πkBT
)1/2
exp
− m2kBT
(
cν − ν0
ν0
)2
dν (4.34)
The constant of proportionality in this expression is unity(see Problem 4.1) so theshape factor is
fD(ν − ν0) =1
αDπ1/2exp
−(
ν − ν0
αD
)2
, (4.35)
where
αD =ν0
c
(
2kBTm
)1/2
. (4.36)
The value ofαD is the 1/e-width, i.e. the point at which the absorption drops to 1/eof that of the line centre. The Doppler FWHM,α′D, is a factor
√ln(2) greater, i.e.
α′D =√
ln(2)αD.
4.4.3 Pressure Broadening
The interaction between emitting or absorbing atom or molecule and other particlesor fields can widen and shift the transition energy levels. Processes involved include:
Electromagnetic Interaction with Atoms and Molecules 91
Impact pressure broadening: The collision of other particles with the emitting par-ticle interrupts the emission process for a period much shorter than the lifetimeof the emission process.
Quasistatic pressure broadening:In this case collisions are so frequent that theenergy levels are influenced for a period much longer than thelifetime of theemission process.
Resonance broadening:Resonance broadening (self-broadening) occurs only be-tween identical species and is confined to lines with the upper or lower levelhaving an electric dipole transition (resonance line) to the ground state.
van der Waals broadening: Van der Waals broadening arises from the dipole inter-action of an excited atom with the induced dipole of a ground state atom.
Stark broadening: Stark broadening due to charged perturbers, i.e., ions and elec-trons, usually dominates resonance and van der Waals broadening in dischargesand plasmas.
Much fuller descriptions of these processes are provided byThorne [1988] (alsoGoody & Yung??) and references therein.
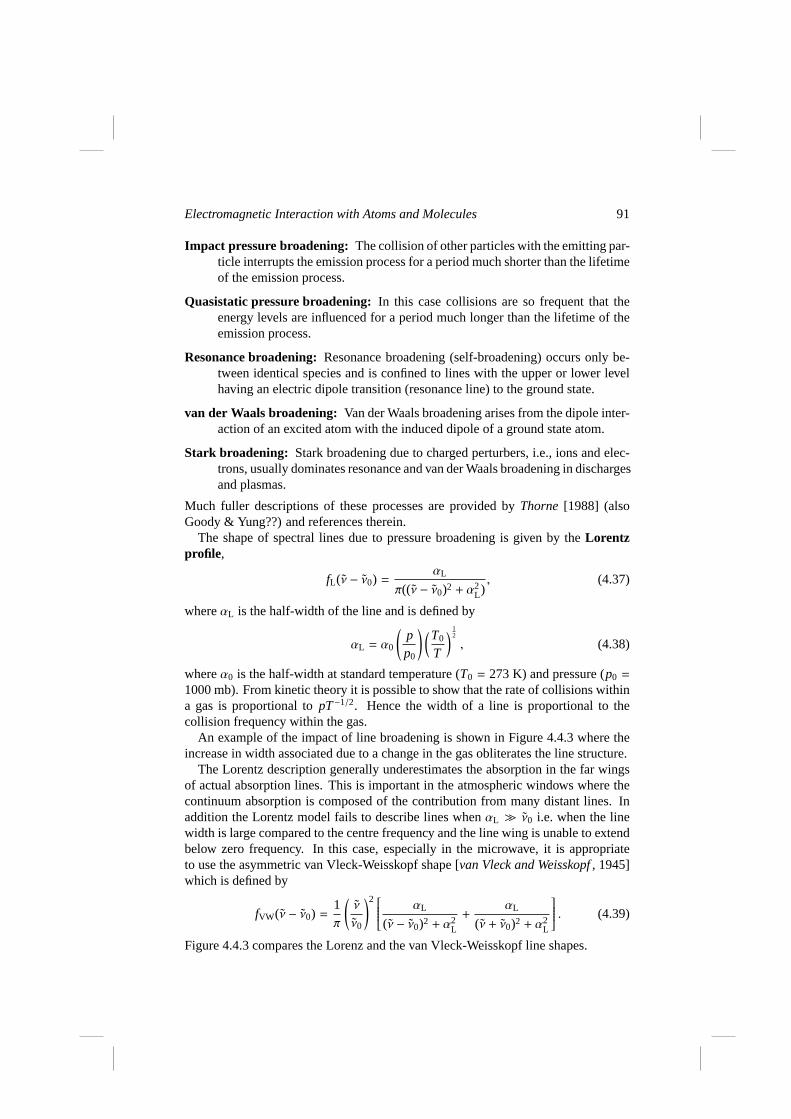
The shape of spectral lines due to pressure broadening is given by theLorentzprofile,
fL(ν − ν0) =αL
π((ν − ν0)2 + α2L), (4.37)
whereαL is the half-width of the line and is defined by
αL = α0
(
pp0
)
(T0
T
)
12
, (4.38)
whereα0 is the half-width at standard temperature (T0 = 273 K) and pressure (p0 =
1000 mb). From kinetic theory it is possible to show that the rate of collisions withina gas is proportional topT−1/2. Hence the width of a line is proportional to thecollision frequency within the gas.
An example of the impact of line broadening is shown in Figure4.4.3 where theincrease in width associated due to a change in the gas obliterates the line structure.
The Lorentz description generally underestimates the absorption in the far wingsof actual absorption lines. This is important in the atmospheric windows where thecontinuum absorption is composed of the contribution from many distant lines. Inaddition the Lorentz model fails to describe lines whenαL ≫ ν0 i.e. when the linewidth is large compared to the centre frequency and the line wing is unable to extendbelow zero frequency. In this case, especially in the microwave, it is appropriateto use the asymmetric van Vleck-Weisskopf shape [van Vleck and Weisskopf , 1945]which is defined by
fVW(ν − ν0) =1π
(
ν
ν0
)2
αL
(ν − ν0)2 + α2L
+αL
(ν + ν0)2 + α2L
. (4.39)
Figure 4.4.3 compares the Lorenz and the van Vleck-Weisskopf line shapes.

92 An Atmospheric Radiative Transfer Primer
FIGURE 4.2redo using rfm - can we show this in the ir or does it have to be the microwave?
4.4.4 The Voigt Line Shape
The Voigt line shape covers those regimes where both collision broadening andDoppler broadening contribute to the line shape. If the two process are assumedto be independent then the resultant profile is the convolution of the two line shapesi.e.
fV (ν − ν0) =∫ ∞
−∞fD(ν′ − ν0) fL(ν′ − ν0) dν′ (4.40)
=αL
αDπ3/2
∫ ∞
−∞
1
(ν′ − ν0)2 + α2L
exp
−(
ν − ν′
αD
)2
dν′ (4.41)
This integration has no analytic solution and must be done numerically. For smallvalues ofαL/αD the Lorentz component determines the central part of the Voigtprofile. As the Lorentz profile drops much more slowly than theDoppler profile theline wings are determined almost entirely by pressure broadening. A problem withthe Voigt shape is that pressure and velocity can be correlated.
4.4.5 Comparison of Doppler and Pressure Broadening
Figure 4.4.5 shows the change in line half width as a functionof altitude. Aboveabout 60 km the collisions between molecules are so infrequent that the Dopplerbroadening is the dominant broadening process. As the collision half width increasewith pressure, collision broad becomes the dominant process below about X km. Theregion in between where both process contribute to the line width is where the Voigtline shape is adopted.
The principal absorption bands of carbon dioxide and water vapour bands consistof a large number of lines which are independent (i.e. non-overlapping) broadeningby collision processes only for levels in the stratosphere between≈ 20 to 60 km inaltitude. At lower levels the lines overlap substantially.
Electromagnetic Interaction with Atoms and Molecules 93
FIGURE 4.3Comparison between the Lorenz and the van Vleck-Weisskopf line shapes. Choose
actual line??
4.4.6 Continuum Absorption
The total energy of the molecule includes the translationalenergy which is not quan-tized. Therefore process that fragment a molecule can absorb a range of energies.Continuum absorption/emission has a smooth frequency dependence making it im-possible to ascribe to specific molecular transitions. Continuum absorption/emissionis most apparent in the windows regions to be less transparent than predicted by dis-crete molecular absorption alone. The processes identifiedgiving rise to continuumabsorption/emission are
Photoionization Absorption occurs when the photon has enough energy to stripan electron completely from an atom or molecule. Ionizationrequire a largeamount of energy so that it primarily occurs from X-ray and gamma radiation.Although the ionization requires a discrete amount of energy any excess en-ergy carried by the photon can be absorbed as part of the kinetic energy ofthe ion or electron. As translational kinetic energy is not quantised there is noconstraint on the energy of the photon.
Photodissociation Sufficiently energetic electrons can also dissociate a moleculeinto two pieces. In this case the photon must have at least theof the chemi-cal bonding energy. Any energy in excess of this appears in the unquantisedkinetic energy of the fragments.
94 An Atmospheric Radiative Transfer Primer
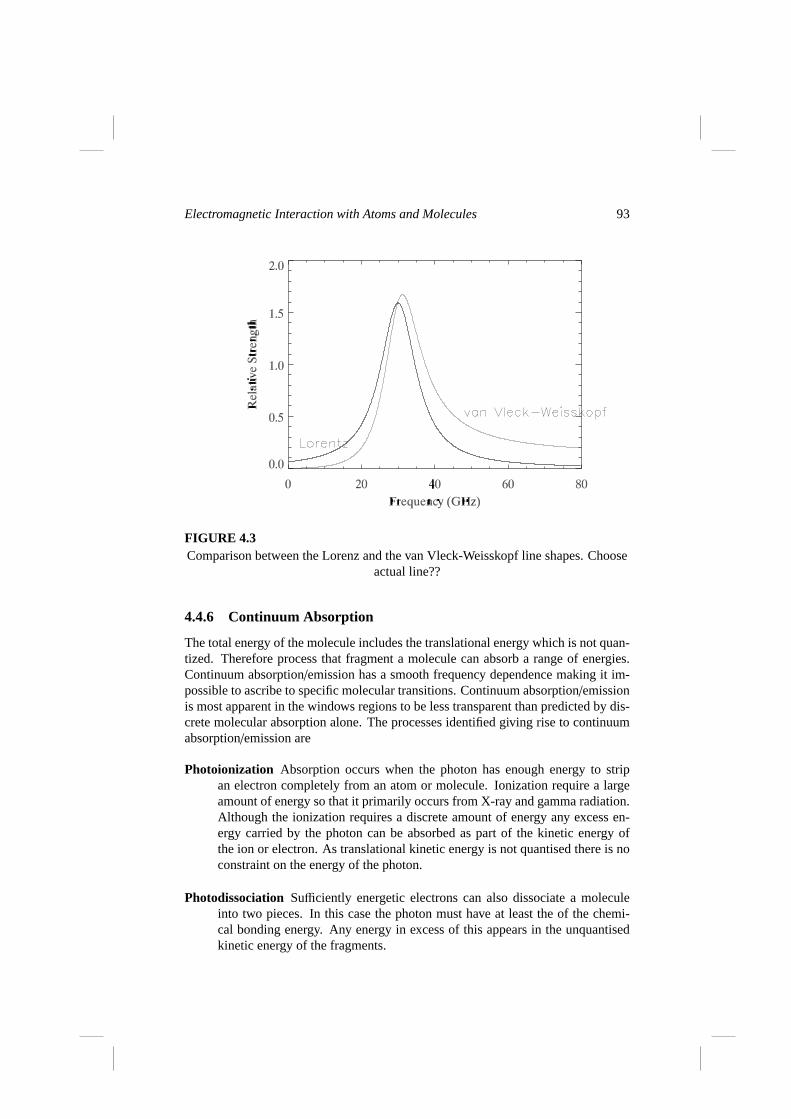
FIGURE 4.4show two bands say then on right show the transmission over 1km horizontal path
i.e. can resolve lines high up but not lower down
Wing absorption absorption/emission. One is that it is due to the residual effectsof the far wings of strong lines which are not accurately modelled. If there aremany strong lines some distance away (in frequency) the effect of the individ-ual lines can accumulate.
Polymer absorption the interaction is caused by molecular polymers (e.g. watervapour dimer) which being large floppy molecules might be expected to havebroad transitions and hence broad spectral features.
check
4.5 Radiative Penetration of the Earth’s Atmosphere
4.5.1 Atmospheric Windows
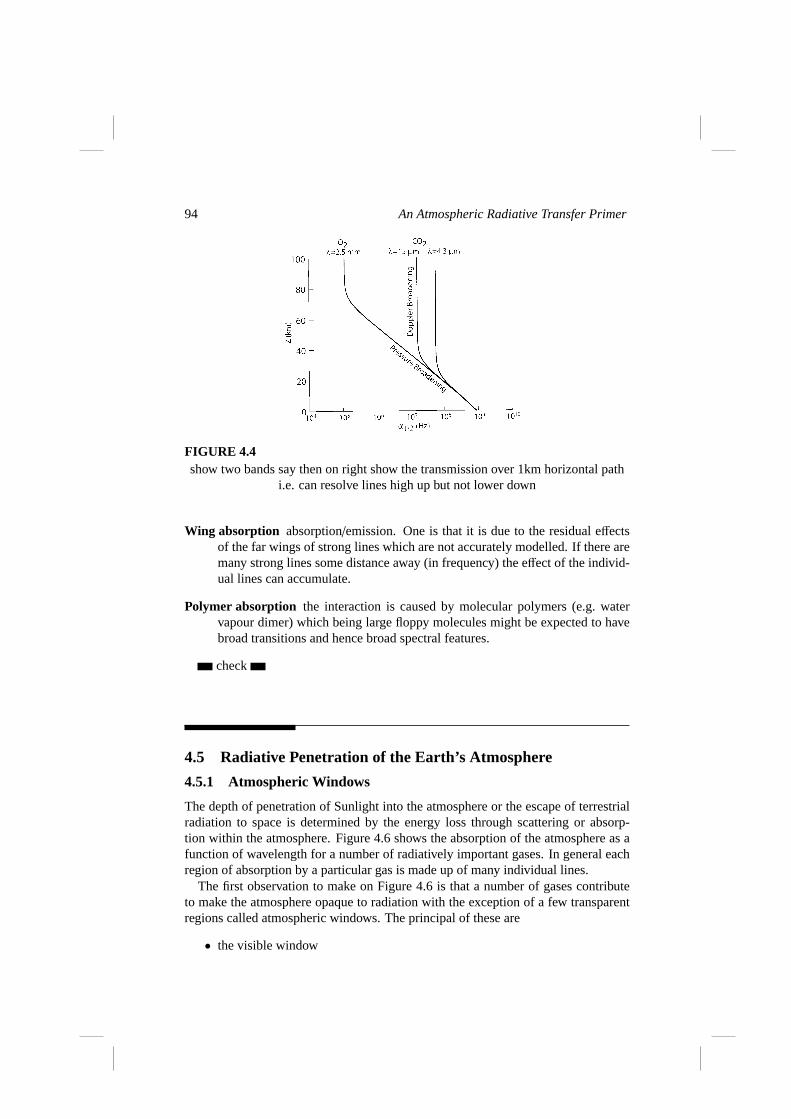
The depth of penetration of Sunlight into the atmosphere or the escape of terrestrialradiation to space is determined by the energy loss through scattering or absorp-tion within the atmosphere. Figure 4.6 shows the absorptionof the atmosphere as afunction of wavelength for a number of radiatively important gases. In general eachregion of absorption by a particular gas is made up of many individual lines.
The first observation to make on Figure 4.6 is that a number of gases contributeto make the atmosphere opaque to radiation with the exception of a few transparentregions called atmospheric windows. The principal of theseare
• the visible window

Electromagnetic Interaction with Atoms and Molecules 95
FIGURE 4.5Optical depth in shortwave.
• the infrared window from about 7 to 13µm which is interrupted by a strongO3band centred at about 9.6µm.
In addition there are many trace gases that have very little contribution to the totalatmospheric absorption but have to be included because the gas has spectral featuresthat dominate a very narrow waveband. This feature is shown in Figure 4.8 wheresuccessive increase of resolution at about 12µm releals the contribution by individuallines.
go further to 200 um
photo ionization - ionosphere Transmission of the atmosphere is cut off at shortwavelengths by o2 and o3 through the visible there are weak h2o bands
A band of o2 at 760 nm also at 1.27 um water vapour most important absorber inthe infrared
atmospheric window at about 3-5 um and 8 - 14 um. co2 at 4.3 um ch4 at 3.3 o3at 9.6
4.5.2 O2
At wavelengths less than 1 um bands of O2 are caused by electronic transitions.Figure 4.5.2 shows the absorption cross section for O2 below 250 nm. O2 consists ofa band system overlying a continuum 220 - 300 nm
at about 220 Schumann-Runge
96 An Atmospheric Radiative Transfer Primer
FIGURE 4.6Spectral absorption for a vertical path from the surface to the top of the atmosphere.
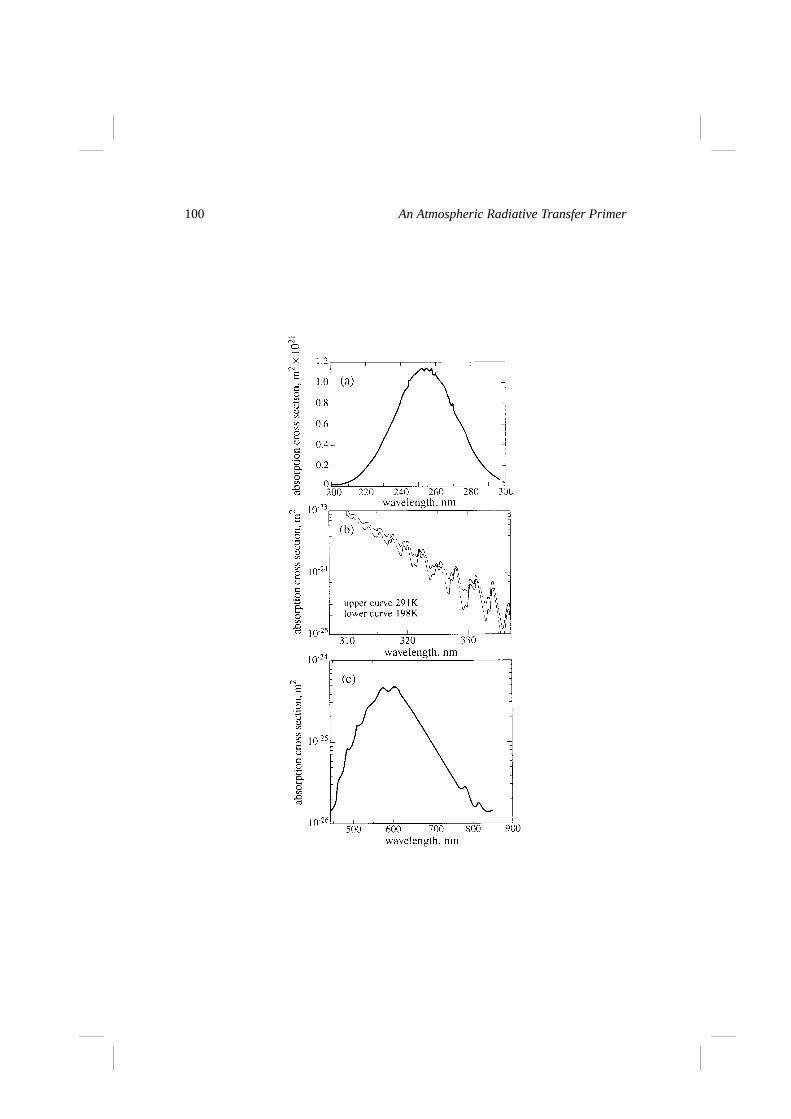
4.5.3 O3
At wavelengths less than 1 um bands of O3 are caused by electronic transitions.Figure 4.5.3 shows the principal shortwave ozone bands centred at 250 nm, 320 nmand 600 nm.
gases that matter h20 co2 o3 n2o co and ch4 then no so2 and no2
4.6 Spectroscopic Data Bases
Most complete and widely used HITRAN 1992 edition lists 709,308 lines species?wavelength range.
Problem 4.1 By using the normalization criterion defined in Equation 4.21 showthat the constant of proportionality in Equation 4.34 is unity.

Electromagnetic Interaction with Atoms and Molecules 97
Additional Reading
Atkins, P., and R. S. Friedman,Molecular Quantum Mechanics, Oxford UniversityPress, New York, 2005.Banwell, C. N., and E. M. McCash,Fundamentals of Molecular Spectroscopy, McGraw-Hill, Maidenhead, 1994.Thorne, A.,Spectrophysics: Principles and Applications, Springer, Berlin, 1988.

98 An Atmospheric Radiative Transfer Primer
1
50
100
150
200
250
50
100
150
200
250
Irra
dian
ce(W
m-2 µ
m-1)
Ultraviolet Visible Near InfraredTop of Atmosphere
1
0.2
0.4
0.6
0.8
1.0
1
0.2
0.4
0.6
0.8
1.0
Abs
orpt
ion:
Tro
popa
use
to S
pace
1
50
100
150
200
250
1
50
100
150
200
250
Irra
dian
ce(W
m-2 µ
m-1)
Tropopause
1
0.2
0.4
0.6
0.8
1.0
1
0.2
0.4
0.6
0.8
1.0
Abs
orpt
ion:
Sur
face
to S
pace
0
50100150200250
0.3 0.4 0.5 0.6 0.7 0.80.9 1 2 3 4Wavelength (µm)
050
100150200250
Irra
dian
ce(W
m-2 µ
m-1) Surface
FIGURE 4.7Spectral absorption for a vertical path from the surface to the top of the atmosphere.

Electromagnetic Interaction with Atoms and Molecules 99
FIGURE 4.8Spectral absorption for a vertical path from the surface to the top of the atmosphere.
100 An Atmospheric Radiative Transfer Primer