Embed Size (px)
Citation preview
Int. J. Hydrogen Energy, Voi. 15, No. 3, pp. 155-169, 1990. Printed in Great Britain.
0360-3199/90 $3.00 + 0.00 Pergamon Press plc.
© 1990 International Association for Hydrogen Energy.
ELECTROLYTIC HYDROGEN FROM THIN-FILM SOLAR CELLS*
J. M. OGDEN and R. H. WILLIAMS Center for Energy and Environmental Studies, Princeton University, Princeton, NJ 08544, U.S.A.
A~tract--In the last few years there have been rapid advances in thin-film solar cell technology. Industry projections indicate that 12-18% efficient photovoltaic (PV) cells costing $0.20-0.40 per peak Watt could become available by the year 2000. If these goals are realized, hydrogen could be produced via PV-powered electrolysis in sunny areas such as the Southwestern United States at costs of $9-14 per GJ. The lifecycle cost of using PV hydrogen for transport and home heating would then be comparable to using coal-based synthetic fuels or electricity (from coal or nuclear sources), if energy efficiency is stressed in energy use. If concerns about the build-up of atmospheric CO2 lead to restrictions on the future use of carbon-based fossil fuels, it appears that PV hydrogen could offer an environmentally benign and economically acceptable alternative beginning early in the next century.
INTRODUCTION
It has long been recognized that electrolytic production of hydrogen using photovoltaic (PV) electricity would have strong environmental advantages over fossil fuel- based energy supply options. The absence of carbon monoxide, volatile organic compounds, oxides of sulfur and other noxious pollutants in the production and combustion of PV hydrogen would help solve serious local and regional air pollution problems such as the deterioration of urban air quality and acid deposition on lakes and forests. Moreover, because no carbon dioxide is released in its production or combustion, a PV hydro- gen system would not contribute to the "greenhouse warming" of the planet.
While PV hydrogen production and utilization are technically feasible, economic assessments published the early 1980s [1-3] concluded that PV electricity would probably always be too expensive for PV hydrogen to be economically competitive with other synthetic fuels. But several factors suggest that PV hydrogen be reconsidered as an alternative energy source.
First, there has been rapid progress in the develop- ment of new solar cell technologies that require much less raw material and energy to manufacture and are amenable to inexpensive mass production techniques. In particular, advances in the technology of thin-film solar cells suggest that DC electricity from PV systems (and therefore PV hydrogen) could become less costly than was previously thought feasible.
*The results presented here are discussed in more detail in J. M. Ogden and R. H. Williams, Solar Hydrogen: Moving Beyond Fossil Fuels, World Resources Institute, Washington, D.C., September 1989.
Second, there is a growing awareness of the high environmental costs of continued dependence on car- bon-based fossil fuels. Rising concerns about the the greenhouse effect [4], the long-term effects of acid depo- sition [5], and poor urban air quality [6] are powerful new reasons for developing low-polluting, non-fossil energy sources.
In this paper, the implications of advances in thin-film solar cell technology for the prospects for PV hydrogen production are explored. First, recent progress and projections for thin-film solar cells are reviewed. Then, to indicate the possibilities, a conceptual design of a PV hydrogen energy system based on amorphous silicon thin-film solar cells is presented and the cost of PV hydrogen production in the Southwestern United States is estimated. Then the estimated cost of PV hydrogen is compared to estimated costs for electrolytic hydrogen based on other electricity sources and for other synthetic fuels from coal and biomass, for the timeframe near the turn of the century. Also, the lifecycle cost of automotive transportation using PV hydrogen fuel is compared to that using other alternative liquid and gaseous synthetic fuels and to that using electricity from coal or nuclear power. Finally, a possible scenario for the development of a PV hydrogen energy system in the United States is sketched.
PROGRESS IN THIN-FILM SOLAR CELL TECHNOLOGY
Background
Before about 1980, the only commercially available solar cells were made of high-grade, single-crystal
155
156 J. M. OGDEN AND R. H. WILLIAMS
silicon, using materials- and energy-intensive crystal- growing processes. In the early 1980s the industry began marketing solar cells made of cast polycrystalline silicon, a less expensive (but somewhat less efficient) material composed of many small crystallites. Also around 1980, the first thin-film solar cells were introduced [7].
The cost of solar cells has dropped steadily, as new solar cell materials and improved manufacturing methods were developed. In the early 1970s solar cells were priced at over $100 per peak Watt (W~). At present, single crystalline cells cost perhaps $5 Wp ~ to manufac- ture, polycrystalline cells $3 W ; ~ and amorphous silicon about $1.6 W~ l [8].
Further cost reductions, as well as increases in efficiency to 30% or more, will probably be achieved with further development of crystalline silicon cells [9]. Producing electricity competitively with single-crystal solar cells may well require the use of concentrating solar collectors [10], which can help make these relatively high-cost cells more competitive but which also add to the mechanical complexity of the system.
Various thin-film PV technologies probably offer the best prospects for lowering capital costs, though the efficiencies that can be realized with potentially low-cost, thin-film devices are lower than what is possible with crystalline cells. High on the list of promising thin-film technologies are amorphous silicon (a-Si) cells [11] and polycrystalline copper indium diselenide (CulnSe2) and cadmium telluride (CdTe) cells--all of which offer the advantages of low materials requirements and cost- cutting through the use of automated manufacturing processes [12].
The analysis here is focussed on a-Si thin-film PV technology. There are several reasons for this choice. First, as a thin-film technology under rapid develop- ment, the a-Si option offers good prospects for substan- tial cost reduction soon. Second, no obvious resource or environmental constraints limit the large-scale develop- ment of a-Si technology. And, third, the a-Si manufac- turing process is sufficiently well understood that a plausible quantitative analysis can be presented showing how costs might be lowered as the technology advances. Of course, this last reason does not represent an inherent advantage of a-Si technology--it merely makes possible a fairly solid analytical basis for estimating future cost trends.
Though for specificity's sake a-Si PV technology is the focus of the present analysis, it is premature to declare a-Si to be the PV technology of choice. The findings presented here would also hold for other PV tech- nologies that reach the assumed cost and efficiency goals.
The amorphous silicon solar cell
In 1974 it was discovered that the thin films of amorphous silicon could be used to convert sunlight
*Multi-junction cells, made by depositing several thin-film layers, each tuned to absorb a different part of the solar spectrum, are more efficient than single-junction cells, because they utilize more of the solar spectrum.
directly into electricity. Amorphous thin films are about 1/~m thick, using much less raw material than crystalline solar cells, which are typically 100-200#m thick. In contrast to the crystal growing and cutting process, a-Si solar cells are produced by vapor depositing silicon on an inexpensive substrate such as glass, plastic or stainless steel. Because of the speed with which vapor deposition can be done, the ease with which electrical connections can be made, and the lower energy and material require- ments, a-Si modules can be mass produced much more quickly and cheaply than crystalline modules [11, 13].
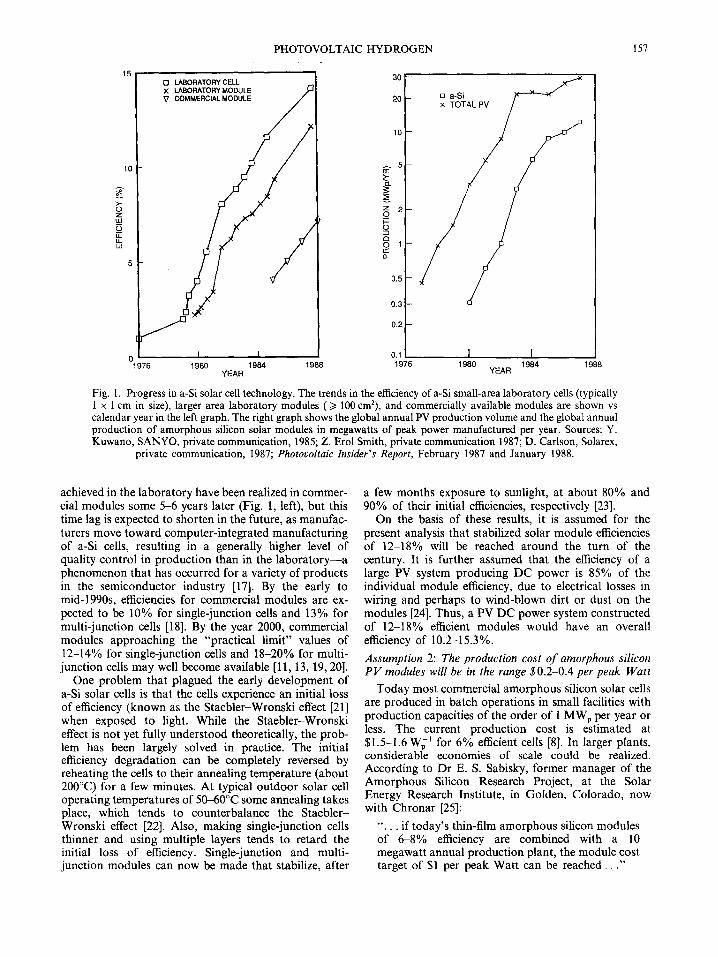
Progress in a-Si technology has been rapid. Efficiencies have increased from 1% for the first cells in 1976 to over 13% for small-area laboratory cells, to over 11% for larger area laboratory modules and to 5-7% for large- area, commercially available mass-produced modules in 1987 (Fig. 1, left). One of the leading scientists involved in the development of a-Si solar cells projects that an efficiency of 18% will be achieved in the laboratory in the early 1990s [11, 13]. Since the first commercial a-Si solar cells were introduced in 1980, production has steadily increased, reaching 11.9 megawatts peak (MWp) (or 41% of the total worldwide PV market [14]) in 1987 (Fig. 1, right).
Present indications are that this rapid growth will continue. In conjunction with Seawest, an independent power producer, Chronar Corporation of Princeton, NJ started construction on a 10 MWv per year a-Si solar cell factory toward the end of 1988 [8] and has recently announced plans to build a 50 MWp a-Si solar cell power plant in California [15]. Solarex, of Newtown, Pennsylvania, is planning to build a 10 MWp per year pro- duction facility in the early 1990s [11, 13]. Arco Solar, of Chatsworth, California, has designed plants capable of 5 MWp and 70 MWp of yearly production [16].
Although the future performance and costs of a-Si solar cells cannot be predicted with certainty, it seems likely that between 1990 and 1995 commercial modules will be available at costs less than $1 W~ -1 and efficiencies of 10% and 13%, for single- and multi-junction* cells, respectively. Manufacturers' projections indicate that by the turn of the century, 12-18% efficient PV modules costing $0.20-0.40/Wp could well be available (Table 1).
KEY TECHNICAL ASSUMPTIONS RELATING TO AMORPHOUS SILICON SOLAR CELLS
The present analysis of the prospects for PV hydrogen is based on the assumption that the cost and perfor- mance goals for thin-film solar cells near the turn of the century will be realized. In this section the technical basis for these a-Si technology goals are reviewed.
Assumption l: Amorphous silicon PV modules will have stable eJficiencies of 12-18%
While today's commercially available single-junction a-Si modules have modest conversion efficiencies of about 5-7%, efficiencies achieved in the laboratory with small-area, multi-junction cells have exceeded 13%, and may reach 18% by the early 1990s. To date, efficiencies
PHOTOVOLTAIC HYDROGEN 157
>- O
ku
15
10
30
20
10
5
z 2 o I.- O £3 O 1
0.5
u a-Si x TOTAL PV
0 . 3 - -
0.2 --
o o.1 I I 1976 1980 1984 1988 1976 1980 1984 1988
YEAR YEAR
Fig. 1. Progress in a-Si solar cell technology. The trends in the efficiency of a-Si small-area laboratory cells (typically 1 × 1 cm in size), larger area laboratory modules ( >/100 cm2), and commercially available modules are shown vs calendar year in the left graph. The right graph shows the global annual PV production volume and the global annual production of amorphous silicon solar modules in megawatts of peak power manufactured per year. Sources: Y. Kuwano, SANYO, private communication, 1985; Z. Erol Smith, private communication 1987; D. Carlson, Solarex,
private communication, 1987; Photovoltaic Insider's Report, February 1987 and January 1988.
achieved in the laboratory have been realized in commer- cial modules some 5-6 years later (Fig. 1, left), but this time lag is expected to shorten in the future, as manufac- turers move toward computer-integrated manufacturing of a-Si cells, resulting in a generally higher level of quality control in production than in the labora tory--a phenomenon that has occurred for a variety of products in the semiconductor industry [17]. By the early to mid-1990s, efficiencies for commercial modules are ex- pected to be 10% for single-junction cells and 13% for multi-junction cells [18]. By the year 2000, commercial modules approaching the "practical limit" values of 12-14% for single-junction cells and 18-20% for multi- junction cells may well become available [11, 13, 19, 20].
One problem that plagued the early development of a-Si solar cells is that the cells experience an initial loss of efficiency (known as the Staebler-Wronski effect [21] when exposed to light. While the Staebler-Wronski effect is not yet fully understood theoretically, the prob- lem has been largely solved in practice. The initial efficiency degradation can be completely reversed by reheating the cells to their annealing temperature (about 200°C) for a few minutes. At typical outdoor solar cell operating temperatures of 50--60°C some annealing takes place, which tends to counterbalance the Staebler- Wronski effect [22]. Also, making single-junction cells thinner and using multiple layers tends to retard the initial loss of efficiency. Single-junction and multi- junction modules can now be made that stabilize, after
a few months exposure to sunlight, at about 80% and 90% of their initial efficiencies, respectively [23].
On the basis of these results, it is assumed for the present analysis that stabilized solar module efficiencies of 12-18% will be reached around the turn of the century. It is further assumed that the efficiency of a large PV system producing DC power is 85% of the individual module efficiency, due to electrical losses in wiring and perhaps to wind-blown dirt or dust on the modules [24]. Thus, a PV DC power system constructed of 12-18% effÉcient modules would have an overall efficiency of 10.2-15.3%.
Assumption 2: The production cost of amorphous silicon PV modules will be in the range $0.24).4 per peak Watt
Today most commercial amorphous silicon solar cells are produced in batch operations in small facilities with production capacities of the order of 1 MWp per year or less. The current production cost is estimated at $1.5-1.6 W~ -~ for 6% efficient ceils [8]. In larger plants, considerable economies of scale could be realized. According to Dr E. S. Sabisky, former manager of the Amorphous Silicon Research Project, at the Solar Energy Research Institute, in Golden, Colorado, now with Chronar [25]:
" . . . if today's thin-film amorphous silicon modules of 6-8% efficiency are combined with a 10 megawatt annual production plant, the module cost target of $1 per peak Watt can be r eached . . . "
158 J. M. OGDEN AND R. H. WILLIAMS
Table 1. Cost and efficiency projections for amorphous silicon solar cells
Single-junction Multi-junction
Efficiency 1987 small area cell (best laboratory results for 1 cm 2 device) 1987 submodule (laboratory module with area of about 1000 cm 2) 1987 commercial module (typical, mass-produced) Projected 1990-1995 module Practical limit
12%* 14%t 8-9%* 12%~" 5-7%~ 10%§ 13%§
12-14%11 18-20%11
Costs (in 5; per peak Watt) 1988 Module manufacturing cost
Module manufacturing cost projected for 1990-95
Module manufacturing cost projected for 2000
1.5-1.6¶ [for 6-7% modules¶]
0.5-1.2** [for 6-12% modules**]
0.2-0.4** [for 12-18% modules]
*D. E. Carlson, Solarex, quoted in Photovoltaic Insider's Report, p. 4 (December 1987) "I'D. L. Morel, ARCO Solar, quoted in PVIR, p. 4 (December 1987). ~PVIR, p. 1 (May 1987). §Four U.S. manufacturers of a-Si solar cells (Chronar, Solarex, ARCO Solar and ECD) are in a cost-shared program with the
U.S. Department of Energy to procedure modules of these efficiencies by 1990 (PVIR, p. 2, February 1987). []Ref. [13]. ¶For a plant producing 1.3-1.4 MWp per year. Ref [8]. Prices in 1988 were about $4-$5 W~ ~ . **D. E. Carlson, based on estimates by a-Si solar cell manufacturers for factories producing 10-300 MWp of solar modules
per year.
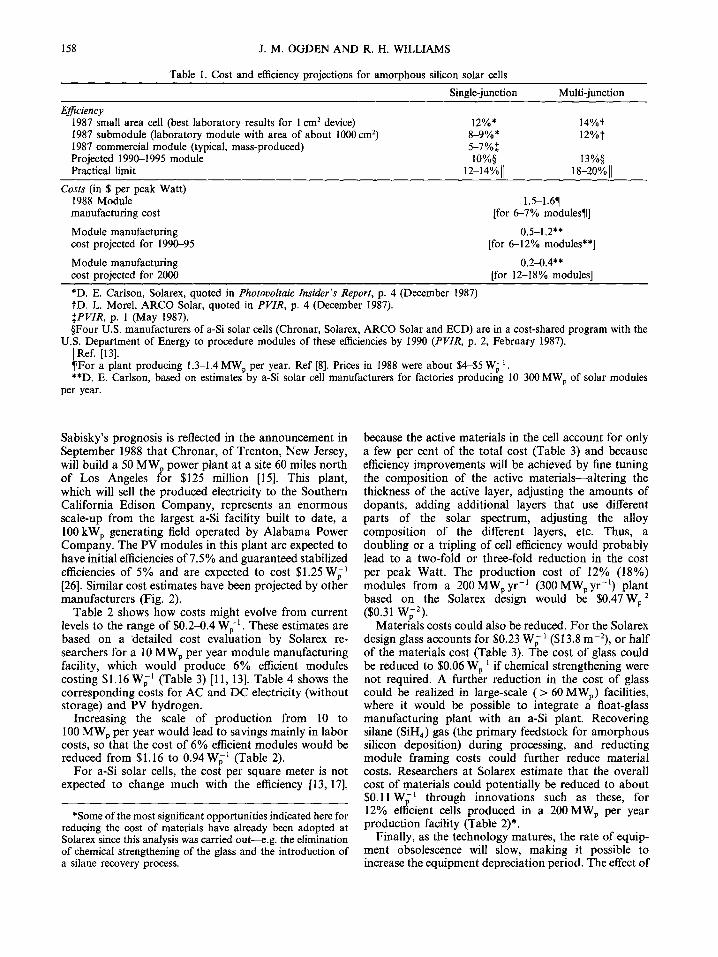
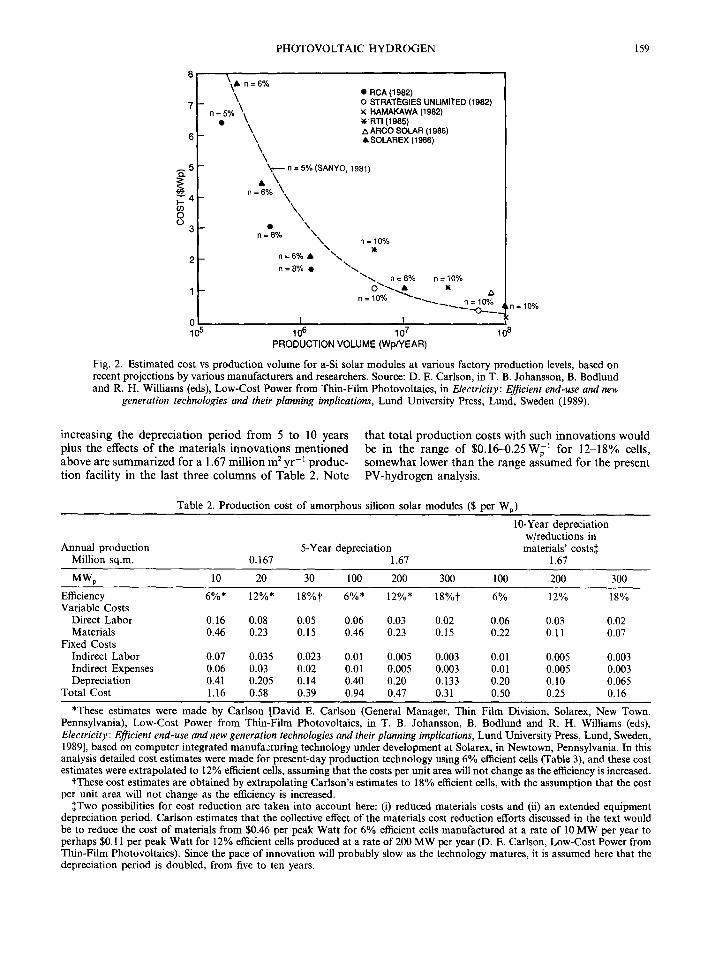
Sabisky's prognosis is reflected in the announcement in September 1988 that Chronar, of Trenton, New Jersey, will build a 50 MWp power plant at a site 60 miles north of Los Angeles for $125 million [15]. This plant, which will sell the produced electricity to the Southern California Edison Company, represents an enormous scale-up from the largest a-Si facility built to date, a 100 kWp generating field operated by Alabama Power Company. The PV modules in this plant are expected to have initial efficiencies of 7.5 % and guaranteed stabilized efficiencies of 5% and are expected to cost $1.25W~ -~ [26]. Similar cost estimates have been projected by other manufacturers (Fig. 2).
Table 2 shows how costs might evolve from current levels to the range of $0.2-0.4 Wp -1 . These estimates are based on a detailed cost evaluation by Solarex re- searchers for a 10 MWp per year module manufacturing facility, which would produce 6% efficient modules costing $1.16 W~ -~ (Table 3) [11, 13]. Table 4 shows the corresponding costs for AC and DC electricity (without storage) and PV hydrogen.
Increasing the scale of production from 10 to 100 MWp per year would lead to savings mainly in labor costs, so that the cost of 6% efficient modules would be reduced from $1.16 to 0.94 W~ -l (Table 2).
For a-Si solar cells, the cost per square meter is not expected to change much with the efficiency [13, 17],
*Some of the most significant opportunities indicated here for reducing the cost of materials have already been adopted at Solarex since this analysis was carried out---e.g, the elimination of chemical strengthening of the glass and the introduction of a silane recovery process.
because the active materials in the cell account for only a few per cent of the total cost (Table 3) and because efficiency improvements will be achieved by fine tuning the composition of the active materials--altering the thickness of the active layer, adjusting the amounts of dopants, adding additional layers that use different parts of the solar spectrum, adjusting the alloy composition of the different layers, etc. Thus, a doubling or a tripling of cell efficiency would probably lead to a two-fold or three-fold reduction in the cost per peak Watt. The production cost of 12% (18%) modules from a 200 MWp yr - l (300 MWpyr -1) plant based on the Solarex design would be $0.47W~ -2 ($0.31 W~-2).
Materials costs could also be reduced. For the Solarex design glass accounts for $0.23 Wp ~ ($13.8 m-2), or half of the materials cost (Table 3). The cost of glass could be reduced to $0.06 W~ -~ if chemical strengthening were not required. A further reduction in the cost of glass could be realized in large-scale ( > 60 MWp) facilities, where it would be possible to integrate a float-glass manufacturing plant with an a-Si plant. Recovering silane (Sill4) gas (the primary feedstock for amorphous silicon deposition) during processing, and reducting module framing costs could further reduce material costs. Researchers at Solarex estimate that the overall cost of materials could potentially be reduced to about $0.11 W~ -~ through innovations such as these, for 12% efficient cells produced in a 200 MWp per year production facility (Table 2)*.
Finally, as the technology matures, the rate of equip- ment obsolescence will slow, making it possible to increase the equipment depreciation period. The effect of
PHOTOVOLTAIC HYDROGEN 159
o.
O9 o (..)
\ \ ,L n = 6 % \
n --050/, \ \ \
\ \
\ 5 ~ n = 5% (SANYO, 1981)
A \ n = 8% \\
4 \
\ • N
3 - n = 8 % \ \ n = 10%
2 - n = 6 % • " x . n = 8% • \ ~
1 -
0 10 5
• RCA (1982) 0 STRATEGIES UNLIMITED (1982) x HAMAKAWA (1982)
RTI (1985) • ,., ARCO SOLAR (1986) • SOLAREX (1988)
n = 6 % n=10% o"-...j,
n = 10% "~" ~"-....~ n = la*~ n 10%
t I 10 6 10 7 10 8
PRODUCTION VOLUME (Wp/YEAR)
Fig. 2. Estimated cost vs production volume for a-Si solar modules at various factory production levels, based on recent projections by various manufacturers and researchers. Source: D. E. Carlson, in T. B. Johansson, B. Bodlund and R. H. Williams (eds), Low-Cost Power from Thin-Film Photovoltaics, in Electricity: Efficient end-use and new
generation technologies and their planning implications, Lund University Press, Lund, Sweden (1989).
increasing the deprecia t ion per iod f rom 5 to 10 years plus the effects of the materials innova t ions men t ioned above are summar ized for a 1.67 mil l ion m 2 y r - i produc- t ion facility in the last three columns of Table 2. Note
tha t total p roduc t ion costs with such innova t ions would be in the range of $0.16--0.25W~ -~ for 12-18% cells, somewha t lower than the range assumed for the present PV-hydrogen analysis.
Table 2. Production cost of amorphous silicon solar modules ($ per Wp)
10-Year depreciation w/reductions in
Annual production 5-Year depreciation materials' costs:~ Million sq.m. 0.167 1.67 1.67
MWp 10 20 30 100 200 300 100 200 300
Efficiency 6%* 12%* 18°/or 6%* 12°/o * 18%I" 6% 12% 18% Variable Costs
Direct Labor 0.16 0.08 0.05 0.06 0.03 0.02 0.06 0,03 0.02 Materials 0.46 0.23 0.15 0.46 0.23 0.15 0.22 0,11 0.07
Fixed Costs Indirect Labor 0.07 0.035 0.023 0.01 0.005 0.003 0.01 0.005 0.003 Indirect Expenses 0.06 0.03 0.02 0.01 0.005 0.003 0.01 0.005 0.003 Depreciation 0.41 0.205 0.14 0.40 0.20 0.133 0.20 0.10 0.065
Total Cost 1.16 0.58 0.39 0.94 0.47 0.31 0.50 0.25 0.16
*These estimates were made by Carlson [David E. Carlson (General Manager, Thin Film Division, Solarex, New Town, Pennsylvania), Low-Cost Power from Thin-Film Photovoltaics, in T. B. Johansson, B. Bodlund and R. H. Williams (eds), Electricity: Efficient end-use and new generation technologies and their planning implications, Lund University Press, Lund, Sweden, 1989], based on computer integrated manufacturing technology under development at Solarex, in Newtown, Pennsylvania. In this analysis detailed cost estimates were made for present-day production technology using 6% efficient cells (Table 3), and these cost estimates were extrapolated to 12% efficient cells, assuming that the costs per unit area will not change as the efficiency is increased.
tThese cost estimates are obtained by extrapolating Carlson's estimates to 18% efficient cells, with the assumption that the cost per unit area will not change as the efficiency is increased.
:~Two possibilities for cost reduction are taken into account here: (i) reduced materials costs and (ii) an extended equipment depreciation period. Carlson estimates that the collective effect of the materials cost reduction efforts discussed in the text would be to reduce the cost of materials from $0.46 per peak Watt for 6% efficient cells manufactured at a rate of 10 MW per year to perhaps $0.11 per peak Watt for 12% efficient cells produced at a rate of 200 MW per year (D. E. Carlson, Low-Cost Power from Thin-Film Photovoltaics). Since the pace of innovation will probably slow as the technology matures, it is assumed here that the depreciation period is doubled, from five to ten years.
160 J.M. OGDEN AND R. H. WILLIAMS
Table 3. Estimated amorphous silicon module production cost for a factory producing 10 MWp per year of 6% efficient solar
modules*
Dollars per Wp
Equipment Depreciationt 0.41 Direct Materials:[: 0.46 Direct Labor and Fringe Benefits§ 0.16 Indirect Laborll 0.07 Indirect Expenses 0.06 Total 1.16
*For a factory planned by Solarex. Source: David E. Carlson, Low-Cost Power from Thin-Film Photovoltaics.
tFor a five-year depreciation period and a capital cost for equipment (computer integrated manufacturing) in a 20,000 square foot facility estimated to be $16,500,000.
:~For 1 x 4 ft modules produced with an overall yield of 84%. The following is a breakdown of the materials cost:
Material Cost
SW~ -I $m -2 Glass (chemically strengthened) 0.23 13.8 Silane 0.07 4.2 Encapsulant 0.04 2.4 Frame 0.03 1.8 Diborane, phosphine 0.03 1.8 Stannic chloride 0.02 1.2 Wire, other process gases 0.02 1.2 Aluminum 0.02 1.2 Total 0.46 27.6
§83 direct employees, 5 day work week, 2.5 shifts per day. I117 indirect employees.
Assumption 3: Amorphous silicon PV modules will have lifetimes of 30 years
Because the a-Si solar cell is a new technology, field tests of more than a few years have not yet been completed. However, present-day commercial modules pass a battery of accelerated environmental tests. These tests are designed to simulate many years of use in a short time by subjecting the solar modules to rapidly varying extremes of light, temperature, humidity, hail impacts, etc. A preliminary judgment (which must be verified by further field testing), based on the results of such tests and expected processing improvements, is that a 30-year lifetime is a reasonable expectation [11, 13].
Assumption 4: Area-related balance of system costs will be $33 per square meter for large, fixed, flat-plate a-Si based PV arrays
Area-related balance of system (BOS) costs include the support structure holding the PV modules, the array wiring and electrical equipment, land, site preparation and other construction costs. Previous conceptual de- signs studies and analysis of data from experimental PV arrays and demonstration projects indicate that area-re- lated BOS costs of $50 per square meter could be readily achieved with present technology [27, 28]. If low-cost support structures using pre-fabricated PV panels were employed, this cost could be reduced to perhaps $37 per
square meter. With a low-current, high-voltage electrical design, which is especially well suited to amorphous silicon cells, wiring costs could be reduced to give a total area-related BOS cost of $33 per square meter [29].
Power-related balance-of-system costs can be ne- glected for PV hydrogen systems. Since DC electricity is required for electrolysis, no DC-AC inverter is needed. Moreover, a direct connection between the PV array and the electrolyser gives a highly efficient coupling, so that no DC-DC power conditioning equipment is required [30].
AN AMORPHOUS SILICON BASED PV ELECTROLYSER SYSTEM
Design of a solar photovoltaic electrolytic hydrogen system based on amorphous silicon solar cells
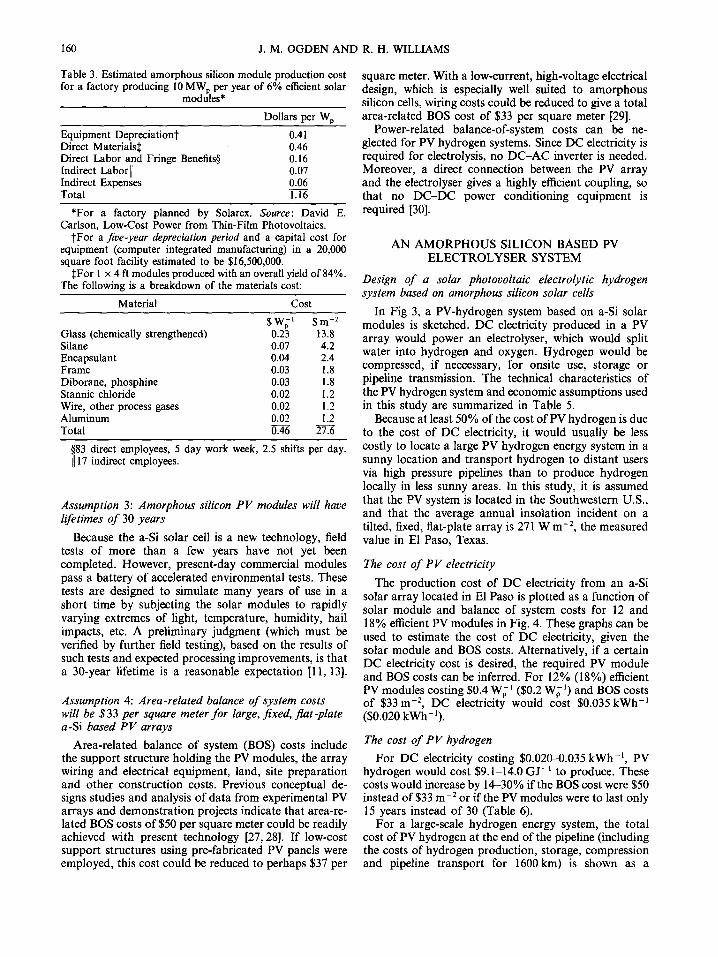
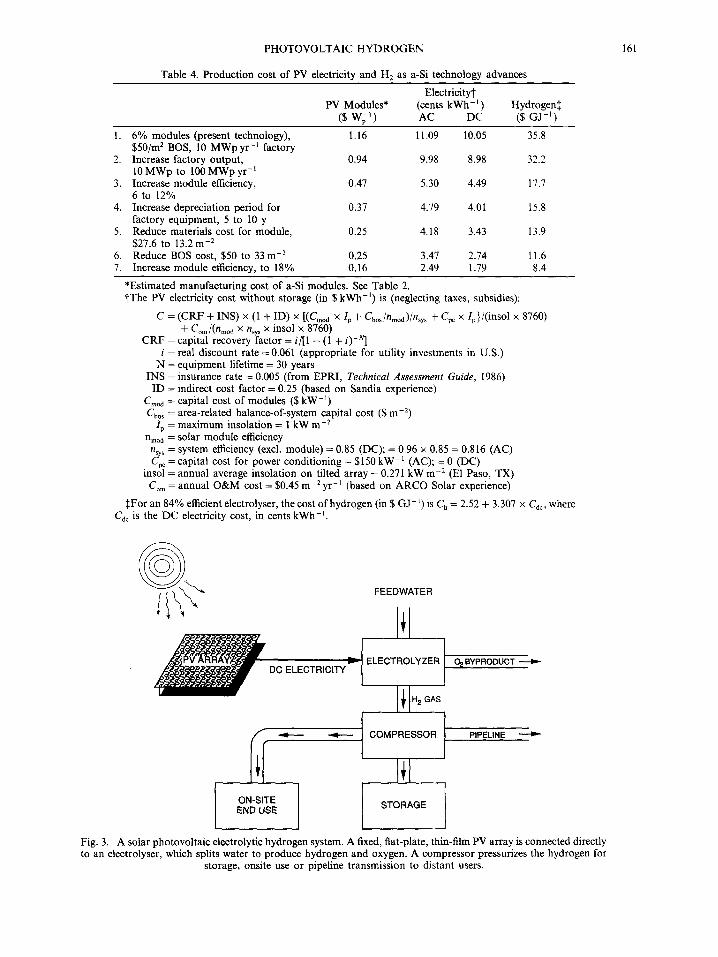
In Fig 3, a PV-hydrogen system based on a-Si solar modules is sketched. DC electricity produced in a PV array would power an electrolyser, which would split water into hydrogen and oxygen. Hydrogen would be compressed, if neccessary, for onsite use, storage or pipeline transmission. The technical characteristics of the PV hydrogen system and economic assumptions used in this study are summarized in Table 5.
Because at least 50% of the cost of PV hydrogen is due to the cost of DC electricity, it would usually be less costly to locate a large PV hydrogen energy system in a sunny location and transport hydrogen to distant users via high pressure pipelines than to produce hydrogen locally in less sunny areas. In this study, it is assumed that the PV system is located in the Southwestern U.S., and that the average annual insolation incident on a tilted, fixed, flat-plate array is 271 W m -2, the measured value in E1 Paso, Texas.
The cost of PV electricity
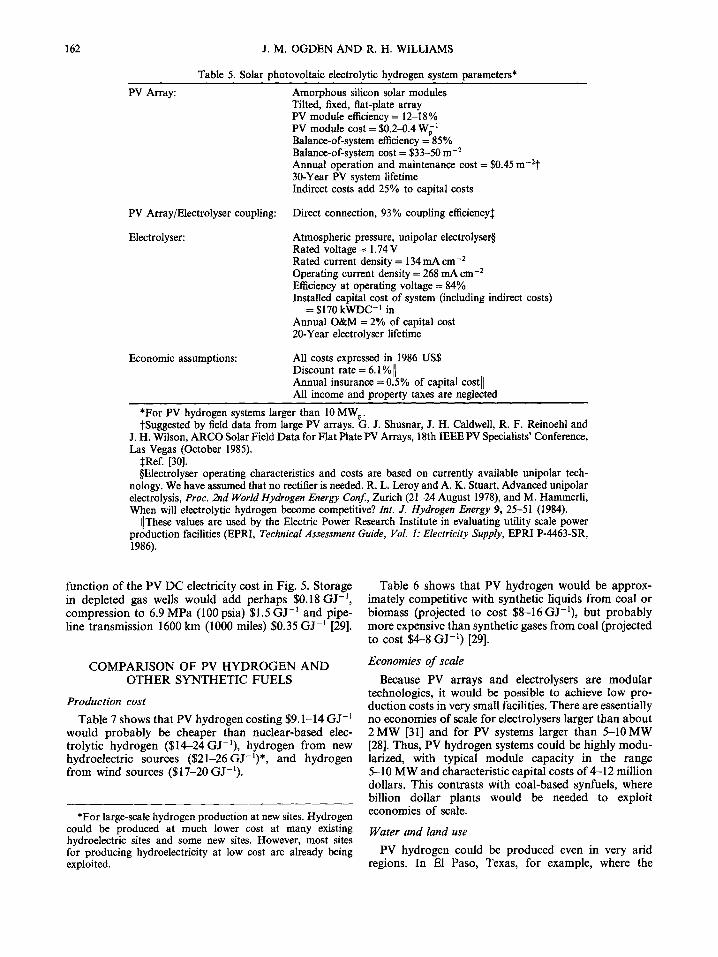
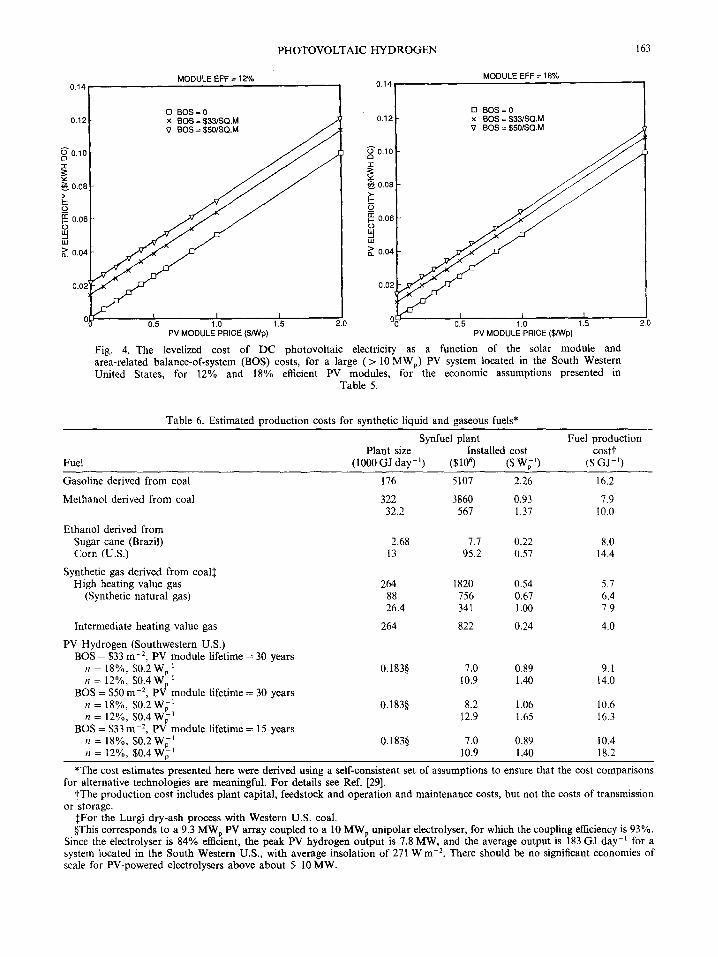
The production cost of DC electricity from an a-Si solar array located in El Paso is plotted as a function of solar module and balance of system costs for 12 and 18% efficient PV modules in Fig. 4. These graphs can be used to estimate the cost of DC electricity, given the solar module and BOS costs. Alternatively, if a certain DC electricity cost is desired, the required PV module and BOS costs can be inferred. For 12% (18%) efficient PV modules costing $0.4 Wp I ($0.2 W~ -1) and BOS costs of $33 m -2, DC electricity would cost $0.035 kWh -1 ($0.020 kWh-J).
The cost of PV hydrogen
For DC electricity costing $0.020-0.035 kWh -~, PV hydrogen would cost $9.1-14.0 GJ -~ to produce. These costs would increase by 14--30% if the BOS cost were $50
2 instead of $33 m - or if the PV modules were to last only 15 years instead of 30 (Table 6).
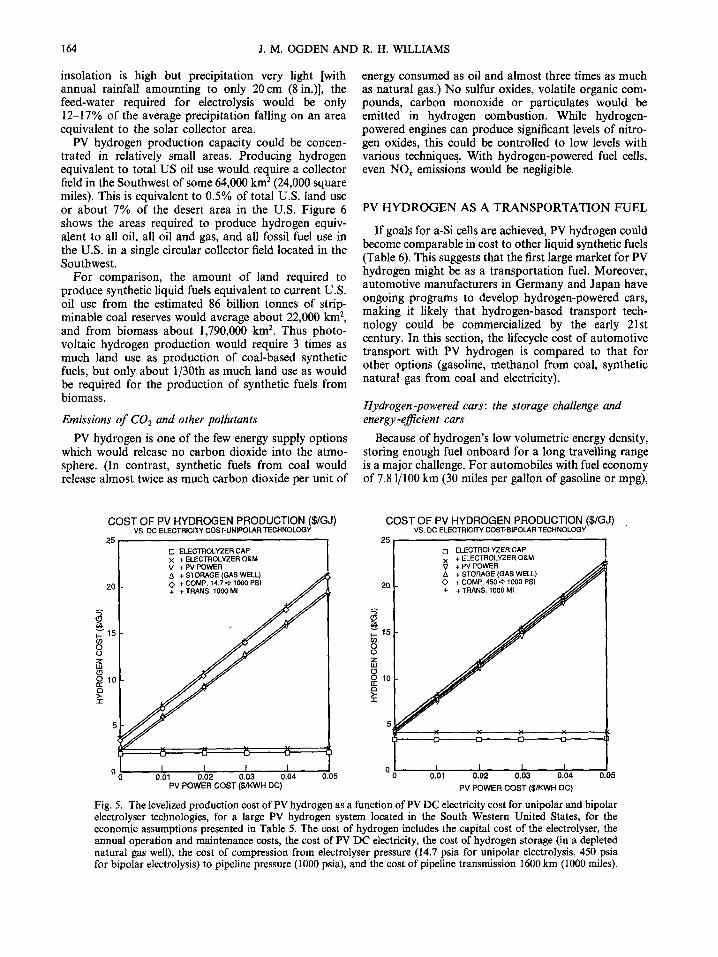
For a large-scale hydrogen energy system, the total cost of PV hydrogen at the end of the pipeline (including the costs of hydrogen production, storage, compression and pipeline transport for 1600km) is shown as a
P H O T O V O L T A I C H Y D R O G E N
Table 4. Production cost of PV electricity and H 2 as a-Si technology advances
16l
Electricityt PV Modules* (cents k W h - ~ ) Hydrogen:~
($ Wp- t ) AC DC ($ G J - I )
1. 6% modules (present technology), 1.16 11.09 10.05 35.8 $50/m 2 BOS, 10 M W p y r -~ factory
2. Increase factory output , 0.94 9.98 8.98 32.2 1 0 M W p to 100 M W p y r - '
3. Increase module efficiency, 0.47 5,30 4.49 17.7 6 to 12%
4. Increase depreciation period for 0.37 4.79 4.01 15.8 factory equipment, 5 to 10 y
5. Reduce materials cost for module, 0.25 4.18 3.43 13.9 $27.6 to 13.2 m -2
6. Reduce BOS cost, $50 to 33 m -2 0,25 3.47 2.74 11.6 7. Increase module efficiency, to 18% 0.16 2.49 1.79 8.4
*Estimated manufactur ing cost of a-Si modules. See Table 2. 1"The PV electricity cost without storage (in $ k W h - ' ) is (neglecting taxes, subsidies):
C = (CRF + INS) x (1 + ID) x [(Cmo d x Ip + Cbos/nmod)/nsy s "b Cpc x Ip}/(insol × 8760) + Com/(nmo d x nsy s × insol x 8760)
CRF = capital recovery factor = i/[1 - (1 + i) -N] i = real discount rate = 0.061 (appropriate for utility investments in U.S.)
N = equipment lifetime = 30 years INS = insurance rate = 0.005 (from EPRI, Technical Assessment Guide, 1986)
ID = indirect cost factor = 0.25 (based on Sandia experience) Cmod = capital cost of modules ($ k W - 1) Cbo, = area-related balance-of-system capital cost ($ m -2)
Ip = max imum insolation = 1 kW m -2 nmo d = solar module efficiency
nsys = system efficiency (excl. module) = 0.85 (DC); = 0.96 × 0.85 = 0.816 (AC) C~ = capital cost for power conditioning = $150 kW - t (AC); = 0 (DE)
insol = annual average insolation on tilted array = 0.271 kW m -2 (El Paso, TX) Corn = annual O&M cost = $0.45 m -2 y r - ' (based on A R C O Solar experience)
++For an 84% efficient electrolyser, the cost of hydrogen (in $ G J - ' ) is Ch = 2.52 + 3.307 × Cdc, where Cd¢ is the DC electricity cost, in cents k W h - ' .
FEEDWATER
+1 DC ELECTRICITYV ELECTROLYZER
~ ~ COMPRESSOR
ON-SITE STORAGE END USE
O-gBYPRODUCT,,~'-
PIPELINE
Fig. 3. A solar photovoltaic electrolytic hydrogen system. A fixed, flat-plate, thin-film PV array is connected directly to an electrolyser, which splits water to produce hydrogen and oxygen. A compressor pressurizes the hydrogen for
storage, onsite use or pipeline t ransmission to distant users.
162 J. M. OGDEN AND R. H. WILLIAMS
Table 5. Solar photovoltaic electrolytic hydrogen system parameters*
PV Array:
PV Array/Electrolyser coupling:
Electrolyser:
Economic assumptions:
Amorphous silicon solar modules Tilted, fixed, flat-plate array PV module efficiency = 12-18% PV module cost = $0.2-0.4 W~ -1 Balance-of-system efficiency = 85% Balance-of-system cost = $33-50 m -2 Annual operation and maintenance cost = $0.45 m-2"t 30-Year PV system lifetime Indirect costs add 25% to capital costs
Direct connection, 93% coupling efficiencyZ~
Atmospheric pressure, unipolar electrolyser§ Rated voltage = 1.74 V Rated current density = 134 mA em -2 Operating current density = 268 mAcm -2 Efficiency at operating voltage = 84% Installed capital cost of system (including indirect costs)
= $170 kWDC -I in Annual O&M = 2% of capital cost 20-Year electrolyser lifetime
All costs expressed in 1986 US$ Discount rate = 6.1% II Annual insurance = 0.5% of capital costll All income and property taxes are neglected
*For PV hydrogen systems larger than 10 MWp. tSuggested by field data from large PV arrays. G. J. Shusnar, J. H. CaldweU, R. F. Reinoehl and
J. H. Wilson, ARCO Solar Field Data for Flat Plate PV Arrays, 18th IEEE PV Specialists' Conference, Las Vegas (October 1985).
~Ref. [30]. §Electrolyser operating characteristics and costs are based on currently available unipolar tech-
nology. We have assumed that no rectifier is needed. R. L. Leroy and A. K. Stuart, Advanced unipolar electrolysis, Proc. 2nd World Hydrogen Energy Conf., Zurich (21-24 August 1978), and M. Hammerli, When will electrolytic hydrogen become competitive? Int. J. Hydrogen Energy 9, 25-51 (1984).
IlTbese values are used by the Electric Power Research Institute in evaluating utility scale power production facilities (EPRI, Technical Assessment Guide, VoL I: Electricity Supply, EPRI P-4463-SR, 1986).
function of the PV DC electricity cost in Fig. 5. Storage in depleted gas wells would add perhaps $0.18 GJ -1, compression to 6.9 MPa (100psia) $1.5 GJ -~ and pipe- line transmission 1600 km (1000 miles) $0.35 GJ -1 [29].
C O M P A R I S O N OF PV H Y D R O G E N AND O T H E R SYNTHETIC FUELS
Production cost
Table 7 shows that PV hydrogen costing $9.1-14 GJ -~ would probably be cheaper than nuclear-based elec- trolytic hydrogen ($14-24GJ-1), hydrogen from new hydroelectric sources ($21-26Gj-1) *, and hydrogen from wind sources ($17-20 Gj - I ) .
*For large-scale hydrogen production at new sites. Hydrogen could be produced at much lower cost at many existing hydroelectric sites and some new sites. However, most sites for producing hydroelectricity at low cost are already being exploited.
Table 6 shows that PV hydrogen would be approx- imately competitive with synthetic liquids from coal or biomass (projected to cost $ 8 - 1 6 G j - l ) , but probably more expensive than synthetic gases from coal (projected to cost $4--8 GJ -1) [29].
Economies of scale
Because PV arrays and electrolysers are modular technologies, it would be possible to achieve low pro- duction costs in very small facilities. There are essentially no economies of scale for electrolysers larger than about 2 MW [31] and for PV systems larger than 5-10 M W [28]. Thus, PV hydrogen systems could be highly modu- larized, with typical module capacity in the range 5- I0 M W and characteristic capital costs of 4-12 million dollars. This contrasts with coal-based synfuels, where billion dollar plants would be needed to exploit economies of scale.
Water and land use
PV hydrogen could be produced even in very arid regions. In E1 Paso, Texas, for example, where the
PHOTOVOLTAIC HYDROGEN 163
0.14
0.12
oO" 0.10
"1-
o.o6
0.06
n > 0.04
0,02 ~
MODULE EFF = 12%
[3 BOS = 0 x DOS = $33/SQ.M / V DOS = $50/SQ.M / •
I I I 0.5 1.0 1.5 2.0
PV MODULE PRICE ($/Wp)
Fig. 4. The levelized cost of DC photovoltaic
0.14
0.12
0.10 ~2 -r
0.061 >, I -
~- 0.06
.-I, 0.04
0,0:
electricity
MODULE EFF = 18%
[ ] DOS = 0 x DOS = $33/SQ.M V BOS = $50/SQ.M
I I I 0.5 1.0 1.5 2.0
PV MODULE PRICE (S/Wp)
as a function of the solar module and area-related balance-of-system (BOS) costs, for a large ( > 10 MWp) PV system located in the South Western United States, for 12% and 18% efficient PV modules, for the economic assumptions presented in
Table 5.
Table 6. Estimated production costs for synthetic liquid and gaseous fuels*
Synfuel plant Fuel production Plant size Installed cost costt
Fuel (1000 GJ day -~ ) ($106) ($ Wp ~ ) ($ GJ-~)
Gasoline derived from coal
Methanol derived from coal
Ethanol derived from Sugar cane (Brazil) Corn (U.S.)
Synthetic gas derived from coal:~ High heating value gas
(Synthetic natural gas)
Intermediate heating value gas
PV Hydrogen (Southwestern U.S.) BOS = $33 m -2, PV module lifetime = 30 years
n = 18%, $0.2Wff 1 n 12%, $0.4 W~ -1
BOS = $50 m -2, PV module lifetime = 30 years n = 18%, $0.2 Wp 1 n 12%, $0.4 W~ -I
BOS = $33 m -2, PV module lifetime = 15 years n = 18%, $0.2 Wp -1 n 12%, $0.4 Wp I
176 5107 2.26 16.2
322 3860 0.93 7.9 32.2 567 1.37 I0.0
2.68 7.7 0.22 8.0 13 95.2 0.57 14.4
264 1820 0.54 5.7 88 756 0.67 6.4 26.4 341 1.00 7.9
264 822 0.24 4.0
0.183§ 7.0 0.89 9.1 10.9 1.40 14.0
0.183§ 8.2 1.06 10.6 I2.9 1.65 16.3
0.183§ 7.0 0.89 10.4 10.9 1,40 18.2
*The cost estimates presented here were derived using a self-consistent set of assumptions to ensure that the cost comparisons for alternative technologies are meaningful. For details see Ref. [29].
1"The production cost includes plant capital, feedstock and operation and maintenance costs, but not the costs of transmission or storage.
:~For the Lurgi dry-ash process with Western U.S. coal. §This corresponds to a 9.3 MWp PV array coupled to a 10 MWp unipolar electrolyser, for which the coupling efficiency is 93%.
Since the electrolyser is 84% efficient, the peak PV hydrogen output is 7.8 MW, and the average output is 183 GJ day t for a system located in the South Western U.S., with average insolation of 271 W m -2. There should be no significant economies of scale for PV-powered electrolysers above about 5-10 MW.
energy consumed as oil and almost three times as much as natural gas.) No sulfur oxides, volatile organic com- pounds, carbon monoxide or particulates would be emitted in hydrogen combustion. While hydrogen- powered engines can produce significant levels of nitro- gen oxides, this could be controlled to low levels with various techniques. With hydrogen-powered fuel cells, even NOx emissions would be negligible.
insolation is high but precipitation very light [with annual rainfall amounting to only 20 cm (8 in.)], the feed-water required for electrolysis would be only 12-17% of the average precipitation falling on an area equivalent to the solar collector area.
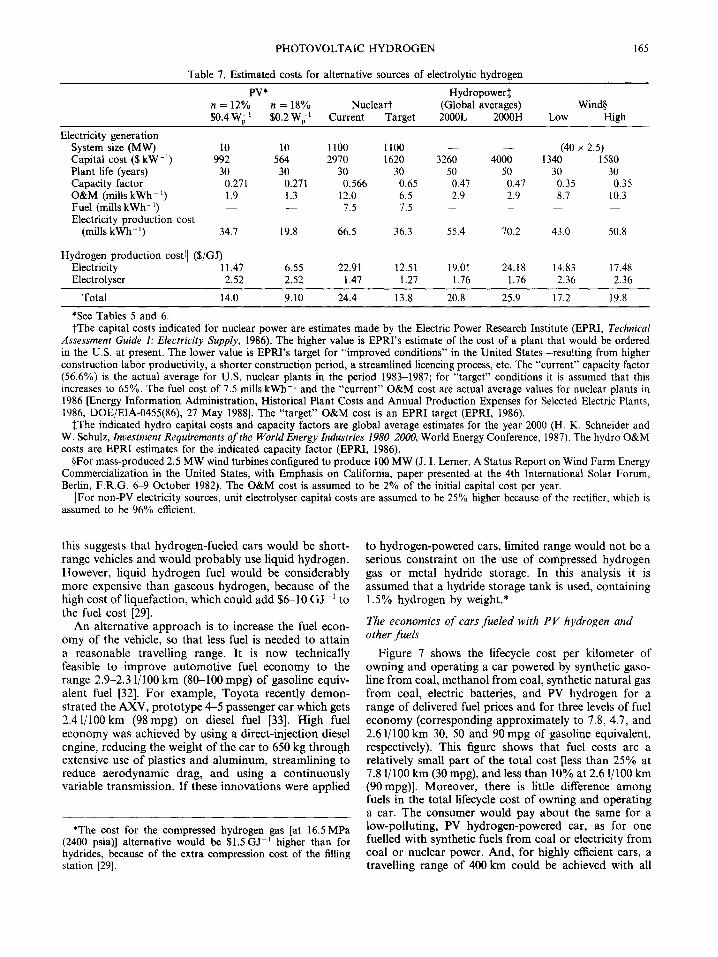
PV hydrogen production capacity could be concen- trated in relatively small areas. Producing hydrogen equivalent to total US oil use would require a collector field in the Southwest of some 64,000 km 2 (24,000 square miles). This is equivalent to 0.5% of total U.S. land use or about 7% of the desert area in the U.S. Figure 6 shows the areas required to produce hydrogen equiv- alent to all oil, all oil and gas, and all fossil fuel use in the U.S. in a single circular collector field located in the Southwest.
For comparison, the amount of land required to produce synthetic liquid fuels equivalent to current U.S. oil use from the estimated 86 billion tonnes of strip- minable coal reserves would average about 22,000 km 2, and from biomass about 1,790,000 km 2. Thus photo- voltaic hydrogen production would require 3 times as much land use as production of coal-based synthetic fuels, but only about 1/30th as much land use as would be required for the production of synthetic fuels from biomass.
Emissions of C02 and other pollutants
PV hydrogen is one of the few energy supply options which would release no carbon dioxide into the atmo- sphere. (In contrast, synthetic fuels from coal would release almost twice as much carbon dioxide per unit of
PV HYDROGEN AS A TRANSPORTATION FUEL
If goals for a-Si cells are achieved, PV hydrogen could become comparable in cost to other liquid synthetic fuels (Table 6). This suggests that the first large market for PV hydrogen might be as a transportation fuel. Moreover, automotive manufacturers in Germany and Japan have ongoing programs to develop hydrogen-powered cars, making it likely that hydrogen-based transport tech- nology could be commercialized by the early 21st century. In this section, the lifecycle cost of automotive transport with PV hydrogen is compared to that for other options (gasoline, methanol from coal, synthetic natural gas from coal and electricity).
Hydrogen-powered cars: the storage challenge and energy-efficient cars
Because of hydrogen's low volumetric energy density, storing enough fuel onboard for a long travelling range is a major challenge. For automobiles with fuel economy of 7.8 1/100 km (30 miles per gallon of gasoline or mpg),
COST OF PV HYDROGEN PRODUCTION ( $ / G J ) VS. DC ELECTRICITY COST-UNIPOLAR TECHNOLOGY
25
20 20
8 =; o10
COST OF PV HYDROGEN PRODUCTION (S/G J) VS, DC ELECTRICITY COST.BIPOLAR TECHNOLOGY
25 E] ELEGTROLYZER CAP × + ELECTROLYZER O&M ~7 + PV POWER A + STORAGE (GAS WELL) C' + OOMP. 14.7 ,¢, 1000 PSI ~ ' + + TRANS. 1000 MI
~ ~ 5 o / I I I I
0.01 0.02 0.03 0.04 0.05 PV POWER COST (S/KWH DC)
i
co O O
0 o 10 o
[3 ELECTROLYZER CAP x + ELECTROLYZER O&M ~? + PV POWER , ~ A + STORAGE (GAS WELL) J J J O + COMP. 450 ~ 1000 PSI J ~ "
a 5 ~i
164 J.M. OGDEN AND R. H. WILLIAMS
I I I I 0.01 0.02 0.03 0.04 0.05
PV POWER COST (S/KWH DO)
Fig. 5. Thelevelized production cost ofPV hydrogen as a function ofPV DC electricity cost for unipolar andbipolar electrolyser technologies, for a large PV hydrogen system located in the South Western United States, for the economic assumptions presented in Table 5. The cost of hydrogen includes the capital cost of the electrolyser, the annual operation and maintenance costs, the cost of PV DC electricity, the cost of hydrogen storage (in a depleted natural gas well), the cost of compression from electrolyser pressure (14.7 psia for unipolar electrolysis, 450 psia for bipolar dectrolysis) to pipeline pressure (1000 psia), and the cost of pipeline transmission 1600 km (1000 miles).
PHOTOVOLTAIC HYDROGEN
Table 7. Estimated costs for alternative sources of electrolytic hydrogen
165
PV* Hydropower:~ n = 12% n = 18% Nuclear1- (Global averages) Wind§ $0.4 W~ I $0.2 W~ -l Current Target 2000L 2000H Low High
Electricity generation System size (MW) 10 10 1100 1100 - - - - Capital cost ($ kW -~) 992 564 2970 1620 3260 4000 Plant life (years) 30 30 30 30 50 50 Capacity factor 0.271 0.271 0.566 0,65 047 0.47 O&M (mills kWh - 1) 1.9 1.3 12.0 6.5 2.9 2.9 Fuel (mills kWh -l) - - - - 7.5 7.5 -- - - Electricity production cost
(mills kWh-i) 34.7 19.8 66.5 36.3 55.4 70.2
(40 x 2.5) 1340 1580
30 30 0.35 0.35 8.7 10.3
43.0 50.8
Hydrogen production costll ($/GJ) Electricity 11.47 6.55 22.91 12.51 19.01 24.18 14.83 17.48 Electrolyser 2.52 2.52 1.47 1.27 1.76 1.76 2.36 2.36
Total 14.0 9.10 24.4 13.8 20.8 25.9 17.2 19.8
*See Tables 5 and 6. tThe capital costs indicated for nuclear power are estimates made by the Electric Power Research Institute (EPRI, Technical
Assessment Guide 1: Electricity Supply, 1986). The higher value is EPRI's estimate of the cost of a plant that would be ordered in the U.S. at present. The lower value is EPRI's target for "improved conditions" in the United States--resulting from higher construction labor productivity, a shorter construction period, a streamlined licencing process, etc. The "current" capacity factor (56.6%) is the actual average for U.S. nuclear plants in the period 1983-1987; for "target" conditions it is assumed that this increases to 65%. The fuel cost of 7.5 mills kWh -~ and the "current" O&M cost are actual average values for nuclear plants in 1986 [Energy Information Administration, Historical Plant Costs and Annual Production Expenses for Selected Electric Plants, 1986, DOE/EIA-0455(86), 27 May 1988]. The "target" O&M cost is an EPRI target (EPRI, 1986).
:~The indicated hydro capital costs and capacity factors are global average estimates for the year 2000 (H. K. Schneider and W. Schulz, Investment Requirements of the Worm Energy Industries 1980-2000, World Energy Conference, 1987). The hydro O&M costs are EPRI estimates for the indicated capacity factor (EPRI, 1986).
§For mass-produced 2.5 MW wind turbines configured to produce 100 MW (J. I. Lerner, A Status Report on Wind Farm Energy Commercialization in the United States, with Emphasis on California, paper presented at the 4th International Solar Forum, Berlin, F.R.G. 6-9 October 1982). The O&M cost is assumed to be 2% of the initial capital cost per year.
[IFor non-PV electricity sources, unit electrolyser capital costs are assumed to be 25% higher because of the rectifier, which is assumed to be 96% efficient.
this suggests that hydrogen-fueled cars would be short- range vehicles and would probably use liquid hydrogen. However, liquid hydrogen fuel would be considerably more expensive than gaseous hydrogen, because of the high cost of liquefaction, which could add $6-10 GJ -1 to the fuel cost [29].
An alternative approach is to increase the fuel econ- omy of the vehicle, so that less fuel is needed to attain a reasonable travelling range. It is now technically feasible to improve automotive fuel economy to the range 2.9-2.3 1/100 km (80-100 mpg) of gasoline equiv- alent fuel [32]. For example, Toyota recently demon- strated the AXV, prototype 4--5 passenger car which gets 2.41/100km (98mpg) on diesel fuel [33]. High fuel economy was achieved by using a direct-injection diesel engine, reducing the weight of the car to 650 kg through extensive use of plastics and aluminum, streamlining to reduce aerodynamic drag, and using a continuously variable transmission. If these innovations were applied
*The cost for the compressed hydrogen gas [at 16.5 MPa (2400 psia)] alternative would be $1.5GJ -1 higher than for hydrides, because of the extra compression cost of the filling station [29].
to hydrogen-powered cars, limited range would not be a serious constraint on the use of compressed hydrogen gas or metal hydride storage. In this analysis it is assumed that a hydride storage tank is used, containing 1.5% hydrogen by weight.*
The economics o f cars fueled with P V hydrogen and other fuels
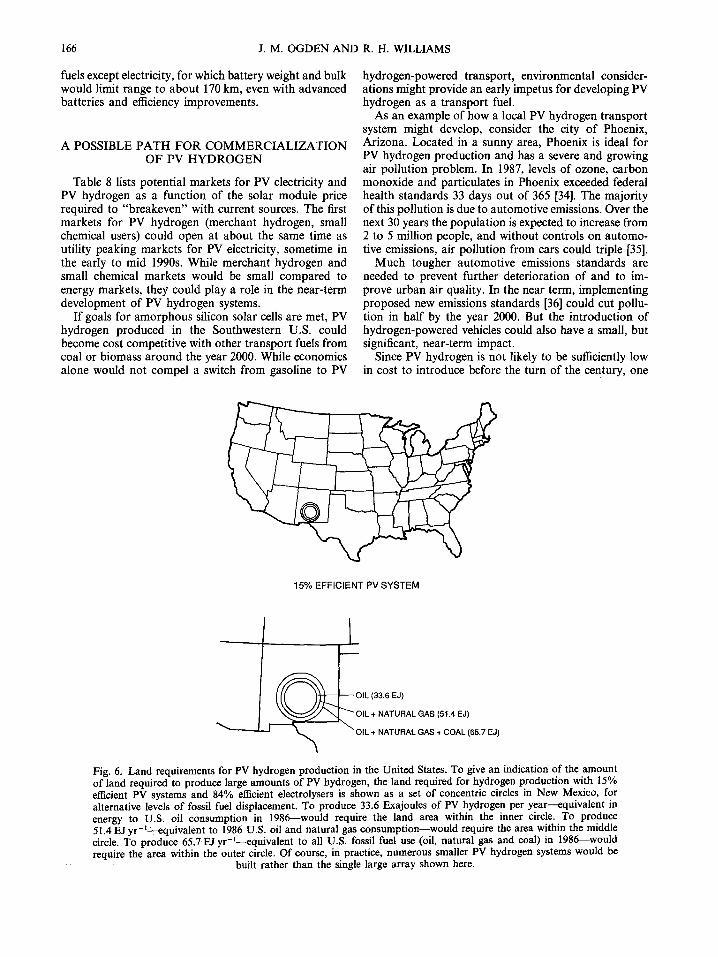
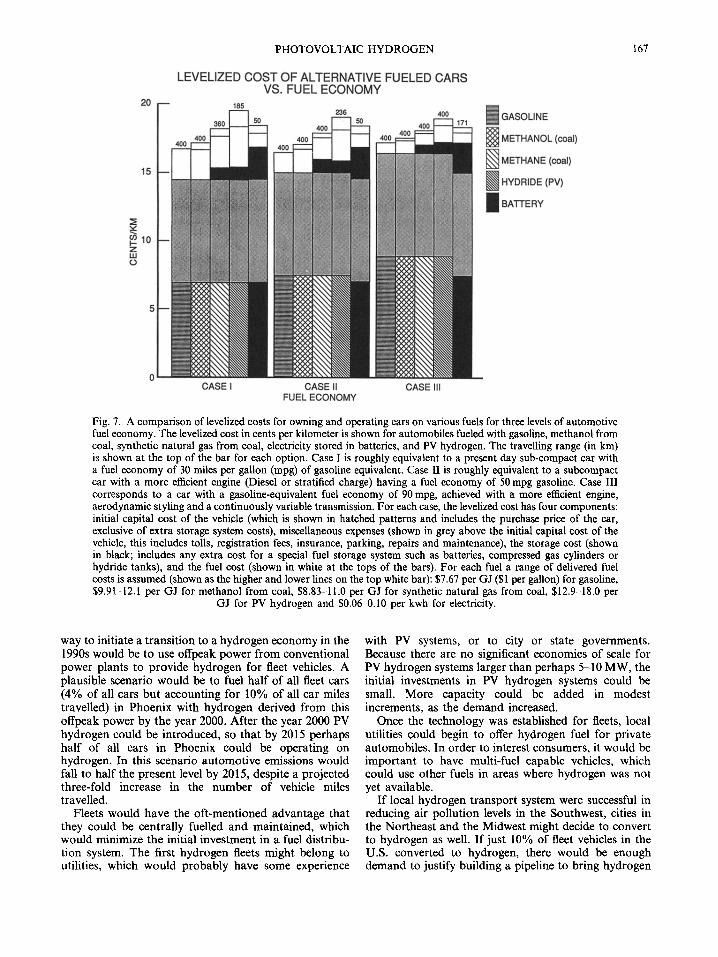
Figure 7 shows the lifecycle cost per kilometer of owning and operating a car powered by synthetic gaso- line from coal, methanol from coal, synthetic natural gas from coal, electric batteries, and PV hydrogen for a range of delivered fuel prices and for three levels of fuel economy (corresponding approximately to 7.8, 4.7, and 2.61/100 km 30, 50 and 90 mpg of gasoline equivalent, respectively). This figure shows that fuel costs are a relatively small part of the total cost [less than 25% at 7.8 1/100 km (30 mpg), and less than 10% at 2.61/100 km (90 mpg)]. Moreover, there is little difference among fuels in the total lifecycle cost of owning and operating a car. The consumer would pay about the same for a low-polluting, PV hydrogen-powered car, as for one fuelled with synthetic fuels from coal or electricity from coal or nuclear power. And, for highly efficient cars, a travelling range of 400 km could be achieved with all
166 J. M. OGDEN AND R. H. WILLIAMS
fuels except electricity, for which battery weight and bulk would limit range to about 170 km, even with advanced batteries and efficiency improvements.
A POSSIBLE PATH FOR COMMERCIALIZATION OF PV HYDROGEN
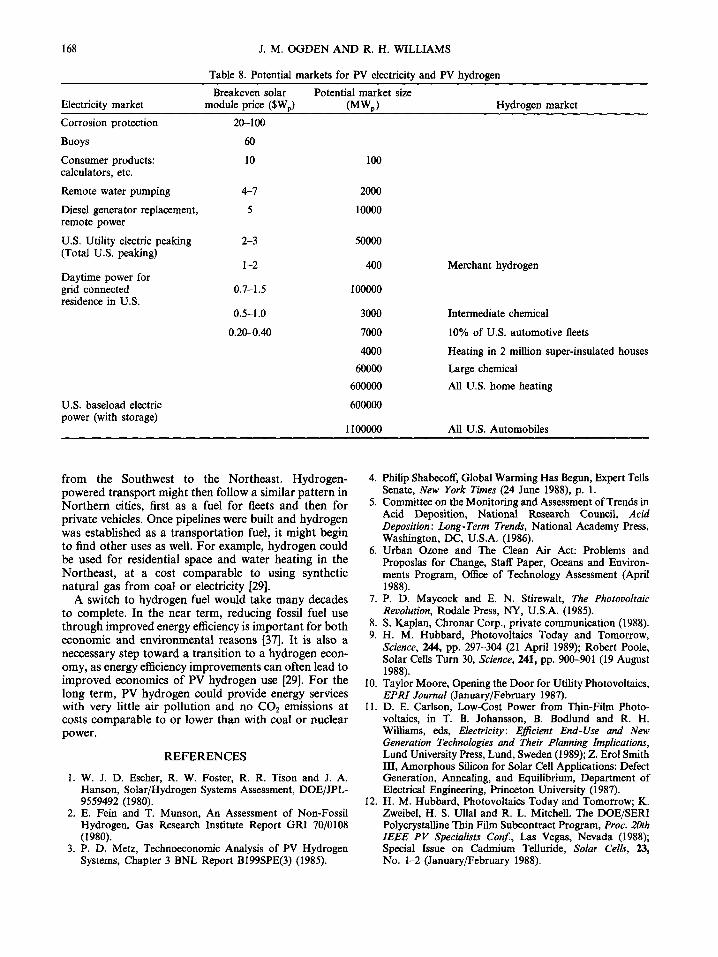
Table 8 lists potential markets for PV electricity and PV hydrogen as a function of the solar module price required to "breakeven" with current sources. The first markets for PV hydrogen (merchant hydrogen, small chemical users) could open at about the same time as utility peaking markets for PV electricity, sometime in the early to mid 1990s. While merchant hydrogen and small chemical markets would be small compared to energy markets, they could play a role in the near-term development of PV hydrogen systems.
If goals for amorphous silicon solar cells are met, PV hydrogen produced in the Southwestern U.S. could become cost competitive with other transport fuels from coal or biomass around the year 2000. While economics alone would not compel a switch from gasoline to PV
hydrogen-powered transport, environmental consider- ations might provide an early impetus for developing PV hydrogen as a transport fuel.
As an example of how a local PV hydrogen transport system might develop, consider the city of Phoenix, Arizona. Located in a sunny area, Phoenix is ideal for PV hydrogen production and has a severe and growing air pollution problem. In 1987, levels of ozone, carbon monoxide and particulates in Phoenix exceeded federal health standards 33 days out of 365 [34]. The majority of this pollution is due to automotive emissions. Over the next 30 years the population is expected to increase from 2 to 5 million people, and without controls on automo- tive emissions, air pollution from cars could triple [35].
Much tougher automotive emissions standards are needed to prevent further deterioration of and to im- prove urban air quality. In the near term, implementing proposed new emissions standards [36] could cut pollu- tion in half by the year 2000. But the introduction of hydrogen-powered vehicles could also have a small, but significant, near-term impact.
Since PV hydrogen is not likely to be sufficiently low in cost to introduce before the turn of the century, one
15% EFFICIENT PV SYSTEM
~ OIL (33.6 EJ)
OIL + NATURAL GAS (61.4 E J)
OIL + NATURAL GAS + COAL (65.7 E J)
Fig. 6. Land requirements for PV hydrogen production in the United States. To give an indication of the amount of land required to produce large amounts of PV hydrogen, the land required for hydrogen production with 15% efficient PV systems and 84% efficient electrolysers is shown as a set of concentric circles in New Mexico, for alternative levels of fossil fuel displacement. To produce 33.6 Exajoules of PV hydrogen per year--equivalent in energy to U.S. oil consumption in 1986--would require the land area within the inner circle. To produce 51.4 EJ yr-L~-equivalent to 1986 U.S. oil and natural gas consumption--would require the area within the middle circle. To produce 65.7EJ yr-L---equivalent to all U.S. fossil fuel use (oil, natural gas and coal) in 1986---would require the area within the outer circle. Of course, in practice, numerous smaller PV hydrogen systems would be
built rather than the single large array shown here.
PHOTOVOLTAIC HYDROGEN 167
20
15
v
z i i i
LEVELIZED COST OF ALTERNATIVE FUELED CARS VS. FUEL ECONOMY
~ ASOLINE
[~ METHANOL (coal)
~ METHANE (coal)
l HYDRIDE (PV)
I BATTERY
CASE I CASE II CASE Ill FUEL E C O N O M Y
Fig. 7. A comparison of levelized costs for owning and operating cars on various fuels for three levels of automotive fuel economy. The levelized cost in cents per kilometer is shown for automobiles fueled with gasoline, methanol from coal, synthetic natural gas from coal, electricity stored in batteries, and PV hydrogen. The travelling range (in km) is shown at the top of the bar for each option. Case I is roughly equivalent to a present day sub-compact car with a fuel economy of 30 miles per gallon (mpg) of gasoline equivalent. Case II is roughly equivalent to a subcompact car with a more efficient engine (Diesel or stratified charge) having a fuel economy of 50 mpg gasoline. Case III corresponds to a car with a gasoline-equivalent fuel economy of 90 mpg, achieved with a more efficient engine, aerodynamic styling and a continuously variable transmission. For each case, the levelized cost has four components: initial capital cost of the vehicle (which is shown in hatched patterns and includes the purchase price of the car, exclusive of extra storage system costs), miscellaneous expenses (shown in grey above the initial capital cost of the vehicle, this includes tolls, registration fees, insurance, parking, repairs and maintenance), the storage cost (shown in black; includes any extra cost for a special fuel storage system such as batteries, compressed gas cylinders or hydride tanks), and the fuel cost (shown in white at the tops of the bars). For each fuel a range of delivered fuel costs is assumed (shown as the higher and lower lines on the top white bar): $7.67 per GJ ($1 per gallon) for gasoline, $9.91-12.1 per GJ for methanol from coal, $8.83-11.0 per GJ for synthetic natural gas from coal, $12.9-18.0 per
GJ for PV hydrogen and $0.064).10 per kwh for electricity.
way to initiate a transi t ion to a hydrogen economy in the 1990s would be to use offpeak power from conventional power plants to provide hydrogen for fleet vehicles. A plausible scenario would be to fuel half of all fleet cars (4% of all cars bu t accounting for 10% of all car miles travelled) in Phoenix with hydrogen derived from this offpeak power by the year 2000. After the year 2000 PV hydrogen could be introduced, so that by 2015 perhaps half of all cars in Phoenix could be operating on hydrogen. In this scenario automotive emissions would fall to half the present level by 2015, despite a projected three-fold increase in the number of vehicle miles travelled.
Fleets would have the oft-mentioned advantage that they could be centrally fuelled and maintained, which would minimize the initial investment in a fuel distribu- tion system. The first hydrogen fleets might belong to utilities, which would probably have some experience
with PV systems, or to city or state governments. Because there are no significant economies of scale for PV hydrogen systems larger than perhaps 5-10 MW, the initial investments in PV hydrogen systems could be small. More capacity could be added in modest increments, as the demand increased.
Once the technology was established for fleets, local utilities could begin to offer hydrogen fuel for private automobiles. In order to interest consumers, it would be important to have multi-fuel capable vehicles, which could use other fuels in areas where hydrogen was not yet available.
If local hydrogen transport system were successful in reducing air pollution levels in the Southwest, cities in the Northeast and the Midwest might decide to convert to hydrogen as well. If just 10% of fleet vehicles in the U.S. converted to hydrogen, there would be enough demand to justify building a pipeline to bring hydrogen
168 J. M. OGDEN AND R. H. WILLIAMS
Table 8. Potential markets for PV electricity and PV hydrogen
Breakeven solar Potential market size Electricity market module price ($Wp) (MWp) Hydrogen market
Corrosion protection 20-100
Buoys 60
Consumer products: 10 100 calculators, etc.
Remote water pumping 4-7 2000
Diesel generator replacement, 5 10000 remote power
U.S. Utility electric peaking 2-3 50000 (Total U.S. peaking)
1-2 400 Daytime power for grid connected 0.7-1.5 100000 residence in U.S.
0.5-1.0 3000
0.20-0.40 7000
4000
6O000
600000
U.S. baseload electric 600000 power (with storage)
1100000
Merchant hydrogen
Intermediate chemical
10% of U.S. automotive fleets
Heating in 2 million super-insulated houses
Large chemical
All U.S. home heating
All U.S. Automobiles
from the Southwest to the Northeast, Hydrogen- powered transport might then follow a similar pattern in Northern cities, first as a fuel for fleets and then for private vehicles. Once pipelines were built and hydrogen was established as a transportation fuel, it might begin to find other uses as well. For example, hydrogen could be used for residential space and water heating in the Northeast, at a cost comparable to using synthetic natural gas from coal or electricity [29].
A switch to hydrogen fuel would take many decades to complete. In the near term, reducing fossil fuel use through improved energy efficiency is important for both economic and environmental reasons [37]. It is also a neccessary step toward a transition to a hydrogen econ- omy, as energy efficiency improvements can often lead to improved economics of PV hydrogen use [29]. For the long term, PV hydrogen could provide energy services with very little air pollution and no CO2 emissions at costs comparable to or lower than with coal or nuclear power.
REFERENCES
1. W. J. D. Esther, R. W. Foster, R. R. Tison and J. A. Hanson, Solar/Hydrogen Systems Assessment, DOE/JPL- 9559492 (1980).
2. E. Fein and T. Munson, An Assessment of Non-Fossil Hydrogen, Gas Research Institute Report GRI 70/0108 (1980).
3. P, D. Metz, Technoeconomic Analysis of PV Hydrogen Systems, Chapter 3 BNL Report B199SPE(3) (1985).
4. Philip Shabecoff, Global Warming Has Begun, Expert Tells Senate, New York Times (24 June 1988), p. 1.
5. Committee on the Monitoring and Assessment of Trends in Acid Deposition, National Research Council, Acid Deposition: Long-Term Trends, National Academy Press, Washington, DC, U.S.A. (1986).
6. Urban Ozone and The Clean Air Act: Problems and Proposlas for Change, Staff Paper, Oceans and Environ- ments Program, Office of Technology Assessment (April 1988).
7. P. D. Maycock and E. N. Stirewalt, The Photovohaic Revolution, Rodale Press, NY, U.S.A. (1985).
8. S. Kaplan, Chronar Corp., private communication (1988). 9. H. M. Hubbard, Photovoltaics Today and Tomorrow,
Science, 244, pp. 297-304 (21 April 1989); Robert Poole, Solar Cells Turn 30, Science, 241, pp. 900-901 (19 August 1988).
10. Taylor Moore, Opening the Door for Utility Photovoltaics, EPRI Journal (January/February 1987).
I 1. D. E. Carlson, Low-Cost Power from Thin-Film Photo- voltaics, in T. B. Johansson, B. Bodlund and R. H. Williams, eds, Electricity: E~cient End-Use and New Generation Technologies and Their Planning Implications, Lund University Press, Lund, Sweden (1989); Z. Erol Smith III, Amorphous Silicon for Solar Cell Applications: Defect Generation, Annealing, and Equilibrium, Department of Electrical Engineering, Princeton University (1987).
12. H. M. Hubbard, Photovoltalcs Today and Tomorrow; K. Zweibel, H. S. Ullal and R. L. Mitchell. The DOE/SERI Polycrystalline Thin Film Subcontract Program, Proc. 20th IEEE PV Specialists Conf., Las Vegas, Nevada (1988); Special Issue on Cadmium Telluride, Solar Cells, 23, No. 1-2 (January/February 1988).
PHOTOVOLTAIC HYDROGEN 169
13. D. E. Carlson, Solarex Thin Films Division, private communications (1988).
14. Photovoltaic Insiders' Report (February 1988). 15. M. L. Wald, Solar Power Plant Planned for California,
Business Day Section of The New York Times (6 September 1988).
16. Photovoltaic Insiders' Report (January 1987). 17. Sigurd Wagner, Electrical Engineering Department,
Princeton University, private communication (July 1988). 18. Four US manufacturers (Chronar, Solarex, Arco Solar,
and ECD) are in a cost shared program with the US Department of Energy to produce modules of these efficiencies by 1990, PVIR (February 1987).
19. E. A. DeMeo and R. W. Taylor, Solar Photovoltaic Power Systems: An Electric Utility Perspective, Science, 224 (20 April 1984).
20. Sigurd Wagner, Electrical Engineering Department, Princeton University, private communication (July 1988).
21. D. L. Staebler and C. R. Wronski, Applied Physics Letters, 31, 292 (1977).
22. D. E. Carlson, in J. I. Pankove (ed), Solar Cells, Semi- conductors and Semimetals, 21, Part D, p. 7, Academic Press, NY, U.S.A. (1984).
23. D. E. Carlson, 8th European Photovoltaic Solar Energy Conference, Florence, Italy (9-13 May 1988).
24. US Department of Energy, DOE/CH10093-19 (January 1988); S. L. Levy and L. E. Stoddard, Integrated Photo- voltaic Central Station Conceptual Designs, EPRI Report AP-3264 (June 1984). G. T. Noel, D. C. Carmichael, R. W. Smith, and J. H. Broehl, Optimization and Modularity Studies for Large-Size, Flat-Panel Array Fields, Battelle- columbus, 18th IEEE PV Specialists' Conference, Las Vegas, Nevada (October 1985).
25. $1 per Wp Module Cost Target Seen Obtainable by Early 1990s Without Efficiency Gains, p. 4, PVIR (May 1988).
26. Chronar Negotiating to Install 60 MW, $150 Million PV System in Southern California, p. 1, PVIR (September 1988).
27. S. L. Levy and L. E. Stoddard, Integrated Photovoltaic Central Station Conceptual Designs, EPRI Report AP-3264 (June 1984).
28. G. T. Noel, D. C. Carmichael, R. W. Smith, and J. H. Broehl, Optimization and Modularity Studies for Large- Size, Flat-Panel Array Fields, Battelle-Columbus, 18th IEEE PV Specialists' Conference, Las Vegas, Nevada (October 1985).
29. J. M. Ogden and R. H. Williams, Solar Hydrogen: Moving Beyond Fossil Fuels, World Research Institute, Washington, DC (1989).
30. C. Carpetis, Int. J. Hydrogen Energy, 7, 287 (1982); C. Carpetis, Int. J. Hydrogen Energy, 9, 969 (1984); R. W. Leigh, P. D. Metz and K. Michalek, Brookhaven National Laboratory Report BNL-34081 (December 1983); P. D. Metz and M. Piraino, BNL-51940 (July 1985).
31. E. Fein and K. Edwards, Market Potential of Electrolytic Hydrogen Production in Three North Eastern Utilities' Service Territories, EPRI Report EM-3561 (May 1984); R. F. Craft, Electrolyser Corp., private communication (1985).
32. D. Bleviss, Preparing for the 1990's: The Worm Automotive Industry and Prospects for Future Fuel Economy Innovation in Light Vehicles, Federation of American Scientists, Washington, DC (January 1987).
33. Toyota Press Release (23 October 1985). 34. Urban Ozone and The Clean Air Act: Problems and
Proposals for Change, Staff Paper, Oceans and Environ- ments Program, Office of Technology Assessment (April 1988).
35. Maricopa County Regional Public Transit Authority, Building Mobility: Transit 2020, draft report, Phoenix, Arizona (1988).
36. M. Walsh, Pollution on Wheels, Report to the American Lung Association (11 February 1988).
37. J. Goldemberg, T. B. Johansson, A. K. N. Reddy, and R. H. Williams, Energy for a Sustainable World, World Resources Institute, Washington DC (1987).