Embed Size (px)
Citation preview
A, K, VIJH 506
Electrolytic Hydrogen Evolution Reaction on Aluminum, Oxide-Covered Electrodes
by A. K. Vijh Research & Development Laboratories, Sprague Electric C o m p a n y , N o r t h A d a m s , Massachusetts (Received J u n e 3, 1 9 6 8 )
The electrolytic hydrogen evolution reaction (h.e.r.) on aluminum covered by thin “spontaneous” oxide has been examined iii aqueous, buffered acetate solutions of pH ~ 5 . 5 . Tafel parameters and their temperature dependence have been determined galvanostatically, with emphasis on the effect of time of polarizatioii 011 these parameters. Galvanostatic cathodic charging curves and open-circuit decay of the electrode potential have also been examined. Tafel plots obtained by procedures involving short polarizatioiis show slopes be- tween 2.3 X 3RT/F and 2.3 X 4RT/P, depending on the temperature. On long polarizations, some cathodic “activation” is manifested, which also reduces the values of b to 2.3 X 2RT/F approximately. The initial discharge step is suggested as the probable rate-determining step (rds) iii the overall reaction. This con- clusion is based on the values of Tafel slopes and on the lack of appreciable electrode coverage by adsorbed hydrogen as deduced from transient studies. A cm-2, before surface activation) and apparent heat of activation (11 kcal mol-‘) have been concluded to be consistent with this mechanism. Relation of present studies to the mechanisms of rectification is briefly pointed out.
The values of “apparent” exchange current densities (ca.
I, Introduction In a previous report,1 the iiicclianisni of hydrogen
evolution reaction (h.e.r.) was exaniined on aluminum electrodes which wcre essentially free of “spontaneous” surface oxidrq2 In thc present investigation the iiiech- anisni of 1i.e.r. has IWYI studied on nluniinuin electrodes covered hy a [‘natural” surfacc oxide in solutions (pH d T . 5 ) in wliirh the aluiiiiiiiiin oxidc is thermo- dynamically stsblc.2 The oxidr-covcred aliiniinuni has purposely not been called passivc aluminum here, since oxide filiii~ on valve nietals3 are not passivc in thc sense of oxide films, e.g., on 5 4 4 which are noiiinsulating.
‘I’liere are fern previous iiivestigations on tlie niecha- iiisni of he,r . 011 oxide-covered electrodes,j-* probably because the difficulties involved in the deteriiiinatioii of reliable kinetic parameters on these electrodes are con- siderablc,s owing to rather pronounced irreproducibility from one electrode to anothcr.8-”0 However, i t is still possible to draw unanibiguous mechanistic conclusions froni the general niagnitude of the various kinetic parameters, without coiicediiig precise quantitative sigiiificancc to the data, as mill br attempted. An additional difficulty associated with the electrode proc- esses on oxide-covcred electrodes is the interpretation of anornalous transfcr coefficient^.^-^^"
11. Experimental Section The electrochemical measurements mere carried out
in an aqueous solution which mas 1 in CHSCOOK and 0.22 M in CHaCOOH and had pH -5.5. Pre- electrolysis was purposely not carried out since it mas observed in a previous study‘ that in acetate solutions, preelectrolysis tends to produce rather than remove impurities. All other experimental procedures were similar to those used in other modern work on electrode kinetics12-’6 and in our previous closely related study.’
Preparation of the working electrode surface, however, was modified in the present investigation. After the chemipolishing, etching, washing, etc., sequence,’ the electrodes were either exposed to air for a fern dags or were lrft in distilled water (which was not deaerated) for sevcral days so that the clectrode surfacc acquired a “spontaneous” oxide. Tlir iiieasurcineiits to hc re- ported here were obtained in descending directioii of current density or temperature, unless stated otherwise, since it was observed that data in the descending direc- tion were inore reproducible than those in the ascending direction. This is probably because the electrode becoinex rapidly “coiiditioiied” at higher current deii- sities or temperatures by achieving either a steady-statc contaminatioii17 or a “steady-state” hydration which
(1) A. K. Vijh, J. P h y s . Chem., 72, 114s (1968). (2) 31. Pourbaix, “Atlas D’Equilibres Electrochimiques,” Gauthier- Villars and Co., Paris, 1963, p 16s. (3) L. Young, “Anodic Oxide Films,” Academic Press, New York, N. Y . , 1961. (4 ) I<. J. Vetter. “Electrochemische Kinetik,” Springer, Berlin, 1961; see English translation by Academic Press, New York, N. Y., 1967. (5) A. C . Makrides, J. EZeclrochem. Soc.. 113, 1158 (1966). (6) A, Iv. Frumkin, Discussions Faraday Soc., 1, 67 (1947). (7) J. Weiss, ib id . , 1, 68 (1947); J. Kunze, Corr. Scd., 7, 273 (1967). (8) R. E. Meyer, J . Electrochem. SOC., 107, 847 (1960). (9) A. C. Makrides, ibid. , 109, 977 (1962). (10) J. K. Butler and M. Dienst, ib td . , 112, 226 (1965). (11) A. C. Makrides. ib id . , 113, 1158 (1966). (12) M. Salomon, Ph.D. Thesis, Ottawa, Canada, 1964. (13) J. J. MacDonald and B. E. Conway, Proc. R o y . Soc., A269, 419 (1962). (14) B . E. Conway and M. Dzieciuch, C a n . J . Chem., 41, 21, 38, 55 (1963). (15) J. O’M. Bockris, H. Wroblowa, E. Gileadi, and B. J. Piersma, T r a n s . Faraday Soc.. 61, 2531 (1965). (16) A. K. Vijh and B . E. Conway, Chem. Rev., 67, 623 (1967). (17) G. J. Hills, informal remarks in a session of the Electrochemical Society Symposium held in Toronto, Canada, 1964.
The Journal of Physical Chemistry
ELECTROLYTIC HYDROGEN EVOLUTION REACTION 507
would tend to restrict i t to a certain narrow range of catalytic activity.
111. Results The "spontaneous" oxide exhibited a dc resistance in
the anodic direction which gave rise to a voltage drop of ca. 0.5 Y at an anodic current density of 7.93 X L\ c i ~ i - ~ (or ca. 0.03 V at 1 A ~ i i i - ~ ) . This dc resistancc would be equivalent to a thickncss18 of 0 if the "spon- taneous" barrier oxide is assumed to be composed of amorphous AlzOa. When this electrode is immersed in the experimental solution at about 55", it would acquire a layer of protectivc, nonbarrier, hydrated oxide, the thickness of which may, very roughly, be estimated to be less thanlg 2000 hL by ignoring any specific features that the hydration reaction may exhibit with respect to the anions in the solution.20 This hydrated oxide prob- ably consists of, by anology with the case of pure water, some ratio of amorphous oxide, boehmite and bayerite.lg
I. Tafel Parameters. Since the values of the Tafel parameters were strongly dependent on the time of polarization at a given current density, as well as on the general procedure of obtaining the Tafel plots, four "different" methods were tried for obtaining the Tafel parameters and the results are given below.
In this procedure, the value of electrode potential after approximately 5 sec was recorded. This time is rather arbitrary but is probably sufficient for charging processes to proceed to completion; this length of polarization, however, probably does not (?) result in any profound changes of the electrode surface. The results were reasonably re- producible on a given electrode; e.g., the rate a t a given potential could be reproduced within i20%. The Tafel slopes thus obtained are comparable to ones obtained from the slow portion of an open-circuit einf decay curve.21 Similar procedures have been usedz2 in cases where drastic surface changes are produced by the
( a ) Quasi Steady-State Method.
-14r I 1 I I . I I
I
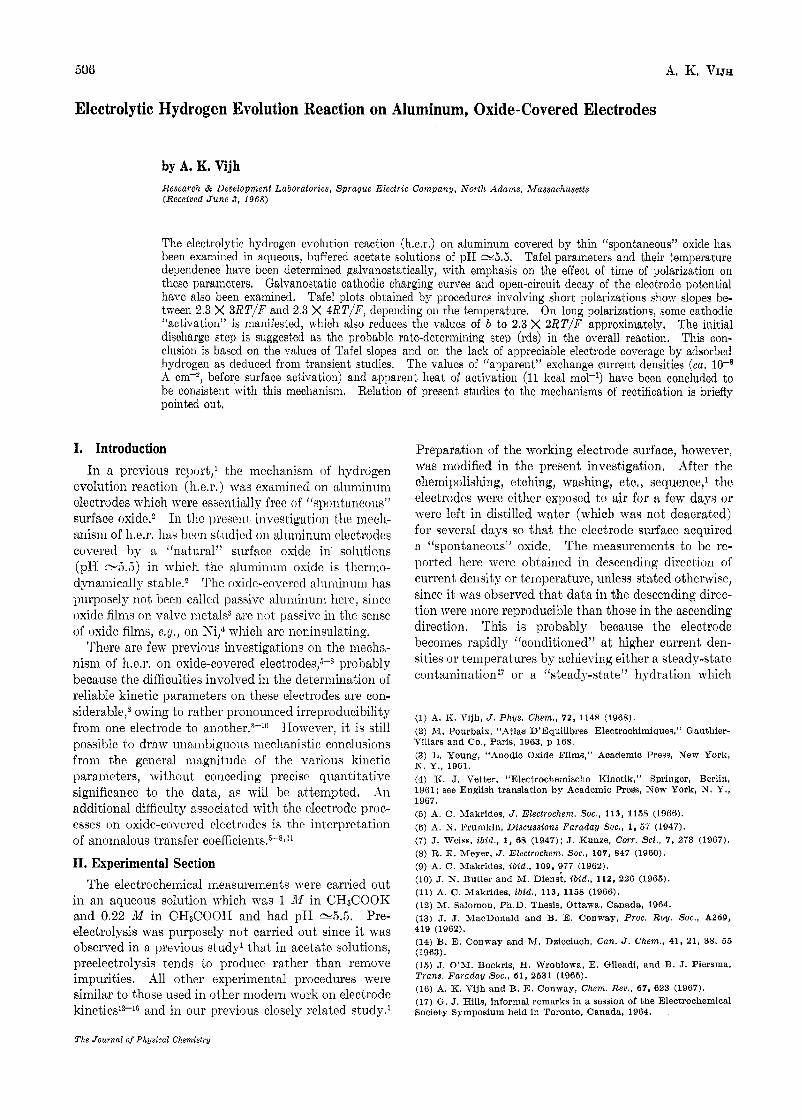
Figure 1. aluminum electrodes obtained by quasi-steady-state procedure a t the indicated temperatures.
Galvanostatic Tafel plots for h.e.r. on oxide-covered
polarization process. Tafel plots obtained on a giveii electrode at various temperatures are shown in Figure 1 and the data have been summarized in Table I.
Temp. -Log i o H*,
50 0.224 7.23 1.621 , 0.286 10.66 40 0.212 7.55 1.603 0.293 10.80 34 0.208 7.72 1.606 0.293 10.82 15 0.196 8.18 1.605 0.291 10.74 2 0.187 8.57 1.604 0.292 10.77
00 b , V ( i o , A cm-2) a , V 01 kcal mol-1
( b ) F r o m Open-Circuit Emf Decay. In Figure 2, electrode potential-log (time) relations obtained from the relevant portions21 of open-circuit emf decay profiles have been presented. The data were obtained by fol- lowing the emf decay on a recorder; they were also
-0.6 h. P -0.5 I
I LOO t I t in secs1
3 4
Figure 2. Plots of electrode potential E us. log t ( t in aec), obtained from slow portions of open circuit emf decay profiles (e.g., Figure 9b at 23'). "Steady-state" polarization prior to the decay. current density prior to the decay and the b values on the subsequent decays are as follows: i = 3.67 X A cm-a, b = 0.133 V; A, E = -1.227 V, i = 7.35 X IOva A cm-2, b = 0.160 V; 0, E = -1.205 V, i = 3.67 X A om-2, b = 0.176 V; 0, E = -1.188 V, i = 1.62 X A om-2, b = 0.180 V.
Electrode potentials and corresponding
., E = -1,305 V,
checked manually. In the absence of a significant pseudo-Faradaic process, the dopes of these lines, i e . , dE/dlogt, have the same significance as the Tafel slopesz1 if the decays are triggered froni high current densities (ca. 21 X low3 A em+!). Tafel slopes are, again, higher than 2.3 X Z R T I F . Value of exchange current density, io, obtained by this is ca.
(18) W. J. Bernard and J. W. Cook, J. Electrochem. Soc., 106, 643 (1959): W. J. Bernard and J. J. Randall, Jr., ibdd., 107, 483 (1960). (19) R. K. Hart, T r a n s . Faraday Soc., 53, 1020 (1957). (20) W. J. Bernard (Sprague Electric Co.), private communication. (21) E. Gileadi and B. E. Conway in "Modern Aspects of Electro- Chemistry," Vol. 3, J. O'M. Bockris and B. E. Conway, Ed., Butterworth and Co. Ltd., London, 1964, Uhapter V. (22) G. Okamoto, M. Kagayama and N. Sat0 in Proceedings of the Eighth CITCE Meeting (Madrid, 1958). Butterworth and 00. Ltd., London, 1958, p 72; 88% also discussion of this paper.
Volume 73, Number 9 March 1969
508 A. K. VIJH
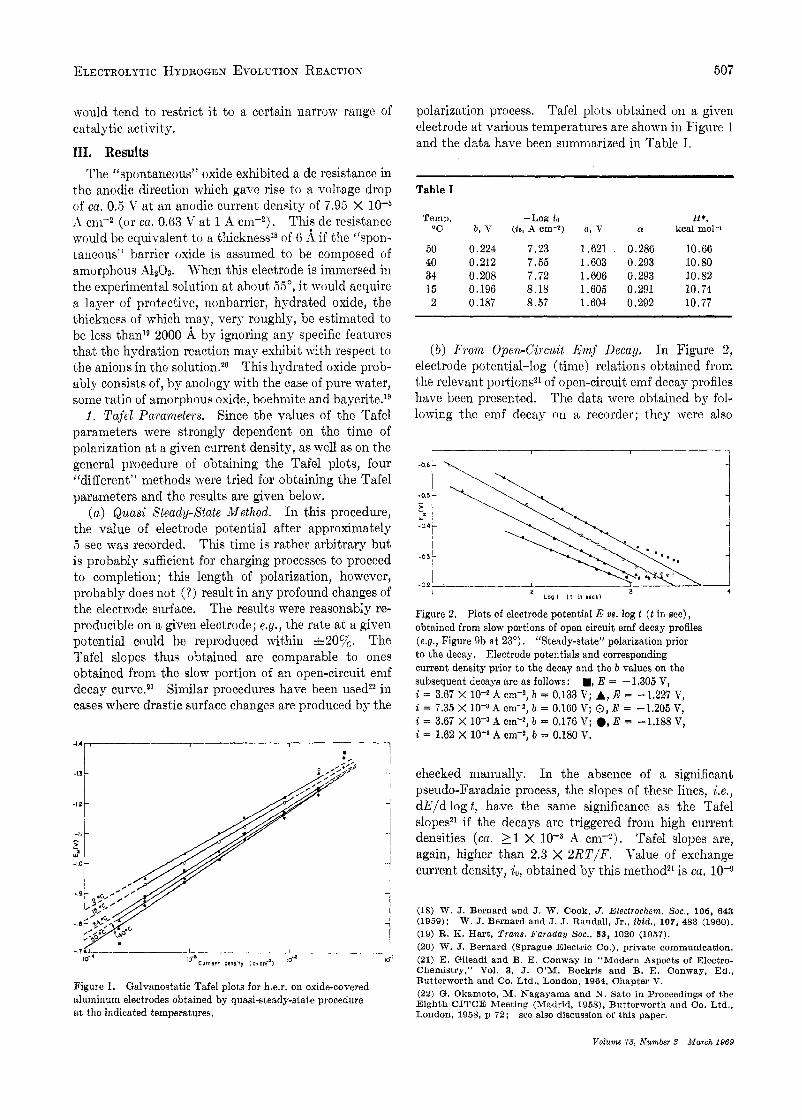
A cm-2. If the dE/d log t is plotted against the initial polarization potential ( i e . , potent,ial before the com- mencement of the decay), a straight line is obtained (Figure 3) . From Figure 3, it may be concluded that
-1.15 -I 2 -1.25 -I 3 E, ( V I
Figure 3. Plot of steady-state polarization potential (before the commencement of the open circuit decay) us. b values obtained from the subsequent decay profiles; temperature 23”.
the higher the initial polarization potential, the lower the “Tafel” slope obtained from the emf decay curve, till a limitingly lower value, 2.3 X 2RT/F, is obtained, thus suggesting some “activation” of the electrode sur- face a t higher cathodic potentials ( c f . 4).
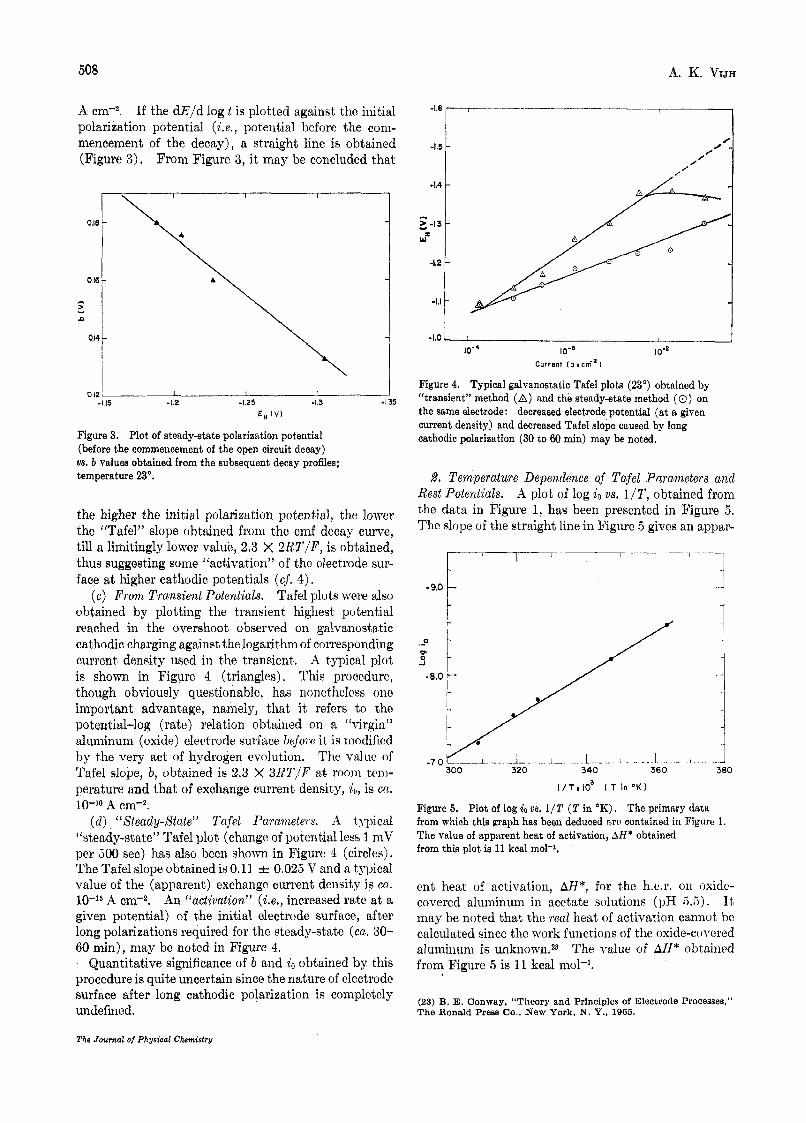
Tafel plots were also obtained by plotting the transient highest potential reached in the overshoot observed on galvanostatic cathodic charging against the logarithm of corresponding current density used in the transient. A typical plot is shown in Figure 4 (triangles). This procedure, though obviously questionable, has iionetheless one important advantage, namely, that i t refers to the potential-log (rate) relation obtained on a “virgin” aluininuni (oxide) electrode surface befow it is modified by the very act of hydrogen evolution. The valuc of Tafel slope, b, obtained is 2.3 X 3 K T I F a t room tem- perature and that of exchange current density, io, is ca. 10-1° A cin-2.
( d ) “Xteady-State” Tufel Paramete~s. 1 1 typical “steady-state” Tafel plot (change of potential less 1 niV per 600 see) has also been shown in Figure 4 (circles). The Tafel slope obtained is 0.11 i 0.023 V and a typical value of the (apparent) exchange current density is CCI.
10-l6 A cm-2. An “activation” (Le. , increased rate a t a given potential) of the initial electrode surface, after long polarizations required for the steady-state (ca. 30- 60 min), may be noted in Figure 4.
Quantitative significance of b and io obtained by this procedure is quite uncertain since the nature of electrode surface after long cathodic polarization is completely undefined.
( c ) Prom Transient Potentials.
-1.6
-1.5
-1.4
- 5 -1.3
w’
-1.2
-1.1
-1.0
Figure 4. Typical galvanostatic Tafel plots (23”) obtained by “transient” method (A) and the steady-state method ( 0 ) on the same electrode: decreased electrode potential (at a given current density) and decreased Tafel slope caused by long cathodic polarization (30 to 60 min) may be noted.
2. Temperature Dependence of Tafel Parameters and Rest Potentials. A plot of log io us. 1/T, obtained from the data in Figure 1, has been presented in Figure 5 , The slope of the straight line in Figure 5 gives an appar-
4 -9.0 1 t c
.-e I-
..I 360
I .
i J
.. - .J 380
I / T x I O ’ ( T in O K )
Figure 5. Plot of log io 2)s. 1/T ( T in OK), The primary data from which this graph has been deduced R r C contained in Figure 1. The value of apparent heat of activation, AH* obtained from this plot is 11 kcal mol-’.
ent heat of activation, AH*, for the 1i.e.r. on oxidc- covered aluminum in acetate solutions (pH 5 . 5 ) . It may be noted that thc real heat of activation cannot he calculated since the work functions of the oxide-covercd aluminum is unknowi~~3 The value of AH* obtained from Figure 5 is 11 kcal mol-’.
(23) B. E. Conway, “Theory and Principles of Electrode Processes,” The Ronald Press Co., New York, N. Y., 1965.
The Journal of Physical Chemistry
ELECTROLYTIC HYDROGEN EVOLUTION REACTION 509
The value of a in the equation, 7 = a - b log i, is virtually constant (1.613 & 0.009 V) a t all tempera- tures (Table I). This implies that (AH* - a?) is equal to zero when the rate is 1 A cm”, in the tempera- ture range 2-50”. This would offer an alternative way of calculating AH* at a given temperature, for every one of the temperatures studied. The values obtained are shown in Table I. The value of AH* is close to 11 kcal mol-’, as would he expected since experimental a values have been used, and, like 01 values themselves (Table I), is independent of temperature. The inde- pendence of AH* from temperature would also be sug- gested by lack of curvature in Figure 5. When a is independent of temperature, b must increase linearly with increasing temperature,u as indeed is observed and is shown in Table I.
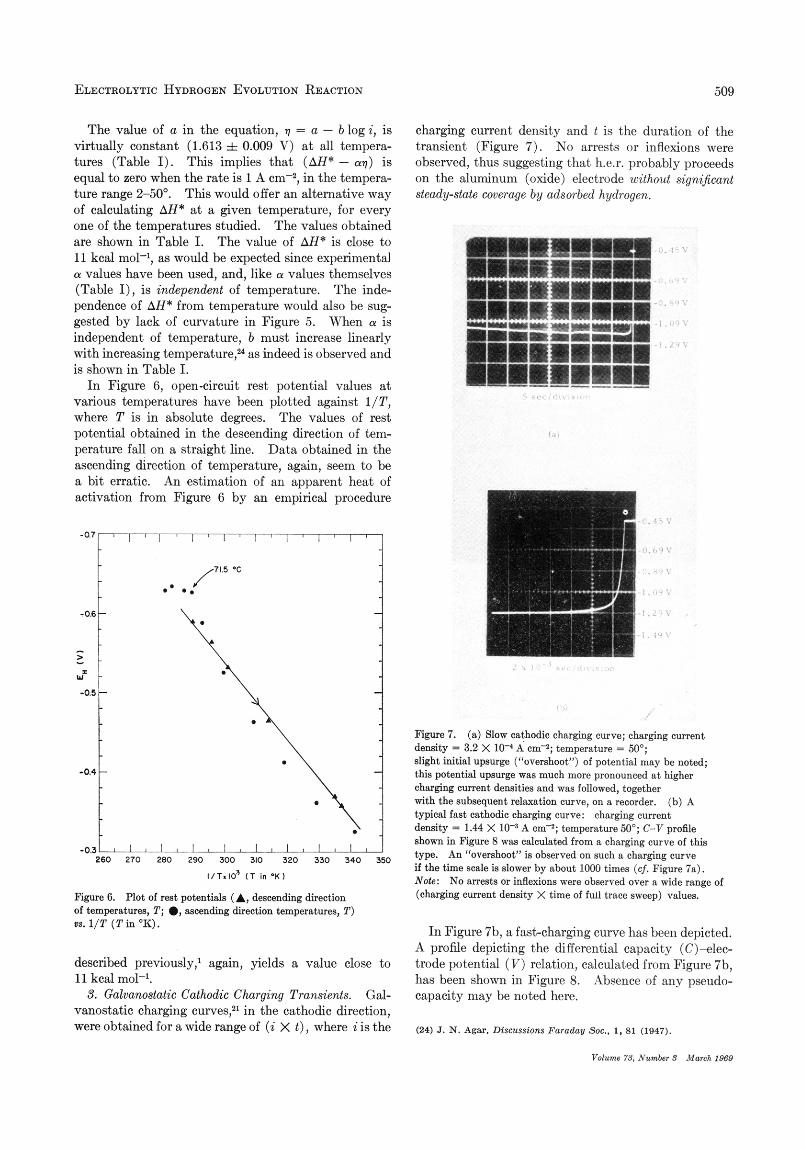
In Figure 6 , open-circuit rest potential values at various temperatures have been plotted against 1 / T , where T is in absolute degrees. The values of rest potential obtained in the descending direction of tem- perature fall on a straight line. Data obtained in the ascending direction of temperature, again, seem to be a bit erratic. An estimation of an apparent heat of activation from Figure 6 by an empirical procedure
?. i - 0 . 3 U L - A
260 270 280 290 300 310 320 330 340 350
IlT.10’ I T in .Kl
Figure 6. Plot of rest potentials (A, descending direction of tempersturea, T; e, Bscending direction temperatures, T) U8.l/T (TinOK).
described previously,’ again, yields a value close to 11 kcal molP.
Gal- vanostatic charging curves:1 in the cathodic direction, were obtained for a wide range of (i X t ) , where i is the
3. Galvanostatic Cathodic Charging Transients.
charging current density and t is the duration of the transient (Figure 7) . No arrests or inflexions were observed, thus suggesting that h.e.r. probably proceeds on the aluminum (oxide) electrode without significant steady-state coverage by adsorbed hydrogen.
Figure 7. (a) Slaw cathodic ohmging curve; charging current density = 3.2 X 10⁻⁴ A em-’; tempersture = 50’; slight initial upsurge (“overahoot”) of potential may be noted; this potential upsurge was much more pronounced a t higher charging current densities and was followed, together with the subsequent relaxation curve, on a recorder. (b) A typical fast oathodic charging curve: charging current density = 1.44 X A m - 3 ; temperature 50”; C-V profile shown in Figure 8 was calculated from a charging curve of this type. An “overshoot” is observed on such a charging curve if the time a d e is slower by about 1000 times ( c j . Figure 78). Note: No arrests or inflexions were observed over a wide range of (charging current density X time of full trace sweep) values.
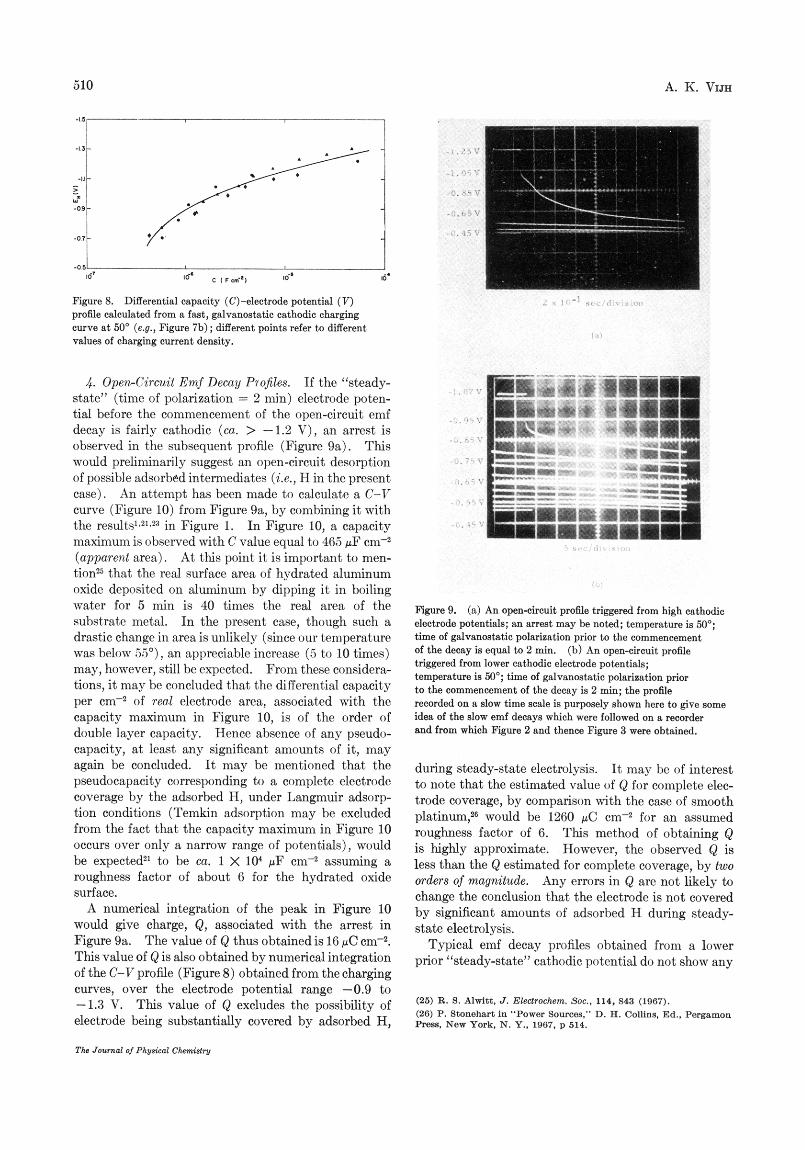
In Figure 7b, a fast-charging curve has been depicted. A profile depicting the differential capacity (C)-elec- trnde potential ( V ) relation, calculat,ed from Figure 7b, has been shown in Figure 8. Absence of any pseudo- capacity may be noted here.
(24) J. N. Agar. Dtsw$stons Faraday Soc., I , 81 (1947).
510 A. K. VIJH
Figure 8. profile calculated from a fast, gdvmo&dic cathodic oharging cwve at 50' (e.g., Figure 7b); different paints refer to ditIerent values of charging current density.
Differential capacity (C)-electrade potential (7)
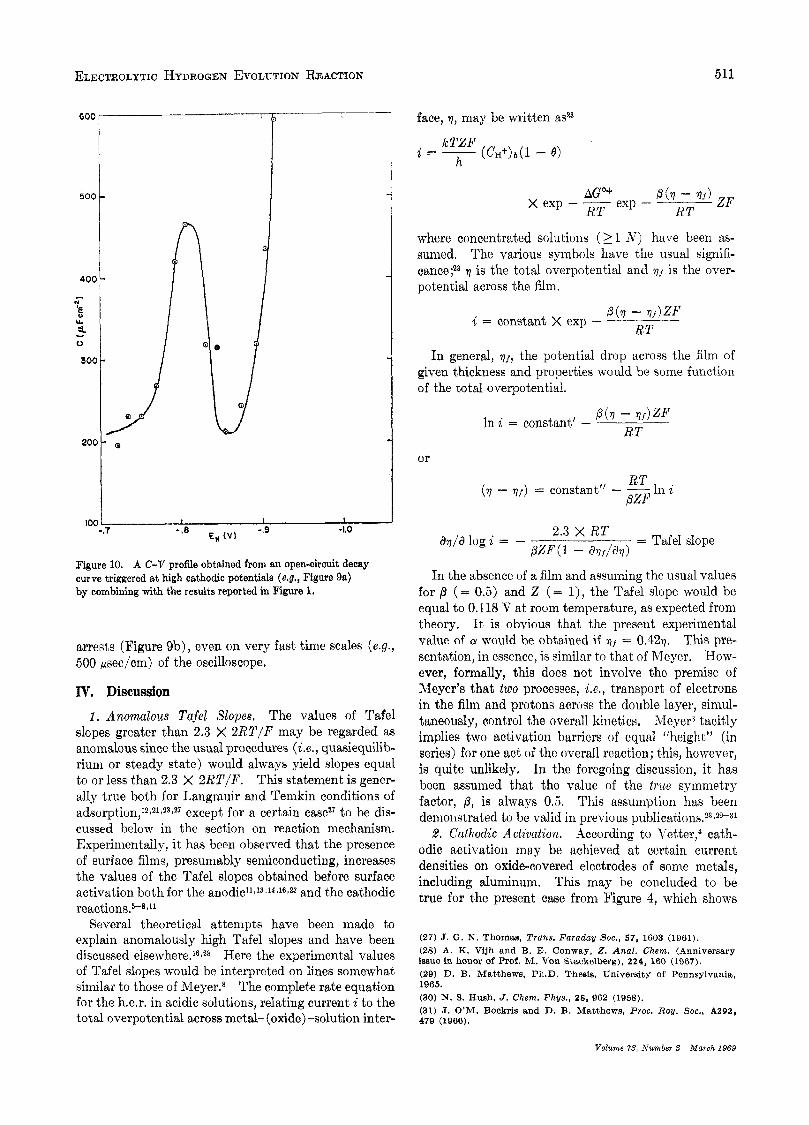
4. Open-circuit Emf Decay P70fikS. If the "steady- state" (time of polarization = 2 min) electrode poten- tial before the commencement of the open-circuit emf decay is fairly cathodic (ca. > -1.2 V), an arrest is observed in the subsequent profile (Figure sa) . This would preliminarily suggest an open-circuit desorption of possible adsorbedintermediates (Le., H in the present case). An attempt has been made to calculate a C-V curve (Figure 10) from Figure 9a, by combining it with the results1~21.2a in Figure 1. In Figure 10, a capacity maximum is observed with C value equal to 465 pF cm-2 (apparent area). At this point it is important to men- tionZs that the real surface area of hydrated aluminum oxide deposited on aluminum by dipping it in boiling water for 5 min is 40 times the real area of the substrate metal. In the present case, though such a drastic change in area is unlikely (since our temperature was below 5 2 ) , an appreciable increase (5 to 10 times) may, however, still be expected. From these considera- tions, it may be concluded that the differential capacity per of real electrode area, associated with the capacity maximum in Figure 10, is of the order of double layer capacity. Hence absence of any pseudo- capacity, a t least any significant amounts of it, may again be concluded. It may be mentioned that the pseudocapacity corresponding to a complete electrode coverage by the adsorbed H, under Langmuir adsorp- tion conditions (Temkin adsorption may be excluded from the fact that the capacity maximum in Figure 10 occurs over only a narrow range of potentials), would be expected2' to be ea. 1 X lo4 pF assuming a roughness factor of about 6 for the hydrated oxide surface.
A numerical integration of the peak in Figure 10 would give charge, Q , associated with the arrest in Figure 9a. The value of Q thus obtained is 16 pC cm-*. This value of Q is also obtained by numerical integration of the C-V profile (Figure 8) obtained from the charging curves, over the electrode potential range -0.9 to -1.3 V. This value of Q excludes the possibility of electrode being substantially covered by adsorbed H,
The Jarrnol ol Phyaieol Chamktry
R g u ~ 9. electrode potentials; an arrest may be noted; temperature is 50"; time of galvsnaststic polariastion prior to the commencement of the deosy is equal to 2 min. (h) An open-circuit profile triggered from lower cathodic electrode potentials; temperature is 50'; time of galvsnostatic polariaation prior to the commencement of the decay is 2 mi"; the profile reoorded on a slow time sa le is purposely shown here to give some idea of the slow emf decays which were followed on B recorder and from which Figure 2 snd thence Figure 3 were obtained.
(a) An open-circuit profile triggered from high cathodic
during steady-state electrolysis. It may be of interest to note that the estimated value of Q for complete elec- trode coverage, by comparison with the case of smooth platinum,lE would be 1260 pC em* for an assumed roughness factor of 6. This method of obtaining Q is highly approximate. However, the observed Q is less than the Q estimated for complete coverage, by two orders of magnitude. Any errors in Q arc not likely to change the conclusion that the electrode is not covered by significant amounts of adsorbed H during steady- state electrolysis.
Typical emf decay profiles obtained from a lower prior "steady-state" cathodic potential do not show any
(25) R. S. Alwitt. J. Eledrochern. Soc., 114. 843 (1067). (26) P. Stonehart In "Power Sources," D. A. Collins. Ed.. Pergamon Press, New York. N. Y.. 1067. p 514.
ELECTROLYTIC HYDROGEN EVOLUTION REACTION 511
600
500
400
0
yg L a Y
0
300
200
IOC
I P -7-
Figure 10. A C-V profile obteined from en open-circuit decay curve triggered at high oathodic potentials (e.g., Figure 9a) by combining with the results reported in Figure 1.
arrests (Figure 9b), even on very fast time scales (e.g., 500 psec/cm) of the oscilloscope.
IV. Discussion 1. Anomalous Tafel Slopes. The values of Tafel
slopes greater than 2.3 X 2RT/F may be regarded as anomalous since the usual procedures (Le., quasiequilib- rium or steady state) would always yield slopes equal to or less than 2.3 x 2RT/F. This statement is gener- ally true both for Langniuir and Teiiikin conditions of a d ~ o r p t i o n , 1 ~ ~ ~ 1 ~ ~ ~ ~ ~ ~ except for a certain case2? to be dis- cussed below in the section on reaction mechanism. Experimentally, it has been observed that the presence of surface films, presumably semiconducting, increases the values of the Tafel slopes obtained before surface activation both for the a n o d i ~ ~ ~ J ~ ~ ~ ~ J ~ ~ ~ ~ and the cathodic r eac t ion~ .~ -~J~
Several theoretical attempts have been made to explain anomalously high Tafel slopes and have been discussed elsemhere.16~z* Here the experimental values of Tafel slopes would be interpreted on lines somewhat similar to those of Meyer.8 The complete rate equation for the h.e.r. in acidic solutions, relating current i to the total overpotential across metal- (oxide) -solution inter-
face, ?, may be written asz3
P(r - ?If) ZF RT
exp - AG ’+
X exp - __ RT
where concentrated solutions ( 2 1 N ) have been as- sumed. The various symbols have the usual signifi-
r is the total overpotential and vf is the over- poteiitial across the film.
P(r - rlf)ZF RT i = constant X exp -
In general, ~ f , the potential drop across the film of given t,hickness and properties would be some function of the total overpotential.
P(r - rif)ZF RT
In i = constant’ -
or
RT (7 - ~ f ) = constant” - __In i
PZF
2.3 X RT PZF(1 - dtlf/dV)
= Tafel slope as/a log i = -
In the absencc of a film and assuming the usual values for fl (= 0.5) and Z (= 1), the Tafel slope would be equal to 0.118 V at room temperature, as expected from theory. It is obvious that the present experimental value of 01 would be obtained if 71 = 0.427. This pre- sentation, in essence, is similar to that of Meyer. How- ever, formally, this does not involve the premise of 3Ieyer’s that two processes, i.e., transport of electrons in the film and protons across the double layer, simul- taneously, control the overall kinetics, ,Ifeyers tacitly implies two activation barriers of equal “height” (in series) for one act of the overall reaction; this, however, is quite unlikely. In the foregoing discussion, it has been assumed that the value of the true symmetry factor, P, is always 0.5. This assumption has been demonstrated to be valid in previous p u b l i c a t i o n ~ , ~ ~ ~ ~ ~ - 3 ~ 2. Cathodic A ctiuation. According to Yettert4 cath-
odic activation may be achieved at certain ourreiit densities on oxide-covered electrodes of some metals, including aluminum. This may be concluded to be true for the present case from Figure 4, which shows
(27) J. G. N. Thomas, Trans. Faraday SOC., 57, 1603 (1961). (28) A. K. Vijh and B. E. Conway, Z . Anal. C h e n . (Anniversary issue in honor of Prof. M. Von Stackelberg), 224, 160 (1967). (29) D. B. Matthews, Ph.D. Thesis, University of Pennsylvania, 1965. (80) N. 9. Hush, J. Chem. Phys. , 28, 962 (1958). (31) J. O’M. Bockris and D. B. Matthews, Proc. Roy. Soc.. A292, 479 (1966).
Volume Y3, Number 9 March 1060
512 A. K, VIJH
-1.4.
- - I S > - d
-1.1
that activation results in lowering of Tafel slope, and the polarization values for a given rate of h.e.18.
It may be mentioned that the cathodic activation is also suggested by the fact that (Figures ’2 and 3) the higher the initial polarization current density prior to the open circuit emf decay, the lower is the potential (even lower than the quasi-steady rest potential) to which the subsequent decay curve descends down. If the emf decay curve descends down to potentials lower than the quasi-steady rest potential, profound surface changes (activation?) must be inferred; in the limiting case, this activation would be expected to be so pro- nounced that the decay curve may even approach the reversible hydrogen potential, although only transiently.
It has been shown in the sec- tion on Results [111 ( 3 ) and I11 (4)] that the h.e.r. proceeds on oxide-covered electrodes without significant concentration of adsorbed H on the electrode. This would tend to exclude radical-ion and recombination as the possible rate-determining steps.1~12~21~23~27~29~32
The Tafel slopes observed on oxide-covered aluminum (Figures 1, 2, 4; Table I) are, most likely, values of 2.3 X Z R T I F which have been modified by the presence of oxide. This observa- tion, when combined with lack of significance concen- tration of adsorbed H, would uniquely give initial dis- charge step as the likely rds. Discussion of other possible me~hanisms@J’~ and related theory has been given previously.’
The exchange current densities and apparent heats of activation observed in the present investigations are quite consistent with the initial discharge as the rds.’ Independence of a from temperature (Tablo I) would exclude the iniportance of entropy and adsorption
3. Electrode Coverage.
4. Reaction Mechanism.
- -
I 1 7-7
-I.’ I----
4 6 e pn
-“o- ;
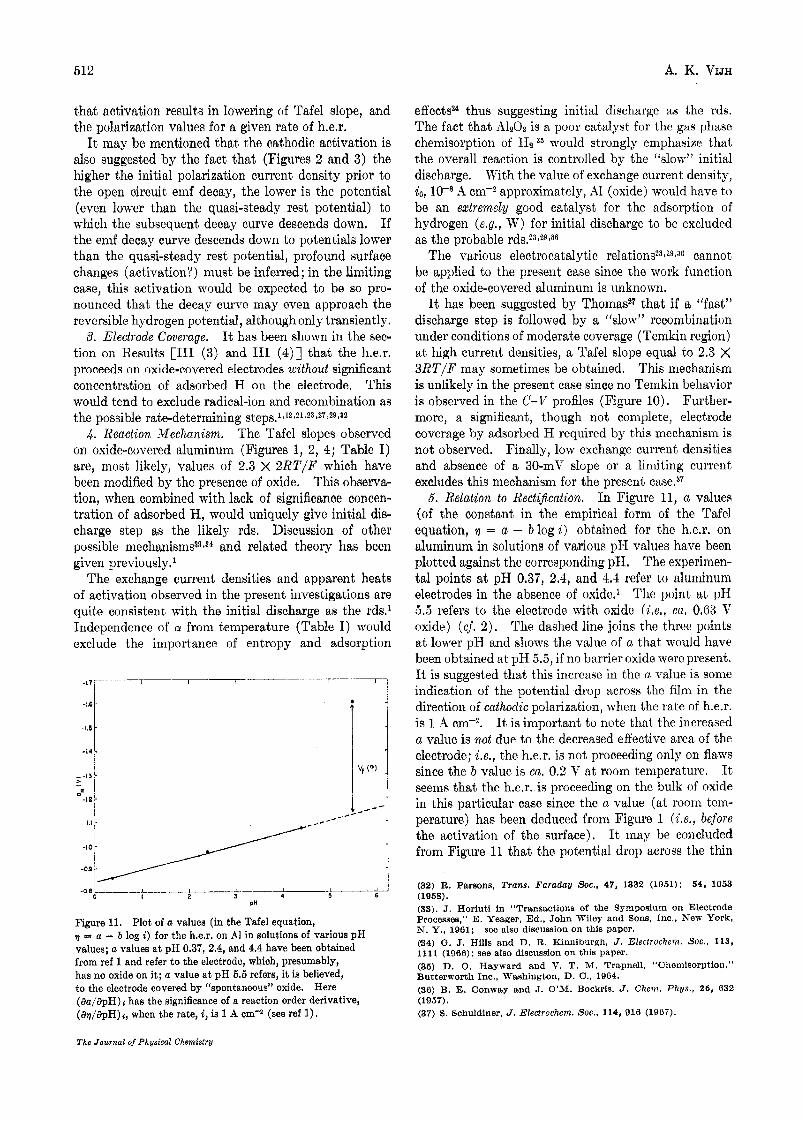
Figure 11. Plot of a values (in the Tafel equation, q = a - b log i) for the h.e.r. on A1 in solutions of various pH values; a values a t pH 0.37, 2.4, and 4.4 have been obtained from ref 1 and refer to the electrode, which, presumably, has no oxide on i t ; a value a t pH 5.5 refers, it is believed, to the electrode covered by “spontaneous” oxide. Here (aa/apH) I has the significance of a reaction order derivative, (av/apH)i, when the rate, i, is 1 A om-# (see ref 1).
effects2* thus suggesting initial discharge as the rds. The fact that A1203 is a poor catalyst for the gas phasc chemisorption of H2 35 would strongly emphasize that the overall reaction is controlled by the “slow” initial discharge. With the value of exchange current density, io, A approximately, A1 (oxide) would have to be an extremely good catalyst for the adsorption of hydrogen (e.g., W) for initial discharge to be excluded as the probable rds.23,29,36
The various electrocatalytic relations23~2QJ~ cannot be applied to the present case since the work function of the oxide-covered aluminum is unknown.
It has been suggested by Thomas2’ that if a “fast” discharge step is followed by a “slow” recombination under conditions of moderate coverage (Temkin region) a t high current densities, a Tafel slope equal to 2.3 X 3 R T / F may sometimes be obtained. This mechanism is unlikely in the present case since no Temkin behavior is observed in the C-V profiles (Figure 10). Further- more, a significant, though not complete, electrode coverage by adsorbed H required by this mechanism is not observed. Finally, low exchange current densities and absence of a 30-mV slope or a limiting current excludes this mechanism for the present case.37
6. Relation to Rectification. In Figure 11, a values (of the constant in the empirical form of the Tafel equation, 17 = a - blogi) obtained for the h.e.r. on aluminum in solutions of various pH values have been plotted against the corresponding pH. The experimen- tal points a t pH 0.37, 2.4, and 4.4 refer to aluminum electrodes in the absence of oxide.’ The point a t pII 5.5 refers to the electrode with oxide (Le , , ca. 0.03 V oxide) ( c j . 2 ) . The dashed line joins the three points a t lower pH and shows the value of a that would have been obtained at pH 5.5, if no barrier oxide were present. It is suggested that this increase in the a value is some indication of the potential drop across the film in the direction of cathodic polarization, when the rate of h.e.r. is 1 A cm-2. It is important to note that the increased a value is no2 due to the decreased effective area of the electrode; i.e., the h.e.r. is not proceeding only on flaws since the b value is ca. 0.2 V at room temperature. It seeins that the h.e.r. is proceeding on the bulk of oxide in this particular case since the a value (at roonz tem- perature) has been deduced from Figure 1 ( L e . , before the activation of the surface), It rnay be concluded from Figure 11 that the potential drop across the thin
(32) R. Parsons. Trans. Faraday Soc., 47, 1332 (1951); 54, 1053 (1968). (33). J. Horiuti in “Transactions of the Symposium on Electrode Processes,” E. Yeager, Ed., John Wiley and Sons, Inc., New York, N. Y., 1961; cj4) G. J. Hills and D. R. Kinniburgh, J. Electrocitem. Soc., 113, 1111 (1966); see also discussion on this paper. (35) D. 0. Hayward and V. T. M. Trapnell, “Chemisorption,” Butterworth Inc.. Washington, D. C., 1964. (36) B. E. Conway and J. O’M. Bockris, J. Chem. Phys. , 26, 632 (1957). (37) S. Schuldiner. J. Electrochem. Soc., 114, 916 (1907).
see also discussion on this paper.
The Journal of Physical Chemistry
ELECTRONIC PROPERTIES OF TCNQ COMPLEXES 513
barrier film is almost the same both in the anodic and cathodic direction of polarization. That would suggest that very thin films of oxide formed spontaneously probably do not rectify, a t least, not before activation
in the cathodic direction of polarization. Most of these conclusions are, obviously, quite tentative and would need much more elaborate investigations of the matters mentioned above.
(flaw production?) of the surface has been achieved by some initial cathodic polarization. Here, it has been assumed that both Faradaic rectification (at film- solution interface)3* and any possible rectification at the metal-oxide interface are negligible and do not enter into the argument. This behavior may be contrasted with that of anodically grown thicker films which are known to rectify when placed in metal-oxide-electrolyte configuration.ag Here, an implied conclusion is that thin films which are probably continuous (i.e., without flaws) before cathodic activation do not rectify whereas thicker films of the same oxide do rectify and hence39 must have flaws at which t8he h.e.r. is sustained without developing an appreciable potential drop across the film
Acknowledgments. The author wishes to acknowl- edge helpful discussions with Drs. Robert S. Alwitt and Glenn 31. Cook of these laboratories and Dr. 31, Salomon of NASA, ERL, Cambridge, Massachusetts. Thanks are also due to Nr. W. Hilchey, of Sprague Test Equipment Department, for assistance in calibra- tion of the instruments.
(38) K. S. 0. Doss and H. P. Agarwal, J . Se i . Ind. Res. India, 9B, 280 (1950); see also Proc. Indian Acad. Sci., 34A, 263 (1951); 35A, 45 (1952); (39) Symposium on "Electrolytic Rectiflcation and Conduction Mechanisms in Anodic Oxide Films," P. F. Schmidt and D. M. Smyth, Ed., The Electrochemical Society Inc., New York, N. Y., 1967.
also see ref 23.
Electronic Properties of Some TCNQ Complexes1
by A. Rembaum, A. M. Hermann, F. E. Stewart, and F. Gutmann Polymer Research Section. Jet Propulsion Laboratory, Californ6a Institute of Technology, Pasadena, California 91103 (Received June 1 3 , 1968)
A study of electrical properties of tetracyanoquinodimethaiie (TCNQ) complexes representing unit segments of nonconjugated as well as conjugated polymers is described. Corresponding studies with the analogous polymer complexes are presented. The model compounds choseii were a saturated donor I ,2-bis(4-pyridyl)- ethane and an unsaturated donor 1,2-bis(4-pyridyl)ethylene. Analyses are presented to substantiate the chemical structure. Electron spin resonance studies show the triplet nature of the complexes, and rotational anisotropy in compressed pellets denionstrates orientation of molecules or crystallites during compression. Electronic transport properties iiicludiiig the first reported measurement of the Hall effect in TCNQ complexes are described. These measurements along with conipanion studies of conductivity and therinoelectric power indicate concentration of carriers of several orders of magnitude below that of the unpaired spins. The transport data presented are interpreted in terms of band theory.
Spectrophotometric data are in agreement with previous results.
I. Introduction It was recently reported that certain heterocyclic
salts exhibit an exceptionally high cond~ctivity.**~ These compounds may be represented by the general formula D+(TCNQ-) in which D is an aromatic molecule generally containing a nitrogen atom and (TCNQ-) symbolizes 7,7' , 8,8'-tetracyanoquinodi- methane in the form of a paramagnetic radical anion. Neutral TCNQ molecules may also take part in the complex in which case the electrical conductivity is increased by several orders of magnitude. A number of the TCNQ complexes exhibit room temperature conductivity varying from about 10-6 up to about
1 ohn1-l cm-l, Le., the highest conductivity of organic crystals known to date. It was also shown recently2b that polymeric analogs of the TCNQ salts can be prepared. One such complex, copoly (styrene) ,1- butyl-2-vinylpyridinium (TCNQ-) TCNQ had a conductivity of ohm+ cm-1 and these polymeric
(1) This paper represents one phase of research performed by the Jet Propulsion Laboratory, California Institute of Technology, sponsored by the National Aeronautics and Space Administration, Contract NAS7-100. (2) (a) R. G. Kepler, J . Chem. Phys. , 39, 3528 (1963): (b) J. H. Lupinski and K. D. Kopple. Sctence, 146, 1038 (1964). (3) L. R. Melby, R. J. Harder, W. R. Hertler, W. Mahler, R. E. Benson, and W. E. Mochel, J. Amer. Chem. SOC., 84, 3374 (1962).
Volume '7SP Number 9 March 1969