Embed Size (px)
Citation preview

Research Article
Electrogenerated ferrate(VI) forCE–chemiluminescence detection todetermine benzenediol isomers
Based on the quenched chemiluminescence intensity of the luminol reaction sensitized
by ferrate(VI) in alkaline medium, a novel CE with on-line inhibited method for the
simultaneous analysis of benzenediol isomers was developed. The ferrate(VI) solution was
freshly prepared by electrochemical technique before electrophoresis. The parameters
influencing detection and separation were carefully investigated. Baseline separation of
benzenediols including catechol, resorcinol, and hydroquinone was achieved in less than
8 min with 5.0 mmol/L sodium tetraborate and 2.0 mmol/L luminol at an applied voltage
of 18 kV. The LODs (S/N 5 3) for catechol, resorcinol and hydroquinone were determined
to be 8.5� 10�9, 8.0� 10�7 and 6.5� 10�9 mol/L, respectively. Finally, the proposed
method was applied for phenolic compounds in hair dye.
Keywords: Benzenediol isomers / CE / Chemiluminescence / Ferrate(VI) / Hair dyeDOI 10.1002/jssc.200900511
1 Introduction
CE, with its high separation efficiency, minimal reagent
consumption, short analysis time and low-cost analyses, has
been widely investigated as a powerful and prevailing
analytical separation tool. It is commonly combined with
UV/vis spectrometry, LIF, MS and chemiluminescence (CL)
to determine different kinds of analytes [1–6]. Since there is
no need for an external energy supply, CL can provide
higher sensitivity and simplicity compared with other
detections, and it is uniquely suited to on-line detection
for CE. CE combined CL (CE-CL) has been successfully used
as an attractive scheme for the analysis of metal ions [7–8],
organic substances [9–12], amino acids [13–14], and
antigen–antibody complexes [15–18]. Typically, the CL
systems consist of CL reagent, oxidant and catalyst.
Common oxidants include hydrogen peroxide, potassium
ferricyanide and potassium permanganate, and so on.
Hydrogen peroxide, which is the most frequently utilized,
can be problematic, as it might be unstable due to bubble
formation in CE. It is a great challenge to search for new CL
oxidants to extend the applications of CL reactions.
Hexavalent iron species (ferrate(VI)), which possesses a
strong oxidizing power, relatively high redox potential and
environmentally friendly by-product, is the high-oxidation-
state compound of iron. Over the last two decades, fer-
rate(VI) has been widely investigated as the oxidant in
environmental remediation [19], as catalyst in organic
synthesis [20], and more recently as cathodic charge storage
material [21]. Stupin et al. [22] reported that the mixing of
the solid sodium ferrate(VI) and luminol solution in alka-
line medium can generate a strong, lasting CL signal. They
also found that certain d-metals and surfactants can affect
the CL signal. These imply that ferrate(VI)–luminol system
has a good potential to be applied in analytical chemistry.
Unfortunately, they did not make an intensive study of these
phenomena. To our best knowledge, no reports have been
published on ferrate(VI)–luminol CL system for CE
separation.
At present, the preparation methods of ferrate(VI)
include chemical method, electrochemical method and
thermal method. Because of its simple operation, safety and
free-hypochlorite, the electrochemical method has been
chosen as the most promising technique and it is very
suitable to synthesize ferrate(VI). The basic principle of
production is shown in Eqs. (1) and (2) [23].
Anode reaction:
Feþ 8OH� ! FeO2�4 þ 4H2Oþ 6e ð1Þ
Cathode reaction:
3H2O! 3H2 þ 6OH� � 6e ð2Þ
We found that the stable sodium ferrate(VI) solution
could be electrochemically produced with low concentration
of sodium hydroxide at low temperature. Mixing it
Fang Li1,2
Yonggang Hu1
Huijing Zhang1,2
Jie Zhang3
1State Key Laboratory ofAgricultural Microbiology,College of Life Science andTechnology, HuazhongAgricultural University, Wuhan,P. R. China
2College of EnvironmentalScience and Engineering,Huazhong University of Scienceand Technology, Wuhan,P. R. China
3College of EnvironmentalScience and Technology,Huangshi Institute ofTechnology, Huangshi,P. R. China
Received July 27, 2009Revised November 8, 2009Accepted November 10, 2009
Abbreviations: CE-CL, CE combined CL; CL,
chemiluminescence
Correspondence: Dr. Yonggang Hu, State Key Laboratory ofAgricultural Microbiology, College of Life Science and Technol-ogy, Huazhong Agricultural University, Wuhan 430070,P. R. ChinaE-mail: [email protected]: 186-27-6201-3553
& 2010 WILEY-VCH Verlag GmbH & Co. KGaA, Weinheim www.jss-journal.com
J. Sep. Sci. 2010, 33, 631–636 631
with luminol solution could give rise to a strong, stable
and homogeneous CL signal. The CL signals could
be inhibited by benzenediol isomers, and the inhibited
CL signals were highly dependent on the concentration
of benzenediols. Based on these, we developed a novel
highly sensitive indirect CL detection for CE analyzing
of benzenediol isomers. This proposed method was
then applied to detect benzenediols in a real practical
sample.
2 Materials and methods
2.1 Materials
All the chemicals were of analytical grade. Luminol was
purchased from Alfa Aesar (USA). Benzenediol isomers
were supplied by the Chemical Reagent Factory of Shanghai
(Shanghai, China). Sodium hydroxide (NaOH) from the
Third Chemical Reagent Factory of Tianjin (Tianjin, China)
was used to produce ferrate(VI). All solutions were prepared
with doubly distilled water and filtered through a 0.22 mm
pore-size membrane filter before use. The water was
produced by doubly distilled water system (SZ 93, Shanghai
Yarong Biochemistry Instrument Factory, Shanghai,
China).
The hair dye sample (claret-red) was purchased from
Yaer Cosmetic of Guangzhou (Guangdong, China). It was
stored in a refrigerator at 4711C, and diluted 100 times by
running buffer before the analysis.
2.2 Apparatus
All the detections were operated on a laboratory-built
CE-CL detection equipment, designed as described
previously [24]. A 0–30 kV high-voltage DC power supply
(Nucleus Institute, Shanghai, China) provided for separa-
tion. A photomultiplier tube (Hamamatsu, Japan) operated
at �843 V was used to detect the photons. The captured
photocurrent was magnified by a signal magnifier (Nanjing
University, Nanjing, China) and recorded by HW-2000
chromatogram station (Qianpu Software, Shanghai,
China). A separation capillary of 55 cm� 50 mm
id, a reagent capillary of 25 cm� 200 mm id and
a reaction capillary of 15 cm� 530 mm id (Yongnian Optical
Fiber Factory, Hebei, China) were used in the CE-CL
system.
The synthesis of ferrate(VI) was carried out in a
homemade two-compartment cell, which was divided by
cationic exchanged membrane (Asahi Kasei, Japan). The
stainless steels were selected to produce ferrate(VI) similarly
as described in [25]. The RS1303DQ DC power source
(Shenzhen RICH Test & Measurement Instrumentation,
Guangdong, China) was used to supply the constant
current. The magnetic bar driven by a standard stirrer was
purchased from Yihua, Ltd. (China).
2.3 Procedure
Two 16 cm2 (apparent area) sheets of stainless steel were
employed as anode and cathode, respectively. The electro-
lytes in both compartments were 0.3 mol/L NaOH solution,
and their volume was 100 mL. The anode was activated by
cathodic polarization for 30 min at a constant current of
1.0 A before the start of electro-synthesis [26]. Cell
temperature was controlled within 711C by ice-water
cooling bath. Electrogenerated ferrate(VI) was added in a
brown bottle and then the system was put into an ice-water
cooling system to maintain the stability of ferrate(VI). The
content of ferrate(VI) was determined by the chromite
method [27].
The capillaries were successively rinsed using a syringe
with 0.1 mol/L NaOH, 0.1 mol/L HCl and doubly distilled
water for 10 min respectively, followed by equilibration with
the running buffer (pH 5 9.2) for 1 h. The whole system
was placed 20 cm above the outlet of reaction capillary so
that the ferrate(VI) solution could be continuously delivered
via gravity. The buffer was introduced into the separation
capillary by electroosmotic flow. The sample solution was
introduced at the positive electrode from a height of 20 cm
by siphoning. All separations were performed at 25711C.
The quantitation of three test benzenediol compounds were
operated by measuring the net CL intensity DI 5 I0–Ii,
where I0 was the CL intensity of blank signal of ferrate-
(VI)–luminol reaction and Ii was the ICL intensity induced
by the test analyte.
3 Results and discussion
3.1 Influence of electrochemical-synthesizing param-
eters on CE-CL system
Anode passivation layer, which is a firm film developed on
the surface of the anode, prevents the pathways of electron
flow and then breaks the electrolytic process [23]. In order to
reactivate the anode and ensure the repeatability of
ferrate(VI) production yield, cathodic polarization was
selected to destroy the passive layer before synthesis.
As previously reported, the internal cell temperature
was a crucial factor for electrochemically synthesizing
ferrate(VI) solution [20]. A high cell temperature generally
speeded up ferrate(VI) synthesis, but it also increased the
rates of ferrate(VI) decomposition and induced baseline
drift. In addition, the storage temperature of ferrate(VI)
solution was also significant for the CL detection. When the
ferrate(VI) solution was synthesized and stored in ice-water
cooling bath, the stable baseline and minimal noise levels
could be obtained.
In the previous reports, high concentration of NaOH
solution is predominantly utilized as an electrolyte to
synthesize the ferrate(VI) solution. However, strong causti-
city of high-concentration NaOH was harmful to the fused-
silica capillary detection window and the subsequent CL
J. Sep. Sci. 2010, 33, 631–636632 F. Li et al.
& 2010 WILEY-VCH Verlag GmbH & Co. KGaA, Weinheim www.jss-journal.com

detection. This problem could be solved by the use of low
concentration NaOH solution as electrolyte. Influences of
NaOH concentration on ferrate(VI) production yield and CL
detection were carefully investigated from 0.2 to 0.6 mol/L.
The ferrate(VI) production yield continuously rose with the
NaOH concentration (Fig. 1A), and this was similar to that
described in [20]. The CL signal intensities increased with
the ferrate(VI) concentration, and reached a maximum at
0.26 mmol/L (Fig. 1B). Further increasing the ferrate(VI)
concentration produced a decrease of the CL signal inten-
sities, which might be due to the self-absorption of ferra-
te(VI). As a result, 0.3 mol/L NaOH, with which 0.26 mmol/
L ferrate(VI) was produced, was selected.
Electrolytic current played an important role in fer-
rate(VI) production yield and CL signal intensities. The
concentration of ferrate(VI) increased with the electrolytic
current and up to 2.0 A (Fig. 2A). A large electrolytic current
caused the increase of the oxygen evolution rate to be larger
than that of ferrate(VI) yield, led to a rapid inactivation of
the surface of electrode and then a dramatic decline of
ferrate(VI) production yield. As shown in Fig. 2B, the CL
signal intensities rose with the concentration of ferrate(VI),
and the maximum CL signal intensities appeared at
0.32 mmol/L corresponding to the electrolytic current in
1.8 A. Thus, 1.8 A was chosen to be the optimum electrolytic
current.
Subsequently, dependence of ferrate(VI) production
yield and CL intensities on the duration of electrolysis from
10 to 50 min was examined; 30 min was determined to be
the optimum time.
0.2 0.3 0.4 0.5 0.6
0.1
0.2
0.3
0.4
0.5
0.6
Co
nce
ntr
atio
n o
f fe
rrat
e(V
I) (
mm
ol/L
)
Conentration of sodium hydroxide (mol/L)
A
B
0.0 0.1 0.2 0.3 0.4 0.5 0.60
100
200
300
400
500
Rel
ativ
e C
L in
ten
sity
(m
V)
Conentration of ferrate(VI) (mol/L)
catechol resorcinol hydroquinone
Figure 1. Influence of the concentration of NaOH on theferrate(VI) production yield (A); influence of the ferrate(VI)production yield on the CL intensities (B). Conditions: Capillary,55 cm� 50 mm id, fused silica; applied voltage, 15 kV; injection,5 s; running buffer, 10 mmol/L sodium tetraborate–2.0 mmol/Lluminol; electrolyte, NaOH; electrolytic current, 1.5 A; duration ofelectrolysis, 30 min; 1.0� 10�5 mol/L catechol, 1.0� 10�4 mol/Lresorcinol, 1.0�10�6 mol/L hydroquinone.
0.8 1.0 1.2 1.4 1.6 1.8 2.0 2.2 2.40.05
0.10
0.15
0.20
0.25
0.30
0.35
0.40
Co
nce
ntr
atio
n o
f fe
rrat
e(V
I) (
mm
ol/L
)
Electrolytic current (A)
A
B
0.00 0.05 0.10 0.15 0.20 0.25 0.30 0.35 0.400
100
200
300
400
500
600
Rel
ativ
e C
L in
ten
sity
(m
V)
Concentration of ferrate(VI) (mmol/L)
catechol resorcinol hydroquinone
Figure 2. Influence of the electrolytic current on the ferrate(VI)production yield (A); influence of the ferrate(VI) production yieldon the CL intensities (B). Conditions: Capillary, 55 cm�50 mm id,fused silica; applied voltage, 15 kV; injection, 5 s; running buffer,10 mmol/L sodium tetraborate–2.0 mmol/L luminol; electrolyte,0.3 mol/L NaOH; duration of electrolysis, 30 min; 1.0� 10�6 mol/Lcatechol,1.0�10�4 mol/L resorcinol, 1.0� 10�6 mol/L hydroqui-none.
J. Sep. Sci. 2010, 33, 631–636 Electrodriven Separations 633
& 2010 WILEY-VCH Verlag GmbH & Co. KGaA, Weinheim www.jss-journal.com
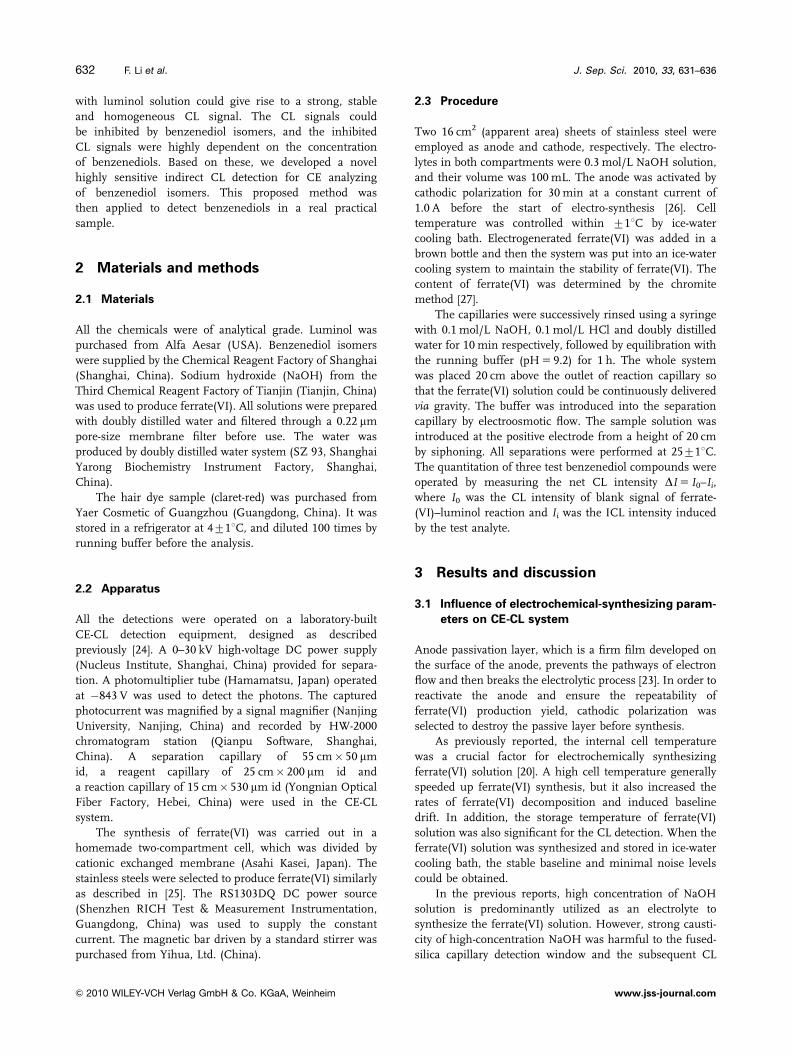
3.2 Influence of CE separation parameters on CE-CL
system
The sodium tetraborate containing luminol was employed
as the running buffer for CE separation. Both the separation
efficiency and the CL intensities were affected by the
concentration of sodium tetraborate. Effects of the sodium
tetraborate buffer concentration were examined in the range
of 2.5–15.0 mmol/L. The three analytes were baseline
separated under these conditions. As shown in Fig. 3, the
CL signals were enhanced as tetraborate concentration
increased and peaked at 5.0 mmol/L. Further increasing the
tetraborate concentration could produce considerable Joule
heating while the baseline became unstable. Meanwhile, the
electroosmotic flow decreased with an increase in the
concentration of sodium tetraborate buffer and the migra-
tion time also became longer. Thus, 5.0 mmol/L sodium
tetraborate (pH 5 9.2) was chosen as the optimum buffer
concentration for the consequent detection.
The effect of the concentration of luminol in the
running buffer on the CL intensity was investigated over the
range of 0.5–5.0 mmol/L. The results shown in Fig. 4
indicated that the CL signals increased gradually with
increasing luminol concentration and up to 2.0 mmol/L,
where maximum CL intensities were obtained and further
increasing the luminol concentration led to a decrease in CL
intensities. The luminol concentration of 2.0 mmol/L was
therefore selected for subsequent research work.
Dependence of CL intensities on applied voltage was
tested from 9 to 21 kV. Increasing applied voltage could
improve separation and selectivity until it reached 18 kV.
Sample injection time was further optimized and the best
CL signals were acquired when sample injection time
reached 5 s.
3.3 Performance characteristics of the method
Under the optimal conditions, the three benzenediols were
baseline separated and detected in less than 8 min (Fig. 5).
The dynamic ranges, regression equations, recovery rates
and RSDs are listed in Table 1. The correlation coefficients
(r240.99) show that good linearity could be obtained by this
method. The RSDs were investigated by injecting 1.0� 10�6
mol/L catechol, 1.0� 10�4 mol/L resorcinol, 1.0� 10�6 mol/
L hydroquinone standard solution and the results were in
the range of 1.5–4.5% (n 5 5). The recovery rates were
estimated by testing 1.0� 10�7 mol/L catechol, 1.0� 10�5
2 4 6 8 10 12 14 16200
300
400
500
600
700
800
Rel
ativ
e C
L in
ten
sity
(m
V)
Concentration of sodium tetraborate (mmol/L)
catecholresorcinolhydroquinone
Figure 3. Influence of the concentration of sodium tetraborateon the CL intensity. Conditions: Capillary, 55 cm�50 mm id,fused silica; applied voltage, 15 kV; injection, 5 s; running buffer,sodium tetraborate–2.0 mmol/L luminol; electrolyte, 0.3 mol/LNaOH; electrolytic current, 1.8 A; duration of electrolysis, 30 min;1.0�10�6 mol/L catechol, 1.0� 10�4 mol/L resorcinol, 1.0� 10�6
mol/L hydroquinone.
0 1 2 3 4 5
100
200
300
400
500
600
700
800
Rel
ativ
e C
L in
ten
sity
(m
V)
Concentration of luminol (mmol/L)
catecholresorcinolhydroquinone
Figure 4. Influence of the concentration of luminol on the CLintensity. Conditions: Capillary, 55 cm� 50 mm id, fused silica;applied voltage, 15 kV; injection, 5 s; running buffer, 5.0 mmol/Lsodium tetraborate–luminol; electrolyte, 0.3 mol/L NaOH; elec-trolytic current, 1.8 A; duration of electrolysis, 30 min; 1.0� 10�6
mol/L catechol, 1.0� 10�4 mol/L resorcinol, 1.0� 10�6 mol/Lhydroquinone.
Figure 5. Electropherogram of three analytes under optimizedconditions. Conditions: Capillary, 55 cm� 50 mm id, fused silica;applied voltage, 18 kV; injection, 5 s; running buffer, 5.0 mmol/Lsodium tetraborate–2.0 mmol/L luminol; electrolyte, 0.3 mol/LNaOH; electrolytic current, 1.8 A; duration of electrolysis, 30 min;peak 1, 8.0�10�7 mol/L hydroquinone; peak 2, 5.0� 10�5 mol/Lresorcinol; peak 3, 5.0� 10�7 mol/L catechol.
J. Sep. Sci. 2010, 33, 631–636634 F. Li et al.
& 2010 WILEY-VCH Verlag GmbH & Co. KGaA, Weinheim www.jss-journal.com
mol/L resorcinol, 1.0� 10�7 mol/L hydroquinone standard
solution 5 times and recording the peak height. The results
were between 94.7 and 99.2%, and it indicated that this
method was reliable.
The LODs were considered as concentration that gave a
S/N of 3. The comparison of the proposed method with
other methods is summarized in Table 2. It is well known
that the injected sample volume in HPLC is much larger
than that in CE mode. The similar concentration LODs
between these two modes demonstrated that the mass LODs
of the proposed method were at least 3 orders of magnitude
lower than that of mentioned in [28]. Meanwhile, the
concentration LODs of the proposed method were lower in
comparison with electrochemical methods [29, 30].
Compared with our earlier studies [24, 31], the sensitivities
of hydroquinone and catechol were improved five and ten
times, respectively, and resorcinol could be detected in the
same magnitude level. Moreover, ferrate(VI) was envir-
onmentally friendly in comparison with ferricyanide.
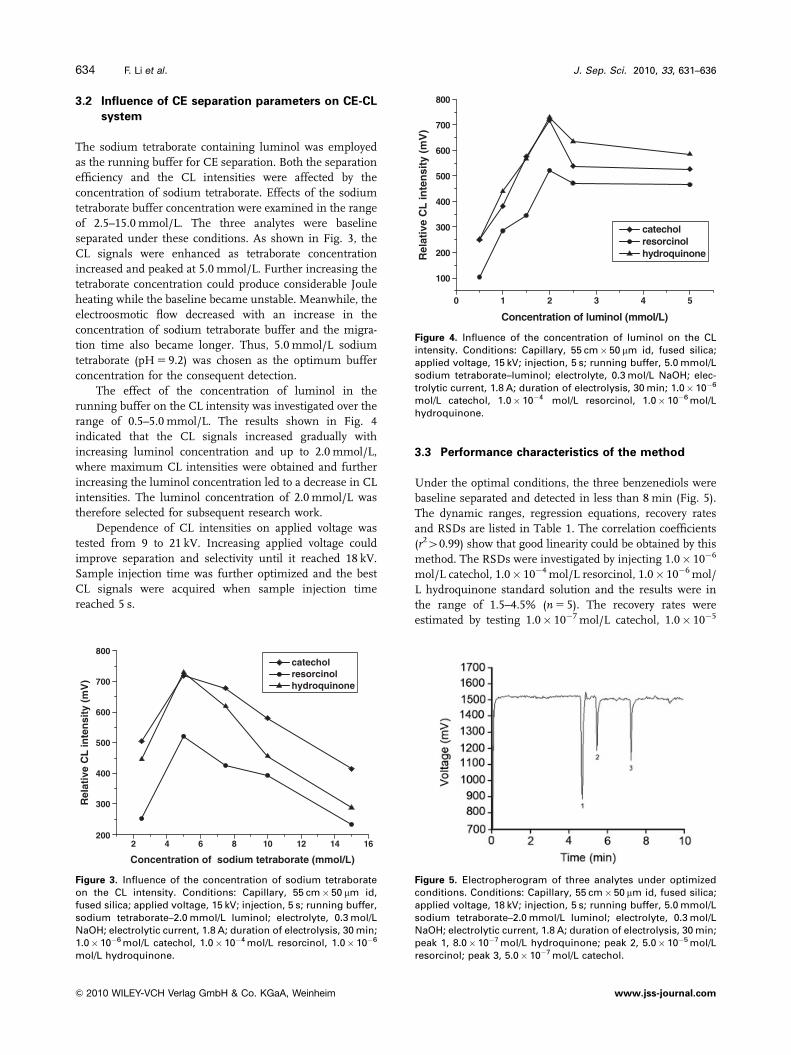
3.4 Application
Benzenediol isomers are considered to be toxic. Exposure to
them can cause many clinical symptoms [28]. Benzenediols,
as couplers, are used in permanent hair dye [32]. Because of
the health risks from exposure to bezenediols in hair dye, it
is vital to develop an efficient method for simultaneously
analyzing the benzenediol isomers. The proposed method
was applied for the analysis of benezenediol isomers in hair
dye. The electropherogram of hair dye in the optimal
conditions was shown in Fig. 6A. Both migration time and
spiked method were applied for the detection of benzenediol
isomers. As shown in Fig. 6B, resorcinol in hair dye was
successfully separated and detected. Peak 1 has longer
retention time and serious peak tailing. When hydroqui-
none was spiked into hair dye, a peak corresponding to
hydroquinone appeared in the tailing region of peak 1.
Thus, it was difficult to identify whether hydroquinone
existed in hair dye. Moreover, catechol was not detected in
hair dye.
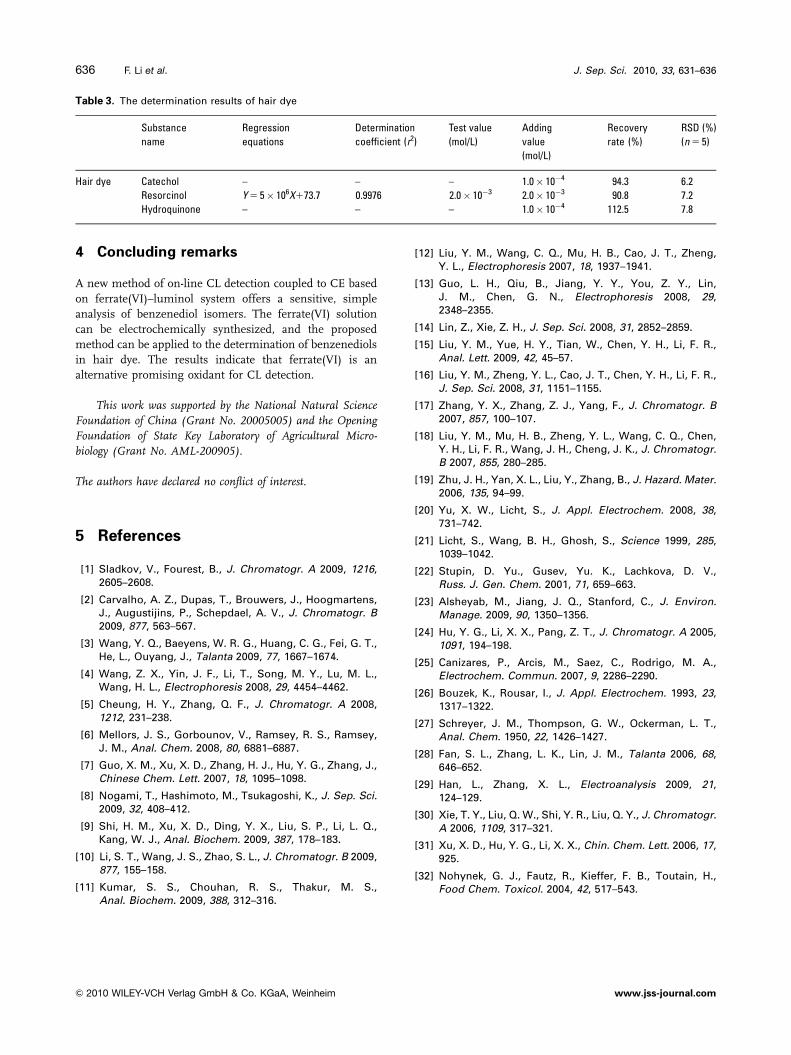
From the hair dye analysis (Table 3), the recoveries of
the analytes at three spiked concentration levels were carried
out and varied between 90.8 and 112.5%. The RSDs (n 5 5)
of peak height were less than 7.8%.
Table 1. Parameters of regression equations for the three analytes
Substance
name
Linear range (mol/L) Regression equations Determination
coefficient (r2)
RSD (%)
(n 5 5)
Adding value
(mol/L)
Recovery
rate (%)
Catechol 1.0� 10�6–9.0� 10�9 Y 5 6.8� 108X146.1 0.9983 1.9 1.0� 10�7 97.5
Resorcinol 9.0� 10�4–9.0� 10�7 Y 5 4.8� 106X167.5 0.9915 4.5 1.0� 10�5 94.7
Hydroquinone 1.0� 10�6–9.0� 10�9 Y 5 6.8� 108X1100.61 0.9955 1.5 1.0� 10�7 99.2
Table 2. Comparison of detections of benzenediol isomers with
other methods
Samples LOD (mol/L)
Catechol Resorcinol Hydroquinone
Proposed
method
Hair dye 8.5� 10�9 8.0� 10�7 6.5� 10�9
HPLC-CL [28] River water 4.7� 10�8 4.3� 10�8 4.3� 10�8
Electrochemical
[29]
Wastewater 6.5� 10�7 9.0� 10�7 5.0� 10�7
CE-SWAD [30] Wastewater 1.5� 10�6 1.0� 10�6 1.0� 10�6
CE-CL [31] Wastewater 8.6� 10�8 3.9� 10�7 3.2� 10�8
CE-CL [24] Urine 9.0� 10�8 – –
Figure 6. Electropherogram of hair dye under optimized condi-tions: (A) hair dye sample; (B) hair dye sample spiked with5.0�10�5 mol/L resorcinol. Peaks 1, 2, 4 unknown compounds;peak 3, resorcinol.
J. Sep. Sci. 2010, 33, 631–636 Electrodriven Separations 635
& 2010 WILEY-VCH Verlag GmbH & Co. KGaA, Weinheim www.jss-journal.com
4 Concluding remarks
A new method of on-line CL detection coupled to CE based
on ferrate(VI)–luminol system offers a sensitive, simple
analysis of benzenediol isomers. The ferrate(VI) solution
can be electrochemically synthesized, and the proposed
method can be applied to the determination of benzenediols
in hair dye. The results indicate that ferrate(VI) is an
alternative promising oxidant for CL detection.
This work was supported by the National Natural ScienceFoundation of China (Grant No. 20005005) and the OpeningFoundation of State Key Laboratory of Agricultural Micro-biology (Grant No. AML-200905).
The authors have declared no conflict of interest.
5 References
[1] Sladkov, V., Fourest, B., J. Chromatogr. A 2009, 1216,2605–2608.
[2] Carvalho, A. Z., Dupas, T., Brouwers, J., Hoogmartens,J., Augustijins, P., Schepdael, A. V., J. Chromatogr. B2009, 877, 563–567.
[3] Wang, Y. Q., Baeyens, W. R. G., Huang, C. G., Fei, G. T.,He, L., Ouyang, J., Talanta 2009, 77, 1667–1674.
[4] Wang, Z. X., Yin, J. F., Li, T., Song, M. Y., Lu, M. L.,Wang, H. L., Electrophoresis 2008, 29, 4454–4462.
[5] Cheung, H. Y., Zhang, Q. F., J. Chromatogr. A 2008,1212, 231–238.
[6] Mellors, J. S., Gorbounov, V., Ramsey, R. S., Ramsey,J. M., Anal. Chem. 2008, 80, 6881–6887.
[7] Guo, X. M., Xu, X. D., Zhang, H. J., Hu, Y. G., Zhang, J.,Chinese Chem. Lett. 2007, 18, 1095–1098.
[8] Nogami, T., Hashimoto, M., Tsukagoshi, K., J. Sep. Sci.2009, 32, 408–412.
[9] Shi, H. M., Xu, X. D., Ding, Y. X., Liu, S. P., Li, L. Q.,Kang, W. J., Anal. Biochem. 2009, 387, 178–183.
[10] Li, S. T., Wang, J. S., Zhao, S. L., J. Chromatogr. B 2009,877, 155–158.
[11] Kumar, S. S., Chouhan, R. S., Thakur, M. S.,Anal. Biochem. 2009, 388, 312–316.
[12] Liu, Y. M., Wang, C. Q., Mu, H. B., Cao, J. T., Zheng,Y. L., Electrophoresis 2007, 18, 1937–1941.
[13] Guo, L. H., Qiu, B., Jiang, Y. Y., You, Z. Y., Lin,J. M., Chen, G. N., Electrophoresis 2008, 29,2348–2355.
[14] Lin, Z., Xie, Z. H., J. Sep. Sci. 2008, 31, 2852–2859.
[15] Liu, Y. M., Yue, H. Y., Tian, W., Chen, Y. H., Li, F. R.,Anal. Lett. 2009, 42, 45–57.
[16] Liu, Y. M., Zheng, Y. L., Cao, J. T., Chen, Y. H., Li, F. R.,J. Sep. Sci. 2008, 31, 1151–1155.
[17] Zhang, Y. X., Zhang, Z. J., Yang, F., J. Chromatogr. B2007, 857, 100–107.
[18] Liu, Y. M., Mu, H. B., Zheng, Y. L., Wang, C. Q., Chen,Y. H., Li, F. R., Wang, J. H., Cheng, J. K., J. Chromatogr.B 2007, 855, 280–285.
[19] Zhu, J. H., Yan, X. L., Liu, Y., Zhang, B., J. Hazard. Mater.2006, 135, 94–99.
[20] Yu, X. W., Licht, S., J. Appl. Electrochem. 2008, 38,731–742.
[21] Licht, S., Wang, B. H., Ghosh, S., Science 1999, 285,1039–1042.
[22] Stupin, D. Yu., Gusev, Yu. K., Lachkova, D. V.,Russ. J. Gen. Chem. 2001, 71, 659–663.
[23] Alsheyab, M., Jiang, J. Q., Stanford, C., J. Environ.Manage. 2009, 90, 1350–1356.
[24] Hu, Y. G., Li, X. X., Pang, Z. T., J. Chromatogr. A 2005,1091, 194–198.
[25] Canizares, P., Arcis, M., Saez, C., Rodrigo, M. A.,Electrochem. Commun. 2007, 9, 2286–2290.
[26] Bouzek, K., Rousar, I., J. Appl. Electrochem. 1993, 23,1317–1322.
[27] Schreyer, J. M., Thompson, G. W., Ockerman, L. T.,Anal. Chem. 1950, 22, 1426–1427.
[28] Fan, S. L., Zhang, L. K., Lin, J. M., Talanta 2006, 68,646–652.
[29] Han, L., Zhang, X. L., Electroanalysis 2009, 21,124–129.
[30] Xie, T. Y., Liu, Q. W., Shi, Y. R., Liu, Q. Y., J. Chromatogr.A 2006, 1109, 317–321.
[31] Xu, X. D., Hu, Y. G., Li, X. X., Chin. Chem. Lett. 2006, 17,925.
[32] Nohynek, G. J., Fautz, R., Kieffer, F. B., Toutain, H.,Food Chem. Toxicol. 2004, 42, 517–543.
Table 3. The determination results of hair dye
Substance
name
Regression
equations
Determination
coefficient (r2)
Test value
(mol/L)
Adding
value
(mol/L)
Recovery
rate (%)
RSD (%)
(n 5 5)
Hair dye Catechol – – – 1.0� 10�4 94.3 6.2
Resorcinol Y 5 5� 106X173.7 0.9976 2.0� 10�3 2.0� 10�3 90.8 7.2
Hydroquinone – – – 1.0� 10�4 112.5 7.8
J. Sep. Sci. 2010, 33, 631–636636 F. Li et al.
& 2010 WILEY-VCH Verlag GmbH & Co. KGaA, Weinheim www.jss-journal.com


![Spectrophotometric Determination of Tiemonium Methyl …methods as aqueous potentiometric titration [11] and electrogenerated chemiluminescence [12]. High-performance liquid chromatography](https://img.pdfslide.us/doc/110x75/6142453e55c1d11d1b34166d/spectrophotometric-determination-of-tiemonium-methyl-methods-as-aqueous-potentiometric.jpg)