Embed Size (px)
Citation preview

Chapter 11
© 2012 Soldati et al., licensee InTech. This is an open access chapter distributed under the terms of the Creative Commons Attribution License (http://creativecommons.org/licenses/by/3.0), which permits unrestricted use, distribution, and reproduction in any medium, provided the original work is properly cited.
Electrode/Electrolyte Interphase Characterization in Solid Oxide Fuel Cells
Analía Leticia Soldati, Laura Cecilia Baqué, Horacio Esteban Troiani and Adriana Cristina Serquis
Additional information is available at the end of the chapter
http://dx.doi.org/10.5772/47756
1. Introduction
The increasing global energy requirements and the growing environmental conscience demand high performance technology for energy production, storage and transport. Fuel cells (FCs) have reached a recognized place within the potentially efficient devices to convert chemical energy into electricity. First developed by William Grove in 1835 [1], FCs had a profound impact in the aerospatial industry and more recently gained special attention for wider application, because they are considered as environmentally friendly devices. Some advantages of FCs include, that their efficiency is independent of the Carnot cycle for thermal machines [2], and that they can be designed for mobile and stationary applications. These devices also produce only water as residue when Hydrogen is used as fuel, without undesired residual emissions and consequently has no impact on the greenhouse effect.
Contrary to the conventional energy conversion devices, FCs reduce the emission of contaminating gases such as CO2, Sulfur, Nitrogen dioxide and hydrocarbons. Between them, Carbon dioxide is thought as one of the principal sources of the global warming effect that forces the climate change we are experiencing for the past decades. A technology which would reduce these emissions is in agreement with the actual international political framework and is ethically desirable.
Another great advantage of the FC technology is that it allows the distributed energy generation. FCs have minimal installation and maintenance costs, allowing on-site generation and reducing production and transport costs when compared to conventional central power stations (fossil fuel, nuclear, hydroelectric, etc.). For example, FCs are a suitable opportunity of energetic autonomy (at fair costs) for small communities, hospitals or schools, which are not connected to national distribution grids.
Hydrogen Energy – Challenges and Perspectives 280
Finally, Hydrogen has been chosen historically to supply FC devices. This element is considered the clean fuel of the future because its combustion only generates water vapor as a product. However, recent investigations show that the FC can also be operated with conventional hydrocarbon fuels such as natural gas or bio-gas [3]. Compared to the gas-fired power stations, for the same quantity of raw material, FCs show higher efficiency in the energy generation and decrease the contaminants released into the atmosphere. Thus, FCs are an alternative and clever way for using the resources which allows for a stepwise approach towards a future hydrogen-based economy.
2. Materials for solid oxide fuel cells
2.1. The Solid Oxide Fuel Cell (SOFC)
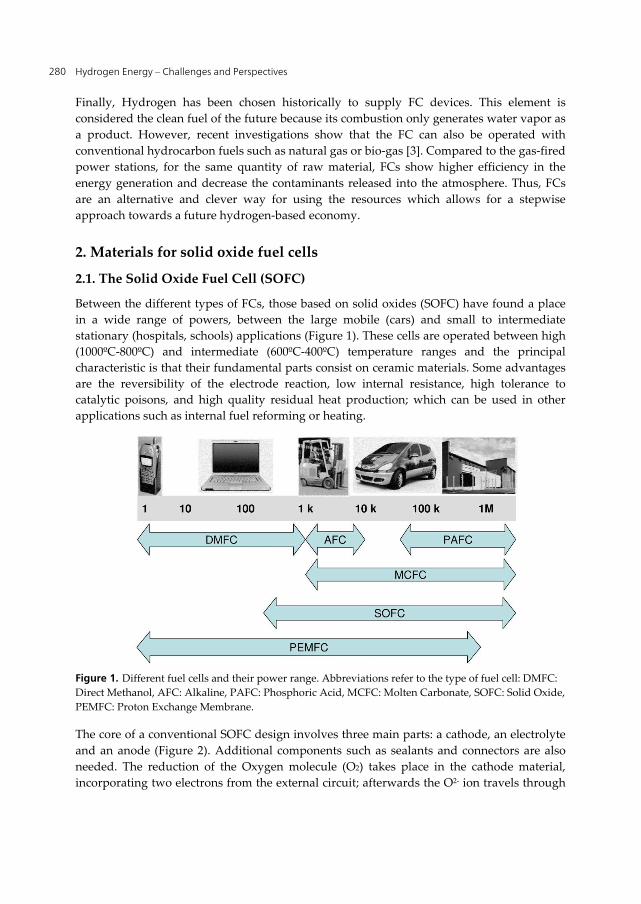
Between the different types of FCs, those based on solid oxides (SOFC) have found a place in a wide range of powers, between the large mobile (cars) and small to intermediate stationary (hospitals, schools) applications (Figure 1). These cells are operated between high (1000ºC-800ºC) and intermediate (600ºC-400ºC) temperature ranges and the principal characteristic is that their fundamental parts consist on ceramic materials. Some advantages are the reversibility of the electrode reaction, low internal resistance, high tolerance to catalytic poisons, and high quality residual heat production; which can be used in other applications such as internal fuel reforming or heating.
Figure 1. Different fuel cells and their power range. Abbreviations refer to the type of fuel cell: DMFC: Direct Methanol, AFC: Alkaline, PAFC: Phosphoric Acid, MCFC: Molten Carbonate, SOFC: Solid Oxide, PEMFC: Proton Exchange Membrane.
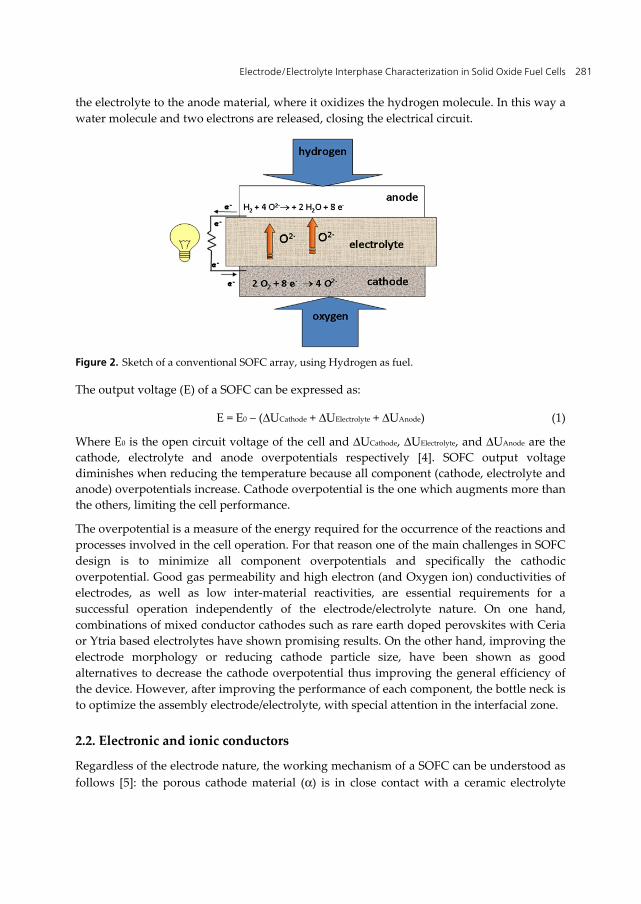
The core of a conventional SOFC design involves three main parts: a cathode, an electrolyte and an anode (Figure 2). Additional components such as sealants and connectors are also needed. The reduction of the Oxygen molecule (O2) takes place in the cathode material, incorporating two electrons from the external circuit; afterwards the O2- ion travels through
Electrode/Electrolyte Interphase Characterization in Solid Oxide Fuel Cells 281
the electrolyte to the anode material, where it oxidizes the hydrogen molecule. In this way a water molecule and two electrons are released, closing the electrical circuit.
Figure 2. Sketch of a conventional SOFC array, using Hydrogen as fuel.
The output voltage (E) of a SOFC can be expressed as:
E = E0 – (ΔUCathode + ΔUElectrolyte + ΔUAnode) (1)
Where E0 is the open circuit voltage of the cell and ΔUCathode, ΔUElectrolyte, and ΔUAnode are the cathode, electrolyte and anode overpotentials respectively [4]. SOFC output voltage diminishes when reducing the temperature because all component (cathode, electrolyte and anode) overpotentials increase. Cathode overpotential is the one which augments more than the others, limiting the cell performance.
The overpotential is a measure of the energy required for the occurrence of the reactions and processes involved in the cell operation. For that reason one of the main challenges in SOFC design is to minimize all component overpotentials and specifically the cathodic overpotential. Good gas permeability and high electron (and Oxygen ion) conductivities of electrodes, as well as low inter-material reactivities, are essential requirements for a successful operation independently of the electrode/electrolyte nature. On one hand, combinations of mixed conductor cathodes such as rare earth doped perovskites with Ceria or Ytria based electrolytes have shown promising results. On the other hand, improving the electrode morphology or reducing cathode particle size, have been shown as good alternatives to decrease the cathode overpotential thus improving the general efficiency of the device. However, after improving the performance of each component, the bottle neck is to optimize the assembly electrode/electrolyte, with special attention in the interfacial zone.
2.2. Electronic and ionic conductors
Regardless of the electrode nature, the working mechanism of a SOFC can be understood as follows [5]: the porous cathode material (α) is in close contact with a ceramic electrolyte

Hydrogen Energy – Challenges and Perspectives 282
phase (γ) along an interphase (α/γ), which is exposed to a gas phase (β) rich in Oxygen. The Oxygen diffuses from an external source through the cathode pores and is reduced in some place of the α/β/γ interphase, called the tree-phase boundary or TPB. The α phase is connected in a point far away from this interphase to a current collector which provides a conduction path for the electrons. On the other hand, the electrolyte γ provides an ionic conduction path to transport the O2- ions from the Oxygen reaction zone to the anode, where they can oxidize the fuel and be recombined into water.
Figure 3. Sketch showing the Oxygen reduction reaction steps in pure electronic conductor (A), composite (B) and mixed conductor (C) cathodes.
Historically the first choice for cathode materials was pure electronic conductor oxides (Figure 3A). A good example of this kind of ceramics is the family of (La,Sr)MnO3-δ (LSM) manganites. Some structural improvements to achieve better performance comprised decreasing the electrode grain size to nanometric levels in order to increase the active surface, or increasing its porosity to allow a better diffusion of the Oxygen molecules. However, in these materials the Oxygen reduction reaction is limited to the TPB zone, where the Oxygen ion can be transferred to the electrolyte in the same place where the reduction reaction occurs.
Another excellent way to increase the SOFC device performance is enlarging the area where the electrode reaction takes place. Different ways were explored and successful alternatives were detected. One of the most used solutions was enlarging the TPB area by incorporating to the electrode an ionic conductor with the composition of the electrolyte (Figure 3B). When using Ytria doped Zirconia (YSZ) or Gadolinium or Samarium doped Ceria (CGO and SDC) as electrolyte materials, LSM/YSZ, LSM/CGO and LSM/SDC combinations are often found as composite cathodes, respectively [6].
The discovery of ceramic materials which present mixed conductivity opened new perspectives in the SOFC design. Mixed conductors (MC) are able to conduct both Oxygen ions and electrons, and are therefore excellent as SOFC cathodes. Good examples are ABO3 perovskites with rare-earth cations in the A site and transition metals in the B site. To them

Electrode/Electrolyte Interphase Characterization in Solid Oxide Fuel Cells 283
belong the emerging MC family of rare earth - iron doped cobaltites of composition La1-
xSrxCo1-yFeyO3-δ (LSCF) and related families. The B ions in these structures are surrounded by Oxygen octahedral, and the ionic conductivity is achieved by the diffusion of Oxygen vacancies. This property bypasses the need of a TPB in this sense: the MC cathode material allows the Oxygen reduction reaction occurrence over the entire cathode/gas interphase (α/β), at the same time that provides a conduction path through which the O2- ions can travel towards the electrolyte γ (Figure 3C).
2.3. Oxygen reduction reaction and cathode performance
A strategy to reduce cathode overpotential is to facilitate the Oxygen reduction reaction (ORR) at the cathode. Besides the different reaction paths proposed in the literature, there is a general consensus about that ORR involves the following steps [5] (see Figure 3):
1. O2 gas-phase diffusion through cathode pore and/or boundary layer. 2. (a-b) O2 adsorption / desorption and successive dissociation. This stage can also occur in
one single step of dissociative adsorption. In addition, Oxygen can be partially reduced thus forming electroactive species.
3. Transport of Oxygen and/or electroactive species to cathode/electrolyte interphase. (3’) This stage consists in surface diffusion of adsorbed Oxygen (Oad) and/or electroactive species (see Figures 3A, B and C). (3’’a-b) Only for MC materials, this stage can also involve the following steps (see Figures 3B and 3C): (3’’a) charge transfer (Oxygen reduction) and ionic incorporation into cathode material, and (3’’b) O2- diffusion through bulk cathode. It is worth to note that in the case of cathodes composed of a mixture of pure electronic and ionic conductor materials, this stage can occur at the points where the gas and the ionic conductor are in contact only if the ionic conductor is also in contact with the electrolyte (see Figure 3B).
4. Incorporation of electroactive species into the electrolyte (4’) For pure electronic materials, this stage can only take place at the TBP (see Figure 3A). (4’’) In the case of cathodes composed of a mixture of pure electronic and ionic conductor materials, this stage can occur at the TBP and at the points where the ionic conductor is in contact with the electrolyte (see Figure 3B). (4’’’) In the case of MC materials, this step can occur in the whole cathode/electrolyte interphase including the TPB (see Figure 3C).
Because of the variety and complexity of the involved processes, it is difficult to know which of the steps mentioned above actually happens during the ORR and if they occur simultaneously or successively. However, in real systems some stages are slower than others and, hence, the ORR rate is defined by them. The ORR limiting step or steps depend on several parameters such as temperature, Oxygen partial pressure, cathode/electrolyte interphase and cathode microstructure, composition and electronic nature (i.e. if the material is a pure electronic conductor, a pure mixed conductor or a composite).

Hydrogen Energy – Challenges and Perspectives 284
Electrochemical impedance spectroscopy (EIS) is a useful technique for studying component performance as well as for determining the limiting steps of the reactions occurring in a SOFC [7]. It consists in applying an electrical signal (voltage or current) of small amplitude and recording the response (current or voltage). From the relation between the voltage and the current it is possible to obtain the impedance Z = |Z| ejωt+φ = Z’ + j Z’’ (where |Z| is the amplitude, φ is the phase, Z’ is the real component and Z’’ is the imaginary component). As the input frequency signal (ω) is varied, an impedance spectrum is obtained which can be represented in a Nyquist (Figure 4A) or in a Bode plot (Figure 4B).
Several microscopic phenomena happen when an electrical signal is applied to an electrochemical system such as a SOFC. The variation of applied frequency allows discriminating processes characterized by different time constants. Generally speaking, the selection of frequency range allows focusing on the phenomena taking place in certain component of the cell. The flow of charged particles (current density) depends on the ohmic resistances of electrodes and electrolyte and on the rate of the reactions occurring in the system. The overpotential (ΔU) of the system or cell component is related to the current j by ΔU = j ⋅ ASR, where ASR stands for area specific resistance. This value can be estimated as the difference between the low frequency (ω → 0) and the high frequency (ω → ∞) intersection of the spectrum with the Z’ axis (see Figure 4A). A reasonable value of maximum ASR is 0.45 Ωcm2 for the entire fuel cell [2], yielding to an average maximum value of 0.15 Ωcm2 for each cell component (i.e. cathode, anode and electrolyte).
EIS is also a useful technique for identifying the rate limiting mechanisms of the reactions involved in a fuel cell. In order to do so, several impedance spectra must be recorded as a function of operation variables as temperature, oxidant or fuel gas partial pressure, carrier gas, and bias potential or current. Then, all EIS spectra must be fitted with an equivalent circuit using a Complex Nonlinear Least Squares (CNLS) procedure. Impedance expressions of the element generally used in equivalent circuits can be found in reference [7]. The equivalent circuit is proposed according to the shape of spectra and the nature of the system in study. The identification of the reaction limiting steps is made by analyzing the variation of the fitted parameters as a function of operation conditions.
Figure 4 shows an example of cathode spectrum fitted using an equivalent circuit [8]. This spectrum corresponds to the Oxygen reduction reaction at a nanostructured La0.4Sr0.6Co0.8Fe0.2O3-δ cathode. Points in Figures 4A and B represent experimental data, continuous lines represent equivalent circuit fitting and dotted lines represent the individual contributions. The equivalent circuit used for fitting is shown in Figure 4C. The analysis of the circuit parameter as function of temperature, Oxygen partial pressure and gas carrier allows identifying the ORR limiting steps. These are O2 gas-phase diffusion and Oxygen ion transport into cathode bulk (steps 1 and 3’’b in Figure 3C, respectively). In Figure 4C, the sub-circuit composed of a resistance (R) in parallel with a constant phase element (CPE) is related to Oxygen gas-phase diffusion whereas the finite-length Warburg element (W) represents the Oxygen ion transport into cathode bulk.

Electrode/Electrolyte Interphase Characterization in Solid Oxide Fuel Cells 285
Figure 4. Example of an impedance spectrum [8]. (A) Nyquist and (B) Bode plots. Numbers in Figure A indicate the measuring frequency. Points are experimental data, continuous lines represent equivalent circuit fitting and dotted lines represent the individual contributions. (C) Equivalent circuit used for fitting.

Hydrogen Energy – Challenges and Perspectives 286
3. Interphases and interfaces in SOFC
The region where two systems meet is known as “interface” or alternatively as “interphase”. The former word is often used when two different crystalline orientations meet at a specific face (or surface), while the latter is used to describe the convergence of two different phases. Both concepts are involved in the study of fuel cells. Inside a SOFC core there are two main interphases that, as stated before, influence the performance of the cell: they are the cathode/electrolyte and the anode/electrolyte interphases.
3.1. The role of the electrode/electrolyte interphase in a SOFC
The Oxygen reduction reaction at the cathode/electrolyte boundary or the hydrogen oxidation reaction at the anode/electrolyte boundary are principally determined by the charge transfer capacity at the interphase and by those structural parameters which affect the gas diffusion in the solids and its concentration in the adsorption surfaces [9, 10]. Although these reduction and oxidation mechanisms are not fully understood, it is generally accepted that the reactions follow different stages and involve more than one reaction path. Therefore, the reaction kinetics at the interphases strongly depends on chemical and structural properties of the cell components [6, 11-13], the electrode morphology (particle size, porosity, thickness, etc.) [14], the characteristics at the interfacial boundary [15, 16] and other working parameters as the operation temperature and the gas partial pressure [17].
3.2. Sample preparation and interphases characteristics types
The three primordial SOFC parts (cathode, electrolyte or anode) can be assembled in several ways. They differ in which part of them constitutes the mechanical supporting element and in the different possible deposition methods used to mount the assembly. Thus, the mechanical properties and characteristics of the interphase zone strongly depend on the selected technique.
Two designs established a precedent in the SOFC market: cells supported by the anode and cells supported by the electrolyte. In both cases the supporting part is pressed as a dense pellet of some millimeters thickness and the other two parts are deposited as layers on its surfaces.
Painting, spraying and coating are the cheapest and less complicated available techniques to deposit layers between 200 nm and 20 μm on dense pellets. The interphases obtained are generally incoherently grown and often contain zones of no adherence (interphase pores or voids). Such an interphase could be an advantage for electronic conductor cathodes for example, because they need higher abundance of TPB points. However, it is clearly a disadvantage for MC materials, because the presence of interphase pores decreases the area where the Oxygen can be effectively transferred towards the electrolyte. In all these slurry deposition methods the material to be deposited must be transformed into an ink of controlled viscosity. They differ in the way the ink is placed on the pellet. In dip coating

Electrode/Electrolyte Interphase Characterization in Solid Oxide Fuel Cells 287
methods for example, the dense pellet is immersed in the ink, taken out at a controlled rate and let dry [18]. On the other side, in spin coating techniques, the ink is dropped into the pellet surface, while it spins at a certain angular velocity [19]. The desired layer thickness is obtained after repeating the processes a number of times. After that, thermal treatments are applied to improve the adherence to the base material. Presence of undesired micro-fractures, pores, delaminating zones, etc. can be controlled by changing deposition parameters such as characteristic times, velocities, ink composition, viscosity and thermal treatments.
Screen printing (also known as serigraphy) is other mechanical process used to deposit an electrode (or electrolyte) layer on the supporting surface [20]. A paste made of the electrode powder is pressed through a stencil with open zones. As a consequence, the material deposits only in these open zones. The advantage of the method is that the electrode can be painted thus forming the desired intricate patterns to tailor the cell design. These layers have a thickness of a several μm . Electrophoretic deposition is another method that can be used to deposit dense uniform coatings with thicknesses in a wider range. In this case the charged electrode particles are dispersed in a fluid and migrate to the substrate forced by a potential gradient [21, 22]. Besides, spray pyrolysis method involves atomizing a solution of the material’s precursors salts onto a heated substrate, using either air pressure or high voltage [23].
A refined deposition technique is Pulsed Laser Deposition (PLD) [11]. Usually this technique is used to grow the electrode on an electrolyte supported cell. The cathode is synthesized as a dense core, which is after ablated by Laser pulses at controlled energy and frequency. The sputtered cathode material is deposited on the electrolyte pellet in atomic-size layers. This methodology allows not only depositing ultra-thin layers and forming coherent electrode/electrolyte interfaces, but also building composite cathodes by changing the ablating core successively between two different compositions. Besides, it allows shaping the cathode with special nano-structured morphologies that improve the element performance. An excellent example are the vertically aligned nano-pores (VANP), which enhances Oxygen-gas phase diffusivity [24, 25].
3.3. The effect of different interphases and micro-nanostructures in the SOFC performance
It is well known that, for the same compositions of the trio cathode/electrolyte/anode, the performance of a SOFC can be improved or deteriorated by modifying the micro/nano-structure of the components and the nature of their interphases. Jorgensen et al. reported for example, that a less dense microstructure with smaller grain sizes in LSM/YSZ composite cathodes enlarged the TPB active zone [6]. Beckel et al. characterized La0.6Sr0.4Co0.2Fe0.8O3−δ and Ba0.25La0.25Sr0.5Co0.8Fe0.2O3-δ cathodes on YSZ electrolytes and found that modifying the cathode composition or the microstructure the assembly showed a significant enhancement in performance [13]. The authors reported that reducing the grain size and introducing a dense layer between the porous cathode and the electrolyte were favorable structure

Hydrogen Energy – Challenges and Perspectives 288
modifications. On the other side, Chen et al modified the microstructure of a NiO/YSZ composite anode instead of the cathode materials [26]. In this way, they improved the cell performance by reducing the particle size to the sub micrometric level and increased the material porosity by adding organic substances (to nucleate pore formation) in a mixture 5:3. The same effect was reported by Li et al, who demonstrated that the SOFC performance could be enhanced by modifying the TPB size and density and thus optimizing the microstructural properties of a Ni/YSZ composite cermet anode [27].
Regarding the influence of the composition in the cell performance using electronic conductors or composites, Barbucci et al. reported the electrochemical characteristics of rare earth doped manganites and Yttria stabilized Zirconia (LSM/YSZ) composite cathodes, an excellent material for intermediated temperature (IT-) SOFCs [28]. Using potentiometric and complex impedance analyses they found that a volume ratio of 1:1 enlarges the electrochemical activity, because it extends the TPB region inside the electrode volume. At the same time, Chen et al. compared the performance achieved by cathodes of pure LSM, LSM/YZS composite and LSM/SDC composite using YSZ electrolytes. In that study the LSM/SDC cell reached the highest performance at an operating temperature of 700ºC, and the efficiency difference was related to both the gas diffusion rate and the TPB size in each of the three arrays [29].
On the other side, the electrode/electrolyte interphase using MC cathodes is limited only to the small area where both materials make contact. Nowadays, the challenge with these promising materials tends both, to maximize the contact area improving the deposition methods and to increase the mixed conductivity by modifying the material composition and microstructure. Following the idea of composite cathodes, Dusastre et al. investigated mixtures of La0.6Sr0.4Co0.2Fe0.8O3−δ/Ce0.9Gd0.1O2-δ and found that the electrochemical properties of the composite cathode mounted on pure CGO electrolytes were highly dependent on the electrode microstructure and its composition [30]. The authors found that the porous electrode performance is affected not only by the mixed conduction transport but also by catalytic properties inherent to the TPB and the gas transport to and from the TPB. Afterwards, Baqué et al synthesized La0.6Sr0.4Co0.8Fe0.2O3−δ powders with nanometric sized grain and deposited it by different methods on CGO dense electrolytes [18]. The authors demonstrated that this array reached ASR values of 0.4 Ω cm2 at 450°C and 0.18 Ω cm2 at 550°C in air [31]. This excellent electrochemical performance is even better than many of the cathodes and composite cathodes known at the moment for these operating temperatures. This especially attractive behavior is explained by two main factors: (i) the increase in the cathode active zones. This is due to the nanometric particle sizes, the increase in porosity and improved connectivity. (ii) The improvement of the electrode/electrolyte interface. This is a consequence of the combination of the used deposition method and the optimized electrode/electrolyte composition [15].
3.4. Reactivity at the interphase
A good electrode/electrolyte interphase in SOFC assemblies must fulfill two main requirements: first of all it must facilitate the transfer of the O2- ions in an efficient way from

Electrode/Electrolyte Interphase Characterization in Solid Oxide Fuel Cells 289
the cathode to the anode and second, the interfacial reactivity between the components must be minimized or avoided at the working temperatures and under the presence of reductive/oxidative atmospheres, for the entire cell lifetime.
However, due to the SOFC hard operating conditions, the presence of electrode/electrolyte reactivity is not rare. In a recent review of solid state chemistry applied to SOFC materials Backhaus-Ricoult [10, 32] studied different solid oxide cathodes with Zirconia based electrolytes. The author found that formation of reaction products, diffusion, segregation and modification of the electronic structure in the cathode/electrolyte interphase affected the Oxygen exchange rate and had an undesirable impact on the SOFC performance. Bevilacqua et al. studied, by different X-ray absorption spectroscopy techniques, the composition and speciation of Ni and Fe in the cathode material LaNi0.6Fe0.4O3 deposited on YSZ or SDC electrolytes [33]. Under operation conditions the authors found that the LaNi0.6Fe0.4O3 /YSZ assemblies formed an isolating layer of La2Zr2O7 at the interphase, while LNF/SDC showed no parasite phases and excellent electrochemical properties, together with an enlargement of the TPB. On the other side, Grosjean et al. studied the behavior of La0.8Sr0.2MnO3 on YSZ electrolytes and found a decrease in the electrical performance of one order of magnitude, together with a quick deterioration after a long term treatment at 850ºC [34]. The authors correlated the efficiency loss to both an inter-diffusion of Mn and the presence of the resistive La2Zr2O7 phase. This conditions lead to a rise in the electronic conductivity and a decrease in the ionic conductivity, deteriorating the cell performance. Besides, Izuki et al. studied a La0.8Sr0.2Co0.2Fe0.8Ox cathode deposited by PLD on a CGO substrate [35]. After long term operation at 1000-1200 ºC the authors observed inter-diffusion of La, Ce and Gd across the interphase, and presumed the formation of Lanthanum doped Ceria in the vicinity of the interface. Recently, Montenegro Hernandez et al. (2012) investigated the reaction of the rare earth niquelates La2NiO4 , Nd2NiO4 and Pr2NiO4 deposited by spin coating on CGO and YZS electrolytes [36]. After 1000 hours operation the authors found by X-ray diffraction analysis and complex impedance measurements significant performance deterioration. This could be in part associated with the formation of new phases, product of decomposition of cathode and electrolyte materials at the interphase.
4. Techniques for characterization
4.1. Scanning electron microscopy
In a SOFC assembly the change from one phase into the other occurs in the nanometer scale. Therefore, for a precise characterization of the interfacial zone, high quality sample preparation and high spatial resolution techniques are required. A first appropriate tool to find out morphology and chemical composition at both sides of the interphase is the Scanning Electron Microscope (SEM). High magnified images can be acquired using a Field Emission Gun (FEG-SEM) device instead a conventional Tungsten filament. The bright source and the wide field depth allow producing a topographic image of high magnification. A coarse view of the material at both sides of the interphase can be thus be achieved by detecting secondary electrons emitted from the sample (Figure 5A). Besides,

Hydrogen Energy – Challenges and Perspectives 290
these microscopes are equipped with backscattering electron detectors, which provide an intensity profile depending on the atomic number of the target atom. A complementary Energy or Wavelength Dispersive System (EDS or WDS, respectively) coupled to the microscope makes possible to map the composition by analyzing the characteristic X-ray spectra.
4.2. Transmission electron microscopy
A powerful technique to investigate (even at the atomic level) crystal structure and chemical composition is the Transmission Electron Microscope (TEM). In this case, the electron beam is allowed to pass through the sample and interacts with the material. The intensity of transmitted and/or diffracted electrons is afterwards converted into images or diffraction patterns, whose contrast can be (carefully) related to the material properties [37]. In addition, EDS systems can also be coupled to this microscope, with the advantage that the interaction volume is very small as compared to the SEM situation. However, the difficulty with this method is that, to let transmission happen, the sample must have thicknesses of about 0.1 μm or less in the region of interest. How to get those thin samples from an electrode/electrolyte interphase can be very challenging: these are regions of superior reactivity, which often contain boundaries between different microstructures, chemical compositions, densities, hardness, grain sizes, etc. Traditional TEM preparation methods as Ar-milling or electrochemical polishing, which may affect differently both phases, are therefore inappropriate. A solution to that problem arrived with Focused Ion Beam (FIB) technology, which is one of the most versatile tools to prepare thin samples of site-specific areas for microscopy and spectroscopy analyses [38].
4.3. Focused ion beam
A desired area can be selected with micrometric precision with help of a dedicated SEM installed in the same chamber as the FIB (Figure 5A). A thin Pt-layer is deposited on the surface to protect the underlying material from the sputtering process and a Ga-ion beam is used to cut a slab of the bulk material (Figures 5B and 5C). This slab can be further polished to a final thickness of about 100 nm or less. After, the foil is deposited with a micromanipulator in an adequate substrate and is ready for analysis [39]. This procedure is known as FIB/lift-out preparation, and is often found related with SEM and TEM ex-situ analysis [40]. On the other hand, the FIB technique can be also used for site-specific in-situ analyses. FIB-SEM nano-tomography for example, is more and more being used for a detailed three dimensional (3D) reconstruction of the micro- and nanostructure in a material. In this case, the FIB is used stepwise to mill a slice in the selected area. The sample is then alternatively micrographed with SEM or EDS and further milled in slices. The 3D reconstruction is possible using computer programs to merge the images together. Porosity, tortuosity, phase composition, percentage of adherence, etc. can be obtained from these reconstructions.

Electrode/Electrolyte Interphase Characterization in Solid Oxide Fuel Cells 291
Figure 5. (A and B) SEM images showing the cathode/electrolyte interphase in an electrolyte-supported SOFC; the images were obtained from a fractured piece. (B) A Pt layer is deposited on the surface of interest to protect the underlying material. (C) Schema of a FIB cut: a Ga-ion beam is used to sputter the material in front and back of the region of interest. (D) TEM image of the obtained foil: a 10×15×0.1 μm slice is extracted from the bulk and deposited in an appropriate substrate using a micromanipulator.
Since 2005 the increasing number of publications using FIB to study SOFC materials shows that the methodology’s usefulness in this field has been recognized. The fact that the beam homogeneously mills the whole sample makes it an attractive method to prepare thin specimens of the interfacial SOFC regions, where two very different materials converge in a sensible and reactive area [41]. Liu and Jiao (2005) reported for the first time FIB/lift-out prepared TEM samples of the anode/electrolyte interface from a long-term tested Ni/YSZ-YSZ half-cell [42]. One year later Grosjean et al. (2006), investigated the diffusion and reactivity processes at the interphase of a planar SOFC, between an YSZ electrolyte and a La0.8Sr0.2MnO3 cathode [34]. Using FIB/lift-out samples the authors analyzed the microstructure and made site-specific nano-scaled chemical analysis at both sides of the interfacial zone. Recently, Soldati et al. (2011) studied by FEG-SEM, TEM and EDS, FIB/lift out foils of the interfacial region between nano-sized LSCF cathodes and dense CGO electrolytes [15]. The authors compared the effect of different synthesis routes in the interfacial characteristics and found correlations with the cell performance.
Regarding the 3D-FIB/SEM profiles, the first report applied to SOFC materials corresponds to the group of Wilson et al., who studied with this technique a thin YSZ electrolyte layer cast onto a thick NiO–YSZ anode support, with a LSM-YSZ composite cathode; 3D-microsctructural features such as phase volume fractions, total phase boundary areas, TPB

Hydrogen Energy – Challenges and Perspectives 292
lengths and density, connectivity, tortuosity, etc. could be related to cathode polarization resistances and cell performance [43]. These authors analyzed also the properties of composite LSM-YSZ cathodes [44, 45]. Smith et al. used the same technique to find the relationship between the cathode microstructure and the electrochemical performance in symmetric LSM-YSZ-LSM cells [46]. Afterwards, Holzer et al. statistically characterized size, shape and topology of complex granular cermets, while Jiao et al. reported the 3D microstructure of a NiO-YSZ anode and 72.5ZnO–27MnO2–0.5Al2O3 cathode [47] and Chae et al. studied the internal microstructure of Mg-, Sr- and Co- doped LaGaO3 powders pellets used as SOFC electrolyte [48].
Secondary effects due to the FIB preparation must be evaluated in in-situ as well as in ex-situ samples. Shearing et al. for example, commented on some problems associated with charging, shadowing and re-deposition of sputtering material observed in FIB-SEM profiles that could be overcome using coupled FIB/lift-out preparation and ex-situ SEM imaging [49-51]. On the other side, Soldati et al. (2012) compared two FIB/lift-out prepared foils of the same Nd2NiO4 / Ce0.9Gd0.1O1.95 interphase: in one case the foil was extracted from the “as prepared” bulk material and in the second case Pt was deposited prior to the extraction filling all material pores; TEM and FEG/SEM-EDS analyses showed no differences between both samples, demonstrating that no detectable re-deposition or structural change occurred because of the FIB preparation [36, 52].
5. Some particular case studies1
5.1. The case of LSCF/CGO adherence
When evaluating a SOFC design, the electrode/electrolyte adherence and the nature of its interphase are relevant points to take into account to improve the performance. A well connected porous interphase would be desirable for electronic conductor cathodes, but a full covered contact area would be preferred in case of a mixed conductor cathode. In the former case, the existence of pores at the interphase plane would enlarge the TPB zones where the electrolyte, the cathode and the gas phases coexist, thus enlarging the points where Oxygen can be reduced and transferred. In the latter case, a TPB is not mandatory. A porous interphase would reduce instead the cell performance by reducing the cathode/electrolyte contact area for Oxygen transfer.
Figure 6 shows TEM images of two FIB foils extracted from the interfacial region of two different SOFC assemblies. In both cases the dense electrolyte is a Ce0.9Gd0.1O2-δ polished pellet and the cathode corresponds to nanostructured La0.4Sr0.6Co0.8Fe0.2O3-δ synthesized by a modified acetate route [31]. The cathodes were deposited by spin coating forming a 5 μm or a 15 µm layer (upper and bottom figures respectively). No micro-fractures, delamination or damaged boundaries were observed, supporting a good electrode/electrolyte attachment. In addition, no amorphous or re-deposited material was found inside the pores indicating the 1 In this section the acronnysms LSCF and CGO are used specifically for the compounds La0.4Sr0.6Co0.8Fe0.2O3-δ; and Ce0.9Gd0.1O1.95.

Electrode/Electrolyte Interphase Characterization in Solid Oxide Fuel Cells 293
absence of secondary effects due to the FIB preparation [34, 42]. However, although both samples were thermally treated and prepared in the same way, the interphase presented a different microstructure: The 5 µm sample (Figures 6A to 6C) showed a partially open interphase, presenting many regions where the cathode layer did not cover the electrolyte (i.e. interfacial pores), while the 15 µm sample (Figures 6D to 6F) presented an interfacial boundary with almost 100% coverage factor.
Figure 6. (A-D) FEG-SEM and TEM images of two LSCF/CGO assemblies showing the cathode/electrolyte interphase. The cathodes were deposited by spin coating. In the (A-C) images the interphase observed in the foil presents regions of no adherence called “interfacial pores” or “voids”. The (D-F) images show a totally covered interphase. Impedance measurements of both arrays are shown in (G and H). LSCF=La0.4Sr0.6Co0.8Fe0.2O3-δ; CGO=Ce0.9Gd0.1O1.95
EIS was used for evaluating the electrochemical performance of these assemblies as a function of temperature, Oxygen partial pressure and gas carrier [8]. The obtained results point out that, in both cases the ORR is limited by Oxygen gas-phase diffusion and Oxygen ion transport into the cathode bulk. Figures 6G and 6H show the impedance spectra of the two arrays measured at 500ºC in air and fitted with the equivalent circuit of Figure 4C. As it can be observed, the total area specific resistance (ASR) resulted lower for the thickest

Hydrogen Energy – Challenges and Perspectives 294
cathode (0.43Ωcm2, Figure 6H) than for the thinnest one (0.67Ωcm2, Figure 6G). ASRw values related to Oxygen ion transport into cathode bulk are 0.27 Ωcm2 and 0.48 Ωcm2 for the thickest and the thinnest cathodes, respectively; while ASRRCPE values related to Oxygen gas-phase diffusion are similar for both cathodes (i.e. 0.16 Ωcm2 for the first cathode and 0.19 Ωcm2 for the latter), as expected because of the similar pore structures. Accordingly, the difference in the total ASR can be mainly attributed to different efficiencies in the Oxygen ion transport into the cathode bulk. The ASR related to this step can be expressed as follows [53]:
2
w 2 20
ASR4 v x
lth jlRT DA
SC DF lj
D
δ
δ
δ
ω
ω=
= (2)
where A is the cathode geometric area, R and F are the ideal gas and Faraday constants, T is the temperature, lδ is the effective diffusion length, S is the electrode/electrolyte interface area, Cv|x=0 is the Oxygen vacancy concentration at the electrode/electrolyte interface, D is the vacancy diffusion coefficient and ω is the measuring angular frequency.
Both cathodes, which have exactly the same composition, were prepared in the same way and presented the same morphology and nano/microstructure. As a result, A, Cv|x=0, and D in Eq. 2 are equal for both materials. In addition, a higher ASRw is expected for a thicker cathode [54], contrary to the observed in Figure 6. Consequently, the ASRw difference can be mainly attributed to the difference in interfacial contact area (S).
The dissimilar interphases in both samples may be due to some lack of reproducibility in the substrate polishing procedure or in the ink preparation, but they could also be inherent to the spin coating deposition. Similar results were also observed by other authors. Murray et al., for example, reported variations in the impedance results of LSCF spin coated samples, sometimes as large as a factor of 3, while attempting to reproduce the processing conditions from cathode to cathode [19]. Indeed, a systematic study including the characterization of substrate roughness and a comprehensive ink rheology analysis is needed to optimize the reproducibility of the electrode/electrolyte interphase.
5.2. The case of LSCF nano-crystals
The strategy generally adopted for enhancing the Oxygen ion transport into the cathode bulk is modifying its composition. Nevertheless, outstanding results can be also achieved by using nanostructured cathodes. The study of cathode nanostructure even at atomic level is very important not only for characterizing it accurately, but also for detecting detrimental impurities at grain boundaries which could block the Oxygen ion transport. This task can be done by combining FIB/lift-out and TEM techniques.

Electrode/Electrolyte Interphase Characterization in Solid Oxide Fuel Cells 295
Figure 7. Dark Field (A) and Bright Field (B) TEM images of an La0.4Sr0.6Co0.8Fe0.2O3-δ cathode showing nanocrystallites. (C and D) High Resolution TEM images detailing the nano-sized crystals.
Figure 7 shows TEM images from nanostructured La0.4Sr0.6Co0.8Fe0.2O3-δ cathodes [8, 15, 31]. Bright spots reveal diffracting nanometric domains in the dark field (DF) image of Figure 7A. The inverted phenomenon is applied in the bright field (BF) image of Figure 7B and hence the nanocrystalline domains appear obscure. Figure 7C displays high resolution (HR) images where several nanocrystallites of 10 nm or less are surrounded by zones with some degree of crystalline disorder. Atomic planes inside the nanocrystallites can be clearly distinguished in the HR image shown in Figure 7D.
ORR reaction occurring at these nanostructured cathodes was studied by EIS as a function of temperature, Oxygen partial pressure and carrier gas [8]. The limiting steps are O2- transport into the cathode bulk and Oxygen gas-phase diffusion. This reaction path was previously proposed by Grunbaum et al. for a La0.6Sr0.4Co0.8Fe0.2O3-δ cathode with sub-micrometric grains [55]. The ASRRCPE related to Oxygen gas-phase diffusion is similar for both cathodes [8], while ASRw related to Oxygen ion transport into cathode bulk is more than two orders of magnitude lower for the nanostructured cathode (see Figure 8) at temperatures lower than 600°C. This significant difference cannot solely be explained by the different compositions [56]. Thus, this behavior can be attributed to an Oxygen diffusion enhancement as a result of the advantageous nanostructure exhibited by our cathodes. Nanostructured materials exhibit a considerable larger grain boundary volume than those with sub-micrometric grains. In particular, grain boundaries are zones with high density of defects and disorder. Hence, the diffusion coefficient is higher in these zones and the effective diffusion length is shorter yielding to lower ASRw values (see Eq. 2).

Hydrogen Energy – Challenges and Perspectives 296
Figure 8. Area Specific Resistance (ASRw) in nanostructured La0.4Sr0.6Co0.8Fe0.2O3-δ cathodes (Baqué et al. [31]) compared to that reported for sub-micrometric grains with the same composition (Grunbaum et al.[55])
5.3. The case of a semi-coherent LSCF/CGO interphase
Cathode/electrolyte symmetric cells were assembled coating a dense Ce0.9Gd0.1O1.95 pellet with an ink of nano-sized particles of composition La0.4Sr0.6Co0.8Fe0.2O3-δ [18, 31]. The final thicknesses of the cathode layers were between 2 and 10 μm. The FIB/lift-out technique was used to sample the interphase area. Although the cathode porosity was high, and the cathode part was expected to be mechanically fragile, the foils were extracted and manipulated, keeping the original granular structure. Afterwards, the slices were studied with FEG-SEM and TEM, and the images obtained from two of them are shown in Figure 9 and 10.
Figures 9A and 9B show an LSCF/CGO foil that resulted in a slice of 10×15μm and ~100 nm thickness. The images were obtained with FEG-SEM by detecting backscatter electrons. Therefore a Z contrast is observed. The very light layer in the right side of the foil in Figure 9A corresponds to the Pt layer used to prepare the sample. A contrast of light and dark-gray tones is obtained for CGO and LSCF materials. CGO is observable as a dense pellet, while LSCF grains can be clearly recognized in the porous part.
A TEM view of the electrode/electrolyte interphase is shown in Figure 9F. The higher magnification achieved with TEM allows noting that the change from one phase to the other occurs in less than 200 nm. Diffraction in the electrolyte side (Figure 9C) showed a mono-crystalline pattern, corresponding to the CGO crystals. On the other side, the diffraction pattern of the LSCF cathode well far from the interphase shows a poly-crystalline pattern (Figure 9E). This is expected for random-oriented nano-sized particles. Conversely, the diffraction pattern of LSCF near the interphase (see star in Figure 9D) corresponds to a single crystal pattern. The spots coincide with that of the CGO diffraction. This means that

Electrode/Electrolyte Interphase Characterization in Solid Oxide Fuel Cells 297
the LSCF nano-grains near the interphase are not randomly oriented. Instead, they repeat the orientation of the underlying CGO grains.
Figure 9. (A) FEG-SEM images of a thick FIB foil detecting backscattered electrons. The gray contrast is due to differences in the atomic number Z; Pt is observed as a very bright layer, while CGO grains are light gray and LSCF nano-grains are dark colored. (B) Detail of the interphase plane. Electron diffraction patterns of the electrolyte (C), the interphase region (D) and the cathode far from it (E). (F) TEM image of the LSCF/CGO interphase; the star indicates the position where the diffraction pattern shown in (D)·was obtained. LSCF=La0.4Sr0.6Co0.8Fe0.2O3-δ; CGO=Ce0.9Gd0.1O1.95
Figure 10 shows a LSCF/CGO foil that resulted thinner than the one observed in Figure 9. In this case, no Z contrast can be detected using backscattered electrons in the FEG-SEM (Figure 10A). However, exactly because this foil is very thin, it is excellent for doing high resolution (HR) TEM images.
Indeed, a close view of the interphase (Figure 10B) at higher magnification (Figure 10C) using the high resolution (HR)-TEM mode demonstrated that the crystal planes of CGO and La0.4Sr0.6Co0.8Fe0.2O3-δ are semi-coherently oriented along the interphase [15]. The fact that LSCF may growth semi-coherently with the substrate seems to be the result of using an ink prepared with powders at temperature slightly below of the final phase formation temperature. [31].
Figures 9 and 10 demonstrate that the LSCF and the CGO atoms near the interphase are not randomly oriented. Furthermore, it could be proved using two different microscopic techniques (electron diffraction in a thicker foil and HR-TEM in a thinner foil) that the interphases are semi-coherently oriented. This ordered transition implies that the Oxygen

Hydrogen Energy – Challenges and Perspectives 298
Figure 10. (A) FEG-SEM image of a FIB foil detecting backscattered electrons. Pt is observed in light colors. This sample was extremely thin and therefore no Z contrast is observed between the LSCF and the CGO materials. (B) TEM image showing a detail of the interphase plane; the nano-grains of the cathode and the micro-grains of the electrolyte are observed. (C) High resolution TEM image of the LSCF/CGO interphase, showing a semi-coherent interphase; the two insets are Fourier filtered reconstructions using only the 111 crystal plane in CGO and the 100 plane in LSCF. LSCF=La0.4Sr0.6Co0.8Fe0.2O3-δ; CGO=Ce0.9Gd0.1O1.95
atoms can be easily transferred from the cathode to the electrolyte by Oxygen vacancy mobility between the components. These structural properties contribute thus, to increase the cell performance by enhancing the Oxygen ionic transfer through the cathode/electrolyte interphase and thus, lowering the ASR values [5].
6. Overview There are numerous examples in the SOFC field that illustrate how dependent the cell performance of the electrode/electrolyte interphase characteristics is. The combination of site-specific sampling techniques, with high spatial resolution microscopy and electrochemical impedance spectroscopy, is an excellent way to evaluate a given design for improving the cell performance. Several cases are given in the different sections of this text and can be resumed in two main groups:

Electrode/Electrolyte Interphase Characterization in Solid Oxide Fuel Cells 299
• Studies correlating the cell performance with the interphase micro-structure:
An interesting case of this group was reported in reference [57]. The study comprises two SOFC assemblies, where La0.4Sr0.6Co0.8Fe0.2O3-δ cathodes were deposited on Ce0.9Gd0.1O2-δ electrolytes by spin coating methods. The cathodes and the electrolytes presented the same morphology and composition, and the sintering treatments applied to favor adherence were similar. However, electrochemical impedance studies demonstrated that the efficiency of one cell was very low in comparison to the other. A microscopic and spectroscopic characterization of FIB foils obtained from the cathode/electrolyte region, from both assemblies, showed that the interphase morphologies were different. In one case the electrode/electrolyte interphase presented interfacial pores and voids, and in the other case it was completely covered which explained the better performance. Other examples where the interphase micro-structure was related to the cell performance was reported in reference [15]. This study reported enhanced electrochemical performance in LSCF cathodes synthesized by the novel HMTA route [31]. High resolution TEM images demonstrated that the CGO and LSCF atoms at both sides of the interphase were semi-coherently oriented. The ordered structure was thus responsible of facilitating the Oxygen ion transfer by Oxygen vacancy diffusion. Consequently, a decrease in the array’s ASR value produced an increase in the cell electrochemical performance.
• Studies correlating the cell performance with presence of reactivity at the interphase:
Studies that comprise the characterization of the interphases after long term operation conditions are excellent examples of this group. A SOFC operates at intermediate to high temperatures and reducing/oxidizing conditions. In addition, to make these devices economically competitive, a long lifetime span with minimal maintenance is desirable. Thus, chemical reaction or diffusion between the components are problematic because they alter the cell integrity and directly affect the performance [58]. A well known case is that of La0.8Sr0.2MnO3 cathodes mounted on ZrO2-based electrolytes (YSZ) [34]. Cells operated at 850ºC showed one order of magnitude less electrical performance than expected, and deteriorated quickly under operating conditions. The causes were diffusion of Mn into the cathode and the electrolyte, and the formation of parasite phases. Another example regards a La0.8Sr0.2Co0.2Fe0.8Ox cathode deposited as thick film onto sintered Ce0.9Gd0.1O1.95 [35]. The inter-diffusion of La into CGO, and of Ce and Gd into LSCF together with the formation of lanthanum doped ceria near the interface, were observed after long term treatments at 1000-1200ºC. Of course, this behavior is undesirable because it deteriorates the cells integrity and consequently the electrochemical properties.
7. Conclusion The cathode, the electrolyte, and the anode materials form the core of a SOFC assembly; therefore, to improve the cell performance it is necessary to tailor each of these three components. Microstructure, composition, and thermal treatments were largely recognized as potentially useful parameters to change. Common strategies involved were, adding traces of other elements to achieve mixed conduction in the cathode, reducing the particles grain size to increase the surface area, or increasing the quantity of pores (and their connectivity) to enlarge the gas diffusion across the electrodes. Once these parameters are optimized for each of the three components, the bottle neck is the optimization of the contact regions between them.
Hydrogen Energy – Challenges and Perspectives 300
The electrode/electrolyte interphases are the most relevant because they influence the transfer of ions and electrons from one material to the other and thus directly affect cell performance. Good contact area, improved mechanical/thermal behavior, absence of micro-fractures or delamination, and lack of inter-material reactivity after long-term operation conditions are desired properties. Some of these parameters can be engineered by optimizing, for example, the composition at both sides of the interphase, or through the methods used for deposition and/or the sintering treatments.
However, SOFC interphases occur at the nanometric scale and thus their characterization needs high spatial resolution techniques such as TEM. Preparing a sample of these interphases is not trivial. Two materials of very different microstructures, compositions, and mechanical and thermal properties converge in this zone and make it very reactive and mechanically weak. One of the most versatile tools to prepare samples of selected areas for microscopy and spectroscopy analyses is the Focused Ion Beam (FIB). With help of an electron microscope, a desired area can be selected with micrometric precision and a Ga-ion beam is used to extract a thin sample of the bulk. This foil, with only some nm thickness, can then be analyzed afterwards with the scanning and the transmission electron microscopes and related techniques. Z-contrast, Energy dispersive spectroscopy (EDS) and Energy Loss Spectroscopy (EELS) are common choices for composition analyses. Electron Diffraction (ED) produces information about the atomic order and crystal structure in the materials. Electron Backscatter Diffraction (EBSD) is used for texture analysis. 3D-FIB micro-tomography allows for finding structure related parameters as pore concentration, tortuosity or contact area. On the other side, the evaluation of the electrochemical performance of a given cell design can be carried out using spectroscopy techniques such as Electrochemical Impedance Spectroscopy (EIS). The combination of site-specific sampling, high resolution microscopy techniques, and this kind of spectroscopic studies are thus an excellent group of tools for characterization. It allows establishing clear correlations between the microstructure/composition at the electrode/electrolyte interphase and the measured cell performance. Thus, this information can be used to improve the cell design and to increase the cell performance and its stability after long term operation conditions.
Author details Analía Leticia Soldati1,2, Laura Cecilia Baqué1,3, Horacio Esteban Troiani2,4 and Adriana Cristina Serquis1,2 1Materials Characterization Department, Bariloche Atomic Center, Atomic Energy Nacional Commission, San Carlos de Bariloche, Argentina 2CONICET, Buenos Aires, Argentina 3IDEPA-CONICET, CCT-Comahue, Buenos Aires, Neuquén, Argentina 4Metals Physics Department, Bariloche Atomic Center, Atomic Energy Nacional Commission, San Carlos de Bariloche, Argentina
Acknowledgement The authors gratefully thank Mrs. Anja Schreiber and Dr. Richard Wirth from the GeoFoschungsZentrum (GFZ Potsdam, Germany) for preparing the FIB foils. Mr. Carlos

Electrode/Electrolyte Interphase Characterization in Solid Oxide Fuel Cells 301
Cotaro (CNEA, Argentine) is acknowledged for making the FEG-SEM images. Fundación Balseiro, University of Cuyo and CONICET are acknowledged for the financial support and CNEA for supplying the equipment, technical staff and laboratories. Dr Alberto Caneiro from the Materials Characterization Department (CNEA, Argentine) is thankfully recognized for allowing us to use the experimental facilities and for helpful discussions.
Abbreviations FC = Fuel Cell EDS = energy dispersive spectroscopy FIB = focused ion beam MC = mixed conductor SEM = scanning electron microscopy SOFC = solid oxide fuel cell TEM = transmission electron microscopy TPB = triple phase boundary WDS = wavelength dispersive spectroscopy XRD = x-ray diffraction
Cathodes
LSCF= LaxSr1-xCoyFe1-yO3-δ LSM= LaxSr1-xMnO3-δ
Electrolytes
CGO= Ce0.9Gd0.1O2-δ SDC= Ce0.9Sm0.1O2-δ YSZ= Zr0.9Y0.1O2-δ
8. References [1] Ormerod RM (2003) Solid oxide fuel cells. Chem. soc. rev. 32: 17-28. [2] Steele BCH, Heinzel A (2001) Materials for fuel-cell technologies. Nature 414: 345-352. [3] Hibino T, Hashimoto A, Inoue T, Tokuno J, Yoshida S, Sano M (2000) A low-operating-
temperature solid oxide fuel cell in hydrocarbon-air mixtures. Science 288: 2031-2033. [4] Larminie J, Dicks A (2003) Fuel cell systems explained John Wiley & Sons. [5] Adler SB (2004) Factors governing oxygen reduction in solid oxide fuel cell cathodes.
Chem. rev. 104: 4791-4843. [6] Jorgensen MJ, Primdahl S, Bagger C, Mogensen M (2001) Effect of sintering temperature
on microstructure and performance of LSM-YSZ composite cathodes. Solid state ionics 139: 1-11.
[7] Macdonald JR (1987) Impedance Spectroscopy. Emphasizing solid materials and systems John Wiley & Sons.
[8] Baqué LC (2011) Preparation and characterization of high performance cathodes for intermediate temperature solid oxide fuel cells.available online at

Hydrogen Energy – Challenges and Perspectives 302
http://ricabib.cab.cnea.gov.ar, in Engineering Department. 2011, Universidad Nacional de Cuyo, Instituto Balseiro: San Carlos de Bariloche.
[9] Armstrong T, Prado F, Manthiram A (2001) Synthesis, crystal chemistry, and oxygen permeation properties of LaSr3Fe3-xCoxO10 (0 <= x <= 1.5). Solid state ionics 140: 89-96.
[10] Backhaus-Ricoult M (2008) SOFC - A playground for solid state chemistry. Solid state sci. 10: 670-688.
[11] Sase M, Suzuki J, Yashiro K, Otake T, Kaimai A, Kawada T, Mizusaki J, Yugami H (2006) Electrode reaction and microstructure of La0.6Sr0.4CoO3-delta thin films. Solid state ionics 177: 1961-1964.
[12] Sasaki K, Susuki K, Iyoshi A, Uchimura M, Imamura N, Kusaba H, Teraoka Y, Fuchino H, Tsujimoto K, Uchida Y, Jingo N (2006) H[sub 2]S Poisoning of Solid Oxide Fuel Cells. J. electrochem. soc. 153: A2023-A2029.
[13] Beckel D, Muecke UP, Gyger T, Florey G, Infortuna A, Gauckler LJ (2007) Electrochemical performance of LSCF based thin film cathodes prepared by spray pyrolysis. Solid state ionics 178: 407-415.
[14] Nielsen J, Jacobsen T (2008) SOFC cathode/YSZ - Non-stationary TPB effects. Proceedings 1314-1319. Elsevier Science Bv.
[15] Soldati AL, Baqué L, Troiani H, Cotaro C, Schreiber A, Caneiro A, Serquis A (2011) High resolution FIB-TEM and FIB-SEM characterization of electrode/electrolyte interfaces in solid oxide fuel cells materials. Int. j. hydrogen energ. 36: 9180-9188
[16] Hildenbrand N, Boukamp BA, Nammensma P, Blank DHA (2011) Improved cathode/electrolyte interface of SOFC. Solid state ionics 192: 12-15.
[17] Nam JH, Jeon DH (2006) A comprehensive micro-scale model for transport and reaction in intermediate temperature solid oxide fuel cells. Electrochim. acta 51: 3446-3460.
[18] Baqué L, Serquis A (2007) Microstructural characterization of La0.4Sr0.6Co0.8Fe0.2O3-delta films deposited by dip coating. Appl. surf. sci. 254: 213-218.
[19] Murray EP, Sever MJ, Barnett SA (2002) Electrochemical performance of (La,Sr)(Co,Fe)O-3-(Ce,Gd)O-3 composite cathodes. Solid state ionics 148: 27-34.
[20] Hansch R, Chowdhury MRR, Menzler NH (2009) Screen printing of sol/gel-derived electrolytes for solid oxide fuel cell (SOFC) application. Ceram. int. 35: 803-811.
[21] Besra L, Liu M (2007) A review on fundamentals and applications of electrophoretic deposition (EPD). Prog. mat. sci. 52: 1-61.
[22] Corni I, Ryan MP, Boccaccini AR (2008) Electrophoretic deposition: From traditional ceramics to nanotechnology. J. eur. ceram. soc. 28: 1353-1367.
[23] Perednis D, Gauckler LJ (2004) Solid oxide fuel cells with electrolytes prepared via spray pyrolysis. Solid state ionics 166: 229-239.
[24] Yoon J, Araujo R, Grunbaum N, Baque L, Serquis A, Caneiro A, Zhang XH, Wang HY (2007) Nanostructured cathode thin films with vertically-aligned nanopores for thin film SOFC and their characteristics. Appl. surf. sci. 254: 266-269.
[25] Napolitano F, Baqué L, Cho SM, Qing S, Wang H, Casanova JR, Lamas D, Soldati AL, Serquis A (2011) Characterization of SOFC cathodes prepared by pulse laser deposition. ECS trans. 35: 2379-2386.
[26] Chen KF, Lu Z, Chen XJ, Ai N, Huang XQ, Wei B, Hu JY, Su WH (2008) Characteristics of NiO-YSZ anode based on NiO particles synthesized by the precipitation method. J. alloy. compd. 454: 447-453.

Electrode/Electrolyte Interphase Characterization in Solid Oxide Fuel Cells 303
[27] Li C-x, Xing Y-z, Yang G-j, Li C-j (2005) Effect of anode microstructure on performance of SOFC fabricated by thermal spraying. Chin. j. nonferr. met. 15: 1411-1415.
[28] Barbucci A, Viviani M, Panizza M, Delucchi M, Cerisola G (2005) Analysis of the oxygen reduction process on SOFC composite electrodes. In: editors. Springer. pp. 399-403.
[29] Chen KF, Lu Z, Chen XJ, Ai N, Huang XQ, Du XB, Su WH (2007) Development of LSM-based cathodes for solid oxide fuel cells based on YSZ films. J. power sources 172: 742-748.
[30] Dusastre V, Kilner JA (1999) Optimisation of composite cathodes for intermediate temperature SOFC applications. Solid state ionics 126: 163-174.
[31] Baqué L, Caneiro A, Moreno MS, Serquis A (2008) High performance nanostructured IT-SOFC cathodes prepared by novel chemical method. Electrochem. commun. 10: 1905-1908.
[32] Backhaus-Ricoult M (2006) Interface chemistry in LSM-YSZ composite SOFC cathodes. Solid state ionics 177: 2195-2200.
[33] Bevilacqua M, Montini T, Tavagnacco C, Fonda E, Fornasiero P, Graziani M (2007) Preparation, characterization, and electrochemical properties of pure and composite LaNi0.6Fe0.4O3-Based cathodes for IT-SOFC. Chem. mat. 19: 5926-5936.
[34] Grosjean A, Sanséau O, Radmilovic V, Thorel A (2006) Reactivity and diffusion between La0.8Sr0.2MnO3 and ZrO2 at interfaces in SOFC cores by TEM analyses on FIB samples. Solid state ionics 177: 1977-1980.
[35] Izuki M, Brito ME, Yamaji K, Kishimoto H, Cho D-H, Shimonosono T, Horita T, Yokokawa H Interfacial stability and cation diffusion across the LSCF/GDC interface. J. power sources In Press, Corrected Proof:
[36] Montenegro Hernandez A, Soldati A, Troiani H, Schreiber A, Flavio, Caneiro A (2012) Interface Reaction between Ln2NiO4 cathodes and two comercial electrolytes. In prep.
[37] Williams DB, Carter CB (1996) Transmission Electron Microscopy New York: Plenum Press.
[38] Phaneuf MW (2005) FIB For Materials Science Applications - A Review. In: Giannuzzi LA, Stevie FA editors. Introduction to Focused Ion Beams. Instrumentation, Theory, Techniques and Practice. New York: Springer. pp. 143-172.
[39] Anderson R, Klepeis SJ (2005) Practical Aspects on FIB TEM Specimen Preparation. With Emphasis on Semiconductor Applications. In: Giannuzzi LA, Stevie FA editors. Introduction to Focused Ion Beams. Instrumentation, Theory, Techniques and Practice. New York: Springer. pp. 173-200.
[40] Giannuzzi LA, Kempshall BW, Schwarz SM, Lomness JK, Prenitzer BI, Stevie FA (2005) FIB Lift-out Specimen Preparation Techniques. In: Giannuzzi LA, Stevie FA editors. Introduction to Focused Ion Beams. Instrumentation, Theory, Techniques and Practice. New York: Springer. pp. 201-228.
[41] Wirth R (2009) Focused Ion Beam (FIB) combined with SEM and TEM: Advanced analytical tools for studies of chemical composition, microstructure and crystal structure in geomaterials on a nanometre scale. Chem. geol. 261: 217-229.
[42] Liu YL, Jiao C (2005) Microstructure degradation of an anode/electrolyte interface in SOFC studied by transmission electron microscopy. Solid state ionics 176: 435-442.
[43] Wilson JR, Kobsiriphat W, Mendoza R, Chen H-Y, Hiller JM, Miller DJ, Thornton K, Voorhees PW, Adler SB, Barnett SA (2006) Three-dimensional reconstruction of a solid-oxide fuel-cell anode. Nat. mater. 5: 541-544.

Hydrogen Energy – Challenges and Perspectives 304
[44] Wilson JR, Cronin JS, Duong AT, Rukes S, Chen H-Y, Thornton K, Mumm DR, Barnett S (2010) Effect of composition of (La0.8Sr0.2MnO3-Y2O3-stabilized ZrO2) cathodes: Correlating three-dimensional microstructure and polarization resistance. J. power sources 195: 1829-1840.
[45] Wilson JR, Duong AT, Gameiro M, Chen H-Y, Thornton K, Mumm DR, Barnett SA (2009) Quantitative three-dimensional microstructure of a solid oxide fuel cell cathode. Electrochem. commun. 11: 1052-1056.
[46] Smith JR, Chen A, Gostovic D, Hickey D, Kundinger D, Duncan KL, DeHoff RT, Jones KS, Wachsman ED (2009) Evaluation of the relationship between cathode microstructure and electrochemical behavior for SOFCs. Solid state ionics 180: 90-98.
[47] Holzer L, Muench B, Wegmann M, Gasser P, Flatt RJ (2006) FIB-Nanotomography of Particulate Systems—Part I: Particle Shape and Topology of Interfaces. J. am. ceram. soc. 89: 2577-2585.
[48] Chae NS, Park KS, Yoon YS, Yoo IS, Kim JS, Yoon HH (2008) Sr- and Mg-doped LaGaO3 powder synthesis by carbonate coprecipitation. Colloid surface A 313-314: 154-157.
[49] Shearing PR, Gelb J, Brandon NP (2010) X-ray nano computerised tomography of SOFC electrodes using a focused ion beam sample-preparation technique. J. eur. ceram. soc. 30: 1809-1814.
[50] Shearing PR, Gelb J, Yi J, Lee WK, Drakopolous M, Brandon NP (2010) Analysis of triple phase contact in Ni-YSZ microstructures using non-destructive X-ray tomography with synchrotron radiation. Electrochem. commun. 12: 1021-1024
[51] Shearing PR, Golbert J, Chater RJ, Brandon NP (2009) 3D reconstruction of SOFC anodes using a focused ion beam lift-out technique. Chem. eng. sci. 64: 3928-3933.
[52] Soldati A, Troiani H, Montenegro-Hernández A, Schreiber A, Soldera F, Caneiro A, Serquis A (2012) Evaluación de efectos secundarios originados por la preparación con fib de interfases entre materiales cerámicos porosos y sólidos. Proceedings of SAMIC 2012, p: Buenos Aires:
[53] Siebert E, Hammouche A, Kleitz M (1995) Impedance spectroscopy analysis of La1-
xSrxMnO3-yttria-stabilized zirconia electrode kinetics. Electrochim. acta 40: 1741-1753. [54] Grunbaum N, Dessemond L, Fouletier J, Prado F, Caneiro A (2006) Electrode reaction of
Sr1-xLaxCo0.8Fe0.2O3-δ with x=0.1 and 0.6 on Ce0.9Gd0.1O1.95 at 600 <= T <= 800ºC Solid state ionics 177: 907-913.
[55] Grunbaum N, Dessemond L, Fouletier J, Prado F, Mogni L, Caneiro A (2009) Rate limiting steps of the porous La0.6Sr0.4Co0.8Fe0.2O3-δ. Solid state ionics 180: 1448-1452.
[56] Teraoka Y, Zhang HM, Okamoto K, Yamazoe N (1988) Mixed ionic-electronic conductivity of La1-xSrxCo1-yFeyO3-δ perovskite-type oxides. Mater. res. bull. 23: 51-58.
[57] Soldati AL, Baqué L, Troiani H, Cotaro C, Schreiber A, Caneiro A, Serquis A (2011) La0.4Sr0.6Co0.8Fe0.2O3-δ / Ce0.9Gd0.1O2-δ Interface: Characterization by High Resolution SEM and TEM. ECS trans. 35: 657-664.
[58] Wiedenmann D, Hauch A, Grobéty B, Mogensen M, Vogt UF (2010) Complementary techniques for solid oxide electrolysis cell characterisation at the micro- and nano-scale. Int. j. hydrogen energ. 35: 5053-5060.