Embed Size (px)
Citation preview

Available online at www.sciencedirect.com
International Journal of Hydrogen Energy 28 (2003) 311–316
www.elsevier.com/locate/ijhydene
Electrochemical studies on the Ti–Zr–V–Mn–Cr–Ni hydrogenstorage electrode alloys
Yunfeng Zhu, Hongge Pan ∗, Mingxia Gao, Jianxin Ma, Yongquan Lei, QidongWangDepartment of Materials Science and Engineering, Zhejiang University, Hangzhou 310027, China
Abstract
In this paper, the electrochemical properties of the (Ti0:8Zr0:2)(V0:533Mn0:107Cr0:16Ni0:2)x (x = 2; 3; 4; 5; 6) hydrogen storageelectrode alloys have been studied. X-ray powder di;raction analysis showed that all alloys mainly consisted of a C14 Lavesphase with hexagonal structure and a V-based solid solution phase with BCC structure. The lattice parameters and the unit cellvolumes of the two phases decrease when x is increased. The electrochemical performances of the alloy electrodes, includingthe cycle life, the linear polarization, the anodic polarization, the Tafel polarization and the electrochemical impedance spectra,have been investigated systematically. After considering the global e;ect of the non-stoichiometry of B-side elements on theperformances of the alloy electrodes, the optimum composition was found to lie in x = 5. Consequently, we believe that thenon-stoichiometry is an e;ective way to improve the overall electrochemical properties of the Ti-based Laves phase hydrogenstorage alloys used for the negative electrodes of Ni–MH secondary batteries.? 2002 International Association for Hydrogen Energy. Published by Elsevier Science Ltd. All rights reserved.
Keywords: Non-stoichiometry; Hydrogen storage alloy; C14 Laves phase; V-based solid solution; Electrochemical property
1. Introduction
Recently, nickel–metal hydride (Ni–MH) secondary bat-teries which use hydrogen storage alloys as the negativeelectrode material have been widely studied and utilizedbecause of their higher capacity, higher high-rate dis-chargeability, better cycling properties and improved en-vironmental compatibility compared to Ni–Cd batteries[1–5]. Several types of hydrogen storage alloys have beeninvestigated, including rare earth-based AB5-type alloys[6], Ti, Zr-based or Zr, Ti-based AB2-type alloys [7,8],Mg-based alloys [9] and V-based solid solutions [10].However, each type of alloy has its disadvantages, such asthe comparatively low discharge capacity of the AB5-typealloys, the poor cyclic stability of the Mg-based alloysand the V-based solid solutions, and the low high-ratedischargeability of the Ti- or Zr-based AB2-type alloys.
∗ Corresponding author. Tel.: +86-571-8795-2576; fax: +86-571-8795-1152.
E-mail address: [email protected] (H. Pan).
Non-stoichiometry is considered to be an e;ective tech-nique for changing the electrochemical properties of thehydrogen storage alloys either by special doping or mul-ticomponent alloying [11–14]. Lee et al. [11] formulateda kind of hypostoichiometric Zr-based hydrogen storagealloys, which appeared very promising. The cycle life wasfound improved by over-stoichiometry. Notten et al. [12]and Vogt et al. [14] discovered that both La(Ni;Cu)5+xand La(Ni; Sn)5+x electrodes had improved cyclic dura-bility compared to electrodes made from the stoichiomet-ric alloys. Thus, it appears that the non-stoichiometry isprobably an e;ective technique to improve the electro-chemical properties of the hydrogen storage alloys to bestudied.In the present study, we selected the Ti-based AB2-type
Ti–Zr–V–Mn–Cr–Ni hydrogen storage alloys for investiga-tion since they generally have a higher discharge capacitythan the rare earth-based AB5-type alloys, and also be-cause Ti is cheaper than Zr. We formulated a series ofsuper-stoichiometric (Ti0:8Zr0:2)(V0:533Mn0:107Cr0:16Ni0:2)x(x = 2; 3; 4; 5; 6) hydrogen storage alloys and the elec-trochemical properties of these alloys were investigatedsystematically.
0360-3199/02/$ 22.00 ? 2002 International Association for Hydrogen Energy. Published by Elsevier Science Ltd. All rights reserved.PII: S 0360 -3199(02)00083 -6

312 Y. Zhu et al. / International Journal of Hydrogen Energy 28 (2003) 311–316
2. Experimental
The alloys (Ti0:8Zr0:2)(V0:533Mn0:107Cr0:16Ni0:2)x (x =2; 3; 4; 5; 6) were prepared by induction levitation meltingof the constituent metals on a water-cooled copper crucibleunder argon atmosphere. The ingots were turned over andremelted twice to ensure a high homogeneity. Part of thealloys were mechanically crushed and ground to powder of300 mesh size for the X-ray powder di;raction (XRD) andelectrochemical measurements. The crystal structures andlattice parameters were determined by XRD using Cu K�radiation.All test electrodes were prepared by Lrst mixing thor-
oughly 0:1 g alloy powder with 0:4 g carbonyl nickelpowder and then cold-pressing the mixture under a pres-sure of 25 MPa into a pellet of 10 mm diameter and about1 mm thickness. The electrochemical measurements wereperformed in a half-cell consisting of a working electrode(MH electrode), a sintered Ni(OH)2=NiOOH counter elec-trode and a Hg=HgO reference electrode. The electrolytewas a 6 M KOH solution, at a controlled temperature of30 ± 1◦C. In order to reduce the IR drop during the elec-trochemical impedance spectroscopy measurements, theHg=HgO reference electrode was equipped with a Luggintube. The discharge capacity of the electrode was deter-mined by the galvanostatic method. Each electrode wascharged at 100 mA=g for 5 h followed by 10 min restand then discharged at 60 mA=g to the cut-o; potentialof −0:6 V vs. the Hg=HgO reference electrode. Electro-chemical impedance spectroscopy (EIS) measurementswere conducted at 50% depth of discharge (DOD) using aSolartron SI1287 Electrochemical Interface with a 1255BFrequency Response Analyzer, using the ZPLOT electro-chemical impedance software. Before EIS measurements,the test electrodes were completely activated (15 cycles).The EISs of the electrodes were obtained in the frequencyrange of 100 kHz–5 mHz with an ac amplitude of 5 mVunder open-circuit conditions. The linear polarizationcurves, the anodic polarization curves and the Tafel po-larization curves of the test electrodes were measured byscanning the electrode potentials (Solartron SI1287 poten-tionstat, using the CorrWare electrochemistry=corrosionsoftware) at 0:1 mV=s from −5 to 5 mV (vs. open circuitpotential (ocp)), 5 mV=s from 0 to 1200 mV (vs. ocp) and5 mV=s from −150 to 150 mV (vs. ocp) at 50% DOD,respectively.
3. Results and discussion
3.1. Alloy structures
Fig. 1 shows the XRD patterns of the (Ti0:8Zr0:2)(V0:533Mn0:107Cr0:16Ni0:2)x (x= 2; 3; 4; 5; 6) alloys. It can beseen that all the alloys are mainly composed of a C14 Lavesphase with hexagonal structure and a V-based solid solution
Fig. 1. XRD patterns of the (Ti0:8Zr0:2)(V0:533Mn0:107Cr0:16Ni0:2)x (x = 2; 3; 4; 5; 6) alloys.
Fig. 2. Discharge curves of the (Ti0:8Zr0:2)(V0:533Mn0:107Cr0:16Ni0:2)x (x = 2; 3; 4; 5; 6) alloy electrodes at 303 K.
phase with BCC structure. The lattice parameters of thetwo phases are presented in Table 1. The lattice parametersand the unit cell volumes of both phases decrease when xincreases. Furthermore, it can also be found that the peakintensity of the C14 Laves phase becomes weaker withincreasing x, which makes us believe that the C14 Lavesphase content decreases while the V-based solid solutionphase content increases for alloys with higher x-values.
3.2. Electrochemical characteristics
3.2.1. Discharge behavior and cycle lifeFig. 2 shows the discharge curves of the 15th cycle for
the (Ti0:8Zr0:2)(V0:533Mn0:107Cr0:16Ni0:2)x (x=2; 3; 4; 5; 6) al-loy electrodes. It can be seen that the discharge equilib-rium potential is increased and the slope of the curve isdecreased with increasing x. The discharge midpoint poten-tials obtained from the discharge curves and the OCP withDOD = 50% are presented in Table 2. Both the dischargemidpoint potential and the ocp with DOD = 50% increase

Y. Zhu et al. / International Journal of Hydrogen Energy 28 (2003) 311–316 313
Table 1The crystallographic parameters of alloy phases in the (Ti0:8Zr0:2)(V0:533Mn0:107Cr0:16Ni0:2)x (x=2; 3; 4; 5; 6) alloys as determined by XRD
Samples Phase Lattice parameter ( PA) Cell volume ( PA3)
x = 2 C14 a = 5:023 c = 8:190 179.0BCC a = 3:012 27.33
x = 3 C14 a = 4:967 c = 8:105 173.2BCC a = 2:986 26.62
x = 4 C14 a = 4:937 c = 8:057 170.1BCC a = 2:977 26.38
x = 5 C14 a = 4:920 c = 8:017 168.1BCC a = 2:973 26.28
x = 6 C14 a = 4:897 c = 7:983 165.8BCC a = 2:962 25.99
Table 2The electrochemical characteristics of the (Ti0:8Zr0:2)(V0:533Mn0:107Cr0:16Ni0:2)x (x = 2; 3; 4; 5; 6) alloy electrodes
Samples Veqa (mV, vs. Hg=HgO) Vob (mV, vs. Hg=HgO) Cmax (mAh=g) Nac C100=Cmax (%)
x = 2 − 869 − 909 225.5 3 40.62x = 3 − 870 − 914 336.9 5 42.42x = 4 − 876 − 919 360.2 9 57.66x = 5 − 892 − 925 379.8 11 69.43x = 6 − 902 − 931 320.3 15 85.79aThe discharge midpoint potentials obtained from the discharge curves.bThe OCP with DOD = 50%.cThe number of cycles needed to activate the electrodes.
Fig. 3. Variation of the discharge midpoint potentials, Veq, and theocps, Vo, at DOD = 50% of the (Ti0:8Zr0:2)(V0:533Mn0:107Cr0:16Ni0:2)x (x = 2; 3; 4; 5; 6) alloy electrodes at 303 K.
with increasing x. Fig. 3 shows the di;erences between thedischarge midpoint potentials and the open circuit potentialswith DOD=50%. It can be seen that the discharge overpo-tentials tend to decrease with higher x-values, which indi-cates that the polarization of the alloy electrodes decreases.
Fig. 4. Discharge capacity vs. cycle number for the (Ti0:8Zr0:2)(V0:533Mn0:107Cr0:16Ni0:2)x (x = 2; 3; 4; 5; 6) alloy electrodes at303 K.
Fig. 4 shows the cycle life curves of the (Ti0:8Zr0:2)(V0:533Mn0:107Cr0:16Ni0:2)x (x=2; 3; 4; 5; 6) alloy electrodes.The maximum discharge capacities and the activationcycles (Na) are summarized in Table 2. It can be seen thatthe maximum discharge capacity increases with increasing
314 Y. Zhu et al. / International Journal of Hydrogen Energy 28 (2003) 311–316
x from 2 to 5 and then decreases for x = 6, while the num-ber of activation cycles (Na) increases monotonically withx. Tsukahara [15] has reported that the single V-based solidsolution phase had no electrochemical discharge capacityin the KOH electrolyte because it was not electrocatalytic.But with the presence of other phases in the V-based solidsolution alloys, such as TiNi phase or C14 Laves phase,which acted as a catalyst and a micro-current collector,the V-based solid solution phase was activated to absorband desorb reversibly a considerable amount of hydrogenin KOH electrolyte. In the present study, all the alloys arecomposed of two phases, of which both the C14 Lavesphase and the V-based solid solution phase, especially, arethe hydrogen storage phases, with the C14 Laves phaseworking as the catalyst and the micro-current collector. Sothe increase in maximum discharge capacity here may beascribed to the increase in content of the V-based solidsolution phase when x increases. However, when x reaches6, the maximum discharge capacity decreases. We try toattribute this phenomenon to the competition between in-creasing V-based solid solution phase content and decreas-ing electrocatalytic activity of C14 Laves phase. It has beenconcluded that the V-based solid solution phase content in-creases, while the C14 Laves phase content decreases withincreasing x. Since the C14 Laves phase works as a catalystand a micro-current collector, so the decrease in C14 Lavesphase content will lead to the decrease in electrochemicalactivity of the V-based solid solution phase. Consequently,we believe it is natural for this type of electrode to have amaximum discharge capacity and subsequent decline in ca-pacity as x increases. In this study, the discharge capacity ofthe alloy electrode reaches the maximum of 379:8 mAh=gwhen x=5 and then decreases to 320:3 mAh=g when x=6.It can also be seen from Table 2 that the cyclic stability of
the alloy electrode improves, whereas the number of cyclesrequired for activation increases as x increases. For x = 6,the discharge capacity of the electrode is still 85.79% ofthe maximum discharge capacity even after 100 charge–discharge cycles. However, it needs 15 cycles to activatethe electrode. It has been reported [16] that Cr improves thecyclic durability of Ti-based alloy electrodes due to its goodcorrosion resistance in an alkaline electrolyte by forminga passive oxide Llm on the electrode surface, which thenretards the oxidation and dissolution of other elements. Webelieve that, likewise, the increase in Cr content in the alloywhen x increases here is responsible for the improved cyclicstability of the alloy electrodes. However, the passive Llmmakes the electrode more diQcult to activate.
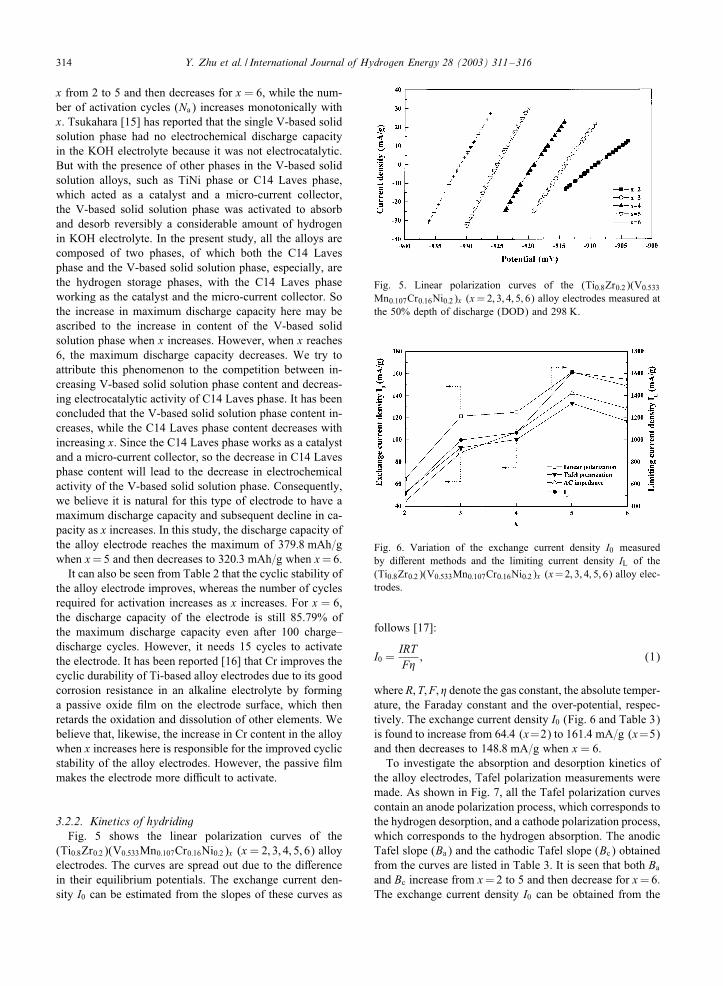
3.2.2. Kinetics of hydridingFig. 5 shows the linear polarization curves of the
(Ti0:8Zr0:2)(V0:533Mn0:107Cr0:16Ni0:2)x (x = 2; 3; 4; 5; 6) alloyelectrodes. The curves are spread out due to the di;erencein their equilibrium potentials. The exchange current den-sity I0 can be estimated from the slopes of these curves as
Fig. 5. Linear polarization curves of the (Ti0:8Zr0:2)(V0:533Mn0:107Cr0:16Ni0:2)x (x=2; 3; 4; 5; 6) alloy electrodes measured atthe 50% depth of discharge (DOD) and 298 K.
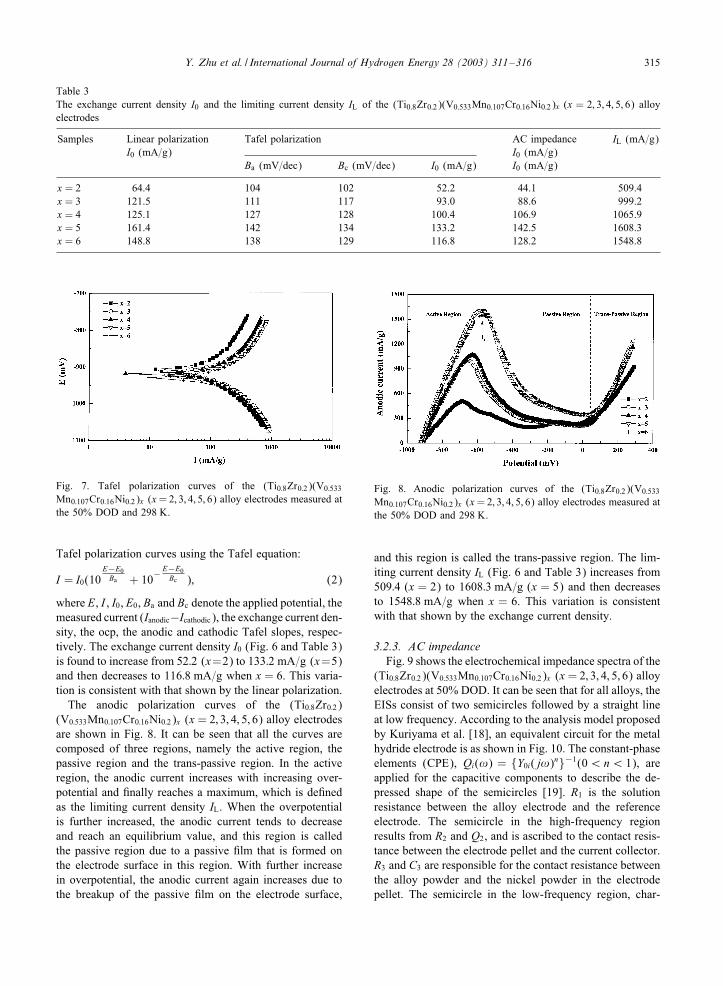
Fig. 6. Variation of the exchange current density I0 measuredby di;erent methods and the limiting current density IL of the(Ti0:8Zr0:2)(V0:533Mn0:107Cr0:16Ni0:2)x (x=2; 3; 4; 5; 6) alloy elec-trodes.
follows [17]:
I0 =IRTF�
; (1)
where R; T; F; � denote the gas constant, the absolute temper-ature, the Faraday constant and the over-potential, respec-tively. The exchange current density I0 (Fig. 6 and Table 3)is found to increase from 64:4 (x=2) to 161:4 mA=g (x=5)and then decreases to 148:8 mA=g when x = 6.To investigate the absorption and desorption kinetics of
the alloy electrodes, Tafel polarization measurements weremade. As shown in Fig. 7, all the Tafel polarization curvescontain an anode polarization process, which corresponds tothe hydrogen desorption, and a cathode polarization process,which corresponds to the hydrogen absorption. The anodicTafel slope (Ba) and the cathodic Tafel slope (Bc) obtainedfrom the curves are listed in Table 3. It is seen that both Baand Bc increase from x=2 to 5 and then decrease for x=6.The exchange current density I0 can be obtained from the
Y. Zhu et al. / International Journal of Hydrogen Energy 28 (2003) 311–316 315
Table 3The exchange current density I0 and the limiting current density IL of the (Ti0:8Zr0:2)(V0:533Mn0:107Cr0:16Ni0:2)x (x = 2; 3; 4; 5; 6) alloyelectrodes
Samples Linear polarization Tafel polarization AC impedance IL (mA=g)I0 (mA=g) I0 (mA=g)
Ba (mV=dec) Bc (mV=dec) I0 (mA=g) I0 (mA=g)
x = 2 64.4 104 102 52.2 44.1 509.4x = 3 121.5 111 117 93.0 88.6 999.2x = 4 125.1 127 128 100.4 106.9 1065.9x = 5 161.4 142 134 133.2 142.5 1608.3x = 6 148.8 138 129 116.8 128.2 1548.8
Fig. 7. Tafel polarization curves of the (Ti0:8Zr0:2)(V0:533Mn0:107Cr0:16Ni0:2)x (x=2; 3; 4; 5; 6) alloy electrodes measured atthe 50% DOD and 298 K.
Tafel polarization curves using the Tafel equation:
I = I0(10E−E0Ba + 10−
E−E0Bc ); (2)
where E, I , I0, E0, Ba and Bc denote the applied potential, themeasured current (Ianodic−Icathodic), the exchange current den-sity, the ocp, the anodic and cathodic Tafel slopes, respec-tively. The exchange current density I0 (Fig. 6 and Table 3)is found to increase from 52:2 (x=2) to 133:2 mA=g (x=5)and then decreases to 116:8 mA=g when x = 6. This varia-tion is consistent with that shown by the linear polarization.The anodic polarization curves of the (Ti0:8Zr0:2)
(V0:533Mn0:107Cr0:16Ni0:2)x (x = 2; 3; 4; 5; 6) alloy electrodesare shown in Fig. 8. It can be seen that all the curves arecomposed of three regions, namely the active region, thepassive region and the trans-passive region. In the activeregion, the anodic current increases with increasing over-potential and Lnally reaches a maximum, which is deLnedas the limiting current density IL. When the overpotentialis further increased, the anodic current tends to decreaseand reach an equilibrium value, and this region is calledthe passive region due to a passive Llm that is formed onthe electrode surface in this region. With further increasein overpotential, the anodic current again increases due tothe breakup of the passive Llm on the electrode surface,
Fig. 8. Anodic polarization curves of the (Ti0:8Zr0:2)(V0:533Mn0:107Cr0:16Ni0:2)x (x=2; 3; 4; 5; 6) alloy electrodes measured atthe 50% DOD and 298 K.
and this region is called the trans-passive region. The lim-iting current density IL (Fig. 6 and Table 3) increases from509:4 (x = 2) to 1608:3 mA=g (x = 5) and then decreasesto 1548:8 mA=g when x = 6. This variation is consistentwith that shown by the exchange current density.
3.2.3. AC impedanceFig. 9 shows the electrochemical impedance spectra of the
(Ti0:8Zr0:2)(V0:533Mn0:107Cr0:16Ni0:2)x (x = 2; 3; 4; 5; 6) alloyelectrodes at 50% DOD. It can be seen that for all alloys, theEISs consist of two semicircles followed by a straight lineat low frequency. According to the analysis model proposedby Kuriyama et al. [18], an equivalent circuit for the metalhydride electrode is as shown in Fig. 10. The constant-phaseelements (CPE), Qi(!) = {Y0i(j!)n}−1(0¡n¡ 1), areapplied for the capacitive components to describe the de-pressed shape of the semicircles [19]. R1 is the solutionresistance between the alloy electrode and the referenceelectrode. The semicircle in the high-frequency regionresults from R2 and Q2, and is ascribed to the contact resis-tance between the electrode pellet and the current collector.R3 and C3 are responsible for the contact resistance betweenthe alloy powder and the nickel powder in the electrodepellet. The semicircle in the low-frequency region, char-

316 Y. Zhu et al. / International Journal of Hydrogen Energy 28 (2003) 311–316
Fig. 9. Electrochemical impedance spectra of the (Ti0:8Zr0:2)(V0:533Mn0:107Cr0:16Ni0:2)x (x=2; 3; 4; 5; 6) alloy electrodes measured atthe 50% DOD and 298 K.
Fig. 10. An equivalent circuit for the (Ti0:8Zr0:2)(V0:533Mn0:107Cr0:16Ni0:2)x (x = 2; 3; 4; 5; 6) metal hydride.
acterized by R4 and Q4, is attributed to the charge-transferresistance and the double-layer capacitance, respectively.W4 is the Warburg impedance corresponding to the hydro-gen di;usion in the alloy. It can be found from Fig. 9 thatthe radius of the larger semicircle in the low-frequency re-gion decreases as x increases from 2 to 5, and then slightlyincreases for x= 6, which indicates that the charge-transferresistance of the electrode surface decreases to a minimumfrom x = 2–5 and then increases for x = 6. The parame-ters in the equivalent circuit were Ltted using the ZPLOTelectrochemical impedance software. The exchange currentdensity I0 calculated from the charge-transfer resistance(Fig. 6 and Table 3) is found to increase from 44:1 (x = 2)to 142:5 mA=g (x = 5) and then decreases to 128:2 mA=gwhen x = 6. This variation is consistent with that seen forthe linear polarization and the Tafel polarization.From the above results, it is believed that the kinetics of
hydriding of the (Ti0:8Zr0:2)(V0:533Mn0:107Cr0:16Ni0:2)x (x =2; 3; 4; 5; 6) hydrogen storage alloys is greatly improved byincreasing x, and that the optimum composition is aroundx = 5.
4. Conclusions
The electrochemical properties of the (Ti0:8Zr0:2)(V0:533Mn0:107Cr0:16Ni0:2)x (x = 2; 3; 4; 5; 6) hydrogen stor-age electrode alloys have been investigated. All alloys
consist of a C14 Laves phase with hexagonal structure and aV-based solid solution phase with BCC structure. The C14Laves phase content decreases, and the V-based solid solu-tion phase content increases, with increasing x. The electro-chemical measurements show that the maximum dischargecapacity, the discharge equilibrium potential, the cyclicstability, the exchange current density I0 and the limitingcurrent density IL of the alloy electrodes increase withincreasing x from 2 to 5. As x further increases to 6, thedischarge equilibrium potential and the cyclic stability con-tinue to increase proportionately, whereas the maximumdischarge capacity, the exchange current density I0, andthe limiting current density IL decrease. Furthermore, thedischarge overpotential decreases with increasing x andthe alloy electrode becomes more diQcult to activate. Theoptimum performance was found for the alloy with x = 5.
References
[1] Willems JJG. Philips J Res Suppl 1984;39(1):10.[2] Willems JJG, Buschow KHJ. J Less-Common Metals1987;129:13.
[3] Sakai T, Miyamura H, Kuriyama N, Kato A, Oguro K,Ishikawa H. J Electrochem Soc 1990;137:795.
[4] Hongge Pan, Yun Chen, Chunsheng Wang, Ma JX, Chen CP,Wang QD. Electrochim Acta 1999;44:2263.
[5] Wang CS, Lei YQ, Wang QD. Electrochim Acta1998;43:3193.
[6] Hongge Pan, Ma JX, Chunsheng Wang, Chen CP, Wang QD.Electrochim Acta 1999;44:3977.
[7] Yu JS, Lee SM, Cho K, Lee JY. J Electrochem Soc2000;147:2013.
[8] Kim DM, Lee SM, Jang KJ, Lee JY. J Alloys Compounds1998;268:241.
[9] Iwakura C, Inoue H, Zhang SG, Nohara S, Yorimitsu K,Kuramoto N, Morikawa T. J Electrochem Soc 1999;146:1659.
[10] Tsukahara M, Kamiya T, Takahashi K, Kawabata A, SakuraiS, Shi J, Takeshita HT, Kuriyama N, Sakai T. J ElectrochemSoc 2000;147:2941.
[11] Lee SM, Kim SH, Jeon SW, Lee JY. J Electrochem Soc2000;147:4464.
[12] Notten PHL, Einerhand REF, Daams JLC. J AlloysCompounds 1994;210:221.
[13] Kim DM, Lee SM, Jung JH, Jang KJ, Lee JY. J ElectrochemSoc 1998;145:93.
[14] Vogt T, Reilly JJ, Johnson JR, Adzic GD, McBreen J.Electrochem Solid-State Lett 1999;2(3):111.
[15] Tsukahara M, Takahashi K, Mishima T, Isomura A, Sakai T.J Alloys Compounds 1997;253–4:583.
[16] Yu JS, Liu BH, Cho K, Lee JY. J Alloys Compounds1998;278:283.
[17] Notten PHL, Hokkeling P. J Electrochem Soc 1991;138:1877.
[18] Kuriyama N, Sakai T, Miyamura H, Uehara I, Ishikawa H,Iwasaki T. J Alloys Compounds 1993;202:183.
[19] Boukamp BA. Solid State Ion 1986;20:31.