Embed Size (px)
Citation preview
Electrochemical Properties of Some Oxisols and Alfisols of the Tropics
BERNARDO VAN RAIJ AND MICHAEL PEECH2
ABSTRACT
A study of the distribution of the electric charges in the Apand B2 horizons of two highly weathered Oxisols and one Alfi-sol from Brazil was made by means of potentiometric titrationand by direct measurement of adsorption of ions in the pres-ence of varying concentration of electrolyte. The titration curvesat different ionic strengths crossed at the common point ofintersection, the zero point of charge (ZPC), or the pH atwhich the net electric charge is zero. Thus, the electrochemicalbehavior of these soils was found to be similar to that exhibitedby many metallic oxides in which the surface potential of areversible double layer is determined solely by the activity ofpotential determining H+ and OH~ ions in the bulk solution.Direct determination of the adsorption of ions from NaCl,CaCl2, and MgSO4 solutions showed that pH, electrolyte con-centration, and valence of the counter ion influence the mag-nitude of the electric charges on the soil particles. From knownsurface areas and ZFC of these soils, the values for the netelectric charge calculated by the application of the Stern modelof the double layer theory were found to be in good agreementwith the experimental results.
Additional Index Words: electric charges, Gouy-Chapmantheory, potential determining ions, reversible double layer,Stern layer, zero point of charge.
H IGHLY WEATHERED SOILS of the humid tropics ex-hibit peculiar electrochemical properties which differ
markedly from those shown by soils of the temperateregions. Some of the differences are attributed to the exis-tence of positive electric charges and to the extreme easewith which cations are hydrolyzed in tropical soils. Further-more, positive and negative charges of tropical soils aremainly pH dependent while the negative charges of thesoils of temperate regions are mostly permanent. On thebasis of their electrochemical behavior, soils may be con-veniently classified in accordance with two well knowntypes of colloids; (i) those with completely polarizableinterface or constant surface charge, and (ii) those withreversible interface or constant surface potential (13, 20).In general, soils of the temperate regions are characterizedby surfaces bearing a constant surface charge, whereassoils of the humid tropics are characterized by surfaceshaving a constant surface potential which is solely deter-mined by the potential determining ions, H+ and OH~. Soil-water and clay-water systems have been usually treatedas interfaces having a constant surface charge (8, 20).
An attempt has been made in the present study to deter-mine the distribution of electric charges in the Ap and B2horizons of two highly weathered Oxisols and one Alfisol
1 Contribution from the Department of Agronomy, CornellUniv., Ithaca, N.Y. 14850. Agronomy Paper no. 944. Presentedbefore Div. S-2, Soil Sci. Soc. Amer. Meeting at New York,Aug. 19, 1971. Received July 6, 1971. Approved March 9,1972.
2 Graduate Student and Professor of Soil Science, CornellUniversity, respectively. Present address of the senior author isInstitute Agronomico, Campinas, SP, Brazil.
and to explain the experimental results by the applicationof the double layer theory for reversible interfaces.
THEORY
It is known that in many instances a double layer of chargesarises when solids are put in contact with electrolyte solutions.The double layer has its origin in an excess charge on the sur-face which must be balanced by oppositely charged counterions in the solution. In systems with a reversible double layer,the surface charge is determined by the adsorption of potentialdetermining ions by the solid surface (13, 16, 20). The poten-tial determining ions are H+ and OH~ in the case of metallicoxides,- including iron and aluminum oxides and probably othersoil materials.
If the adsorption of H+ and OH~ is the only source of sur-face charge, then
where a is the surface charge, e is the charge of the electron,and TH+ and rOH~ represent the adsorption densities of poten-tial determining ions H+ and OH~.
For gibbsite, as an example, in which Al(III) is in octahedralcoordination, formation of charge on the surface may be rep-resented schematically by
A12OH2 -H++A12OH + OH [2]
where the underscored symbols refer to species forming part ofthe solid surface.
Acid dissociation, producing negative surface sites, is equiva-lent to adsorption of OH~, whereas basic dissociation, givingrise to positive surface sites, is equivalent to adsorption of H+.If the ionogenic group is located on a crystal edge rather thanon the surface of the mineral, the following represents morecorrectly the formation of electric charges on the exposed octa-hedral aluminum groups,
A1OH05- + H + :AlOH2°-5 + . [3]
It is customary to refer to the activities of the potential deter-mining ions in calculating the surface potential of reversibleinterfaces. That means that the pH of the solution should beconsidered if H+ and OH~ are the potential determining ions.The pH at which the net surface charge reduces to zero is acharacteristic value for a reversible interface and is called thezero point of charge, henceforth represented by ZPC. The ZPCmay be visualized as the state in which only the unchargedintermediate species of. reaction [2] exist. However, equalamounts of both charged species of reaction [3] would neces-sarily have to be present at the ZPC. If the surface charge isassumed to originate only from the adsorption of H+ and OH~,the surface electric potential due to charges is determined bythe pH of the equilibrium solution and is given by a Nernsttype relation,
(RT/F) In [(H+)/(H+)zpc]
59 (ZPC — pH) mV at 25C [4]
Thus, it should be possible to calculate the double layer poten-tial at any pH value if the ZPC is known.
The net surface charge can be related to the potential at thesurface by a direct relationship given by the Gouy-Chapman
587
588 SOIL SCI. SOC. AMER. PROC., VOL. 36, 1972
theory of the double layer'for a symmetric electrolyte (1, 13,20,21).
Table 1—Some properties of the soils used in the present study
a = (2nekT/w)K sinh (ze^,0/2kT). [5]
In this equation n is the concentration of the equilibriumsolution in number of ions per cm3, e is the dielectric constantof the medium, z is the valence of the counter ion, and theother symbols have their usual meaning.
At this point, it should be instructive to contrast the twotypes of colloids mentioned before. For colloids with a rever-sible interface, the surface potential at any given pH should begiven by equation [4], and should be independent of electro-lyte concentration. For this reason such interfaces are charac-terized by a constant surface potential, in contrast to thosewhich possess a constant surface charge. With the potentialremaining constant, the surface charge must, therefore, changeby varying the electrolyte concentration according to equation[S]. On the other hand, if the surface charge is to remain con-stant, the surface potential must change upon varying the con-centration of electrplyte.
In both types of colloids, the Gouy-Chapman theory of thedouble layer is not adequate to describe realistically the rela-tion between the surface charge and the surface potential athigh values for the surface potential. The difficulty lies in thetacit assumption of the Gouy-Chapman theory that ions behaveas point charges and can approach the surface without limit.The simple Gouy-Chapman theory leads to absurdly high val-ues for surface concentrations at high surface potentials (20).In the Stern theory (1, 13, 20, 21) the finite size of the ions istaken into account. The surface charge is now assumed to bebalanced by the charge in solution which is distributed betweentwo layers. The charge in the layer closer to the surface (ad-sorbed ions), called the Stern layer, is represented by a^. Thecharge in the other layer of ions (diffuse layer) is representedby <rz. Thus the total charge a in both layers is,
The charge in the Stern layer is given by
(NAp/Mn) exp[— (ze,/,6
[6]
[7]
where Nl is the number of available spots per cm2 for adsorp-tion of ions, NA is the number of Avogadro, /> is the density ofthe solvent, M is the molecular weight of the solvent, 4>s is {heelectric potential at the boundary between the Stern layer andthe diffuse layer, also called the Stern potential, and 0 is a termintroduced to account for the energy of specific adsorption ofcounter ions by the surface.
The charge in the diffuse layer is given by the Gouy-Chap-man theory, but now the reference is the Stern potential insteadof the surface potential,
sinh (ze,j,d/2kT). [8]
The surface charge is also given by the equation for a molec-ular condenser,
[9]
where e' is the average dielectric "constant" in the medium ofthe Stern layer and S is the thickness of the Stern layer.
Some of the problems inherent in the Stern theory arise fromthe fact that N1( e', and S are not known. Nevertheless, it ispossible to calculate the net surface charge by introducing rea-,sonable values for these parameters which can be adjusted byexperimental observations.
Soil sample
Acrohumox- ApAcrohumox-B3
Acrorthox-ApAcrorthox-B2Tropudalf-ApTropudalf-Bj
Depth
0-20200-230
0-20100-200
0-2037-71
gaoicC
1.90.32.50.72.31.0
pHln
B^O
4.94.95.35.96.36.7
WKC1
4.14.34.76.05.45.9
ofbases
UVKC1
ableacidity
1.9 0.70.22.60.5
11.07.0
0.0.0.0.0.
52010
Mlneraloglcalcomposition*
Gib- Kao-Fe,Os bsite Unite
46
19181617
36
3733
810
25379
113343
Sur-facearea
m'/g9865
15480
140135
' Kaolinite and gibbsite were determined in the clay fraction (<2jt) but all the results ofmineralogical analysis are expressed on the basis of the whole oven-dry soil.
MATERIALS AND METHODS
Preparation and Characterization of Soil Samples—Six soilsamples were used in this investigation, representing the Ap aridB2 horizons of two Oxisols and one Alfisol of the State of SaoPaulo, Brazil. The soils were named after the great groups inaccordance with a recent soil classification system (19), asAcrohumox, Acrorthox, and Tropudalf. The samples of theAcrohumox were collected in Campinas and the two other soilswere from Ribeirao Preto.
The samples were air dried and ground with a rubber pestleto pass through a 2-mm sieve. Some relevant properties of thesoils are presented in Table 1. The mineralogical compositionwas determined following the procedure described by Jackson(11). The amounts of kaolinite and gibbsite were determinedin the clay fraction « 2/i), after removal of free iron oxides,by differential thermal analysis, and are reported as percentageof the whole soil. The surface area was evaluated by a gravi-metric method based on the retention of ethylene glycol mono-ethyl ether by soil samples previously dried over P£O5 (10).
Samples for the determination of potentiometric titrationcurves were previously washed with very dilute HC1 and water,to remove the exchangeable bases, and will be referred to as"washed" samples. A quantity of dilute HC1 roughly equivalentto two to three times the amount of exchangeable bases wasadded to the soils. The samples were then washed with distilledwater until all the chloride was removed, as tested with AgNO3,and the specific conductance of the washings was less than 0.01mmhos/cm. The washing procedure was carried out by re-peated centrifugations. Upon washing, the Ap horizons becamedispersed and, for this reason, these samples were washed fur-ther by ultrafiltration. The washed samples were air-dried andpassed through the 0.71-mm sieve.
Adequate amounts of the original 2-mm soil samples werealso passed through a 0.71-mm sieve for the determination ofelectric charges by direct measurement of adsorption of ions.
Potentiometric Titration Curves—The potentiometric titra-tion curves were made to determine the ZPC and the distribu-tion of the net electric charge with varying pH and concentra-tion of NaCl.
Serial titration curves were made using an individual soilsample for each point. To a" 4-g sample of washed soil in a50-ml beaker, appropriate amounts of NaCl, 0.1N HC1, or0.1JV NaOH, and water, were added, and the final volume wasmade up to 20 ml. The final concentrations of NaCl were 1.0,0.1, 0.01, and 0.001N. The beakers were kept in a closed hu-midified jar to prevent evaporation and were stirred occasion-ally. After 3 days, the pH was measured by immersing thecalomel electrode in the clear supernatant liquid and immersingthe glass electrode in the sediment as recommended by Peech(17). Both electrodes were immersed in the suspension whenthe soil particles became dispersed.
The amount of H+ and OH~ adsorbed by the soil sample, atany given pH value, was taken as equal to the amount of HC1or NaOH added to the suspension minus the amount of acid orbase required to bring the same volume and the same concen-tration of NaCl solution, without the soil sample, to the samepH. The ZPC was considered to be the common intersectionpoint of the titration curves carried out in the presence of four
VAN RAIJ & PEECH: PROPERTIES OF SOME OXISOLS AND ALFISOLS OF THE TROPICS 589
-16
-12
- 8
o>-4OO
o>E-•f 4
UJ
a-
ACROHUMOX - A ACRORTHOX-AO
-12- ACROHUMOX-B2O<rt -8hUJ
H -4Ul
+ 4
+ 8
ACRORTHOX-BZ
8 3PH
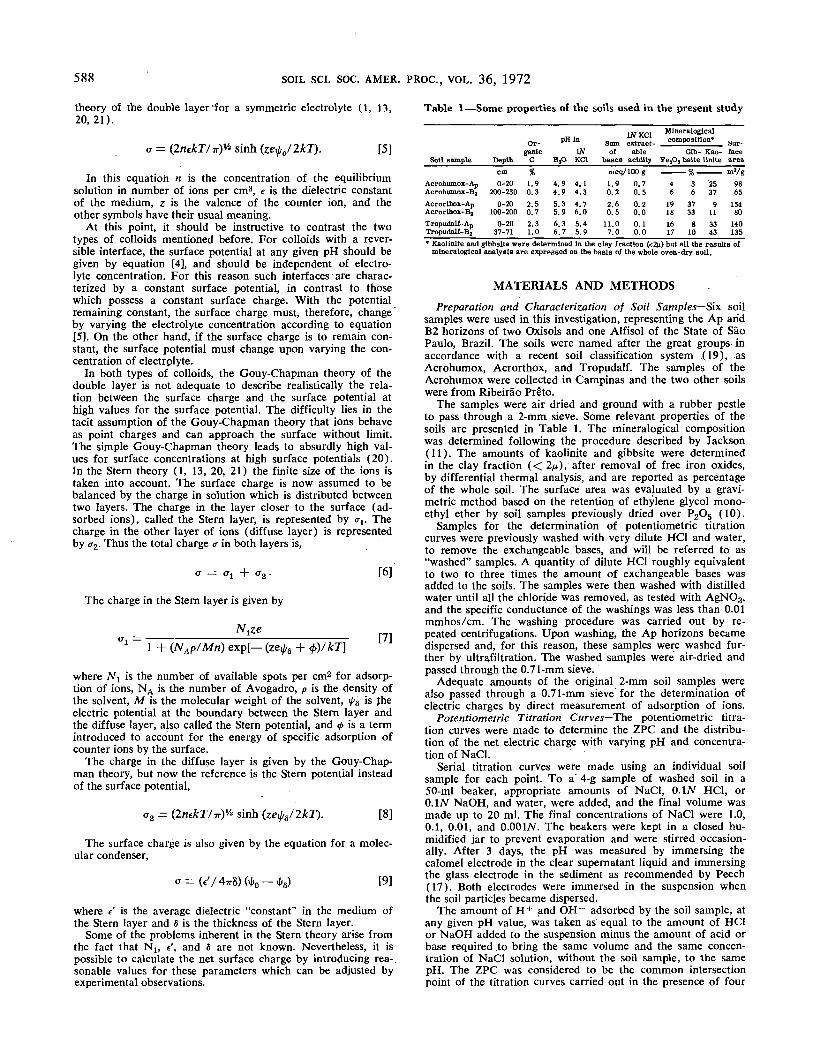
Fig. 1 — The net electric charge of soils as determined by potentiometric titration.
concentrations of NaCl. The net electric charge was calculatedfrom the amount of H+ and OH~ adsorbed with respect tothe ZPC.
Determination of Electric Charges by Adsorption of Ions—Positive and negative electric charges of the soil were also deter-mined by measuring the adsorption of both positive and negativeions from NaCl, CaCl2, or MgSO4 as a function of electrolyteconcentration and pH. The method used was essentially that de-scribed by Schofield (18).
The equivalent of 2 g of oven-dry soil was placed in a beakerand 50 ml of IN NaCl solution was added. The pH was ad-justed to the desired value by the addition of HC1 or NaOH.Next day, the pH was readjusted and the suspension was trans-ferred to a preweighed 50-ml centrifuge tube. The supernatantsolution was separated by centrifugation. When MgSO4 wasused to determine the electric charges one extra washing withIN NaCl was given to assure the removal of exchangeable cal-cium and aluminum of the soil prior to introduction of the sul-fate ion into the system. Next, the sample was washed threetimes with 40 ml of the Q.2N salt solution selected for satura-tion, followed by five more washings with 40 ml of the moredilute saturating salt solution when the final equilibrium concen-tration of the salt solution was to be 0.1, 0.01, or 0.001N. Somereadjustment of the pH was necessary with HC1 or NaOH be-fore the last two or three washings, but the exact attainment ofthe desired pH values was not attempted. After the final cen-trifugation, the centrifuge tube was drained and immediatelyweighed. The pH of the final extract was considered to be theequilibrium pH. The soil samples were then extracted five timeswith 20 ml of 0.5N NH4NO3 in the case of NaCl-saturatedsamples, and five times with 20 ml of 0.5N NaNO3 in the caseof CaCl2- or MgSO4- saturated samples. Sodium was determinedby flame photometry; calcium and magnesium were determinedby the EDTA titration; chloride was determined by potentio-metric titration with AgNO3; and sulfate was determined by aturbidimetric method (3).
The amounts of cations and anions retained were expressedas equivalent amounts of negative and positive charges, respec-tively. The results were corrected for the occluded salt solution,which was assumed to have the concentration of the equilibriumsolution, without any correction for the negative adsorption.
RESULTS AND DISCUSSION
Net Electric Charge by Potentiometric Titration
The net electric charge and the ZPC of soils as determinedby potentiometric titration are shown in Fig. 1 for the sixsoil samples. It will be noted from the pertinent data givenin Table 2 that the 'zero point of titration (the pH of thesoil in a salt solution before the addition of either acid orbase) did not coincide with ZPC and, with one exception(Acrorthox-B2), the ZPC was displaced from 0.4 to 1.8meq/100 g on the acid side from the zero point of titration.The amount of H+ adsorbed by the soil before reaching theZPC, with consequent development of equivalent amount ofpositive charge, was very nearly equal to the amount ofexchangeable A13+ and represents the permanent negativecharge present in these soils. This amount of H+ adsorbedin reaching the ZPC was subtracted from the total amountof H+ adsorbed and added to the total amount of OH~adsorbed by the soil, as determined from potentiometrictitration data, in computing the net electric charge withrespect to the ZPC, shown in Fig. 1.
Further details in determing the net electric charge frompotentiometric titration curves are given elsewhere (van
590 SOIL SCI. SOC. AMER. PROC., VOL. 36, 1972
Table 2—The salt-extractable acidity of the washed soils, theposition of the ZPC in relation to the zero point of titration,and the ZFC determined from titration curves in NaClsolutions and by direct measurement of retention of ions
from NaCl, CaClo, and MgSC>4 solutions
Soil sample
Acrohumox-ApAcrohumox-B2
Acrorthox-A_Acrorthox-B2
Tropudalf-ATropudalf-Bj
KC1- Positionextract- of ZPC
able with respectacidity of to zero point
washed soil of titration
1.80.61.10.03.22.4
0.4, acid side0. 7, acid side1.3, acid side0. 2, alkaline side1.8, acid side1.3, acid side
Zero point of charge
From titrationcurves In
.NaCl solutions
3.64.23.96.23.43.8
By measurement ofretention of Ions from
NaCl
2.14.43.56.01.92.7
CaCl2 MgSO4
-
5.8 6.3
2.2 3.6
Raij, B. 1971. Electrochemical properties of some Bra-zilian soils. Ph.D. thesis, Cornell University, Ithaca, N.Y.).
The values for the ZPC obtained from the potentiometrictitration curves, listed in Table 2, show strikingly theeffect of the higher organic matter content of the Ap hori-zon in lowering the ZPC, when compared with the ZPC ofthe corresponding B2 horizon. Since the mineralogicalcomposition of the Ap and B2 horizons was found to bevery similar within each soil profile (Table 1), the differ-ences in the electrochemical properties between the Apand B2 horizons must be attributed to differences in theorganic matter content. The high value for the ZPC of theAcrorthox-B2 sample is a consequence of the high con-tent of iron oxides and gibbsite in this soil. In general, itcan be said that the presence of iron and aluminum oxideswill tend to increase the ZPC towards the higher pH values(9, 14) while the presence of clay minerals with perma-nent or structural negative charge (15) as well as the pres-ence of organic matter will tend to shift the ZPC of thesoil to lower pH values. Thus, the ZPC reflects the over-all mineralogical composition and the organic matter con-tent of the soil. If minerals with a permanent negativecharge predominate in the soil, as is commonly the casein soils of temperate regions, the ZPC may be very lowor may not exist at all. The common point of intersectionof potentiometric titration curves of a soil obtained inthe presence of varying salt concentration, or the pH of asoil suspension which is not affected by the addition ofsalt, was called the "point of exchange neutrality" byMattson and his co-workers (12) who interpreted thisunique point as the pH of the soil at which the exchangeacidity due to displacement of H+ was just balanced bythe displacement of OH~ by the added salt.
It may be well to comment, at this point, on the influ-ence of the ZPC on the difference between the pH deter-mined in water and that determined in 17V KC1. As canbe seen from Table 1, if the pH of a given soil in IN KC1is higher than that in water, as found for the B2 horizonof the Acrorthox, the pH of the soil lies on the positiveside of the ZPC, and the soil has a net positive charge. Onthe other hand, if the pH of a soil in IN KC1 is lower thanthat in water, as found for the remaining five samples, thepH of the soil lies on the negative side of the ZPC, and thesoil carries a net negative charge. Furthermore, a large dif-ference between the pH determined in water and in IN KC1indicates that the pH of the soil is several units away fromthe ZPC. This is also indicated in Fig. 1 which shows that,for a given charge of any soil as measured by the amount
of H+ or OH adsorbed, the difference between the pHvalue measured in O.OOIN and IN NaCl will be greaterthe farther away from the ZPC one chooses to make thiscomparison.
The distribution of net electric charge for the six soilsamples, shown in Fig. 1, indicates that the magnitude ofthe charge is influenced by the pH as well as by the con-centration of NaCl. The curves are very similar to the onesgiven for several metallic oxides (6, 16), indicating thatprobably even for organic matter H+ and OH~ are thepotential determining ions.
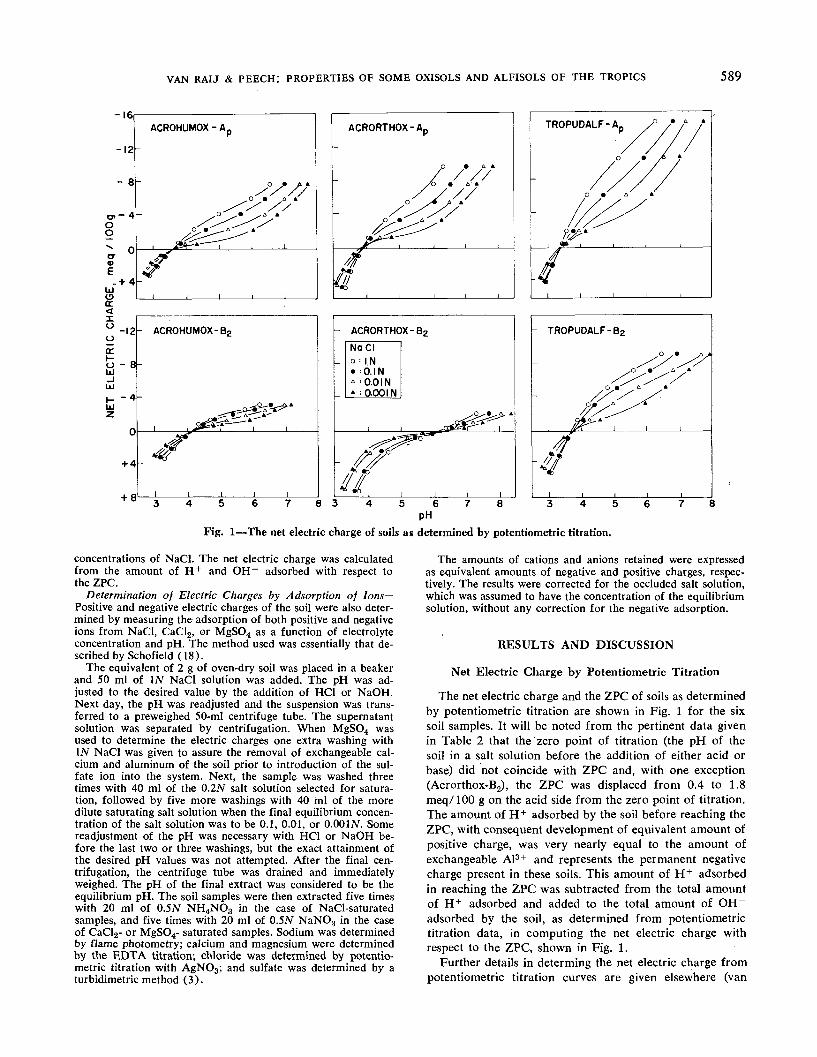
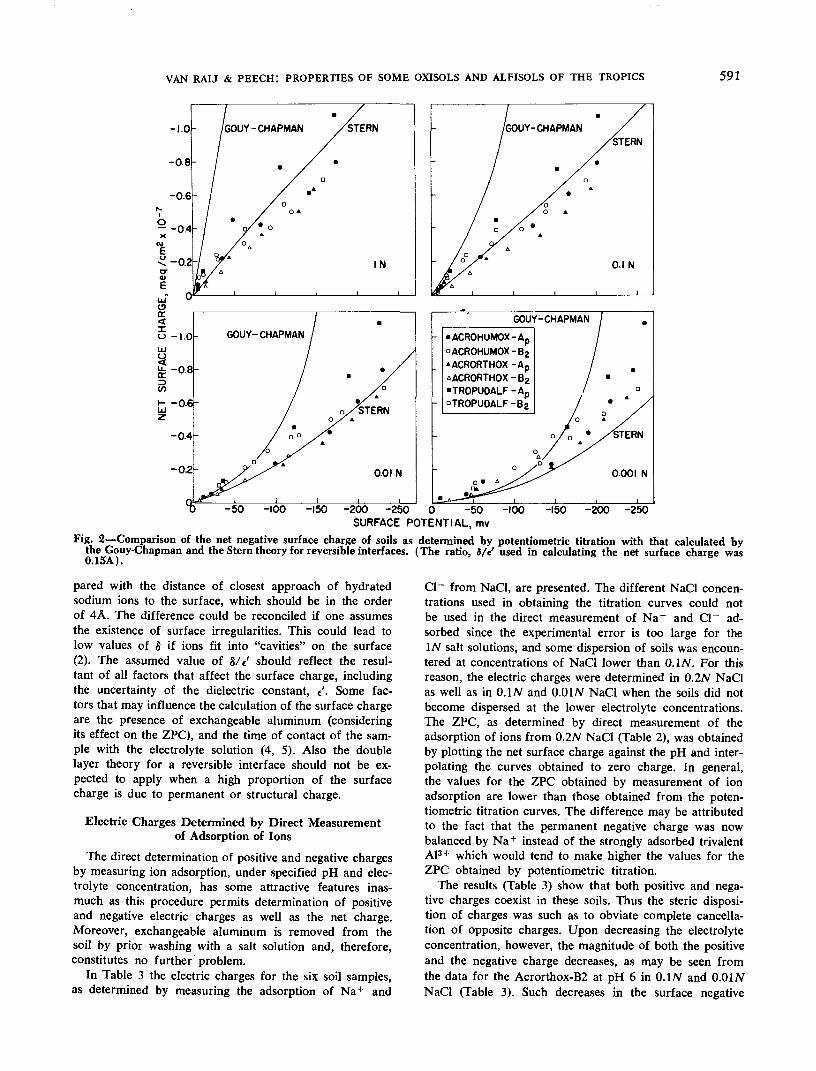
It should be possible to predict the variation of electriccharge of the soils with pH and electrolyte concentrationby the application of the double layer theory for reversibleinterfaces. Accordingly, the net negative surface chargedensity was calculated as a function of the surface potentialfor the six soil samples, and the results are plotted in Fig.2. The surface potential used in making the plots shown inFig. 2 was calculated by equation [4]. The experimentalpoints for the net surface charge shown in this figure arethe same as those given in Fig. 1, except that now the sur-face charge is given in meq/cm2. The surface chargeused in constructing the curve labeled "Gouy-Chapman"was calculated directly by equation [5], after introducingthe value of tf/0 given by equation [4]. Calculation of thesurface charge represented by curves labeled "Stern" issomewhat more complicated and involved the use of equa-tions [6], [7], [8], and [9]. The value taken for Nt was1015 cm"2 (20). The value of 8/V was adjusted so asto give the best fit of the curves to the experimental re-sults. The value of 0.15A for this ratio was found to givethe best fit of the curves to the experimental data for allsoil samples at the four concentrations of NaCl. Specificadsorption of ions was assumed to be negligible, thus</> = 0. These substitutions finally yielded four equationswith four unknowns. The solution adopted was numerical,similar to the one used by Blok and de Bruyn (6). Forselected values of the Stern potential, ^6, the charge in theStern layer, o^, the charge in the diffuse layer, <r2, andthe total charge, a, as well as the surface potential, i]/0,were calculated in the order given. Plots of a against ij/0were then prepared as shown in Fig. 2. It is obvious thatthe experimental values for the net surface charge arelower than those predicted by the Gouy-Chapman theory,although the agreement improves with decreasing electro-lyte concentration and with decreasing surface potential(Fig. 2). On the other hand, the agreement between theexperimental values for the net surface charge and thosepredicted by the Stern model of the double layer theoryis much better, except for the O.OOIN NaCl solution. Thepoorer agreement for O.OOIN NaCl is not surprising sincethe determination of charge by potentiometric titrationtacitly assumes the absence of H+ as counter ions in thedouble layer, a condition not likely to be met at this verylow electrolyte concentration.
If the dielectric "constant" of the Stern layer (e') isassumed to be equal to 6 (7), the thickness of the Sternlayer (8) should be 0.9A, since 8/t' was taken as 0.15A.In this paper no attempt will be made to attach any physi-cal significance to 8 and «', because the value of 0.9Afor the thickness of the Stern layer is quite low as com-
VAN RAIJ & PEECH: PROPERTIES OF SOME OXISOLS AND ALFISOLS OF THE TROPICS 591
LU
-0.2-
°0 -50 -100 -150 -200 -250 0 -50 -100 -150 -200 -250SURFACE POTENTIAL, mv
Fig. 2—Comparison of the net negative surface charge of soils as determined by potentiometric titration with that calculated hythe Couy-Chapman and the Stern theory for reversible interfaces. (The ratio, S/e' used in calculating the net surface charge was0.15A) •
pared with the distance of closest approach of hydratedsodium ions to the surface, which should be in the orderof 4A. The difference could be reconciled if one assumesthe existence of surface irregularities. This could lead tolow values of 8 if ions fit into "cavities" on the surface(2). The assumed value of 8/e' should reflect the resul-tant of all factors that affect the surface charge, includingthe uncertainty of the dielectric constant, £'. Some fac-tors that may influence the calculation of the surface chargeare the presence of exchangeable aluminum (consideringits effect on the ZPC), and the time of contact of the sam-ple with the electrolyte solution (4, 5). Also the doublelayer theory for a reversible interface should not be ex-pected to apply when a high proportion of the surfacecharge is due to permanent or structural charge.
Electric Charges Determined by Direct Measurementof Adsorption of Ions
The direct determination of positive and negative chargesby measuring ion adsorption, under specified pH and elec-trolyte concentration, has some attractive features inas-much as this procedure permits determination of positiveand negative electric charges as well as the net charge.Moreover, exchangeable aluminum is removed from thesoil by prior washing with a salt solution and, therefore,constitutes no further problem.
In Table 3 the electric charges for the six soil samples,as determined by measuring the adsorption of Na+ and
Cl~ from Nad, are presented. The different NaCl concen-trations used in obtaining the titration curves could notbe used in the direct measurement of Na+ and Cl~ ad-sorbed since the experimental error is too large for theIN salt solutions, and some dispersion of soils was encoun-tered at concentrations of NaCl lower than O.IN. For thisreason, the electric charges were determined in 0.2AT NaClas well as in O.IN and O.OlAf NaCl when the soils did notbecome dispersed at the lower electrolyte concentrations.The ZPC, as determined by direct measurement of theadsorption of ions from 0.2N NaCl (Table 2), was obtainedby plotting the net surface charge against the pH and inter-polating the curves obtained to zero charge. In general,the values for the ZPC obtained by measurement of ionadsorption are lower than those obtained from the poten-tiometric titration curves. The difference may be attributedto the fact that the permanent negative charge was nowbalanced by Na+ instead of the strongly adsorbed trivalentA13+ which would tend to make higher the values for theZPC obtained by potentiometric titration.
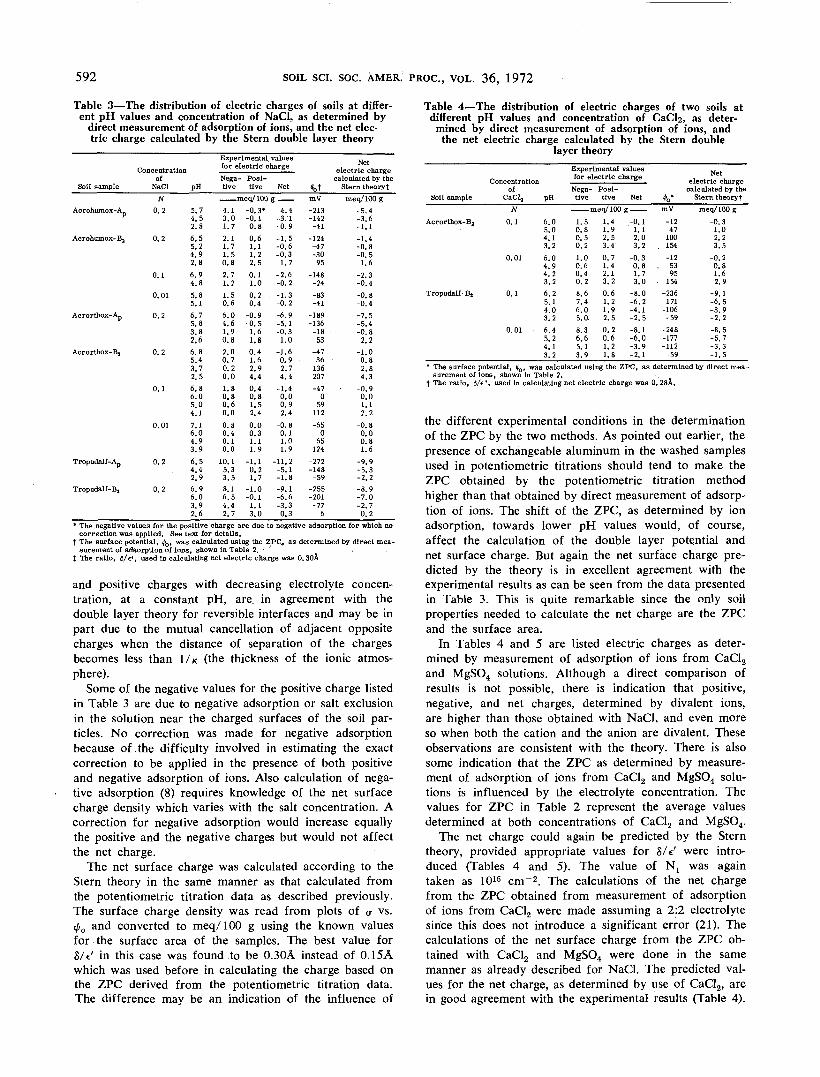
The results (Table 3) show that both positive and nega-tive charges coexist in these soils. Thus the steric disposi-tion of charges was such as to obviate complete cancella-tion of opposite charges. Upon decreasing the electrolyteconcentration, however, the magnitude of both the positiveand the negative charge decreases, as may be seen fromthe data for the Acrorthox-B2 at pH 6 in 0.1 N and 0.0 INNaCl (Table 3). Such decreases in the surface negative
592 SOIL SCI. SOC. AMER. PROC., VOL. 36, 1972
Table 3—The distribution of electric charges of soils at differ-ent pH values and concentration of NaCl, as determined by
direct measurement of adsorption of ions, and the net elec-tric charge calculated by the Stern double layer theory
Concentrationof
Soil sample NaCl pH
Acrohumox-A"
Acrohumox-B2
Acrorthox-Ap
Acrorthox-B2
Tropudalf-A
Tropudalf-B2
N0.2 5. 7
4.52.8
0.2 6.55.24.92.8
0.1 6.94.8
0.01 5.85.1
0.2 6.75.83.82.6
0.2 6.85.43.72.5
0.1 6.86.05.04.1
0. 01 7. 16.04.93.9
0.2 6.54.42.9
0.2 6.96.03.92.6
Experimental valuesfor electric chargeNega- Posi-tive tive Net
——— meq/100 g ——4.13.01.72.11.71.50.82.71.21.50.66.04.61.90.82.00.70.20.01.80.80.60.00.80.40.10.0
10.15.33.58.16.54.42.7
-0.3*-0.10.80.61.11.22.50.11.00.20.4
-0.9-0.51.61.80.41.62.94.40.40.81.52.40.00.31.11.9
-1.10.21.7
-1.0-0.11.13.0
-4.4-3.1-0.9-1.5-0.6-0.31.7
-2.6-0.2
. -1.3-0.2-6.9-5.1-0.31.0
-1.60.92.74.4
-1.40.00.92.4
-0.80.11.01.9
-11.2-5.1-1.8-9.1-6.6-3.30.3
Netelectric charge
calculated by the$0t Stern theorytmV-213-142-41
-124-47-30
95-148-24-83-41
-189-136-18
53-4736
136207-47
059
112-65
065
124-272-148-59
-255-201-77
6
meq/100 g-5.4-3.6-1.1-1.4-0.8-0.51.6
-2.3-0.4-0.8-0.4-7.5-5.4-0.82.2
-1.00.82.84.3
-0.90.01.12.2
-0.80.00.81.6
-9.9-5.3-2.2-8.9-7.0-2.70.2
Table 4—The distribution of electric charges of two soils atdifferent pH values and concentration of CaCk, as deter-
mined by direct measurement of adsorption of ions, andthe net electric charge calculated by the Stern double
layer theory
* The negative values for the positive charge are due to negative adsorption for which nocorrection was applied. See text for details.
t The surface potential, ^b, was calculated using the ZPCj as determined by direct mea-surement of adsorption of ions, shown in Table 2.
t The ratio, <5/e', used In calculating net electric charge was 0.30A
and positive charges with decreasing electrolyte concen-tration, at a constant pH, are in agreement with thedouble layer theory for reversible interfaces and may be inpart due to the mutual cancellation of adjacent oppositecharges when the distance of separation of the chargesbecomes less than I/K (the thickness of the ionic atmos-phere).
Some of the negative values for the positive charge listedin Table 3 are due to negative adsorption or salt exclusionin the solution near the charged .surfaces of the soil par-ticles. No correction was made for negative adsorptionbecause of .the difficulty involved in estimating the exactcorrection to be applied in the presence of both positiveand negative adsorption of ions. Also calculation of nega-tive adsorption (8) requires knowledge of the net surfacecharge density which varies with the salt concentration. Acorrection for negative adsorption would increase equallythe positive and the negative charges but would not affectthe net charge.
The net surface charge was calculated according to theStern theory in the same manner as that calculated fromthe potentiometric titration data as described previously.The surface charge density was read from plots of <? vs.tji0 and converted to meq/100 g using the known valuesfor the surface area of the samples. The best value forS/V in this case was found to be 0.30A instead of 0.15Awhich was used before in calculating the charge based onthe ZPC derived from the potentiometric titration data.The difference may be an indication of the influence of
Concentrationof
Soil sample CaCl2 pH
Acrorthox-B2
Tropudalf-Ba
N0.1 6.0
5.04.13.2
0.01 6.04.94.23.2
0.1 6.25.14.03.2
0.01 - 6.45.24.13.2
Experimental valuesfor electric charge
Nega-tive
Posi-tive Net
——— meq/100 g ———1.50.80.50.21.00.60.40.28.67.46.05.0.8.36.65.13.9
1.41.92.53.40.71.42.13.20.61.21.92.50.20.61.21.8
-0.11.12.03.2
-0.30.81.73.0
-8.0-6.2-4.1-2.5-8.1-6.0-3.9-2.1
Netelectric charge
calculated by the0O* Stern theory!
-mV-1247
100. 154
-12.. 53
95- 154
-236-171-106-59
-248-177-112
-59
meq/100 g-0.31.02.23.5
-0.20.81.62.9
-9.1-6.5-3.9-2.2-8.5-5.7-3.3-1.5
* The surface potential, ^o, was calculated using the ZPC, as determined by direct mea-surement of ions, shown in Table 2.
t The ratio, 6/€\ used in calculating net electric charge was 0. 28A.
the different experimental conditions in the determinationof the ZPC by the two methods. As pointed out earlier, thepresence of exchangeable aluminum in the washed samplesused in potentiometric titrations should tend to make theZPC obtained by the potentiometric titration methodhigher than that obtained by direct measurement of adsorp-tion of ions. The shift of the ZPC, as determined by ionadsorption, towards lower pH values would, of course,affect the calculation of the double layer potential andnet surface charge. But again the net surface charge pre-dicted by the theory is in excellent agreement with theexperimental results as can be seen from the data presentedin Table 3. This is quite remarkable since the only soilproperties needed to calculate the net charge are the ZPCand the surface area.
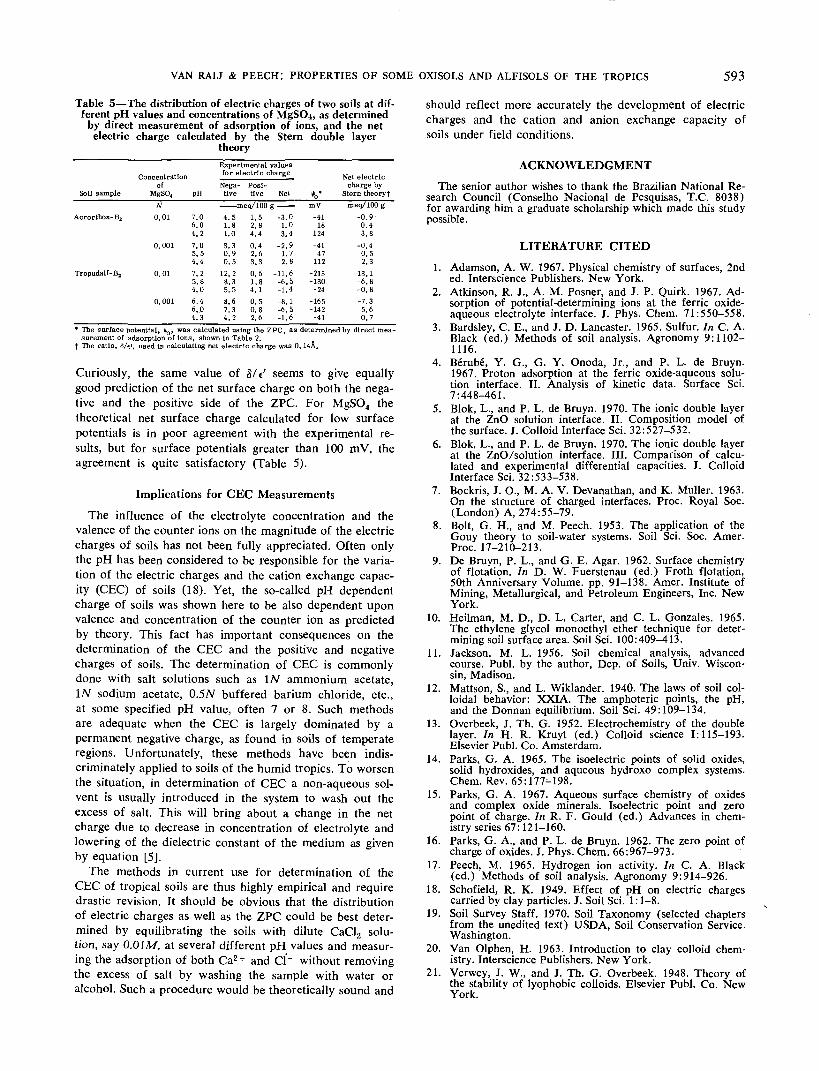
In Tables 4 and 5 are listed electric charges as deter-mined by measurement of adsorption of ions from CaCl2and MgSO4 solutions. Although a direct comparison ofresults is not possible, there is indication that positive,negative, and net charges, determined by divalent ions,are higher than those obtained with NaCl, and even moreso when both the cation and the anion are divalent. Theseobservations are consistent with the theory. There is alsosome indication that the ZPC as determined by measure-ment of adsorption of ions from CaCl2 and MgSO4 solu-tions is influenced by the electrolyte concentration. Thevalues for ZPC in Table 2 represent the average valuesdetermined at both concentrations of CaCl2 and MgSO4.
The net charge could again be predicted by the Sterntheory, provided appropriate values for 8/V were intro-duced (Tables 4 and 5). The value of Nx was againtaken as 1015 cm~2. The calculations of the net chargefrom the ZPC obtained from measurement of adsorptionof ions from CaCl2 were made assuming a 2:2 electrolytesince this does not introduce a significant error (21). Thecalculations of the net surface charge from the ZPC ob-tained with CaCl2 and MgSO4 were done in the samemanner as already described for NaCl. The predicted val-ues for the net charge, as determined by use of CaCl2, arein good agreement with the experimental results (Table 4).
VAN RAU & PEECH: PROPERTIES OF SOME OXISOLS AND ALFISOLS OF THE TROPICS 593
Table 5—The distribution of electric charges of two soils at dif-ferent pH values and concentrations of MgSO-i, as determined
by direct measurement of adsorption of ions, and the netelectric charge calculated by the Stern double layer
theory
Concentration
Soil sample
Acrorthox-B2
Tropudalf-B2
ofMgSOj
N0.01
0.001
0.01
0.001
pH
Experimental valuesfor electric charge
Nega-tive
Posi-tive Net
——— meg/100 g ———7.06.04.27.05.54.47.25.84.06.46..04.3
4.51.81.03.30.90.5
12.28.35.58.67.34.2
1.52.84.40.42.63.3
-3.01.03.4
-2.91.72.8
0.6 -11.61.84.10.50.82.6
-6.5-1.4-8.1-6.5-1.6
»o'mV-41
18124-4147
112-213-130-24
-165-142-41
Net electriccharge by
Stern theoryfmeq/100 g
-0.90.43.8
-0.40.52.3
-13.1-6.8-0.8-7.3-5.6-0.7
* The surface potential, i/>0, was calculated using the ZPC, as determined by direct measurement of adsorption of ions, shown in Table 2.
f The ratio, <5/e', used in calculating net electric charge was 0,14A.
Curiously, the same value of 8/V seems to give equallygood prediction of the net surface charge on both the nega-tive and the positive side of the ZPC. For MgSO4 thetheoretical net surface charge calculated for low surfacepotentials is in poor agreement with the experimental re-sults, but for surface potentials greater than 100 mV, theagreement is quite satisfactory (Table 5).
Implications for CEC Measurements
The influence of the electrolyte concentration and thevalence of the counter ions on the magnitude of the electriccharges of soils has not been fully appreciated. Often onlythe pH has been considered to be responsible for the varia-tion of the electric charges and the cation exchange capac-ity (CEC) of soils (18). Yet, the so-called pH dependentcharge of soils was shown here to be also dependent uponvalence and concentration of the counter ion as predictedby theory. This fact has important consequences on thedetermination of the CEC and the positive and negativecharges of soils. The determination of CEC is commonlydone with salt solutions such as IN ammonium acetate,\N sodium acetate, 0.5N buffered barium chloride, etc.,at some specified pH value, often 7 or 8. Such methodsare adequate when the CEC is largely dominated by apermanent negative charge, as found in soils of temperateregions. Unfortunately, these methods have been indis-criminately applied to soils of the humid tropics. To worsenthe situation, in determination of CEC a non-aqueous sol-vent is usually introduced in the system to wash out theexcess of salt. This will bring about a change in the netcharge due to decrease in concentration of electrolyte andlowering of the dielectric constant of the medium as givenby equation [5].
The methods in current use for determination of theCEC of tropical soils are thus highly empirical and requiredrastic revision. It should be obvious that the distributionof electric charges as well as the ZPC could be best deter-mined by equilibrating the soils with dilute CaCl2 solu-tion, say O.OIM, at several different pH values and measur-ing the adsorption of both Ca2 + and Cl ~ without removingthe excess of salt by washing the sample with water oralcohol. Such a procedure would be theoretically sound and
should reflect more accurately the development of electriccharges and the cation and anion exchange capacity ofsoils under field conditions.
ACKNOWLEDGMENTThe senior author wishes to thank the Brazilian National Re-
search Council (Conselho Nacional de Pesquisas, T.C. 8038)for awarding him a graduate scholarship which made this studypossible.

![Efficiency of the Electrochemical methods for the repair of ... ouarti-2018.pdf• Electrochemical chloride extraction [14-17] • Electrochemical realkalisation. [18.19] Electrochemical](https://img.pdfslide.us/doc/110x75/610237547e288528f40cbc06/efficiency-of-the-electrochemical-methods-for-the-repair-of-ouarti-2018pdf.jpg)


![Conventiona~ cropping Systems for Alfisols and S - [email protected]](https://img.pdfslide.us/doc/110x75/623522cac8d9bb728c615034/conventiona-cropping-systems-for-alfisols-and-s-emailprotected.jpg)