Embed Size (px)
Citation preview

Electrochemical Formation
of Hydrogel Films for Bioanalytics
Doctoral Thesis
(Dissertation)
to be awarded the degree of
Doctor rerum naturalium (Dr. rer. nat.)
submitted by
Johanna Bünsow
from Kassel
approved by the Faculty of Natural and Materials Sciences,
Clausthal University of Technology
Date of oral examination
October 31, 2008

Chairperson of the Board of Examiners: Prof. Dr. Dieter Kaufmann
Chief Reviewer: Prof. Dr. Diethelm Johannsmann
Reviewer: Prof. Dr. Wilhelm Oppermann
This thesis was written at the Institute of Physical Chemistry at Clausthal University of Technology, Clausthal-Zellerfeld, Germany, in the period from November 2005 to October 2008. Parts of this work have been published previously. The following publications have been finalized:
• “Patterned Hydrogel Layers Produced by Electrochemically Triggered Polymerization” Bünsow, J., Johannsmann, D. Macromolecular Rapid Communications, submitted.
• “Electrodeposition of Amino-Functionalized Particles in a pH Gradient: Quantitative Investigations Employing an Electrochemical Quartz Crystal Microbalance” Bünsow, J., Grabs, I.-M., Schmidt-Naake, G., Johannsmann, D. Macromolecular Symposia, accepted.
• “Preparation of Hydrogel-Silica Composite Films by Electrochemically Triggered Deposition” Bünsow, J., Petri, J., Johannsmann, D. Macromolecular Symposia, accepted.
• “Influence of Added Salt on the Thickness and Morphology of Electrochemically Produced Responsive Hydrogel Films” Bünsow, J., Johannsmann, D. Journal of Colloid and Interface Science 2008, 326, 61–65.
• “Production of Polyacrylic Acid Homo- and Copolymer Films by Electrochemically Induced Free-Radical Polymerization: Preparation and Swelling Behavior“ Bünsow, J., Johannsmann, D. Macromolecular Symposia 2007, 248, 207–212.
• “Formation of Surface-Attached Responsive Gel Layers via Electrochemically Induced Free-Radical Polymerization” Reuber, J., Reinhardt, H., Johannsmann, D. Langmuir 2006, 22, 3362–3367.
• “Simultaneous Determination of Density and Viscosity of Liquids Based on Quartz-Crystal Resonators Covered with Nanoporous Alumina” Goubaidoulline, I., Reuber, J., Merz, F., Johannsmann, D. Journal of Applied Physics 2005, 98, 014305.


Meinen Eltern


Acknowledgements
My thank goes to all the people who contributed to this work. I am particularly thankful to Prof. Dr. Diethelm Johannsmann for giving me the opportunity to work on this exciting project, for numerous interesting and helpful discussions, and for the support on all stages and in all aspects of my PhD thesis. I want to thank Prof. Dr. Wilhelm Oppermann for reviewing my thesis and many stimulating discussions. Special thanks go to PD Dr. Philipp Vana for fruitful discussions concerning the combination of RAFT polymerization with EIP and for providing the RAFT agent used in this work. For the synthetic work, I want to thank Johannes Kaschel and Kai Kalz from the University of Göttingen. Without the participation in the European Graduate School on Microstructural Control in Free-Radical Polymerization (EGS), this collaboration would not have developed. Thus, I want to thank the EGS for help in “networking” and for giving me the opportunity to meet many people with whom I had numerous interesting discussions. Another special thank goes to the group of Prof. Dr. Wolfgang Schuhmann at the Ruhr University Bochum – particularly to Sebastian Neugebauer – for training me in amperometric biosensing and electrochemical methods in general. Their introduction helped a lot and enabled me to carry out the part of my work concerned with amperometric glucose detection. I am also very thankful to all people who contributed to this work (in no particular order):
• Judith Petri always supported me with her work, especially in the field of hybrid coatings and pOEGMA homopolymer films.
• Dr. Arne Langhoff helped me countless times with discussions, technical help, and measurements with the confocal microscope.
• Dr. Ilya Reviakine introduced me to AFM imaging and helped me with many stimulating discussions. In particular, his knowledge on biological systems was very helpful.
• Mathis Düwel helped me a lot with his knowledge on electrochemistry.
• Markus Topp imaged spots with an optical microscope in the Institute of Polymer Materials and Plastics Engineering, Clausthal University of Technology.
• Uwe Cronjäger built quartz holders, the temperature controlled liquid cell, and many more very helpful technical components.
• Roland Zain constructed the glass cell used for temperature controlled sensor tests.
• Anne Finger acquired images of hydrogel spots with the confocal microscope.
• Robert Scherf investigated alternative electrochemical patterning techniques.

• Björn Kussmaul and Ralf Elze carried out preliminary studies on the effect of salts on EIP of pNIPAm.
• Maria Krusche and Matthias Alhelm worked on the first steps towards a locally induced pattern formation.
• Christian Kaldun, Maik Sievers, Katja Pohl, and Anne Enzenberg were involved in experiments on the deposition of pOEGMA films and their application in biosensing.
• Special thanks are addressed to Julia Gansel, Markus Susoff, Dr. Sebastian Seiffert, and Dr. Arne Langhoff for the correction of this work and many helpful discussions.
Of course I am also deeply grateful to all other people in the institute for numerous discussions, for practical help whenever it was needed, and for the perfect working atmosphere. My group as well as PD Dr. Jörg Adams and Dr. Andrey Turshatov always gave me great input, especially in the group meetings. Many thanks are dedicated to Kerstin and Sergiy for a funny time in our office. Michael and Astrid never hesitated to support me when practical help, material, or reactants were needed. Julia, Markus, Sebastian, Conny, and Arne always allowed me to join them for lunch where we had countless discussions on science and beyond. Ralf is acknowledged for his support with all electrical issues and all the unbelievable situations in the coffee room. The financial support to this work was provided by the German Research Foundation (Deutsche Forschungsgemeinschaft, DFG) which is gratefully acknowledged. In addition, I want to thank all the people from the priority program “Smart hydrogels” for pleasant meetings and many stimulating discussions. On the private side, I want to thank sincerely my husband Christian, my parents, and Maximilian and Kamila for the support over all the years. I am also very thankful to my family-in-law. Last but not least I thank all my friends, especially Tina, Julia, and Friederike for being at my side.

Abstract
Thermoresponsive homo- and copolymer hydrogel films of N-isopropylacrylamide (NIPAm) and oligo(ethylene glycol) methacrylate (OEGMA) were prepared by electrochemically induced polymerization. The deposition was investigated with an electrochemical quartz crystal microbalance (EQCM). The film thickness ranged from 5 to 100 nm. Factors of influence on the film thickness of pNIPAm were the preparation temperature, the solution pH, and additives such as cross-linker, salt, and chain transfer agents. The chain transfer agents used were sodium formate and a reversible addition–fragmentation chain transfer (RAFT) agent. The pNIPAm films showed a lower critical solution temperature (LCST) of 30 °C in water. Added salt and copolymerization with the hydrophilic OEGMA shifted the LCST. In acidic solutions, the surface roughness increased with the film thickness. Models for the structure formation were proposed that take into account microgel formation and hydrogen evolution underneath thick collapsed hydrogel films. Shifting the solution pH to higher values hindered the polymerization. When chain transfer agents were added to the basic reactant solution, both the film thickness and the lateral homogeneity increased. Both chain transfer agents enhanced the rate of initiator decomposition. Sodium formate additionally acted as an electrochemical initiator itself. PNIPAm films produced in the presence of RAFT agent contained active RAFT groups and could be electrochemically modified with polystyrene in a second polymerization step.
Laterally heterogeneous films were produced by a new patterning technique where oxygen bubbles induced the local deposition of the hydrogel. The hydrogel patterns reproduced the size and the shape of the bubbles. The observed feature sizes were of a few tens of microns. Structure formation could be actively controlled by electrochemical production of an oxygen bubble in a small gap between the substrate and an insulated counter electrode. The enzyme glucose oxidase could be encapsulated into a hydrogel spot. The mechanism of structure formation was discussed.
Encapsulation of glucose oxidase into homo- and copolymer films of NIPAm and OEGMA was possible by electrochemically induced polymerization. The films showed Michaelis–Menten kinetics in amperometric glucose detection. The sensor response depended on the copolymer composition and the operation temperature. Swelling of the films in the buffer resulted in a significant increase of the sensitivity.


Zusammenfassung
Thermosensitive Hydrogelfilme aus Homo- und Copolymeren von N-Isopropyl-acrylamid (NIPAm) und Oligo(ethylenglykol)methacrylat (OEGMA) wurden mittels elektrochemisch induzierter Polymerisation hergestellt. Die Abscheidung wurde mit einer elektrochemischen Quarzmikrowaage (EQCM) untersucht. Die erzielten Filmdicken lagen zwischen 5 und 100 nm. Die Dicke der pNIPAm-Filme wurde beeinflusst durch die Polymerisationstemperatur, durch den pH-Wert der Reaktionslösung und durch Additive wie Vernetzer, Leitsalz und Kettenüberträger. Letztere waren Natriumformiat und ein reversibles Additions-Fragmentations-Ketten-übertragungs-Agens (RAFT-Agens). Die pNIPAm-Filme zeigten eine untere kritische Entmischungstemperatur (LCST) von 30 °C in Wasser. Zugabe von Salzen sowie Copolymerisation mit dem hydrophilen OEGMA veränderten die LCST. In saurer Lösung stieg die Oberflächenrauhigkeit mit der Schichtdicke an. Es wurde ein Modell entwickelt, welches die Mikrogelbildung und die Entwicklung von Wasserstoffblasen unter dicken, kollabierten Hydrogelfilmen beschreibt. Bei hohen pH-Werten wurde die Polymerisation drastisch gehemmt. Der Zusatz von Kettenüberträgern im Basischen erhöhte die Schichtdicke und die laterale Homogenität der Filme. Beide Kettenüberträger beschleunigten den Initiatorzerfall. Natriumformiat war in der Lage, selbst als elektroaktiver Initiator zu fungieren. Wurde die Polymerisation in Gegenwart eines RAFT-Agens geführt, so enthielt der pNIPAm-Film aktive RAFT-Gruppen und konnte in einem zweiten Schritt mit Polystyrol modifiziert werden.
Lateral heterogene Filme wurden mit Hilfe einer neuen Strukturierungsmethode erzeugt. Diese beruht darauf, dass Sauerstoffblasen eine lokale Abscheidung des Hydrogels induzierten. Dabei nahm das Hydrogel die Größe und die Form der induzierenden Blase an. Charakteristische Dimensionen lagen im Bereich von einigen zehn Mikrometern. Eine lokal kontrollierte Abscheidung wurde durch Erzeugung der Blasen unter einer isolierten Gegenelektrode realisiert. Das Enzym Glukose Oxidase konnte dabei in das Hydrogel eingeschlossen werden. Der Mechanismus der Strukturbildung wurde diskutiert.
Die Polymerisation in Gegenwart von Glukose Oxidase ermöglichte deren Einschluss in Homo- und Copolymer-Filme aus NIPAm und OEGMA. In der ampero-metrischen Bestimmung von Glukose zeigten diese Filme die Michaelis-Menten-Kinetik. Das Signal der Sensoren hing von der Zusammensetzung des Copolymer-Films und der Messtemperatur ab. Eine Quellung der Filme im Puffer führte zu einer deutlichen Erhöhung der Empfindlichkeit.


Table of Contents
1 Introduction 1
2 Background 3
2.1 Responsive Hydrogels 3
2.2 The Hofmeister Effect 6
2.3 Polymer Films at Interfaces 7 2.3.1 Grafting Techniques 7 2.3.2 Electrochemical Coating Techniques 8
2.4 Reversible Addition–Fragmentation Chain Transfer (RAFT) Polymerization 10
2.5 Patterning of Polymer Films 13
2.6 Bioanalytics 14 2.6.1 Amperometric Biosensors 14 2.6.2 Michaelis–Menten Kinetics 16
3 Methods 18
3.1 Quartz Crystal Microbalance 18 3.1.1 Piezoelectric Sensing Devices 18 3.1.2 The Quartz Crystal Microbalance 20
3.2 Electrochemical Techniques 23 3.2.1 Chronoamperometry 24 3.2.2 Cyclic Voltammetry 25
3.3 Electrochemical Quartz Crystal Microbalance 26
4 Experimental 28
4.1 Materials 28
4.2 Electrochemically Induced Polymerization (EIP) of N-Isopropylacrylamide 28
4.2.1 General Procedure 28 4.2.2 EIP in the Presence of Chain Transfer Agents 29 4.2.3 Modification of RAFT Group Containing pNIPAm Films 30 4.2.4 Copolymerization with Oligo(Ethylene Glycol) Methacrylate 30 4.2.5 Preparation of Patterned Hydrogel Films 30

4.3 Characterization of Hydrogel Films 31 4.3.1 Determination of the Lower Critical Solution Temperature 31 4.3.2 AFM Imaging 31 4.3.3 Microscopy 32 4.3.4 Protein Adsorption Test 32 4.3.5 Amperometric Glucose Detection 32
5 Results 34
5.1 Electrochemically Induced Polymerization of N-Isopropylacrylamide 34 5.1.1 Formation of Thermoresponsive Hydrogel Films 34 5.1.2 Swelling Behavior 36 5.1.3 Surface Morphology 38 5.1.4 Influence of the Cross-Linking Reaction 39 5.1.5 Influence of Supporting Electrolyte and Temperature 43
5.1.5.1 Influence of the Supporting Electrolyte 44 5.1.5.2 Influence of the Preparation Temperature 48
5.1.6 Influence of Chain Transfer Agents 51 5.1.6.1 Addition of Sodium Formate 51 5.1.6.2 Addition of a RAFT Agent 56 5.1.6.3 Modification of RAFT Group Containing Films 62
5.2 EIP in a Lithographic Mode 65
5.3 Copolymer Films of NIPAm and Oligo(Ethylene Glycol) Methacrylate 74 5.3.1 EIP of NIPAm and Oligo(Ethylene Glycol) Methacrylate 74 5.3.2 Fouling Properties 78 5.3.3 Amperometric Detection of Glucose 79
6 Conclusions 83
7 References 85
Appendix A: List of Symbols 100
Appendix B: List of Abbreviations 102

1 Introduction
1
1 Introduction
The rapidly growing field of biosensing requires the development of low-cost sensing devices which are highly selective towards the analyte of interest, flexible, easy to handle, and allow for a fast screening of complicated samples such as blood. A biosensor typically consists of a biorecognition element – often an enzyme – in contact with a transducer surface where the biorecognition event leads to a detectable (usually electric) signal.1 In the so-called third generation biosensors, the enzyme is embedded in a matrix material which protects the enzyme from mechanical stress, denaturation, and chemical attack by interfering species. Since all the enzyme is tethered to the sensor surface, the total amount of enzyme needed is low, which reduces cost. Typical matrix materials are silica monoliths2 and polymer hydrogels.3 Polymer hydrogels are excellent matrix materials for enzyme encapsulation because they emulate the conditions which enzymes encounter in their natural environment. Some hydrogels such as poly(ethylene glycol) are able to prevent unspecific adsorption of proteins, which is an attractive feature for sensors operating in biological environments.4 Attaching hydrogels to a solid support guarantees a sufficient mechanical stability of the device. The read-out can be realized by optical techniques (e.g., surface plasmon resonance),5 by acoustic techniques (e.g., quartz crystal microbalance),6 by spectroscopy (e.g., fluorescence),7 or by electrochemistry.8,9 If responsive hydrogels are used for enzyme encapsulation their volume-phase transition may serve as an amplification mechanism and thereby decrease the detection limits. Patterning responsive hydrogels further enhances the functionality of the sensing device in the sense that a number of spots with variable chemical constitution can be immobilized on the same transducer.
The aim of the present work was the preparation of responsive hydrogel films for bioanalytics. A project outline is shown in Fig. 1. Responsive hydrogels were produced on conducting surfaces by an electrochemical technique, namely electrochemically induced polymerization (Panel A). With regard to possible applications in bioanalytics, the film thickness and the surface morphology, which often are key factors of the sensor performance, were investigated as a function of the preparation conditions. Temperature, supporting electrolyte, and chain transfer agents were used to adjust the hydrogel properties. In a second step, laterally homogeneous films were characterized in view of their potential in biosensing (Panel B). For this purpose, glucose oxidase (a model enzyme) was encapsulated into the hydrogel and glucose was detected amperometrically. The sensor performance was correlated to the properties of the hydrogel matrix. Concurrently, a lithographic approach was used to produce patterned hydrogel films (Panel C). Although electrochemical lithography should be useful to deposit laterally patterned films, a new route based on bubble-

1 Introduction
2
induced pattern formation was chosen. In the future, the combination of biosensing and patterning may open up a versatile route for the production of array biosensors (Panel D). For such an array sensor, the different hydrogel pads have to be functionalized such that they selectively respond to certain analytes, allowing for a simultaneous detection of a large number of analytes on one device. The responsiveness of the hydrogel pads may serve as an amplification mechanism or as the recognition mechanism itself.
Fig. 1: Project outline. The electrochemical deposition of hydrogel films was investigated with regard to the film properties as a function of the preparation conditions (A). The sensing potential of the films was tested by encapsulation of an enzyme (B). A lithographic mode was applied to obtain patterned hydrogel films (C). Combination of patterning and sensing may in the future open up a route towards array sensors for bioanalytics (D).

2 Background Responsive Hydrogels
3
2 Background
2.1 Responsive Hydrogels
A hydrogel is a three-dimensionally cross-linked polymer network which is swollen in water. If a hydrogel is composed of monomer units that contain both hydrophilic and hydrophobic moieties, it may undergo a reversible volume-phase transition which is driven by external parameters such as temperature or pH. Prominent examples of responsive hydrogels are poly(acrylic acid) and poly(N-isopropylacrylamide) (pNIPAm), where the volume-phase transition is triggered by pH and temperature, respectively.
PNIPAm is the best-studied thermoresponsive hydrogel.10 As sketched in Fig. 2, it exhibits a lower critical solution temperature (LCST) at 32 °C. Below the LCST, the hydrogel is hydrophilic and swells in water, whereas above the LCST, it becomes hydrophobic and the water is expelled from the network. The collapse is driven by different processes. The entropy gain of the water molecules upon dehydration plays a major role. On the molecular level, the collapse of uncross-linked pNIPAm chains in a dilute solution proceeds via a two-step mechanism where the shrinking of individual chains is followed by the aggregation of these globules into larger particles.11 The swelling-deswelling behavior of pNIPAm is a consequence of a delicate equilibrium between hydration of the amide groups, on the one hand, and hydrophobic interactions between segments on the acrylic backbone on the other. The LCST can be easily shifted, for instance by copolymerization with hydrophilic12 or hydrophobic monomers13 and by additives such as salt (see Section 2.2),14 surfactant,15 or cosolvents.16
Responsive hydrogels have many applications in sensing,17 as actuators,18,19 and in the biomedical field.20,21 For example, they have been used for the stimulated delivery of drugs. For drug release applications, the hydrogel is loaded with drugs in the
Fig. 2: Temperature-driven volume-phase transition of a pNIPAm hydrogel. Red dots represent chemical cross-links.

2 Background Responsive Hydrogels
4
swollen state. Encapsulation is achieved by collapse of the hydrogel. Drug release can then be triggered by an external stimulus such as a change in pH or temperature.22,23 In tissue engineering, substrates with thermo-switchable fouling properties have been created.24 In “cell sheet engineering” introduced by Okano and co-workers, cells are grown on hydrophobic pNIPAm films at 37 °C. Detachment of an intact cell sheet can be induced by switching the temperature to below the LCST, where the hydrogel becomes hydrophilic and non fouling. Recently, a similar approach was reported by Lutz and co-workers, who used a thermoresponsive hydrogel based on oligo(ethylene glycol).25
Apart from biomedical applications, the LCST behavior has been employed to tune the properties, namely the degree of cross-linking, of pNIPAm hydrogels during the preparation stage. Sayil and Okay synthesized pNIPAm hydrogels at various temperatures.26 The swelling ratio increased with the preparation temperature, which was attributed to a decrease of the effective cross-linking density. A similar effect was observed by Lee and Yen who additionally reported on an influence of organic cosolvents on the swelling properties.27 Nie et al. investigated the effect of preparation temperature and cross-linker concentration on spatial inhomogeneities of pNIPAm hydrogels.28 The amplitude of the density fluctuations increased with temperature and cross-linker concentration. Both parameters decreased the degree of swelling of intermediately formed microgel domains29 and the inhomogeneity of the macrogels increased in proportion. The effect of preparation temperature on the bulk inhomogeneity and on the surface morphology of pNIPAm was investigated by Suzuki et al.30 They found that pNIPAm surfaces were rougher when prepared at temperatures above the LCST. The increase in roughness was explained by the formation of inhomogeneous, loosely cross-linked microgel domains at elevated temperatures. The surface roughness correlated positively with the bulk inhomogeneities of the hydrogel.
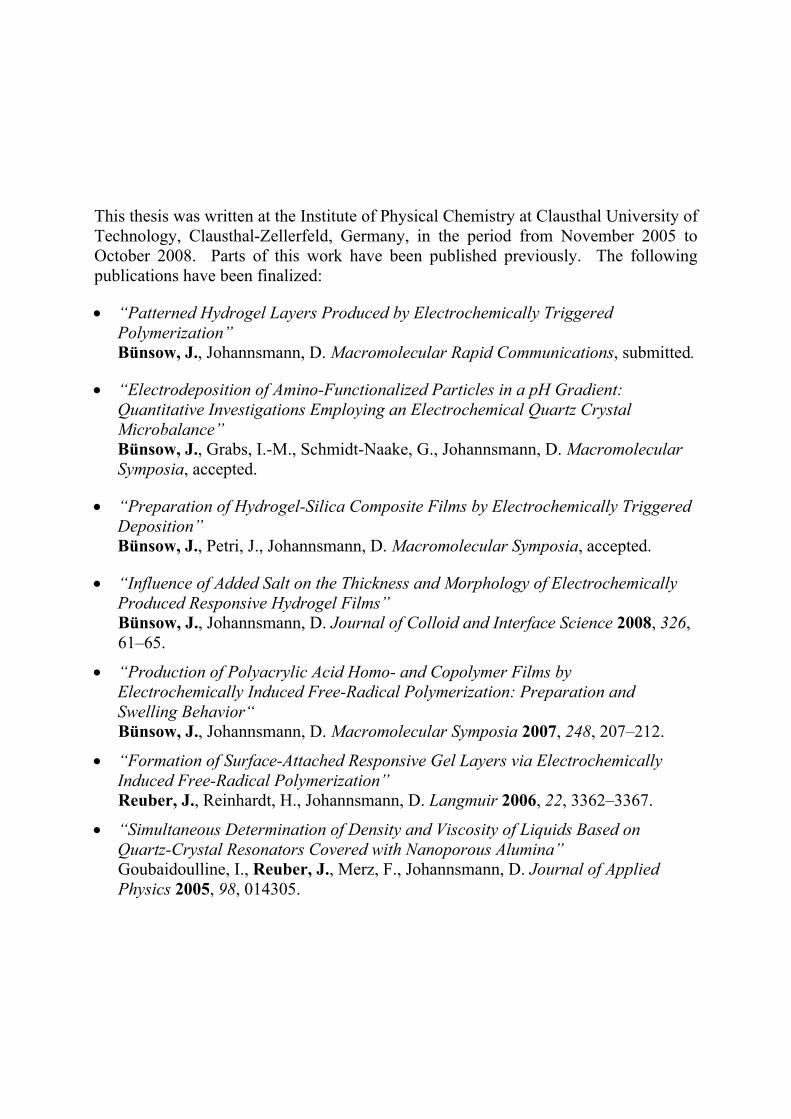
Another polymer often used in biomedical applications is poly(ethylene glycol) (PEG). PEG has a low toxicity, a high solubility in water and most organic solvents, and a high protein-repellence.31 PEG does not harm proteins and cells and often transfers its favorable properties to other molecules if covalently bound to them (“PEGylation”). Poly(ethylene glycol) methacrylate (PEGMA) is a derivative of PEG amenable to free-radical polymerization. Fig. 3 shows the chemical structures of PEG, PEGMA, and NIPAm.

2 Background Responsive Hydrogels
5
O
NH
O
OO
Hn OOHH
n
I II III
If the poly(ethylene glycol) side chain of PEGMA is long, polymers produced from PEGMA have properties similar to PEG. If short oligomeric PEG side chains are used (“OEGMA”), the hydrophobic methacrylate group gains in relative importance and the polymers exhibit a LCST that depends on the number of PEG units in the monomer.32−34
Due to its protein- and cell-repellent properties, PEG is often used as an antifouling coating.4,35 The origin of the antifouling properties of PEG coatings are still under debate. One mainly ascribes the antifouling behavior to two mechanisms. The steric repulsion theory assumes that attractive hydrophobic and van-der-Waals forces between a protein and a PEG brush are balanced by an entropically driven steric repulsion. This repulsive force contains an osmotic component, which is related to the hydration of PEG, and an elastic component that results from compression of the brush when a protein approaches the surface.31 In principle, the steric repulsion theory should apply to any kind of well-hydrated polymer brush. A second explanation for the antifouling behavior of PEG brushes takes into account the low interfacial energy between PEG and water.4 It is assumed that the protein resistance is a consequence of the formation of an interfacial water layer which prevents a direct contact between the protein and the surface.36,37 If thermoresponsive PEG derivatives are employed, the antifouling properties can be thermally modulated.25 Further on, PEG hydrogels were applied to drug delivery21 and as matrix material in the electrochemical detection of glucose.38
Copolymers of NIPAm and OEGMA are attractive materials. They show an unusual temperature-dependent swelling behavior and have appealing properties for biomedical applications due to the combination of thermoresponsiveness and biocompatibility. Because of the hydrophilicity of OEGMA, copolymers of NIPAm and OEGMA have a higher LCST than the pNIPAm homopolymer.12,39,40 For p(NIPAm-co-OEGMA) microgels, Ma et al. found a broadening of the swelling-vs.-temperature curve which was accompanied by a decrease in the amplitude of the transition.35 The broadening is related to a phase separation of the copolymers upon collapse. Due to the hydrophilic nature of OEGMA, the OEGMA side chains are well hydrated when pNIPAm collapses. Based on these considerations, Wu and co-workers
Fig. 3: Chemical structures of poly(ethylene glycol) (I, PEG), poly(ethylene glycol) methacrylate (II, PEGMA), and N-isopropylacrylamide (III, NIPAm).

2 Background Responsive Hydrogels
6
proposed the formation of a core–shell structure with a hydrophobic pNIPAm core and a hydrophilic PEG shell.41,42 Leobandung et al. made use of such core-shell particles for the protective encapsulation of insulin.43
The fouling properties of pure pNIPAm films depend on film thickness and grafting density. Copolymerization with PEG derivatives lowers the fouling tendency due to the protein-repellent nature of PEG.
2.2 The Hofmeister Effect
Hofmeister was the first to describe the effect, which salts have on the stability of a protein mixture from hen egg white.44 He found that some salts stabilize the proteins, whereas others induce precipitation. When ranking salts in a series according to their ability to stabilize or destabilize protein solutions, one obtains the “Hofmeister series”. Typically, anions have a much stronger effect than cations. The Hofmeister series holds not only for protein stability, but plays an important role in numerous other processes such as the micelle-to-vesicle transition,45 film formation from aqueous polymer dispersions,46 bubble coalescence,47 and pH measurements with glass electrodes.48 Another phenomenon depending on the position of an ion in the Hofmeister series is the shift of the LCST of pNIPAm induced by added salt. When anions are ordered according to the shift of the LCST, one finds the following series (which is essentially the same as the Hofmeister series):14
CO32− > SO4
2− > S2O32− > H2PO4
− > F− > Cl− > NO3− ≈ Br− > ClO4
− > I− > SCN−.
Anions on the left decrease the LCST (“kosmotropes”), whereas anions on the right increase it (“chaotropes”). The decrease of the LCST is much stronger than the increase.
The origin of the Hofmeister effect is under investigation.49 Until recently, it was attributed to the influence of salts on the local structure of water.50 Recent experiments raised doubt on that explanation. For instance, Batchelor et al. reported that the salts’ partial compressibility did not correlate well with their capability for protein precipitation.51 Correlation of the two parameters would be expected if the perturbation of the water structure was the driving force for the Hofmeister effect. Gurau et al. investigated the influence of salt on the ordering of an octadecylamine monolayer on water by vibrational sum frequency spectroscopy (VSFS).52 Here, the impact of the ions on the interfacial water structure partially ranked as the Hofmeister series, but significant deviations became apparent. New explanations for the Hofmeister effect take into account the role of dispersion forces which had been ignored or underestimated in the previous models describing electrolyte solutions and ions at interfaces.49,53

2 Background Responsive Hydrogels
7
For the interaction of ions with pNIPAm, Cremer and co-workers claim that three mechanisms are at work.14 First, ions can polarize water molecules which are involved in hydrogen bonding with the amide groups of pNIPAm. Second, ions can interfere with intramolecular hydrophobic interactions by increasing the surface tension of the hydrophobic cavity surrounding the polymer backbone and isopropyl side chain. Third, ions can directly bind to the polyamide. The first two effects decrease the LCST whereas the third increases it. Which of the three effects dominates depends on the type of anion used. Kesselman et al. claim that the effect that ions have on pNIPAm goes beyond a shift in the LCST.54 Their IR studies revealed that sulfate induces hydrophobic interactions even at temperatures below the LCST. Similar hydrophobic interactions were absent when the salt was omitted.
The impact of salt on the LCST of bulk pNIPAm was the objective of many investigations, but little work has been done so far on the shift of the LCST of surface-immobilized pNIPAm. Jhon et al. measured the LCST of grafted pNIPAm chains as a function of sodium chloride concentration.55 The LCST was found to decrease with increasing salt concentration. In contrast to free pNIPAm chains in solution, the decrease of the LCST with concentration was nonlinear, which was attributed to the lack of translational entropy in grafted pNIPAm and to an enhancement of intra- and intermolecular hydrogen bonding upon collapse at high grafting densities. Ishida et al. focused on the structural changes of grafted pNIPAm induced by sodium sulfate solutions.56 They observed a transition from a brush-like to a mushroom-like surface morphology at the critical concentration for collapse. Above this concentration, rigid hydrogel domains with characteristic sizes between 100 and 200 nm dominated the surface morphology.
2.3 Polymer Films at Interfaces
2.3.1 Grafting Techniques
For biomedical and sensing applications, polymers are often fixed to solid supports. For this purpose, various coating techniques have been developed. Grafting comprises all methods where the attachment is achieved by a covalent bond between the polymer and the substrate. There are also numerous ways such as spin-coating and spray-coating where the polymer is physically adsorbed to the surface.
One mainly distinguishes between “grafting-to” and “grafting-from” approaches. Grafting-to techniques are based on the synthesis of the polymer, in a first step, followed by the attachment of the polymer to the surface. This allows for a characterization of the polymer with standard techniques such as differential scanning calorimetry, NMR spectroscopy, or size exclusion chromatography but often requires a

2 Background Polymer Films at Interfaces
8
high synthetic effort. Grafting-to techniques include methods like the attachment of polymer chains to gold and silicon dioxide surfaces via self-assembly57 or irradiation induced cross-linking of pre-formed polymer chains at the surface.58–60
Grafting-from methods either make use of active groups that are fixed to the surface or of a simultaneous polymerization and grafting reaction. Often, grafting-from is fast and experimentally easy, but the characterization of the resulting polymer films requires surface- sensitive techniques. Examples where the polymerization is started at the surface are irradiation induced polymerizations (e.g., plasma polymerization, electron-beam induced polymerization)61,62 or polymerizations from surface-attached active groups such as atom transfer agents (ATRP).35,63 Generally speaking, the achievable grafting densities are higher with grafting-from because chain crowding prevents the diffusion of entire chains towards the solid surface in the case of grafting-to.
2.3.2 Electrochemical Coating Techniques
For conducting surfaces, electrochemical coating techniques are particularly attractive.∗ Conducting polymer films can be formed by electropolymerization,64 but insulating polymer films can be produced electrochemically, as well. For example, Schuhmann and co-workers precipitated anodic and cathodic electrodeposition paints.65–67 Similar to the electrocoating process used in car industry,68 this method relies on the neutralization of acidic or basic polymer chains in an electrochemically induced pH gradient. Palacin and co-workers induced an ionic polymerization via direct electron transfer from the electrode to the monomer (“electrografting”).69–71 This approach works for many vinylic monomers such as acrylonitrile, oligo(ethylene glycol) acrylate,72 or N-vinylpyrrolidone73 in aprotic solvents at cathodic (but for some monomers also at anodic) potentials.
One makes also use of electro-initiated polymerizations where the initiating radicals are produced electrochemically.74 Methods for an anodic formation of initiating radicals are the Kolbe electrolysis of acetates,75-77 the decomposition of persulfate ions at silver electrodes,78 the oxidation of perchlorate in organic solvents,79 and the polymerization in aqueous zinc chloride solutions.80 All these anodic techniques suffer from the drawback that many metals are oxidized or even dissolved at positive potentials. Hence, cathodic formation of the radicals is the more convenient approach. The most widespread cathodic route to produce radicals is the electrochemical
∗ The distinction between grafting techniques, on the one hand, and electrochemical coating techniques, on the other, does not imply that electrochemical approaches are “non-grafting” techniques in a sense that the attachment is based on physical adsorption, only. Electrochemical techniques may both have a grafting (e.g., electrografting) or a non-grafting character (e.g., electroneutralization of electrodeposition paints).
2 Background Polymer Films at Interfaces
9
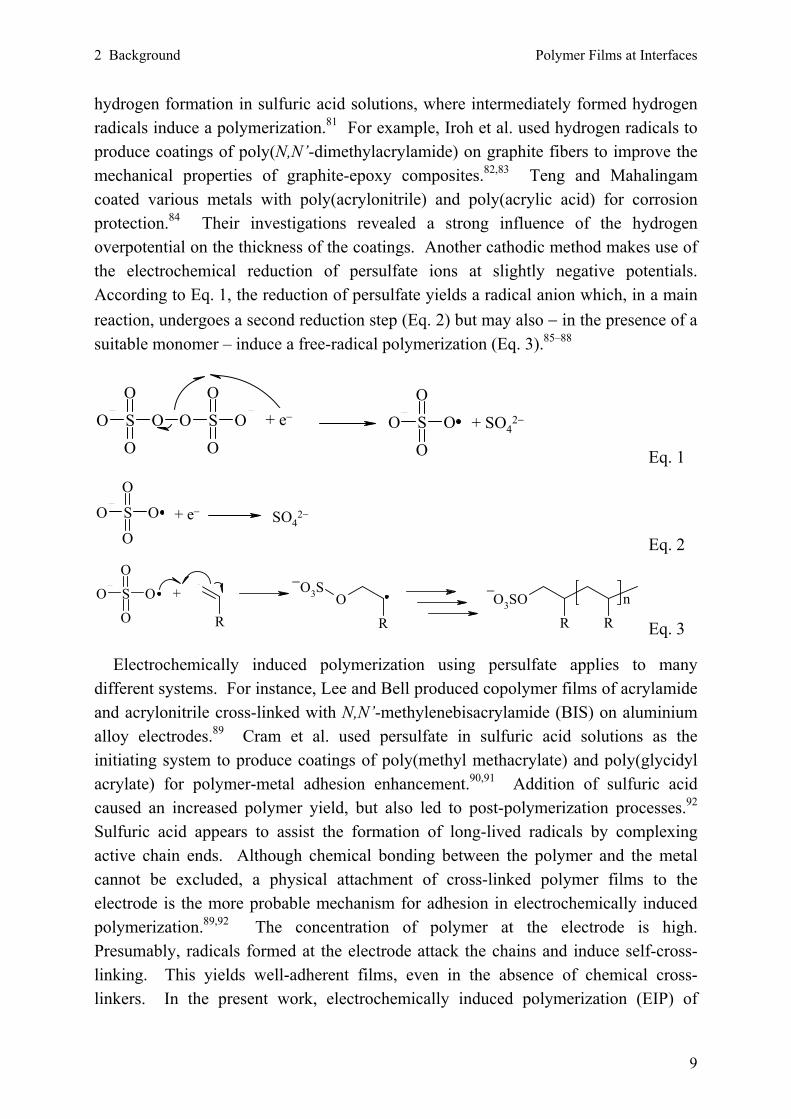
hydrogen formation in sulfuric acid solutions, where intermediately formed hydrogen radicals induce a polymerization.81 For example, Iroh et al. used hydrogen radicals to produce coatings of poly(N,N’-dimethylacrylamide) on graphite fibers to improve the mechanical properties of graphite-epoxy composites.82,83 Teng and Mahalingam coated various metals with poly(acrylonitrile) and poly(acrylic acid) for corrosion protection.84 Their investigations revealed a strong influence of the hydrogen overpotential on the thickness of the coatings. Another cathodic method makes use of the electrochemical reduction of persulfate ions at slightly negative potentials. According to Eq. 1, the reduction of persulfate yields a radical anion which, in a main reaction, undergoes a second reduction step (Eq. 2) but may also − in the presence of a suitable monomer – induce a free-radical polymerization (Eq. 3).85–88
O S
O
O
O O S
O
O
O O S O
O
O
+ e− + SO42−
Eq. 1
O S O
O
O+ e− SO4
2−
Eq. 2
O S O
O
O RO
O3S
R
O3SO
R R
n +−
−
Eq. 3
Electrochemically induced polymerization using persulfate applies to many different systems. For instance, Lee and Bell produced copolymer films of acrylamide and acrylonitrile cross-linked with N,N’-methylenebisacrylamide (BIS) on aluminium alloy electrodes.89 Cram et al. used persulfate in sulfuric acid solutions as the initiating system to produce coatings of poly(methyl methacrylate) and poly(glycidyl acrylate) for polymer-metal adhesion enhancement.90,91 Addition of sulfuric acid caused an increased polymer yield, but also led to post-polymerization processes.92 Sulfuric acid appears to assist the formation of long-lived radicals by complexing active chain ends. Although chemical bonding between the polymer and the metal cannot be excluded, a physical attachment of cross-linked polymer films to the electrode is the more probable mechanism for adhesion in electrochemically induced polymerization.89,92 The concentration of polymer at the electrode is high. Presumably, radicals formed at the electrode attack the chains and induce self-cross-linking. This yields well-adherent films, even in the absence of chemical cross-linkers. In the present work, electrochemically induced polymerization (EIP) of

2 Background Polymer Films at Interfaces
10
NIPAm and OEGMA is achieved by the decomposition of persulfate in the absence of sulfuric acid.93,94
2.4 Reversible Addition–Fragmentation Chain Transfer (RAFT) Polymerization
Recently, various techniques have been developed that allow for a sophisticated control over the molecular weight, the molecular weight distribution, the polymer composition, and the architecture of a polymer formed by free-radical polymerization. The level of control approaches traditional living polymerization techniques (for instance anionic polymerization) but the robustness and versatility of a conventional free-radical polymerization are preserved. Similarly to the traditional techniques, controlled radical polymerizations add a living character to the polymers. Controlled radical polymerization techniques include nitroxide-mediated polymerization (NMP),95 atom transfer radical polymerization (ATRP),96 reversible addition–fragmentation chain transfer (RAFT) polymerization,97–99 and some newer techniques like tellurium-mediated radical polymerization (TERP).100
RAFT polymerization uses degenerative chain transfer of thiocarbonylthio species to control the polymerization. A sketch of the mechanism of RAFT polymerization is given in Eqs. 4 to 7.98
1. Initiation
Initiator IΔhν, γ, e− Eq. 4
2. Reversible chain transfer, “pre-equilibrium”
I M
SS R
z SR
SM
I SM
I S
SS R
z
SI
S
z
z
SR
SI
IM + R
ZZ
ZZ
Z
a
b
+ RZ Eq. 5

2 Background RAFT Polymerization
11
3. Re-initiation
R M R M MPm Eq. 6
4. Chain equilibration, “main equilibrium”
SS P
z
SSP P
z
SSP
z
z
zPm
M
+n
m n
mPn+
MZ
Z
Z
Eq. 7
Here, I• is a radical produced by initiator decomposition, M is the monomer, P is the growing polymer chain with n or m monomer units, Z is a stabilizing group, and R is a free radical leaving group. In principle any source of radicals can be used for the initiation step (Eq. 4). Most RAFT polymerizations use standard initiators for free-radical polymerizations such as potassium persulfate or 2,2’-azobisisobutyronitrile (AIBN). The initiator can induce the free-radical polymerization of the monomer (Eq. 5a) which adds to the RAFT agent after some propagation steps. Alternatively, the initiator can directly add to the RAFT agent (Eq. 5b). The intermediate radical adduct stabilizes by homolytic cleavage of the S−R bond which yields an R-radical that re-initiates the polymerization (Eq. 6). In the main equilibrium (Eq. 7), a rapid equilibrium between the propagating chains and the dormant RAFT agent provides an equal probability for all chains to grow, resulting in the formation of polymer chains of low polydispersity.
The key structural features of a RAFT agent are the Z and the R group. The Z group mainly controls the bulk reactivity of the thiocarbonylthio species and is the major factor of influence on the lifetime of the intermediate formed by radical addition (cf. Eqs. 5 and 7). The R group allows for the fine tuning of the overall reactivity. It must be a good radical leaving group and the radical generated from homolytic cleavage of the S–R bond must be able to re-initiate the polymerization. Requirements for an effective RAFT agent are a reactive C=S bond, a fast fragmentation reaction, and a low tendency of the intermediate radical adduct towards side reactions. Moreover, the fragmentation rate should equal or exceed the rate of the addition reaction, and the expelled radicals should efficiently re-initiate the polymerization.
Non-idealities in conventional cross-linking copolymerizations are mainly due to microgel formation as a consequence of inhomogeneous cross-linking reactions. When cross-linking copolymerizations are conducted in a controlled manner, one

2 Background RAFT Polymerization
12
would intuitively expect the formation of more homogeneous networks. Several arguments speak for the reduction of network inhomogeneities by controlling agents. Ide and Fukuda argued that the formation of homogeneous polystyrene gels by NMP is caused by a simultaneous and slow∗ growth of the chains. This allows the chains to relax, resulting in efficient and homogeneous cross-linking reactions.101 Another reason for the reduction of network inhomogeneities by NMP and ATRP may be the slowing-down of the rate of polymerization. When the polymerization is slower, temperature fluctuations which can locally enhance the polymerization are less important. A similar reduction of temperature fluctuations may occur during RAFT polymerization due to a more homogeneous distribution of reaction events in the solution. In RAFT polymerization, the chain length of the polymers at a given conversion is reduced compared to conventional free-radical polymerization, resulting in the formation of smaller microgel domains. If, at a given polymer volume fraction, the number density of the (smaller) microgel domains is increased, this would eventually yield a more homogeneous gel (this is not trivial).
The formation of homogeneous networks by controlled radical polymerization techniques has been verified by a number of experiments. As mentioned previously, Ide and Fukuda synthesized polystyrene gels by NMP.101 Yu et al. investigated the formation of networks from PEGMA by ATRP.102 In both cases, the controlled polymerization yielded more homogeneous network structures compared to conventional free-radical polymerization. Similar results were also obtained by Jiang et al.103 No effect of the controlled character on the network homogeneity was found by Peppas and co-workers who synthesized networks consisting of PEGMA and PEG dimethacrylate by photopolymerization in the presence of an iniferter.104 Norisuye et al. prepared more homogeneous polystyrene gels in the presence of RAFT agents.105 Liu et al. investigated the swelling behavior of pNIPAm hydrogels cross-linked with N,N’-methylenebisacrylamide in the presence of a monovalent RAFT agent.106 Here, the swelling ratio and the shrinking rate increased which the authors attributed to a decreasing network homogeneity in the presence of RAFT agent. This decrease was explained by the formation of dangling ends that retarded the cross-linking reaction.
∗ In contrast to ATRP and NMP, the polymerization rate is not decreased by RAFT agents. The control mechanism in RAFT polymerization is fundamentally different from other controlled polymerization techniques. Control in the RAFT process is achieved by a degenerative chain transfer reaction whereas in ATRP and NMP the concentration of polymeric radicals is decreased by the formation of a “dormant” species.
2 Background Patterning
13
2.5 Patterning of Polymer Films
Patterning increases the functionality of polymer films. A typical application of patterned polymer films would be an array sensor where different spots respond selectively to certain analytes of interest, allowing for a fast detection of a large number of analytes and to an easier differentiation between different species. In addition, patterned polymer films are promising substrates for directed cell-growth in tissue engineering.
Various techniques exist which allow for the patterning of polymer surfaces.107 Classical examples are irradiation induced polymerizations or cross-linking reactions where patterning is achieved by irradiation through a mask108 or with a focused beam which scans the sample.109
Soft-lithography techniques are based on the replication of a relief pattern from a poly(dimethylsiloxane) (PDMS) stamp to a substrate.110 Microcontact printing makes use of the transfer of an organic ink from a structured PDMS stamp to a substrate, where the material forms a self-assembled monolayer.110,111 In micromolding, the PDMS structure is replicated by stamping into a polymer.110 Subsequent curing of the polymer fixes the pattern. Inkjet printing allows for the direct printing of material with commercially available (or sometimes more sophisticated) printing devices.112,113 Although this low-cost approach easily allows for a rapid patterning, even of large-scale samples, its applicability is limited by the surface tension and the viscosity of the ink as well as by the wettability of the substrate. Another way to produce laterally structured polymer films is based on the self-assembly of block copolymers on surfaces.114,115
Variants of the scanning probe technique are widely used, as well.116,117 In dip-pen nanolithography, the deposit is transferred from an AFM tip to the desired location by diffusion through a water droplet which is condensed in the small gap between the tip and the substrate.118 As demonstrated by Mirkin and co-workers, dip-pen nanolithography easily allows for the patterning of organic material such as 1-octadecanethiol or DNA strands on gold and derivatized silica surfaces.119 An extension to this technique is electrochemical dip-pen nanolithography. For instance, Li et al. wrote poly(thiophene) nanowires120 and deposited platinum by electro-chemical reduction of H2PtCl6 dissolved in the water phase.121
A versatile tool for the electrochemical production of laterally heterogeneous films is the scanning electrochemical microscope (SECM)122,123 where the deposition of a conducting material is restricted to a small area underneath an ultramicroelectrode (UME).124,125 Although usually employed for localized deposition of inorganic conductors such as copper126 or silver,127 the SECM has also been applied to produce

2 Background Patterning
14
patterns of conducting polymers.128,129 Electrospotting was used by Szunerits et al. to produce arrays of poly(pyrrole) functionalized with oligonucleotides.7 In this case, a micropipette was used as an electrochemical cell, allowing for the localized deposition of the conducting polymer. Another electrochemical approach is based on variations of the electron transfer efficiency on a silicon wafer patterned with gold as reported by Palacin et al.69 Patterning of the gold was achieved by vacuum evaporation through a mask. Electrografting of poly(methacrylonitrile) in a subsequent step was only successful on the gold patterns, owing to a more efficient electron transfer on gold. Electrohydrodynamic patterning exploits an electric field underneath a structured electrode to induce patterns in thin polymer films below their glass temperature.130 At high electric field strengths, the stabilizing surface tension is overcompensated by a dielectric instability and the polymer film forms pillars which can be fixed, for instance by photocuring. Kumacheva and co-workers exploited convection instabilities to produce patterned polymer surfaces.131
2.6 Bioanalytics
Biosensors are usually constructed from a biological recognition element in contact with a transducer surface.1,132 For the sake of protection of the recognition element, it is encapsulated into a matrix. Encapsulation also guarantees proximity of the enzyme to the electrode and reduces the needed amount of enzyme. The biorecognition event, for example, can be a chemical reaction of the analyte catalyzed by an enzyme,67 the coupling of antigen–antibody pairs,133,134 or the hybridization of DNA and other oligonucleotides.7 The biorecognition event must induce an electronic signal that allows for a fast and easy read-out. The read-out of biosensors has been realized in many different ways.135 Examples are the detection of fluorescence arising from a coupling reaction,7 the measurement of mass variations by surface plasmon resonance,7 the detection of a change in the focal length of microlens arrays upon analyte binding,133,134 and the electrochemical detection of redox events on the transducer surface (cf. Section 2.6.1).8,9
2.6.1 Amperometric Biosensors
If the biorecognition event involves redox reactions of the analyte or a correlated species, amperometric biosensing is the most convenient approach to the quantification of the analyte.8,9 In this case, the transducer surface is an electrode, where the current following the biorecognition is detected. One distinguishes between three generations of amperometric biosensors. Biosensors of the first and the second generation employ electron transfer from a dissolved enzyme to the electrode by diffusion of either a reaction product (first generation biosensors) or of a redox mediator (second generation biosensors). Since the enzyme often is the most

2 Background Amperometric Biosensing
15
expensive part of an amperometric biosensor, third generation biosensors use encapsulated redox enzymes such as glucose oxidase which reduces the required amount of enzyme.
Redox enzymes lower the activation energy of a specific redox reaction by storing redox equivalents in a prosthetic group (e.g., FAD) or by transferring electrons to a cosubstrate (e.g., NAD+). The regeneration of the enzyme is realized by electron transfer from the cofactor or the cosubstrate to the electrode surface. Encapsulation of the enzyme into a suitable matrix is necessary. Sensors based on adsorbed enzymes suffer from insufficient long-term stability caused by desorption and denaturation of the enzyme. A well-suited immobilization matrix must preserve the enzyme activity, it must prevent unwanted side reactions, it should allow for a fast diffusion of the analyte to the enzyme, and it must provide efficient electron transfer pathways. Electron transfer can be realized by different mechanisms, namely by tunneling of electrons from the cofactor to the electrode surface,136 by freely diffusing redox species,65,67 by electron hopping in redox polymers,137,138 and by “wiring” the enzyme to the electrode with conducting polymers.139 An approach that makes use of the detection of hydrogen peroxide generated upon the enzyme-catalyzed oxidation of glucose was described by Schuhmann and co-workers.65,67 In these sensors, glucose oxidase was encapsulated in a film formed by electroneutralization of acidic or basic polymers. If the polymers contained redox-active osmium complex-based side groups, the sensitivity of the device was increased. The osmium complexes formed an electron-hopping pathway from the enzyme to the electrode.137 Similarly, Merchant et al. increased the current through a poly(ethylene imine) matrix by incorporation of ferrocene units.138 An elegant way to improve the specificity of a glucose sensor was reported by Lau et al.140 The technique addresses the problem that glucose sensors based on pyrrolo-quinoline quinone-dependent glucose dehydrogenase (PQQ-sGDH) also respond to maltose. In order to differentiate between the two sugars, the authors deposited the active layer on an indirectly heated electrode. The primary reaction was such, that glucose and maltose had different temperature characteristics, which allowed for differentiation.

2 Background Amperometric Biosensing
16
2.6.2 Michaelis–Menten Kinetics
Glucose oxidase is by far the most common redox enzyme in amperometric biosensors. It allows for the detection of glucose, which is highly relevant in the diagnostics for diabetes. Glucose oxidase catalyses the oxidation of glucose to a glucono-lactone in the presence of oxygen (Eq. 8).
O OH
OHOHOH
OH O O
OHOHOH
OH+ O2
[glucose oxidase]+ H2O2
Eq. 8
In a subsequent step, hydrolysis of the D-glucono-1,5-lactone yields gluconic acid. The hydrogen peroxide produced upon oxidation can be easily detected amperometrically at positive potentials. When plotting the current related to the oxidation of hydrogen peroxide versus the glucose concentration, one typically finds Michaelis–Menten behavior. The Michaelis–Menten kinetics is characteristic for enzyme-catalyzed reactions, where the formation of the enzyme–substrate complex is an equilibrium reaction, preceding the product formation.141 The reaction scheme is depicted in Eq. 9.
E + S ES E + P
k1
k-1
k2
Eq. 9
E is the enzyme, S is the substrate, P is the product, k2 is the rate constant of the product formation, and k1, k−1 are the rate constants of the formation and the decomposition of the enzyme–substrate complex, respectively. The rate of reaction at high substrate concentrations is limited by competitive hindrance of the enzyme. The rate of reaction follows the law
glucoseM
glucosemax
cKcv
v+
⋅= Eq. 10
where v is the rate of reaction, vmax is the maximum rate of reaction, KM is the Michaelis constant, and cglucose is the glucose concentration. The Michaelis constant as given by Eq. 11 is a measure of the reciprocal affinity of the enzyme to the substrate.
1
1
1
21
kk
kkkK M
−− ≈+
= Eq. 11

2 Background Amperometric Biosensing
17
In Eq. 11, the Michaelis constant simplifies to the ratio of k−1 and k1 if the decomposition of the enzyme–substrate complex is much faster than the product formation. The Michaelis constant can be determined graphically from the plot of the reaction rate versus the substrate concentration. KM is equal to the substrate concentration at half saturation. As a consequence, the Michaelis constant can serve as a measure of the width of the linear regime of an amperometric biosensor. The maximum reaction rate (or, likewise, the maximum current) is determined by the activity of the enzyme and – at a given KM – controls the sensitivity of an amperometric biosensor.

3 Methods Quartz Crystal Microbalance
18
3 Methods
3.1 Quartz Crystal Microbalance
3.1.1 Piezoelectric Sensing Devices
With the development of life sciences and nanotechnology, the demand for surface-sensitive analysis techniques has increased considerably. Phenomena like cell–cell or cell−protein interactions, catalysis, and friction take place at the solid–liquid or solid–gas interface. Analyzing solid interfaces is demanding. Methods that allow for the chemical characterization of surfaces most often rely on spectroscopic techniques like surface-enhanced Raman spectroscopy,142 X-ray photoelectron spectroscopy (XPS),143 and Auger electron spectroscopy.143 Scanning probe techniques probe mechanical (atomic force microscope, AFM),144 or electrical (scanning tunneling microscope, STM and scanning electrochemical microscope, SECM)122,123,145 interactions of a small tip with a sample surface.117 A detection of the thickness and mass of surface-attached films is possible, for instance, by ellipsometry,146 surface plasmon resonance (SPR),5 and the quartz crystal microbalance (QCM).147–149 SPR and QCM techniques exploit the reflection of an optical or acoustic wave that propagates from the surface into an attached film. Acoustic wave devices are constructed from piezoelectric materials, usually quartz,147−149 where a vibrational motion of the material is induced by application of an alternating voltage. This effect is called the inverse piezoelectric effect. Piezoelectricity appears in materials without inversion center in the crystal structure. A mechanical stress exerted on these crystals causes an asymmetric displacement of charges, resulting in the appearance of an electric field at the crystal surface. Conversely, if an alternating voltage is applied to a piezoelectric material, a shear vibration results. If the frequency coincides with the acoustic resonance frequency of the crystal, the shear amplitude becomes very large.
Depending on the crystal cut and the electrode design, different acoustic wave devices can be constructed, as illustrated in Fig. 4. The most common acoustic wave device is the thickness shear device (Panel A),6,147–150 where a standing shear wave propagates through the quartz crystal between a front and a back electrode. If a material is deposited on the surface, the wave penetrates into the latter and its wavelength increases in proportion to the deposited mass (for details, see below). The sensitivity of all piezoelectric sensors increases with the resonance frequency. Thickness shear devices typically operate in the 10 MHz regime whereas the surface acoustic wave devices (Panel B) have resonance frequencies in the 100 MHz regime.148 Despite their good sensitivity, the latter devices suffer from the drawback that they can only be operated in gases. A normal component in the displacement pattern avoids the operation in liquids where the surface acoustic wave is heavily

3 Methods Quartz Crystal Microbalance
19
damped. This drawback is overcome in shear-horizontal Love wave devices (Panel C) by deposition of a thin overlayer with a low acoustic wave velocity. Such a layer works as a waveguide and keeps the vibrational energy close to the surface.149 Shear-transverse wave resonators work similar to surface acoustic wave devices, but they are made from, for instance, lithium tantalate instead of quartz.147 Due to the high dielectric constant of the material, the electric field is by-and-large confined to the guiding layer. The fringe fields are small, which avoids the interference of the dielectric properties of the sample with the mass determination. Torsional resonators (Panel D) have low resonance frequencies in the 100 kilo-Hz regime.151 The low resonance frequencies come along with an increasing penetration depth of the acoustic wave which makes the torsional resonator useful for the investigation of bulk properties of the surrounding medium. Another class of piezoelectric sensing devices are flexural plate wave resonators, where the acoustic wave is excited in a thinned membrane.148 The following discussion will focus on thickness shear vibration devices, which are the key elements of the classical quartz crystal microbalance (QCM).
Besides investigations on deposition processes, acoustic wave devices have been successfully applied to a variety of sensing applications and fundamental studies.6,152 For gas sensing, the device is coated with a thin sorptive layer which swells selectively in the presence of the analyte.147,153 If biorecognition elements are fixed to the device surface, DNA hybridization147 or antigen-antibody coupling can be easily detected.154,155 Biological studies are often concerned with the investigation of interactions between proteins and the functionalized surface of a quartz crystal.6 Further, the QCM has been extensively used to investigate the swelling of polymer
Fig. 4: Piezoelectric sensing devices. Depending on the electrode design and the resulting acoustic wave, one can distinguish between thickness shear vibration devices (A), surface-acoustic wave devices (B), shear horizontal Love wave devices (C), and torsional resonators (D).

3 Methods Quartz Crystal Microbalance
20
brushes,156–158 for the study of contact mechanics,147,159 and for the determination of viscoelastic parameters of polymer coatings.147,149,160,161
3.1.2 The Quartz Crystal Microbalance
The quartz crystal microbalance uses a thin quartz crystal, usually coated with gold electrodes and a thin layer of chromium or titanium as adhesion promoters between the quartz crystal and the gold. As sketched in Fig. 5, application of an alternating voltage to the electrodes induces a thickness shear vibration of the crystal. The resonance frequency of the thickness shear vibration is in the range of 1 to 10 MHz. Several overtones can be detected at odd multiples of the fundamental.
In impedance analysis, electrical conductance spectra are determined. A network analyzer sweeps the frequency of the exciting voltage. When the exciting frequency matches the resonance frequency of the crystal, the amplitude of oscillation becomes large and the conductance passes through a maximum. Resonance parameters can be inferred from conductance spectra by fitting the theoretical conductance curve to the
Fig. 5: Application of an alternating voltage to the quartz crystal induces standing shear waves in the material. Depending on the number of nodes, one can distinguish between the fundamental frequency and several overtones.
Fig. 6: Conductance spectra (A) and standing shear waves (B) of a bare quartz crystal and of a crystal coated with a rigid material in air. The negative frequency shift is proportional to the deposited mass.

3 Methods Quartz Crystal Microbalance
21
data. In this way, one can extract the resonance frequency and its overtones as well as the half bandwidth at half maximum (“bandwidth”, for short) of the conductance curves.
For a rigid material, e.g., a metal or a metal oxide, the standing shear wave and the conductance curves are sketched in Fig. 6. In an ideally elastic material in air, the standing shear wave propagates into the deposited film without dissipative losses (Panel B). Deposition of a film causes a shift of the conductance curve towards smaller frequencies without change in the shape of the curve (Panel A). The relation between the frequency shift and the film’s mass is given by the Sauerbrey equation162
Sf
2f
Sq
2f ρ
22d
Znf
mZnf
fq
−=−=Δ Eq. 12
where n is the overtone order, ff is the frequency of the fundamental, mS is the mass per unit area, Zq = 8.8×10⁶ kg m−2 s−1 is the acoustic impedance of AT-cut quartz, ρf is the density of the film, and dS is the film thickness in the Sauerbrey sense (called “Sauerbrey thickness”).
When the quartz crystal is operated in a liquid, the situation changes, as illustrated in Fig. 7. The standing shear wave penetrates into the liquid, but dissipative losses cause the decay of the vibration (Panel B). In water at 20 °C, the decay length is in the range of 250 nm.6 Upon immersion in a liquid, the conductance curve of the crystal shifts to smaller frequencies, and at the same time it broadens and decreases in
Fig. 7: Conductance spectra (A) and standing shear waves (B) of a quartz crystal operated in a liquid. The standing shear wave decays in the liquid. The conductance curve shifts to smaller frequencies and broadens.

3 Methods Quartz Crystal Microbalance
22
amplitude due to damping of the vibration (Panel A). The frequency and bandwidth shifts are given by the Kanazawa–Gordon equation163,164
q
nff
μπρηρ
q
l3/2f−=Δ Eq. 13
where ρl is the density of the liquid, η is its viscosity, and ρq and μq are the density and the shear modulus of the quartz crystal, respectively.
If viscoelastic films such as polymer layers are deposited on the crystal surface, the situation becomes more complicated and impedance analysis allows for the determination of the viscoelastic properties of the material.160 For a thin viscoelastic film in air, the frequency shift is given by the Sauerbrey equation and the bandwidth shift is related to the viscous compliance J″ of the film.
ΔΓ=′′3f
4f
fq2
1ρ8π
3mf
ZJ Eq. 14
If a thin viscoelastic film is immersed in a liquid, the dissipation is usually high due to stress exerted by the liquid. In this case, the elastic compliance J′ of the film is given by Eq. 15.
ηπ21
fnffJ
ΔΔΓ
−=′ Eq. 15
More detailed discussions of studies on viscoelasticity with the QCM are reported in Refs. 147, 149, 160, and 161.
In QCM measurements, a number of complications can occur. In general, QCM measurements yield accurate results only if the deposited mass does not exceed 2% of the crystal’s mass. In addition, the frequency of the quartz crystal is a function of temperature. This effect can be reduced by a proper choice of the crystal cut (for instance, the frequency of AT cut crystals is relatively stable around 25 °C) or by mathematical corrections. The frequency is also sensitive to mechanical stress, which is often exerted by the holder. Energy trapping is another problem. The quartz crystal can be described as an “acoustic lens” where the sensitivity is highest at the center. This lens effect is necessary to mount the crystal but it complicates the analysis of the data, especially if the mass distribution over the crystal is non-uniform. Very thick films can produce misleading results if their thickness much exceeds the penetration depth of the acoustic wave. In this case, the crystal detects the film’s density and viscosity at the surface, rather than its mass. In a liquid, flexural motion and

3 Methods Quartz Crystal Microbalance
23
compressional waves can distort the results. Roughness effects play an important role, as well, because solvent can be trapped in surface cavities and act as an additional mass. Moreover, changes in the density and the viscosity of the liquid can complicate the interpretation of the data. Still, the QCM is a versatile and simple tool to investigate thin films in air and in liquid media. The caveats mentioned above are intended as a warning against overinterpretation.
3.2 Electrochemical Techniques
Electrochemical experiments are usually performed in a three-electrode setup as illustrated in Fig. 8.165,166 The three-electrode setup contains a working electrode, where the electrochemical reaction of interest takes place, a reference electrode, and a counter electrode. The potential of the working electrode, ΔUWE, is applied relative to the reference electrode, for instance a silver/silver chloride or a calomel electrode, which usually has a high input impedance. If the measurement is carried out under potentiostatic control, an external device (the potentiostat) maintains ΔUWE at some constant setpoint ΔU0. If a chemical reaction occurs at the working electrode, the potential ΔUWE differs from the setpoint ΔU0. The potentiostat detects this potential difference and compensates it by passing a current i from the counter electrode to the working electrode. The current is measured at the resistance R. In this way, the potentiostatic three-electrode setup allows for the detection of the current at the working electrode as a function of the applied potential.
Fig. 8: Schematic representation of a potentiostatic three-electrode setup.

3 Methods Electrochemical Techniques
24
3.2.1 Chronoamperometry
In a chronoamperometric experiment, a potential step is applied to the electrode as illustrated in Fig. 9.165 At the potential U1, no electrochemical reaction takes place (Panel A). When the potential is switched to U2, the electro-active species reacts at the electrode, resulting in a high current (Panel B). As the redox reaction causes a depletion of the reactant in front of the electrode, a concentration gradient evolves (Panel C). A diffusion layer of increasing thickness forms in front of the electrode surface (curves 2 and 3, Panel C). When diffusion of the active species becomes the rate-determining step of the redox reaction, the current decreases with time. If the current response is a function of diffusion alone, the current is given by the Cottrell equation
1/21/2
1/2
πF)(
tcADzti = Eq. 16
where i is the current, z is the number of electrons transferred per molecule, A is the electrode area, F = 96485 C mol−1 is the Faraday constant, D and c are the translational diffusion coefficient and the bulk concentration of the electro-active species, respectively, and t is the time. Depletion of the electro-active species leads to an inverse t1/2 function. Such a time-dependence often appears in electrochemical experiments when the electrochemical process is controlled by diffusion rather than by the electron transfer reaction. In many chronoamperometric experiments, additional factors of influence such as poisoning or blocking of the electrode cause deviations from the ideal Cottrell diffusion. Apart from Cottrell diffusion, non-Faradaic currents also affect the current response during a chronoamperometric experiment. These non-
U1
U2
CBA
t
(3)
(3)
(2)
(2)
(1)
(1)
ciU
t
0
x
Fig. 9: Chronoamperometry. Potential-time curve (A) and drop of current (B) due to the formation of a concentration gradient of the electro-active species in front of the electrode (C). The parameter x denotes the distance from the electrode surface. Curves 1, 2, and 3 are the concentration gradients at the times marked in Panel B.

3 Methods Electrochemical Techniques
25
Faradaic currents result from the charging of the electrical double layer in response to a potential step. This capacitive current is given by
⎟⎟⎠
⎞⎜⎜⎝
⎛−
Δ=
dSS
exp)(CRt
RUti Eq. 17
where ΔU is the potential step at the working electrode, RS is the solution resistance, and Cd is the differential capacitance of the double layer. Typical values of the differential capacitance of the double layer are in the order of 100 µF cm−2. Usually, the charging of the double layer is fast compared to Cottrell diffusion and the currents in a well-conducting solution are small. Still, if quantitative results are to be obtained from a Cottrell experiment, non-Faradaic contributions can cause severe complications.
3.2.2 Cyclic Voltammetry
In cyclic voltammetry, the potential of the working electrode is ramped linearly with time.165,166 The time-dependent potential curve, the current response to the potential ramp, and a typical cyclovoltammogram of a reversible redox reaction are sketched in Fig. 10. When the potential ramp (Panel A) reaches a level where oxidation or reduction of the analyte occur, the current increases due to the redox reaction (Panel B, C). Plotting the current versus the potential yields a cyclovoltammogram (Panel C). With increasing potential, the current increases and reaches a maximum at the cathodic or anodic peak potential. A further increase in the potential causes a drop of current due to the depletion of the analyte in front of the electrode (cf. Fig. 9 C). In cyclic voltammetry, both the electron transfer kinetics and the diffusion kinetics influence the current-vs.-voltage diagram. The situation is further complicated by the fact that the voltage is variable. Still, the problem has a unique and well known solution depicted in Fig. 10 C. It can only be obtained in
CBA
t
0
iiU
t
0
Aox
+ ze− Ared
Ared
Aox
+ ze−
U
Fig. 10: Triangular potential ramp (A), current response (B), and cyclovoltammogram (C) of a reversible redox reaction.

3 Methods Electrochemical Techniques
26
numerical form. Of considerable practical relevance is the maximum peak current, jp. It is given by the Randles-Sevcik equation
1/2r
1/23/25p 102.69 cvDzj ×= Eq. 18
where jp is the maximum current density and vr is the ramp rate. Eq. 18 holds for one-step reversible redox reactions. It demonstrates that cyclic voltammetry is a straightforward method to investigate the diffusion of electro-active species. More complicated systems include irreversible redox reactions (Fig. 11A) or multiple-step electron transfer reactions (Fig. 11B). In the following, cyclic voltammetry will be used to determine the reversibility of electrochemical reactions in aqueous solutions. The height of the peaks is a measure of the barrier properties of deposited films.
3.3 Electrochemical Quartz Crystal Microbalance
The investigation of processes which take place at the electrode during electrochemical reactions is demanding. The techniques used should preferably be non-invasive as any chemical modification of the system tends to interfere with the sensitive electrochemical reactions. Analysis by techniques from the solution side is complicated by the solvent in which the electrode is immersed. Examples of techniques that can be easily integrated into an electrochemical setup are surface plasmon resonance5,167 and the electrochemical quartz crystal microbalance (EQCM).168 In an EQCM setup, a conventional QCM (cf. Section 3.1) is incorporated into a three-electrode setup (cf. Section 3.2), as shown in Fig. 12. In the EQCM, the front electrode of the quartz crystal serves as the working electrode. The crystal is connected to the potentiostat and the impedance analyzer by means of a low pass and a high pass, respectively. This prevents interferences between the signals of the two
UU
i
BA
Fig. 11: Cyclovoltammograms of an irreversible reduction (A) and of a reversible multi-step charge transfer redox reaction (panel B).

3 Methods Electrochemical Quartz Crystal Microbalance
27
instruments. The EQCM allows for an in-situ investigation of electrochemical experiments. The current and voltage are detected by the potentiostat, whereas the QCM gives information on the mass and the viscoelastic properties of the deposited films. The EQCM has been applied to the investigation of many electrochemical processes including the deposition of conducting polymers,169 the redox activity of enzymes,170 and redox events on self-assembled monolayers.171 EQCM measurements suffer from the same pitfalls as conventional QCM experiments. Additional attention has to be paid to gas formation that appears in many electrochemical experiments. If a deposition is accompanied by bubble formation, the apparent mass of the film is smaller than the actual mass.
Fig. 12: Sketch of an electrochemical quartz crystal microbalance.

4 Experimental
28
4 Experimental
4.1 Materials
Ammonium persulfate (Sigma Aldrich), N,N’-methylenebisacrylamide (BIS, Merck), ammonium nitrate (Acros Organics), ammonium sulfate (Fluka), ammonium perchlorate (Alfa Aesar), sodium formate (Merck), and oligo(ethylene glycol) methacrylate (OEGMA, MW = 526 g mol−1, 10 PEG units in the side chain, Sigma Aldrich) were used as received. N-isopropylacrylamide (NIPAm, Acros Organics) was purified by triple recrystallization from hexane and dried under vacuum before use. The RAFT agent S,S′-bis(α,α′-dimethyl-α′′-acetic acid) trithiocarbonate was kindly provided by the group of Philipp Vana, University of Göttingen, and prepared according to Ref. 172. A sketch of the preparation is shown in Eq. 19.
S C SH
Cl ClCl
O
S S
S
HOOC COOH+ +
phasetransfercatalysis
H+
Eq. 19
All solutions were prepared with ultrapure water (arium 611VF, Sartorius, Germany). Styrene was purified by vacuum distillation and dissolved in dimethyl sulfoxide (DMSO, Acros Organics).
Human serum albumin (HSA, Sigma Aldrich) was dissolved in phosphate buffered saline (PBS, Sigma Aldrich) at a concentration of 1.25 g L−1. The 0.1 M phosphate buffer used for amperometric glucose detection contained 50 mmol L−1 potassium phosphate monobasic (Sigma Aldrich) and 50 mmol L−1 potassium phosphate dibasic (Riedel de Haën). Glucose oxidase (from aspergillus niger, type X-S, 185000 units g−1, KM = 33–110 mmol L−1) was purchased from Sigma Aldrich and used as received. D(+)-glucose monohydrate (Fluka) was dissolved in the 0.1 M phosphate buffer at a concentration of 1 mol L−1. The glucose solution was allowed to anomerize at room temperature for at least 24 h.
4.2 Electrochemically Induced Polymerization (EIP) of N-Isopropylacrylamide
4.2.1 General Procedure
The electrochemically induced polymerization (EIP) of N-isopropylacrylamide (NIPAm) was carried out in a three-electrode setup under potentiostatic control (potentiostats: IviumStat, EK Technologies, Germany; Reference 600, Gamry, USA; or PGU 10V-1A IMP, Jaissle, Germany) with a platinum plate as the counter electrode, a saturated calomel reference electrode (SCE, Sensortechnik Meinsberg, Germany), and the gold front electrode of a 5 MHz AT-cut quartz crystal resonator

4 Experimental
29
(Maxtek, CA) as the working electrode. The polymerization was induced by applying a voltage of –0.8 V vs. SCE to the working electrode for 15 min. Usually, EIP was performed at room temperature which varied between 22 and 25 °C. The influence of the preparation temperature was tested by adjusting the temperature of the solution to 40 °C. Before and after EIP, cyclovoltammograms were acquired in a potential range from 0 to –1 V with a ramp rate of 100 mV s−1. During EIP, the frequency shifts, Δf, and the bandwidth shifts, ΔΓ, were determined from impedance spectra by fitting. Impedance spectra were monitored with a network analyzer (HP4396A, Hewlett Packard or Saunders 250B).
Prior to polymerization, the quartz crystals were cleaned in a UV/ozone cleaner (Bioforce Nanosciences, USA) for 15 min. In a subsequent electrochemical cleaning step, the potential of the working electrode was cycled in 1 M sulfuric acid from 0 to –1 V at a ramp rate of 10 mV s−1 for 2 to 3 h. The reactant solution contained 0.3 mol L−1 NIPAm (the monomer), 12.5 mmol L−1 ammonium persulfate (the initiator), 3 mmol L−1 BIS (the cross-linker), and 0.25 to 0.6 mol L−1 ammonium sulfate, perchlorate, or nitrate (the supporting electrolyte). After filtration (0.2 µm PVDF filter, Titan, USA), the solution was purged with nitrogen for 10 min to remove dissolved oxygen which acts as a radical scavenger during EIP. After EIP, the quartz crystals were extensively rinsed and stored in ultrapure water at 8 °C. The film thickness was determined from the frequency shifts by applying the Sauerbrey equation (Eq. 12), assuming a hydrogel density of 1 g mL−1. The reference states were the bare crystals in air or in the reactant solution. The Sauerbrey equation holds for rigid films in air (see Section 3.1.2). Frequency shifts measured in a solvent also comprise dissipative contributions from roughness, trapped solvent, and density and viscosity of the liquid. As a consequence, the conversion of the wet frequency shifts to a Sauerbrey thickness often does not yield the geometric thickness.
4.2.2 EIP in the Presence of Chain Transfer Agents
EIP in the presence of chain transfer agents was performed in a way adapted from the procedure described above. As the reproducibility was good, the electrochemical cleaning step was skipped and the electrodes were just cleaned in a UV/ozone cleaner for 15 min prior to polymerization. The reactant solution contained 0.3 mol L−1 NIPAm, 12.5 mmol L−1 ammonium persulfate, 3 mmol L−1 BIS, and 0.25 mol L−1 ammonium sulfate. The concentration of sodium formate was 7.5 mmol L−1. The RAFT agent concentration varied between 2.5 and 15 mmol L−1. Due to the low activity of sodium formate and the poor solubility of the RAFT agent at low pH, the pH of the reactant solution was adjusted to 8.5 by addition of 6.4 vol.-% of an

4 Experimental
30
ammonia solution (25 vol.-% in water). EIP was induced by applying four voltage pulses of −0.8 V for 15 min, each interrupted by quiet periods (0 V) of 2 min.
4.2.3 Modification of RAFT Group Containing pNIPAm Films
To modify pNIPAm films that contained RAFT groups, EIP was performed in DMSO in the presence of 20 vol.-% styrene and 12.5 mmol L−1 ammonium persulfate as the initiator. Prior to immersion into the reactant solution, the frequency and bandwidth shifts of the quartz crystal were acquired in DMSO. EIP was induced by application of a potential of –0.8 V vs. a home-made silver/silver chloride pseudo-reference electrode for 15 min. After EIP, the samples were rinsed and the shifts of frequency and bandwidth were acquired in DMSO. All samples were stored in toluene at room temperature to remove ungrafted polystyrene.
4.2.4 Copolymerization with Oligo(Ethylene Glycol) Methacrylate
EIP was performed similar to the procedure described in Section 4.2.1. The reactant solution contained NIPAm and OEGMA at concentrations between 0 and 0.3 mol L−1. The total concentration of monomer was kept constant at 0.3 mol L−1. The supporting electrolyte was 0.4 mol L−1 ammonium nitrate. All reactants were allowed to dissolve in water at 8 °C for at least 12 h. The reactant solution was bubbled with nitrogen for 10 min. After immersion of the quartz crystal into the reactant solution, the first cyclovoltammogram, the polymerization, and the last cyclovoltammogram were started after 20, 30, and 55 min, respectively. After deposition, the crystals were stored in water at 8 °C for at least 24 h to guarantee for a complete removal of non cross-linked polymer. Due to adsorption of OEGMA oligomers to the gold electrode, the baseline of the quartz crystal in the reactant solution drifted strongly. As a consequence, the direct conversion of the frequency shifts in solution to a wet film thickness was impossible.
4.2.5 Preparation of Patterned Hydrogel Films
Bubble-induced pattern formation was performed on the gold front electrode of a 5 MHz quartz crystal. The crystal was cleaned in a UV/ozone cleaner for 15 min. Subsequently, the quartz was mounted horizontally. The SCE reference electrode and a ring-shaped platinum wire as the counter electrode were approached to the working electrode from the top. All three electrodes were immersed into the reactant solution which was prepared according to Sections 4.2.1 and 4.2.4. Oxygen bubbles were produced by applying a potential of +2 V to the working electrode until bubbles were visible, which typically occurred after 10 to 20 s. The duration of the positive potential pulse was kept as short as possible because the gold electrode tended to

4 Experimental
31
delaminate from the crystal due to oxidation of the chromium adhesion layer. Shortly after bubble formation, EIP was induced by a potential pulse of –0.8 V for 5 to 15 min. After EIP, the patterned films were rinsed with copious amounts of ultrapure water and were stored in water at 8 °C.
For the purpose of electrochemically directed patterning, a small, insulated microelectrode with a diameter of 300 µm was used as the counter electrode and a platinum wire served as pseudo-reference electrode. For a detailed description of the preparation of insulated microelectrodes see Section 4.3.5. The distance between the counter and the working electrode was approximately 0.1 mm. Bubble formation at the counter electrode proceeded simultaneously to EIP. Below a critical interelectrode distance, an oxygen bubble formed between the two electrodes and a hydrogel spot was deposited at the bubble location.
4.3 Characterization of Hydrogel Films
4.3.1 Determination of the Lower Critical Solution Temperature
The lower critical solution temperature (LCST) was determined from the frequency and bandwidth shifts measured in water as a function of temperature. For this purpose, the coated quartz crystal was mounted in a home-built liquid cell. The liquid cell was placed onto a heating stage and the temperature was linearly ramped from room temperature to 50 °C with a ramp rate of 0.08 K min−1. The LCST was defined as the inflection point of the frequency shift plotted versus temperature. When the transition was broad, as in the case for the p(NIPAm-co-OEGMA) films, a third order polynomial of the form Δf = Δf0 + a (T−T0) + c (T−T0)3 was fitted to the Δf-vs.-T curve and the LCST was identified with the parameter T0.
4.3.2 AFM Imaging
For AFM imaging, separate samples had to be prepared as the 5 MHz quartz crystals were too large for the sample compartment of the AFM used. For this purpose, small glass slides (1 cm × 1 cm) coated with gold and a thin layer of chromium as an adhesion promoter between the glass and the gold were used as the working electrodes. Prior to EIP, the substrates were cleaned in a UV/ozone cleaner for 15 min. The electrochemical cleaning step had to be skipped because of the poor adhesion of the gold electrodes, which easily detached upon electrochemical cleaning. EIP was performed according to the procedures for coating quartz crystals. After drying, the films were imaged with an AFM (extended multimode, NanoScope IIIa controller, Veeco/Digital Instruments) operating in tapping mode at room temperature in air.

4 Experimental
32
4.3.3 Microscopy
Patterned hydrogel films were imaged with an optical microscope (Keyence Digital Microscope VHX-500F with VH-Z100R optics) in air and with a confocal laser scanning microscope (Leica, Germany, 63× magnification, NA 1.2 water immersion objective, scanner TCS SP2) either in air or in water after staining with a diluted aqueous solution of rhodamine B. In the latter case, the fluorescence originating from the adsorbed dye was excited at a wavelength of 543 nm and detected in the range of 550 to 750 nm. When glucose oxidase was encapsulated in the films, the dye was omitted because the enzyme contains a fluorescent flavin group.
4.3.4 Protein Adsorption Test
The adsorption of human serum albumin (HSA) to the hydrogel films was investigated with a quartz crystal microbalance. The quartz was placed into a liquid cell that was filled consecutively with phosphate buffered saline (PBS) and with HSA dissolved in PBS. The protein was allowed to adsorb to the surface for at least 60 min and was removed by rinsing with copious amounts of PBS. The frequency shifts determined in PBS after rinsing were used to quantify the adsorption of HSA to the films.
4.3.5 Amperometric Glucose Detection
Platinum microelectrodes were prepared by melting a glass pipette around a platinum wire with a diameter of 0.5 mm. The glass was polished with sand paper and 0.3 µm alumina powder until the tip of the platinum wire was exposed. The electrodes were electrochemically cleaned in 1 M sulfuric acid. Prior to EIP, 1 g L−1 glucose oxidase was added to the reactant solution and the enzyme was allowed to adsorb to the electrode surface for 20 min. Note that the enzyme is adsorbed to the surface before EIP. Subsequent steps were performed in the same way as EIP on quartz crystals (see Section 4.2.4). The coated electrodes were rinsed with water and stored in PBS at 8 °C for at least one week.
For amperometric glucose detection, the microelectrodes were immersed in 0.1 M phosphate buffer in a temperature-controlled glass cell. The temperature of the solution was 25 or 37 °C. The coated platinum microelectrode was used as the working electrode in a three-electrode setup with a platinum counter electrode and a saturated calomel reference electrode. Glucose was added at small aliquots. The stationary current was measured at +0.65 V vs. SCE in a quiescent solution. For the determination of the Michaelis constant and the maximum current, the current was plotted versus the glucose concentration and the following function was fitted (using Microcal Origin 6.0) to the curves:

4 Experimental
33
glucoseappM
glucoseappmax
cKci
i+
⋅= Eq. 20
with i the current, imaxapp the apparent maximum current at the saturation level,
cglucose the glucose concentration, and KMapp the apparent Michaelis constant as
determined by electrochemical oxidation of hydrogen peroxide produced upon oxidation of glucose (see Eq. 8).

5 Results – EIP of NIPAm General Procedure
34
5 Results
5.1 Electrochemically Induced Polymerization of N-Isopropylacrylamide
5.1.1 Formation of Thermoresponsive Hydrogel Films
Fig. 13 shows a typical data set obtained during the electrochemically induced polymerization (EIP) of N-isopropylacrylamide (NIPAm) at room temperature with 0.6 mol L−1 ammonium nitrate as the supporting electrolyte.
-2
0
D
C
B
A
Δf [k
Hz]
-0.1
0.0
0.1
ΔΓ
[kH
z]
-4
-2
0
j [m
A c
m−2
]
-20 0 200
50
dS [n
m]
t [min]
Fig. 13: Typical data set of EIP of NIPAm in NH4NO3 at −0.8 V for 15 min. The frequency shift Δf (A), the bandwidth shift ΔΓ (B), and the current density j (C) are plotted versus the polymerization time (t = 0 was set to the point where the voltage was applied). The thickness dS in Panel D was calculated from Δf, using the Sauerbrey equation. The overtones used were 15 (□), 25 (○), and 35 MHz ( ). Before and after EIP, cyclovoltammograms were acquired as indicated by the arrows in Panel A.

5 Results – EIP of NIPAm General Procedure
35
The frequency (Panel A) decreases when the voltage is applied to the electrode. The shift in frequency results from the deposition of a polymer film at the surface. The frequency shifts were converted to a film thickness (Panel D) using the Sauerbrey equation (Eq. 12). For this particular experiment, the final wet and dry film thicknesses were 61 nm and 38 nm, respectively (data not shown). In the beginning, the deposition is fast and slows down after about three minutes as indicated by a kink in the frequency shift and thickness curves. Presumably, this slowing-down results from a blocking of electrochemically active surface sites by the pNIPAm film. The hydrogel film grows in a collapsed state, which can be concluded from the small bandwidth shifts (Panel B). A collapsed film acts as a barrier to the diffusion of reactants toward the electrode surface and reduces the rate of polymerization. The limited permeability of pNIPAm hydrogel films was proven by cyclic voltammetry in the presence of potassium ferricyanide where the peak currents decreased after coating the electrode (data not shown, cf. Refs. 89 and 93). The collapse of the pNIPAm film in the reactant solution at room temperature can be related to the presence of supporting electrolyte and reactants and will be discussed in detail in Section 5.1.5. Formation of a hydrogel film also decreases the current density during EIP (Panel C). The current peaks, initially, and then rapidly drops. The shape of the current density curve is not only related to the formation of the hydrogel film but the charging of the double layer and Cottrell diffusion (see Section 3.2.1) contribute to the current, as well. The charging of the electrical double layer is much faster than the polymerization process. The double layer current usually drops to values close to zero in less than 5 s and can be neglected. The Cottrell current can be calculated according to Eq. 16 with a persulfate diffusion coefficient of 1.2×10⁻⁵ cm2 s−1.85 The calculation shows that after 30 s, the current measured during EIP exceeds the Cottrell current by a factor of 10. Hence, Cottrell diffusion will be neglected in the following discussions, as well. After EIP, the frequency (Panel A) still decreases slightly. Seemingly, a swelling equilibrium was not reached during EIP and the hydrogel took up additional water after the voltage was switched off. The results in Fig. 13 fit well to earlier results obtained for EIP of NIPAm.93
The cyclovoltammograms acquired in the reactant solution before and after the polymerization are shown in Fig. 14.

5 Results – EIP of NIPAm General Procedure
36
-1.0 -0.5 0.0-10
-5
0
j [m
A c
m−2
]
U [V]
The cyclovoltammogram acquired before EIP shows a broad peak between –0.7 and −1 V. This shoulder originates from the overlap of the initiator reduction peak at −0.8 V and the peak of hydrogen formation at –1 V. After EIP, the shoulder disappears and the current density decreases, indicating that the rate of persulfate decomposition is reduced. Presumably, the initiator is depleted at the surface during EIP and its diffusion is hindered by the collapsed hydrogel film. An additional indistinct shoulder appears before EIP at a potential of –0.4 V. This shoulder is not correlated to the initiator reduction as evidenced by the absence of hydrogel formation at this potential. A possible origin of this shoulder are surface oxides on the gold electrode which are reduced during the first cyclovoltammetric scan.
In general, pNIPAm films produced by EIP show excellent adhesion. Delamination of the films upon storage in water was never observed, even not after months. This finding implies that cross-linked or covalently grafted hydrogel films were formed.
5.1.2 Swelling Behavior
The lower critical solution temperature (LCST) of pNIPAm films was determined in water from the frequency shifts of the coated quartz crystal as a function of temperature. Fig. 15 shows typical deswelling curves (the temperature ramp goes from low to high temperatures).
As a result of the expulsion of water from the hydrogel, the frequency (Panel A) increases with temperature. This shift is particularly strong between 24 and 32 °C. In
Fig. 14: Cyclovoltammograms acquired with 100 mV s−1 in the reactant solution before (—) and after (—) EIP of NIPAm. The scan was started towards negative potentials, as indicated by the arrows. After the formation of the hydrogel film, the shoulder at –0.8 V resulting from persulfate reduction was much smaller and the overall current density was reduced.

5 Results – EIP of NIPAm General Procedure
37
the present work, the LCST is defined as the inflection point of the curve in this temperature range. In this particular case, the LCST of the hydrogel was 30 °C. For bulk pNIPAm, the LCST is about 32 °C. The bandwidth shifts (Panel B), which are a measure of the film’s softness, decrease upon collapse. Clearly, the hydrogel densifies and forms a rigid film when the water is expelled. Interestingly, the frequency still increases after the deswelling transition. The bandwidth shows a similar behavior. This finding can be explained by an ongoing release of water from the network. Free pNIPAm often contains many hydrated amide groups, even at temperatures much above the LCST.173 As a consequence, dehydration can still occur at higher temperatures. Similar findings of dehydration above the LCST have been reported by Biggs and Ishida56 and others.
The shifts of frequency and bandwidth of the bare crystal are a function of temperature, as well. The effect mostly is a consequence of the temperature dependent viscosity of the liquid. However, the dependence of frequency on temperature between 25 and 35 °C is almost linear with a slope of 6 Hz K−1. The effect caused by the collapse of pNIPAm exceeds the shifts of the bare crystal by a factor of 10.
-2
0
B
A
Δf [k
Hz]
20 30 40 50
0.0
0.5
ΔΓ
[kH
z]
T [°C]
Fig. 15: Frequency shifts Δf (Panel A) and bandwidth shifts ΔΓ (Panel B) of a quartz crystal coated with pNIPAm. The shifts of frequency and bandwidth were determined in water as a function of temperature. The overtones used were 15 (□), 25 (○), 35 ( ), and 45 MHz ( ). The LCST was determined from the inflection point of the Δf curve acquired during the deswelling of the film.

5 Results – EIP of NIPAm General Procedure
38
The swelling ratio of the films, Q, was determined from the Sauerbrey thicknesses measured in wet (100% relative humidity) and in dry air (1 to 2% relative humidity)
S,1%r.h.
S,100%r.h.
dd
Q = Eq. 21
where dS,100%r.h. and dS,1%r.h. are the Sauerbrey thicknesses at 100 and 1% relative humidity, respectively. Here, 100% r.h. implies a saturated atmosphere. A wet filter paper in contact with a water reservoir was placed into the chamber and allowed to equilibrate with the chamber over night. Typical swelling ratios of the pNIPAm films were between 1.7 and 2. They were largely independent of the preparation conditions. For a bulk hydrogel, the degree of swelling often is much larger. When a hydrogel is fixed to a surface, the swelling becomes anisotropic.58 Usually, swelling in the vertical direction notably exceeds the lateral swelling due to the constraints imposed by the substrate. This reduces the overall degree of swelling. In addition, the degree of cross-linking of the films may be higher than for a hydrogel prepared under the same conditions in the bulk. As will be discussed in detail in Section 5.1.4, self-cross-linking occurs at the surface and introduces additional cross-links to the hydrogel film which reduce its swellability.
5.1.3 Surface Morphology
The surface morphology of electrochemically prepared pNIPAm films was investigated with an AFM on dry films in air. A typical image is depicted in Fig. 16.
The film produced in the presence of nitrate shows a homogeneous structure on the microscopic scale. On the nanoscale, small globules with a characteristic size of about
Fig. 16: Surface morphology of a dry pNIPAm film produced at room temperature in 0.6 M NH4NO3 imaged with an AFM operating in tapping mode in air.

5 Results – EIP of NIPAm General Procedure
39
50 nm are observed. Presumably, these globules are microgel domains. Their formation is believed to proceed similar as for bulk hydrogels. One may envision different processes leading to the formation of surface-attached microgels.
- Newly formed polymer chains are preferentially found at places, where initially formed hydrogel prevents the desorption of the new chains.
- Polymerization is an exothermic process and may locally increase the temperature. At these locations, hydrogel precipitation is enhanced. Cross-linking fixes the collapsed domains, thus producing microgels.
- Temperature fluctuations locally influence the rates of reaction and diffusion which induces local heterogeneities, as well.
- At low surface coverage, the probability of intramolecular cross-linking reactions is high. Intramolecular cross-linking at early stages of the polymerization produces small, highly cross-linked microgel domains.
5.1.4 Influence of the Cross-Linking Reaction
To check for the influence of the cross-linking reaction, EIP was performed in the presence and in the absence of the cross-linker (Fig. 17). A detailed study on the film thickness as a function of cross-linker concentration was reported in Ref. 93 and is not repeated here.
Green circles in Fig. 17 denote polymerization in the presence of cross-linker. The frequency decreases with time (Panel A) and the curve shows a kink after approximately three minutes. The bandwidth shift (Panel B) scatters strongly but does not change significantly during EIP, indicative of the formation of a collapsed film. Initially, the current density (Panel C) peaks. It drops rapidly as EIP proceeds. The frequency shifts (Panel A) show a different behavior when the cross-linker is omitted. In this case, EIP slightly speeds up with time, rather than slowing down. The acquisition of cyclovoltammograms causes significant frequency shifts. The final film thicknesses were 33 and 50 nm in the reactant solution and 22 and 8 nm in air with and without cross-linker, respectively. After storage in water for two days, the dry thickness of the film produced without cross-linker decreased to a constant value of 4 nm. Without cross-linker, the bandwidth (Panel B) increases during EIP, indicative of the formation of a soft film. The current densities are almost the same; blocking of the surface occurs in both cases.

5 Results – EIP of NIPAm Influence of Cross-Linking
40
The experimental findings suggest the following picture of the mechanisms of EIP in the presence (A) or absence of cross-linker (B) (Fig. 18). In the presence of cross-linker (Panel A), the polymerization proceeds via a microgel state (I, II). Macrogelation occurs at a later stage by cross-linking of the microgel domains (III). Cross-linking copolymerization results in rigid, inhomogeneous films which cause a small bandwidth shift.
-1
0A
Δf [k
Hz]
-0.1
0.0
0.1B
ΔΓ
[kH
z]
-4
-2
0 C
j [m
A c
m−2
]
0 50
0
25
50 D
dS [n
m]
t [min]
Fig. 17: Shifts of frequency Δf (A) and bandwidth ΔΓ (B) on the 15 MHz overtone, current density j (C), and Sauerbrey thickness dS (D) during EIP without (□) or with (○) 3 mmol L−1
cross-linker in 0.25 M (NH4)2SO4. The arrows in Panel A indicate the acquisition of cyclovoltammograms.

5 Results – EIP of NIPAm Influence of Cross-Linking
41
Without cross-linker (Panel B), non cross-linked pNIPAm chains form during the induction period (I). At a critical chain length, these chains collapse due to the presence of sulfate ions and adsorb to the electrode surface. The collapsed chains are softer and less dense than their cross-linked analogs and cause a shift of bandwidth (Fig. 17 B). As EIP proceeds, the polymer concentration at the interface increases and entanglements of the chains appear (II). Desorption of short chains becomes less probable due to entanglements which results in an increased frequency shift at a later stage of the deposition (Fig. 17 A). At even higher polymer concentrations, the diffusion of the reactants to the surface will be hindered and the reactants are depleted at the electrode. In this situation, radicals attack the polymer chains located at the surface (III) resulting in chemical cross-linking of these chains. Upon rinsing with water, the non cross-linked chains dissolve which explains the much smaller film thickness in air (IV). Self-cross-linking of polymer chains produced by EIP has been suggested by Cram et al. even for polymers like poly(methylmethacrylate), where self-cross-linking in the bulk is rare.92 Gao and Frisken reported on self-cross-linking reactions of pNIPAm at high polymer concentrations.174,175 They investigated the
Fig. 18: Sketch of the deposition mechanisms for EIP in the presence (A) or in the absence (B) of a cross-linker. Red dots represent chemical cross-links. A: Cross-linking copolymerization yields cross-linked microgel domains at early stages of the polymerization. B: Without cross-linker, chemical cross-linking appears at later stages when the concentration of polymer chains at the surface is high.

5 Results – EIP of NIPAm Influence of Cross-Linking
42
formation of pNIPAm microspheres by precipitation polymerization in the absence of cross-linker and proposed the self-cross-linking reactions shown in Eqs. 22 and 23.
O NH
H
O NH
P
radical
m
m MPn
PqPn
Pq
Eq. 22
O NH
H
O NH
Pm
m MradicalPn
PqPn
Pq
Eq. 23
Radicals can attack the tertiary carbon atom of the isopropyl group (Eq. 22). Abstraction of a hydrogen radical in this position gives rise to a tertiary carbon radical which is stabilized by the positive inductive effect of the adjacent methyl groups. The steric hindrance to propagation is relatively low. A second possibility is a chain transfer reaction at the hydrogen atom at the tertiary carbon atom of the polymer backbone (Eq. 23). Again, the resulting radical is stabilized by inductive effects of the neighboring groups. Due to the stronger steric hindrance by the backbone, cross-linking will less readily occur in this position as compared to the isopropyl position.
If the reaction pathways proposed in Fig. 18 hold, the surfaces of films prepared in the absence of cross-linker should be significantly smoother because the system does not pass through a microgel state. To test this hypothesis, the AFM images shown in Fig. 19 were acquired. Indeed, the surface of the pNIPAm film prepared without cross-linker (Panel A) exhibits a more homogeneous structure as compared to the sample prepared with cross-linker (Panel B). As a consequence, one may increase the homogeneity of the surface by omitting the chemical cross-linker.

5 Results – EIP of NIPAm Influence of Cross-Linking
43
However, if the films are prepared for bioanalytics applications, the sensing devices may suffer from a low signal intensity due to the smaller film thickness (and, likewise, the small amount of encapsulated species∗). It would thus be attractive to find alternative ways to improve the surface homogeneity without such a drastic decrease of the film thickness.
5.1.5 Influence of Supporting Electrolyte and Temperature
Temperature and added salt are important parameters, controlling the solubility of pNIPAm. In conventional free-radical polymerizations, the preparation temperature affects the cross-linking density26–28 and the surface morphology30 of pNIPAm. At temperatures above the LCST, the hydrogel precipitates and the rates of polymerization and reactant diffusion are increased. Added salt with a high precipitation (“salting-out”) capability in the Hofmeister sense lowers the solubility of the hydrogel, but diffusion and polymerization kinetics are expected to remain largely unaffected by the salt. As a consequence, both temperature and electrolyte concentration are attractive parameters for tuning the properties of pNIPAm hydrogel films.
∗ This is only true for biosensors that make use of enzymes which are located at a certain distance from the electrode surface. In the present work, we employ an enzyme which is adsorbed to the electrode (cf. Section 5.3.3). In this case, a thin cover layer may be beneficial for the sensor performance because the hindrance of analyte diffusion to the enzyme is low. However, the protective properties of the hydrogel film may suffer from the low thickness.
Fig. 19: AFM images acquired on pNIPAm films prepared without (A) and with (B) cross-linker in 0.25 M (NH4)2SO4 solution. The AFM was operated in tapping mode in air at room temperature.

5 Results – EIP of NIPAm Influence of Supporting Electrolyte
44
0
50
C
B
A
NH4ClO4NH4NO3
(NH4)2SO4
d S,dr
y [nm
]
0.2 0.4 0.60
50
100
c [mol L−1]
dS,
wet [n
m]
D
Fig. 20: Dry (A, C) and wet (B, D) film thicknesses plotted versus salt concentration (A, B) and type of salt (C, D). The electrolytes used were the ammonium salts of sulfate (□), nitrate (○), and perchlorate ( ) at concentrations of 0.25, 0.4 (▲), 0.5 (◄), and 0.6 mol L−1 ( ). The error bars are standard deviations determined from at least three experiments. The film thickness increases with increasing salt concentration and with increasing salting-out capability of the electrolyte.
5.1.5.1 Influence of the Supporting Electrolyte
The precipitation capability of an electrolyte is governed by its concentration55,56 and by its position on the Hofmeister scale.14 The film thicknesses obtained by EIP in the presence of different salts at various concentrations are shown in Fig. 20.176 Both the wet and the dry thicknesses increase with the salt concentration (Panel A, B). This effect can be attributed to the increasing precipitation capability of the reactant solution which leads to the formation of thick films during EIP. Presumably, the precipitation strength governs the film thickness.
The effect of the chemical nature of the salt on the film thickness is less pronounced. The dry thickness (Panel C) is highest in sulfate solutions due to the high salting-out capability of the sulfate ion as given by the Hofmeister series. The differences between nitrate and perchlorate were small and the ordering was a function of concentration. At 0.6 mol L−1, thicker films were obtained in nitrate than in perchlorate solutions. At lower concentrations, however, the relation was inverted. A

5 Results – EIP of NIPAm Influence of Supporting Electrolyte
45
change in the ordering of nitrate and perchlorate at high concentrations was also observed by Zhang et al. for the LCST of pNIPAm.14 The latter ordering (nitrate < perchlorate < sulfate) was also found for the wet film thickness measured in the reactant solution (Panel D).
The wet thickness (Panel D) measured in perchlorate was close to the thickness produced in sulfate solutions. This finding will not be discussed in detail here because the thickness measured with the QCM in a liquid environment includes contributions from trapped solvent, roughness, and the product of density and viscosity of the surrounding liquid. Because the roughness of the films differs strongly (see Fig. 22), the wet thicknesses are difficult to compare.
To quantify the precipitation capability of the electrolytes, the LCST was measured as a function of salt concentration and of the type of salt (Fig. 21). The LCST decreases with increasing salt concentration (Panel A) which correlates with the increase in film thickness. When plotting the LCST vs. the type of added salt (Panel B) one finds the lowest LCST in sulfate solutions where the film thickness (Fig. 20) is highest. The shift of the LCST follows the series sulfate > nitrate > perchlorate. For perchlorate and nitrate, this order does not correlate with the order of the thickness (Fig. 20).
The collapse of pNIPAm in water is a two-step process where dehydration of the pNIPAm segments is followed by agglomeration into larger domains.173 Interactions of a salt with pNIPAm are based on three different mechanisms: (i) the polarization of water molecules involved in hydrogen bonding, (ii) the impact on hydrophobic
0.0 0.5
25
30
c [mol L−1]
BA
LCST
[°C]
NH4ClO
4NH
4NO
3(NH
4)
2SO
4H
2O
Fig. 21: LCST as a function of the salt concentration (A) and as a function of the type of salt (B). The LCST was measured in water ( ) and in aqueous solutions of ammonium sulfate (□), nitrate (○), and perchlorate ( ) at concentrations of 0.4 (▼), 0.5 (◄), and 0.6 mol L−1 ( ). Arrows indicate that the LCST was below the accessible temperature range. The error bars are standard deviations from at least three experiments.

5 Results – EIP of NIPAm Influence of Supporting Electrolyte
46
attraction by increasing the surface tension of the cavity around hydrophobic parts of the polymer, and (iii) direct interactions with the amide groups.14,54 Strong salting-out electrolytes like sulfate mainly interact with pNIPAm by polarization, which favors the collapse of the pNIPAm segments14,54 and leads to a high film thickness during EIP. The situation in perchlorate and nitrate solutions is more complicated and deviations from the Hofmeister series can be explained in three ways.
- Precipitation. Perchlorate and nitrate interact with pNIPAm by altering the hydrophobic interactions which favors the agglomeration step. Simultaneously, direct binding to the amide groups prevents the intrachain collapse and increases the LCST. The interplay between the two processes may affect the collapse and the growth of the hydrogel, as quantified by the LCST and the film thickness, respectively, in different ways.
- Additives in the reactant solution. Precipitation of pNIPAm in the reactant solution can be altered by the presence of other components such as monomer and initiator. For instance, the reactant solution contains persulfate ions which have a salting-out effect. The latter is evidenced by the fact that the films grow in a collapsed state although the LCST in the pure salt solutions is above room temperature. The film thickness is a result of the overall precipitation capability of the reactant solution, which does not necessarily follow the same order as the shift in the LCST.
- Further interactions between salt and pNIPAm. Additional interactions between salt and pNIPAm can contribute to the deposition. For example, Kesselman et al. reported on hydrophobic interactions in the presence of sulfate ions even at temperatures below the LCST.54
Fig. 22 shows AFM images acquired on the pNIPAm films. Films produced in nitrate solutions (Images A and B) exhibit a rather homogeneous surface morphology with small-scale globules as discussed in Section 5.1.3 (Fig. 16, Fig. 23 A).

5 Results – EIP of NIPAm Influence of Supporting Electrolyte
47
The characteristic size of the globules decreases with increasing salt concentration. Presumably, at a higher salting-out capability of the solution, the microgels form in a more collapsed state, resulting in smaller and more rigid domains. Similar observations were reported by Ishida and Biggs for the collapse of grafted pNIPAm chains in sulfate solutions.56 The films obtained from perchlorate solutions (Image C)
Fig. 22: AFM images acquired on pNIPAm films produced in the presence of NH4NO3(A, B), NH4ClO4 (C, D), and (NH4)2SO4 (E, F) at concentrations of 0.5 (A, C, E) or 0.6 mol L−1 (B, D, F). The lateral heterogeneity of the surfaces correlates with the increase in film thickness.

5 Results – EIP of NIPAm Influence of Supporting Electrolyte
48
resemble the nitrate samples at low concentrations. At 0.6 mol L−1 perchlorate (Image D), large-scale heterogeneities occur and the microgel domains change their shape to a structure resembling a collapsed blister. These features can be a result of the collapse of hydrogen bubbles which form underneath dense collapsed films (Fig. 23 B). A cartoon of the mechanism of structure formation is presented in Fig. 23.176 The roughness continues to increase when sulfate is used as the supporting electrolyte (Fig. 22 E and F). At 0.6 mol L−1, dark zones appear on the AFM image which may be pores, possibly formed by delamination of the films above large hydrogen bubbles. The roughness increases in the order nitrate < perchlorate < sulfate, which correlates with the increase in film thickness. Thicker films block the access of initiator to the surface more efficiently. When the initiator is depleted at the surface, hydrogen forms underneath the film, resulting in the formation of blisters and pores which cause a rough surface upon drying. An increase of hydrogen formation with increasing salting-out capability of the electrolyte was proven by cyclic voltammetry (data not shown).
5.1.5.2 Influence of the Preparation Temperature
Fig. 24 shows the thickness of electrochemically prepared pNIPAm films in different salt solutions at room temperature and at 40 °C. The dry thickness (Panel A)
Fig. 23: Proposed mechanism of structure formation. A: In electrolytes with a low precipitation capability, a loose network forms and homogeneous films consisting of small microgel domains are obtained. B: When the film grows in a more collapsed state, hydrogen bubbles form underneath the film. The bubbles produce wrinkles upon drying. If the film is strongly collapsed, H2 bubbles can reach the critical size for delamination, resulting in the formation of pores.

5 Results – EIP of NIPAm Influence of Preparation Temperature
49
was hardly affected by the preparation temperature. The wet film thickness (Panel B) was almost constant for nitrate, it increased slightly with temperature for perchlorate, and it increased dramatically at 40 °C in the presence of sulfate. In the latter case, a strong loss of mass after EIP was observed in the QCM measurements (data not shown). Presumably, the tendency towards precipitation is high in sulfate solutions at 40 °C and the initially formed hydrogel film consists of a dense skin. When the polymerization proceeds, water and non cross-linked pNIPAm chains are trapped in the film. After EIP, surplus water and soluble polymer chains are released from the network. This explains the large difference of several hundred nanometers between the wet and the dry film thickness.
Typically, one would expect a higher film thickness at higher temperatures also for films prepared in nitrate solutions. In nitrate, the hydrogel is not fully collapsed. Raising the temperature to values above the LCST should induce full collapse of the
0
50
DB
CA
d S,dr
y [nm
]
20 30 400
200
400
dS,
wet [n
m]
T [°C]
NH4ClO4NH4NO3
(NH4)2SO4
Fig. 24: Dry (A, C) and wet (B, D) film thickness in dependence on the preparation temperature (A, B) and on the type of electrolyte (C, D). EIP was carried out at room temperature (▼) and at 40 °C (►). The supporting electrolytes used were (NH4)2SO4 (□), NH4NO3 (○), and NH4ClO4 ( ) at 0.6 mol L−1. Changing the preparation temperature had little effect on the dry film thickness, whereas the wet thickness dramatically increased understrong salting-out conditions.

5 Results – EIP of NIPAm Influence of Preparation Temperature
50
film. In the case of EIP, two opposite mechanisms are at work. On the one hand, precipitation is enhanced at high temperatures and the polymerization speeds up. On the other hand, the collapsed film is a more efficient barrier to the diffusion of reactants which slows down the speed of polymer growth. The latter aspect is evidenced by cyclovoltammograms acquired in the reactant solutions at room temperature and at 40 °C (data not shown) where the current density in 0.6 mol L−1 nitrate solutions dropped by a factor of two at 40 °C. In nitrate solutions, the enhancement of precipitation, the increased polymerization rate, and the decrease of the ease of diffusion seem to cancel out.
Images of the surface morphology of pNIPAm films prepared at different temperatures are shown in Fig. 25. As discussed in Section 5.1.5.1, the formation of large features on the surface is favored in the order nitrate < perchlorate < sulfate. Increasing the temperature has a similar effect as increasing the precipitation capability of the solution. Similar to the results reported by Suzuki et al.,30 the feature size increases with temperature. This increase is explained by two processes. First, more microgel domains form at 40 °C. Macrogelation yields a less homogeneous network. Second, thick and strongly collapsed films block the surface efficiently, hence enhancing hydrogen evolution at the electrode. As illustrated in Fig. 23, hydrogen evolution causes the formation of strongly heterogeneous films. In the case of the sulfate sample, the inhomogeneities were of microscopic nature and clearly
Fig. 25: AFM images acquired in tapping mode in air on pNIPAm films prepared in solutions of 0.6 M NH4NO3 (A,D), NH4ClO4 (B, E), and (NH4)2SO4 (C, F) at room temperature (A to C) or at 40 °C (D to F).

5 Results – EIP of NIPAm Influence of Preparation Temperature
51
visible by optical inspection of the samples. The roughness correlates with the wet film thickness.
5.1.6 Influence of Chain Transfer Agents
Chain transfer agents (CTAs) are often added to conventional free-radical polymerizations to reduce the amount of branching and self-cross-linking. Radicals from growing chain ends add to the CTA which transfers them to another radical process in a second step. In this way, one obtains linear chains with a reduced molecular weight as compared to the polymers prepared without CTA. When the CTA is a reversible addition–fragmentation chain transfer (RAFT) agent, the CTA is reformed after a radical addition step. In the case of cross-linking copolymerizations, CTAs can increase the homogeneity of the network.177 The following section reports on experiments, where CTAs were added to EIP to obtain laterally more homogeneous hydrogel films.
5.1.6.1 Addition of Sodium Formate
Sodium formate is a widely used CTA for free-radical polymerizations in water.178 Eqs. 24 and 25 illustrate possible transfer reactions.
HO
OR
HO
OR+H+
+− Eq. 24
HO
O R RHCO2 + H
+−CO2
Eq. 25
In the first step, the growing polymer chain attacks the oxygen of formate (Eq. 24). This step yields an inactive polymer chain and a formate radical which rapidly eliminates carbon dioxide (Eq. 25). The elimination reaction produces a hydrogen radical which can initiate the growth of a new polymer chain. The chain transfer reaction of sodium formate is an irreversible reaction and the chain transfer agent is consumed during the polymerization. The chain transfer reaction works best at medium to high pH where formate is deprotonated and the intermediate radical is resonance-stabilized. For this reason, the pH of the reactant solution was adjusted to 8.5. The results are plotted in Fig. 26.

5 Results – EIP of NIPAm Addition of Sodium Formate
52
EIP at high pH is significantly hindered as indicated by the small frequency shift (A) and the low Sauerbrey thickness (D). Deswelling occurs after EIP which may be a result of dissolution of non cross-linked pNIPAm chains. Addition of sodium formate enhances EIP, resulting in a wet film thickness of about 5 nm. Interestingly, the
-0.1
0.0
0.1
D
C
B
A
Δf [
kHz]
0.0
0.2
ΔΓ
[kH
z]
-0.3
0.0
j [m
A c
m−2
]
0 100
-5
0
5
dS [n
m]
t [min]
Fig. 26: Frequency shifts Δf (A), bandwidth shifts ΔΓ (B), both measured on the 15 MHz overtone, current density j (C), and Sauerbrey thickness dS (D) monitored during EIP in a basic environment in the absence (□) and in the presence of 7.5 mmol L−1 sodium formate (○). In a further experiment, the initiator ammonium persulfate was omitted ( ). EIP was induced by applying four potential pulses of −0.8 V for 15 min, each interrupted by quiet periods (0 V) of 2 min. The results demonstrate that sodium formate enhances EIP, even in the absence of initiator.

5 Results – EIP of NIPAm Addition of Sodium Formate
53
deposition rate is hardly affected by omission of the initiator ammonium persulfate; a wet film thickness of about 4 nm is obtained even without adding initiator to the recipe. The dry thickness determined in air is 8 nm in the absence of sodium formate, 27 nm in the absence of initiator, and 32 nm with both CTA and initiator. Typically, one would expect the wet film thickness to be in the same range as the dry film thickness or higher. Presumably, carbon dioxide gas is formed by the chain transfer reaction and/or by a Kolbe-like electrolysis of sodium formate, as discussed below. Gas inclusions in the film cause an increase of frequency and decrease the apparent mass. The current densities (Panel C) reveal that an electrochemical reaction takes place in all three cases. The current density in the absence of CTA increases slightly with polymerization time. No blocking of the surface appears as it was usually observed in acidic solutions. Conversely, in the presence of formate, blocking is observed. In the absence of persulfate, the current density was strongly reduced to a constant value of about –15 µA cm−2.
To get more insight into the electrochemical behavior of these systems, cyclovoltammograms were acquired in the reactant solutions as illustrated in Fig. 27. Without formate, the current density is low. A small peak at −0.8 V is observed both before and after EIP. The current density is not affected by the polymerization. The reduction of persulfate is drastically hindered in basic solution, resulting in the formation of very thin hydrogel films (see Fig. 26). Hindrance of the thermal decomposition of persulfate at high pH was reported by Beylerian et al.179 The higher decomposition rate in acidic solutions was explained by the formation of HS2O8
− where the O–O bond is weakened by polarization and more susceptible to
-1.0 -0.5 0.0
-2
-1
0BA
U [V]
j [m
A c
m−2
]
-1.0 -0.5 0.0
U [V]
Fig. 27: Cyclovoltammograms acquired before (A) and after (B) EIP in basic reactant solutions containing persulfate alone (―), persulfate and formate (―), or formate alone (―). The arrows indicate that the scan was started towards negative potentials.

5 Results – EIP of NIPAm Addition of Sodium Formate
54
decomposition. A similar mechanism may be at work in the electrochemical reduction of persulfate. In addition, HS2O8
− is less negatively charged than persulfate. As a consequence, electrostatic repulsion, which is an important kinetic factor in the direct reduction of persulfate at negative potentials,86 may be less important at low pH. When sodium formate is added to the basic reactant solution, the current density increases strongly and a narrow peak between –0.7 and −1 V appears. This peak is slightly broader before EIP (Panel A) and may contain contributions from the reduction of persulfate. The drop of the current density after EIP (Panel B) is moderate, indicative of the formation of a permeable film. When only formate is added, the narrow peak at –1 V appears again, but it is significantly smaller. After EIP, the current density is close to zero. These observations give rise to the assumption that formate works as an electro-active initiator itself, presumably caused by a Kolbe-like reaction (Eq. 26).75–77
R O
O
R O
O
R −e− −CO2 Mpolymerization−
Eq. 26
This hypothesis is supported by the cyclic voltammograms and by the film thickness detected when EIP is performed in the absence of persulfate. Usually, one would expect the Kolbe electrolysis to take place at positive potentials but it seems that at least a small amount of oxidation occurs at slightly negative potentials, as well. The difference in the wet and the dry film thickness (Fig. 26 D) indicates that a gas – potentially carbon dioxide – is formed during the deposition which may be a hint for a Kolbe-like reaction. However, gas formation is no direct proof for the Kolbe electrolysis, because the transfer reaction can yield a certain amount of carbon dioxide, as well.
At the same time, formate seems to interact with the persulfate and promotes its reduction as indicated by the shoulder in the cyclovoltammograms (Fig. 27 A) and by the increased current densities when both formate and persulfate are added to the solution (Fig. 26 C). Since the film thickness is hardly affected by the presence of persulfate, one can conclude that the initiation efficiency of the formate reaction markedly exceeds that of the persulfate reduction and dominates the polymerization. An exceptionally high initiation efficiency of the primary radicals produced by Kolbe electrolysis of trifluoroacetic acid and potassium trifluoroacetate was reported by Ogumi et al.76 They found that almost all radicals produced in the oxidation step reacted with the monomer.
To investigate the impact of sodium formate on the surface morphology, pNIPAm films were imaged with an AFM as demonstrated in Fig. 28.

5 Results – EIP of NIPAm Addition of Sodium Formate
55
The sample prepared by EIP in basic solutions is much smoother than samples prepared under acidic conditions (see Fig. 16, 22, 25). Presumably, this is related to the low film thickness obtained at high pH. In the presence of sodium formate, the root-mean-square (rms) roughness of the samples decreases from 4.9 to 4.2 nm. Based on these results, a model for structure formation can be proposed as illustrated in Fig. 29. In the absence of a chain transfer agent (Panel A), polymer chains are rapidly cross-linked at early stages of the polymerization. Microgel domains form due to inhomogeneous cross-linking reactions, e.g., caused by temperature fluctuations (cf. Section 5.1.3). Macrogelation occurs when the initially built microgel domains are interconnected, resulting in a globular surface morphology. When a CTA is added (Panel B), shorter polymer chains form and cross-linking occurs at shorter chain
Fig. 28: AFM images acquired in tapping mode on dry pNIPAm films produced in basic reactant solutions containing 0.25 mol L−1 (NH4)2SO4 and no (A) or 7.5 mmol L−1 sodium formate (B). The rms-roughness without and with formate was 4.9 and 4.2 nm, respectively.
Fig. 29: Proposed mechanism for the structure formation without (A) or with (B) sodium formate. Sodium formate decreases the tendency towards microgel formation and yields more homogeneous surface morphologies.

5 Results – EIP of NIPAm Addition of Sodium Formate
56
lengths, leading to smaller microgels and a more homogeneous surface morphology. In the case of sodium formate, it is not completely clear whether the decreasing heterogeneity of the surface is caused by the chain transfer reaction or by the increased initiation efficiency. When the initiation efficiency increases, more chains will be started, resulting in the formation of shorter chains. If shorter chains are formed, the initial microgel domains are smaller, as well, and the surface is more homogeneous.
5.1.6.2 Addition of a RAFT Agent
In order to investigate the influence of the efficiency of the chain transfer reaction on EIP and to insert functional groups which allows for a further modification of the films, a RAFT agent was added to the reactant solution. A sketch of the polymerization in presence of the RAFT agent is given in Eq. 27.172
S S
S
HOOC COOH MS S
SMHOOC COOH
(n+m) Minitiator n m
Eq. 27
The trithiocarbonate depicted in Eq. 27 is a very efficient bifunctional RAFT agent with two reactive S–R bonds. The tertiary radical produced upon cleavage of an S–R bond is stabilized by the adjacent carboxy group. During the RAFT process, the growing polymer chains insert into the S–R bonds. No additional cross-links or dangling chain ends are introduced.
The results obtained in the presence of RAFT agent are shown in Fig. 30. The shape of the curves monitored in absence of the RAFT agent was discussed in Section 5.1.6.1. Briefly, the frequency shift (Panel A), the bandwidth shift (Panel B), and the film thickness (Panel D) are low in basic solutions. EIP is followed by significant deswelling, presumably due to the dissolution of short, non cross-linked pNIPAm chains. The low film thickness is attributed to a reduced efficiency of initiator reduction as indicated by the low current density (Panel C) in the basic solution.
The strong frequency shift (Panel A) monitored in the presence of RAFT agent shows an enhancement of EIP. The shape of the curve resembles the curves typically found for EIP in acidic solutions. Again, a kink occurs after short polymerization times, indicating blocking of the surface by the hydrogel film. The wet and the dry film thicknesses are 17 and 13 nm, respectively, which is small compared to the thickness usually obtained in acidic solutions. The bandwidth shift (Panel B) is small, as well, indicative of the formation of a rigid, collapsed hydrogel film. The current density (Panel C) is significantly increased by the RAFT agent, indicating an enhanced reduction reaction. The increased current can be explained either by reduction of the RAFT agent which may then act as an initiator (cf. Section 5.1.6.1) or by an

5 Results – EIP of pNIPAm Addition of RAFT Agent
57
interaction between the RAFT agent and the persulfate which makes the latter more susceptible to reduction.
-1
0
D
C
B
A
Δf [k
Hz]
-0.1
0.0
0.1
ΔΓ
[kH
z]
-2
0
j [m
A c
m−2
]
0 100
0
20
t [min]
dS,
dry [n
m]
Fig. 30: Frequency (Δf, A), and bandwidth shifts (ΔΓ, B) on the 35 MHz overtone, current density (j, C), and film thickness (dS, D) during EIP without (□) or with (○) 5 mmol L−1
RAFT agent.

5 Results – EIP of pNIPAm Addition of RAFT Agent
58
In order to test for an electro-activity of the RAFT agent, cyclovoltammograms were acquired in a solution with 5 mmol L–1 RAFT agent in the absence of initiator. These cyclovoltammograms do not reveal any peaks that can be attributed to the reduction of the RAFT agent. In addition, the frequency shifts monitored during EIP are close to zero (data not shown). This proves that the RAFT agent itself does not act as an electro-active initiator. In the absence of RAFT agent, a very small peak is detected at −0.8 V where the initiator reduction usually takes place. Performing EIP has no impact on the shape and the height of the cyclovoltammograms and the corresponding film thickness is low (see Fig. 30). Hence, the efficiency of persulfate reduction is low at high pH. When both the RAFT agent and the initiator are added, the typical persulfate reduction peak appears at −0.8 V. After EIP, the current density drops strongly, indicative of the formation of a hydrogel film which efficiently blocks the electrode surface. The cyclovoltammograms show that the RAFT agent increases the initiation efficiency by making the persulfate more susceptible to reduction. Presumably, a complex is formed between the RAFT agent and the persulfate. Formation of a donor−acceptor complex between hydroquinone and persulfate has been reported by Santos et al.180 In their work, hydroquinone accelerated the thermal decomposition of persulfate by complex formation. It was assumed that hydroquinone acts as a proton donor in persulfate reduction. This finding was supported by a color change of the solution caused by the formation of p-benzoquinone from hydroquinone. In the case of the RAFT agent it is not obvious how it could act as a proton donor in
-1.0 -0.5 0.0-4
-2
0BA
j [m
A c
m−2
]
U [V]-1.0 -0.5 0.0
U [V]
Fig. 31: Cyclovoltammograms acquired before (A) and after EIP (B) in reactant solutions containing no initiator with 5 mmol L−1 RAFT agent (―) or both initiator and RAFT agent at concentrations of 0 (―), 2.5 (―), 7.5 (―), or 15 mmol L−1 (―). The arrows indicate that the sweep was started towards negative potentials.

5 Results – EIP of pNIPAm Addition of RAFT Agent
59
basic solutions. A color change which would occur upon decomposition of the RAFT agent has not been observed. These findings argue against a direct chemical involvement of the RAFT agent in persulfate reduction. Presumably, a charge-transfer complex forms between the RAFT agent and the persulfate which withdraws electrons from the O–O bond and makes it more susceptible to reduction.
Interestingly, the shape of the cyclovoltammograms changes at high RAFT agent concentrations where a hydrogen peak appears at –1 V. This peak can be attributed to a local decrease of the pH at the electrode surface due to the presence of carboxylic acid groups which were transferred from the RAFT agent to the hydrogel.
The film thickness as a function of RAFT agent concentration is shown in Fig. 32. Both the dry (Panel A) and the wet thickness (B) increase with the RAFT agent concentration. If the increase in thickness is related to a complex formation between the RAFT agent and the persulfate, the dependence of the thickness on concentration is expected to level off when all initiator molecules are complexed by RAFT agent molecules. For the wet film thickness, this is not the case. Presumably, the
0
10
20
B
A
d S,dr
y [nm
]
0 100
10
20
dS,
wet [n
m]
cRAFT [mmol L−1]
Fig. 32: The dry (A) and the wet (B) Sauerbrey thickness increase with the RAFT agent concentration in the reactant solution.

5 Results – EIP of pNIPAm Addition of RAFT Agent
60
incorporation of hydrophilic RAFT groups in the film increases its swelling ratio and the difference between the wet and the dry thickness increases in proportion (cf. Fig. 33). Additionally, an enhancement of EIP above the saturation concentration is possible because the acidic groups of the RAFT agent shift the pH at the surface to lower values which favors the decomposition of persulfate. The appearance of a hydrogen peak in the cyclovoltammograms (cf. Fig. 31) supports this hypothesis.
In Fig. 33, the LCST of pNIPAm films prepared in the presence of RAFT agent is plotted versus the RAFT agent concentration. The LCST increases with the amount of RAFT agent in the reactant solution. An increase of the LCST implies that the films become more hydrophilic. The R groups of the RAFT agent contain carboxylic moieties. Incorporation of the R groups into pNIPAm renders the hydrogel more hydrophilic. The shift of the LCST is particularly pronounced at concentrations of 7.5 mmol L−1. It is possible that the acidic R groups alter the pH inside the hydrogel film and, hence, change the LCST. Another explanation is that the incorporation of RAFT groups in the film is favored relative to NIPAm at higher amounts of RAFT agent in the reactant solution.
The effect that the RAFT reaction has on the surface morphology is illustrated in Fig. 34. Again, the chain transfer reaction promotes the formation of more homogeneous surface morphologies. Without RAFT agent (Image A), pNIPAm films were obtained which show the typical globular structure with microgel domains in the 40 nm range. At low RAFT agent concentrations (Images B and C), these globular structures increase in size. Presumably, this is due to the enhancement of EIP by the
0 5 10 15
30
40
50
LCST
[°C
]
cRAFT [mmol L−1]
Fig. 33: The LCST of the pNIPAm films increases with the amount of RAFT agent added to the reactant solution. The LCST at 0 mM RAFT agent was determined on a pNIPAm film prepared without RAFT agent in acidic solution.

5 Results – EIP of pNIPAm Addition of RAFT Agent
61
RAFT agent, which leads to thicker films and may accordingly increase the size of the microgel domains. At a concentration of 7.5 mmol L−1 (Image D), significant smoothening both in the lateral and in the vertical direction appears. The characteristic size of the microgel domains is reduced to 30 nm. When further increasing the RAFT agent concentration (Images E and F), the surfaces continue to smoothen. The boundaries between the microgel domains become diffuse. Again, the increased initiation efficiency may also smoothen the surface morphology (cf. Section 5.1.6.1). Presumably, the increase in surface homogeneity is related to a reduction of temperature effects and to a decrease of the size of microgel domains, as discussed in Section 2.4.
A cartoon depiction of the mechanism is given in Fig. 35. Without RAFT agent (Panel A), cross-linked microgel domains form during the initial steps. These microgel domains grow by adsorption of other small microgel particles and become cross-linked at a later stage of the polymerization. In RAFT polymerization, small chains are formed during the initial steps (Panel B). All these chains grow simultaneously. As the RAFT agent establishes a rapid equilibrium between all growing chains, local temperature fluctuations caused by the exothermic polymerization reaction are reduced compared to conventional free-radical polymerization. In addition, the number of growth steps per polymer segment is
Fig. 34: AFM images acquired on pNIPAm films prepared in the presence of 0 (A), 2.5 (B), 5 (C), 7.5 (D), 10 (E), and 15 mmol L−1 (F) RAFT agent. The AFM was operated in tapping mode at room temperature in air.

5 Results – EIP of pNIPAm Addition of RAFT Agent
62
smaller in the presence of the RAFT agent, which results in the formation of smaller microgel domains.
At first sight, the results contradict the investigations of Liu et al. on the effect of RAFT polymerization on pNIPAm hydrogels formed in a bulk reaction.106 The authors reported on a decreasing homogeneity of the network in the presence of RAFT agent. This discrepancy may be attributed to the different natures of the RAFT agents under investigation. Liu et al. used a monovalent RAFT agent which formed dangling ends, whereas the experiments presented here were conducted with a bivalent RAFT agent that inserts into the polymer backbone without forming dangling ends. Hence, the homogeneity of the hydrogel is increased by RAFT polymerization.
5.1.6.3 Modification of RAFT Group Containing Films
Incorporation of RAFT groups into pNIPAm films may open up a route to modify these films with water-insoluble monomers in a second step after EIP. So far, EIP is restricted to water-soluble monomers. Grafting of water-insoluble polymers to RAFT group functionalized pNIPAm may increase the range of polymer films that are accessible by EIP. For biosensing (see 2.6.1), modification of hydrogels with water-insoluble redox-active moieties would be attractive. Such redox-active groups can significantly increase the current of amperometric biosensors by providing electron-hopping pathways to the electrode surface.
Conventional EIP works well in water. The choice of the solvent is limited by the low solubility of ammonium persulfate in most organic solvents. When dimethyl-sulfoxide (DMSO) is used, EIP is strongly accelerated but adhesion of the films fails, indicative of a low cross-linking efficiency. For this reason, a one-step synthesis of a pNIPAm film containing water-insoluble groups in DMSO is not straightforward.
Fig. 35: Mechanism of free-radical cross-linking copolymerization in the absence (A) and in the presence (B) of a RAFT agent.

5 Results – EIP of pNIPAm Addition of RAFT Agent
63
Fig. 36: Shifts of frequency Δf (A) and bandwidth ΔΓ (B), both measured on the 15 MHz overtone, current density j (C), and Sauerbrey thickness dS (D) acquired during the modification of a pNIPAm film prepared in the presence of 10 mmol L−1 RAFT agent. EIP was performed in DMSO with 20 vol.-% styrene. Black arrows indicate the acquisition of cyclovoltammograms, red arrows indicate when the film was immersed in DMSO rather than in the reactant solution.
-3
0
D
C
B
A
Δf [k
Hz]
0
1
ΔΓ
[kH
z]
-0.1
0.0
j [m
A c
m−2
]
0 50
0
100
200
dS [n
m]
t [min]
Grafting of hydrophobic polymers to RAFT group functionalized pNIPAm was studied in preliminary experiments where EIP was performed in DMSO in the presence of styrene. A typical data set is shown in Fig. 36. The frequency shift (Panel A) was acquired in DMSO (red arrow in Panel A) prior to immersion into the reactant solution. In the reactant solution, both the frequency and the bandwidth (Panel B) drift

5 Results – EIP of pNIPAm Addition of RAFT Agent
64
strongly. Probably, this drift is caused by the adsorption of short polystyrene chains which are formed in the reactant solution. In DMSO, persulfate decomposes very quickly at room temperature as evidenced by a clouding of the reactant solution directly after dissolution of persulfate. The polystyrene chains adsorbed weakly to the pNIPAm film and could be easily rinsed off when no voltage was applied. When a voltage is applied to the coated electrode, the frequency decreases rapidly (Panel A). The film thickness (Panel D) calculated from the frequency shift was above 200 nm. Note that the calculated film thickness is just a relative measure of the deposited mass. The large bandwidth shift (Panel B) indicates strong viscoelastic contributions due to the formation of a very soft film. In addition, the frequency shifts do not scale with the overtone order (data not shown). Both findings suggest that the deposition proceeds outside the Sauerbrey regime. The current density curve (Panel C) shows the typical shape with a peak in the beginning followed by a drop of current due to blocking of the surface. After the voltage was switched off, the polymer film was allowed to equilibrate before it was rinsed with DMSO. The shifts of frequency and bandwidth acquired in DMSO show a loss of mass upon rinsing. Presumably, weakly adsorbed ungrafted polystyrene chains were rinsed off. The final thickness in DMSO was 75 nm.
Fig. 37 shows the film thickness measured after modification of a bare crystal, of a pNIPAm coated crystal, and of a crystal coated with RAFT group functionalized
0
150
300
B
A
d S,w
et [n
m]
Au 0 mM 15 mM-15
0
15
30
dS,
dry [n
m]
Fig. 37: Wet (A) and dry (B) film thickness in the reactant solution (□) or in DMSO (○) after EIP in DMSO on bare gold (left), or on pNIPAm films prepared in the presence of 0 (center) or 15 mmol L−1 RAFT agent (right).

5 Results – EIP of pNIPAm Addition of RAFT Agent
65
pNIPAm. The reference experiments on gold and on a pNIPAm film reveal that not all polystyrene chains are rinsed off in DMSO (Panel A). The amount of adsorbed polystyrene is lowest for gold and increases slightly when the electrode is coated with pNIPAm. The amount of deposited and potentially grafted polystyrene is highest when pNIPAm was prepared in the presence of 15 mmol L−1 RAFT agent. The fact that the film thickness was not affected by rinsing with DMSO indicates that the polystyrene is covalently attached to the pNIPAm via the RAFT groups in the film.
However, detection of the dry film thickness after rinsing with DMSO and toluene yielded confusing results. The dry thickness was 10 and 30 nm on gold and on unmodified pNIPAm, respectively. On grafted samples, the dry thickness was negative (even below the thickness of the initial pNIPAm film) although a polymer film was easily detectable by optical inspection. A convincing argument why the dry film thickness should be negative after grafting was not found yet.
5.2 EIP in a Lithographic Mode
Patterning is an attractive way to increase the functionality of pNIPAm coatings. Typically, patterned hydrogel films find application as array sensors where the gel pads are functionalized such that they selectively respond to different analytes. Several routes allow for a functionalization of the pads, for example by incorporation of complexing agents that trigger swelling or collapse in the presence of certain ions or by encapsulation of enzymes. Patterning can be achieved in many ways (cf. Section 2.5). Presumably, patterned films can be obtained by performing EIP in an electrochemical lithographic mode, for instance by using an SECM,122 by electrochemical dip-pen nanolithography,121 or by electrospotting.7 However, the approach used here exploits instabilities in film formation induced by oxygen bubbles on the surface. Oxygen bubbles were produced on the working electrode by water decomposition at short positive potential pulses (+2 V). Below a critical size, the bubbles do not detach and stick to the surface. In the presence of initiator, monomer, electrolyte, and cross-linker, EIP can be induced in a subsequent step. Fig. 38 illustrates the patterning procedure.

5 Results – EIP in a Lithographic Mode
66
Fig. 39 shows images of pNIPAm spots obtained by bubble-induced patterning. Image A represents a micrograph of a dry array of pNIPAm spots. Image B shows a magnification of one particular spot. The size of the spots varies, depending on the size of the bubble from which they were produced. Typical diameters of the larger spots are in the range of 130 µm. All patterns show a circular shape with a well-
defined edge. Interestingly, some spots are surrounded by a fringe where polymer accumulates. This fringe is separated from the pattern by a circular zone where the
polymer seems to be depleted. The diameter of this depletion zone is in the range of 200 µm for the particular sample shown in Fig. 39. To test for a diffusional movement
Fig. 38: Principle of bubble-induced pattern formation. In a first step, oxygen bubbles are formed on the working electrode by application of a positive potential (A). When EIP is carried out at –0.8 V in the presence of bubbles (B), patterns form on the electrode surface (C). The nature of the core of the spots is not clear as indicated by the pale green filling. Either, the hydrogel forms as a shell around the bubbles, resulting in an empty core or the patterns consist of continous hydrogel spots.
Fig. 39: Optical micrographs of an array of pNIPAm spots (A) and of an individual spot (B) produced by bubble-induced patterning. The optical contrast is increased at locations with a high polymer concentration (dark zones). The spots show a characteristic circular structure which is in some cases surrounded by a polymer depletion zone and by a zone where the hydrogel seems to accumulate. Small dark feature (< 10 µm) are irregularities of the gold surface.

5 Results – EIP in a Lithographic Mode
67
of the whole hydrogel film towards the bubble, bubbles were produced on a pre-formed pNIPAm film immersed in the reactant solution. The features imaged after application of +2 V for 10 s are depicted in Fig. 40.
Image A and B show three patterns and one particular spot at a higher magnification, respectively. The images reveal several interesting findings. First, bubble formation on pNIPAm films also causes the formation of patterns. Second, the optical contrast of the pNIPAm films is reduced at the sites where bubbles formed. This zone is less geometric than the depletion zones observed in Fig. 39. Third, inhomogeneous deposits are detected at places where bubbles have formed. Importantly, initiator decomposition also takes place at positive potentials.86 Consequently, the deposition of material may be related to EIP which occurs simultaneously to bubble formation. Again, pNIPAm seems to deposit preferentially at locations where bubbles form. The dark features observed in Fig. 40 resemble rings, indicating that pattern formation starts at the rim of the bubble. The depletion zone around the ring-shaped patterns can be a result of hydrogel movement towards the bubble, of delamination of hydrogel by the bubbles, or of deposition of additional pNIPAm around the depletion zone. This experiment cannot clarify the mechanism underlying the bubble-induced pattern formation. Further mechanistic aspects will be discussed in detail below.
The patterns were visualized in the vertical direction by adsorption of rhodamine B to the surface and subsequent imaging with a confocal microscope as shown in Fig. 41. Again, the images reveal a circular shape of the spots with a size distribution according to the varying size of the inducing bubbles. Fluorescence only appears if the dye is located at a certain distance from the surface because gold extinguishes the fluorescence near the interface. Image B represents a side view of one particular spot. The image reveals that the spot has a hemispherical shape which reproduces the shape of the bubble. It is not clear whether the interior of the spot is filled by water or by
Fig. 40: Optical micrographs of features obtained after application of +2 V for 10 s to an electrode covered with a pNIPAm film immersed in the reactant solution.

5 Results – EIP in a Lithographic Mode
68
Fig. 41: Top view of an array of pNIPAm spots (A) and side view (B) of an individual spot imaged with a confocal laser scanning microscope. Prior to imaging, a fluorescent dye was adsorbed to the hydrogel. Fluorescent zones appear green in this false color representation.
hydrogel. The fluorescence was only detected at the spot’s surface. However, it is possible that the outer surface consists of a highly cross-linked hydrogel skin that prevents the dye from penetrating into the interior.
Bubble-induced patterning is not restricted to pNIPAm. Patterning of pOEGMA is possible in the same way as demonstrated in Fig. 42. The pOEGMA spots have diameters between 10 and 30 µm and are significantly smaller than pNIPAm spots. The size of a bubble depends on the surface tension at the gas–liquid interface and may be influenced by the composition of the reactant solution. POEGMA is a macromonomer with a hydrophobic methacrylate group and a hydrophilic side chain. Possibly, it interacts with gas bubbles similar to a tenside and stabilizes small bubbles. The accumulation of material around the patterns and a depletion zone were not observed in the case of pOEGMA. Image A shows a continuous pOEGMA spot whereas Image B shows two spots with a discontinuous structure. It seems that the
Fig. 42: Optical micrographs of pOEGMA spots produced by bubble-induced patterning.

5 Results – EIP in a Lithographic Mode
69
polymerization was too short to induce full coverage of the bubble with hydrogel. The presence of rings instead of spots implies that pattern formation starts at the rim of the bubble.
The explanation why bubbles induce pattern formation is not straightforward. The results allow some speculations as listed below. However, all of these speculations suffer from inconsistencies in one way or another.
- Mass transport. Mass transport to the bubble may be enhanced by convection. Forced convection caused by detached oxygen bubbles can increase the rate of mass transport from the bulk to the electrode surface. This explains the accumulation of material at places where bubbles form. The mass transport at a bubble interface can be affected by gradients of temperature or surfactant concentration. Convection patterns around a gas bubble on a heater surface were described by Wasekar and Manglik.181 Here, a convection pattern developed around the bubble which transported cool water from the top of the bubble to the bubble base. In the case of bubble-induced pattern formation, a temperature gradient may exist between the bubble base and the outer solution which may be caused by the exothermic polymerization reaction and by an increased current density around the bubble (see Point 4). Such a temperature-induced convection pattern can enhance the transport of material to the bubble, which explains the pattern formation at the rim of the bubble. The polymer chains produced at the bubble base are hydrophobic in the reactant solution and have a hydrophilic initiator head group. They may thus behave similar to a tenside and adsorb to the bubble interface. Such a gradient in “surfactant” concentrations may induce additional convection patterns. However, the convection model does not clarify why the hydrogel covers the whole bubble.
- Preferential adsorption. As discussed previously, pNIPAm chains may act in a surfactant-like manner in the reactant solution and preferentially adsorb to the bubble surface. A detachment of short oligomeric pNIPAm chains from the location where they were produced followed by a re-attachment to the gas–liquid interface can explain the depletion zone often (but not always) observed around the spots. It also explains why polymeric material attaches to the bubble surface. An objection against this model is that oligomers adsorbed to the bubble cannot be cross-linked to the hydrogel because the diffusion of radicals is restricted to a small zone close to the electrode surface. Upon rinsing with water, the oligomers on the bubble surface would dissolve and no bubble-shaped pattern would be obtained.
- Prevented desorption. If small cavities on the rough gold surface underneath the bubble are filled with reactant solution, EIP will take place in these cavities, as well. As the gap between the cavity and the bubble is small, pNIPAm chains are

5 Results – EIP in a Lithographic Mode
70
not able to desorb and escape to the bulk by diffusion; they are trapped underneath the bubble. The initiator and the monomer are small molecules, which can still reach the cavities and new polymer is formed which blows up the initial film. There are various objections against this idea. When thinking of pOEGMA spots, it is difficult to imagine that oligomers will be prevented from desorption whereas the macromonomers are able to reach the cavities underneath the bubbles. The model can neither explain the depletion of polymer at the rim, nor the accumulation of material around bubbles, nor the bubble-like shape of the spots. The latter point could be explained by the model if the hydrogel grew into the bubble which is very improbable.
- Electrochemical effects. If the current density around the bubble is significantly enhanced, the initiator decomposition is favored at the bubble base and the hydrogel is preferentially formed in a ring around the bubble. An inhomogeneous distribution of the current density around small hydrogen bubbles was modeled by Křišt’ál et al.182 They calculated the current density around a bubble situated between a structure anode and a cathode at small distances. A similar increase of current density at the bubble interface may appear in the system studied in the present work, but again, the model fails to explain the deposition of material on the whole bubble interface.
- Unconventional interface effects. By intuition, bubble-induced patterning could be explained if the hydrogel grew like a skin around the bubble, forming a balloon-like structure. Such a mechanism would be possible if either the initiator decomposed at the gas–liquid interface or if the bubble interface would be a pathway for exceptionally fast diffusion of radicals. In both cases, polymerization and cross-linking would appear directly at the bubble interface and a balloon-like hydrogel film would form around the bubble. However, no processes that argue for these mechanisms have been reported in literature. On the other hand, bubble interfaces in such complex systems are rarely the subject of fundamental research on radical diffusion or electrochemistry.
The mechanism of pattern formation remains unclear. Possibly, it is a combination of the processes discussed previously.

5 Results – EIP in a Lithographic Mode
71
For a locally triggered pattern formation, it is necessary to induce bubble formation in a controlled way. For this purpose, bubbles were produced electrochemically in a narrow gap between an insulated counter microelectrode and the working electrode. Spots that were produced at these locations upon application of a negative potential are shown in Fig. 43. Controlling the size of the spots was difficult because the distance between the two electrodes was adjusted manually, which was poorly reproducible. Using an SECM for bubble formation would provide improved control over the deposition parameters and allow for a better size control. Image A shows a large spot obtained by localized bubble formation. This particular spot was rather thick as indicated by the dark circular feature in the center. It was surrounded by an inhomogeneous fringe which may be a result of vibrations during the deposition. A side view of a small spot to which a fluorescent dye was adsorbed is depicted in Image B. Compared to Image 41 B, this spot resembles a small droplet more than a hemisphere. As illustrated in Fig. 44, the pattern shape seems to depend on whether a hemispherical bubble forms directly on the surface or whether the bubble is produced at the opposing electrode. Image C in Fig. 43 shows a spot produced in the presence of glucose oxidase. Here, the fluorescence originating from the flavin moiety of glucose oxidase was detected. Interestingly, the symmetry of the spot seems to be reduced in the presence of glucose oxidase. Again, a small inhomogeneous fringe appears which may be a result of vibrations and bubble instabilities during the deposition. The vertical dimension of glucose oxidase containing spots appeared to be small, which may be an artifact of the preferential encapsulation of glucose oxidase at the bottom of the spot which yields a higher fluorescence intensity at this location.
Fig. 43: Spots prepared by electrochemically triggered localized pattern formation. A: optical micrograph of a large spot. B: Side view of a small spot onto which a fluorescent dye was adsorbed. C: Top view of a spot into which glucose oxidase was encapsulated.

5 Results – EIP in a Lithographic Mode
72
Fig. 43 demonstrates an advantage of bubble-induced pattern formation over conventional electrochemical lithography techniques. In electrochemical lithography, the pattern size is a function of the diameter of the counter electrode and of its distance from the surface. When pattern formation is induced by small bubbles, the pattern size is governed by the bubble size which may be much below the diameter of the counter electrode. For example, the size of the spot shown in Fig. 43 B was reduced by a factor of 10 as compared to the counter electrode (diameter 300 µm).
Fig. 45 shows an AFM image acquired on the edge of a large spot without inhomogeneous fringe. The height of this particular spot was above 5 µm. The edge of the spot was well-defined. Corona-like structures were imaged which can be a result of shrinking of the spot upon drying or of a movement of the hydrogel towards the bubble while some polymer filaments stick to the places where they were produced. To prove that the spots were formed from pNIPAm, the LCST of a dense array of hydrogel spots was measured by QCM as demonstrated in Fig. 46.
Fig. 44: Impact of the mode of bubble formation on the shape of the pattern. A: Bubble formation on the working electrode yields hemispherical patterns. B: Forced bubble formation in the gap between a counter microelectrode and the working electrode gives rise to droplet-like patterns.
Fig. 45: AFM image acquired in tapping mode in air on the edge of a large hydrogel spot.

5 Results – EIP in a Lithographic Mode
73
0
1
2
B
A
Δf [
kHz]
20 30 40
0
2
ΔΓ
[kH
z]
T [°C]
Both the frequency (Panel A) and the bandwidth shift (Panel B) show an inflection point at 31 °C which is close to the bulk LCST of pNIPAm. Interestingly, the frequency decreases upon collapse. The opposite would be expected if the spots were acoustically thin in the Sauerbrey sense.162 This is not the case, as also evidenced by the optical images (see, for example, Fig. 43 B). Since the thickness of the spots is much larger than the penetration depth of the acoustic shear wave, the gel forms a semi-infinite medium in the Kanazawa sense.163,164 Upon collapse, the material’s viscosity increases, decreasing the frequency in proportion.
The investigations show that bubble-induced pattern formation is an attractive alternative to conventional patterning techniques although the mechanism needs further investigation. In addition, the control over bubble formation was poor. Using an SECM or electrochemical dip-pen nanolithography to induce the bubble formation may improve the control over the pattern size. It may also be attractive to test further approaches that allow for a localized deposition of hydrogel films. For instance, electrochemical dip-pen nanolithography or the SECM technique in combination with EIP may be useful alternatives to bubble-induced patterning.
Fig. 46: Shifts of frequency (Δf, A) and bandwidth (ΔΓ, B) measured on the 15 MHz overtone as a function of temperature. Both Δf and ΔΓ decrease at the LCST of pNIPAm.

5 Results – Copolymerization of NIPAm and OEGMA
74
5.3 Copolymer Films of NIPAm and Oligo(Ethylene Glycol) Methacrylate
5.3.1 EIP of N-Isopropylacrylamide and Oligo(Ethylene Glycol) Methacrylate
In order to combine the thermoresponsive properties of pNIPAm with the antifouling properties of oligo(ethylene glycol) methacrylate (OEGMA), cross-linked copolymer films of the two monomers were prepared. Two typical data sets measured during EIP are shown in Fig. 47. In the absence of OEGMA, EIP proceeds in the well-known way (cf. Section 5.1.1). Briefly, application of a voltage causes a negative frequency shift (Panel A). The bandwidth (Panel B) remains constant, indicative of the formation of a rigid, collapsed hydrogel film. The current density (Panel C) drops rapidly as the polymerization proceeds, which is attributed to blocking of the electrode
0
2
C
B
A
Δf [k
Hz]
0.0
0.2
ΔΓ
[kH
z]
-30 0 30-4
-2
0
2
j [m
A c
m−2
]
t [min]
Fig. 47: Frequency shift (Δf, A), bandwidth shift (ΔΓ, B), both determined on the 15 MHz overtone, and current density (j, C) measured during EIP in a solution containing 100 (□) and 67 mol-% (○) NIPAm with 0 and 33 mol-% OEGMA, respectively.

5 Results – Copolymerization of NIPAm and OEGMA
75
by the collapsed film. The film acts as a barrier to the diffusion of reactants to the electrode and slows down the further polymerization.
When OEGMA is added to the solution, the frequency decreases strongly even before application of a voltage (Panel A). Presumably, the oligomeric monomer adsorbs to the gold surface. The adsorption of OEGMA prior to EIP is a reversible process and the adsorbed monomer can be completely removed by rinsing with water. When a voltage is applied to the system, OEGMA is fixed to the surface by cross-linking and copolymerization with NIPAm. The frequency shift curve shows no change in slope when EIP starts but it stops to decrease after about 10 min. The bandwidth (Panel B) increases during EIP and reaches a constant value after about 10 min, as well. The current density (Panel C) is reduced by the presence of OEGMA which supports the hypothesis that OEGMA adsorbs and blocks the electrode surface. The strong drift in frequency due to adsorption of OEGMA prevents the determination of a stable baseline. As a consequence, the frequency shifts cannot be used for the calculation of a wet film thickness.
A plot of the dry film thickness as a function of the amount of NIPAm in the reactant solution is presented in Fig. 48. The film thickness is highest for the pOEGMA homopolymer and lowest for the pNIPAm homopolymer. At NIPAm contents between 67 and 33 mol-% in the reactant solution, the film thickness remains constant at about 50 nm. The model shown in Fig. 49 illustrates the growth process. The pNIPAm homopolymer film grows in a collapsed state (Panel A, cf. Sections 5.1.1 and 5.1.5). Copolymerization with OEGMA yields a more hydrophilic hydrogel with an increased swelling ratio in the reactant solution. As a result of the more open
0 50 1000
50
100
d S,dr
y [nm
]
amount NIPAm [mol-%]
Fig. 48: Dry Sauerbrey thickness of p(NIPAm-co-OEGMA) films as a function of the amount of NIPAm in the reactant solution. The thickness decreases with increasing amount of NIPAm.

5 Results – Copolymerization of NIPAm and OEGMA
76
network structure, the diffusion of initiator to the surface is less hindered and the film thickness increases. Presumably, the dangling ends inserted by the OEGMA cause a further opening of the network. In addition, OEGMA has a higher molecular weight and the deposited mass increases (see Panel B). Another reason why a plateau appears in this regime may be the influence of adsorption of the macromonomer. The pOEGMA homopolymer (Panel C) has the highest thickness which again is a result of the open network structure and the higher molecular weight of the macromonomer.
Fig. 50 shows the LCST as a function of the amount of NIPAm in the reactant
0 50 10020
40
60
LCST
[°C
]
amount NIPAm [mol-%]
Fig. 50: LCST of copolymer films measured in water as a function of the amount of NIPAm in the reactant solution. The arrow indicates that the LCST was above the experimental range. The LCST is increased by incorporation of OEGMA in the copolymer films.
Fig. 49: Model suggested for the formation of hydrogel films of pNIPAm (A), pOEGMA (C) and their copolymers (B). Increasing the OEGMA content in the copolymer yields a more open structure and a higher film thickness.

5 Results – Copolymerization of NIPAm and OEGMA
77
solution. The LCST of the copolymer films increases with the amount of OEGMA in the reactant solution. The increase in the LCST proves that both monomers were incorporated into the copolymer. The shift in the LCST is proportional to the hydrophilicity of the films which is governed by the ratio of OEGMA to NIPAm incorporated into the hydrogel. Adding a small amount of OEGMA to the reactant solution causes a strong increase of the LCST of more than 10 °C. Presumably, OEGMA is preferentially incorporated into the hydrogel which may be related to the adsorption of the chains to the surface. As the OEGMA is located at the surface where the reaction takes place, its fractional content in the hydrogel may be increased. Above 3 mol-% OEGMA, the LCST increases linearly with increasing OEGMA content in the reactant solution. The increase of the LCST is accompanied by a broadening of the curves and a decrease of the swelling amplitude (data not shown). Such a behavior was also reported by Ma et al.35 as well as by Wu and co-workers41,42 who attributed the broadening to a microphase separation of the p(NIPAm-co-OEGMA) system at temperatures between the LCSTs of the two homopolymers.
AFM images acquired on copolymer films of various compositions are depicted in Fig. 51. The roughness of the films increases with the OEGMA content. At high amounts of OEGMA, the films show pancake- and mushroom-like structures. The pNIPAm homopolymer (Panel A) exhibits a globular structure on the nanoscale (cf. Fig. 16). The globules increase slightly in size when OEGMA is added at low
Fig. 51: AFM images acquired on copolymer films of NIPAm and OEGMA obtained from reactant solutions containing 0 (A), 5 (B), 16 (C), 33 (D), 67 (E), and 100 mol-% OEGMA(F).

5 Results – Copolymerization of NIPAm and OEGMA
78
concentrations (Panel B). At 16 mol-% OEGMA content (Panel C), pancake-like structures appear in addition to the small globules. These pancakes possibly are the result of phase separation between the hydrophilic pOEGMA and the hydrophobic pNIPAm segments in the hydrogel. A further increase of the OEGMA content to 67 mol-% (Panel D) has no impact on the number of pancakes. At even higher OEGMA concentrations, the amount of pancakes decreases (Panel E). No pancakes are imaged on pOEGMA homopolymer films (Panel F). The fact that the number of pancakes is highest around the 1:1 mixture supports the hypothesis that they are a result of phase separation. Mushroom-like features are observed on the films at OEGMA concentrations above 33 mol-% (Panel D to F). The size of the mushrooms increases with the OEGMA content. Probably, mushrooms are OEGMA (not polyOEGMA) aggregates that were not completely dissolved. An incomplete dissolution of OEGMA was evidenced by the turbidity of the reactant solution. The fact that OEGMA was not completely dissolved complicates the interpretation of the QCM data because adsorbed globules of the macromonomer also contribute to the frequency shift. The thickness reported in Fig. 48 should thus be treated with care. The sub-structure of pOEGMA homopolymer films is again dominated by globules with characteristic sizes of about 25 nm.
The investigations clearly prove that EIP is a well-suited technique to produce p(NIPAm-co-OEGMA) hydrogel coatings on conducting substrates.
5.3.2 Fouling Properties
The potential of p(NIPAm-co-OEGMA) films to serve as protein-repellent (“antifouling”) coating was tested by adsorption experiments with the water-soluble blood serum protein human serum albumin (HSA) in phosphate buffered saline (PBS). The frequency and bandwidth shifts measured in response to adsorption of HSA are shown in Fig. 52. The shifts of frequency and bandwidth monitored on an uncoated gold surface serve as a reference because gold is a good fouling material. The frequency and bandwidth shifts on gold were approximately –65 and 40 Hz, respectively. When the gold was coated with pNIPAm, pOEGMA, or their copolymers, no adsorption of HSA was detected.

5 Results – Copolymerization of NIPAm and OEGMA Fouling Properties
79
These findings are in line with earlier experiments. POEGMA has often been referred to as an antifouling coating.25,31,35 PNIPAm films produced by EIP have been tested in cell culture where the adsorption of human umbilical vein endothelial cells was prevented by the homopolymer film.183 In the latter case, the adsorption could be triggered by the addition of fibronectin to the surface. A surface where the adsorption of proteins or cells can be triggered by addition of certain proteins or peptides is called “low-fouling”. In the present work, a discrimination between antifouling (protein adsorption is always prevented) and low-fouling properties was not carried out. The films will be referred to as “non fouling” coatings.
5.3.3 Amperometric Detection of Glucose
Fig. 53 shows the results of amperometric glucose detection using platinum micro-electrodes covered with homopolymers of NIPAm and OEGMA and the copolymers of the two into which glucose oxidase was encapsulated. In Panel A, the currents of platinum microelectrodes coated with pNIPAm and pOEGMA homopolymers at 25 °C are plotted versus the glucose concentration in the solution. As a reference experiment, the current was determined on a platinum electrode onto which glucose oxidase was adsorbed. All three curves show the typical Michaelis–Menten kinetics with a linear increase of the current with concentration at low glucose levels and
-50
0
B
AAu
Δf [H
z]
0 50 1000
20
40
Au
ΔΓ
[Hz]
amount NIPAm [mol-%]
Fig. 52: Frequency shifts Δf (A) and bandwidth shifts ΔΓ (B) monitored in PBS after adsorption of HSA. A reference experiment was performed on a bare gold surface. The low shifts of frequency and bandwidth indicate that all films prevent the adsorption of HSA.

5 Results – Copolymerization of NIPAm and OEGMA Amperometric Glucose Detection
80
saturation at high glucose concentration. This proves that glucose oxidase was encapsulated in the hydrogel during EIP and that the enzyme is active in the film. This finding is not trivial. EIP is a free-radical process where the radicals potentially attack the enzyme and destroy its active sites. Fig. 53 A demonstrates that at least a part of the enzyme molecules remained active.
To quantify the results, the maximum current imaxapp (Panel B) and the Michaelis
constant KMapp (Panel C) were determined from the current curves by fitting. The
highest current was detected for pOEGMA at 25 °C. In phosphate buffer, the LCST of pOEGMA is 30 °C (data not shown). As a consequence, the film is swollen at 25 °C, which explains the high maximum current (see Fig. 54 B). All other copolymers are
0 1000
100A
amount NIPAm [mol-%]
i [nA
]
cglucose [mmol L−1]
0 1000
50C
B
KM
app [m
mol
L−1
]
0
100
200
i max
app [n
A]
Fig. 53: A: Current at 25 °C as a function of glucose concentration measured with a bare platinum microelectrode with adsorbed glucose oxidase ( ) and with microelectrodes covered with a pNIPAm ( ) or a pOEGMA film ( ) with encapsulated glucose oxidase. B, C: Maximum current imax
app (B) and Michaelis constant KMapp (C) determined from the current
by fitting, at 25 (○) or at 37 °C (□) versus the amount of NIPAm in the reactant solution. The filled symbols represent reference data determined with an uncoated platinum microelectrode with adsorbed glucose oxidase. Both KM
app and imaxapp are mean values determined from at
least two experiments.

5 Results – Copolymerization of NIPAm and OEGMA Amperometric Glucose Detection
81
collapsed and the currents are about 14 nA, independent of both the copolymer composition and the temperature (see Fig. 54 A). Small variations of the current are related to differences in the electrode areas. The temperature dependence of the enzyme reactivity is small, as well, as evidenced by the reference experiments. The maximum current detected with collapsed films is close to the reference value which is the current range of an adsorbed monolayer of glucose oxidase.
The Michaelis constant (Panel C) is a measure of the regime of linear sensor response. It varies between 20 and 60 mmol L−1, which is in the same range as the values of 30 to 110 mmol L−1 reported for glucose oxidase in solution. The Michaelis constant depends strongly on both the copolymer composition and the temperature. At 25 °C, the Michaelis constant increases linearly with the amount of OEGMA in the film. Presumably, this increase is related to an increasing swelling ratio. The maximum Michaelis constant is found for the pOEGMA homopolymer, where the highest maximum current is obtained, as well. At 37 °C, the dependence of the Michaelis constant on the copolymer composition is inverted, indicating that different phenomena influence the enzyme’s properties, here. The dependence of the Michaelis constant on composition is much less pronounced at 37 °C and may be a result of the increasing hydrophobicity with decreasing OEGMA content. Similar observations were made by Schuhmann et al. for glucose oxidase encapsulated in electrodeposition paints.66 Fig. 54 summarizes the results in a model for the sensors’ temperature response taking into account changes in the hydrogel structure.
The results clearly prove that glucose sensors can be easily prepared by EIP. Presumably, the potential of electrochemically prepared hydrogel films in
Fig. 54: Model for the processes causing the temperature response of a pNIPAm (A) and a pOEGMA (B) hydrogel sensor with encapsulated glucose oxidase (green points) operating in phosphate buffer.

5 Results – Copolymerization of NIPAm and OEGMA Amperometric Glucose Detection
82
amperometric biosensing has not yet been driven to its limit. In the future, if may be interesting to relate the thickness and the surface morphology of a film to the performance of the sensing device. Depending on the application, roughness and film thickness may have a tremendous effect on the sensor response. In addition, adjusting the degree of swelling is of practical importance. In the present work, the operation temperature triggered the accessibility of the enzyme due to the thermoresponsive behavior of the matrix material. Thermoresponsive biosensors may open up routes to discriminate between the analyte and interfering species. For instance, one could employ size differences in combination with the accessibility of the enzyme to modulate the sensors’ signal. At present, the current of pOEGMA sensors upon detection of glucose did not exceed 0.15 µA. Modification of the films with redox-active moieties such as vinylferrocene may significantly increase the sensitivity by providing electron-hopping pathways to the surface.
With regard to the production of a hydrogel array sensor, amperometric detection of the biorecognition event is typically not the method of choice. Electrochemical read-out of a large array of gel pads requires a strong electronic and computational effort which is not in line with the demand for low-cost multiple-response sensing devices. Development of other detection mechanisms that allow for an optical read-out, for instance by surface plasmon resonance, would be attractive. A route towards an optical read-out may be to tune the swelling of the hydrogel pads in a way that each pad swells or deswells selectively in response to a certain analyte.

6 Conclusions
83
6 Conclusions
Thermoresponsive hydrogel films of pNIPAm, pOEGMA, and their copolymers were prepared by electrochemically induced polymerization. The film thickness in air was in the range of 5 to 100 nm. PNIPAm films exhibited an LCST of 30 °C in water which is close to the LCST of bulk pNIPAm. The degree of swelling typically was in the order of two and largely independent of the preparation conditions. The thickness of pNIPAm films increased with the salting-out capability of the reactant solution which is a function of the concentration of the supporting electrolyte and of its position on the Hofmeister scale. When varying the nature of the electrolyte, the film thickness increased in the order nitrate < perchlorate < sulfate. Deviations from the classical Hofmeister scaling were attributed to factors like the presence of the initiator and other reactants.
Addition of a cross-linker resulted in the formation of thicker films but was no pre-requisite for adhesion. Adhesion of films prepared in the absence of cross-linker was explained by self-cross-linking of pNIPAm at high polymer concentrations at the electrode surface.
Switching the solution pH to high values inhibited the electrochemical reduction of persulfate and yielded very thin films. Addition of chain transfer agents to the basic reactant solution increased the film thickness. Cyclic voltammetry proved that the enhancement of film growth was caused by an enhanced initiator reduction. In the case of the irreversible chain transfer agent sodium formate, radicals possibly produced by a Kolbe-like reaction yielded pNIPAm films even in the absence of the persulfate initiator. In addition, an interaction between formate and persulfate increased the persulfate reduction current. Added RAFT agent did not undergo any electrochemical reactions. The enhanced initiator reduction was explained by the formation of a charge-transfer complex between the RAFT agent and the persulfate. Such a complex may withdraw electrons from the persulfate, which makes the O−O bond more susceptible to reduction.
The surface morphology of the films as imaged with an AFM often showed small-scale globular structures. These globules were microgel domains presumably formed in essentially the same way as in the bulk. The hypothesis that the globules are microgel domains was supported by the smoothening of the films in the absence of cross-linker and in the presence of chain transfer agents. The surface morphology was found to be influenced by the supporting electrolyte and the temperature. The roughness as a function of the electrolyte increased in the same order as the film

6 Conclusions
84
thickness, namely nitrate < perchlorate < sulfate. Increasing the temperature to 40 °C caused a dramatic increase of roughness. The increased lateral heterogeneity under strong salting-out conditions was related to the formation of hydrogen bubbles underneath well cross-linked, dense hydrogel films.
Polystyrene was electrochemically grafted to RAFT group functionalized pNIPAm films in preliminary experiments. This approach increases the scope of EIP with regard to the choice of monomers and the layer architecture.
Structured pNIPAm and pOEGMA films were obtained by bubble-induced pattern formation. Electrochemical formation of oxygen bubbles on an electrode followed by EIP yielded laterally patterned hydrogel films where the polymer was deposited around the bubbles. Feature sizes ranged from 400 to below 10 µm. The mechanism of pattern formation remained unclear. A locally controlled pattern formation was achieved by producing an oxygen bubble in a narrow gap between a counter microelectrode and the substrate. Patterns of pNIPAm spots showed a LCST of 31 °C. Encapsulation of glucose oxidase into the spots was possible.
Laterally homogeneous films of pNIPAm, pOEGMA, and their copolymers were tested with respect to their fouling properties. All homo- and copolymer films showed non fouling behavior towards human serum albumin. Glucose oxidase was successfully encapsulated into the films. The enzyme retained its activity upon encapsulation and showed the typical Michaelis–Menten kinetics in amperometric glucose detection. The Michaelis constants were in the range of 20 to 60 mmol L−1 and strongly depended on the copolymer composition and on the operation temperature. The maximum current was 14 nA for collapsed films. The pOEGMA homopolymer swelled in the buffer which increased the maximum current by a factor of 12.
From these findings, one can conclude that electrochemically induced polymerization is a versatile and well-suited approach for the fabrication and optimization of sensing elements for bioanalytics.

85
7 References
[1] Biosensors – Sense and Sensitivity Turner, A. P. F. Science 2000, 17, 1315–1317. [2] Entrapment of Biomolecules in Sol-Gel Matrix for Applications in Biosensors: Problems and Future Prospects Gupta, R., Chaudhury, N. K. Biosensors and Bioelectronics 2007, 22, 2387–2399. [3] Designing Materials for Biology and Medicine Langer, R., Tirell, D. A. Nature 2004, 428, 487–492. [4] Advances in Polymers for Anti-Biofouling Surfaces Krishnan, S., Weinman, C. J., Ober, C. K. Journal of Materials Chemistry 2008, 18, 3405–3413. [5] Optical Sensors Narayanaswamy, R., Wolfbeis, O. S., Eds.; Springer Series on Chemical Sensors and Biosensors, Springer-Verlag: Berling, Heidelberg, New York, 2004, Vol. 1, pp. 144–172. [6] Piezoelectric Mass-Sensing Devices as Biosensors – An Alternative to Optical Biosensors? Janshoff, A., Galla, H.-J., Steinem, C. Angewandte Chemie International Edition 2000, 39, 4004–4032. [7] Comparison of Different Strategies on DNA Chip Fabrication and DNA-Sensing: Optical and Electrochemical Approaches Szunerits, S., Bouffier, L., Calemczuk, R., Corso, B., Demeunynck, M., Descamps, E., Defontaine, Y., Fiche, J.-B., Fortin, E., Livache, T., Mailley, P., Roget, A., Vieil, E. Electroanalysis 2005, 17, 2001–2017. [8] Amperometric Enzyme Biosensors Based on Optimised Electron-Transfer Pathways and Non-Manual Immobilisation Procedures Schuhmann, W. Reviews in Molecular Biotechnology 2002, 82, 425–441. [9] Electrochemical Biosensors – Sensor Principles and Architectures Grieshaber, D., MacKenzie, R., Vörös, J., Reimhult, E. Sensors 2008, 8, 1400−1458. [10] Poly(N-Isopropylacrylamide): Experiment, Theory and Application Schild, H. G. Progress in Polymer Science 1992, 17, 163–249. [11] Phase Transition of Aqueous Poly-(N-Isopropylacrylamide) Solutions: a Study by Non-Radiative Energy Transfer Winnik, F. M. Polymer 1990, 31, 2125–2134. [12] Deswelling Comparison of Temperature-Sensitive Poly(N-Isopropylacrylamide) Microgels Containing Functional –OH Groups with Different Hydrophilic Long Side Chains Ma, X., Xi, J., Zhao, X., Tang, X. Journal of Polymer Science B 2005, 43, 3575−3583.

86
[13] Manipulating the Thermoresponsive Behavior of Poly(N-Isopropylacrylamide). 1. On the Conformational Behavior of a Series of N-Isopropylacrylamide-Styrene Statistical Copolymers Chee, C. K., Rimmer, S., Shaw, D. A., Soutar, I., Swanson, L. Macromolecules 2001, 34, 7544–7549. [14] Specific Ion Effects on the Water Solubility of Macromolecules: PNIPAM and the Hofmeister Series Zhang, Y., Furyk, S., Bergbreiter, D. E., Cremer, P. S. Journal of the American Chemical Society 2005, 127, 14505–14510. [15] Influence of Additives on the Thermoresponsive Behavior of Polymers in Aqueous Solutions Van Durme, K., Rahier, H., Van Mele, B. Macromolecules 2005, 38, 10155−10163. [16] Reentrant Behavior of Poly(N-Isopropylacrylamide) Brushes in Water-Methanol Mixtures Investigated with a Quartz Crystal Microbalance Liu, G., Zhang, G. Langmuir 2005, 21, 2086–2090. [17] Polymerized Colloidal Crystal Hydrogel Films as Intelligent Chemical Sensing Materials Holtz, J. H., Acher, S. A. Nature 1997, 389, 829–832. [18] Multilayer Hydrogels as Muscle-Like Actuators Liu, Z., Calvert, P. Advanced Materials 2000, 12, 288–291. [19] A Microfluidic Actuator Based on Thermoresponsive Hydrogels Harmon, M. E., Tang, M., Frank, C. W. Polymer 2003, 44, 4547–4556. [20] Weiche Nanotechnologie mit weichen Nanopartikeln Nayak, S., Lyon, L. A. Angewandte Chemie 2005, 117, 7862–7886. [21] Poly(Ethylene Glycol)-Containing Hydrogels in Drug Delivery Peppas, N. A., Keys, K. B., Torres-Lugo, M., Lowman, A. M. Journal of Controlled Release 1999, 62, 81–87. [22] Environment-Sensitive Hydrogels for Drug Delivery Qiu, Y., Park, K. Advanced Drug Delivery Reviews 2001, 53, 321–339. [23] Pulsatile Drug Release Control Using Hydrogels Kikuchi, A., Okano, T. Advanced Drug Delivery Reviews 2002, 54, 53–77. [24] Nanostructured Designs of Biomedical Materials: Applications of Cell Sheet Engineering to Functional Regenerative Tissues and Organs Kikuchi, A., Okano, T. Journal of Controlled Release 2005, 101, 69–84. [25] Kontrollierte Zelladhäsion auf PEG-basierten schaltbaren Oberflächen Wischerhoff, E., Uhlig, K., Lankenau, A., Börner, H. G., Laschewsky, A., Duschl, C., Lutz, J.-F. Angewandte Chemie 2008, 120, 5749–5752. [26] The Effect of Preparation Temperature on the Swelling Behavior of Poly(N- Isopropylacrylamide) Gels Sayil, C., Okay, O. Polymer Bulletin 2000, 45, 175–182.

87
[27] Thermoreversible Hydrogels. XII. Effect of the Polymerization Conditions on the Swelling Behavior of the N-Isopropylacrylamide Gel Lee, W.-F., Yen, S.-H. Journal of Applied Polymer Science 2000, 78, 1604−1611. [28] Influence of Formation Conditions on Spatial Inhomogeneities in Poly(N- Isopropylacrylamide) Hydrogels Nie, J., Du, B., Oppermann, W. Macromolecules 2004, 37, 6558–6564. [29] Curing of Unsaturated Polyester Resins: Viscosity Studies and Simulations in Pre-Gel State Yang, Y.-S., Suspene, L. Polymer Engineering and Science 1991, 31, 321–332. [30] Effects of Network Inhomogeneity in Poly(N-Isopropylacrylamide) Gel on its Surface Structure Suzuki, A., Kobiki, Y., Yamazaki, M. Japanese Journal of Applied Physics 2003, 42, 2810–2817. [31] Polyethylene Glycol-Coated Biocompatible Surfaces Alcantar, N. A., Aydil, E. S., Israelachvili, J. N. Journal of Biomedical Materials Research 2000, 51, 343–351. [32] Preparation of Ideal PEG Analogues with a Tunable Thermosensitivity by Controlled Radical Copolymerization of 2-(2-Methoxyethoxy)Ethyl Methacrylate and Oligo(Ethylene Glycol) Methacrylate Lutz, J.-F., Hoth, A. Macromolecules 2006, 39, 893–896. [33] Point by Point Comparison of Two Thermosensitive Polymers Exhibiting a Similar LCST: Is the Age of Poly(NIPAM) Over? Lutz, J.-F., Akdemir, Ö., Hoth, A. Journal of the American Chemical Society 2006, 128, 13046–13047. [34] About the Phase Transitions in Aqueous Solutions of Thermoresponsive Copolymers and Hydrogels Based on 2-(2-Methoxyethoxy)Ethyl Methacrylate and Oligo(Ethylene Glycol) Methacrylate Lutz, J.-F., Weichenhan, K., Akdemir, Ö., Hoth, A. Macromolecules 2007, 40, 2503–2508. [35] “Non-Fouling” Oligo(Ethylene Glycol)-Functionalized Polymer Brushes Synthesized by Surface-Initiated Atom Transfer Radical Polymerization Ma, H., Hyun, J., Stiller, P., Chilkoti, A. Advanced Materials 2004, 16, 338–341. [36] Molecular Conformation of Oligo(Ethylene Glycol)-Terminated Self-Assembled Monolayers and Their Resistance to Protein Adsorption Wang, R. L. C., Kreuzer, H. J., Grunze, M. Journal of Physical Chemistry B 1997, 101, 9767–9773. [37] Factors that Determine the Protein Resistance of Oligoether Self-Assembled Monolayers – Internal Hydrophilicity, Terminal Hydrophilicity, and Lateral Packing Density Herrwerth, S., Eck, W., Reinhardt, S., Grunze, M. Journal of the American Chemical Society 2003, 125, 9359–9366.

88
[38] Electrochemical Redundant Microsensor Arrays for Glucose Monitoring with Patterned Polymer Films Mugweru, A., Clark, B. L., Pishko, M. V. Electroanalysis 2007, 19, 453–458. [39] Synthesis of Poly[N-Isopropylacrylamide-g-Poly(Ethylene Glycol)] with a Reactive Group at the Poly(Ethylene Glycol) End and Its Thermosensitive Self- Assembling Character Iijima, M., Nagasaki, Y. Journal of Polymer Science A 2006, 44, 1457–1469. [40] Aggregation in Aqueous Poly(N-Isopropylacrylamide)-block-Poly(Ethylene Oxide) Solutions Studied by Fluorescence Spectroscopy and Light Scattering Virtanen, J., Holappa, S., Lemmetyinen, H., Tenhu, H. Macromolecules 2002, 35, 4763–4769. [41] Folding and Unfolding of Individual PNIPAM-g-PEO Copolymer Chains in Dilute Aqueous Solutions Chen, H., Li, J., Ding, Y., Zhang, G., Zhang, Q., Wu, C. Macromolecules 2005, 38, 4403–4408. [42] Single Chain Core–Shell Nanostructures Wu, C., Qiu, X. Physical Review Letters 1998, 80, 620–622. [43] Preparation of Stable Insulin-Loaded Nanospheres of Poly(Ethylene Glycol) Macromers and N-Isopropyl Acrylamide Leobandung, W., Ichikawa, I., Fukumori, Y., Peppas, N. A. Journal of Controlled Release 2002, 80, 357–363. [44] ‘Zur Lehre von der Wirkung der Salze’ (About the Science of the Effect of Salts): Franz Hofmeister’s Historical Papers Kunz, W., Henle, J., Ninham, B. W. Current Opinion in Colloid and Interface Science 2004, 9, 19–37. [45] Role of the Surfactant Headgroup on the Counterion Specificity in the Micelle-to- Vesicle Transition through Salt Addition Vlachy, N., Drechsler, M., Verbavatz, J.-M., Touraud, D., Kunz, W. Journal of Colloid and Interface Science 2008, 319, 542–548. [46] Heterogeneous Drying of Colloidal Polymer Films: Dependence on Added Salt König, A. M., Weerakkody, T. G., Keddie, J. L., Johannsmann, D. Langmuir 2008, 24, 7580–7589. [47] Bubble Coalescence and Specific-Ion Effects Craig, V. S. J. Current Opinion in Colloid and Interface Science 2004, 9, 178−184. [48] Specific Anion Effects on Glass Electrode pH Measurements of Buffer Solutions: Bulk and Surface Phenomena Salis, A., Pinna, C. M., Bilaničová, D., Monduzzi, M., Lo Nostro, P., Ninham, B. W. Journal of Physical Chemistry B 2006, 110, 2949–2956. [49] The Present State of Affairs with Hofmeister Effects Kunz, W., Lo Nostro, P., Ninham, B. W. Current Opinion in Colloid and Interface Science 2004, 9, 1–18.

89
[50] The Hofmeister Series: Salt and Solvent Effects on Interfacial Phenomena Cacace, M. G., Landau, E. M., Ramsden, J. J. Quarterly Reviews of Biophysics 1997, 30, 241–277. [51] Impact of Protein Denaturants and Stabilizers on Water Structure Batchelor, J. D., Olteanu, A., Tripathy, A., Pielak, G. J. Journal of the American Chemical Society 2004, 126, 1958–1961. [52] On the Mechanism of the Hofmeister Effect Gurau, M. C., Lim, S.-M., Castellana, E. T., Albertorio, F., Kataoka, S., Cremer, P. S. Journal of the American Chemical Society 2004, 126, 10522–10523. [53] Specific Ion Effects: Why DLVO Theory Fails for Biology and Colloid Systems Boström, M., Williams, D. R. M., Ninham, B. W. Physical Review Letters 2001, 87, 168103. [54] ATR-FTIR Studies on the Effect of Strong Salting-Out Salts on the Phase Separation Scenario in Aqueous Solutions of Poly(N-Isopropylacrylamide) [PNIPA] Kesselman, E., Ramon, O., Berkovici, R., Paz, Y. Polymers for Advanced Technologies 2002, 13, 982–991. [55] Salt-Induced Depression of Lower Critical Solution Temperature in a Surface- Grafted Neutral Thermoresponsive Polymer Jhon, Y. K., Bhat, R. R., Jeong, C., Rojas, O. J., Szleifer, I., Genzer, J. Macromolecular Rapid Communications 2006, 27, 697–701. [56] Salt-Induced Structural Behavior for Poly(N-Isopropylacrylamide) Grafted onto Solid Surface Observed Directly by AFM and QCM-D Ishida, N., Biggs, S. Macromolecules 2007, 40, 9045–9052. [57] Thermally Responsive Poly(N-Isopropylacrylamide) Monolayer on Gold: Synthesis, Surface Characterization, and Protein Interaction/Adsorption Studies Cho, E. C., Kim, Y. D., Cho, K. Polymer 2004, 45, 3195–3204. [58] Photo-Cross-Linkable PNIPAAm Copolymers. 1. Synthesis and Characterization of Constrained Temperature-Responsive Hydrogel Layers Kuckling, D., Harmon, M. E., Frank, C. W. Macromolecules 2002, 35, 6377−6383. [59] Photochemical Attachment of Polymer Films to Solid Surfaces via Monolayers of Benzophenone Derivatives Prucker, O., Naumann, C. A., Rühe, J., Knoll, W., Frank, C. W. Journal of the American Chemical Society 1999, 121, 8766–8770. [60] Generation of Antifouling Layers on Stainless Steel Surfaces by Plasma- Enhanced Crosslinking of Polyethylene Glycol Dong, B., Manolache, S., Somers, E. B., Wong, A. C. L., Denes, F. S. Journal of Applied Polymer Science 2005, 97, 485–497. [61] Plasma and Radiation-Induced Graft Modification of Polymers for Biomedical Applications Gupta, B., Anjum, N. Advances in Polymer Science 2003, 162, 35–61.

90
[62] Plasma Polymerized N-Isopropylacrylamide: Synthesis and Characterization of a Smart Thermally Responsive Coating Pan, Y. V., Wesley, R. A., Luginbuhl, R., Denton, D. D., Ratner, B. D. Biomacromolecules 2001, 2, 32–36. [63] Amphiphilic Polymer Brushes Grown from the Silicon Surface by Atom Transfer Radical Polymerization Kong, X., Kawai, T., Abe, J., Iyoda, T. Macromolecules 2001, 34, 1837–1844. [64] Poly(3,4-Ethylenedioxythiophene) and Its Derivatives: Past, Present, and Future Groenendaal, L. B., Jonas, F., Freitag, D., Pielartzik, H., Reynolds, J. R. Advanced Materials 2000, 12, 481–494. [65] Immobilization Method for the Preparation of Biosensors Based on pH Shift- Induced Deposition of Biomolecule-Containing Polymer Films Kurzawa, C., Hengstenberg, A., Schuhmann, W. Analytical Chemistry 2002, 74, 355–361. [66] Combinatorial Synthesis of a Library of Acrylic Acid-Based Polymers and their Evaluation as Immobilisation Matrix for Amperometric Biosensors Ngounou, B., Neugebauer, S., Frodl, A., Reiter, S., Schuhmann, W. Electrochimica Acta 2004, 49, 3855–3863. [67] An Electrochemical Robotic System for the Optimization of Amperometric Glucose Biosensors Based on a Library of Cathodic Electrodeposition Paints Reiter, S., Ruhlig, D., Ngounou, B., Neugebauer, S., Janiak, S., Vilkanauskyte, A., Erichsen, T., Schuhmann, W. Macromolecular Rapid Communications 2004, 25, 348–354. [68] Cathodic Deposition of Paint Arlt, K. Electrochimica Acta 1994, 39, 1189–1193. [69] Molecule-to-Metal Bonds: Electrografting Polymers on Conducting Surfaces Palacin, S., Bureau, C., Charlier, J., Deniau, G., Mouanda, B., Viel, P. ChemPhysChem 2004, 5, 1468–1481. [70] Study of the Simultaneous Electro-Initiated Anionic Polymerization of Vinylic Molecules Deniau, G., Charlier, J., Alvado, B., Palacin, S., Aplincourt, P., Bauvais, C. Journal of Electroanalytical Chemistry 2006, 586, 62–71. [71] Electrochemical Strategies for the Strengthening of Polymer-Metal Interfaces Baute, N., Jérôme, C., Martinot, L., Mertens, M., Geskin, V. M., Lazzaroni, R., Brédas, J.-L., Jérôme, R. European Journal of Inorganic Chemistry 2001, 1097−1107. [72] Electrografting of Poly(Ethylene Glycol) Acrylate: A One-Step Strategy for the Synthesis of Protein-Repellent Surfaces Gabriel, S., Dubruel, P., Schacht, E., Jonas, A. M., Gilbert, B., Jérôme, R., Jérôme, C. Angewandte Chemie 2005, 117, 5641–5645.

91
[73] On the Electrochemical Polymerization of Acrylonitrile and N-Vinylpyrrolidone: New Insight into the Mechanism Jérôme, R., Mertens, M., Martinot, L. Advanced Materials 1995, 7, 807–809. [74] Electrolytically Initiated Polymerization Yamazaki, N. Advances in Polymer Science 1969, 6, 377–400. [75] Formation of a High Polymer of Acrylamide by Utilizing Kolbe’s Electrolysis Yoshizawa, S., Takehara, Z., Ogumi, Z., Nagai, C. Journal of Applied Electrochemistry 1976, 6, 147–153. [76] The Initiation Reaction of Electro-Initiated Polymerization of Acrylamide in the Kolbe Electrolysis System Ogumi, Z., Tari, I., Takehara, Z., Yoshizawa, S. Bulletin of the Chemical Society of Japan 1976, 49, 841–844. [77] The Electro-Initiated Polymerization of Acrylamide in an Aqueous Solution of Trifluoroacetic Acid and Potassium Trifluoroacetate Ogumi, Z., Tari, I., Takehara, Z., Yoshizawa, S. Bulletin of the Chemical Society of Japan 1974, 47, 1843–1846. [78] Electrochemically Prepared Acrylamide/N,N’-Methylene Bisacrylamide Gels Yildiz, G., Çatalgil-Giz, H., Kadirgan, F. Journal of Applied Electrochemistry 2000, 30, 71–75. [79] Electroinitiated Polymerization of Acrylamide in Acetonitrile Medium Samal, S. K., Nayak, B. Journal of Polymer Science A 1988, 26, 1035–1049. [80] Mechanism of Coating by Electropolymerization on Metal Cathodes from Zinc Chloride Solutions of Acrylamide Collins, G. L., Thomas, N. W. Journal of Polymer Science 1977, 15, 1819–1830. [81] Polymerization Induced by Hydrogen in Metals Parravano, G. Journal of the American Chemical Society 1951, 73, 628–630. [82] Rate of Electropolymerization of N,N’-Dimethyl Acrylamide in Aqueous Sulfuric Acid Solution Iroh, J. O., Bell, J. P., Scola, D. A. Journal of Applied Polymer Science 1993, 49, 583–592. [83] Graphite-Epoxy Composites: Effects of an Applied Interface Bell, J. P., Wimolkiatisak, A. S., Rhee, H. W., Chang, J., Joseph, R., Kim, W., Scola, D. A. Journal of Adhesion 1995, 53, 103–116. [84] Mechanism and Evaluation on Electroinitiated Copolymerization Coatings of Acrylonitrile and Acrylic Acid Teng, F. S., Mahalingam, R. Journal of Applied Polymer Science 1979, 23, 101−113. [85] Mechanism of Peroxodisulfate Reduction at a Polycrystalline Gold Electrode Samec, Z., Doblhofer, K. Journal of Electroanalytical Chemistry 1994, 367, 141–147.

92
[86] Electrocatalytic Reduction of Peroxodisulfate Anion on Au(111) in Acidic Aqueous Solutions Samec, Z., Bittner, A. M., Doblhofer, K. Journal of Electroanalytical Chemistry 1996, 409, 165–173. [87] Mechanism of the Oscillatory Reduction of Peroxodisulfate on Gold (110) at Electrode Potentials Positive to the Point of Zero Charge Treindl, L., Doblhofer, K., Krischer, K., Samec, Z. Electrochimica Acta 1999, 44, 3963–3967.
[88] The Electroreduction of the S2O82− Anion
Frumkin, A. N., Nikolaeva-Fedorovich, N. V., Berezina, N. P., Keis, K. E. Electroanalytical Chemistry and Interfacial Electrochemistry 1975, 58, 189–201. [89] Kinetic Study of the Aqueous Electropolymerization of Acrylamide, Acrylonitrile and N,N’-Methylenebisacrylamide on an Aluminium Alloy Cathode Lee, C. S., Bell, J. P. Journal of Materials Science 1995, 30, 3827–3833. [90] Electrochemical Polymerization of Acrylics on Stainless Steel Cathodes Cram, S. L., Spinks, G. M., Wallace, G. G., Brown, H. R. Journal of Applied Polymer Science 2003, 87, 765–773. [91] Electropolymerised Acrylic Coatings for Polymer-Metal Adhesion Enhancement Cram, S. L., Spinks, G. M., Wallace, G. G., Brown, H. R. Journal of Adhesion Science and Technology 2003, 17, 1403–1423. [92] Mechanism of Electropolymerisation of Methyl Methacrylate and Glycidyl Acrylate on Stainless Steel Cram, S. L., Spinks, G. M., Wallace, G. G., Brown, H. R. Electrochimica Acta 2002, 47, 1935–1948. [93] Formation of Surface-Attached Responsive Gel Layers via Electrochemically Induced Free-Radical Polymerization Reuber, J., Reinhardt, H., Johannsmann, D. Langmuir 2006, 22, 3362–3367. [94] Production of Polyacrylic Acid Homo- and Copolymer Films by Electrochemically Induced Free-Radical Polymerization: Preparation and Swelling Behavior Bünsow, J., Johannsmann, D. Macromolecular Symposia 2007, 248, 207–212. [95] Nitroxide-Mediated Radical Processes Studer, A., Schulte, T. The Chemical Record 2005, 5, 27–35. [96] Electron Transfer Reactions Relevant to Atom Transfer Radical Polymerization Tsarevsky, N. V., Braunecker, W. A., Matyjaszewski, K. Journal of Organometallic Chemistry 2007, 692, 3212–3222. [97] Reversible Addition–Fragmentation Chain Transfer (RAFT) Radical Polymerization and the Synthesis of Water-Soluble (Co)Polymers under Homogeneous Conditions in Organic and Aqueous Media Lowe, A. B., McCormick, C. L. Progress in Polymer Science 2007, 32, 283–351. [98] Radical Addition–Fragmentation Chemistry in Polymer Synthesis Moad, G., Rizzardo, E., Thang, S. H. Polymer 2008, 49, 1079–1131.

93
[99] RAFTing Down Under: Tales of Missing Radicals, Fancy Architectures, and Mysterious Holes Barner-Kowollik, C., Davis, T. P., Heuts, J. P. A., Stenzel, M. H., Vana, P., Whittaker, M. Journal of Polymer Science A 2003, 41, 365–375. [100] Organotellurium Compounds as Novel Initiators for Controlled/Living Radical Polymerizations. Synthesis of Functionalized Polystyrene and End-Group Modifications Yamago, S., Iida, K., Yoshida, J.-I. Journal of the American Chemical Society 2002, 124, 2874–2875. [101] Nitroxide-Controlled Free-Radical Polymerization of Vinyl and Divinyl Monomers.2. Gelation Ide, N., Fukuda, T. Macromolecules 1999, 32, 95–99. [102] Development of Networks in Atom Transfer Radical Polymerization of Dimethacrylates Yu, Q., Zhou, M., Ding, Y., Jiang, B., Zhu, S. Polymer 2007, 48, 7058–7064. [103] Gel Formation in Atom Transfer Radical Polymerization of 2-(N,N-Dimethyl- amino)Ethyl Methacrylate and Ethylene Glycol Dimethacrylate Jiang, C., Shen, Y., Zhu, S., Hunkeler, D. Journal of Polymer Science A 2001, 39, 3780–3788. [104] Kinetics of ‘Living’ Radical Polymerizations of Multifunctional Monomers Ward, J. H., Shahar, A., Peppas, N. A. Polymer 2002, 43, 1745–1752. [105] Comparison of the Gelation Dynamics for Polystyrene Prepared by Conventional and Living Radical Polymerizations: a Time-Resolved Dynamic Light Scattering Study Norisuye, T., Morinaga, T., Tran-Cong-Miyata, Q., Goto, A., Fukuda, T., Shibayama, M. Polymer 2005, 46, 1982–1994. [106] Poly(N-Isopropylacrylamide) Hydrogels with Improved Shrinking Kinetics by RAFT Polymerizaion Liu, Q., Zhang, P., Qing, A., Lan, Y., Lu, M. Polymer 2006, 47, 2330–2336. [107] Patterning Surfaces with Functional Polymers Nie, Z., Kumacheva, E. Nature Materials 2008, 7, 277–290. [108] Preparation of Micropatterned Hydrogel Substrate via Surface Graft Polymerization Combined with Photolithography for Biosensor Application Lee, W., Choi, D., Lee, Y., Kim, D.-N., Park, J., Koh, W.-G. Sensors and Actuators B 2008, 129, 841–849. [109] Laser Scanning Lithography for Surface Micropatterning on Hydrogels Hahn, M. S., Miller, J. S., West, J. L. Advanced Materials 2005, 17, 2939−2942. [110] Soft Lithographic Methods for Nano-Fabrication Zhao, X.-M., Xia, Y., Whitesides, G. M. Journal of Materials Chemistry 1997, 7, 1069–1074.

94
[111] Fabrication of Micropatterned Gold Nanoparticle Arrays as a Template for Surface-Initiated Polymerization of Stimuli-Responsive Polymers Jung, J., Kim, K. W., Na, K., Kaholek, M., Zauscher, S., Hyun, J. Macromolecular Rapid Communications 2006, 27, 776–780. [112] Inkjet Printing for Materials and Devices Calvert, P. Chemistry of Materials 2001, 13, 3299–3305. [113] Fabricating Optical Fiber Imaging Sensors Using Inkjet Printing Technology: A pH Sensor Proof-of-Concept Carter, J. C., Alvis, R. M., Brown, S. B., Langry, K. C., Wilson, T. S., McBride, M. T., Myrick, M. L., Cox, W. L., Grove, M. E., Colston, B. W. Biosensors and Bioelectronics 2006, 21, 1359–1364. [114] Patternable Block Copolymers Li, M., Coenjarts, C. A., Ober, C. K. Advances in Polymer Science 2005, 190, 183–226. [115] The Patterning and Alignment of Muscle Cells Using the Selective Adhesion of Poly(Oligoethylene Glycol Methyl Ether Methacrylate)-Based ABA Block Copolymers Popescu, D. C., Lems, R., Rossi, N. A. A., Yeoh, C.-T., Loos, J., Holder, S. J., Bouten, C. V. C., Sommerdijk, N. A. J. M. Advanced Materials 2005, 17, 2324–2329. [116] Nano-Chemistry and Scanning Probe Nanolithographies Garcia, R., Martinez, R. V., Martinez, J. Chemical Society Reviews 2006, 35, 29–38. [117] Scanning Probe Microscopies Beyond Imaging Samorì, P., Ed.; Wiley-VCH: Weinheim, 2006; 1st edition. [118] “Dip-Pen” Nanolithography Piner, R. D., Zhu, J., Xu, F., Hong, S., Mirkin, C. A. Science 1999, 283, 661−663. [119] Direct Patterning of Modified Oligonucleotides on Metals and Insulators by Dip-Pen Nanolithography Demers, L. M., Ginger, D. S., Park, S.-J., Li, Z., Chung, S.-W., Mirkin, C. A. Science 2002, 296, 1836–1838. [120] Direct-Writing of Polymer Nanostructures: Poly(Thiophene) Nanowires on Semiconducting and Insulating Surfaces Maynor, B. W., Filocamo, S. F., Grinstaff, M. W., Liu, J. Journal of the American Chemical Society 2002, 124, 522–523. [121] Electrochemical AFM “Dip-Pen” Nanolithography Li, Y., Maynor, B. W., Liu, J. Journal of the American Chemical Society 2001, 123, 2105–2106. [122] Nanostructuring and Nanoanalysis by Scanning Electrochemical Microscopy (SECM) Ufheil, J., Heß, C., Borgwarth, K., Heinze, J. Physical Chemistry Chemical Physics 2005, 7, 3185–3190.

95
[123] Biological Applications of Scanning Electrochemical Microscopy: Chemical Imaging of Single Living Cells and Beyond Amemiya, S., Guo, J., Xiong, H., Gross, D. A. Analytical and Bioanalytical Chemistry 2006, 386, 458–471. [124] Ultramicroelectrodes: Design, Fabrication, and Characterization Zoski, C. G. Electroanalysis 2002, 14, 1041–1051. [125] Fabrication and Characterization of Needle-Type Pt-Disk Nanoelectrodes Katemann, B. B., Schuhmann, W. Electroanalysis 2002, 14, 22–28. [126] Microfabrication by Localized Electrochemical Deposition: Experimental Investigation and Theoretical Modelling Said, R. A. Nanotechnology 2003, 14, 523–531. [127] Increasing the Resolution of the Scanning Electrochemical Microscope Using a Chemical Lens: Application to Silver Deposition Borgwarth, K., Heinze, J. Journal of The Electrochemical Society 1999, 146, 3285–3289. [128] High Resolution Deposition of Polyaniline on Pt with the Scanning Electrochemical Microscope Wuu, Y.-M., Fan, F.-R. F., Bard, A. J. Journal of The Electrochemical Society 1989, 136, 885–886. [129] Lateral Deposition of Polypyrrole Lines by Means of the Scanning Electrochemical Microscope Kranz, C., Ludwig, M., Gaub, H. E., Schuhmann, W. Advanced Materials 1995, 7, 38–40. [130] Photocurable Pillar Arrays Formed via Electrohydrodynamic Instabilities Dickey, M. D., Collister, E., Raines, A., Tsiartas, P., Holcombe, T., Sreenivasan, S. V., Bonnecaze, R. T., Willson, C. G. Chemistry of Materials 2006, 18, 2043–2049. [131] Ordered Morphologies in Polymeric Films Produced by Replication of Convection Patterns Xu, S., Kumacheva, E. Journal of the American Chemical Society 2002, 124, 1142–1143. [132] Bioanalytical Chemistry Manz, A., Pamme, N., Iossifidis, D.; Imperial College Press: London, UK, 2004, 1st edition, pp. 125–141. [133] Bioresponsive Hydrogel Microlenses Kim, J., Nayak, S., Lyon, L. A. Journal of the American Chemical Society 2005, 127, 9588–9592. [134] Label-Free Biosensing with Hydrogel Microlenses Kim, J., Singh, N., Lyon, L. A. Angewandte Chemie 2006, 118, 1474–1477. [135] Chemische Sensoren Gründler, P.; Springer-Verlag: Berlin, Heidelberg, New York, 2003, 1st edition.

96
[136] Direct Electrochemistry of Glucose Oxidase and Biosensing for Glucose Based on Boron-Doped Carbon Nanotubes Modified Electrode Deng, C., Chen, J., Chen, X., Xiao, C., Nie, L., Yao, S. Biosensors and Bioelectronics 2008, 23, 1272–1277. [137] A Reagentless Bienzyme Amperometric Biosensor Based on Alcohol Oxidase/Peroxidase and an Os-Complex Modified Electrodeposition Paint Smutok, O., Ngounou, B., Pavlishko, H., Gayda, G., Gonchar, M., Schuhmann, W. Sensors and Actuators B 2006, 113, 590–598. [138] Effects of Electrolyte on the Behavior of Cross-Linked Films of Ferrocene- Modified Poly(Ethylene Imine) Merchant, S. A., Glatzhofer, D. T., Schmidtke, D. W. Langmuir 2007, 23, 11295–11302. [139] Conducting Polymer-Based Amperometric Enzyme Electrodes. Towards the Development of Miniaturized Reagentless Biosensors Schuhmann, W., Kranz, C., Huber, J., Wohlschläger, H. Synthetic Metals 1993, 61, 31–35. [140] Improved Specificity of Reagentless Amperometric PQQ-sGDH Glucose Biosensors by Using Indirectly Heated Electrodes Lau, C., Borgmann, S., Maciejewska, M., Ngounou, B., Gründler, P., Schuhmann, W. Biosensors and Bioelectronics 2007, 22, 3014–3020. [141] Biochemie Voet, D., Voet, J. G.; VCH-Verlag: Weinheim, 1994, 1st edition, pp. 329–340. [142] Quantitative Surface-Enhanced Raman Spectroscopy Bell, S. E. J., Sirimuthu, N. M. S. Chemical Society Reviews 2008, 37, 1012−1024. [143] Introduction to Surface Physical Chemistry Christmann, K.; Steinkopff-Verlag: Darmstadt, 1991, 1st edition. [144] Atomic Force Microscopy, a Tool for Characterization, Synthesis and Chemical Processes Zavala, G. Colloid and Polymer Science 2008, 286, 85–95. [145] Functionalized Molecules Studied by STM: Motion, Switching and Reactivity Grill, L. Journal of Physics: Condensed Matter 2008, 20, 053001. [146] Ellipsometry and Polarized Light Azzam, R. M. A., Bashara, N. M.; Elsevier: Amsterdam, 1987, Paperback Edition. [147] Piezoelectric Sensors Steinem, C., Janshoff, A., Eds.; Springer Series on Chemical Sensors and Biosensors, Springer-Verlag: Berlin, Heidelberg, New York, 2007, Vol. 5. [148] Acoustic Wave Sensors: Theory, Design, and Physico-Chemical Applications Ballantine, D. S., White, R. M., Martin, S. J., Ricco, A. J., Zellers, E. T., Frye, G. C., Wohltjen, H.; Elsevier: Amsterdam, 1997, 1st edition.

97
[149] Piezoelectric Transducers and Applications Arnau, A., Ed.; Springer-Verlag: Berlin, Heidelberg, New York, 2004, 1st edition. [150] Die Schwingquarzmethode Schumacher, R. Chemie in unserer Zeit 1999, 5, 268–277. [151] A Quartz Crystal Microbalance Based on Torsional Piezoelectric Resonators Bücking, W., Du, B., Turshatov, A., König, A. M., Reviakine, I., Johannsmann, D. Review of Scientific Instruments 2007, 78, 074903. [152] Quartz Crystal Microbalance: A Useful Tool for Studying Thin Polymer Films and Complex Biomolecular Systems at the Solution-Surface Interface Marx, K. A. Biomacromolecules 2003, 4, 1099–1120. [153] Sorptive Behavior of Monolayer-Protected Gold Nanoparticle Films: Implications for Chemical Vapor Sensing Grate, J. W., Nelson, D. A., Skaggs, R. Analytical Chemistry 2003, 75, 1868−1879. [154] 2. Assembly of Alternating Polyelectrolyte and Protein Multilayer Films for Immunosensing Caruso, F., Niikura, K., Furlong, D. N., Okahata, Y. Langmuir 1997, 13, 3427−3433. [155] A Novel Method of Immobilizing Antibodies on a Quartz Crystal Microbalance Using Plasma-Polymerized Films for Immunosensors Nakanishi, K., Muguruma, H., Karube, I. Analytical Chemistry 1996, 68, 1695−1700. [156] Swelling of a Polymer Brush Probed with a Quartz Crystal Resonator Domack, A., Prucker, O., Rühe, J., Johannsmann, D. Physical Review E 1997, 56, 680–689. [157] Collapse and Swelling of Thermally Sensitive Poly(N-Isopropylacrylamide) Brushes Monitored with a Quartz Crystal Microbalance Liu, G., Zhang, G. Journal of Physical Chemistry B 2005, 109, 743–747. [158] Temperature-Induced Swelling and De-Swelling of Thin Poly(N-Isopropyl acrylamide) Gels in Water: Combined Acoustic and Optical Measurements Wang, Z., Kuckling, D., Johannsmann, D. Soft Materials 2003, 1, 353–364. [159] Quartz Crystal Microbalance Studies of the Contact Between Soft, Viscoelastic Solids Kunze, M., Shull, K. R., Johannsmann, D. Langmuir 2006, 22, 169–173. [160] Derivation of the Shear Compliance of Thin Films on Quartz Resonators from Comparison of the Frequency Shifts on Different Harmonics: A Pertubation Analysis Johannsmann, D. Journal of Applied Physics 2001, 89, 6356–6364.

98
[161] Viscoelastic, Mechanical, and Dielectric Measurements on Complex Samples with the Quartz Crystal Microbalance Johannsmann, D. Physical Chemistry Chemical Physics 2008, 10, 4516–4534. [162] Verwendung von Schwingquarzen zur Wägung dünner Schichten und zur Mikrowägung Sauerbrey, G. Zeitschrift für Physik 1959, 155, 206–222. [163] Frequency of a Quartz Microbalance in Contact with Liquid Kanazawa, K. K., Gordon, J. G. Analytical Chemistry 1985, 57, 1771–1772. [164] Measurement of the Viscosity of Media by Means of Shear Vibration of Plane Piezoresonators Borovikov, A. P. Instruments and Experimental Techniques 1976, 19, 223–224. [165] Electrochemical Methods Bard, A. J., Faulkner, L. R.; John Wiley & Sons: New York, 2001, 2nd edition. [166] Elektrochemie Hamann, C. H., Vielstich, W.; Wiley-VCH: Weinheim, 2003, 3rd edition. [167] Electrochemical Surface Plasmon Spectroscopy – Recent Developments and Applications Zhang, N., Schweiss, R., Zong, Y., Knoll, W. Electrochimica Acta 2007, 52, 2869–2875. [168] Measurement of Interfacial Processes at Electrode Surfaces with the Electrochemical Quartz Crystal Microbalance Buttry, D. A., Ward, M. D. Chemical Reviews 1992, 92, 1355–1379. [169] Electropolymerization and Doping/Dedoping Properties of Polyaniline Thin Films as Studied by Electrochemical-Surface Plasmon Spectroscopy and by the Quartz Crystal Microbalance Baba, A., Tian, S., Stefani, F., Xia, C., Wang, Z., Advincula, R. C., Johannsmann, D., Knoll, W. Journal of Electroanalytical Chemistry 2004, 562, 95–103. [170] Electrochemical Quartz Crystal Microbalance Studies on Enzymatic Specific
Activity and Direct Electrochemistry of Immobilized Glucose Oxidase in the Presence of Sodium Dodecyl Benzene Sulfonate and Multiwalled Carbon Nanotubes Su, Y., Xie, Q., Chen, C., Zhang, Q., Ma, M., Yao, S. Biotechnology Progress 2008, 24, 262–272.
[171] Electrochemical Functionalization of a Gold Electrode with Redox-Active Self- Assembled Monolayer for Electroanalytical Application Behera, S., Sampath, S., Raj, C. R. Journal of Physical Chemistry C 2008, 112, 3734–3740.
[172] Functional Polymers from Novel Carboxyl-Terminated Trithiocarbonates as Highly Efficient RAFT Agents Lai, J. T., Filla, D., Shea, R. Macromolecules 2002, 35, 6754–6756.

99
[173] Change in Hydration State During the Coil-GlobuleTransition of Aqueous Solutions of Poly-N-Isopropylacrylamide as Evidenced by FTIR Spectroscopy Maeda, Y., Higuchi, T., Ikeda, I. Langmuir 2000, 16, 7503–7509.
[174] Cross-Linker-Free N-Isopropylacrylamide Gel Nanospheres Gao, J., Frisken, B. J. Langmuir 2003, 19, 5212–5216. [175] Influence of Reaction Conditions on the Synthesis of Self-Cross-Linked N- Isopropylacrylamide Microgels Gao, J., Frisken, B. J. Langmuir 2003, 19, 5217–5222. [176] Electrochemically Produced Responsive Hydrogel Films: Influence of Added Salt on Thickness and Morphology Bünsow, J., Johannsmann, D. Journal of Colloid and Interface Science 2008, 326, 61–65. [177] Effects of Cyclization and Pendant Vinyl Group Reactivity on the Swelling Behavior of Polyacrylamide Gels Okay, O., Balimtas, N. K., Nagash, H. J. Polymer Bulletin 1997, 39, 233–239. [178] Molecular Weight Control of Polyacrylamide with Sodium Formate as a Chain- Transfer Agent: Characterization with Size Exclusion Chromatography/ Multiple-Angle Laser Light Scattering and Determination of Chain-Transfer Constant Fevola, M. J., Hester, R. D., McCormick, C. L. Journal of Polymer Science A 2003, 41, 560–568. [179] Kinetics and Mechanism of Potassium Persulfate Decomposition in Aqueous Solutions Studied by a Gasometric Method Beylerian, N. M., Vardanyan, L. R., Harutyunyan, R. S., Vardanyan, R. L. Macromolecular Chemistry and Physics 2002, 203, 212–218. [180] Study of the Thermal Decomposition of Potassium Persulfate by Potentiometry
and Capillary Electrophoresis Santos, A. M., Vindevoghel, P., Graillat, C., Guyot, A., Guillot, J. Journal of Polymer Science A 1996, 34, 1271–1281.
[181] Short-Time-Transient Surfactant Dynamics and Marangoni Convection Around Boiling Nuclei Wasekar, V. M., Manglik, R. M. Transactions of the American Society of Mechanical Engineers 2003, 125, 858–866.
[182] Electrochemical Microreactor and Gas-Evolving Reactions Křišt’ál, J., Kodým, R., Bouzek, K., Jiřičný, V. Electrochemistry Communications 2008, 10, 204–207.
[183] Elektrochemisch induzierte Polymerisation von responsiven Hydrogelen auf Metalloberflächen Reuber, J., Diploma Thesis, Clausthal University of Technology, Germany, 2005.

100
Appendix A: List of Symbols
A Area c Concentration Cd Differential double layer capacitance D Diffusion coefficient Δ Heat energy
Δf Frequency shift
ΔΓ Shift of half bandwidth at half maximum, “bandwidth shift”
ΔU Potential difference
ΔUWE Potential difference between working and reference electrode
ΔU0 Potential difference between working electrode and setpoint dS Sauerbrey thickness dS,100%r.h. Sauerbrey thickness at 100% relative humidity dS,1%r.h. Sauerbrey thickness at 1% relative humidity dS,wet Sauerbrey thickness in the reactant solution dS,dry Sauerbrey thickness in air at ambient conditions F Faraday constant, F = 96485 C mol−1 ff Frequency of fundamental η Viscosity of liquid
hν Irradiation energy; product of Planck constant and wavelength i Current imax Maximum current imax
app Apparent maximum current determined by amperometry j Current density J’ Elastic compliance J’’ Viscous compliance jp Maximum current density k Rate constant KM Michaelis constant KM
app Apparent Michaelis constant determined by amperometry

101
mS Mass per unit area µq Shear modulus of quartz n Number of monomer repeat units or overtone order (QCM) Q Swelling ratio ρl Density of liquid
ρq Density of quartz
ρf Density of film R Resistance RS Solution resistance t Time T Temperature U Voltage v Rate of reaction vmax Maximum rate of reaction vr Potential ramp rate x Distance from electrode surface z Number of transferred electrons Zq Acoustic impedance of quartz, Zq = 8.8×10⁶ kg m−2 s−1
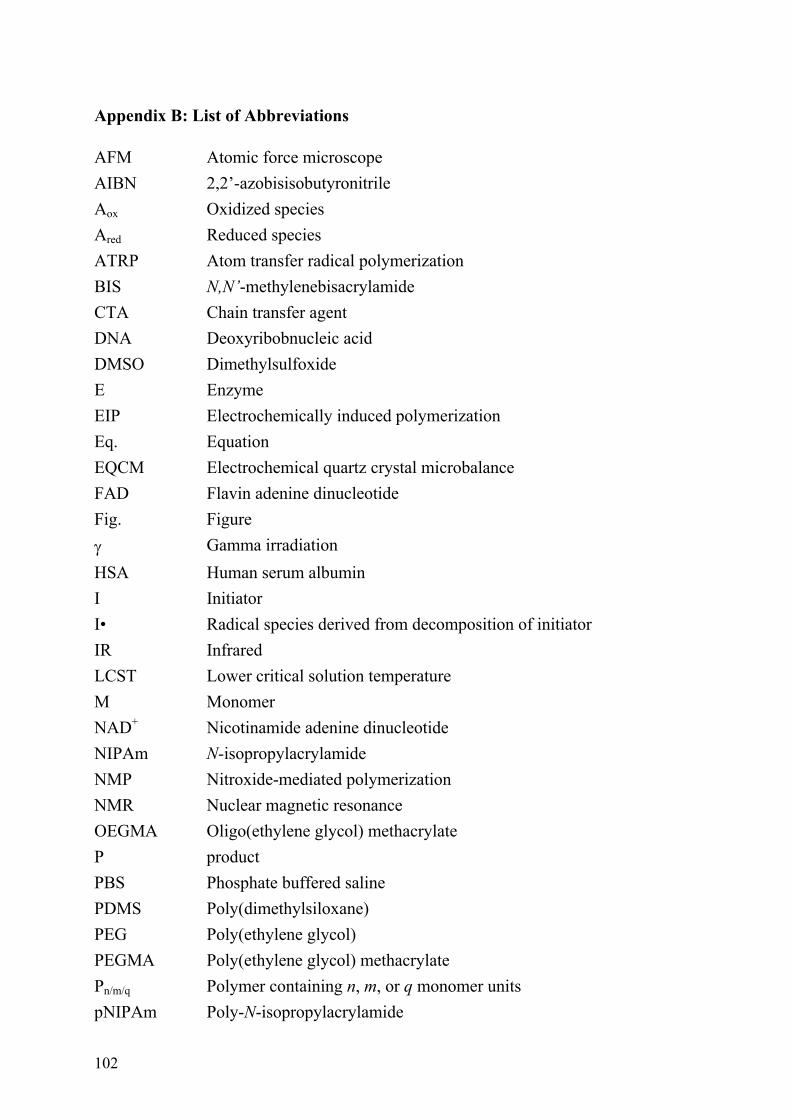
102
Appendix B: List of Abbreviations
AFM Atomic force microscope AIBN 2,2’-azobisisobutyronitrile Aox Oxidized species Ared Reduced species ATRP Atom transfer radical polymerization BIS N,N’-methylenebisacrylamide CTA Chain transfer agent DNA Deoxyribobnucleic acid DMSO Dimethylsulfoxide E Enzyme EIP Electrochemically induced polymerization Eq. Equation EQCM Electrochemical quartz crystal microbalance FAD Flavin adenine dinucleotide Fig. Figure γ Gamma irradiation HSA Human serum albumin I Initiator I• Radical species derived from decomposition of initiator IR Infrared LCST Lower critical solution temperature M Monomer NAD+ Nicotinamide adenine dinucleotide NIPAm N-isopropylacrylamide NMP Nitroxide-mediated polymerization NMR Nuclear magnetic resonance OEGMA Oligo(ethylene glycol) methacrylate P product PBS Phosphate buffered saline PDMS Poly(dimethylsiloxane) PEG Poly(ethylene glycol) PEGMA Poly(ethylene glycol) methacrylate Pn/m/q Polymer containing n, m, or q monomer units pNIPAm Poly-N-isopropylacrylamide

103
pOEGMA Poly(oligo(ethylene glycol) methacrylate) PQQ-sGDH Pyrrolo-quinoline quinone-dependent glucose dehydrogenase PVDF Polyvinylidene fluoride QCM Quartz crystal microbalance RAFT Reversible addition–fragmentation chain transfer Ref. Reference Rms Root mean square, rms of a collectrion of n values x1, x2, …, xn:
∑=
=n
1i
2irms
1 xn
x
SCE Saturated calomel electrode SECM Scanning electrochemical microscope SPR Surface plasmon resonance STM Scanning tunneling microscope TERP Tellurium-mediated radical polymerization UME Ultramicroelectrode UV Ultraviolett vs. Versus XPS X-ray photoelectron spectroscopy