Embed Size (px)
Citation preview
8/12/2019 Electrochemical deposition of silver and gold from cyanide leaching solutions.pdf
http://slidepdf.com/reader/full/electrochemical-deposition-of-silver-and-gold-from-cyanide-leaching-solutionspdf 1/17
Electrochemical deposition of silver and gold from cyanide
leaching solutions
V. Reyes-Cruz, C. Ponce-de-Leon, I. Gonzalez *, M.T. Oropeza
Departamento de Quı mica, Universidad Auto noma Metropolitana-Iztapalapa, Apdo. Postal 55-534, C.P. 09340 Me xico D.F., Mexico
Received 20 March 2001; received in revised form 14 November 2001; accepted 4 June 2002
Abstract
A systematic voltammetric study developed in this work allows the determination of the potential range at which the
selective deposition of gold and silver is carried out in the presence of a high content of copper. As a first approach, laboratory
solutions prepared with a high content of cyanide and copper and low values of gold and silver are used; later, the methodology
is applied to leaching solutions of industrial origin.
The chemical speciation and microelectrolysis studies showed that copper deposition occurs at more negative potentials than
deposition of gold and silver. Also, the voltammetric study of a cyanide solution containing low concentrations of Au(I) and
Ag(I), free of and with high concentration of Cu(I) was carried out. The study shows the potential range at which Au(I) and
Ag(I) are reduced despite the high concentration of the Cu(I) ions. The deposition of gold and silver was not interfered with by
the high concentration of Cu(I) ions when the leaching solution was electrolyzed in a laboratory electrochemical reactor FM01-LC with a reticulated vitreous carbon (RVC) cathode.
D 2002 Elsevier Science B.V. All rights reserved.
Keywords: Silver cyanide; Gold cyanide; Copper cyanide; Electrochemical recovery; Cyanide leaching; RVC electrode; Electrodeposition
1. Introduction
Cyanide leaching processes have been used by the
mining industry for over 100 years in the extraction of
noble metals (Kordosky et al., 1992; Fleming, 1992).Minerals from which most of the noble metals are
obtained are increasingly poorer (gold and silver
concentrations in the order of 1– 5 ppm), so the
leaching solutions from these processes do contain
Au(I), Ag(I) and Cu(I), with copper in concentrations
typically over a hundred times higher than the other
two metals. This high concentration of Cu(I) might
interfere during the selective recovery of gold and
silver (Jha, 1984), and the use of ion exchange resins
or activated carbon to remove the Cu(I) ion is often
necessary to obtain a concentrated solution of Au(I)and Ag(I). The following stage after the removal of
interfering ions is the recovery of noble metals. Two
traditional methods have been used: cementation and
electrolysis (Fleming, 1992; Jha, 1984). The electrol-
ysis method has been used in concentrated solutions
in electrochemical reactors with plane electrodes (e.g.
electrodeposition of copper or zinc); however, with
dilute solutions, the efficiency is low (Jha, 1984;
Reyes, 1998). Works reported in the literature have
shown that the high surface area found in porous
0304-386X/02/$ - see front matter D 2002 Elsevier Science B.V. All rights reserved.P I I : S 0 3 0 4 - 3 8 6 X ( 0 2 ) 0 0 0 8 3 - X
* Corresponding author. Fax: +52-5804-4666.
E-mail address: [email protected] (I. Gonzalez).
www.elsevier.com/locate/hydromet
Hydrometallurgy 65 (2002) 187–203
8/12/2019 Electrochemical deposition of silver and gold from cyanide leaching solutions.pdf
http://slidepdf.com/reader/full/electrochemical-deposition-of-silver-and-gold-from-cyanide-leaching-solutionspdf 2/17
electrodes increases the efficiency when used with
diluted solutions (Bennion and Newman, 1972;
Coeuret, 1976; Coeuret et al., 1976; Trainham and
Newman, 1977; Olive and Lacoste, 1980; Coeuret andStorck, 1981). Most gold plants actually use stainless
steel wool as cathode. The recovery of Au(I) and
Ag(I) at concentrations between 11 and 30 ppm has
been recently studied (Waterman et al., 1984; Reyes et
al., 2002; Stavart et al., 1999). However, the recovery
of Au(I) and Ag(I) from solutions containing high
concentration of Cu(I) in cyanide solutions has
received less attention.
Since the metal with the highest concentration
would be expected to be the first deposited, the
presence of large amount s of Cu(I) is likely to
influence the selective recovery of gold or silver.
Preliminary studies performed on stainless steel 304,
vitreous carbon and Ti showed that vitreous carbon is
the most adequate material for performing Ag(I)
deposition from a diluted silver solution (11 ppm)
with a high content of copper (Reyes, 1998).
The solution used in this preliminary study (0.1
M Cu(I), 0.5 M CN and 10 4 M Ag(I)) differs
significantly from the solutions from industrial
leaching processes with cyanides; nevertheless, the
conditions of high copper and cyanide concentra-
tions allowed the realization of an electrochemicalstudy on a vitreous carbon electrode where the
recovery of silver was shown to be possible without
the deposition of copper, despite the fact that the
concentration of Cu(I) was 100 times higher than the
concentration of silver (Reyes et al., 2002). The
study showed that the Cu(I) deposited at potentials
more negative than Ag(I) and that the cyanide
species of Cu(I) modified the capacitive current
densities of the media (CN ), making favorable
the deposition of silver. On the other hand, in this
study, a systematic methodology is established todetermine the potential range at which the selective
silver deposition takes place. For that reason, it
confronts the problem of faradaic current density
response from the reduction process of a low silver
concentration (11 ppm) masked by the capacitive
current of cyanide. Thus, a part of information of a
previously performed study (Reyes et al., 2002) is
taken up again and the same methodology is applied
in order to study the model solutions containing (a)
Au(I) and (b) Au(I) with Ag(I) in the presence and
absence of Cu(I) (laboratory solutions). This allows
later analysis validation of the results obtained in the
study of an industrial leaching solution containing
low concentrations of copper and cyanide and muchlower concentrations of noble metals (of the order of
1–5 ppm).
Firstly, speciation and voltammetric studies of a
cyanide solution with a high concentration of Cu(I)
and low concentrations of Au(I) (laboratory solution)
were carried out. The purpose of this study was to find
out whether the high concentration of copper inter-
feres with the selective deposition of gold. After this
experiment, a voltammetric study of the cyanide
solution containing the three metallic ions (high
Cu(I) concentration and low concentrations of Au(I)
and Ag(I), laboratory solutions), was carried out in
order to determine if the interaction between the three
metal ions changes the potential range at which the
selective reduction of Au(I) and Ag(I) occurs. After-
wards, the same methodology was applied to the
industrial leaching solution.
Once the potential range of the Au(I) and Ag(I)
reduction was established, an electrolysis of the cya-
nide leaching solution containing the three metallic
ions was carried out in an electrochemical FM01-LC
laboratory reactor.
2. Experimental
A 100-ml Pyrex cell with a three-electrode system
and nitrogen inlet was used in the voltammetric study.
The working electrode was a vitreous carbon rod with
geometric area of 0.07 cm2. The electrode surface was
polished with 0.3-Am alumina powder/water and
rinsed with deionised water followed by ultrasonic
bath for 5 min to remove traces of alumina, grease and
a final rinse with deionised water. The reference andcounter electrodes were saturated calomel and graph-
ite, respectively. The solutions were:
Laboratory solutions for methodology validation
(a) Cyanide solution 0.5 M KCN
(b) Cyanide solution
of Cu(I)
0.1 M CuCN and
0.5 M KCN
(c) Cyanide solution
of Au(I)
10 4 M KAuCN2 and
0.5 M KCN
V. Reyes-Cruz et al. / Hydrometallurgy 65 (2002) 187–203188
8/12/2019 Electrochemical deposition of silver and gold from cyanide leaching solutions.pdf
http://slidepdf.com/reader/full/electrochemical-deposition-of-silver-and-gold-from-cyanide-leaching-solutionspdf 3/17
All solutions except the industrial leaching solution
were prepared with deionised water 18 MV 1 cm 1
and analytical grade reagents. The pH was held
constant at 10 for laboratory solutions and the solu-
tions were deoxygenated with nitrogen for 10 min
prior to cyclic voltammetry experiments. A flux of nitrogen previously saturated in a CN solution was
held on the surface of the solution during the experi-
ments without disturbing the electrolyte.
The electrolysis of the selective reduction of Au(I)
and Ag(I) in the presence of high concentrations of
Cu(I) was carried out using an industrial leaching
solution on a filter press electrochemical reactor,
FM01-LC. A full description of this reactor has been
outlined in the literature (Brown and Plecher, 1992;
Brown and Plecher, 1993; Brown and Plecher, 1994).
A cationic NafionR
membrane NX550 divided theanodic and cathodic reactor compartments. The cath-
ode used was a reticulated vitreous carbon (RVC)
electrode with 60 pores per inch (ppi), filling a
volume of 31 cm3 (Electrosynthesis). Copper plates
glued by conductive carbon paste made the electrical
contact with the RVC electrode. The anode was an
A304 stainless steel plate.
The industrial solution was re-circulated through
the anolyte and catholyte compartments using two
centrifugal pumps obtained from Cole Palmer. A
potentiostat EG and G model PARC 273A with a
Booster KEPCO (0–20 A and 0–20 V) and the M270
software were used in the voltammetric and macro-
electrolysis experiments. The determination of totalAu(I), Ag(I) and Cu(I) concentrations was carried out
by atomic absorption spectroscopy (AAS) (Varian
model Spectr AA-20).
3. Results and discussion
3.1. Laboratory solutions
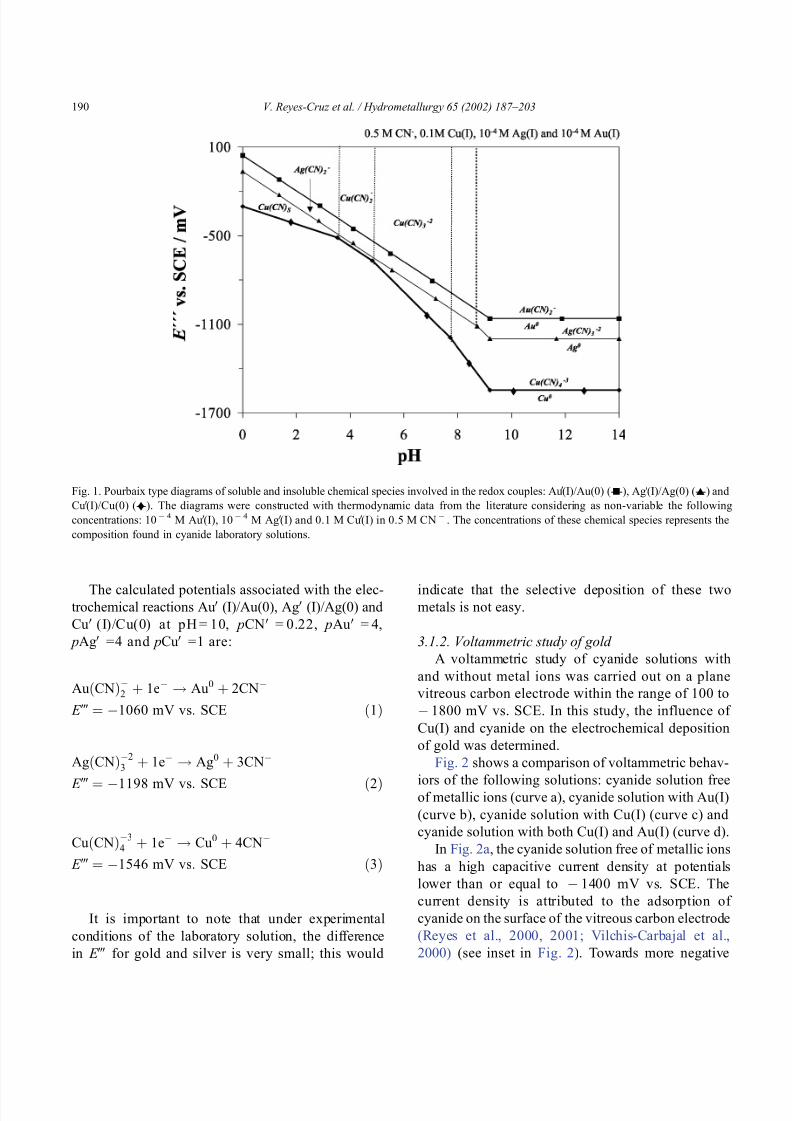
3.1.1. Chemical speciation study
A chemical speciation study was performed in order
to establish the nature of the electroactive species of
gold, silver and cop per in cyanide solutions. A Pour-
baix type diagram (Fig. 1) was constructed using the
thermodynamic data for soluble and insoluble species
of gold, silver and copper reported in the literature
(Ringbom, 1963; Zhang et al., 1997; Caroli and
Sharma, 1978), taking into account the laboratory
solution conditions ( pCN V=log[CN V] = 0.222 ,
pAu V= log[Au V(I)]= 4, pAg V= log[Ag V(I)]=4 and
pCu V(I)= log[Cu V(I)] = 1) using the method proposed
by Rojas et al. (1991, 1993). The M V(I) corresponds to
the gener alized chemical species of the metallic ion insolution (Rojas et al., 1991, 1993).
The full lines in Fig. 1 represent the conditional
potential change of the system M V(I)/M(0) with pH.
The dotted lines represent the limit of the pH range
where a particular metal ion species predominates
(high molar fraction) with respect to the other
cyanide species of the same metallic ion (generalized
chemical species), or in the other case, the solubility
limit for CuCN(s). Fig. 1 shows that under the
chemical conditions of leaching solutions, there are
four copper, two silver and one gold species of cyanide.
Fig. 1 shows that, at any pH, the redox potential
of the couple Cu V(I)/Cu(0) has more negative values
with respect to the potential of the couples Au V(I)/
Au(0) and Ag V(I)/Ag(0). These results indicate that
under thermodynamic considerations, the copper
species should not interfere with the selective reduc-
tion of Au(I) and Ag(I) under experimental condi-
tions of laboratory solution used to validate the
methodology.
(d) Cyanide solution
of Au(I) and Cu(I)
0.1 M CuCN,
10 4 M KAuCN2
and 0.5 M KCN
(e) Cyanide solution
of Au(I),Ag(I) and Cu(I)
0.1 M CuCN,
10
4 M KAuCN2,10 4 M AgNO3
and 0.5 M KCN
Industrial leaching solution
(f) Industrial leaching
solution
0.025 M (400 ppm)
free CN ,
8 10 3 M
(500 ppm) Cu(I),
5 10 6 M
(1 ppm) Au(I),
3 10 5 M
(3 ppm) Ag(I),
0.015 M (615 ppm) Ca,
0.025 M (575 ppm) Na
and 3 10 4 M
(17 ppm) Zn at pH 11
V. Reyes-Cruz et al. / Hydrometallurgy 65 (2002) 187–203 189
8/12/2019 Electrochemical deposition of silver and gold from cyanide leaching solutions.pdf
http://slidepdf.com/reader/full/electrochemical-deposition-of-silver-and-gold-from-cyanide-leaching-solutionspdf 4/17
The calculated potentials associated with the elec-trochemical reactions Au V(I)/Au(0), Ag V(I)/Ag(0) and
Cu V(I)/Cu(0) at pH = 10, pCN V= 0.22, pAu V= 4,
pAg V=4 and pCu V =1 are:
AuðCNÞ2 þ 1e ! Au0 þ 2CN
E j ¼ 1060 mV vs: SCE ð1Þ
AgðCNÞ23 þ 1e ! Ag0 þ 3CN
E j¼ 1198 mV vs
:
SCE ð2Þ
CuðCNÞ34 þ 1e ! Cu0 þ 4CN
E j ¼ 1546 mV vs: SCE ð3Þ
It is important to note that under experimental
conditions of the laboratory solution, the difference
in E j for gold and silver is very small; this would
indicate that the selective deposition of these twometals is not easy.
3.1.2. Voltammetric study of gold
A voltammetric study of cyanide solutions with
and without metal ions was carried out on a plane
vitreous carbon electrode within the range of 100 to
1800 mV vs. SCE. In this study, the influence of
Cu(I) and cyanide on the electrochemical deposition
of gold was determined.
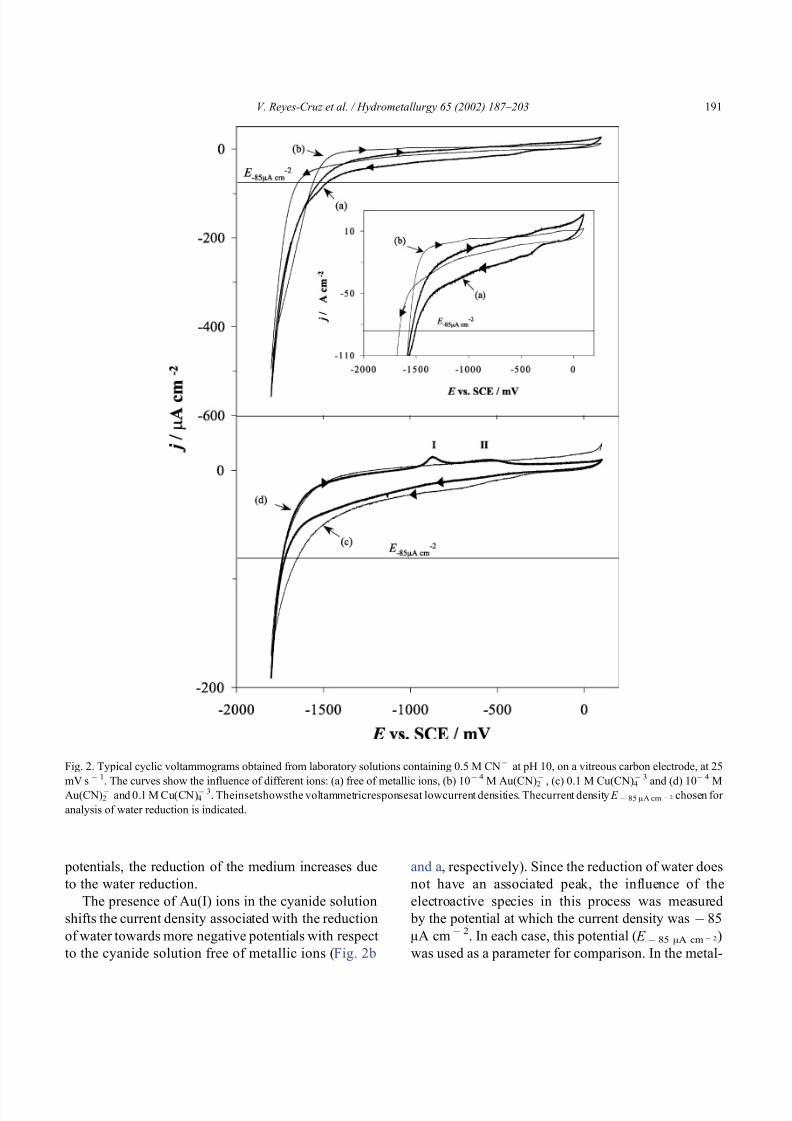
Fig. 2 shows a comparison of voltammetric behav-
iors of the following solutions: cyanide solution freeof metallic ions (curve a), cyanide solution with Au(I)
(curve b), cyanide solution with Cu(I) (curve c) and
cyanide solution with both Cu(I) and Au(I) (curve d).
In Fig. 2a, the cyanide solution free of metallic ions
has a high capacitive current density at potentials
lower than or equal to 1400 mV vs. SCE. The
current density is attributed to the adsorption of
cyanide on the surface of the vitreous carbon electrode
(Reyes et al., 2000, 2001; Vilchis-Carbajal et al.,
2000) (see inset in Fig. 2). Towards more negative
Fig. 1. Pourbaix type diagrams of soluble and insoluble chemical species involved in the redox couples: Au V(I)/Au(0) (-n-), Ag V(I)/Ag(0) (-E-) and
Cu V(I)/Cu(0) (-y-). The diagrams were constructed with thermodynamic data from the literature considering as non-variable the following
concentrations: 10 4 M Au V(I), 10 4 M Ag V(I) and 0.1 M Cu V(I) in 0.5 M CN . The concentrations of these chemical species represents the
composition found in cyanide laboratory solutions.
V. Reyes-Cruz et al. / Hydrometallurgy 65 (2002) 187–203190
8/12/2019 Electrochemical deposition of silver and gold from cyanide leaching solutions.pdf
http://slidepdf.com/reader/full/electrochemical-deposition-of-silver-and-gold-from-cyanide-leaching-solutionspdf 5/17
potentials, the reduction of the medium increases due
to the water reduction.
The presence of Au(I) ions in the cyanide solution
shifts the current density associated with the reduction
of water towards more negative potentials with respect
to the cyanide solution free of metallic ions (Fig. 2b
and a, respectively). Since the reduction of water does
not have an associated peak, the influence of the
electroactive species in this process was measured
by the potential at which the current density was 85
AA cm 2. In each case, this potential ( E 85 AA cm 2)
was used as a parameter for comparison. In the metal-
Fig. 2. Typical cyclic voltammograms obtained from laboratory solutions containing 0.5 M CN at pH 10, on a vitreous carbon electrode, at 25
mV s
1
. The curves show the influence of different ions: (a) free of metallic ions, (b) 10
4
M Au(CN)2
, (c) 0.1 M Cu(CN)4
3
and (d) 10
4
MAu(CN)2 and 0.1 M Cu(CN)4
3. Theinsetshowsthe voltammetricresponsesat lowcurrent densities. Thecurrent density E 85 AA cm 2 chosen for
analysis of water reduction is indicated.
V. Reyes-Cruz et al. / Hydrometallurgy 65 (2002) 187–203 191
8/12/2019 Electrochemical deposition of silver and gold from cyanide leaching solutions.pdf
http://slidepdf.com/reader/full/electrochemical-deposition-of-silver-and-gold-from-cyanide-leaching-solutionspdf 6/17
free solution, E 85 AA cm 2 = 1506 mV vs. SCE,
while in the solution containing Au(I), E 85 AA cm 2 =
1658 mV vs. SCE. The presence of gold reduces the
capacitive current density, which was attributed t o thecomplexes of gold with the adsorbed cyanide (Mac
Arthur, 1972; Kirk et al., 1980; Mughogho and
Crundwell, 1996; Chrzanowski et al., 1996; Bindra
et al., 1989). In the reverse potential scan for the
solution containing Au(I) and CN , the current den-
sity was higher than in the forward scan. This is a
typical behavior of an interface modified by the
presence of a gold deposit. In the forward scan, the
gold and water were reduced on the vitreous carbon,
while in the reverse scan, they were reduced on the
gold. Due to the low concentration of Au(I) in the
cyanide solution, the cathodic current density associ-
ated with the reverse scan is directly attributed to the
reduction of water which notably increases the inter-
facial pH. In the inset of Fig. 2b, it can be seen that
during the reverse scan, the curve has an associated
constant current density in the potential range of
1050 to 400 mV vs. SCE. This observation
suggests the formation of a passive film does not allow
the gold dissolution to be seen as it has been reported
in the literature (Mac Arthur, 1972; Kirk et al., 1980;
Mughogho and Crundwell, 1996). The said passive
film was enhanced by the pH modification at theinterface. This fact does not allow the gold deposition
to be clearly evidenced; however, the above descrip-
tion of voltammetric behavior suggests the presence of
deposited gold.
The influence of the Cu(I) ion in the cyanide
solution (Fig. 2c) can be seen in the voltammetric
response as a shift of the reduction potential of water
towards more negative potentials ( E 85 AA cm 2 =
1664 mV vs. SCE), and a modification of the
capacitive current density. The latter effect can be
attributed to the fact that Cu(I) is adsorbed on thevitreous carbon surface (Reyes et al., 2000, 2001)
and competes with the adsorbed cyanide species
(Reyes et al., 2000, 2001; Vilchis-Carbajal et al.,
2000). On the other hand, there are no peaks asso-
ciated with the reduction and oxidation of copper in
the range of the potential scan studied. In a previous
work, it was shown that the reduction of Cu(I) on a
vitreous carbon electrode from a cyanide solution
begins at a potential of 2200 mV vs. SCE (Reyes
et al., 2002).
From Fig. 2d, it can be seen that the presence of
Au(I) and Cu(I) in the cyanide solution causes a
more negative potential for the reduction of water
( E 85 AA cm
2 = 1728 mV vs. SCE) with respect to Fig. 2a, b and c. This indicates that Au(I) and Cu(I)
ions in the cyanide solution have an influence on the
capacitive current densities and the reduction of water
since both metals involve species adsorbed on the
vitreous carbon surface (Reyes et al., 2000, 2001; Mac
Arthur, 1972; Kirk et al., 1980; Mughogho and
Crundwell, 1996; Chrzanowski et al., 1996; Bindra
et al., 1989). The competition between different
adsorbates on the vitreous carbon causes a modifica-
tion of the voltammetric response. In this work, we
associated such behavior with the modification of the
capacitive current densities. A more detailed study
could consider the evaluation of these capacitive
currents, however, it is out of the scope of this work.
During the reverse scan in Fig. 2d, there are two
oxidation processes: process I at 900 mV vs. SCE,
and process II at 550 mV vs. SCE. These processes
can be attributed to the oxidation of gold as reported
in the literature (Mac Arthur, 1972; Kirk et al., 1980;
Mughogho and Crundwell, 1996) or to the dissolution
of the codeposit Cu/Au (as shown below). When
Cu(I) is in solution, it is possible to observe the
oxidation process of gold, which indicates that the passive process seen in alkaline media has been
modified by the Cu(I), because the pH modification
in the interface is notably diminished. This effect is
similar to that reported for the presence of lead in the
gold oxidation process.
From the above study, it was considered necessary
to identify the potential range at which the selective
deposition of gold occurs in the presence of high
concentration of Cu(I). This was done by a voltam-
metric study, shifting the switching potential E k
towards negative values.
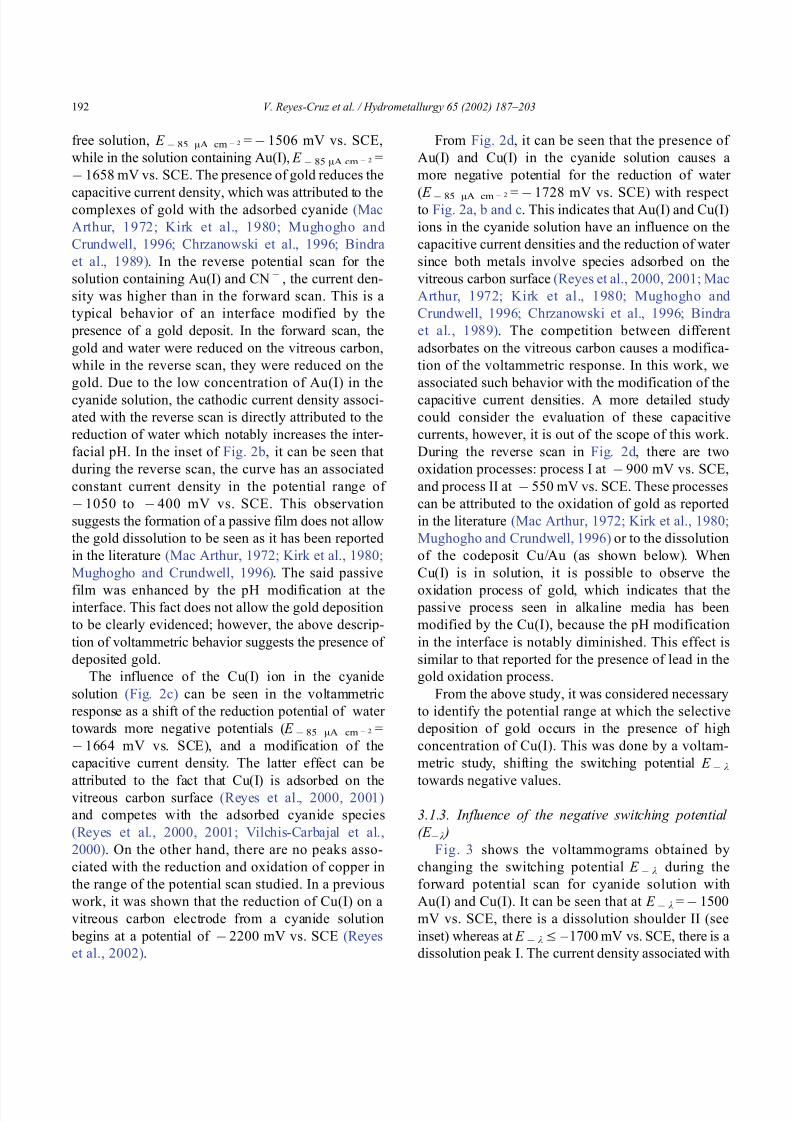
3.1.3. Influence of the negative switching potential
(E k )
Fig. 3 shows the voltammograms obtained by
changing the switching potential E k during the
forward potential scan for cyanide solution with
Au(I) and Cu(I). It can be seen that at E k = 1500
mV vs. SCE, there is a dissolution shoulder II (see
inset) whereas at E kV – 1700 mV vs. SCE, there is a
dissolution peak I. The current density associated with
V. Reyes-Cruz et al. / Hydrometallurgy 65 (2002) 187–203192
8/12/2019 Electrochemical deposition of silver and gold from cyanide leaching solutions.pdf
http://slidepdf.com/reader/full/electrochemical-deposition-of-silver-and-gold-from-cyanide-leaching-solutionspdf 7/17
these two processes increases as the switching poten-
tial E k is changed toward more negative potentials.
These two processes could be associated with the
oxidation of metallic gold deposited during the for-
ward scan, since in a previous work, it was demon-strated that the reduction of Cu(I) in a cyanide solution
(Au(I) free) on a vitreous carbon electrode begins at
2200 mV vs. SCE (Reyes et al., 2002). However, the
potential of the peak I shifts towards negative potential
values as the E k turns more negative; at E
kV
2000 mV vs. SCE, the current density peak in-
creases, indicating the formation of the codeposit Cu/
Au or the massive deposition of copper.
The dissolution of both the codeposit Cu/Au and
the metallic Au occurs at very similar potentials and
therefore, the identification of each dissolution proc-
ess is complex. It was not possible to identify the
exact potential range of gold deposition free of
copper, so it was decided to quantitatively analyze
the voltammetric curves. The associated charge of theoxidation processes, Qa, was determined from the
area under the voltammetric curves of solutions con-
taining Au(I) and Cu(I), Fig. 3, and plotted as a
function of E k (Fig. 4a).
In Fig. 4a, the curve of the charge Qa as a function of
E k for the cyanide solution containing Au(I) and
Cu(I) ions shows a linear correlation in the switching
potential range of 1700 z E k, z 1900 mV vs.
SCE. This linear behavior can be attributed to the gold
deposit on the vitreous carbon electrode. On the other
Fig. 3. Partial view of typical cyclic voltammograms obtained from a laboratory solution containing 10 4 M Au(CN)2 and 0.1 M Cu(CN)4
3
in 0.5 M CN at pH 10, on a vitreous carbon electrode (0.07 cm 2) at 25 mV s 1. The voltammograms were obtained at different negative
switching potentials ( E k). The inset shows the voltammetric responses at low current densities.
V. Reyes-Cruz et al. / Hydrometallurgy 65 (2002) 187–203 193
8/12/2019 Electrochemical deposition of silver and gold from cyanide leaching solutions.pdf
http://slidepdf.com/reader/full/electrochemical-deposition-of-silver-and-gold-from-cyanide-leaching-solutionspdf 8/17
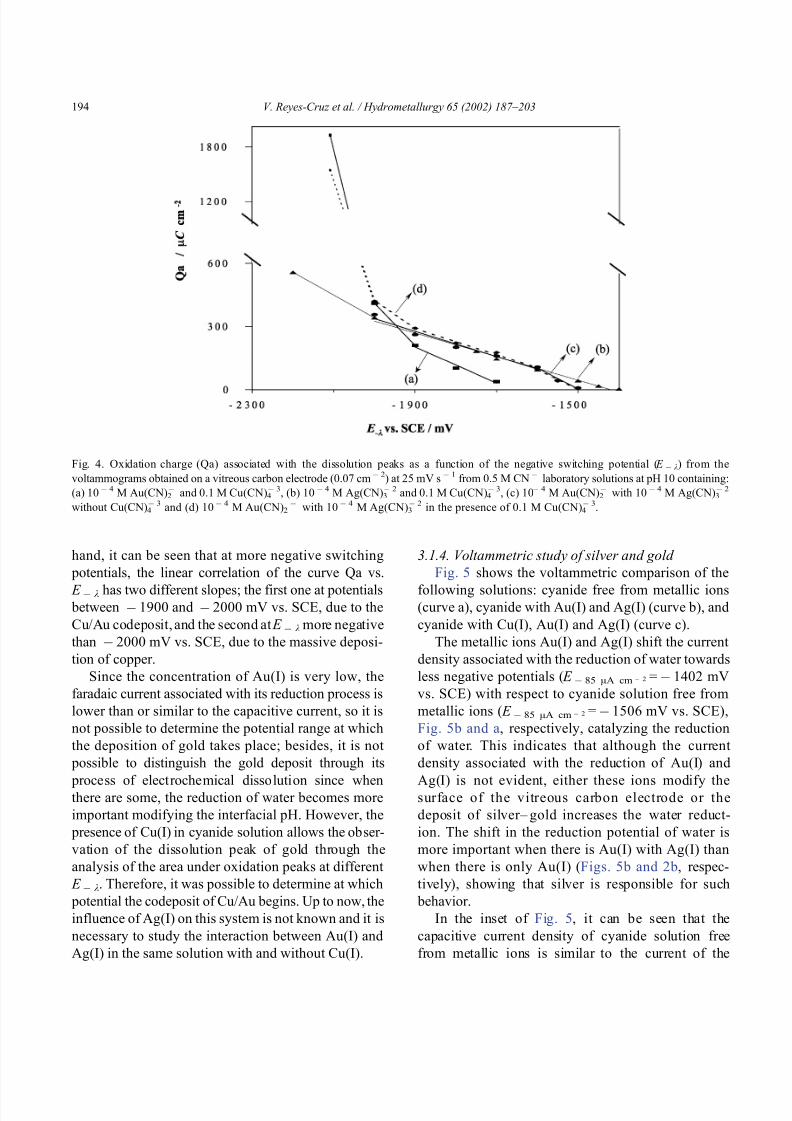
hand, it can be seen that at more negative switching
potentials, the linear correlation of the curve Qa vs.
E k has two different slopes; the first one at potentials between 1900 and 2000 mV vs. SCE, due to the
Cu/Au codeposit, and the second at E k more negative
than 2000 mV vs. SCE, due to the massive deposi-
tion of copper.
Since the concentration of Au(I) is very low, the
faradaic current associated with its reduction process is
lower than or similar to the capacitive current, so it is
not possible to determine the potential range at which
the deposition of gold takes place; besides, it is not
possible to distinguish the gold deposit through its
process of electrochemical dissolution since whenthere are some, the reduction of water becomes more
important modifying the interfacial pH. However, the
presence of Cu(I) in cyanide solution allows the obser-
vation of the dissolution peak of gold through the
analysis of the area under oxidation peaks at different
E k. Therefore, it was possible to determine at which
potential the codeposit of Cu/Au begins. Up to now, the
influence of Ag(I) on this system is not known and it is
necessary to study the interaction between Au(I) and
Ag(I) in the same solution with and without Cu(I).
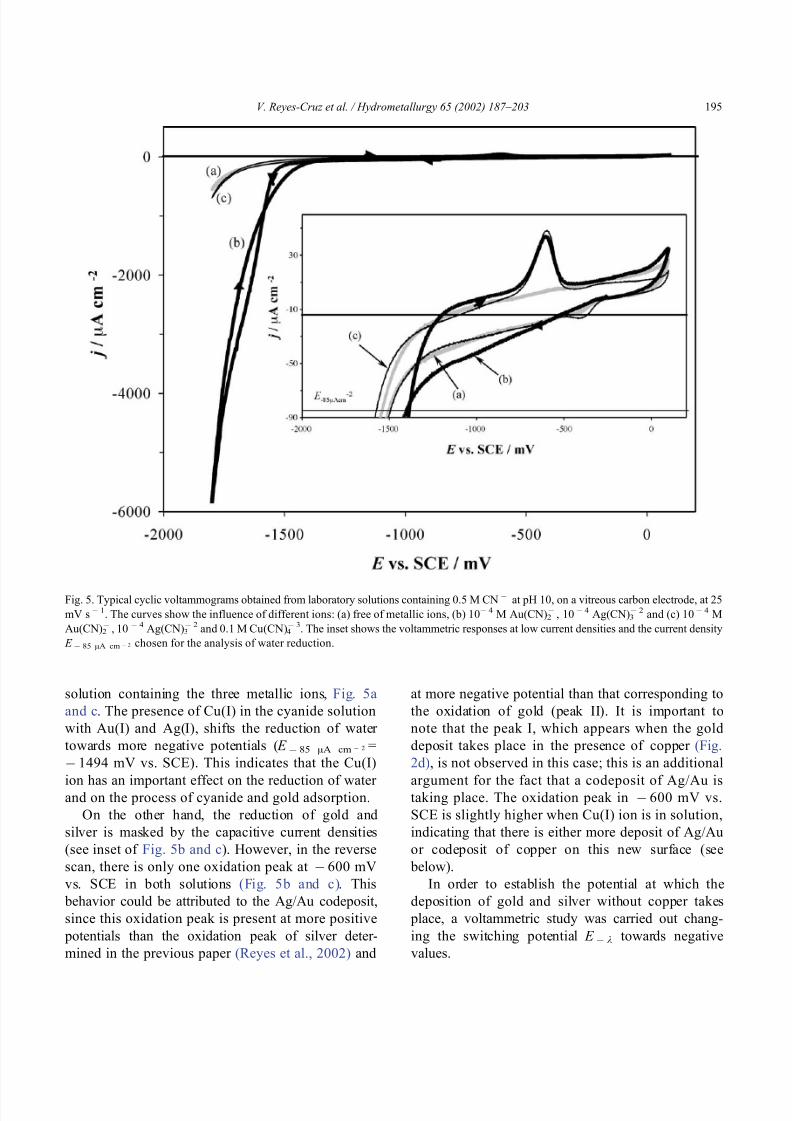
3.1.4. Vol tammetric study of silver and gold
Fig. 5 shows the voltammetric comparison of the
following solutions: cyanide free from metallic ions(curve a), cyanide with Au(I) and Ag(I) (curve b), and
cyanide with Cu(I), Au(I) and Ag(I) (curve c).
The metallic ions Au(I) and Ag(I) shift the current
density associated with the reduction of water towards
less negative potentials ( E 85 AA cm 2 = 1402 mV
vs. SCE) with respect to cyanide solution free from
metallic ions ( E 85 AA cm 2 = 1506 mV vs. SCE),
Fig. 5b and a, respectively, catalyzing the reduction
of water. This indicates that although the current
density associated with the reduction of Au(I) and
Ag(I) is not evident, either these ions modify thesurface of the vitreous carbon electrode or the
deposit of silver– gold increases the water reduct-
ion. The shift in the reduction potential of water is
more important when there is Au(I) with Ag(I) than
when there is only Au(I) (Figs. 5b and 2b, respec-
tively), showing that silver is responsible for such
behavior.
In the inset of Fig. 5, it can be seen that the
capacitive current density of cyanide solution free
from metallic ions is similar to the current of the
Fig. 4. Oxidation charge (Qa) associated with the dissolution peaks as a function of the negative switching potential ( E k) from the
voltammograms obtained on a vitreous carbon electrode (0.07 cm 2) at 25 mV s 1 from 0.5 M CN laboratory solutions at pH 10 containing:
(a) 10 4 M Au(CN)2 and 0.1 M Cu(CN)4
3, (b) 10 4 M Ag(CN)3 2 and 0.1 M Cu(CN)4
3, (c) 10 4 M Au(CN)2 with 10 4 M Ag(CN)3
2
without Cu(CN)4 3 and (d) 10 4 M Au(CN)2
with 10 4 M Ag(CN)3 2 in the presence of 0.1 M Cu(CN)4
3.
V. Reyes-Cruz et al. / Hydrometallurgy 65 (2002) 187–203194
8/12/2019 Electrochemical deposition of silver and gold from cyanide leaching solutions.pdf
http://slidepdf.com/reader/full/electrochemical-deposition-of-silver-and-gold-from-cyanide-leaching-solutionspdf 9/17
solution containing the three metallic ions, Fig. 5a
and c. The presence of Cu(I) in the cyanide solution
with Au(I) and Ag(I), shifts the reduction of water
towards more negative potentials ( E 85 AA cm 2 =
1494 mV vs. SCE). This indicates that the Cu(I)
ion has an important effect on the reduction of water and on the process of cyanide and gold adsorption.
On the other hand, the reduction of gold and
silver is masked by the capacitive current densities
(see inset of Fig. 5b and c). However, in the reverse
scan, there is only one oxidation peak at 600 mV
vs. SCE in both solutions (Fig. 5b and c). This
behavior could be attributed to the Ag/Au codeposit,
since this oxidation peak is present at more positive
potentials than the oxidation peak of silver deter-
mined in the previous paper (Reyes et al., 2002) and
at more negative potential than that corresponding to
the oxidation of gold (peak II). It is important to
note that the peak I, which appears when the gold
deposit takes place in the presence of copper (Fig.
2d), is not observed in this case; this is an additional
argument for the fact that a codeposit of Ag/Au istaking place. The oxidation peak in 600 mV vs.
SCE is slightly higher when Cu(I) ion is in solution,
indicating that there is either more deposit of Ag/Au
or codeposit of copper on this new surface (see
below).
In order to establish the potential at which the
deposition of gold and silver without copper takes
place, a voltammetric study was carried out chang-
ing the switching potential E k towards negative
values.
Fig. 5. Typical cyclic voltammograms obtained from laboratory solutions containing 0.5 M CN at pH 10, on a vitreous carbon electrode, at 25
mV s 1. The curves show the influence of different ions: (a) free of metallic ions, (b) 10 4 M Au(CN)2 , 10 4 Ag(CN)3
2 and (c) 10 4 M
Au(CN)2 , 10 4 Ag(CN)3
2 and 0.1 M Cu(CN)4 3. The inset shows the voltammetric responses at low current densities and the current density
E 85 AA cm 2 chosen for the analysis of water reduction.
V. Reyes-Cruz et al. / Hydrometallurgy 65 (2002) 187–203 195
8/12/2019 Electrochemical deposition of silver and gold from cyanide leaching solutions.pdf
http://slidepdf.com/reader/full/electrochemical-deposition-of-silver-and-gold-from-cyanide-leaching-solutionspdf 10/17
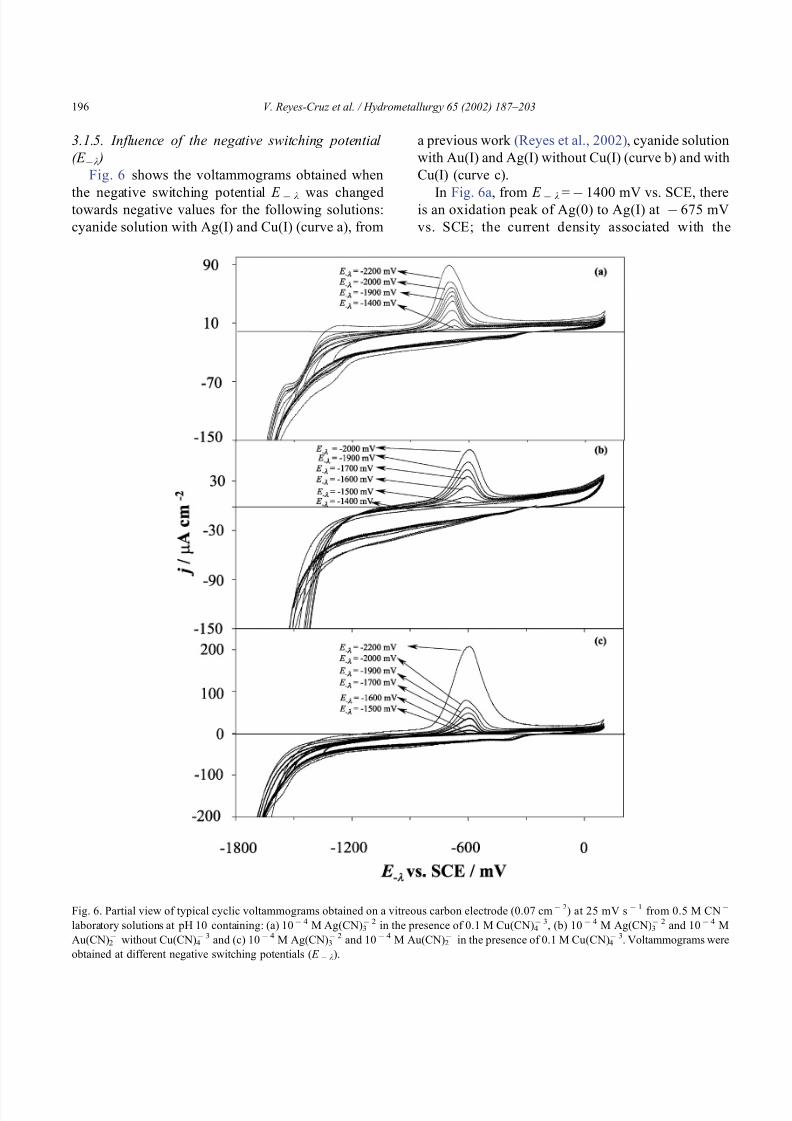
3.1.5. Influence of the negative switching potential
(E k )
Fig. 6 shows the voltammograms obtained when
the negative switching potential E k was changedtowards negative values for the following solutions:
cyanide solution with Ag(I) and Cu(I) (curve a), from
a previous work (Reyes et al., 2002), cyanide solution
with Au(I) and Ag(I) without Cu(I) (curve b) and with
Cu(I) (curve c).
In Fig. 6a, from E k = 1400 mV vs. SCE, thereis an oxidation peak of Ag(0) to Ag(I) at 675 mV
vs. SCE; the current density associated with the
Fig. 6. Partial view of typical cyclic voltammograms obtained on a vitreous carbon electrode (0.07 cm 2) at 25 mV s 1 from 0.5 M CN
laboratory solutions at pH 10 containing: (a) 10 4 M Ag(CN)3 2 in the presence of 0.1 M Cu(CN)4
3, (b) 10 4 M Ag(CN)3 2 and 10 4 M
Au(CN)2 without Cu(CN)4
3 and (c) 10 4 M Ag(CN)3 2 and 10 4 M Au(CN)2
in the presence of 0.1 M Cu(CN)4 3. Voltammograms were
obtained at different negative switching potentials ( E k).
V. Reyes-Cruz et al. / Hydrometallurgy 65 (2002) 187–203196
8/12/2019 Electrochemical deposition of silver and gold from cyanide leaching solutions.pdf
http://slidepdf.com/reader/full/electrochemical-deposition-of-silver-and-gold-from-cyanide-leaching-solutionspdf 11/17
oxidation peak increases as the switching potential
E k turns more negative.
Fig. 6b shows that in the solutions with Au(I) and
Ag(I), there is an oxidation peak at 600 mV vs.SCE from E
k = 1500 mV vs. SCE, with a current
density that increases as E k becomes more negative.
This peak shifts towards less negative values with
respect to the oxidation peak of silver (Fig. 6a),
indicating the normal codeposit of Ag/Au although
the gold dissolution at more negative potential is not
observed in this case.
The voltammogram of cyanide solution containing
the three metallic ions (Fig. 6c) also shows an oxida-
tion peak at 600 mV vs. SCE from E k = 1500
mV vs. SCE. The current density increases, as the
E k turns more negative. This oxidation peak was
shifted towards less negative potentials within the
range of E k from 1500 to 1600 mV vs. SCE.
However, for E kV 1700 mV vs. SCE, the poten-
tial peak now changed to negative values. This change
of the oxidation peak potential is associated with the
dissolution of different deposits (see below).
In order to identify the potential range at which the
gold and silver deposition is free of copper, a quanti-
tative study of the voltammetric curves was carried
out. The associated charge, Qa, of the solutions withand without copper, was calculated and plotted as a
function of the switching potential E k. Fig. 4 shows
the curves Qa vs. E k of the following solutions:
cyanide with Ag(I) and Cu(I) (curve b) obtained from
a previous work (Reyes et al., 2002), cyanide with
Au(I) and Ag(I) (curve c) and cyanide solution with
Au(I), Ag(I) and Cu(I) (curve d).
In Fig. 4, cyanide solutions of Au(I) and Ag(I)
without and with Cu(I), Fig. 4c and d, show the same
slope during the first three switching potentials E k,
thus indicating the same reduction process in these
solutions, the codeposit of Ag/Au. At more negative
switching potentials, the slope of the curve Qa vs.
E k of these solutions was similar to the slope of the
solution containing Ag(I) and Cu(I) (Fig. 4c, d and b,
respectively), indicating the occurrence of the silver
deposition process. On the other hand, in the solution
containing the three metallic ions (Fig. 4d), there is a
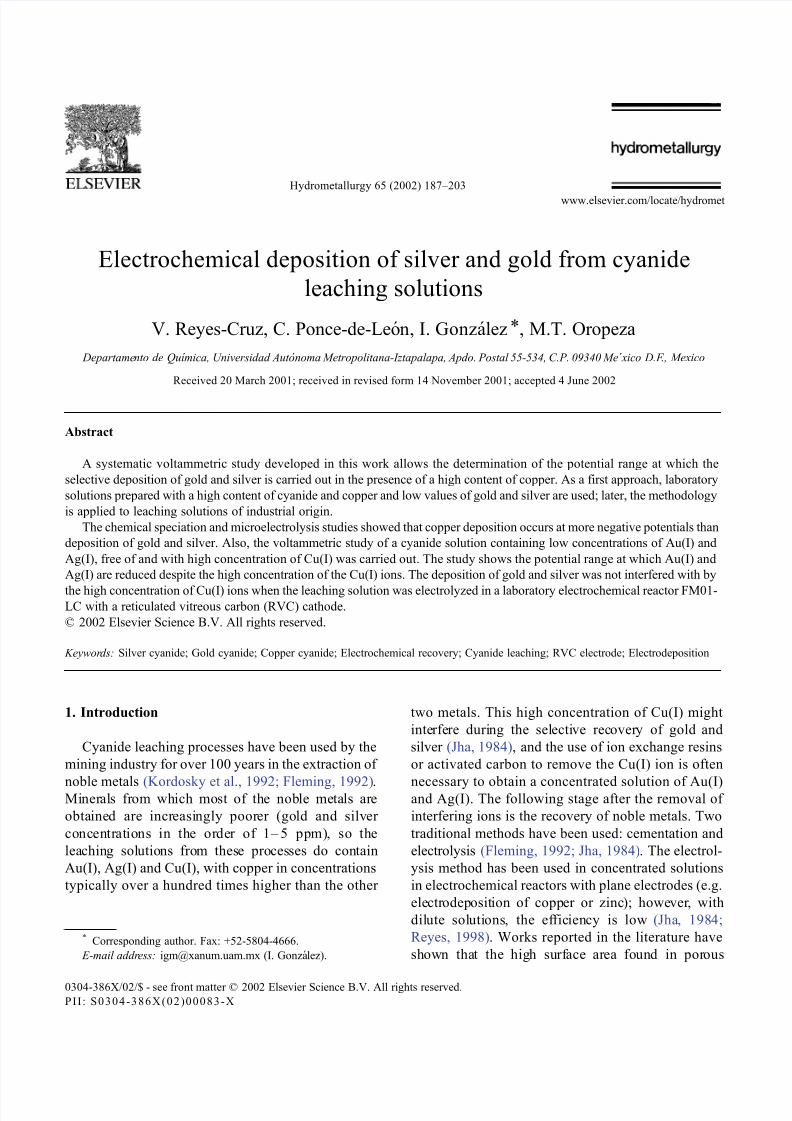
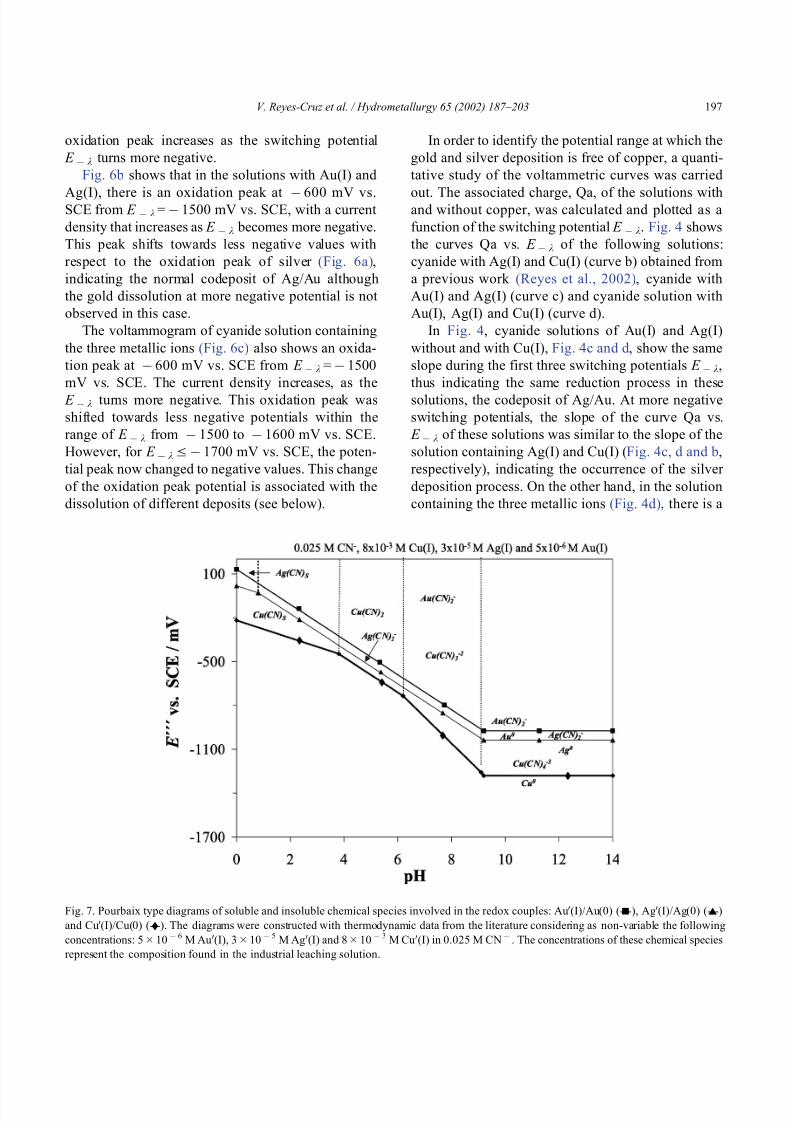
Fig. 7. Pourbaix type diagrams of soluble and insoluble chemical species involved in the redox couples: Au V(I)/Au(0) (-n-), Ag V(I)/Ag(0) (-E-)
and Cu V(I)/Cu(0) (-y-). The diagrams were constructed with thermodynamic data from the literature considering as non-variable the following
concentrations: 5 10 6 M Au V(I), 3 10 5 M Ag V(I) and 8 10 3 M Cu V(I) in 0.025 M CN . The concentrations of these chemical species
represent the composition found in the industrial leaching solution.
V. Reyes-Cruz et al. / Hydrometallurgy 65 (2002) 187–203 197
8/12/2019 Electrochemical deposition of silver and gold from cyanide leaching solutions.pdf
http://slidepdf.com/reader/full/electrochemical-deposition-of-silver-and-gold-from-cyanide-leaching-solutionspdf 12/17
change in the slope and an increase of the density
charge after E k = 1900 mV vs. SCE, which is
attributed to the codeposit Cu/Ag/Au and the massive
deposition of copper.From the comparative study of cyanide solutions
containing Au(I) and Ag(I) ions with and without
Cu(I), it is possible to determine the potential of the
codeposit Ag/Au free of copper. However, the poten-
tial deposition of silver and gold cannot be found
independently.
The methodology developed till now allows us to
establish the systematic electrochemical study that is
to be carried out in order to identify the codeposit of
Ag/Au without copper deposition from diluted gold
and silver solutions with a high content of copper and
cyanide. This methodology is then applied to an
industrial leaching bath.
3.2. Industrial leaching solution
3.2.1. Study of chemical speciation
The chemical speciation study of electroactive
species of Au, Ag and Cu present in the industrial
leaching solution ( pCN V= log[CN V]=1.6, pAu V=
log[Au V] = 5.3, pAg V= log[Ag V] = 4.55, an d
pCu V= log[Cu V]=2.1) is shown in Fig. 7. The
Pourbaix type diagram was constructed with thesame methodology used for the speciation study of
Fig. 1.
In Fig. 7, it can be observed that Cu presents four
cyanide species, whereas Ag presents two and Au
only one cyanide species. Under conditions of indus-
trial leaching (very dilute concentrations of gold,
silver and cyanide ions), it can be seen that the silver
cyanide species have a lower state of coordination
than that observed in the first study of speciation
carried out in this work (Fig. 1). On the other hand,
Fig. 7 shows that, again in all pH values, the potential
of the redox couple Cu(I)/Cu(0) appears at more
negative potentials with regard to the redox couples
Au(I)/Au(0) and Ag(I)/Ag(0), indicating that copper
does not interfere thermodynamically in the selective
deposition of gold and silver.
Potentials and thermodynamic reactions associated
with the Au(I)/Au(0), Ag(I)/Ag(0) and Cu(I)/Cu(0)
couples in an industrial leaching solution at pH = 11,
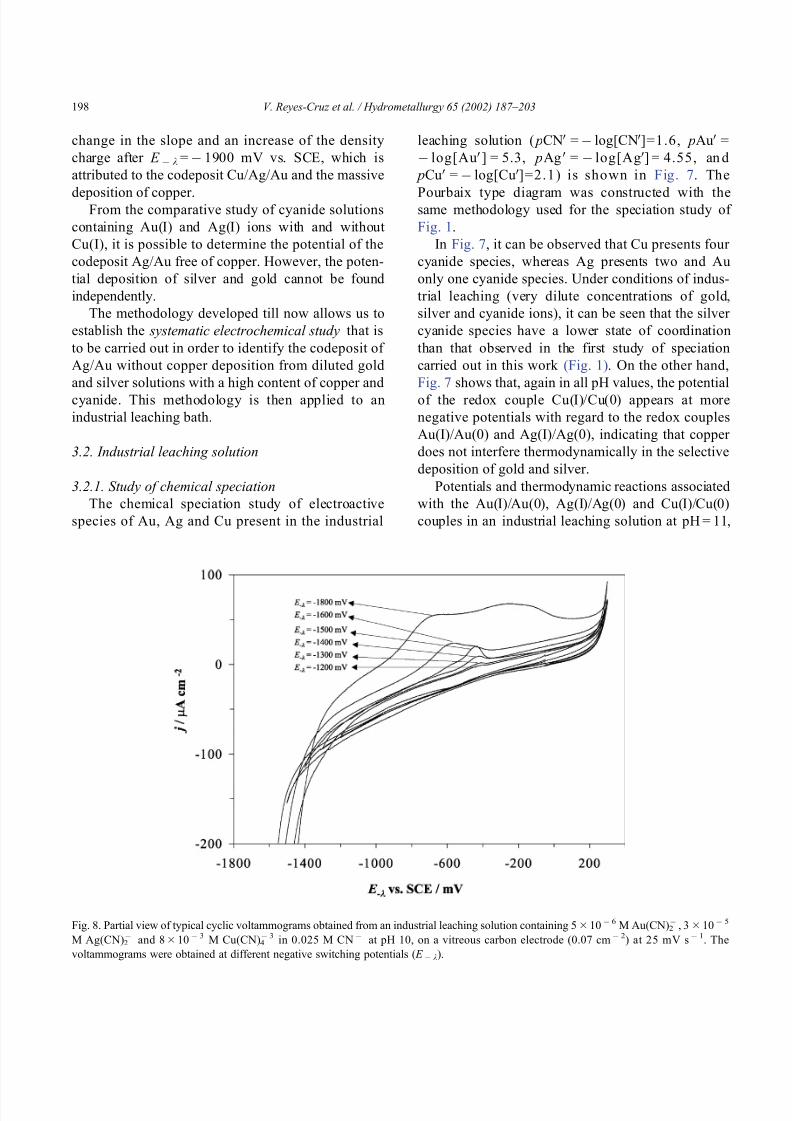
Fig. 8. Partial view of typical cyclic voltammograms obtained from an industrial leaching solution containing 5 10 6 M Au(CN)2 , 3 10 5
M Ag(CN)2 and 8 10 3 M Cu(CN)4
3 in 0.025 M CN at pH 10, on a vitreous carbon electrode (0.07 cm 2) at 25 mV s 1. The
voltammograms were obtained at different negative switching potentials ( E k).
V. Reyes-Cruz et al. / Hydrometallurgy 65 (2002) 187–203198
8/12/2019 Electrochemical deposition of silver and gold from cyanide leaching solutions.pdf
http://slidepdf.com/reader/full/electrochemical-deposition-of-silver-and-gold-from-cyanide-leaching-solutionspdf 13/17
pCN V = 1.6, pAu V= 5.3, pAg V= 4.55 and pCu V=2.1
are:
AuðCNÞ2 þ 1e
! Au0
þ 2CN
E j ¼ 973 mV vs: SCE ð4Þ
AgðCNÞ2 þ 1e ! Ag0 þ 2CN
E j ¼ 1037 mV vs: SCE ð5Þ
CuðCNÞ34 þ 1e ! Cu0 þ 4CN
E W ¼ 1280 mV vs: SCEð6Þ
It is important to stress that, in principle, the above-
predicted potentials should be more negative than
those previously obtained in Eqs. (1)–(3) because of
having much lower concentrations of gold, silver and
copper in relation to the laboratory solution used.
However, the potentials are less negative, which is
attributed to the lower concentration of cyanide in the
industrial leaching solution.
In this case, the potential difference E j between Au
and Ag is even smaller with regard to that seen in the
laboratory solution; this predicts that the separation of
these two metals is more difficult.
3.2.2. Infl uence of the switching potential scan (E k )
Fig. 8 shows the voltammograms obtained by
modifying the switching potential in direct potential
scan ( E k) for the industrial leaching solution. This
figure shows that from E k 1200 mV vs. SCE,
there is an oxidation peak at 425 mV vs. SCE and
that the current density associated with this peak
increases as the switching potential is shifted towards
more negative values. The oxidation peak appears
at less negative potentials within the range of E k
from 1200 to 1400 mV vs. SCE whereas at
E kV 1500 mV vs. SCE, the oxidation peak ap-
pears at more negative potentials, indicating the dis-
solution of different codeposits of gold, silver and
copper on the VC surface. The oxidation peak dis-
placement observed at less negative potentials in
relation to the oxidation peak of the laboratory sol-
ution study is due to the difference in concentration of
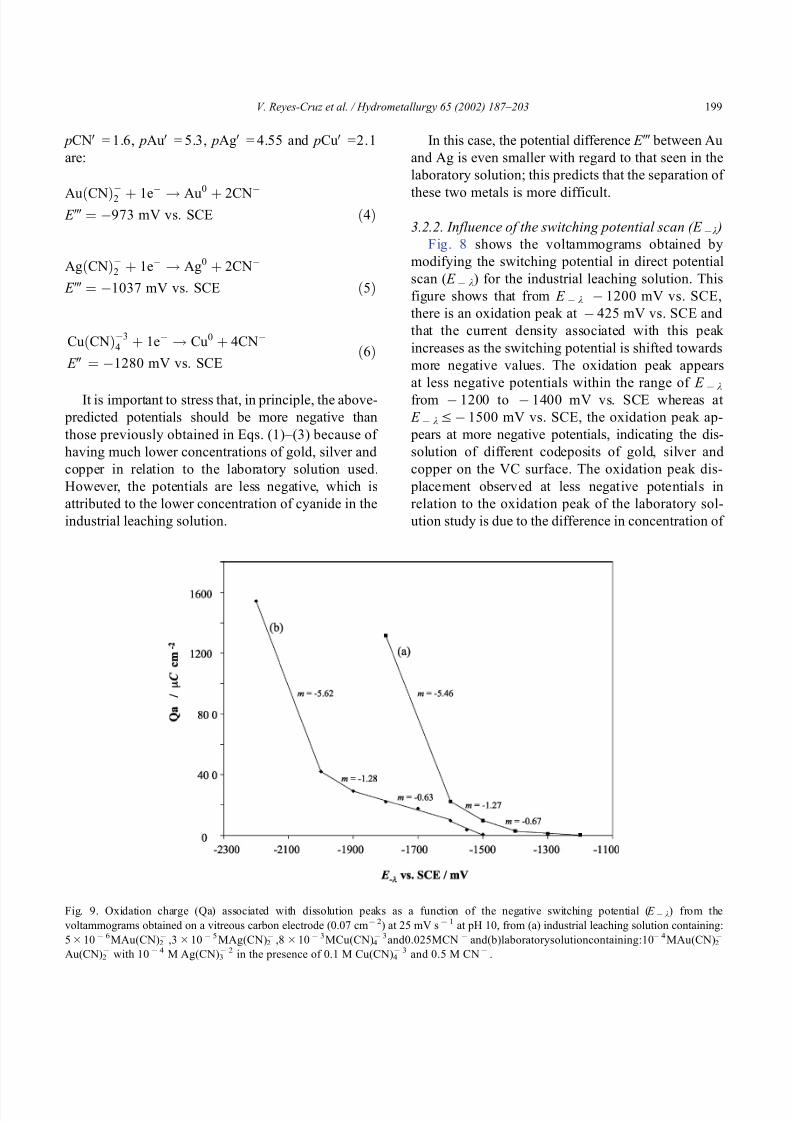
Fig. 9. Oxidation charge (Qa) associated with dissolution peaks as a function of the negative switching potential ( E k) from the
voltammograms obtained on a vitreous carbon electrode (0.07 cm 2) at 25 mV s 1 at pH 10, from (a) industrial leaching solution containing:
5 10 6MAu(CN)2 ,3 10 5 MAg(CN)2
,8 10 3MCu(CN)4 3and0.025MCN and(b)laboratorysolutioncontaining:10 4 MAu(CN)2
Au(CN)2 with 10 4 M Ag(CN)3
2 in the presence of 0.1 M Cu(CN)4 3 and 0.5 M CN .
V. Reyes-Cruz et al. / Hydrometallurgy 65 (2002) 187–203 199
8/12/2019 Electrochemical deposition of silver and gold from cyanide leaching solutions.pdf
http://slidepdf.com/reader/full/electrochemical-deposition-of-silver-and-gold-from-cyanide-leaching-solutionspdf 14/17
metallic ions of Au(I), Ag(I) and Cu(I) and a lower
concentration of cyanide in the solution.
On the other hand, in Fig. 8, it is observed that the
oxidation peaks of industrial leaching solution arewider with regard to laboratory solution and they
change their shape rapidly with increase in the switch-
ing potential. This indicates how complicated it would
be to develop the methodology to identify where the
Ag/Au codeposition takes place without the deposi-
tion of copper from the industrial leaching solution.
The statement above justifies the need to use higher
copper and cyanide concentrations to develop the
methodology used in this study.
With the purpose of determining the potential
range at which the deposition of Au(I) and Ag(I) free
of copper from the industrial leaching solution takes
place, the quantitative study of the voltammetric
curves was carried out through the charge associated
with E k-dependent oxidation peaks (Qa). Fig. 9
compares the Qa vs. E k curves of an industrial
leaching solution (curve a) in relation to that of the
previously obtained and discussed more concentrated
cyanide solution of Au(I), Ag(I), Cu(I) and CN
(curve b).
In Fig. 9, the behaviors of the slopes of the Qa vs.
E k curves of the cyanide solution, for the laboratory
solution prepared in the prior section, and the indus-
trial leaching solution are observed to be quite similar.On the other hand, it can be seen that for the industrial
leaching solution, there is a potential displacement
towards less negative values with regard to more
concentrated cyanide solution of Au(I), Ag(I), Cu(I)
and CN , which agrees with the speciation studies of
bot h solutions.
Fig. 9a shows that for the industrial leaching
solution, the codeposition attributed to Ag/Au takes
place within the potential range of 1200–1400 mV
vs. SCE (slope m = 0.13). Linear correlation in this
range does not show the same slope (m = 0.90) as
that obtained for more concentrated cyanide solution
of Au(I), Ag(I), Cu(I) and CN , because of the
nucleation processes of these metals on the vitreous
carbon electrode and the fact that, at lower over-
potentials, less gold and silver is deposited. However,
at E kV 1400 mV vs. SCE, the changes in the
slopes of the Qa vs. E k curves of the industrial
leaching solution are similar to the slope changes of
the more concentrated cyanide solution of Au(I),
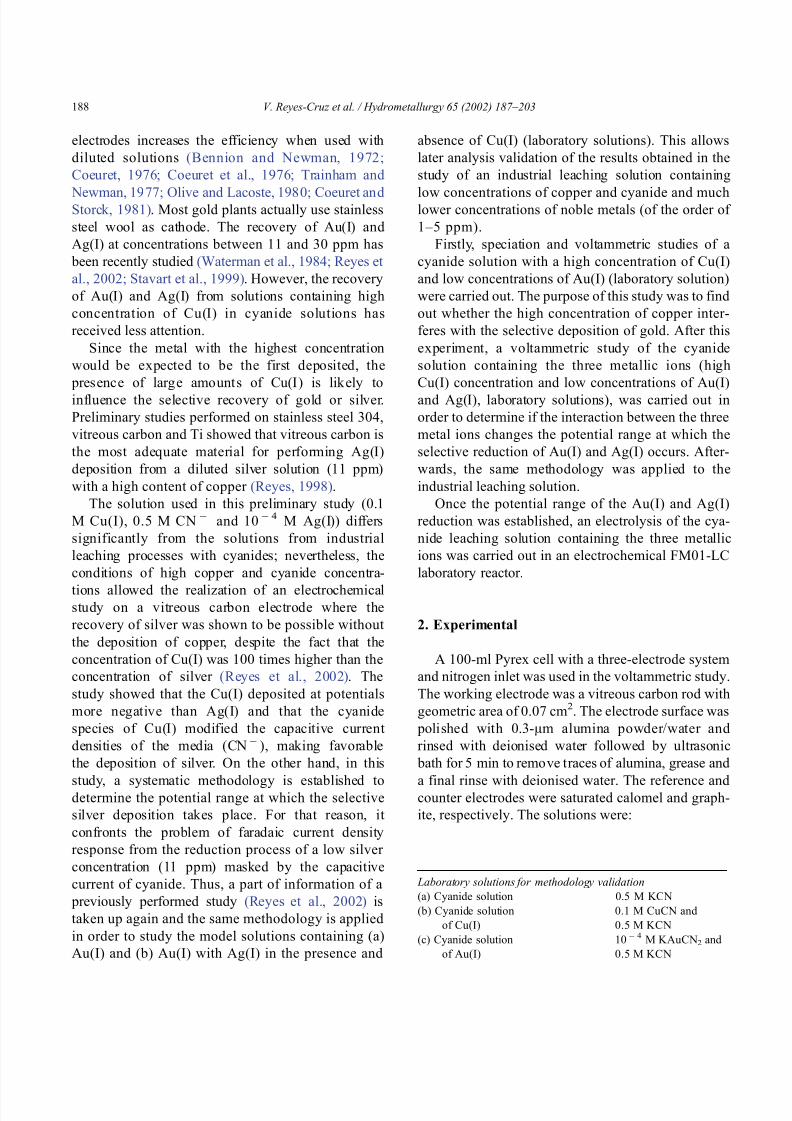
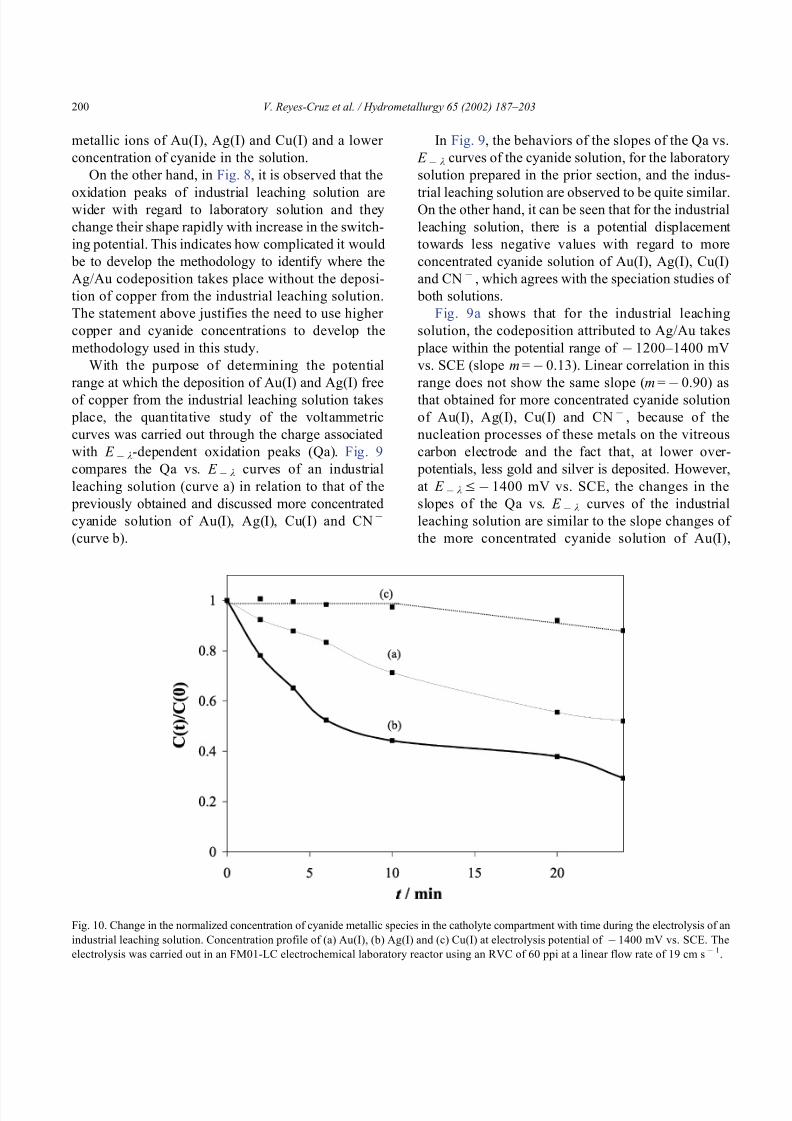
Fig. 10. Change in the normalized concentration of cyanide metallic species in the catholyte compartment with time during the electrolysis of an
industrial leaching solution. Concentration profile of (a) Au(I), (b) Ag(I) and (c) Cu(I) at electrolysis potential of 1400 mV vs. SCE. The
electrolysis was carried out in an FM01-LC electrochemical laboratory reactor using an RVC of 60 ppi at a linear flow rate of 19 cm s 1.
V. Reyes-Cruz et al. / Hydrometallurgy 65 (2002) 187–203200
8/12/2019 Electrochemical deposition of silver and gold from cyanide leaching solutions.pdf
http://slidepdf.com/reader/full/electrochemical-deposition-of-silver-and-gold-from-cyanide-leaching-solutionspdf 15/17
Ag(I), Cu(I) and CN (Fig. 9a and b, respectively),
thus indicating the presence of: (i) the massive dep-
osition of Ag (slope m = 0.67), (ii) the codeposition
of Cu/Ag (slope m = 1.27) and (iii) the massivedeposition of Cu (slope m = 5.46) as the switching
potential turns more negative.
From the comparative study of the charges (Qa) of
industrial leaching solution in relation to the more
concentrated cyanide solution of Au(I) ions with
Ag(I), Cu(I) and CN , it is possible to determine
the potential at which the codeposition of Ag/Au takes
place without the deposition of copper. However, just
like in the study of the more concentrated cyanide
solution of Au(I), Ag(I), Cu(I) and CN , it is not
possible to determine the potential at which the gold
and silver deposit independently. In order to confirm
the results from the previous experiments, an electrol-
ysis study of an industrial leaching solution was
carried out.
3.2.3. Electrolysis study
The potential at which Cu(I) does not interfere
with the electrochemical deposition of gold and
silver has been established from the experiments
above. Taking this into account, an electrochemical
deposition of the species Au(I) and Ag(I) in a batch
re-circulation reactor using the industrial leachingsolution (solution f) was carried out.
The electrolysis was at constant potential on a
reticulated vitreous carbon electrode (RVC) for 25
min at a linear flow velocity of 19 cm s 1. The
concentration change of Au(I), Ag(I) and Cu(I) in
the catholyte compartment during the electrolysis
was analyzed by atomic absorption spectroscopy.
Fig. 10 shows the depletion of Au(I) (curve a),
Ag(I) (curve b) and Cu(I) (curve c) as C t / C 0 vs.
time, at a constant potential of 1400 mV vs. SCE,
where C t and C 0 are, respectively, the concentrations
of the metal ion at time t and at the beginning of the
electrolysis.
Fig. 10 shows the evolution in the concentration of
the three metal ions with time when the electrolysis
was carried out at 1400 mV vs. SCE. Depletions in
the concentration of Au(I) and Ag(I) were up to 48%
and 71%, respectively, from their original concentra-
tions (Fig. 10a and b). The concentration of Cu(I) was
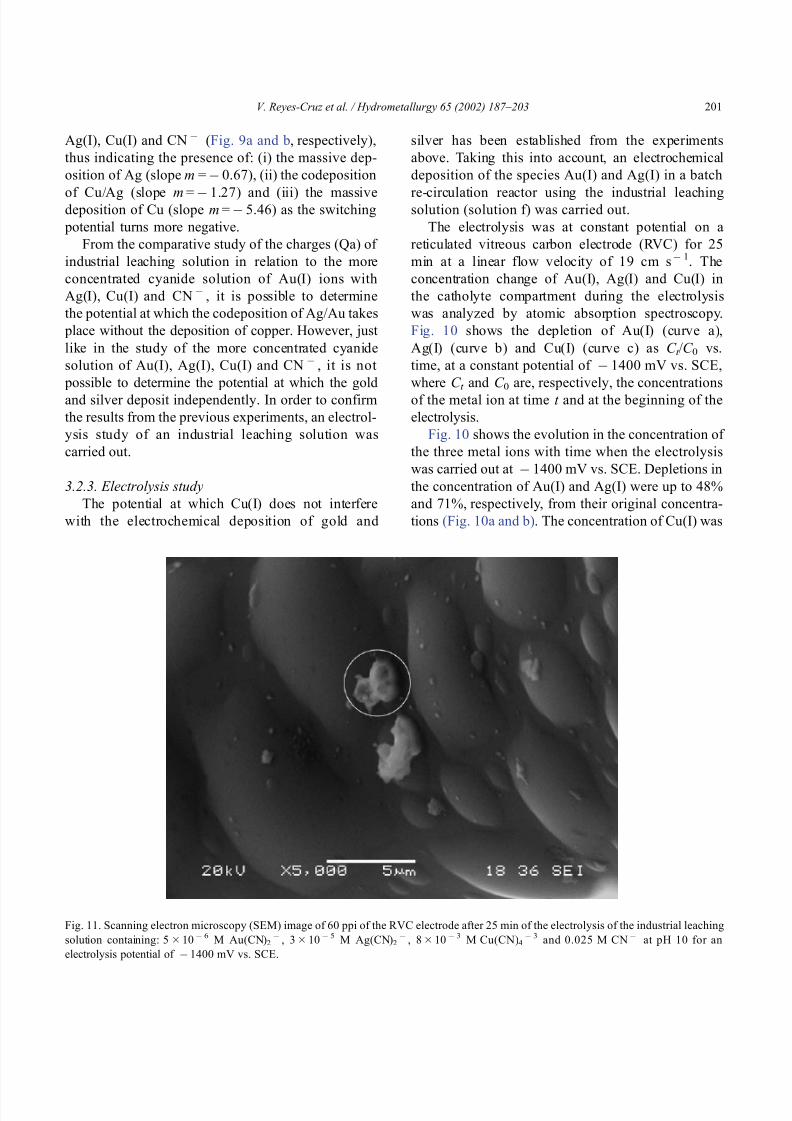
Fig. 11. Scanning electron microscopy (SEM) image of 60 ppi of the RVC electrode after 25 min of the electrolysis of the industrial leaching
solution containing: 5 10 6 M Au(CN)2 , 3 10 5 M Ag(CN)2
, 8 10 3 M Cu(CN)4 3 and 0.025 M CN at pH 10 for an
electrolysis potential of 1400 mV vs. SCE.
V. Reyes-Cruz et al. / Hydrometallurgy 65 (2002) 187–203 201
8/12/2019 Electrochemical deposition of silver and gold from cyanide leaching solutions.pdf
http://slidepdf.com/reader/full/electrochemical-deposition-of-silver-and-gold-from-cyanide-leaching-solutionspdf 16/17
constant during the first 10 min of electrolysis, how-
ever, in the following 25 min, the concentration of
Cu(I) fell 12% (Fig. 10c). This indicates that metallic
copper would be on the surface of the reticulated
vitreous carbon (RVC).
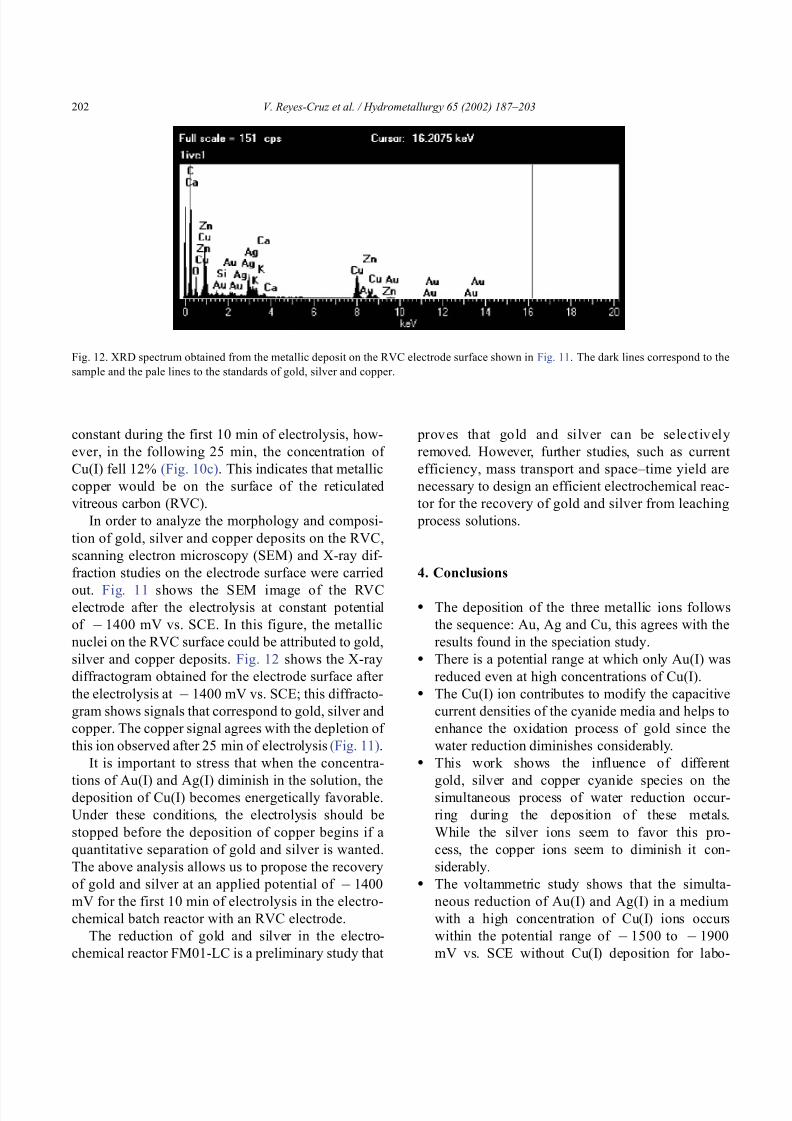
In order to analyze the morphology and composi-
tion of gold, silver and copper deposits on the RVC,
scanning electron microscopy (SEM) and X-ray dif-
fraction studies on the electrode surface were carried
out. Fig. 11 shows the SEM image of the RVCelectrode after the electrolysis at constant potential
of 1400 mV vs. SCE. In this figure, the metallic
nuclei on the RVC surface could be attributed to gold,
silver and copper deposits. Fig. 12 shows the X-ray
diffractogram obtained for the electrode surface after
the electrolysis at 1400 mV vs. SCE; this diffracto-
gram shows signals that correspond to gold, silver and
copper. The copper signal agrees with the depletion of
this ion observed after 25 min of electrolysis (Fig. 11).
It is important to stress that when the concentra-
tions of Au(I) and Ag(I) diminish in the solution, thedeposition of Cu(I) becomes energetically favorable.
Under these conditions, the electrolysis should be
stopped before the deposition of copper begins if a
quantitative separation of gold and silver is wanted.
The above analysis allows us to propose the recovery
of gold and silver at an applied potential of 1400
mV for the first 10 min of electrolysis in the electro-
chemical batch reactor with an RVC electrode.
The reduction of gold and silver in the electro-
chemical reactor FM01-LC is a preliminary study that
prov es that gold and silver can be sele ctively
removed. However, further studies, such as current
efficiency, mass transport and space–time yield are
necessary to design an efficient electrochemical reac-
tor for the recovery of gold and silver from leaching
process solutions.
4. Conclusions
The deposition of the three metallic ions follows
the sequence: Au, Ag and Cu, this agrees with the
results found in the speciation study. There is a potential range at which only Au(I) was
reduced even at high concentrations of Cu(I). The Cu(I) ion contributes to modify the capacitive
current densities of the cyanide media and helps to
enhance the oxidation process of gold since the
water reduction diminishes considerably. This work shows the influence of different
gold, silver and copper cyanide species on thesimultaneous process of water reduction occur-
ring during the deposition of these metals.
While the silver ions seem to favor this pro-
cess, the copper ions seem to diminish it con-
siderably. The voltammetric study shows that the simulta-
neous reduction of Au(I) and Ag(I) in a medium
with a high concentration of Cu(I) ions occurs
within the potential range of 1500 to 1900
mV vs. SCE without Cu(I) deposition for labo-
Fig. 12. XRD spectrum obtained from the metallic deposit on the RVC electrode surface shown in Fig. 11. The dark lines correspond to the
sample and the pale lines to the standards of gold, silver and copper.
V. Reyes-Cruz et al. / Hydrometallurgy 65 (2002) 187–203202
8/12/2019 Electrochemical deposition of silver and gold from cyanide leaching solutions.pdf
http://slidepdf.com/reader/full/electrochemical-deposition-of-silver-and-gold-from-cyanide-leaching-solutionspdf 17/17
ratory solution and 1200 to 1500 mV vs. SCE
for industrial leaching solution. The recovery of gold and silver was proposed at an
applied potential of 1400 mV vs. SCE for thefirst 10 min of the electrolysis in a batch reactor
with re-circulation on a RVC electrode. The reduction of gold and silver in the electro-
chemical reactor FM01-LC confirms the selective
deposition of both metals. However, these are
preliminary studies and further work is necessary
in order to optimize the reactor performance.
Acknowledgements
The authors express their acknowledgment to
Conacyt (project number 32539-T) and Servicios
Industriales Penoles (Monterrey, Mexico) for funding
this work. V. Reyes Cruz thanks Conacyt and
Servicios Industriales Penoles (Monterrey Mexico)
for his PhD scholarship.
References
Bennion, D., Newman, J., 1972. J. Appl. Electrochem. 2, 113.Bindra, P., Light, D., Freudenthal, P., Smith, D., 1989. J. Electro-
chem. Soc. 136, 3616.
Brown, C.J., Plecher, D., 1992. J. Appl. Electrochem. 22, 613.
Brown, C.J., Plecher, D., 1993. J. Appl. Electrochem. 23, 38.
Brown, C.J., Plecher, D., 1994. J. Appl. Electrochem. 24, 95.
Caroli, S., Sharma, V.K., 1978. Tables of Standard Electrode Poten-
tials. Wiley, New York.
Chrzanowski, W., Li, Y.G., Lasia, A., 1996. J. Appl. Electrochem.
26, 385.
Coeuret, F., 1976. Electrochim. Acta 21, 203.
Coeuret, F., Storck, A., 1981. Inf. Chim. 210, 121.
Coeuret, F., Hutin, D., Gaunand, A., 1976. J. Appl. Electrochem. 6,
417.
Fleming, C.A., 1992. Hydrometallurgy 30, 127.
Jha, M.C., 1984. Proceedings of the First International Symposiumon Precious Metals Recovery, p. XXI–1, Reno, NV. The Metal-
lurgical Society of AIME, New York, USA.
Kirk, D.W., Foulkes, F.R., Graydon, W.F., 1980. J. Electrochem.
Soc. 127, 672.
Kordosky, G.A., Sierakosky, J.M., Virnig, M.J., Mattison, P.L.,
1992. Hydrometallurgy 30, 291.
Mac Arthur, D.M., 1972. J. Electrochem. Soc. 119, 672.
Mughogho, D.T., Crundwell, F.K., 1996. In: Woods, R., Richard-
son, P.E. (Eds.), Electrochemistry in Mineral and Metal Process-
ing IV, PV 96-6. Electrochem. Soc. Pennington, USA, p. 275.
Olive, H., Lacoste, G., 1980. Electrochim. Acta 25, 1303.
Reyes, V. MSc Thesis, Universidad Autonoma Metropolitana-Izta-
palapa, Mexico D.F. (1998).
Reyes, V.E., Oropeza, M.T., Gonzalez, I., Ponce de Leon, C., 2002.
J. Appl. Chem., in press.
Reyes, V., Oropeza, M.T., Gonzalez, I., Ponce de Leon, C., 2000.
In: Oropeza, M.T., Gonzalez, I. (Eds.), Proceedings of XIV
Meeting of Sibae. Electroquımica, Oaxaca, Mexico, p. 18.
Reyes, V.E., Oropeza, M.T., Gonzalez, I., Ponce de Leon, C., 2001.
Hydrometallurgy. Submitted for publication.
Ringbom, A., 1963. Complexation in Analytical Chemistry, Wiley-
Interscience, New York.
Rojas, A., Ramırez, M.T., Ibanez, J.G., Gonzalez, I., 1991. J. Elec-
trochem. Soc. 138, 1921.
Rojas, A., Trejo, G., Ramırez, M.T., 1993. Diagramas de Zonas de
Predominio Aplicados al Analisis Quımico. Universidad Auton-
oma Metropolitana-Iztapalapa, Mexico D.F.Stavart, A., Leroy, C., Van Lierde, A., 1999. Miner. Eng. 12, 545.
Trainham, J., Newman, J., 1977. J. Electrochem. Soc. 124, 1528.
Vilchis-Carbajal, S., Gonzalez, I., Lapidus, G.T., 2000. J. Appl.
Electrochem. 30, 217.
Waterman, B., Olson, F.A., Andersen, T.N., 1984. In: Srinivasan,
S., Woods, R., Richardson, P.E. (Eds.), Electrochemistry in
Mineral and Metal Processing I, PV 84-10. Electrochem. Soc.
Pennington, USA, p. 611.
Zhang, Y., Fang, Z., Muhammed, M., 1997. Hydrometallurgy 46,
251.
V. Reyes-Cruz et al. / Hydrometallurgy 65 (2002) 187–203 203


![Improving the process performance of gold cyanide leaching ... · Improving the process performance of gold cyanide leaching reactors 3 literature (Equation [1]) shows that k L a](https://img.pdfslide.us/doc/110x75/5ad34b757f8b9abd6c8dbd36/improving-the-process-performance-of-gold-cyanide-leaching-the-process-performance.jpg)