Embed Size (px)
Citation preview
Contractor Report ARAET-CR-05002
ELECTRO-SPARK DEPOSITED COATINGS FOR REPLACHROME PLATING
R. N. Johnson J. A. Bailey
Pacific Northwest National Laboratory 902 Battelle Boulevard
P.O. Box 999 Richland, WA 99352
Joseph A. Goetz Project Engineer
ARDEC
June 2005
Approved for public release; distribution is unlimited.
AD
AD-E403 050
CEMENT OF
ARMAMENT RESEARCH, DEVELOPMENT AND ENGINEERING CENTER
Armaments Engineering & Technology Center
Picatinny, New Jersey

The views, opinions, and/or findings contained in this report are those of the author(s) and should not be construed as an official Department of the Army posi- tion, policy, or decision, unless so designated by other documentation. The citation in this report of the names of commercial firms or commercially available products or services does not constitute official endorsement by or approval of the U.S. Government. Destroy this report when no longer needed by any method that will prevent disclosure of its contents or reconstruction of the document. Do not return to the originator.
REPORT DOCUMENTATION PAGE Form Approved OMB No. 0704-01-0188
The public reporting burden for this collection of information is estimated to average 1 hour per response, including the time for reviewing instructions, searching existing data sources, gathering and maintaining the data needed, and completing and reviewing the collection of information. Send comments regarding this burden estimate or any other aspect of this collection of information, including suggestions for reducing the burden to Department of Defense, Washington Headquarters Services Directorate for Information Operations and Reports (0704-0188), 1215 Jefferson Davis Highway, Suite 1204, Arlington, VA 22202-4302. Respondents should be aware that notwithstanding any other provision of law, no person shall be subject to any penalty for failing to comply with a collection of information if it does not display a currently valid OMB control number. PLEASE DO NOT RETURN YOUR FORM TO THE ABOVE ADDRESS.
1. REPORT DATE (DD-MM-YYYY) June 2005
2. REPORT TYPE Final
3. DATES COVERED (From – To) January 2000 to December 2003
5a. CONTRACT NUMBER 5b. GRANT NUMBER
4. TITLE AND SUBTITLE ELECTRO-SPARK DEPOSITED COATINGS FOR REPLACEMENT OF CHROME ELECTROPLATING
5c. PROGRAM ELEMENT NUMBER 5d. PROJECT NUMBER PP-1147 5e. TASK NUMBER
6. AUTHORS R. N. Johnson and J. A. Bailey, Pacific Northwest National Lab. Joseph A. Goetz, Project Engineer, ARDEC
5f. WORK UNIT NUMBER
7. PERFORMING ORGANIZATION NAME(S) AND ADDRESS(ES) PNNL USA ARDEC, AETC 902 Battelle Boulevard Energetics, Warheads & Environment Tech P.O. Box 999 (AMSRD-AAR-AEE-P) Richland, WA 99352 Picatinny, NJ 07806-5000
8. PERFORMING ORGANIZATION REPORT NUMBER PP-1147 10. SPONSOR/MONITOR’S ACRONYM(S)
9. SPONSORING/MONITORING AGENCY NAME(S) AND ADDRESS(ES) ARDEC, EM Technical Research Center (AMSRD-AAR-EMK) Picatinny, NJ 07806-5000
11. SPONSOR/MONITOR’S REPORT NUMBER(S) Contractor Report ARAET-CR-05002
12. DISTRIBUTION/AVAILABILITY STATEMENT Approved for public release; distribution is unlimited. 13. SUPPLEMENTARY NOTES 14. ABSTRACT Electro-apark deposited (ESD) coating processes were investigated for line-of-sight (LOS) and non-line-of-sight (NLOS) applications under this Strategic Environmental Research and Development Program Task PP-1147. Apparatus necessary for NLOS ESD applications were developed by Pacific Northwest National Laboratories. Fatigue debits due to application of ESD coatings on reduced section specimens were investigated. A follow-on Environmental Science and Technology Certification Program task resulted from this work and ESD has now been used and is now available for use at Anniston Army Depot, but so far only for LOS applications. 15. SUBJECT TERMS Electro-spark deposit (ESD), Electro-spark alloying, Micro-welding, Chromium, Chrome, Non-line of-sight (NLOS), Line-of-sight (LOS) 16. SECURITY CLASSIFICATION OF: 19a. NAME OF RESPONSIBE PERSON
Joseph A. Goetz a. REPORT
U b. ABSTRACT
U c. THIS PAGE
U
17. LIMITATION OF ABSTRACT
SAR
18. NUMBER OF PAGES
65 19b. TELEPHONE NUMBER (Include area
code) (973) 724-6324 Standard Form 298 (Rev. 8/98)
Prescribed by ANSI Std. Z39.18

ACKNOWLEDGEMENTS This research was supported by the U.S. Department of Defense through the Strategic Environmental Research and Development Program (SERDP), project PP-1147.
i

CONTENTS
Page Executive Summary 1 Introduction and Background 1 Objective 2 Technical Approach 3 Performing Organizations 3 Process Development 3 Materials 3 Process Characterization 4 Development of Contact Force Control 6 Coatings Characterization 11 Hardness 11 Wear Tests 12 Corrosion (Salt Fog Testing) 13 Fatigue 14 Summary and Conclusions 15 References 17 Appendix – Screening Tests Performed by or for the National Defense Center for 19 Environmental Excellence Distribution List 59
iii

FIGURES
Page
1 Effect of contact force variations on ESD coating quality (Stellite 6 on 4340 steel) 5 2 Effect of electrode contact force on weight gain of equal area steel coupons 6 during ESD coating with Stellite 6 3 Wave-form traces showing peak currents associated with sparking events 8 4 Flow diagram of force control process for ESD coatings 9 5 Set up for automated ESD coating of inside diameters of tubes 10 6 Example of Stellite 21 applied to inner diameter of 0.30 in. steel tube 10 7 Microstructure of Stellite 6 ESD deposit, 75 µm thick, on steel showing hardness 11 test indents 8 Crossed cylinder wear tester, ASTM G83 12 9 Results of crossed cylinder wear test (material 7473 is WC-25TaC-13Co) 12 10 Results of salt fog testing (ASTM B117), 48 hrs exposure, single layer coatings 13 11 Stellite 21, 3-layer coating on 4340 steel, after 96 hrs exposure to salt fog 13 (ASTM B117), showing no corrosion 12 Fatigue bars coated with Stellite 21, before grinding and finishing 14
iv
EXECUTIVE SUMMARY This report is the final report for the Strategic Environment Research and Development (SERDP) project PP-1147, “Electro-spark Deposited Coatings for Replacement of Chrome Electroplating.” Electro-spark deposition (ESD) is a pulsed-arc micro-welding process that uses short-duration, high-current electrical pulses to deposit, with very low heat-input, a consumable electrode material on a metallic substrate. The short duration of the electrical pulse produces very rapid solidification of the deposited material resulting in, typically, a nano-structured coating demonstrating unique tribological and corrosion performance. Substrates require no special surface preparation. The process releases no hazardous wastes, fumes, or effluents (from most common materials), is cost-effective, and requires no special chambers, spray booths, or operator protections. This process is, thus, very attractive for the repair or replacement of electroplated hard chromium in many applications. The use of ESD was limited primarily to surfaces that could be seen by the operator, since the control of the process involves the operator sensing and adjusting key parameters during operation to maintain an optimum quality coating. In particular, the force with which the electrode contacts the substrate was found to be the most important and most difficult to control in non-line-of-sight (NLOS) applications. Process and equipment were developed to control the force of the electrode to ±5 g, a feat that several major robotics manufacturers were unable to accomplish. This was finally done by determining characteristics of the arc wave form that were responsive to contact pressure, then using the wave form characteristics to provide a controlling signal to motors (for automated processes) or to a tone generator (for feedback to an operator in manual processes). This allowed the coatings to be successfully applied to the inside diameter (I.D.) of tubes as small as 0.30 in (7.6 mm). Patents are pending. The coating chosen for this development was a cobalt-base alloy (Stellite 21) that was of interest as a potential replacement for electrolytic hard chrome plate (EHC), since it has corrosion resistance, wear resistance, and hardness similar to EHC. The ESD process could deposit any of several alloys, however. The substrate chosen was 4340 steel, a common alloy for many Department of Defense applications. Characterization of the ESD coatings showed that when the process was optimized, the coating could equal or exceed the corrosion perform-ance of EHC in salt fog testing, could equal the lower range of hardness of EHC, and could exhibit only slightly less wear resistance. Fatigue testing, however, revealed that the ESD coated 4340 steel (without shot peening) could only attain about 80% of the fatigue life of the shot-peened chrome plated steel. Further testing with alternate substrates and coatings is recommended to determine if these results are indicative of ESD treated material, or confined to this particular combination of materials.
INTRODUCTION AND BACKGROUND Electrolytic hard chrome plating (EHC) is one of the most widely used surface treatment processes throughout the military services, and represents the most significant contribution to hazardous, carcinogens waste generation and pollution control costs. Increasingly stringent U.S. Occupational Safety and Health Administration (OSHA) and Environmental Protection Agency regulations will continue to drive up costs in the use of hexavalent Cr processes.
1
Current OSHA regulations are for personal exposure limits of 0.1 mg/m3 of hexavalent chrome (ref. 1), and are expected to be decreased even further to 0.005 mg/m3. Alternative tech-nologies are required that will reduce or eliminate the dependence of this process while providing equal or superior performance in wear and corrosion protection. The high velocity oxy-fuel (HVOF) process is one of the alternative technologies that are gradually replacing chrome electroplating in some applications (ref. 2). Other alternatives are required for applica-tions where HVOF coatings cannot be applied because of geometry constraints or because of service conditions exceeding the damage resistance of the HVOF coating. Cost-effective, pollution-free coating alternatives are critical to achieving both the military environmental goals and the performance of key components throughout the services. Numerous coating technologies have been developed for protection of materials. These include the HVOF and other thermal spray processes; electro-chemical, such as the chrome electroplating; various vacuum processes, such as magnetron sputtering or other physical vapor deposition processes; and chemical vapor deposition. Each has its advantages, limitations, and appropriate applications. In recent years, a novel coating technology was developed that produces some of the most robust, damage-resistant coatings known (refs. 3 through 6). In contrast to most of these coatings, which may produce chemical or mechanical bonds with a substrate, the ESD process creates a true metallurgical bond, yet does so while maintaining the substrate at or near ambient temperatures (ref. 3). This prevents thermal distortions and minimizes metallurgical changes in critical heat-treated metal substrates. Electro-spark deposition is a pulsed-arc micro-welding process that uses short-duration, high-current electrical pulses to deposit, with very low heat-input a consumable electrode material on a metallic substrate. The short duration of the electrical pulse produces very rapid solidification of the deposited material resulting in, typically, a nano-structured coating demonstrating unique tribological and corrosion performance. Substrates require no special surface preparation. The process releases no hazardous wastes, fumes, or effluents (from most common materials), is cost-effective, and requires no special chambers, spray booths, or operator protections. The equipment is portable and can be used in repair depots, shop, field, and shipboard, as well as at the original equipment manufacturer (OEM). Objective While the ESD process has been used most frequently on external metal surfaces, the objective of this project is to develop the process for use on internal diameters and NLOS geometries. The previous state-of-the-art allowed coatings to be deposited using either manual technique, where operator skill and sensory feedback determines some of the more subtle process parameters, or automated techniques, where all process parameters are controlled by pre-programmed computer settings and fixtures. With either technique, the operator could modify parameters at any point in the process as necessary to maintain proper deposit charac-teristics. To reproducibility coat internal diameters and NLOS surfaces required development of sensors and methods that can provide the necessary feedback for automated adjustment of critical process parameters. This technique is the next evolution in the process that offers significant benefits over currently available technology and one that complements the existing HVOF alternative by coating geometries that are not possible by HVOF.
2
Technical Approach The technical approach was to develop the process parameters for a selected material coating required for specific military applications, to identify one or more parameters that are specifically critical to NLOS applications, and to develop the process control sensors and algorithms necessary to achieve those parameters in NLOS applications. Specimens were tested as part of the process optimization efforts, using specific test conditions defined by the military services. Performing Organizations Pacific Northwest National Laboratory (PNNL) has the technology lead in this project. Project management is provided by the U.S. Army Industrial Ecology Center, Picatinny, New Jersey. Contributors include the National Defense Center for Environment Excellence, Naval Surface Warfare Center, Naval Air Warfare Center-Patuxent River, U.S. Army Tank & Automotive Center, and Air Force Materials Laboratory at Wright Patterson Air Force Base. Subcontractors include Advanced Surfaces and Processes, Inc., Concurrent Technologies Corporation, and Metcut Research Associates, Inc.
PROCESS DEVELOPMENT Materials Candidate coating materials were selected and included cobalt-based hard facing alloys (Stellites) and tungsten carbide alloys. Candidate coating materials were chosen based on similar compositions being qualified for HVOF applications through the Hard Chrome Alterna-tives Team (HCAT) effort. A tungsten carbide base composition and a cobalt-base alloy were selected. WC-25TaC-13Co is a cermet that shows excellent wear and corrosion resistance and can be applied by ESD in a smoother than average deposit. However, the tungsten carbide base coating, although showing the best wear resistance, was deemed undesirable for fatigue applications due to the inherent micro-cracks that form in the deposit. The other primary candidate coatings are the cobalt-base alloys such as the Stellite and Tribaloy family of hard surfacing materials, known for their wear- and corrosion-resistant properties. Stellite 6 is a suitable material for coating thicknesses of less than 100 µm. Above th is thickness, defects and micro-cracking become increasingly likely. Stellite 21 alloy, however, can be applied in thicknesses to at least 250 µm without micro-cracking. This makes it suitable for repairs requiring build-up of damaged or miss-machined parts. Parameter development in the remainder of the program concentrated on developing optimum coating quality and deposition rates for the Stellite 21 alloy. (Composition of Stellite 21 is Cobalt – 27 Cr – 55.5 Mo – 3.0 Fe – 2.5 Ni – 1 Si – 1 Mn – 0.25 C.) Candidate substrates included several classes of materials of interest to the defense community with type 4340 steel chosen for principal demonstration of coating benefits. Other substrate materials that are of interest are Inconel 718, 300M steel, PH13-8Mo stainless steel, and 7075-T6 aluminum.
3
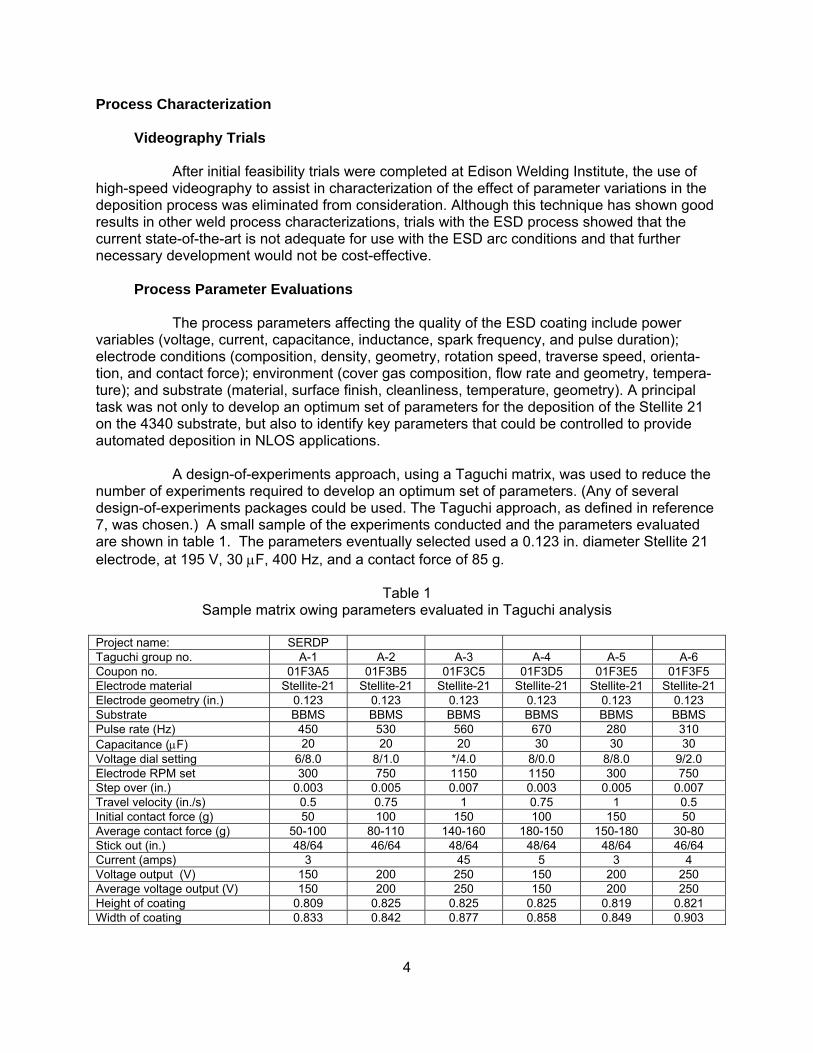
Process Characterization Videography Trials After initial feasibility trials were completed at Edison Welding Institute, the use of high-speed videography to assist in characterization of the effect of parameter variations in the deposition process was eliminated from consideration. Although this technique has shown good results in other weld process characterizations, trials with the ESD process showed that the current state-of-the-art is not adequate for use with the ESD arc conditions and that further necessary development would not be cost-effective. Process Parameter Evaluations The process parameters affecting the quality of the ESD coating include power variables (voltage, current, capacitance, inductance, spark frequency, and pulse duration); electrode conditions (composition, density, geometry, rotation speed, traverse speed, orienta-tion, and contact force); environment (cover gas composition, flow rate and geometry, tempera-ture); and substrate (material, surface finish, cleanliness, temperature, geometry). A principal task was not only to develop an optimum set of parameters for the deposition of the Stellite 21 on the 4340 substrate, but also to identify key parameters that could be controlled to provide automated deposition in NLOS applications. A design-of-experiments approach, using a Taguchi matrix, was used to reduce the number of experiments required to develop an optimum set of parameters. (Any of several design-of-experiments packages could be used. The Taguchi approach, as defined in reference 7, was chosen.) A small sample of the experiments conducted and the parameters evaluated are shown in table 1. The parameters eventually selected used a 0.123 in. diameter Stellite 21 electrode, at 195 V, 30 µF, 400 Hz, and a contact force of 85 g.
Table 1 Sample matrix owing parameters evaluated in Taguchi analysis
Project name: SERDP Taguchi group no. A-1 A-2 A-3 A-4 A-5 A-6 Coupon no. 01F3A5 01F3B5 01F3C5 01F3D5 01F3E5 01F3F5 Electrode material Stellite-21 Stellite-21 Stellite-21 Stellite-21 Stellite-21 Stellite-21 Electrode geometry (in.) 0.123 0.123 0.123 0.123 0.123 0.123 Substrate BBMS BBMS BBMS BBMS BBMS BBMS Pulse rate (Hz) 450 530 560 670 280 310 Capacitance (µF) 20 20 20 30 30 30 Voltage dial setting 6/8.0 8/1.0 */4.0 8/0.0 8/8.0 9/2.0 Electrode RPM set 300 750 1150 1150 300 750 Step over (in.) 0.003 0.005 0.007 0.003 0.005 0.007 Travel velocity (in./s) 0.5 0.75 1 0.75 1 0.5 Initial contact force (g) 50 100 150 100 150 50 Average contact force (g) 50-100 80-110 140-160 180-150 150-180 30-80 Stick out (in.) 48/64 46/64 48/64 48/64 48/64 46/64 Current (amps) 3 45 5 3 4 Voltage output (V) 150 200 250 150 200 250 Average voltage output (V) 150 200 250 150 200 250 Height of coating 0.809 0.825 0.825 0.825 0.819 0.821 Width of coating 0.833 0.842 0.877 0.858 0.849 0.903
4

Table 1 (continued)
Area of coating 0.673897 0.69465 0.723525 0.70785 0.695331 0.741363 Initial weight (g) 90.4792 90.5705 90.6811 90.8362 91.0509 91.0730 Final weight (g) 90.5705 90.6811 90.8362 91.0509 91.0730 91.2094 Change in weight (g) 0.09129 0.11066 0.15511 0.21461 0.02219 0.13631 Weight gain per in.2 (WG/A) 0.135466 0.159303 0.214381 0.303186 0.031913 0.183864 WG/A per pass 0.027 0.032 0.043 0.061 0.006 0.037 Change in stick out (in.) 0.11 0.14 0.11 0.17 0.03 0.14 Change in electrode color Little red Very red Very red Little red Little red Little red Coverage grade A A+ A+ A+ B+ A+ Smooth grade A A- C C C- A Pulse density (PR/velocity) 900 706.6667 560 893.3333 280 620 Energy (1/2CV2) (J) 0.3375 0.6 0.9375 0.3375 0.6 0.9375 In.2/min per pass 0.09 0.225 0.42 0.135 0.3 0.21 g/hr 0.15 0.43 1.08 0.49 0.11 0.46 Thickness (by wt) mils Thickness (by metallography) 1.00 1.17 1.58 2.23 0.23 1.35 Thickness max/min 1.57 1.57 3.3 2.6 0.4 2.2 Thickness uniformity (A-F) 2.8/0.8 2.8/0.8 6.3/0 6.5/0.4 2 to 0 3.9/0.4 Coating integrity (A-F) A A- F C- D A- Defects/mm F D+ F D+ F B+ Cover gas Ar Ar Ar Ar Ar Ar Electrode angle (deg) 15 15 15 15 15 15 Passes 5 5 5 5 5 5
From these experiments, the optimum parameters were selected as well as the parameter most important for NLOS depositions. The most difficult to control for NLOS depositions, and one of the most important variables, was the contact force of the electrode against the substrate. A skilled operator can vary the contact force as necessary to maintain a good quality deposit, providing he can observe or sense the arc characteristics. This is obviously difficult in NLOS situations. All other parameters, though important, can be set independently of the operator’s ability to observe the process. Figure 1 shows the effect of varying contact force on quality of the coating. Figure 2 shows effect of the contact force on the deposition rate
Figure 1 Effect of contact force variations on ESD coating quality (Stellite 6 on 4340 steel)
5

Figure 2 Effect of electrode contact force on weight gain of equal area steel coupons
during ESD coating with Stellite 6
Development of Contact Force Control An automated ESD system was in existence at the start of the program, but the force control used was a simple method of maintaining a spring balance on the electrode holder, then adding weights to achieve the desired force. This was adequate for limited area, flat coupons, but could only maintain a force in one direction (vertical), and could not follow a contoured surface, much less a NLOS surface. The first step was to re-write the control programs in a more suitable programming medium. The existing program was written in Visual Basic. Visual Basic was written for programming ‘Office Applications,’ such as inventory, personnel records, price lists, and pay records (Microsoft Inc. states as much on the box). The control programs were re-written in LabView. LabView is a graphical programming medium developed by National Instruments of Austin, Texas. LabView’s application focus is scientific and engineering applications. The loop time of the main control algorithm was dramatically reduced resulting in faster feedback and finer control of the LabView medium. During the conversion to LabView, the existing mechanical feedback system had to be verified. A workable mechanical platform was needed before the electronic control system could be developed. It was necessary to know that the basic system worked. The first correction made to the mechanical control algorithm involved the feedback to the Z-Axis motor (the vertical probe pressure control motor.) Two limit switches (pressure high and pressure low) were arranged on the Z-axis assembly to measure deflection of the Z-axis spring. More or less force on the probe tip deflected the Z-axis spring to a greater or lesser extent. The control algorithm was designed to compensate for too much deflection and by moving the Z-axis motor. However, the Visual Basic feedback command (or motor-move command) that was sent to the motor control hardware was a ‘report motor position’ inquiry not a ‘motor position correc-tion’ statement. As such, the motor never moved. There was never a motor operated mechan-ical feedback or control based feedback based limit switch.
6
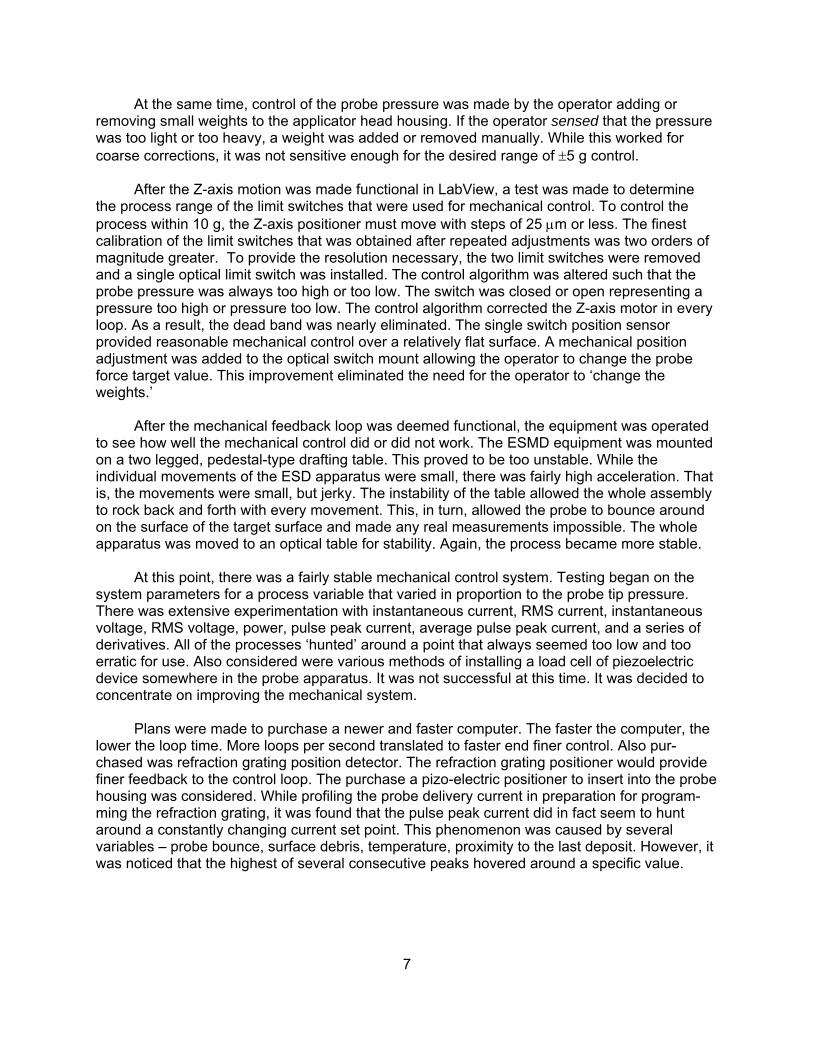
At the same time, control of the probe pressure was made by the operator adding or removing small weights to the applicator head housing. If the operator sensed that the pressure was too light or too heavy, a weight was added or removed manually. While this worked for coarse corrections, it was not sensitive enough for the desired range of ±5 g control. After the Z-axis motion was made functional in LabView, a test was made to determine the process range of the limit switches that were used for mechanical control. To control the process within 10 g, the Z-axis positioner must move with steps of 25 µm or less. The finest calibration of the limit switches that was obtained after repeated adjustments was two orders of magnitude greater. To provide the resolution necessary, the two limit switches were removed and a single optical limit switch was installed. The control algorithm was altered such that the probe pressure was always too high or too low. The switch was closed or open representing a pressure too high or pressure too low. The control algorithm corrected the Z-axis motor in every loop. As a result, the dead band was nearly eliminated. The single switch position sensor provided reasonable mechanical control over a relatively flat surface. A mechanical position adjustment was added to the optical switch mount allowing the operator to change the probe force target value. This improvement eliminated the need for the operator to ‘change the weights.’ After the mechanical feedback loop was deemed functional, the equipment was operated to see how well the mechanical control did or did not work. The ESMD equipment was mounted on a two legged, pedestal-type drafting table. This proved to be too unstable. While the individual movements of the ESD apparatus were small, there was fairly high acceleration. That is, the movements were small, but jerky. The instability of the table allowed the whole assembly to rock back and forth with every movement. This, in turn, allowed the probe to bounce around on the surface of the target surface and made any real measurements impossible. The whole apparatus was moved to an optical table for stability. Again, the process became more stable. At this point, there was a fairly stable mechanical control system. Testing began on the system parameters for a process variable that varied in proportion to the probe tip pressure. There was extensive experimentation with instantaneous current, RMS current, instantaneous voltage, RMS voltage, power, pulse peak current, average pulse peak current, and a series of derivatives. All of the processes ‘hunted’ around a point that always seemed too low and too erratic for use. Also considered were various methods of installing a load cell of piezoelectric device somewhere in the probe apparatus. It was not successful at this time. It was decided to concentrate on improving the mechanical system. Plans were made to purchase a newer and faster computer. The faster the computer, the lower the loop time. More loops per second translated to faster end finer control. Also pur-chased was refraction grating position detector. The refraction grating positioner would provide finer feedback to the control loop. The purchase a pizo-electric positioner to insert into the probe housing was considered. While profiling the probe delivery current in preparation for program-ming the refraction grating, it was found that the pulse peak current did in fact seem to hunt around a constantly changing current set point. This phenomenon was caused by several variables – probe bounce, surface debris, temperature, proximity to the last deposit. However, it was noticed that the highest of several consecutive peaks hovered around a specific value.
7

All of the variables that affected the current peak value acted to reduce that peak value. At some point in time, all of the variables must be reduced to a minimum that represents the optimum peak current. That single peak should be directly dependent on the probe force. The current stream was recorded and it was found that there was not have enough resolution to capture the true peak current without some aliasing. Aliasing is the phenomenon of testing at so low a rate that it is possible to take a measurement during the peak rising slope and again during the declining slope, but not capture the peak itself. A National Instruments high-speed data acquisition card was installed. The peak current value still varied from peak to peak, but we were able to reliably capture the highest value of the peak that interested us. (This correlation could not have been made just a short time ago.) It is only with the development of a 10 million sample per second data acquisition hardware that the needed variable could be tracked – the highest of the last five current peaks. The process as developed is to record enough time to capture five current peaks based on the pulse rate of the power supply, as shown in figure 3. Then discriminate the highest peak value in the sample. This current is normalized to have the same range as the current setting on the pulse generator. That is, a 50% value on the detected peaks has the same range as 50% on the control setting. The peak value is compared to the set point on the controlling computer user interface. A lower or higher value (never an equal value) results in the movement of the Z-axis motor to correct the probe pressure.
Figure 3
Wave-form traces showing peak currents associated with sparking events
Once it was proven that the scheme would work with the raster application on a flat coupon sample, the planned improvements on the mechanical control system were discarded. The new electronic feedback scheme was conspicuously more accurate. An operating applica-tion was controlled to within 5 g of 100 g electronically. A flow diagram for the process is shown in figure 4. At this point, a Taguchi Parameter Analysis was performed to see if the process parameters could be refined to reliably reproduce a given metallurgical target coating. The most promising parameters were selected and entered with the potential parameter ranges in the Taguchi software. The defined tests were conducted and evaluated and the resulting coupons. After entering the evaluation results into Taguchi, the final report defined the most probable parameter settings based on the ratings. A coating using the recommended setting was applied and produced a very fine metallurgical coating.
8
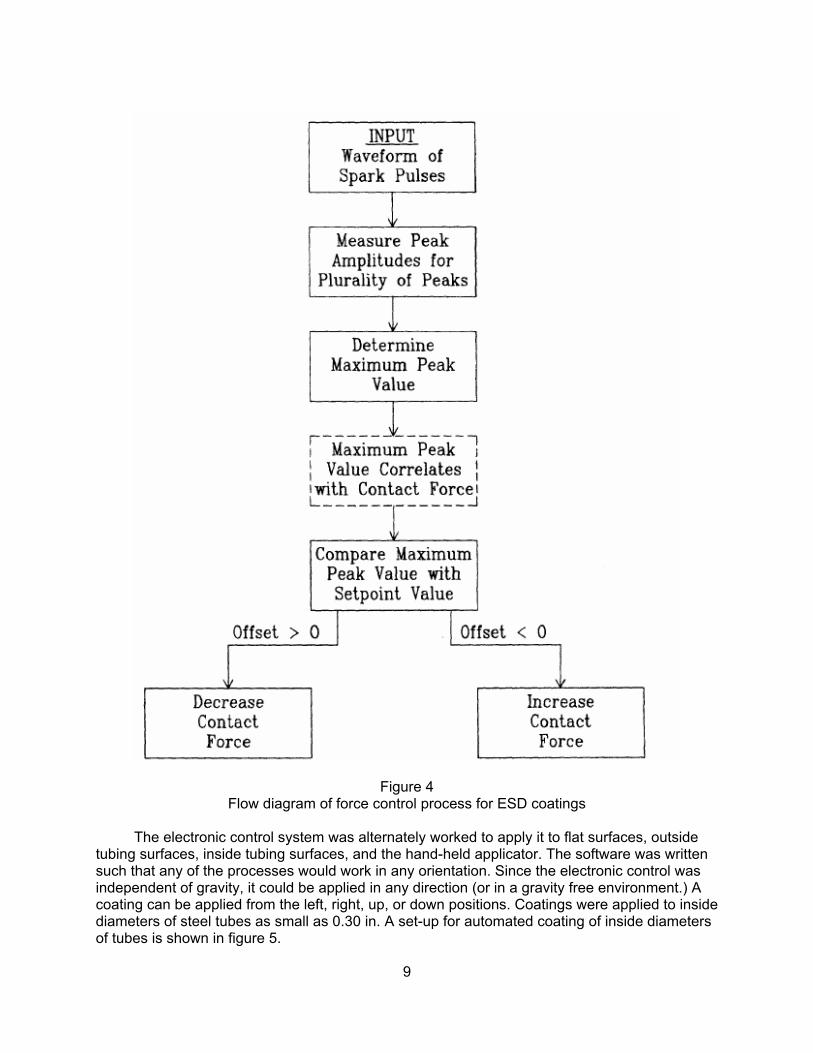
Figure 4 Flow diagram of force control process for ESD coatings
The electronic control system was alternately worked to apply it to flat surfaces, outside tubing surfaces, inside tubing surfaces, and the hand-held applicator. The software was written such that any of the processes would work in any orientation. Since the electronic control was independent of gravity, it could be applied in any direction (or in a gravity free environment.) A coating can be applied from the left, right, up, or down positions. Coatings were applied to inside diameters of steel tubes as small as 0.30 in. A set-up for automated coating of inside diameters of tubes is shown in figure 5.
9
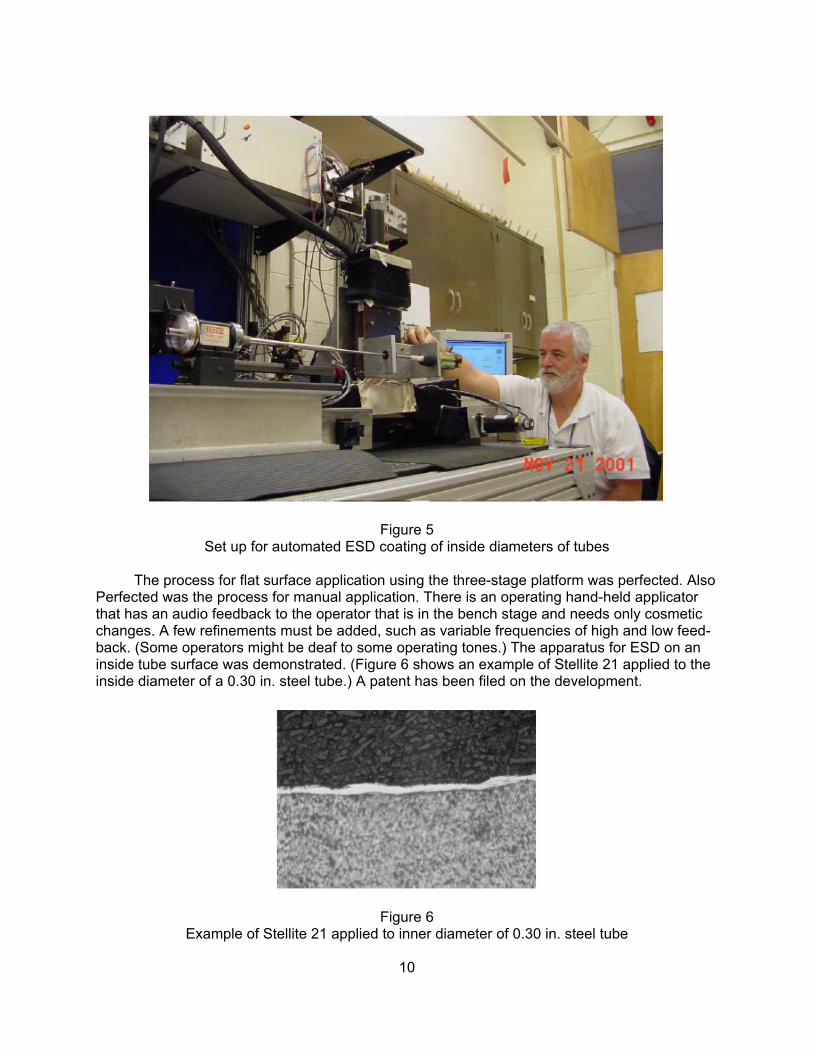
Figure 5 Set up for automated ESD coating of inside diameters of tubes
The process for flat surface application using the three-stage platform was perfected. Also Perfected was the process for manual application. There is an operating hand-held applicator that has an audio feedback to the operator that is in the bench stage and needs only cosmetic changes. A few refinements must be added, such as variable frequencies of high and low feed- back. (Some operators might be deaf to some operating tones.) The apparatus for ESD on an inside tube surface was demonstrated. (Figure 6 shows an example of Stellite 21 applied to the inside diameter of a 0.30 in. steel tube.) A patent has been filed on the development.
Figure 6 Example of Stellite 21 applied to inner diameter of 0.30 in. steel tube
10
The software had to be modified for safety: no sudden movements. The various probe configurations must also be tested. (That work is left for follow-on tasks.) There is a wide variety of possible future work. The most notable is the modification of the inside tubing surface pro-cess software and hardware. While it was developed for a gun barrel, it could also be modified for use in long tube arrangements, such as heat exchanger tubing or hydraulic cylinders. The outside tubing surface equipment is ideally suited to the repair and/or protective coating of any cylindrical structure: pistons, bearing, or shafts. Equipment can be developed to allow the repair of inside surface and outside surface structures in situ. An algorithm was also conceived that would allow the user to scan and repair surface pits. Because ESD is a metallurgical bond, the pit repair is not prone to ‘popping out.’ Because the coating/substrate bond is applied very precisely with a welding electrode, not an effluent chemical process, different metals on different faces of the same work piece could be coated. Successive layers with different metals could also be coated creating a laminate.
COATINGS CHARACTERIZATION Coatings and materials were characterized by testing at the following laboratories: PNNL, Air Force Materials Laboratory (AFML), Concurrent Technologies Corporation, Advanced Surfaces and Processes, and Metcut Research Associates. Some tests were repeated when early results were found to be on non-optimized material. The following summarizes the results. A more detailed discussion is given in the appendix. Hardness ESD coatings typically are harder than the electrode from which they are deposited. This is attributed to the exceptionally fine grain size and homogeneity of the deposits, and to the Hall-Petch effect (where hardness increases with decreasing grain size). Figure 7 shows a typical micrograph of a hardness profile obtained in these studies. In ordinary weld deposits, Stellite 6 normally exhibits a hardness of about 400 Knoop (40 Rc), but ESD deposits of Stellite 6 exceed 700 Knoop (58 Rc). Likewise, Stellite 21 normally shows a hardness of 290 Knoop (27 Rc), but in the ESD deposit, averages 613 Knoop (54 Rc). For comparison, Electrolytic Hard Chrome (EHC) usually measures between 600 and 1100 Knoop.
Figure 7 Microstructure of Stellite 6 ESD deposit, 75 µm thick, on steel showing hardness test indents
Note the absence of a detectable heat-affected-zone.
11
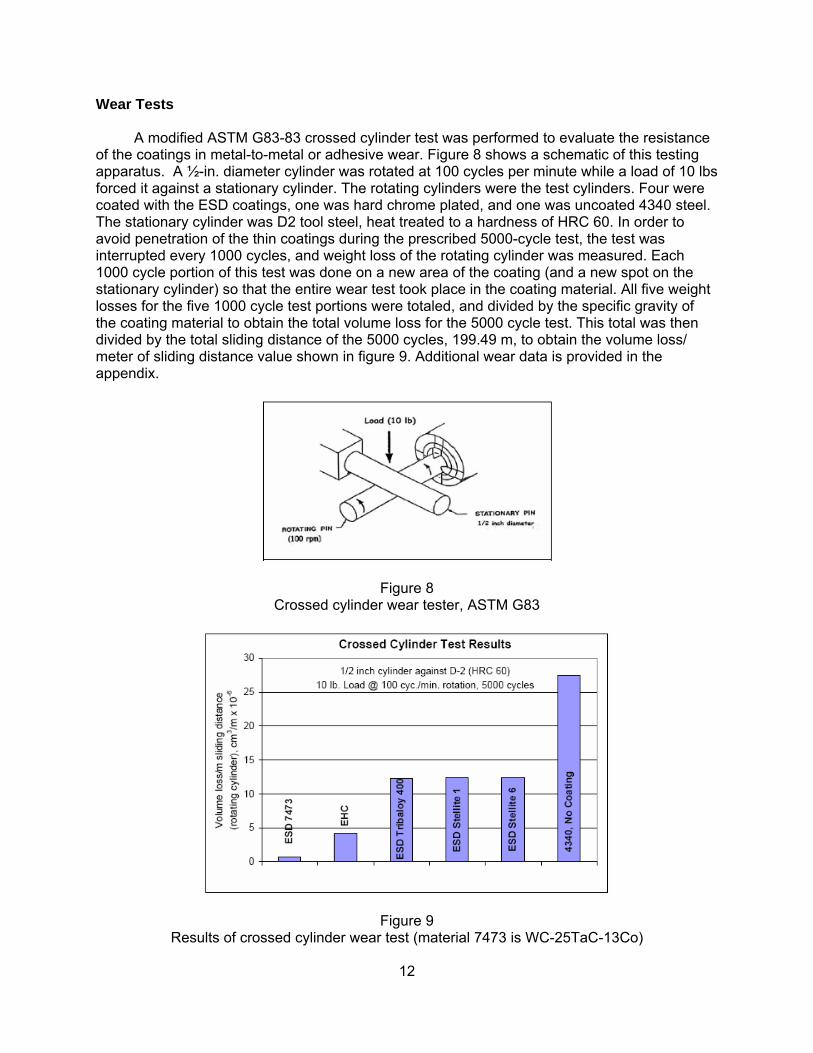
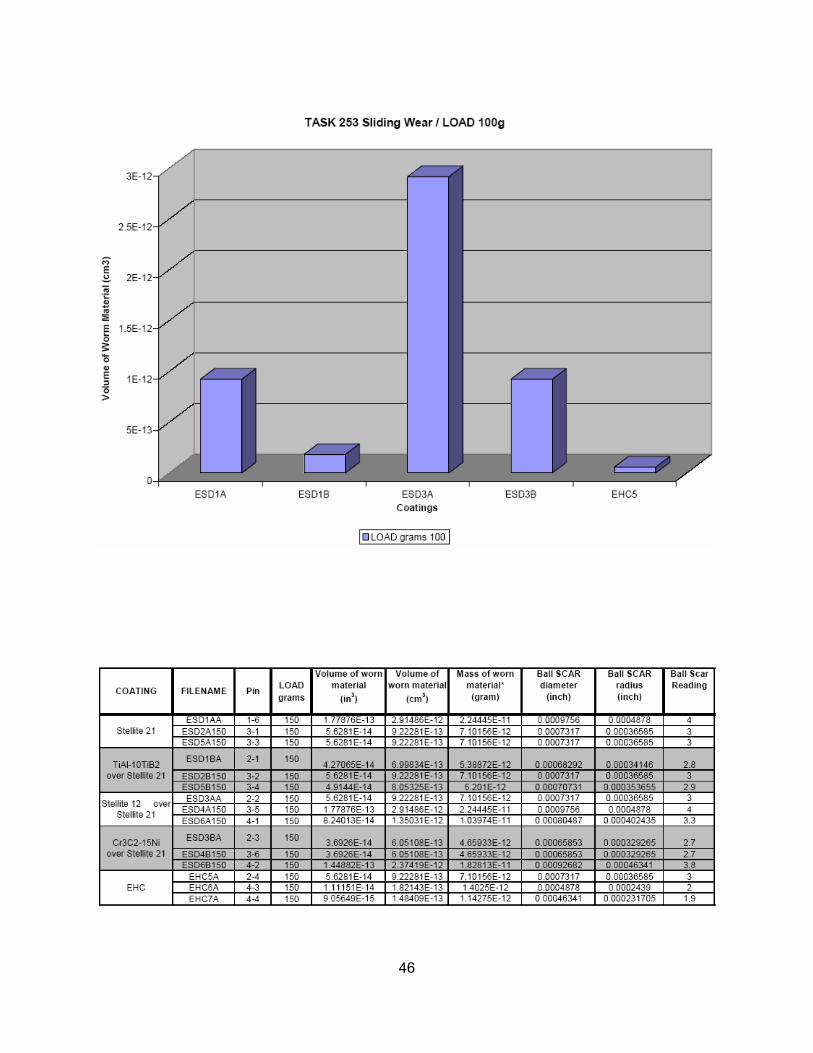
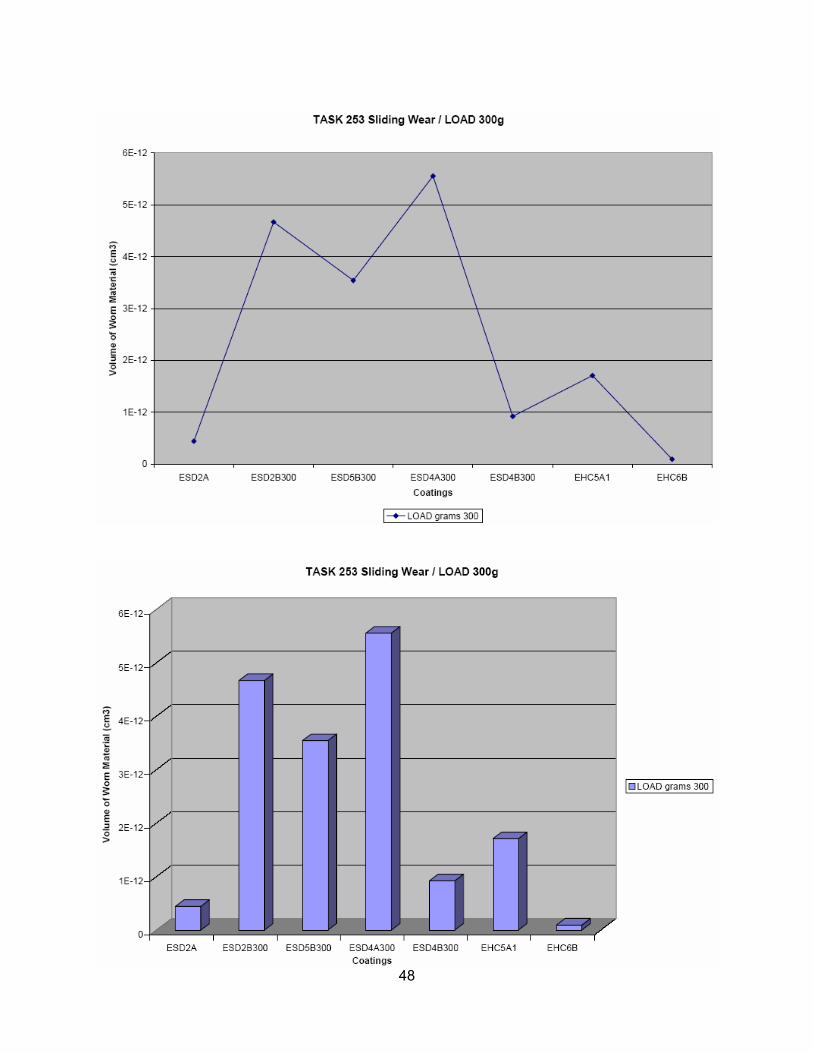
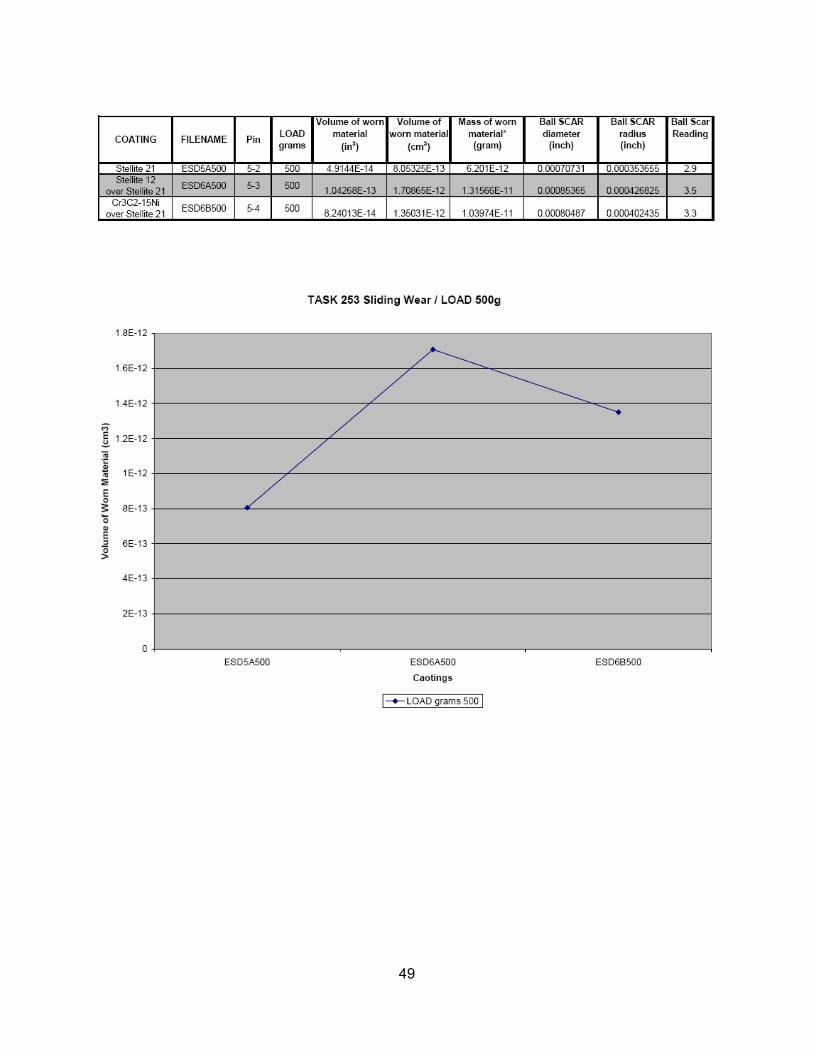
Wear Tests A modified ASTM G83-83 crossed cylinder test was performed to evaluate the resistance of the coatings in metal-to-metal or adhesive wear. Figure 8 shows a schematic of this testing apparatus. A ½-in. diameter cylinder was rotated at 100 cycles per minute while a load of 10 lbs forced it against a stationary cylinder. The rotating cylinders were the test cylinders. Four were coated with the ESD coatings, one was hard chrome plated, and one was uncoated 4340 steel. The stationary cylinder was D2 tool steel, heat treated to a hardness of HRC 60. In order to avoid penetration of the thin coatings during the prescribed 5000-cycle test, the test was interrupted every 1000 cycles, and weight loss of the rotating cylinder was measured. Each 1000 cycle portion of this test was done on a new area of the coating (and a new spot on the stationary cylinder) so that the entire wear test took place in the coating material. All five weight losses for the five 1000 cycle test portions were totaled, and divided by the specific gravity of the coating material to obtain the total volume loss for the 5000 cycle test. This total was then divided by the total sliding distance of the 5000 cycles, 199.49 m, to obtain the volume loss/ meter of sliding distance value shown in figure 9. Additional wear data is provided in the appendix.
Figure 8 Crossed cylinder wear tester, ASTM G83
Figure 9 Results of crossed cylinder wear test (material 7473 is WC-25TaC-13Co)
12
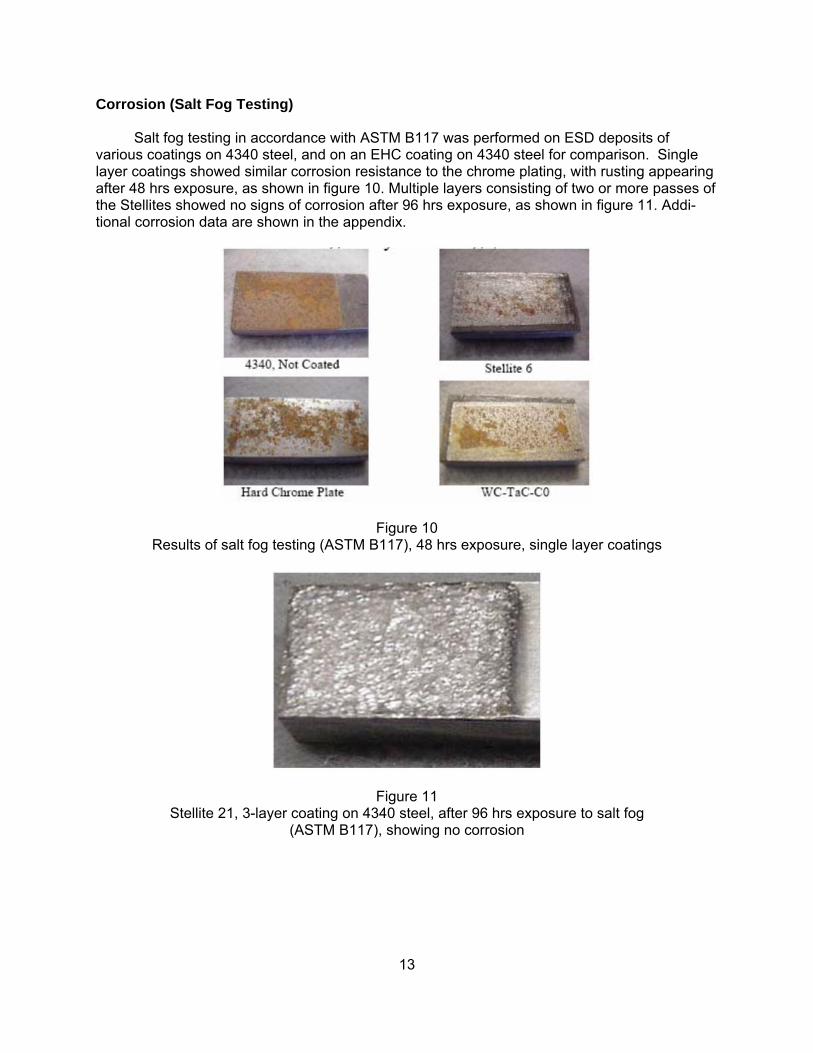
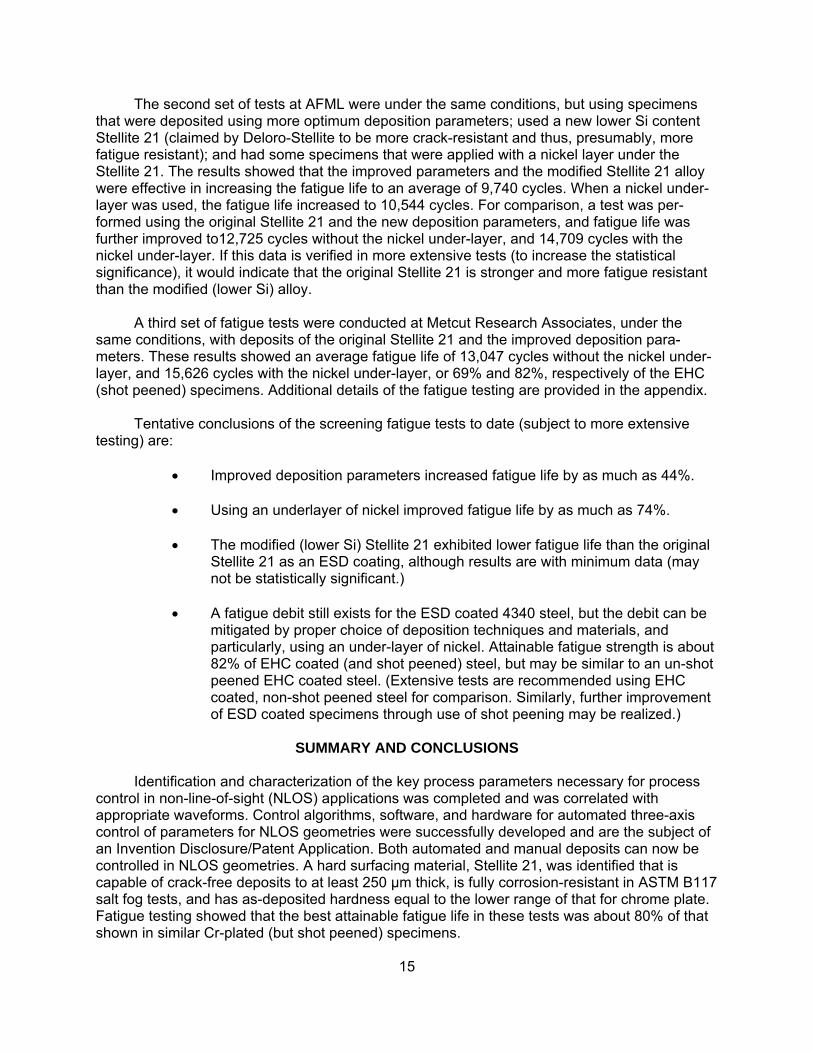
Corrosion (Salt Fog Testing) Salt fog testing in accordance with ASTM B117 was performed on ESD deposits of various coatings on 4340 steel, and on an EHC coating on 4340 steel for comparison. Single layer coatings showed similar corrosion resistance to the chrome plating, with rusting appearing after 48 hrs exposure, as shown in figure 10. Multiple layers consisting of two or more passes of the Stellites showed no signs of corrosion after 96 hrs exposure, as shown in figure 11. Addi-tional corrosion data are shown in the appendix.
Figure 10 Results of salt fog testing (ASTM B117), 48 hrs exposure, single layer coatings
Figure 11 Stellite 21, 3-layer coating on 4340 steel, after 96 hrs exposure to salt fog
(ASTM B117), showing no corrosion
13

Fatigue Coatings of Stellite 21 were applied to 4340 fatigue bars for tests at Wright Patterson Air Force Materials Laboratory (fig. 12). The as-deposited coatings were ground down to leave a polished layer 75 µm (3 mils) thick. Tests were conducted at 185 ksi, R= 0.1, 20 Hz. Results indicated that fatigue life was reduced compared to bare uncoated 4340 steel. The average cycles to failure for the uncoated steel was 141,116 cycles with a minimum of 32,879. The coated steel averaged 8,965 cycles to failure with a minimum of 8,595. A metallurgical analysis by AFML showed a major cause of the debit was a heat-affected-zone in the steel. This was the result of using high-deposition-rate parameters combined with a small specimen mass (inad-equate heat sink). When the parameter optimization was completed (3 months after the fatigue specimens were coated), it was found that the HAZ would have been minimized and defects reduced by using the more optimum, moderate deposition-rate parameters identified by the Taguchi matrix.
Figure 12 Fatigue bars coated with Stellite 21, before grinding and finishing
Success was achieved in reducing heat-affected zones from several mils (for the high deposition rate parameters) to less than 0.5 mil for the more optimum parameters. It appears that a limit in decreasing the size of the heat-affected zone with this specimen size was reached. Experiments have included the use of auxiliary heat sinks and additional gas cooling. The low mass of the specimen (less than ¼-in. diameter) and the heat capacity of 4340 steel limit the energy that can be used in the deposition process, and parameters must be chosen to achieve a balance of low heat affected zone (low energy parameters) and low defect density (higher energy parameters). Discussions about heat affected zones in fatigue specimens were held at the HCAT/ PEWG meetings in late FY2002. The consensus was that the small specimens may not represent “real life” components for the purposes of ESD coatings, since applications to fatigue sensitive components would have much more mass to dissipate the heat. It was recommended that larger (1/2-in. diameter) fatigue samples be considered for coating to minimize the heat-affected zones. Cost and schedule impacts of changing to ½-in. diameter specimens were evaluated and found to be beyond the funding remaining in the program. It is recommended that the larger specimens be coated and tested in follow-on efforts.
14
The second set of tests at AFML were under the same conditions, but using specimens that were deposited using more optimum deposition parameters; used a new lower Si content Stellite 21 (claimed by Deloro-Stellite to be more crack-resistant and thus, presumably, more fatigue resistant); and had some specimens that were applied with a nickel layer under the Stellite 21. The results showed that the improved parameters and the modified Stellite 21 alloy were effective in increasing the fatigue life to an average of 9,740 cycles. When a nickel under- layer was used, the fatigue life increased to 10,544 cycles. For comparison, a test was per-formed using the original Stellite 21 and the new deposition parameters, and fatigue life was further improved to12,725 cycles without the nickel under-layer, and 14,709 cycles with the nickel under-layer. If this data is verified in more extensive tests (to increase the statistical significance), it would indicate that the original Stellite 21 is stronger and more fatigue resistant than the modified (lower Si) alloy. A third set of fatigue tests were conducted at Metcut Research Associates, under the same conditions, with deposits of the original Stellite 21 and the improved deposition para-meters. These results showed an average fatigue life of 13,047 cycles without the nickel under-layer, and 15,626 cycles with the nickel under-layer, or 69% and 82%, respectively of the EHC (shot peened) specimens. Additional details of the fatigue testing are provided in the appendix. Tentative conclusions of the screening fatigue tests to date (subject to more extensive testing) are: • Improved deposition parameters increased fatigue life by as much as 44%. • Using an underlayer of nickel improved fatigue life by as much as 74%. • The modified (lower Si) Stellite 21 exhibited lower fatigue life than the original Stellite 21 as an ESD coating, although results are with minimum data (may not be statistically significant.) • A fatigue debit still exists for the ESD coated 4340 steel, but the debit can be mitigated by proper choice of deposition techniques and materials, and particularly, using an under-layer of nickel. Attainable fatigue strength is about 82% of EHC coated (and shot peened) steel, but may be similar to an un-shot peened EHC coated steel. (Extensive tests are recommended using EHC coated, non-shot peened steel for comparison. Similarly, further improvement of ESD coated specimens through use of shot peening may be realized.)
SUMMARY AND CONCLUSIONS Identification and characterization of the key process parameters necessary for process control in non-line-of-sight (NLOS) applications was completed and was correlated with appropriate waveforms. Control algorithms, software, and hardware for automated three-axis control of parameters for NLOS geometries were successfully developed and are the subject of an Invention Disclosure/Patent Application. Both automated and manual deposits can now be controlled in NLOS geometries. A hard surfacing material, Stellite 21, was identified that is capable of crack-free deposits to at least 250 µm thick, is fully corrosion-resistant in ASTM B117 salt fog tests, and has as-deposited hardness equal to the lower range of that for chrome plate. Fatigue testing showed that the best attainable fatigue life in these tests was about 80% of that shown in similar Cr-plated (but shot peened) specimens.
15

REFERENCES 1. Schell, Jerry D. and Reichtsteiner, Mark, “Replacement of Chromium Electroplating Using Advanced Material Technologies on Gas Turbine Engine Components”, AESF Forum, March 2000. 2. Sartwell, Bruce D., et al, “Replacement of Chromium Electroplating Using HVOF Thermal Spray Coatings”, AESF Plating Forum, March 1998. 3. Johnson, R. N., “Electro-Spark Deposited Coatings for High Temperature Wear and Corrosion Applications”, in Elevated Temperature Coatings: Science and Technology 1, ed. by N.B. Dahotre, J.M. Hampikian and J.J. Stiglich, The Minerals, Metals, and Materials Society, Warrendale, PA, 1995 4. Johnson, R. N., “Principals and Applications of Electro-Spark Deposition”, in Surface Modification Technologies, ed. by T.S. Sudarshan and D.G. Bhat, The Metallurgical Society, 1988. 5. Johnson, R.N., “Alternative Coatings for Wear and Corrosion: the Electrospark Deposition Process”, published in Proceedings, American Electroplaters and Surface Finishers Society, Jan. 2002. 6. Johnson, R.N., “ElectroSpark Deposition: Principals and Applications”, Society of Vacuum Coaters 45th Annual Technical Conference Proceedings, Apr. 2002, Lake Buena Vista, FL, p. 87-92. Also published in Vacuum Technology and Coating, p. 44, May 2003. 7. Ross, Phillip J., Taguchi Techniques for Quality Engineering, 2nd ed., McGraw-Hill, N.Y., 1996.
17

APPENDIX
SCREENING TESTS PERFORMED BY OR FOR THE NATIONAL DEFENSE CENTER FOR ENVIRONMENTAL EXCELLENCE
19

This appendix documents the screening tests performed by or for the National Defense Center for Environmental Excellence (NDCEE) operated for the DoD by Concurrent Technolo-gies Corporation (CTC). The report documents the following for corrosion resistance, wear resistance and fatigue screen testing: • Test specimen preparation • Test equipment used • Data acquisition methods used • Data/Results • Evaluations/Analysis Project Background The needs of the Tri-services were identified through discussions with the Department of Defense (DoD) team members and by leveraging other projects focused on replacing EHC in NLOS applications. For ESD technology to be considered a potentially viable process to replace EHC for NLOS applications, the process’s ability to deposit alternative coatings uniformly on identified NLOS component substrate materials must be demonstrated. In addition, the alterna-tive coating(s) must be screen tested to evaluate its capability to possess equal or better per-formance characteristics than EHC (i.e., corrosion resistance, wear resistance, fatigue, etc.). Coating materials and a substrate were selected for this Task’s screen testing based on Tri-service needs for replacement of EHC in NLOS applications. Various coating materials were selected and are presented in the corrosion resistance, wear resistance and fatigue section of this report. The substrate selected was 4340 steel. Pacific Northwest National Laboratory (PNNL), Richland, Washington, demonstrated the ESD process by coating specimens for this Task. CORROSION RESISTANCE In addition to the ESD coatings, testing was also conducted on EHC to provide a baseline for comparison to the ESD coatings. Corrosion Test Specimens Preparation PNNL fabricated four 3/4" x 1 ½"x 1/4" 4340 steel specimens for ESD coating. All specimens were coated with three layers of Stellite 21 to ~ 0.005" (5 mils) thickness before finishing. Deposition parameters were 400 (hertz) Hz, 50 microfarad [mfd (a unit of capacitance)] and 170 volts. The 4340 steel was heat treated to Rockwell C (Rc) 52. Metals Samples Company supplied the specimens for EHC plating. The four 2" x 2" x 3/16" specimens were fabricated from 4340 steel. The surface to be plated was finished to roughness average (Ra) = 8-10 microinches and heat-treated to RC 48-50. The specimens then were EHC-plated by Southwest United Industries, Inc. The specimens were baked for stress relief, shot peened, masked on one side and edges, and chrome plated on one side to a minimum thickness of 0.005" (5 mils). Post-treatments included embrittlement relief through baking (350° - 400° F for 23 hours within 4 hours of completion of plating) and a
21
finish grind to obtain a surface finish of Ra = 8-10 microinches and maintain a coating thickness of 0.002"-0.003" (2-3 mils). Upon completing grinding operations, the samples were cleaned and inspected using dye penetrant per ASTM E1417-99. Note: The minimal hardness difference between the ESD and the Chrome specimens is not considered critical to this screen test comparison. The ESD was not shot peened because it would be for NLOS surfaces that could not readily be shot peened. It is recommended that future EHC and ESD specimens should not be shot peened for a more accurate comparison. Corrosion Test Equipment NDCEE laboratory technicians conducted the corrosion testing using a Singleton Salt Spray Chamber Serial No. 23-29011 housed in CTC’s Environmental Technology Facility (ETF), Johnstown, Pennsylvania. Corrosion Test Data Acquisition Methods Corrosion resistance data acquisition was performed in accordance with ASTM B 117, Standard Practice for Operating Salt Spray (Fog) Apparatus. The corrosion tests were performed on four ESD-coated specimens and four EHC specimens. The salt fog chamber was operated in accordance with ASTM B 117-97 (Standard Practice for Operating Salt Spray (Fog) Apparatus, approved 1997). The salt solution was verified to be 5% +/-1% concentration and pH was verified to be 6.5 to 7.2 at 95°F. The back and edges of the test specimens were covered with vinyl tape to prevent corrosion products from contaminating the salt fog chamber. The specimens were then placed in the salt spray chamber at a 15° to 30° angle from vertical. The test coupons were placed in the salt fog chamber for 96 hours and evaluated daily for signs of corrosion. At the end of the test duration, the test coupons were removed from the salt spray chamber and cleaned by gently flushing them with running water. They were then allowed to air dry at ambient temperatures. The test coupons were then visually examined for corrosion. Corrosive salts or oxides running down the surface of the coupon were considered evidence of severe corrosion. Corrosion Test Results The test coupons were evaluated according to ASTM D1654 (Standard Test Method for Evaluation of Painted or Coated Specimens Subjected to Corrosive Environments, approved 1992). A summary of the corrosion test results is presented in Table A-1. Complete test results are presented as Attachment I.
22
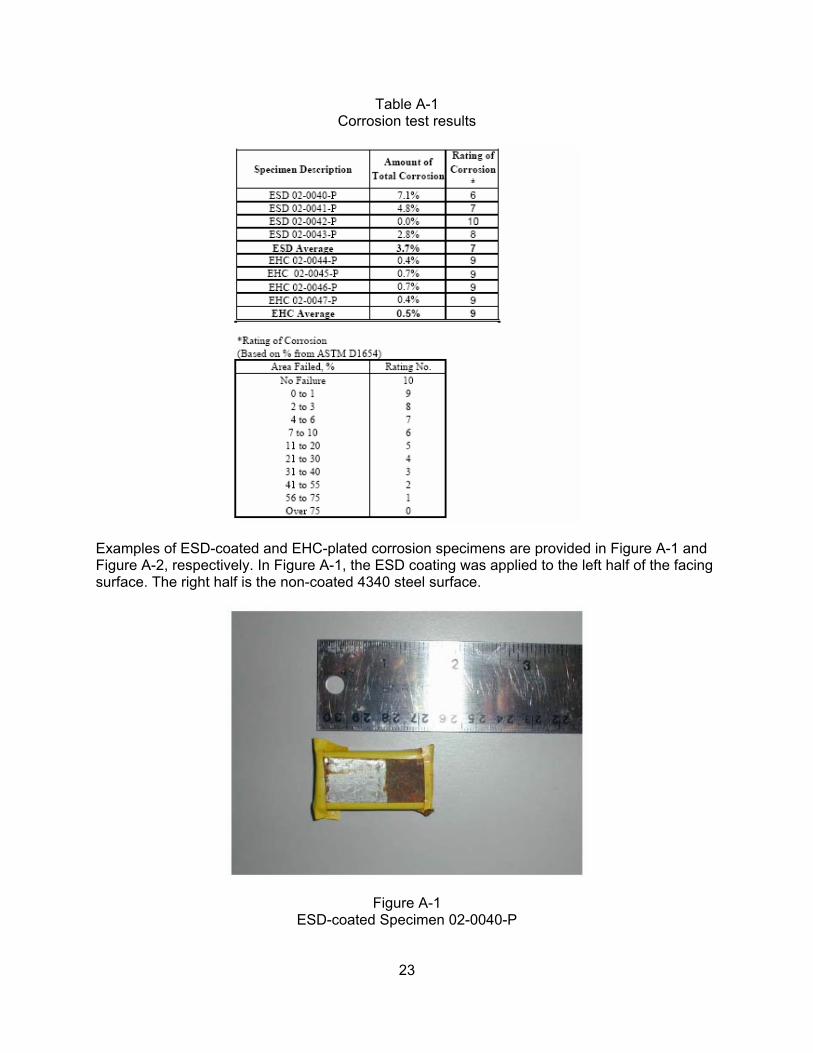
Table A-1 Corrosion test results
Examples of ESD-coated and EHC-plated corrosion specimens are provided in Figure A-1 and Figure A-2, respectively. In Figure A-1, the ESD coating was applied to the left half of the facing surface. The right half is the non-coated 4340 steel surface.
Figure A-1 ESD-coated Specimen 02-0040-P
23
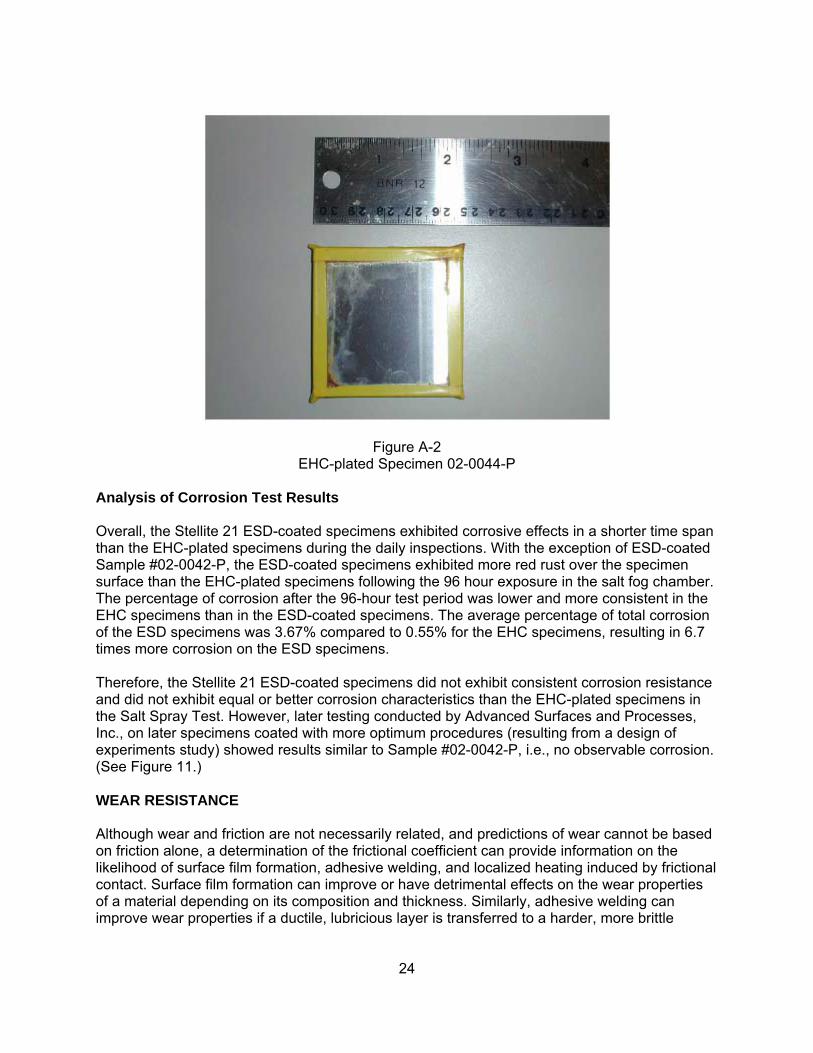
Figure A-2 EHC-plated Specimen 02-0044-P
Analysis of Corrosion Test Results Overall, the Stellite 21 ESD-coated specimens exhibited corrosive effects in a shorter time span than the EHC-plated specimens during the daily inspections. With the exception of ESD-coated Sample #02-0042-P, the ESD-coated specimens exhibited more red rust over the specimen surface than the EHC-plated specimens following the 96 hour exposure in the salt fog chamber. The percentage of corrosion after the 96-hour test period was lower and more consistent in the EHC specimens than in the ESD-coated specimens. The average percentage of total corrosion of the ESD specimens was 3.67% compared to 0.55% for the EHC specimens, resulting in 6.7 times more corrosion on the ESD specimens. Therefore, the Stellite 21 ESD-coated specimens did not exhibit consistent corrosion resistance and did not exhibit equal or better corrosion characteristics than the EHC-plated specimens in the Salt Spray Test. However, later testing conducted by Advanced Surfaces and Processes, Inc., on later specimens coated with more optimum procedures (resulting from a design of experiments study) showed results similar to Sample #02-0042-P, i.e., no observable corrosion. (See Figure 11.) WEAR RESISTANCE Although wear and friction are not necessarily related, and predictions of wear cannot be based on friction alone, a determination of the frictional coefficient can provide information on the likelihood of surface film formation, adhesive welding, and localized heating induced by frictional contact. Surface film formation can improve or have detrimental effects on the wear properties of a material depending on its composition and thickness. Similarly, adhesive welding can improve wear properties if a ductile, lubricious layer is transferred to a harder, more brittle
24
mating material or it can result in catastrophic failure if the adherent material is hard and is dislodged, resulting in an abrasive grit for 3 body wear. The production of heat also can be useful or detrimental. Increases in thermal energy can enhance chemical reactivity or alter the material properties on a localized level.1 Enhancements in chemical reactivity can lead to protective film formation or films that facilitate wear. Therefore, to fully understand the tribological properties of a material, a measurement of friction is necessary. Tribometry enables one to monitor the frictional coefficient during the wear test, while the wear scar is analyzed separately at the completion of the test using a profilometer. Tribometry testing was performed in accordance with ASTM G99, Standard Test Method for Wear Testing with a Pinon-Disk Apparatus. Wear Resistance Specimen Preparation PNNL fabricated six 2 ½"x2 ½"x 3/16” 4340 steel specimens (annealed and heat-treated to a hardness of RC 52 for ESD coating. PNNL coated both sides (surfaces) of each of the six specimens using the ESD process. PNNL applied each of four coating materials to three specimen surfaces, providing three coated surfaces of each coating type for wear resistance testing. PNNL applied coating materials are specified in Table A-2. Note: Polished EHC specimens were prepared by an NDCEE subcontractor for wear resistance testing. PNNL's Roger Johnson, Principal Investigator for SERDP, recommended testing the ESD coatings in the as-deposited finish and non-lubricated condition, which typically produces lower friction and increased wear resistance in ESD coatings. PNNL ESD coated the specimens, lightly buffed the ESD coatings and provided the ESD specimens to the NDCEE for wear resistance testing. The minimal hardness difference between the ESD and the EHC substrates is not critical to this screen test comparison, especially because the wear is on the ESD coating material and not the substrate.
Table A2 Wear resistance specimens and applied coatings
__________________ 1Henry, S., ed., ASM Handbook Volume 18: Friction, Lubrication, and Wear Technology, ASM International, USA, October 1992, pp. 39.
25
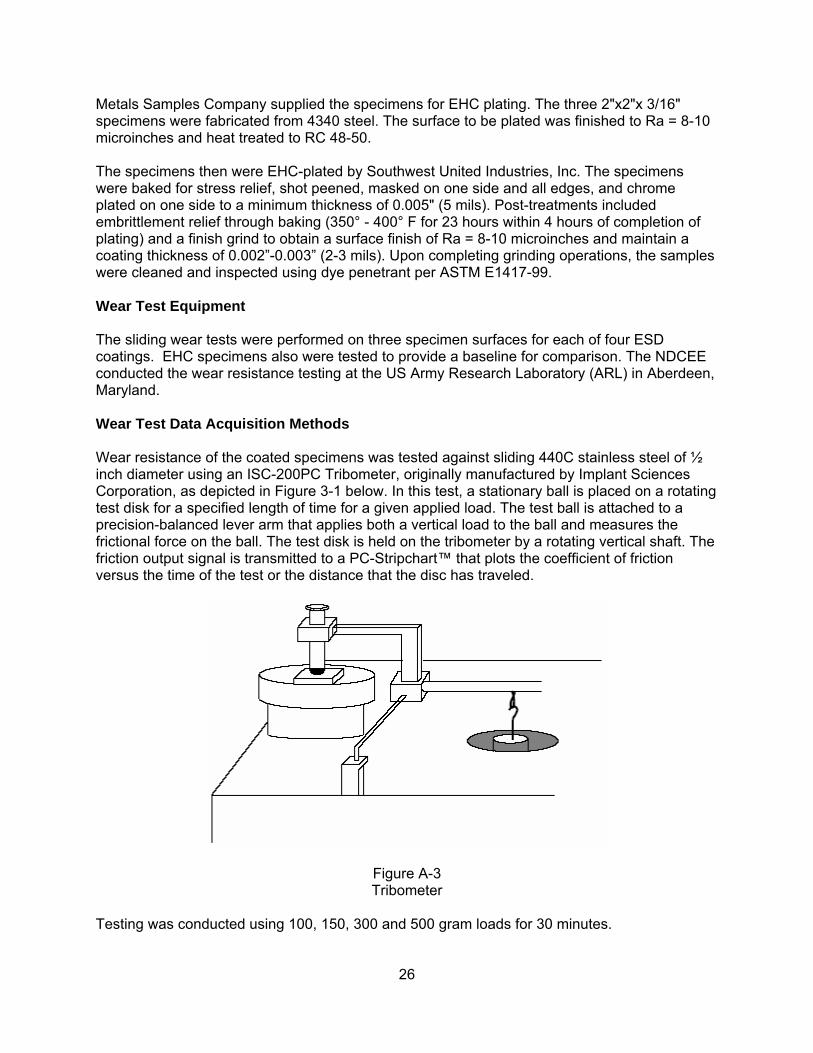
Metals Samples Company supplied the specimens for EHC plating. The three 2"x2"x 3/16" specimens were fabricated from 4340 steel. The surface to be plated was finished to Ra = 8-10 microinches and heat treated to RC 48-50. The specimens then were EHC-plated by Southwest United Industries, Inc. The specimens were baked for stress relief, shot peened, masked on one side and all edges, and chrome plated on one side to a minimum thickness of 0.005" (5 mils). Post-treatments included embrittlement relief through baking (350° - 400° F for 23 hours within 4 hours of completion of plating) and a finish grind to obtain a surface finish of Ra = 8-10 microinches and maintain a coating thickness of 0.002”-0.003” (2-3 mils). Upon completing grinding operations, the samples were cleaned and inspected using dye penetrant per ASTM E1417-99. Wear Test Equipment The sliding wear tests were performed on three specimen surfaces for each of four ESD coatings. EHC specimens also were tested to provide a baseline for comparison. The NDCEE conducted the wear resistance testing at the US Army Research Laboratory (ARL) in Aberdeen, Maryland. Wear Test Data Acquisition Methods Wear resistance of the coated specimens was tested against sliding 440C stainless steel of ½ inch diameter using an ISC-200PC Tribometer, originally manufactured by Implant Sciences Corporation, as depicted in Figure 3-1 below. In this test, a stationary ball is placed on a rotating test disk for a specified length of time for a given applied load. The test ball is attached to a precision-balanced lever arm that applies both a vertical load to the ball and measures the frictional force on the ball. The test disk is held on the tribometer by a rotating vertical shaft. The friction output signal is transmitted to a PC-Stripchart™ that plots the coefficient of friction versus the time of the test or the distance that the disc has traveled.
Figure A-3 Tribometer
Testing was conducted using 100, 150, 300 and 500 gram loads for 30 minutes.
26
Wear Test Results The coefficient of friction for each coated specimen was measured directly by the tribometer. The coating loss was calculated by first measuring the wear scar depth, width, and diameter using a profilometer. To assess the wear on the test specimens, it is assumed that the wear track has an approximately triangular cross-section. Therefore, the volume of worn material on the disc can be calculated using a simple expression: V = (bh/2)c …………………………………………………….………………….(1) In equation 1, V is volume of the worn material (cm3), b is the base or width of the wear scar (cm), h is the height or depth of the wear scar (cm), and c is the circumference of the wear scar (cm) where c = πd, and d is the inner diameter of the wear scar. Figures A-3 and A-4 show the triangular cross-section of the wear scar and the circumference of the scar on the sample surface, respectively.
Figure A-4 Triangular Cross-section of Wear Scar and Associated Dimensions
Figure A-5 Wear Scar on Sample Surface and Associated Dimensions
Similarly, the wear of the ball must be considered. If one surface wears terribly, regardless of whether it is the test specimen or ball, the system is considered a failure. The purpose of using the 440C stainless steel ball is that it is the conventional material to use in tribometry testing, and it gives a good indication of the relative degree of wear to be expected in a system. Therefore, the wear loss of the ball was also calculated by measuring the wear scar on the ball using the profilometer. The volume of worn material on the ball can be calculated using a simple expression: The volume of the wear scar on the 440 C stainless steel test ball is calculated using equations (2), (3), (4), and (5) to derive equation (6). In these equations, R represents the radius of the test ball used and ao represents the radius of the wear scar. Figures A-6 and A-7 shows the test ball and the associated dimensions.
27
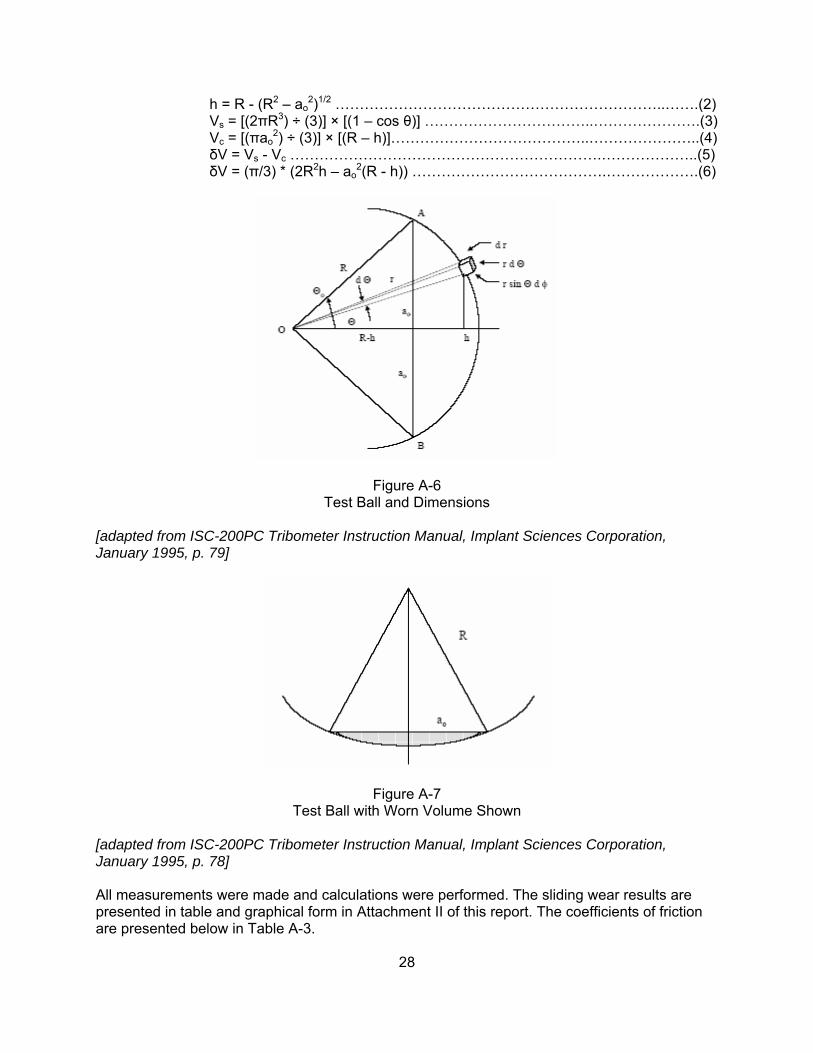
h = R - (R2 – ao2)1/2 …………………………………………………………..…….(2)
Vs = [(2πR3) ÷ (3)] × [(1 – cos θ)] ……………………………..………………….(3) Vc = [(πao
2) ÷ (3)] × [(R – h)]…………………………………..…………………..(4) δV = Vs - Vc ……………………………………………………….………………..(5) δV = (π/3) * (2R2h – ao
2(R - h)) ………………………………….……………….(6)
Figure A-6 Test Ball and Dimensions
[adapted from ISC-200PC Tribometer Instruction Manual, Implant Sciences Corporation, January 1995, p. 79]
Figure A-7 Test Ball with Worn Volume Shown
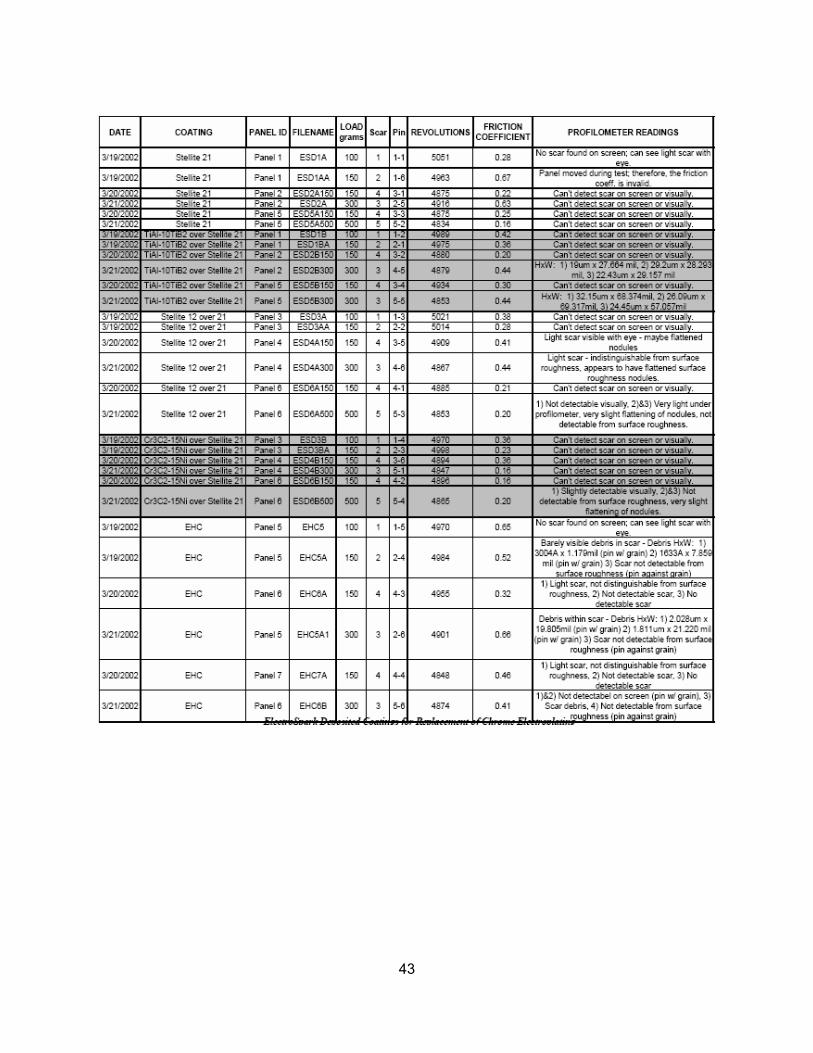
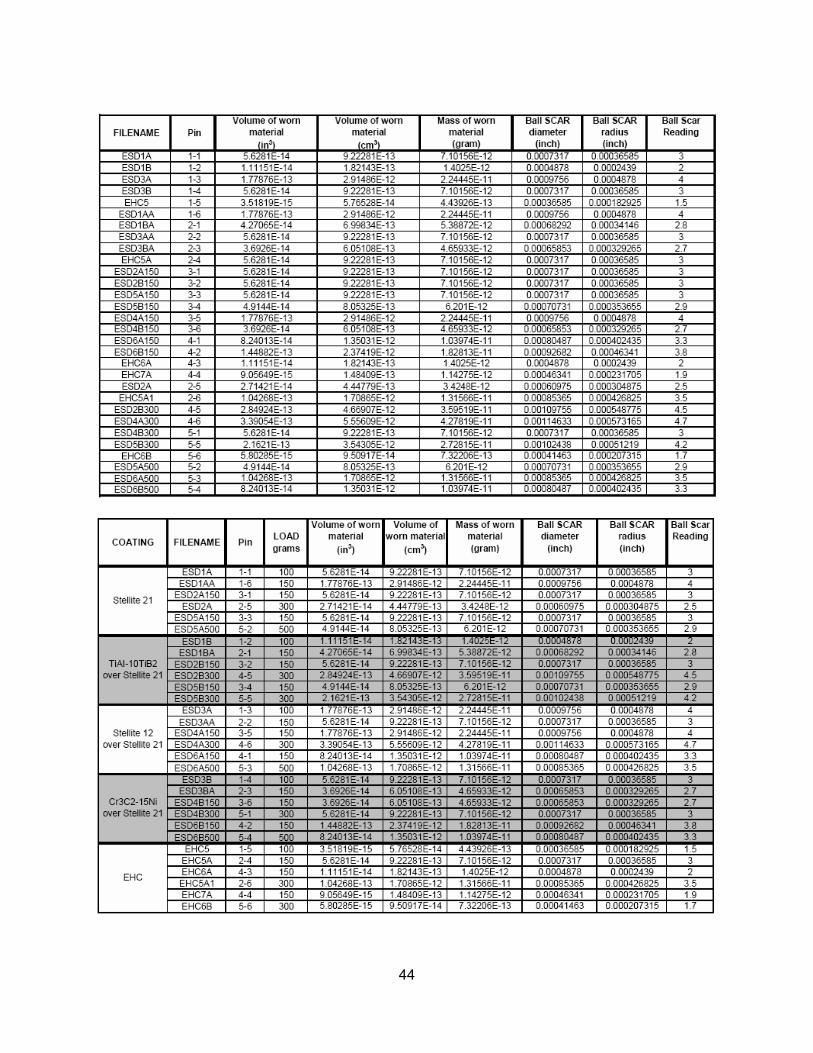
[adapted from ISC-200PC Tribometer Instruction Manual, Implant Sciences Corporation, January 1995, p. 78] All measurements were made and calculations were performed. The sliding wear results are presented in table and graphical form in Attachment II of this report. The coefficients of friction are presented below in Table A-3.
28
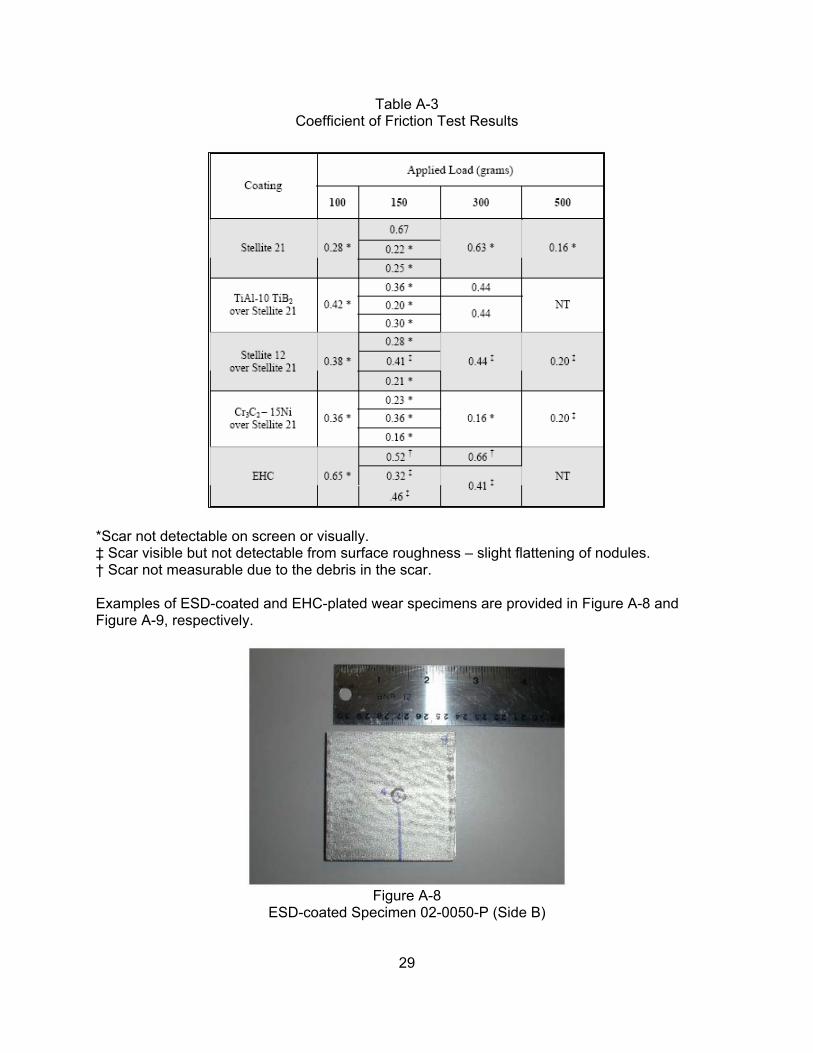
Table A-3 Coefficient of Friction Test Results
*Scar not detectable on screen or visually. ‡ Scar visible but not detectable from surface roughness – slight flattening of nodules. † Scar not measurable due to the debris in the scar. Examples of ESD-coated and EHC-plated wear specimens are provided in Figure A-8 and Figure A-9, respectively.
Figure A-8
ESD-coated Specimen 02-0050-P (Side B)
29
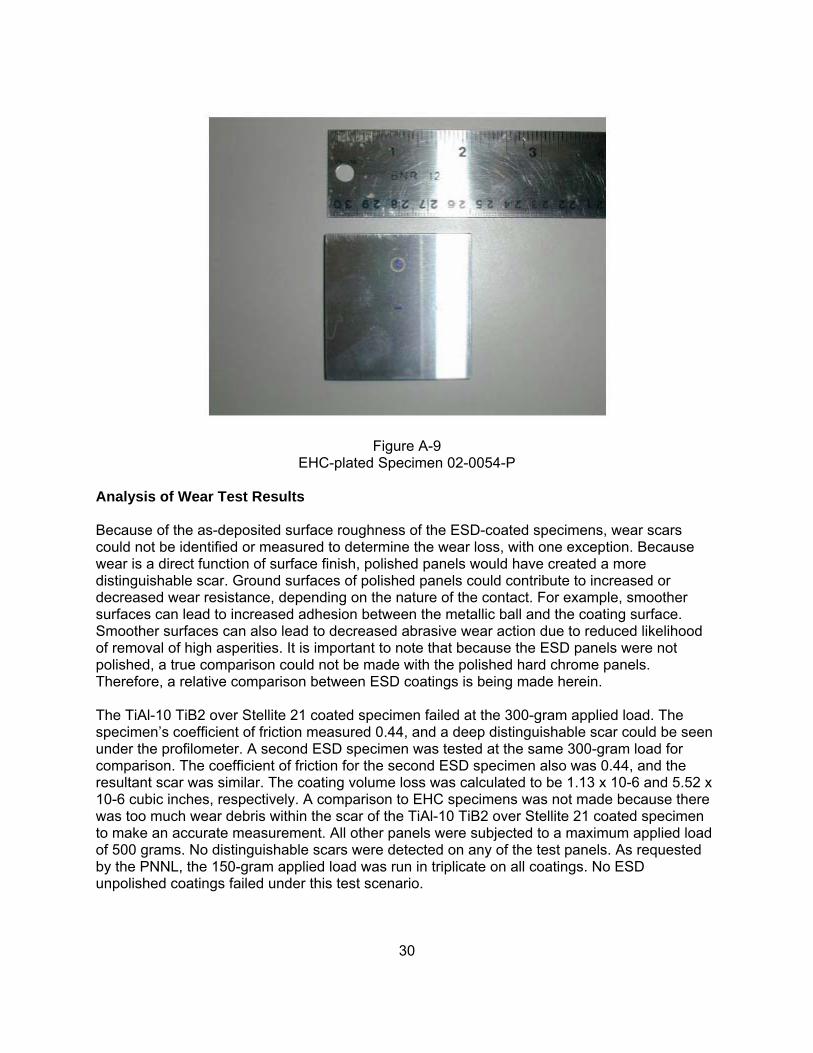
Figure A-9 EHC-plated Specimen 02-0054-P
Analysis of Wear Test Results Because of the as-deposited surface roughness of the ESD-coated specimens, wear scars could not be identified or measured to determine the wear loss, with one exception. Because wear is a direct function of surface finish, polished panels would have created a more distinguishable scar. Ground surfaces of polished panels could contribute to increased or decreased wear resistance, depending on the nature of the contact. For example, smoother surfaces can lead to increased adhesion between the metallic ball and the coating surface. Smoother surfaces can also lead to decreased abrasive wear action due to reduced likelihood of removal of high asperities. It is important to note that because the ESD panels were not polished, a true comparison could not be made with the polished hard chrome panels. Therefore, a relative comparison between ESD coatings is being made herein. The TiAl-10 TiB2 over Stellite 21 coated specimen failed at the 300-gram applied load. The specimen’s coefficient of friction measured 0.44, and a deep distinguishable scar could be seen under the profilometer. A second ESD specimen was tested at the same 300-gram load for comparison. The coefficient of friction for the second ESD specimen also was 0.44, and the resultant scar was similar. The coating volume loss was calculated to be 1.13 x 10⁻⁶ and 5.52 x 10⁻⁶ cubic inches, respectively. A comparison to EHC specimens was not made because there was too much wear debris within the scar of the TiAl-10 TiB2 over Stellite 21 coated specimen to make an accurate measurement. All other panels were subjected to a maximum applied load of 500 grams. No distinguishable scars were detected on any of the test panels. As requested by the PNNL, the 150-gram applied load was run in triplicate on all coatings. No ESD unpolished coatings failed under this test scenario.
30
However, the mating balls did experience significant wear loss. Upon reviewing the wear loss data in Appendix B, it can be seen that in general, most coatings provided similar ball loss with a given load, except the Stellite 12 over Stellite 21. In almost all tests, the wear loss was on the order of 1 to 4 x 10-11 grams. While many other coatings exhibited pin loss on this order at higher loads (typically 300 and 500 g loads), the losses were typically in the 10-12 gram range. It should be noted that the Stellite 12 over Stellite 21 experienced the greatest ball loss for all coatings at a 300 g load, rather than the 500 g load. The second greatest loss for a ball was shown for the TiAl-10TiB2 over Stellite 21 at a 300 g load. No test was performed on this coating using a 500 g load due to measurable wear scars being produced using 300 g. Because some coatings caused greater ball wear loss than others, these coatings should be scrutinized more carefully in follow-on testing. It also is recommended that the coatings be tested against the material against which it will be mated in the selected weapons system. Note: The minimal substrate Rockwell C hardness differences between the ESD and the EHC specimens is not considered to be generic to this screen test comparison, especially because the wear is on the ESD coating material and not the substrate. FATIGUE Fatigue screen testing was conducted as required by Section 2.3.2.1 of the approved Screening Test Plan (Revision 2 dated October 31, 2001). The Air Force Research Laboratory (AFRL) had already completed an EHC baseline for fatigue testing. The NDCEE has included this EHC baseline information from “HVOF Coatings Characterization,” Report No. AFRL/MLSC 02-069 (Kolek, J., February 2002). Fatigue Specimen Preparation Metcut, Cincinnati, Ohio, fabricated six specimens for ESD coating per Metcut Drawing 1288 using hardened (~48-50 Rc) 4340 steel. Metcut Drawing 1288 is provided in Figure A-10. All Metcut specimens were coated by PNNL’s ESD equipment using Stellite 21 with a hardness of 500 to 600 Knoop. ESD Specimens 40-13, 40-14 & 40-15 did not have a nickel underlayer and ESD specimens 40-16, 40-17 & 40-18 did have a nickel underlayer. Metcut then ground the ESD coating thickness back to 0.003 inches (+/- 0.0005 inches). After grinding, the surface was longitudinally polished to an 8 Ra finish.
31
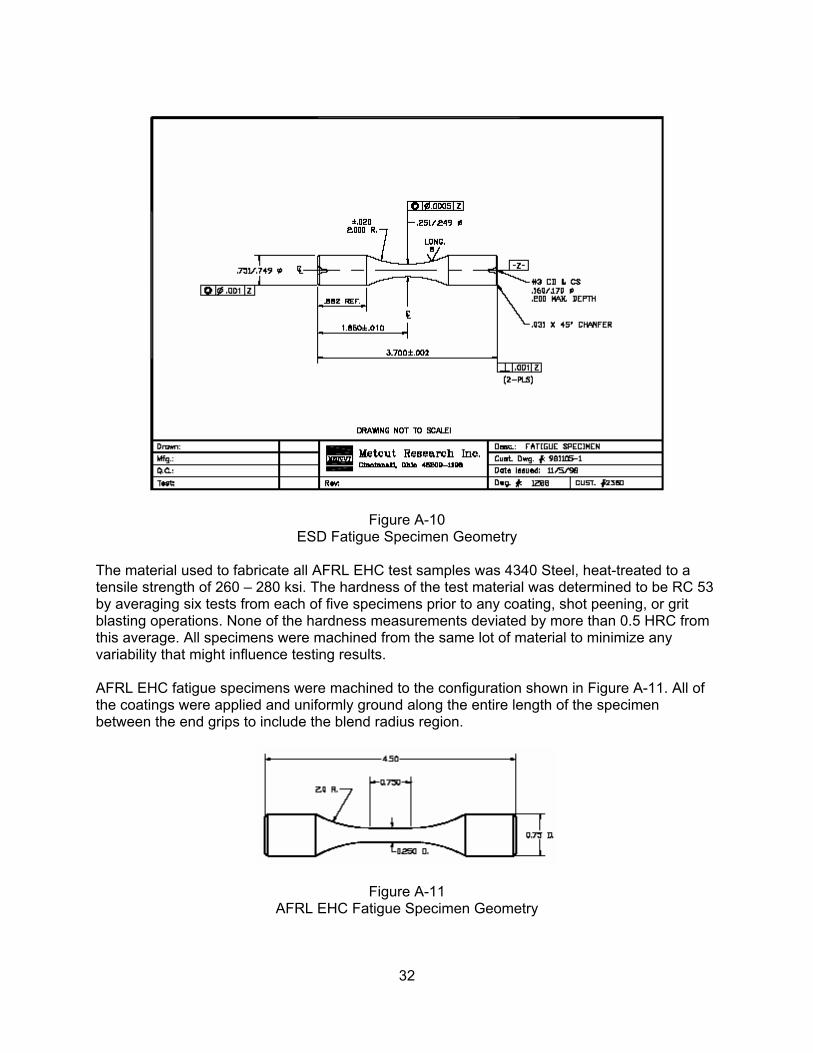
Figure A-10 ESD Fatigue Specimen Geometry
The material used to fabricate all AFRL EHC test samples was 4340 Steel, heat-treated to a tensile strength of 260 – 280 ksi. The hardness of the test material was determined to be RC 53 by averaging six tests from each of five specimens prior to any coating, shot peening, or grit blasting operations. None of the hardness measurements deviated by more than 0.5 HRC from this average. All specimens were machined from the same lot of material to minimize any variability that might influence testing results. AFRL EHC fatigue specimens were machined to the configuration shown in Figure A-11. All of the coatings were applied and uniformly ground along the entire length of the specimen between the end grips to include the blend radius region.
Figure A-11 AFRL EHC Fatigue Specimen Geometry
32

All of the specimen fabrication and coating grinding was accomplished by Metcut. All shot peening operations were performed by Metal Improvement, Blue Ash, Ohio. All EHC plating of the specimens was accomplished by Southwest Aeroservice, Tulsa, Oklahoma. The following specifications were utilized during the EHC specimen preparation. • Shotpeening IAW AMS-2432; wrought steel shot, Almen 9-10A compressive stress. • Grit blasting IAW MIL-STD-1504; 54 grit Aluminum Oxide at 60 psi. • Low stress grinding IAW MIL-STD-866. • EHC IAW MIL-STD-1501 supported by QQ-C-320. Fatigue Test Equipment Metcut laboratory technicians conducted the fatigue testing of the six ESD-coated specimens using Test Machine 60055 housed in Metcut’s facility, Cincinnati, Ohio. EHC fatigue testing for Report No. AFRL/MLSC 02-069 was accomplished using MTS servo-hydraulic machines equipped with commercially available collet grips. Procedures outlined in ASTM E466-96 “Conducting Force Controlled Constant Amplitude Axial Fatigue Tests of Metallic Materials” were closely followed. Fatigue Test Data Acquisition Methods Metcut tested the specimens at room temperature run at a stress ratio of R=0.1 at 185 ksi using a frequency of 30-40 Hz. for 1 x 10⁶ cycles. Metcut performed test set up, calibration and reporting of test data to NDCEE. The fatigue tests were performed on six ESD-coated speci-mens. The test stand was an MTS Model 810 using a 458 controller with MTS Model 64710 hydraulic grips that were fitted with jaws to grip the outside diameter of the specimen. The output from the load cell was fed to a strip chart recorder for the duration of the test. The testing was conducted in accordance with ASTM E466. The alignment of the fixturing was in accordance with ASTM E 1012 and was conducted with a specimen blank that had been strain-gaged for just this purpose. Five fatigue tests were conducted for each AFRL EHC specimen configuration at 185 ksi, stress ratio % R0 0.1 and 25 – 35 Hz. Fatigue Test Results The Laboratory Report from Metcut for fatigue testing of ESD-coated specimens is provided as Attachment III. A typical fatigue specimen is shown in Figure A-12.
33
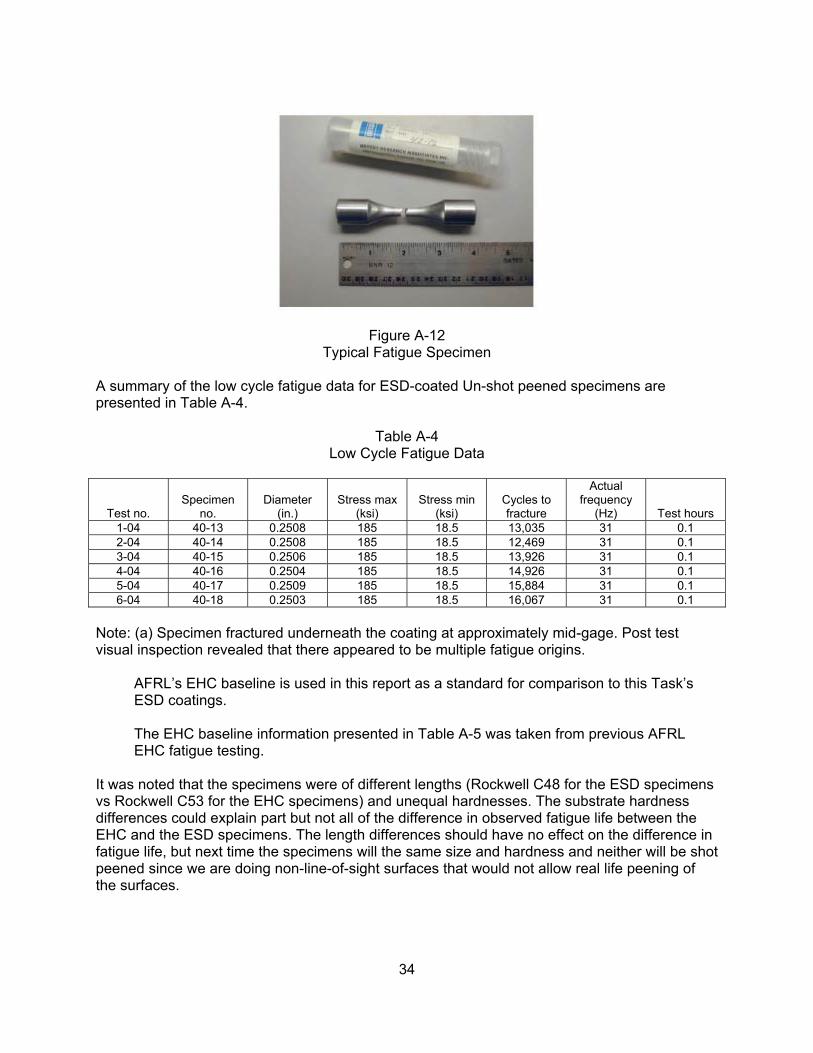
Figure A-12 Typical Fatigue Specimen
A summary of the low cycle fatigue data for ESD-coated Un-shot peened specimens are presented in Table A-4.
Table A-4 Low Cycle Fatigue Data
Test no. Specimen
no. Diameter
(in.) Stress max
(ksi) Stress min
(ksi) Cycles to fracture
Actual frequency
(Hz) Test hours 1-04 40-13 0.2508 185 18.5 13,035 31 0.1 2-04 40-14 0.2508 185 18.5 12,469 31 0.1 3-04 40-15 0.2506 185 18.5 13,926 31 0.1 4-04 40-16 0.2504 185 18.5 14,926 31 0.1 5-04 40-17 0.2509 185 18.5 15,884 31 0.1 6-04 40-18 0.2503 185 18.5 16,067 31 0.1
Note: (a) Specimen fractured underneath the coating at approximately mid-gage. Post test visual inspection revealed that there appeared to be multiple fatigue origins. AFRL’s EHC baseline is used in this report as a standard for comparison to this Task’s ESD coatings. The EHC baseline information presented in Table A-5 was taken from previous AFRL EHC fatigue testing. It was noted that the specimens were of different lengths (Rockwell C48 for the ESD specimens vs Rockwell C53 for the EHC specimens) and unequal hardnesses. The substrate hardness differences could explain part but not all of the difference in observed fatigue life between the EHC and the ESD specimens. The length differences should have no effect on the difference in fatigue life, but next time the specimens will the same size and hardness and neither will be shot peened since we are doing non-line-of-sight surfaces that would not allow real life peening of the surfaces.
34
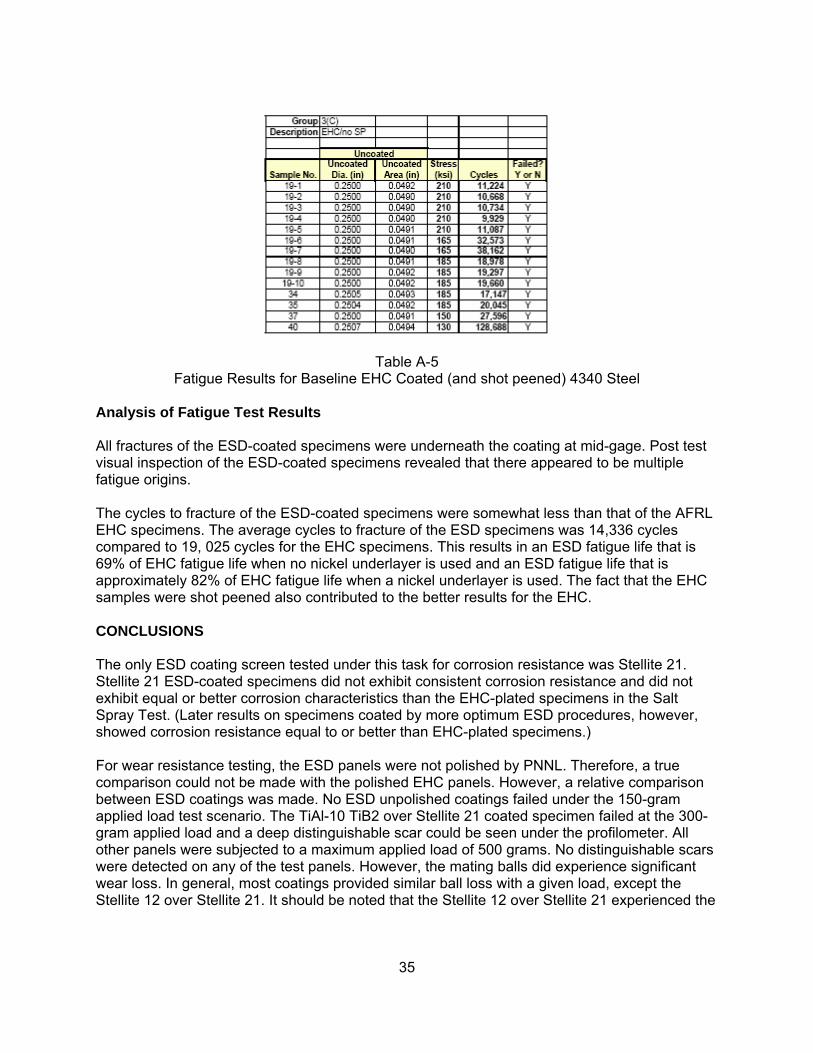
Table A-5 Fatigue Results for Baseline EHC Coated (and shot peened) 4340 Steel
Analysis of Fatigue Test Results All fractures of the ESD-coated specimens were underneath the coating at mid-gage. Post test visual inspection of the ESD-coated specimens revealed that there appeared to be multiple fatigue origins. The cycles to fracture of the ESD-coated specimens were somewhat less than that of the AFRL EHC specimens. The average cycles to fracture of the ESD specimens was 14,336 cycles compared to 19, 025 cycles for the EHC specimens. This results in an ESD fatigue life that is 69% of EHC fatigue life when no nickel underlayer is used and an ESD fatigue life that is approximately 82% of EHC fatigue life when a nickel underlayer is used. The fact that the EHC samples were shot peened also contributed to the better results for the EHC. CONCLUSIONS The only ESD coating screen tested under this task for corrosion resistance was Stellite 21. Stellite 21 ESD-coated specimens did not exhibit consistent corrosion resistance and did not exhibit equal or better corrosion characteristics than the EHC-plated specimens in the Salt Spray Test. (Later results on specimens coated by more optimum ESD procedures, however, showed corrosion resistance equal to or better than EHC-plated specimens.) For wear resistance testing, the ESD panels were not polished by PNNL. Therefore, a true comparison could not be made with the polished EHC panels. However, a relative comparison between ESD coatings was made. No ESD unpolished coatings failed under the 150-gram applied load test scenario. The TiAl-10 TiB2 over Stellite 21 coated specimen failed at the 300- gram applied load and a deep distinguishable scar could be seen under the profilometer. All other panels were subjected to a maximum applied load of 500 grams. No distinguishable scars were detected on any of the test panels. However, the mating balls did experience significant wear loss. In general, most coatings provided similar ball loss with a given load, except the Stellite 12 over Stellite 21. It should be noted that the Stellite 12 over Stellite 21 experienced the
35
greatest ball loss for all coatings at a 300 g load, rather than the 500 g load. If further testing is considered, it is recommended that the coatings be tested against the material that it will be mated to in the selected weapons system. Results from fatigue testing showed that the cycles to fracture of the ESD-coated specimens were somewhat less than that of the AFRL EHC specimens. At the 185 KSI fatigue loading condition, the average cycles to fracture of the non-nickel underplayed ESD specimens was 13,047 cycles compared to 19, 025 cycles for the shot peened EHC specimens. This results in an ESD fatiguelife that is about 69% of shot peened EHC fatigue life. By depositing a nickel underlayment prior to deposit of the Stellite 21, the fatigue life increased to 15,626 cycles before failure, which corresponds to about 82% of shotpeened EHC fatigue life. Using a chart on the website, http://www.metalimprovement.com/met_fatigue.htm, the difference in expected fatigue life due to increases attributable to shot peening of the EHC samples plus an expected increase in fatigue life due to Rockwell C hardness level differences possible (the hardnesses possible ranged from 48 on the ESD samples to 53 on the EHC samples) were looked at on a chart “Comparison of Peened and Un-Peened Limits for Smooth and Notched Specimens as a function of Ultimate Tensile Strength of Steel. The UTS of the steel was correlated to the Rockwell C hardness of the steel. I read at Rockwell C 53 and 48 and thentransposed up to the peened curve and read across to the fatigue strength – Mega Paschals (2 Million Cycles). I noticed that the softer Rockwell C steel could only be expected to last 2 million cycles at about 84% of the load of the harder steel, and this solely as a result of Rockwell C variations on peened specimens. I also noticed that at the hardnesses we were testing, peened specimens had much larger fatigue strength than unpeened specimens. For example, 48 RC unpeened specimens (like the ESD ones) have fatigue strength of only 475 Mpa, while 53 RC peened specimens have fatigue strength of about 950 Mpa. This is exactly half of the fatigue strength. The major effect seems to have been due to our peening the EHC plated hard steel versus not peening the ESD coated soft steel. The hardness on the ESD specimens could have been 48, while the hardness of the EHC substrate was 53. This can explain much of our poor results. In these screen test findings, the ESD coatings did not meet or exceed the corrosion resistance and the fatigue life of EHC specimens. Also, the unpolished ESD wear resistance specimens did not provide for a reliable conclusive comparison to polished EHC specimens. This does not mean that the ESD should be abandoned. ESD still appears very favorable and economical for repair of non-fatigue sensitive items, at the least. Due to the above noted analysis, further testing is indicated as quickly as possible, and the specimens are already in preparation. The work is recommended to continue as quickly as possible for implementation into Army materiel. Although this Task’s Screen Test Results were not entirely favorable, they are not without promise, and the variations noted above can explain much if not all of the differences noted. In the last iteration of fatigue tests performed at Wright Patterson AFB, the fatigue lives were even lower. Therefore, further optimization under the follow on ESTCP for this technology, with further testing and evaluation is mandated, as this technology can save the Government huge amounts of money by enabling repair of scrapped legacy items (at the least, non-fatigue-sensitive ones) no longer in manufacture that are reparable only by use of this ESD process.
36
ATTACHMENT I – Corrosion Resistance Test Results
37

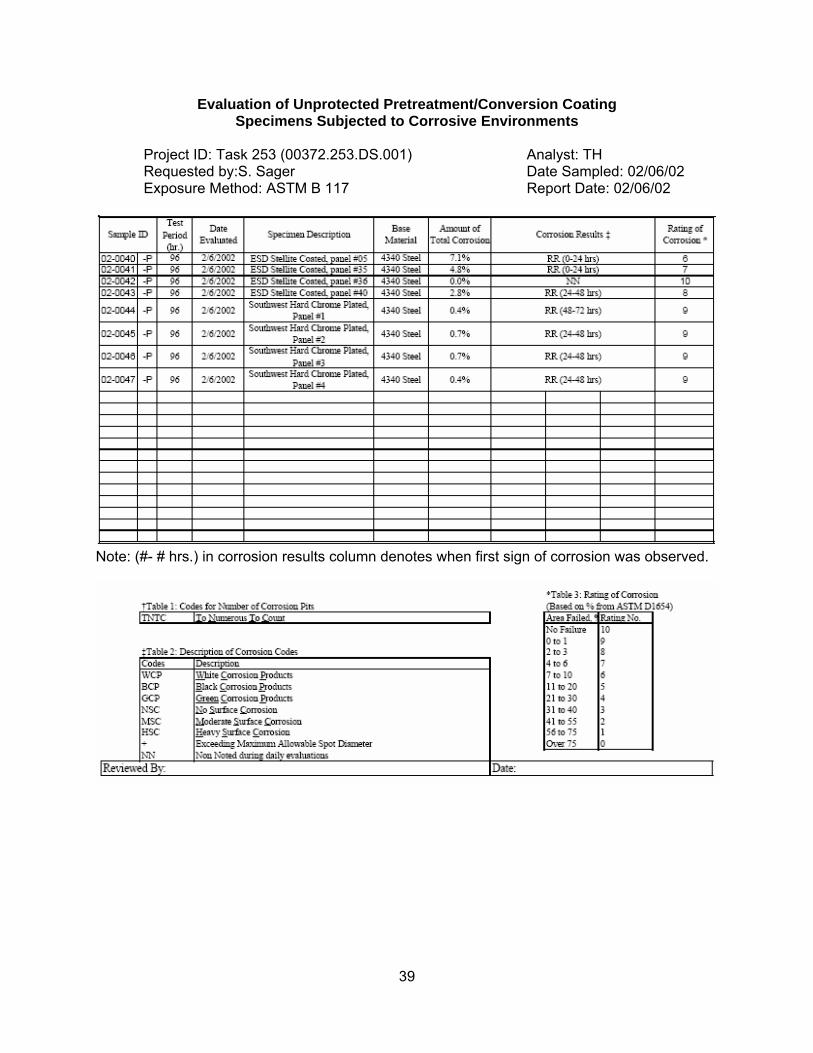
Evaluation of Unprotected Pretreatment/Conversion Coating Specimens Subjected to Corrosive Environments
Project ID: Task 253 (00372.253.DS.001) Analyst: TH Requested by:S. Sager Date Sampled: 02/06/02 Exposure Method: ASTM B 117 Report Date: 02/06/02
Note: (#- # hrs.) in corrosion results column denotes when first sign of corrosion was observed.
39


ATTACHMENT II - Wear Resistance Test Results
41

43
44

45
46

47
48
49
50
ATTACHMENT III - Fatigue Test Results
51

53


ATTACHMENT IV – Diagram of ESD Hardware
55

57

DISTRIBUTION LIST USA ARDEC ATTN: AMSRD-AAR-EMK (2) AMSRD-AAR-GC AMSRD-AAR-WET (5) Picatinny, NJ 07806-5000 Defense Technical Information Center (DTIC) ATTN: Accessions Division 8725 John J. Kingman Road, Ste 0944 Fort Belvoir, VA 22060-6218 Commander Soldier and Biological/Chemical Command ATTN: AMSSB-CII, Library Aberdeen Proving Ground, MD 21010-5423 Director U.S. Army Research Laboratory ATTN: AMSRL-CI-LP, Technical Library Bldg. 4600 Aberdeen Proving Ground, MD 21005-5066 Chief Benet Weapons Laboratory, AETC U.S. Army Research, Development and Engineering Command Armament Research, Development and Engineering Center ATTN: AMSRD-AAR-AEW Watervliet, NY 12189-5000 Director U.S. Army TRADOC Analysis Center-WSMR ATTN: ATRC-WSS-R White Sands Missile Range, NM 88002 Chemical Propulsion Information Agency ATTN: Accessions 10630 Little Patuxent Parkway, Suite 202 Columbia, MD 21044-3204 GIDEP Operations Center P.O. Box 8000 Corona, CA 91718-8000 Charles J Pellerin Weapon Systems & Platforms Program Manager SERDP & ESTCP Program Offices 901 North Stuart Street, Suite 303 Arlington, VA 22203-1853
59


![[Spark meetup] Spark Streaming Overview](https://img.pdfslide.us/doc/110x75/55a457161a28ab057e8b45fd/spark-meetup-spark-streaming-overview.jpg)