Embed Size (px)
Citation preview

17th ERES Conference,
Milan, Italy, June 2010
Electricity Use Trends in New Zealand Office Buildings,
1990-2008
John McDonagh, Property Group, Commerce Faculty,
Lincoln University, New Zealand.
Key Words: energy, electricity, efficiency, office, building, consumption, trends, survey, New
Zealand, sustainability, green buildings, renewable, Property Council, benchmark.
Abstract
The built environment has been assessed as accounting for 70% of electricity consumption in
the USA (Nicolay 2007) and globally the built environment accounts for 40% of energy
consumption (Kolokotsa et. al. 2009). While New Zealand generates most of its electricity
from renewable hydro electric sources, there are limited opportunities to expand such
generation. As a result, the NZ government has been promoting energy efficiency as a means
to reduce growth in electricity demand, with the focus to date on the residential sector.
Efficiency policies relating to office buildings have recently been proposed, but little prior
research has been carried out on this sector in NZ. This research identifies trends in office
building electricity consumption over the period 1990-2008 using data from the Property
Council of New Zealand annual survey of building operating expenses. This will help establish
a base line against which future energy efficiency initiatives can be assessed. Findings
include relatively stable electricity consumption rates over the study period but a surprising
decline in real electricity prices for this sector until 2002 followed by increases since.
Introduction
The built environment is responsible for a large percentage of global energy consumption.
This is both in terms of energy used in the operation of the building on a day to day basis
plus the energy embodied in the fabric of the building during construction, refurbishment
and eventual demolition.
Various estimates of the scale of this use of energy have been made. For example the built
environment has been assessed as accounting for 70% of electricity consumption in the USA
(Nicolay 2007), and globally the built environment accounts for 40% of energy consumption
(Kolokotsa et. al. 2009). Treloar et al (2001) found high rise office buildings have 60% more
embodied energy per square metre NLA than low rise buildings. However, these total
estimates vary considerably from sector to sector and from country to country and are also
influenced by how energy consumption is defined. Nevertheless it is self evident that

2
however measured, buildings are an important factor in global energy consumption and
therefore a likely significant contributor to climate change.
More importantly, it is generally possible to use a variety of different sources of energy to
provide the required services within a building and to readily monitor and control the extent
and pattern of energy consumption. The knowledge and technology already exists to take
advantage of the energy efficiency potential that greater control and monitoring offers. This
is not always the case in other sectors. In addition the scale and capital intensity of the
largest buildings in developed countries helps make the application of existing and still
emerging technologies (such as co-generation) economically viable, again in contrast with
other sectors.
Seeking energy efficiency from the built environment is not new and in most developed
countries there has been development of various building code regulations, as well as
efficiency programmes and other incentives, since the first oil shocks of the 1970’s. But the
focus on energy efficiency has been sporadic and at times it has been more about energy
source switching rather than energy saving. The recent concern over climate change has
forced a refocus on the energy consumption of buildings and this time the emphasis has
been on increased efficiency as most sources of energy generation contribute to global
warming to some extent.
New Zealand already has a “clean green” reputation, part of which is based on the fact that
the majority of our electricity supply (72% - NZ Energy Quarterly, Sep 2009, Ministry of
Economic Development) comes from renewable “green” hydroelectric sources. It is also a
small country with an economy focussed on agriculture and tourism. During the last twenty
years economic restructuring, developments in information technology and changing work
practices have seen the need for traditional CBD office space reduce in relative terms. These
factors in combination seem to have led to little pressure to consider the potential for
improvements in energy efficiency of office buildings.
However, there are limited opportunities to expand hydroelectric generation and, as a
result, the NZ government has recently been promoting energy efficiency as a means to
reduce growth in electricity demand. As in other countries, the focus to date has been on
the residential sector which consumes 36% of the countries electricity compared with 20.7%
for the whole commercial sector, which includes retail and tourist facilities as well as office
space (Ministry of Economic Development 2009). Efficiency policies relating to office
buildings have recently been proposed, but little prior research on actual electricity
consumption has been carried out on this sector in NZ.
Comparison with benchmarks from overseas is made more difficult by the less typical
economic base for a developed country and the scale and characteristics of our office
building stock. The research presented here attempts to establish trends in office building
energy consumption in New Zealand over the last twenty years as some form of base line
against which future energy efficiency initiatives can be measured.

3
Literature Review
The New Zealand Government is considering introducing compulsory disclosure of energy
use performance for office buildings. However, in order to establish an appropriate
benchmark and to determine if improvements in energy efficiency are taking place it is
important to consider current performance and past trends to establish a “business as usual
level of performance” against which improvements can be measured (Lee and Yik 2004, Haji-
Sapar and Lee (2005)).
There is still debate about the efficacy of compulsory minimum standards, vs. compulsory
disclosure, vs. voluntary standards vs. labelling (Lee and Yik 2004, Holmes and Hudson 2002,
Ghanbari Parsa and Akhavan Farshchi 1996). But whichever option or combination is
adopted, some indication of the starting point for improvement is necessary (Love and
Bullen 2009). This is not easy. Haji-Sapar and Lee (2005) state “The main challenges …. are in
collecting sufficient numbers of buildings to establish a statistically reliable database and to
encourage each country to develop their own national benchmark…..”. They also comment
“Benchmarking ….is the starting point of energy efficient design and management”.
This type of energy use benchmarking research has been carried by academics, other
research organisations and industry bodies in some locations for a long period of time. As a
result various energy use benchmarks are now well established in some countries, either on
a stand alone basis or as a component of more comprehensive measures of overall building
sustainability. But the methodologies, benchmark figures and observed energy use trends
are not necessarily transferable from one country to another because of the markedly
varying economic and legal structures that may apply, as well as differing energy sources,
price differences, climate variation and cultural and business practice variations.
The closest comparable country to New Zealand, especially in relation to culture, business
practice, legal structures, and building construction is Australia and so consideration of the
findings of research there provides some worthwhile insights.
Reed and Wilkinson (2005) conducted a wide ranging review of the literature on building
sustainability with a particular focus on office building energy use. They found there was a
wealth of information on technical aspects of energy conservation, but that incorporating
improvements into the existing building stock was a slow process – inhibited by institutional
barriers and research gaps. They also concluded statutory minimum standards then being
introduced in Australia would only have a minor effect. In summing up they said that energy
efficiency in office building was an important emerging research area but that it falls
between environmental studies and research into the built environment. Bridging the gap
between the technical side and the business side of energy efficiency improvement is an
important step on the way forward.
Subsequently, Wilkinson and Reed (2006) examined energy consumption and carbon
emissions of Melbourne office buildings in detail. They faced similar difficulties as were
found in this research in that some respondents were unwilling or unable to provide the
energy use data on their buildings to a depth ideal for carrying out the research. This was
especially the case if their building was likely to be identified as an energy “guzzler”. A partial

4
solution in both cases was via the Property Council of Australia (and Property Council of New
Zealand) who are trusted custodians of energy use data for many office building owners.
Other researchers are also active in this area in Australia and their findings provide good
insights to the New Zealand situation, but both the climate and the energy supply situation
in Australia is very different from New Zealand so it was important to search for previous
research into energy use in office buildings in New Zealand as a basis for this study.
Unfortunately this proved to be a rather fruitless task. A search of the usual academic
databases using the keywords of energy, electricity, survey and New Zealand only resulted in
three hits and of these only one proved to be relevant to this research. This was a Property
Council of New Zealand report from 2000 which reported the energy consumption of thirty
five CBD office buildings in Auckland and Wellington during 1998 and 1999. As will be seen in
the methodology section below this report provided important reference points for this
research. A similar unpublished study of 22 buildings in Christchurch was carried out by
Lincoln University staff and students in 1990.
The search was then widened to Google which resulted in the identification of a number of
official government reports which proved useful.
The Building Research Association of New Zealand (BRANZ) commissioned Bricknell Moss
Raines and Stevens Ltd. to carry out an analysis of 15 office building from 1983 -1986 to try
and develop a theoretical model for calculating energy use. Data on the buildings was
collected but very high levels of variability amongst the sample caused problems in
developing a model.
The Ministry of Economic Development carries out an annual survey of electricity supply,
demand and prices. The results are available via their web site and published in the New
Zealand Energy Data File. While a wealth of aggregate time series data is recorded it is not
broken down as far as electricity use is concerned beyond the categories “large commercial”,
“medium commercial” and “small commercial” (each of which would include a variety of
uses) or alternatively into various SIC codes of which office use would be best represented
by “ financial property, hiring, professional and administrative services” Unfortunately there
is no area recorded for these categories – only “connections” – but as can be seen in the
methodology section – the time series price data was useful in converting dollar expenditure
for surveyed buildings to KWh. .
In 2007 research was carried out by Kema on behalf of the Electricity Commission of New
Zealand into the potential for electricity efficiency gains in New Zealand. They found
significant cost effective potential for around 23% in savings via efficiency measures, but
these were concentrated in the residential sector. The commercial sector had the lowest
potential and within this the greatest contribution was from changes in lighting technology.
The Energy Efficiency and Conservation Authority (EECA) is a NZ government body
supporting initiatives aimed at improving energy efficiency. Thirty six research reports
related to this topic were found on their web site but none related to office building

5
electricity use trends. There were links to office building case studies, but as in much of the
other research identified, these generally represent exemplars rather than typical buildings.
There was one report that tracked energy use trends over the period 2001-2007 (EECA 2009)
but as in the case of the Ministry of Economic Development surveys, and the Electricity
Commission report mentioned above, this only considered the “commercial sector” as a
whole. Findings included a drop in total energy use over the seven years from 48.4 PJ to
47.4PJ (2.1%) even though there was rapid growth in floor areas, employment and economic
activity over the same period. Of this 4.7 PJ was attributed to energy efficiency
improvements. The commercial sector represented 9% of energy use while contributing 64%
of GDP in 2007.
During this research the author also became aware of another major study currently under
way and also supported by BRANZ entitled the Building Energy End-use Study (Build 2010).
This is not yet complete but is gathering energy use data directly from energy suppliers
(after obtaining customer consent) on a variety of non-residential buildings (including
offices). When complete, the anticipated results have the potential to refine the results of
the research presented in this paper, which are inevitably limited by the assumptions made
and the deficiencies in the historic Property Council data, which was collected from a diverse
range of respondents for an entirely different purpose.
Methodology
Data Source
The Property Council of New Zealand is a body that represents the owners of office buildings
and other substantial investment properties, such as shopping centres, throughout the
country.
Since the early 1990’s the Property Council has carried out an annual survey of office
building operating expenses in the major metropolitan areas of Auckland, Wellington, and
Christchurch, and more recently Hamilton. The survey includes both central business district
buildings and suburban office buildings where these are a significant component of the local
office market. The buildings in this annual survey represent the vast majority of the top
quality and large scale office buildings in New Zealand, and also a substantial proportion of
the remainder of the investment grade office market.
The Property Council of New Zealand kindly made available for this research the results of
this office operating expense survey in relation to energy consumption for the period since
1990. Unfortunately data for one year – 1999 was missing as the survey was not carried out
that year due to Property Council restructuring.
This data was received in spreadsheet format, and while this covered 418 individual
buildings, the figures were not continuous throughout the study period as some buildings
dropped in and out of the survey depending on changes in ownership and management.
However, for many properties a continuous sequence of energy related operating
expenditure was available for lengthy periods within the last 20 years.

6
The raw data items obtained for each building included a building identification code, the
city the property was located in, the location within the city, the year of the survey, the total
net lettable area that the operating expenses surveyed applied to, the percentage of the net
lettable area actually occupied in that year, the total electricity cost, additional explanatory
comments on electricity used, gas and oil costs, and additional explanatory comments on gas
and oil costs.
The quality of the building according to the Property Council of New Zealand grading system
was also recorded. This includes grades A, B, C and “other” grades as defined in Appendix A
but many buildings had initially not been assessed and were recorded as un-graded. This
problem reduced substantially over time and it is most likely that un-graded buildings
represent predominantly C and “other” lower graded buildings as owners tend to ensure the
grading of their building is recorded if they qualify for the higher categories.
The raw data was initially checked for obvious entry errors and also cross checked against
other sources of operating expense information to try and determine other clear errors that
could be corrected or alternatively should be deleted. In addition those properties for which
there was only a single year of energy cost figures were deleted from the analysis unless the
figures reported could be substantiated by reference to other sources.
From this amended data an initial figure of electricity cost per annum in dollars, per square
metre of net lettable area, for each building, for each year data was available, was
calculated.
This dollar per square metre figure was again scrutinised for any suspected entry errors or
other discrepancies. In some cases errors identified were able to be rectified and the
amended figures were included in the data base used for further analysis.
A problem with the Property Council survey data is that the figures recorded for energy
expenditure generally relate only to those services identified as “common area and central
services”. These generally include common area lighting, external and car park lighting,
elevator power and heating, ventilation and air-conditioning services delivered throughout
the building as a common service to all property occupiers. Under the net leases common in
New Zealand, these costs are then recovered along with other operating expenses (for
example cleaning, insurance and property taxes) from the tenants.
Electricity expenditure metered and charged separately to exclusively occupied tenant areas
is not usually included in the data collected by the Property Council. As will be detailed later,
an attempt was made to adjust the Property Council data to reflect total electricity
consumption (in kwh/m2) for the buildings in the survey.
Electricity Cost Trends
The next step in the analysis was to sort the electricity expenditure data for all buildings by
year of the survey and then calculate the mean electricity expenditure per square metre of
net lettable area of all the buildings in each survey year. The mean annual electricity
expenditure figures were then plotted on a graph.

7
The next analysis similarly considered each year of data but split the sample into office
building quality grades according to the Property Council categorisation. The mean annual
electricity expenditure per square metre was then calculated for each class of property in
each year and graphed.
Another step involved the same analysis process but this time the mean annual electricity
expenditure per square metre for office buildings was compared between each city in each
year of the survey.
Electricity Consumption Trends - Common Areas and Central Services
As already noted, the data collected by the Property Council over the last twenty years
primarily identified dollars of expenditure for electricity rather than kilowatt hours
consumed. To assess actual electricity consumption patterns (rather than expenditure) was
problematic because the Property Council did not generally have kilowatt hour consumption
figures for each building in the survey (though there were exceptions) and over the survey
period the price per kilowatt hour for electricity supplied to office buildings in New Zealand
has changed.
The kilowatt hour figures for some buildings in some years were recorded in the additional
explanatory comment part of the survey, so in those cases it was possible to additionally
calculate the kwh/m2 rate and the price paid per kwh for “common area and central
services” electricity.
In addition, in 1999 the Property Council carried out a separate more comprehensive
analysis of the energy consumption of 38 office buildings in Auckland and Wellington. In
these cases both kilowatt hour consumption and price per kilowatt hour consumed were
collected.
In combination these figures gave an indication of both electricity prices and kilowatt hours
per square metre applicable to typical office buildings at various points over the last 20
years.
However, these actual prices were not available for all years and locations and there are a
number of electricity suppliers in New Zealand with different pricing structures. In addition,
individual electricity suppliers also have different prices, often related to the scale of the
building supplied and the pattern of electricity consumption, e.g. substantial discounts
offered for limiting electricity use during times of peak demand.
It was therefore necessary to cross check the likely impact of these different prices on typical
electricity prices applicable to office buildings throughout the survey period.
As mentioned above, the electricity consumption figures and electricity prices paid for 38
individual office buildings were available via the in depth 1999 Property Council survey.
Additional figures applying to particular buildings were also identified via the annual
Property Council survey and from various other industry sources. These indicated office

8
building electricity consumption and prices typically fell in the “large commercial” category
of user as defined by the Electricity Commission.
Historic electricity prices for all electricity suppliers in New Zealand are publicly available
from the Electricity Commission and the Ministry of Economic development. Therefore, the
mean prices charged nationally for the “large commercial” category and by the major
suppliers in each of the cities surveyed was obtained for the period 1990 - 2008.
Another source of electricity pricing information was a publication of the Ministry of
Economic Development entitled “The New Zealand Energy Data File”. On page 131 of the
2008 edition it lists the national average price of electricity in cents per kilowatt hour and
dollars per gigajoule for the years from 1974 to 2008. The prices are separated in residential,
industrial and commercial categories.
The national average electricity price data for commercial uses above includes not only large
office buildings but commercial buildings of all types including small offices, CBD and
suburban retail buildings and shopping centres, hospitals, educational institutions etc. The
electricity prices in this series were therefore compared to those identified as applying
nationally to ‘large commercial’’ buildings as well as the prices charged by the major
suppliers in the large cities to this category.
Finally these average electricity prices were compared to the known actual prices applying to
particular office buildings. The objective was to try and identify which electricity price index
most accurately reflected actual office building electricity prices over the survey period. In
the end, all three indices were similar to actual building data and are included in the results.
It was then possible to divide the annual mean electricity expenditure per square metre
from the Property Council survey by the average price paid per kilowatt hour in that year, to
arrive at an estimate of electricity consumption (rather than energy expenditure) for
common area and central services over the last twenty years.
It is clearly a weakness of the analysis that a generic national average figure is used as a
proxy for actual price per kilo watt for the buildings in the sample but in the absence of
better historic information this was the best option available.
Electricity Consumption Trends – Whole Office Buildings
The final step in the analysis was a calculation to try and estimate electricity consumption
trends for whole office buildings. This involved a major assumption – that whole building
electricity consumption will reflect common area and central services consumption. This is
likely to be invalid in many cases, as the electricity consumption of both tenants and the
central services is highly dependent on their activities and equipment and this can vary
markedly from building to building and even within a building. However, the analysis was
still considered worth doing taking into account the moderating effect the large sample
would have and the need to at least provide a rough basis for future studies and
international comparison.

9
Both common area and central services and total electricity consumption were available for
23 buildings in the survey. The ratio of common area and central services to total electricity
consumption was calculated for all these buildings and ranged from 0.16 to 0.65. The
standard deviation was 0.12 and the mean 0.36 indicating an approximately normal
distribution. The common area and central services figures for all the buildings in the survey
were then divided by this figure and aggregated into years to arrive at an indication of total
building energy costs and usage trends over the last 20 years.
As reported in the literature review, there is currently underway a comprehensive research
project entitled the Building Energy End-use Study which is collecting data on actual building
energy use in New Zealand. This will provide more comprehensive and much needed energy
consumption data for NZ buildings. In addition it is recommended that future Property
Council surveys collect both energy cost and energy use data for all buildings in the survey,
not only for the common areas and central services but for the building as a whole as well.
This will help address the serious data deficiencies identified in trying to carry out this
research.
Results
Electricity Expenditure
The graph below shows the trend in annual average expenditure for electricity supplied to
the common area and central services of all the buildings in the Property Council operating
expense survey.
Mean Common Area & Central Services Electricity Expenditure -$/m2
National trend 1990-2008
0
1
2
3
4
5
6
7
8
9
10
1990 1991 1992 1993 1994 1995 1996 1997 1998 2000 2001 2002 2003 2004 2005 2006 2007 2008
$/m2
Year mean $/m2

10
There was an initial reduction from $7.66 /m2 in 1990 to $5.72 /m2 in 1994 but these results
should be treated with caution, as in the early years of the Property Council survey there
were relatively few buildings included in the survey and it is likely there was some variability
in the reporting of the data by respondents new to the process. Subsequently there was a
slow but steady increase in electricity expenditure over the next 14 years. The initial
expenditure level of $ 7.66 per square was not again reached until 2005.
The building data was then split to show average electricity expenditure in the four cities in
New Zealand with substantial office markets – Auckland, Wellington, Christchurch and
Hamilton. Buildings included in the survey for the three largest cities were insufficient in
number to allow meaningful analysis until 1993 and collection of data from Hamilton only
commenced in 1996.
The pattern of slow increases since1994 was mirrored in the three larger cities except for a
more substantial increase in Auckland from 2005 -2007. The figures for Hamilton were more
volatile, probably for the same data problems alluded to above in relation to other cities in
the earlier years of the survey.
Of note though was the similar trend, but significantly lower level of electricity expenditure
in Christchurch buildings. This ranged from below $4.00/m2 in the early years to
approximately $6.00/ m2 in 2008 – generally more than 25% below the other cities.
Mean Common Area & Central Services Electricity Expenditure - $/m2
City comparison
0
2
4
6
8
10
12
1993 1994 1995 1996 1997 1998 2000 2001 2002 2003 2004 2005 2006 2007 2008
$/m2
Auckland Wellington Hamilton Christchurch

11
The data was then split on a different basis to show average electricity expenditure in the
four different building quality categories as defined by the Property Council of New Zealand
(see Appendix A).
Again there were data problems, especially in relation to a large number of un-graded
buildings, but as discussed in the methodology section it is highly likely these would be in the
lower quality grades. The results of this analysis are shown below.
Again all quality categories generally exhibited slow growth in common area and central
services electricity expenditure. The A and B quality buildings had similar levels of
expenditure as did the C and un-graded categories – but somewhat lower as shown above.
The “other” category was lower again – the spike in the 2007 year explained by the very
small number of survey respondents now reporting their buildings as being in these lower
categories.
These results, in particular the shallow slopes of the graphs were somewhat surprising.
Electricity expenditure increases were lower than the general level of inflation over the same
time period and in contrast to the common perception that electricity prices were
increasing. The next step was therefore to examine changes in the price per kilowatt hour
for electricity since 1990.
Mean Common Area and Central Services Electricity Expenditure $/m2
Office Grade Comparison
0
2
4
6
8
10
12
14
1993 1994 1995 1996 1997 1998 2000 2001 2002 2003 2004 2005 2006 2007 2008
$/m2
Grade A Mean Grade B Mean Grade C Mean Other Grade Mean Ungraded Mean

12
Electricity Prices
The graph below shows the national average electricity prices for the period 1990 to 2009
according to figures published by the Ministry of Economic Development. Nominal
commercial electricity prices are shown in pink and real commercial prices are shown in
blue. Nominal domestic electricity prices are show in yellow and real domestic prices in
turquoise for comparison.
It can be seen there has been a radical change in the electricity pricing structure in New
Zealand over the survey period. This is most likely the result of the change from a centralised
and government regulated electricity market to a partially privatised and competitive
market. This commenced in the late 1980’s and continued throughout the 1990’s.
It has seen the nominal price of domestic electricity increase by 156.9% and the real price
increase by 73.55% over the study period. In contrast, the nominal commercial price has
only increased by 29.6% and in real terms has decreased by 23.6% over the same period. This outcome has probably been contributed to by efforts to reduce the need for new
generation capacity by offering substantial price discounts to users willing to manage their
electricity load profile. This has been relatively easy amongst the large users in the
commercial sector, but much more difficult in the domestic sector.
It also appears that the discounts offered to the commercial sector for load management
have reduced in recent years as energy management has improved and there is less off-peak
energy available.
National Electricity Prices
0.00
0.05
0.10
0.15
0.20
0.25
0.30
1990 1991 1992 1993 1994 1995 1996 1997 1998 1999 2000 2001 2002 2003 2004 2005 2006 2007 2008 2009
$/kwh
Commercial real Commercial nominal Residential nominal Residential real
13
The national average electricity price data for commercial uses discussed above includes not
only large office buildings but commercial buildings of all types including small offices, CBD
and suburban retail buildings and shopping centres, hospitals, educational institutions etc.
As outlined in the methodology section, an attempt was made to cross check electricity
prices from various indices against known actual prices applying to particular office
buildings. The objective was to try and identify the most suitable electricity price index via
which the electricity expenditure data collected by the Property Council could be converted
to electricity consumption in kilowatt hours per square metre.
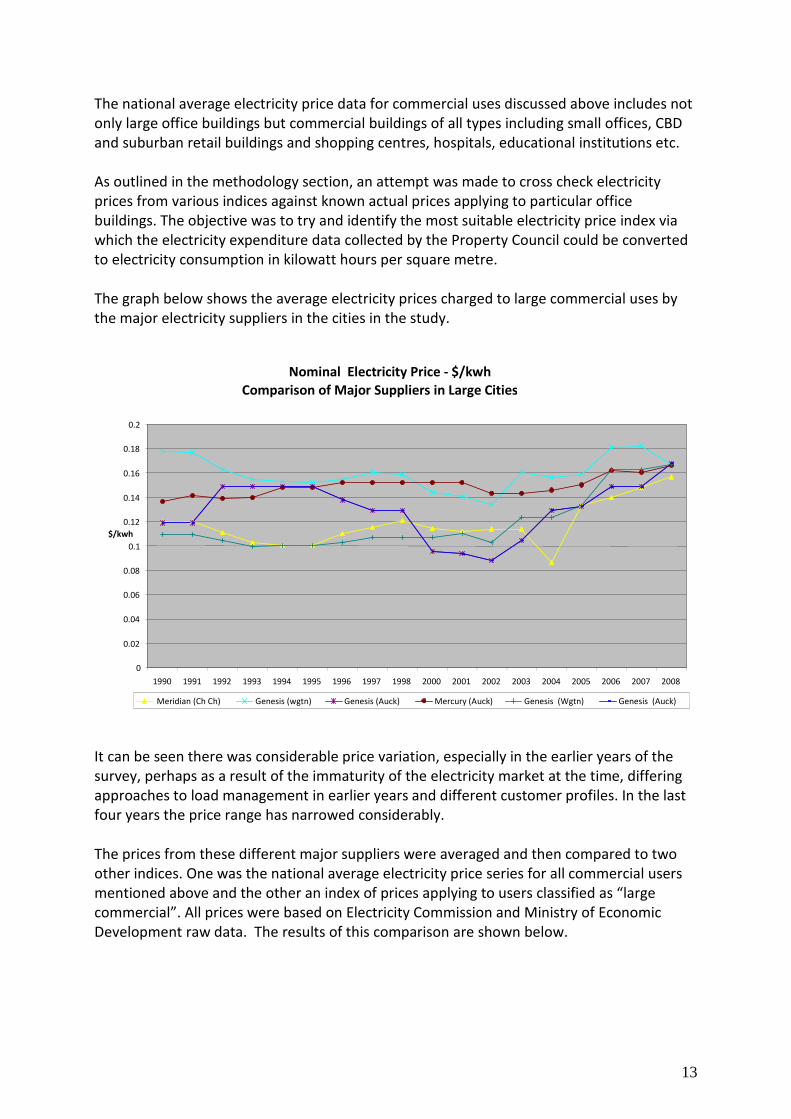
The graph below shows the average electricity prices charged to large commercial uses by
the major electricity suppliers in the cities in the study.
It can be seen there was considerable price variation, especially in the earlier years of the
survey, perhaps as a result of the immaturity of the electricity market at the time, differing
approaches to load management in earlier years and different customer profiles. In the last
four years the price range has narrowed considerably.
The prices from these different major suppliers were averaged and then compared to two
other indices. One was the national average electricity price series for all commercial users
mentioned above and the other an index of prices applying to users classified as “large
commercial”. All prices were based on Electricity Commission and Ministry of Economic
Development raw data. The results of this comparison are shown below.
Nominal Electricity Price - $/kwh
Comparison of Major Suppliers in Large Cities
0
0.02
0.04
0.06
0.08
0.1
0.12
0.14
0.16
0.18
0.2
1990 1991 1992 1993 1994 1995 1996 1997 1998 2000 2001 2002 2003 2004 2005 2006 2007 2008
$/kwh
Meridian (Ch Ch) Genesis (wgtn) Genesis (Auck) Mercury (Auck) Genesis (Wgtn) Genesis (Auck)

14
It can be seen the price trends are similar, but the national “All Commercial” figures are
generally lower – probably reflecting a larger range of building types and possibly lower cost
electricity suppliers being included in these national averages as compared to the main city
data represented above.
Electricity Consumption
A limited amount of electricity price information for individual office buildings was available
from the Property Council survey and other sources throughout the research period of 1990-
2008. This was cross checked against the three indices shown above and it was found actual
electricity prices paid were generally similar to the indices. Therefore, dividing the average
annual electricity expenditure for common area and core services for each year of the survey
by the average electricity prices applying to large commercial users in that year provided a
reasonable estimate of electricity consumption trends in kilowatt hours per square metre.
The results of this process for all three price indices are shown below.
Nominal Electricity Price - $/kwh Comparison of Electricity Price Indices
0
0.02
0.04
0.06
0.08
0.1
0.12
0.14
0.16
0.18
0.2
1990 1991 1992 1993 1994 1995 1996 1997 1998 2000 2001 2002 2003 2004 2005 2006 2007 2008
$/kwh
large commercial all commercial large commercial suppliers - major cities

15
It can be seen from the graph that electricity consumption for common area and core
services in office buildings appears to have remained relatively constant over the period
from 1990 to 2008. If anything there may have been a slight decline since around 2002.
However, to confirm this is actually the situation, improved detail and consistency in
electricity consumption data collection (rather than just expenditure) is needed.
The final step in this part of the research was to try and estimate trends in energy
consumption for entire office buildings, rather than just for the common area and central
services component.
With the limited historical data available this involved some major and potentially tenuous
assumptions regarding there being a fixed ratio between common area and central services
electricity consumption and that of the entire office building.
In many buildings this is likely to be highly variable due to, amongst other things, the varying
activities and equipment of the occupants, the nature of the electrical systems in the
building, the relative sizes of common areas and existence of atriums, the number of levels
and elevators, variations in operating expense apportionment due to metering
arrangements and lease terms etc.
Nevertheless, in light of the number of buildings in the survey and the consequent averaging
effect, it was considered worthwhile to calculate the figures – though of course they should
be treated with caution.
Electricity Consumption Common Area and Central Services - kwh/m2
Mean Expenditure Divided by Electricity Price Indices
0
10
20
30
40
50
60
70
80
1990 1991 1992 1993 1994 1995 1996 1997 1998 2000 2001 2002 2003 2004 2005 2006 2007 2008
kwh/m2
large commercial all commercial large commercial suppliers - major cities
16
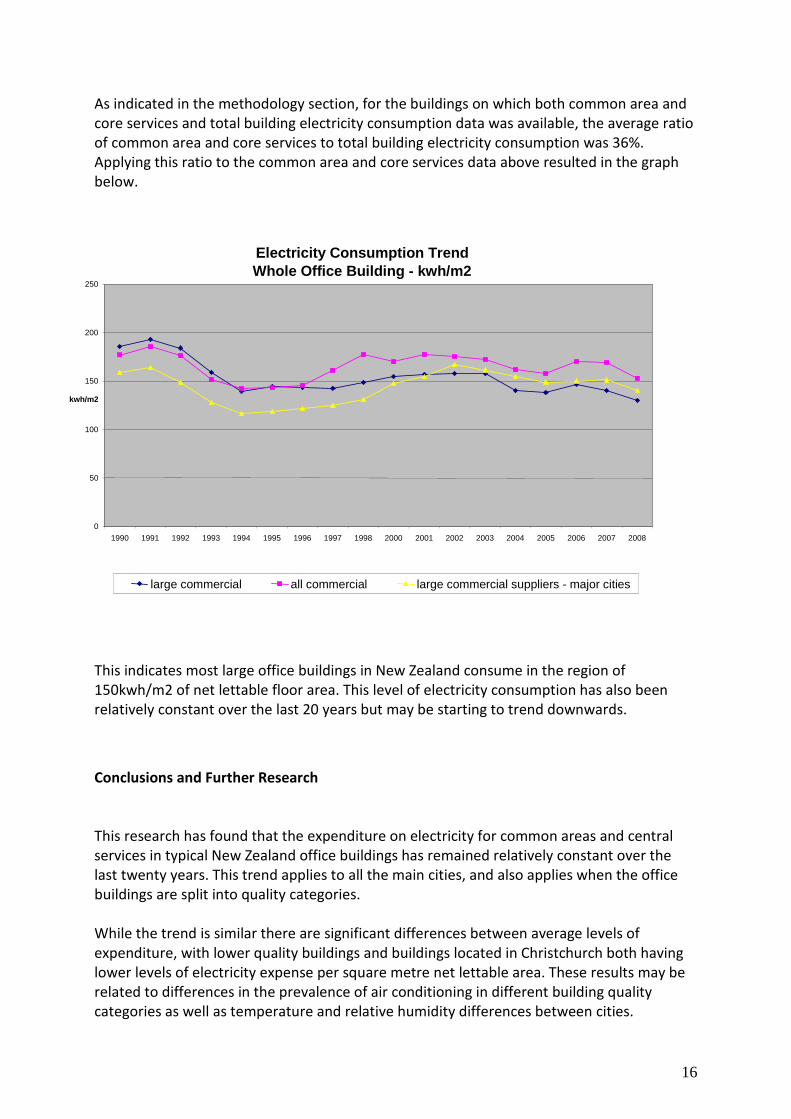
As indicated in the methodology section, for the buildings on which both common area and
core services and total building electricity consumption data was available, the average ratio
of common area and core services to total building electricity consumption was 36%.
Applying this ratio to the common area and core services data above resulted in the graph
below.
This indicates most large office buildings in New Zealand consume in the region of
150kwh/m2 of net lettable floor area. This level of electricity consumption has also been
relatively constant over the last 20 years but may be starting to trend downwards.
Conclusions and Further Research
This research has found that the expenditure on electricity for common areas and central
services in typical New Zealand office buildings has remained relatively constant over the
last twenty years. This trend applies to all the main cities, and also applies when the office
buildings are split into quality categories.
While the trend is similar there are significant differences between average levels of
expenditure, with lower quality buildings and buildings located in Christchurch both having
lower levels of electricity expense per square metre net lettable area. These results may be
related to differences in the prevalence of air conditioning in different building quality
categories as well as temperature and relative humidity differences between cities.
Electricity Consumption Trend Whole Office Building - kwh/m2
0
50
100
150
200
250
1990 1991 1992 1993 1994 1995 1996 1997 1998 2000 2001 2002 2003 2004 2005 2006 2007 2008
kwh/m2
large commercial all commercial large commercial suppliers - major cities
17
The trends identified above can at least be partially explained by the fact that the cost of
electricity supplied to large commercial premises in New Zealand has increased only slightly
in nominal terms and in fact decreased in real terms for most of the survey period. This
stable price period may be coming to an end, but future price increases may be offset by
improvements in energy efficiency.
This tends to be confirmed by the conversion of electricity expenditure into consumption in
kwh/m2. It was observed that in recent years when electricity price increases have been
more apparent, electricity usage in kwh/m2 has remained flat or declined slightly. More
research appears to currently be underway which may confirm this trend.
The conversion of common area and central services electricity consumption to whole
building consumption relied on limited data and a somewhat tenuous assumption. However,
it did indicate that average electricity consumption in New Zealand office buildings is in the
vicinity of 150kwh/m2 and has been at that level for sometime.
In some ways the most important finding of this research is the need to collect better data. It
was necessary to combine primary and secondary data and make major assumptions in
order to try and identify the trends reported. Further statistical analysis of this data is
anticipated over the coming months but the findings would be far more robust if accurate
electricity expenditure and electricity consumption in kwh had been collected for both
common areas and central services and the building as a whole for all the properties in the
survey.
Hopefully such detail will become a feature of future operating expense surveys, which
would result in more meaning being able to be extracted from the data.
References
Bricknell Moss Raines and Stevens Ltd. Energy Conservation in Commercial Buildings.
Research report R49 Building Research Association of New Zealand 1986.
Build Magazine, BEES Buzzing. pp. 70-71 February March 2010.
Energy Efficiency and Conservation Authority, Energy Efficiency and Renewable Energy in
New Zealand Year Six Report: March 2001 to 2007. Wellington, March 2009
Ghanbari Parsa AR, Akhavan Farshchi M. Environmental Regulations and the Real Estate
Industry, Property Management, 1996, Vol 14. No.1, pg.6.
Haji-Sapar M, Lee SE. Establishment of Energy Management Tools for Facilities Managers in
the Tropical Region. Facilities. Bradford: 2005. Vol. 23, Iss.9/10; pg.416.

18
Holmes J, Hudson G. The Application of BREEAM in Corporate Real Estate: A Case Study in
the Design and Marketing of a City Centre Office Development. Journal of Corporate Real
Estate. Bingley: Dec 2002. Vol. 5, Iss. 1; pg .66.
Kema. New Zealand Electric Energy-Efficiency Potential Study. Electricity Commission,
Wellington, New Zealand. September 2007.
Kolokotsa, D. Diakaki, C. Grigoroudis, E. Stavrakakis, G. Kalaitzakis, K. Decision Support
Methodologies on the Energy Efficiency and Energy Management in Buildings. Advances in
Building Energy Research. 2009 pp. 121-146.
Lee WL, Yik FWH. Regulatory and Voluntary Approaches for Enhancing Building Energy
Efficiency. Progress in Energy and Combustion Science. 2004. Issue 30pg. 477.
Lincoln University. A Study of Christchurch C.B.D. Office Expenses. Unpublished research
report 1990.
Love P, Bullen PA. Toward the Sustainable Adaptation of Existing Facilities. Facilities.
Bradford: 2009. Vol.27, Iss. 9/10; pg. 357.
Ministry of Economic Development. New Zealand Energy Quarterly, Wellington, September
2009.
Ministry of Economic Development New Zealand Energy Data File Wellington, 2009.
Nicolay, C. The Greening of Real Estate Appraisal: As Sustainable Building Gains Momentum
Through Standards, Legislation and Public Desire, the Appraisal Community Responds.
Valuation Insights & Perspectives, Vol. 12.2, Spring 2007.
Property Council of New Zealand. Office Building Energy Consumption Benchmarks. 2000.
Reed R.G. Wilkinson S.J. The Increasing Importance of Sustainability for Building Ownership.
Journal of Corporate Real Estate. Bingley: 2005. Vol.7 Iss. 4; pg.339.
Treloar GJ, Fay R, IIozor B, Love PED, An Analysis of the Embodied Energy of Office Buildings
by Height. Facilities. Bradford: May/June 2001. Vol.19, Iss. 5/6
Wilkinson S.J. Reed R.G. Office Building Characteristics and the Link with Carbon Emissions.
Structural Survey. Bradford: 2006 Vol.24 Iss 3 pj. 240.

19