Embed Size (px)
Citation preview
An Coimisiún um Rialáil Fóntas Commission for Regulation of Utilities
0
Information Paper
Reference: CRU/18/195 Date Published: 31/08/2018 Queries to: [email protected]
An Coimisiún um Rialáil Fóntas
Commission for Regulation of Utilities
Electricity Transmission Network
Allowed Revenues 2019
&
Demand Transmission Use of
System (D-TUoS) Tariffs 2018/2019
www.cru.ie
An Coimisiún um Rialáil Fóntas Commission for Regulation of Utilities
1
Public/Customer Impact Statement
The electricity transmission system, which is owned by ESB (Transmission Asset Owner or
TAO) and operated by EirGrid (Transmission System Operator or TSO), allows for the
transport of large volumes of electricity from generators to bulk supply points where the
electricity is then sent to homes and businesses through the distribution system (although
some large businesses connect directly to the transmission system). This paper sets out the
charges necessary to allow EirGrid and ESB Networks recover the costs of safely operating,
maintaining and developing the transmission system.
These charges are referred to as Transmission Use of System (TUoS) tariffs, and are
composed of Generator TUoS (G-TUoS) tariffs and Demand TUoS (D-TUoS) tariffs, which
are charged to generators and energy suppliers respectively. Currently TUoS tariffs make up
approximately 8%1 of an average residential customer’s electricity bill. However, suppliers
decide how to structure the tariffs they offer to consumers to recover their costs, including
other non-network related costs.
This Information paper only focuses on the D-TUoS tariffs charged to energy suppliers for the
costs of safely operating, maintaining and developing the transmission system by EirGrid and
ESB in Ireland. Suppliers may choose how to pass them on to their customers.
Electricity is carried at high voltage through the transmission system until it arrives to
substations where voltage is reduced. Then, electricity is delivered at lower voltages through
the distribution system to homes and businesses. Suppliers get charged the Distribution Use
of System (DUoS) tariffs2 for the cost of building, safely operating and maintaining the
electricity distribution system by ESBN in Ireland.
The new all-island Integrated Single Electricity Market (I-SEM) comes into operation on 1st
October 2018. This is the most significant change to the operation of the market since it was
launched in 2007. I-SEM will integrate the all-island market with the EU internal energy
market, increase competition, facilitate renewable electricity generation and deliver benefits
for all-island consumers.
I-SEM will change how generators and service providers earn revenues. They will compete
for capacity revenues from the capacity market and for system service revenues from the
TSO. This will also change some of the costs components in customers’ bills. Therefore, while
the combined transmission and distribution adjustments will result in upward cost pressure
for this year of €13.85 in a typical domestic bill, this will be offset by the reduced costs for
capacity payments.
1 The Distribution Use of System tariffs account for approximately 25% of the average residential electricity’s bill. 2 The Information paper on the Electricity Distribution Network Allowed Revenue for 2019, the Distribution Tariffs for 2018/2019 & Distribution Loss Adjustment Factors was published by the CRU on 3 August 2018 - CRU/18/146
An Coimisiún um Rialáil Fóntas Commission for Regulation of Utilities
2
Executive Summary
This information paper sets out the update to the Allowed Revenues that the transmission
network companies, EirGrid (TSO) and ESB Networks (TAO), may recover during the
calendar year 2019. These revenues are required for the efficient operation and maintenance
of the electricity transmission system to ensure that the network delivers a reliable supply for
the consumers.
Furthermore, the paper sets out the CRU’s decision on the associated Demand Transmission
Use of System (TUoS) tariffs that will apply to demand customers from 01 October 2018 to
30 September 2019.
The new all-island Integrated Single Electricity Market (I-SEM) comes into operation on 1st
October 2018. This is the most significant change to the operation of the market since it was
launched in 2007. I-SEM will integrate the all-island market with the EU internal energy
market, increase competition, facilitate renewable electricity generation and deliver benefits
for all-island consumers.
I-SEM will change how generators and service providers earn revenues. They will compete
for capacity revenues from the capacity market and for system service revenues from the
TSO. This will also change some of the costs components in customers’ bills. Therefore, while
the combined transmission and distribution adjustments will result in upward cost pressure
for this year of €13.85 in a typical domestic bill, this will be offset by the reduced costs for
capacity payments.
Context
Allowed revenues for the TSO and TAO are set every five years by the CRU following a
review of the companies. These allowed revenues are then updated3 each year and network
tariffs are set to allow for those revenues to be recovered. The current Price Review period
is “PR4”, and was set in in 2015 for the period 2016 to 20204. This five-year approach is
international best practice, and is widely used by regulators in Europe and around the world
in the industry as well as in a number of other regulated sectors.
This year sees a significant increase in D-TUoS this is largely due to a change in the market
arrangements which change where various costs are allocated and recovered. Therefore it is
necessary to consider the wider changes in the industry alongside this year’s D-TUoS. The
increases relate primarily to the cost of implementing the new wholesale market (I-SEM), the
introduction of new system services, and measures to improve security of supply in the Dublin
region. Collectively these initiatives will deliver lower energy costs, increased use of
renewable resources, and ensure secure energy supplies are maintained even as demand
increases rapidly.
3 Using the most up-to-date information, allowed revenues are reviewed annually to account for updated inputs as inflation rates, forecast demand and adjustment to outturn and forecast costs. 4 PR4: Decision on TSO and TAO Transmission Revenue for 2016 to 2020: (CER/15/296)
An Coimisiún um Rialáil Fóntas Commission for Regulation of Utilities
3
The new I-SEM wholesale market will be a more efficient electricity market that will improve
cross-border trade with the rest of Europe and will put downward pressure on electricity
prices. The implementation costs are forecast to be €96.6m and will be recovered over five
years by EirGrid and SONI (System Operator for Northern Ireland) on a 75:25 basis, resulting
in €17.88m in allowed revenues for the Irish TSO (EirGrid) this year. This is a necessary cost
to achieve the enduring consumer savings that will result from a more efficient wholesale
market.
On 1st May 2018 new the system services arrangements replaced the previous interim
arrangements. These new system services are paid to generators that provide valuable
services to the system, which helps to maintain the stability and security of the power system.
The resulting improved performance from generators will allow greater use of zero-marginal-
cost generation, such as wind, by reducing the amount of time wind farms must be curtailed,
or turned down, resulting in lower energy prices for consumers in addition to facilitating Ireland
meeting its 2020 renewable targets. System services costs have increased by €43.26m
against last year’s interim arrangements. It should also be noted that higher system services
payments reduce the cost of capacity payments and overall ensure a more efficient allocation
of revenues to the generators that are delivering the most value to users of the electricity
system.
The third factor in this year’s increase in D-TUoS is set of measures to improve security of
supply in the Dublin region. The Dublin region has seen demand growth in the last few years
and this growth is expected to increase significantly over the next number of years. The new
Capacity Remuneration Mechanism, which introduced the first capacity auction, was brought
in December 2017. This first capacity auction has significantly reduced the total cost of
capacity resulting in consumer savings of approximately €213m across the island. However,
this means that some inefficient high-cost generators will not receive capacity payments and
will exit the market. This is in the long-term interests of consumers, however, it creates some
transitional issues where the inefficient generation is in constrained areas such as Dublin and
so is required until new network infrastructure can be built or new more efficient generation
can be built. In addition significant demand increases in the Dublin region are expected to
continue. Therefore the CRU has included €58.65m in this year’s D-TUoS to cover the costs
of a suite of measures to improve the immediate and long-term security of supply of the Dublin
region. This includes provision for expected Local Reserve Services Agreements with a
diverse range of service providers, and provision for the possible introduction of locational
signals.
The new all-island Integrated Single Electricity Market (I-SEM) comes into operation on
October 1st 2018. This is the most significant change to the operation of the market since it
was launched in 2007. I-SEM will integrate the all-island market with the EU internal energy
market, increase competition, facilitate renewable electricity generation and deliver benefits
for all-island consumers.
I-SEM will change how generators and service providers earn revenues. They will compete
for capacity revenues from the capacity market and for system service revenues from the
TSO. This will also change some of the costs components in customers’ bills. Therefore, while
the combined transmission and distribution adjustments will result in upward cost pressure
An Coimisiún um Rialáil Fóntas Commission for Regulation of Utilities
4
for this year of €13.85 in a typical domestic bill5, this will be offset by the reduced costs for
capacity payments.
D-TUoS tariffs are charged to suppliers, who may choose how, or whether, to pass them on
to their customers.
Please note that the allowed transmission revenues are established on a calendar year basis
whereas the TUoS tariffs run from 01 October to 30 September. Therefore, the TUoS tariffs
are set for periods that span two separate calendar years (i.e. October 2018 to September
2019).
TSO and TAO allowed revenues for 2019
The CRU’s review and consideration of updated key inputs has resulted in an adjusted figure
of €557.86m (2019 monies). This is approximately 9.16% more than had been included in the
PR4 revenue model for calendar year 2019 and is in part related to the fact that forecast costs
were not available at the time of the PR4 decision. The CRU allowance for the network
companies for calendar year 2018 was €416.30m, which represents circa 34% less than this
year’s allowance.
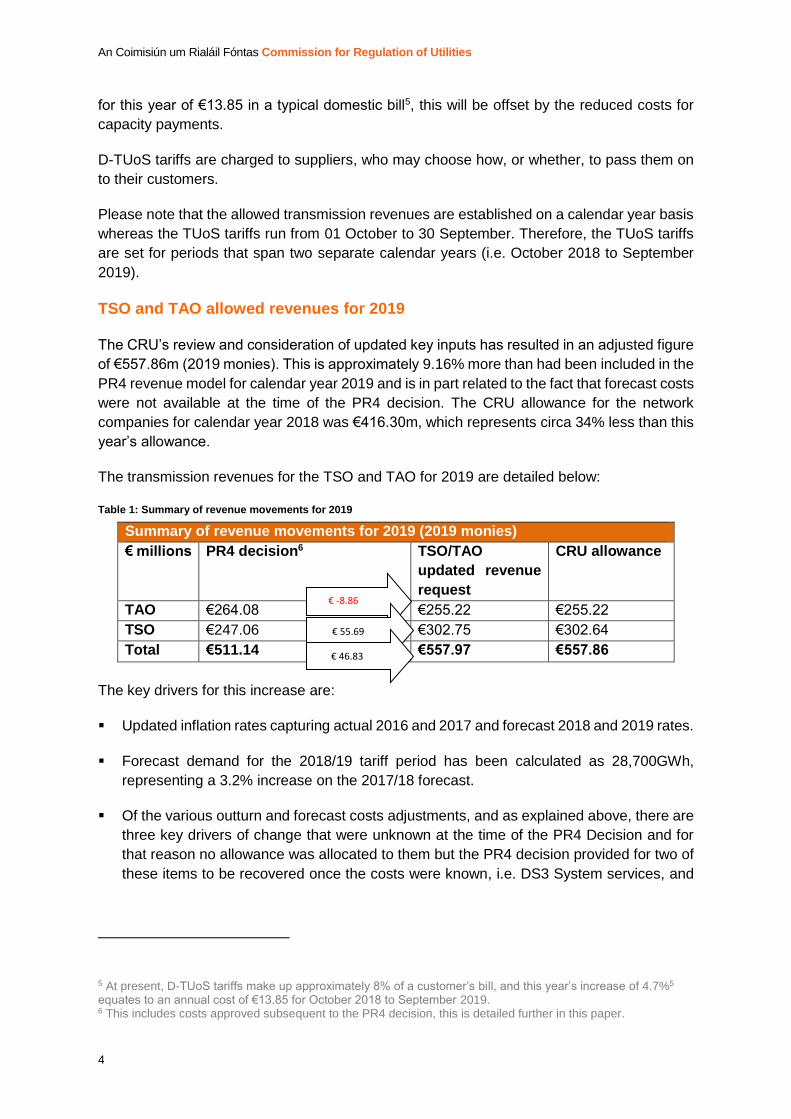
The transmission revenues for the TSO and TAO for 2019 are detailed below:
Table 1: Summary of revenue movements for 2019
Summary of revenue movements for 2019 (2019 monies)
€ millions PR4 decision6 TSO/TAO
updated revenue
request
CRU allowance
TAO €264.08 €255.22 €255.22
TSO €247.06 €302.75 €302.64
Total €511.14 €557.97 €557.86
The key drivers for this increase are:
Updated inflation rates capturing actual 2016 and 2017 and forecast 2018 and 2019 rates.
Forecast demand for the 2018/19 tariff period has been calculated as 28,700GWh,
representing a 3.2% increase on the 2017/18 forecast.
Of the various outturn and forecast costs adjustments, and as explained above, there are
three key drivers of change that were unknown at the time of the PR4 Decision and for
that reason no allowance was allocated to them but the PR4 decision provided for two of
these items to be recovered once the costs were known, i.e. DS3 System services, and
5 At present, D-TUoS tariffs make up approximately 8% of a customer’s bill, and this year’s increase of 4.7%5 equates to an annual cost of €13.85 for October 2018 to September 2019. 6 This includes costs approved subsequent to the PR4 decision, this is detailed further in this paper.
€ -8.86
€ 55.69
€ 46.83
An Coimisiún um Rialáil Fóntas Commission for Regulation of Utilities
5
the implementation of the new wholesale market (I-SEM). The third item is a suite of
measures to improve the immediate and long-term security of supply of the Dublin region.
Transmission AUP for 2018/2019 tariff period
The CRU’s Average Unit Price (AUP), measured in c/kWh, is calculated by dividing the total
allowed tariff year revenue, i.e. 2018/2019 by the forecast energy for the tariff year 2018/19.
The total allowed tariff year revenue 2018/19 is calculated by using the allowed revenues for
calendar years 2018 and 2019, both figures representing 26.26% and 73.74% respectively.
Based on the 2018/19 tariff year revenue figure of €520.68m and the forecast demand of
28,700GWh, the average unit price (AUP) for the period of 01 October 2018 to 30 September
2019 is estimated to be 1.81c/kWh. This 2018/19 AUP is 25.24% higher than currently.
Tariffs Impact Analysis
The new all-island Integrated Single Electricity Market (I-SEM) comes into operation on 1st
October 2018. This is the most significant change to the operation of the market since it was
launched in 2007. I-SEM will integrate the all-island market with the EU internal energy
market, increase competition, facilitate renewable electricity generation and deliver benefits
for all-island consumers.
I-SEM will change how generators and service providers earn revenues. They will compete
for capacity revenues from the capacity market and for system service revenues from the
TSO. This will also change some of the costs components in customers’ bills. Therefore, while
the combined transmission and distribution adjustments will result in upward cost pressure
for this year of €13.85 in a typical domestic bill7, this will be offset by the reduced costs for
capacity payments.
However, the actual outcome for customer prices depends, among other factors, on
international fuel and related generation costs, which are currently circa 50% of the overall
cost of electricity to customers.
7 Based on transmission tariff group DTS-D2 and distribution tariff group DG1, i.e. Urban Domestic: Standard Meter and MWH charge urban 24 hour/kWh - Definition/ Interpretation as per EirGrid's Statement of Charges 2017/2018.
An Coimisiún um Rialáil Fóntas Commission for Regulation of Utilities
6
Table of Contents
Public/Customer Impact Statement ....................................................................... 1
Executive Summary ................................................................................................. 2
Glossary of Abbreviations and Terms ................................................................... 8
1. Introduction .......................................................................................................... 9
1.1. Commission for Regulation of Utilities .......................................................................... 9
1.2. Background ................................................................................................................. 9
1.3. Legal background ......................................................................................................... 9
1.4. Purpose of this information paper .............................................................................. 10
1.5. Other Related Documents .......................................................................................... 10
1.6. Structure of Paper ..................................................................................................... 10
2. Annual Revenue Review Process .................................................................... 11
2.1. CRU’s Revenue Setting Process .................................................................................. 11
2.2. Determination of TUoS tariffs for each tariff period .................................................... 12
3. CRU’s Revenue Allowance for 2019 ................................................................. 13
3.1 Summary of TAO and TSO Revenue ................................................................................. 13
3.2 TAO Allowed Revenue for 2019 ....................................................................................... 14
3.2.1. TAO Revenue review formula ........................................................................................... 14
3.2.2 TAO 2017 k-factor .............................................................................................................. 15
3.2.3 Interest Provision for TAO 2017 k-factor ........................................................................... 17
3.2.3 TAO 2017 incentives outturn ............................................................................................. 17
3.2.4 TAO 2019 Forecast Adjustments ........................................................................................ 17
3.2.5 Summary of TAO Allowed Revenue for 2019 ..................................................................... 18
3.3 TSO Allowed Revenue for 2019 ........................................................................................ 19
3.3.1 TSO Revenue Control Formula ........................................................................................... 19
Elements of equation 2: .............................................................................................................. 19
3.3.2 TSO 2017 k-factor ............................................................................................................... 20
3.3.3 Interest Provision for TSO 2017 k-factor ............................................................................ 22
3.3.4 TSO 2017 incentives outturn .............................................................................................. 22
3.3.5 TSO 2019 forecast Adjustments ......................................................................................... 24
3.3.6 Summary of TSO Allowed Revenue for 2019 ..................................................................... 31
An Coimisiún um Rialáil Fóntas Commission for Regulation of Utilities
7
4. TUoS Tariffs for 2018/19 ................................................................................. 32
5. Summary of 2019 Review ............................................................................... 33
Appendix A ............................................................................................................. 34
Table of Tables
Table 1: Summary of revenue movements for 2019 ............................................................................. 4
Table 2: Overview of price review timeline......................................................................................... 11
Table 3: Summary of revenue movements ......................................................................................... 13
Table 4: Summary of adjustments to TAO 2017 allowed outturns and resulting k-factor ................. 16
Table 5: Summary of TAO allowed revenue for 2019 ......................................................................... 18
Table 7: Summary of adjustments to the TSO 2017 revenue and resulting k-factor .......................... 21
Table 8: Summary of 2016 incentive outturn allowed ........................................................................ 23
Table 9: Summary of TSO 2019 forecast adjustments ........................................................................ 25
Table 10: Summary of TSO Allowed Revenue for 2019....................................................................... 31
Table 11: D-TUoS tariffs 2018/19 ........................................................................................................ 35
An Coimisiún um Rialáil Fóntas Commission for Regulation of Utilities
8
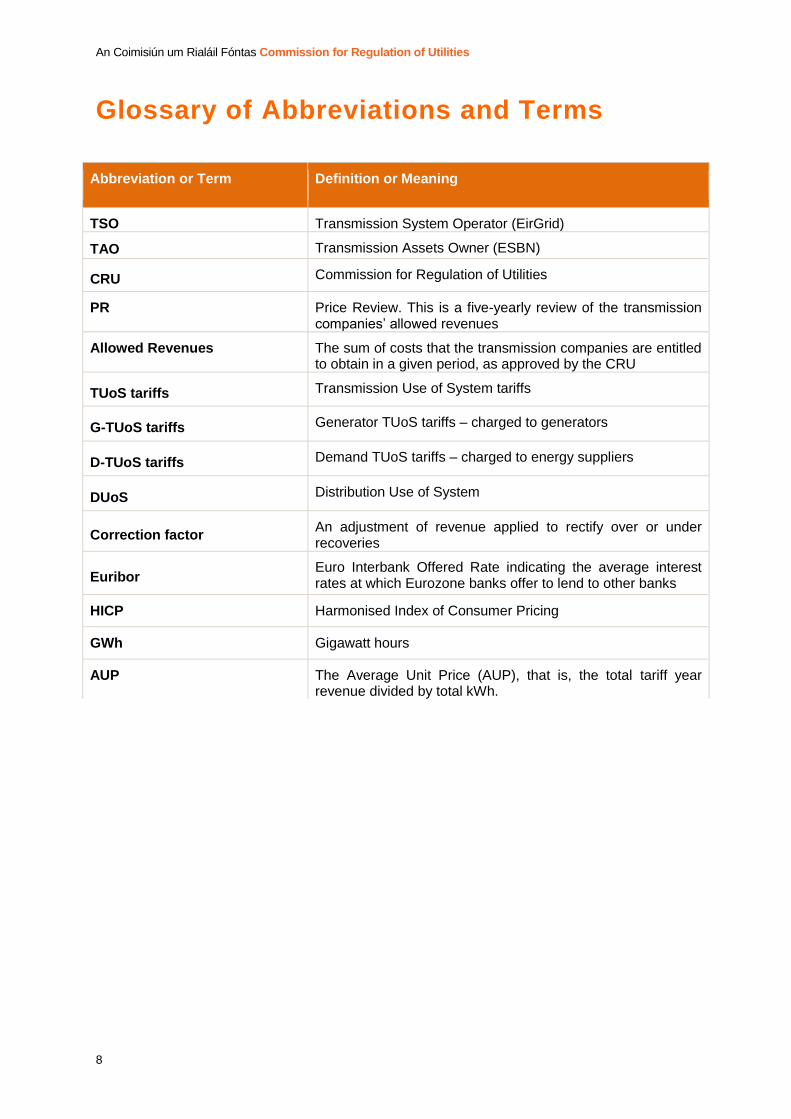
Glossary of Abbreviations and Terms
Abbreviation or Term Definition or Meaning
TSO Transmission System Operator (EirGrid)
TAO Transmission Assets Owner (ESBN)
CRU Commission for Regulation of Utilities
PR Price Review. This is a five-yearly review of the transmission companies’ allowed revenues
Allowed Revenues
The sum of costs that the transmission companies are entitled to obtain in a given period, as approved by the CRU
TUoS tariffs Transmission Use of System tariffs
G-TUoS tariffs Generator TUoS tariffs – charged to generators
D-TUoS tariffs Demand TUoS tariffs – charged to energy suppliers
DUoS Distribution Use of System
Correction factor An adjustment of revenue applied to rectify over or under recoveries
Euribor Euro Interbank Offered Rate indicating the average interest rates at which Eurozone banks offer to lend to other banks
HICP Harmonised Index of Consumer Pricing
GWh Gigawatt hours
AUP The Average Unit Price (AUP), that is, the total tariff year revenue divided by total kWh.
An Coimisiún um Rialáil Fóntas Commission for Regulation of Utilities
9
1. Introduction
1.1. Commission for Regulation of Utilities
The Commission for Regulation of Utilities (CRU) is Ireland’s independent energy and water
regulator. Our mission is to regulate water, energy and energy safety in the public interest.
Further information on the CRU’s role and relevant legislation can be found on the CRU’s
website at www.cru.ie.
1.2. Background
The CRU is responsible for the economic regulation of the system operators and asset owners
for the electricity transmission and distribution systems. Price Reviews, which limit the
revenues that the relevant licensees can recover from electricity consumers are set every five
years. The CRU’s five-year Price Review process is in line with international best practice.
In December 2015, the CRU published its Decision on the Price Review 4 (PR4) period for
ESB Networks (ESBN) as Transmission Asset Owner (TAO) and EirGrid as Transmission
System Operator (TSO). PR4 set annual revenues for each of the years for the period 2016-
2020 (both inclusive).
Annual revenues are reviewed and adjusted each year when setting Transmission Use of
System charges (TUoS or network tariffs) that are also reviewed and adjusted annually. The
annual revenue review includes adjustments to account for more up to date forecasts such as
latest level of demand. It also captures adjustments that relate to the outcome of the previous
years through so called k-factors. This paper details the adjustments made to the 2019 annual
revenue.
1.3. Legal background
Under the Electricity Regulation Act, 1999 (as amended), the CRU is the independent body
responsible for overseeing the regulation of Ireland's electricity sector. Section 35 of the
Electricity Regulation Act 1999 (“the Act”), provides the CRU the legal basis to approve
charges for the use of the electricity system in Ireland.
In accordance with Section 35 of the Act, the CRU’s electricity Price Review decision
(CER/15/296) outlines the revenue that the TSO/TAO can recover from TUoS customers
during a Price Review period. Consistent with Section 36 of the Act, the TSO’s Schedule of
charges, prepared in accordance with Section 35, must be submitted to the CRU for approval
and will not take effect until approved by the CRU. This approval takes place annually through
the annual revenue review. The outcome is published in the annual information note on TUoS
Tariffs.
An Coimisiún um Rialáil Fóntas Commission for Regulation of Utilities
10
1.4. Purpose of this information paper
This paper outlines the CRU’s decision in relation to the allowed revenues for 2019 of ESB
Networks as Transmission Asset Owner (TAO) and EirGrid as Transmission System Operator
(TSO). Furthermore, the paper sets out the CRU’s decision on the associated Demand
Transmission Use of System (D-TUoS) tariffs that will apply to demand customers from 01
October 2018 to 30 September 2019.
1.5. Other Related Documents
CER/17/276 Information Paper on 2018 TSO and TAO Revenue
CER/16/248 Information Paper on 2017 TSO and TAO Revenue
CER/15/216 Information Paper on 2016 TSO and TAO Revenue
CER/15/296 Decision on TSO and TAO transmission revenue for 2016 to 2020 (PR4)
CER/11/128 Decision on 2011/2012 Transmission Incentives
CER/18/087 Decision on Reporting and Incentives under Price Review 4
1.6. Structure of Paper
This Paper is divided into five sections:
Section 1 provides an introduction to the purpose of this Information note, the CRU tasks and
also include related documents.
Section 2 outlines CRU’s revenue setting process.
Section 3 details the TAO and TSO revenues for 2019. This section includes information on
the applicable revenue formula, the 2017 allowed outturn and the 2019 updated forecast.
Section 4 details the D-TUoS tariffs approved for implementation from 01 October 2018 to 30
September 2019.
Section 5 provides a summary of the CRU’s decision regarding transmission network
revenues.
An Coimisiún um Rialáil Fóntas Commission for Regulation of Utilities
11
2. Annual Revenue Review Process
In this section the revenue review process is described, which includes how adjustments are
made to calendar year revenues and how calendar year revenues translate into TUoS tariffs.
2.1. CRU’s Revenue Setting Process
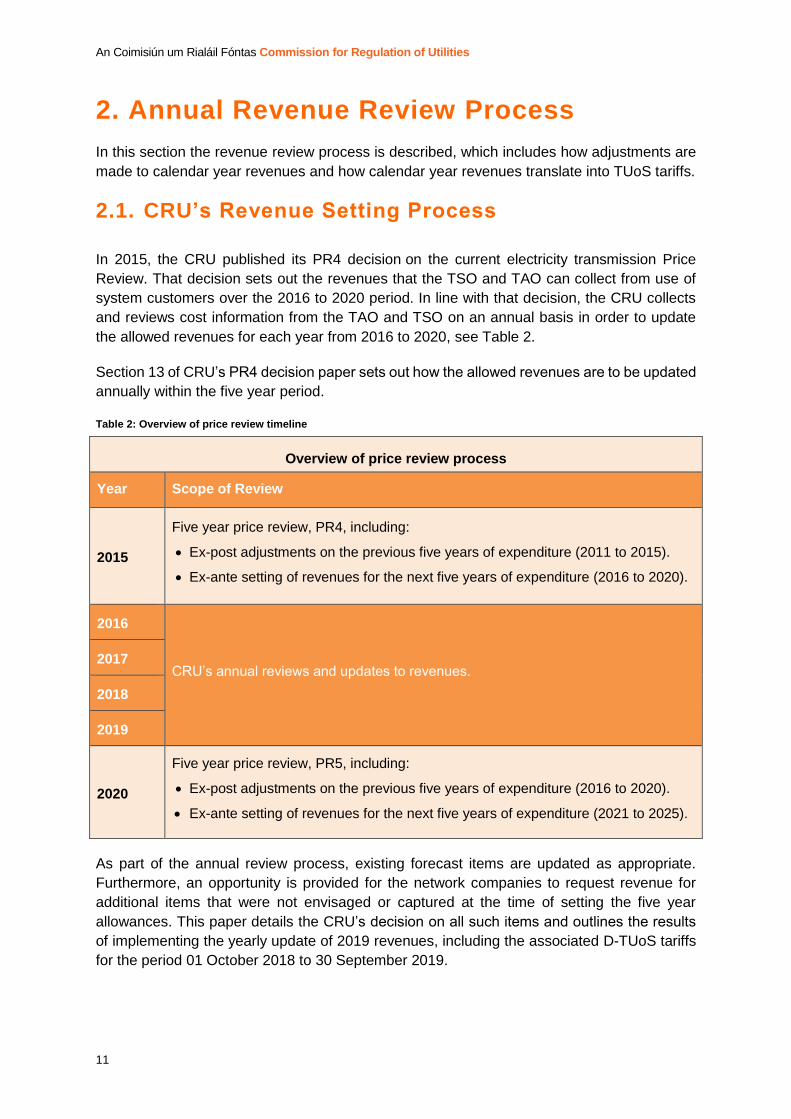
In 2015, the CRU published its PR4 decision on the current electricity transmission Price
Review. That decision sets out the revenues that the TSO and TAO can collect from use of
system customers over the 2016 to 2020 period. In line with that decision, the CRU collects
and reviews cost information from the TAO and TSO on an annual basis in order to update
the allowed revenues for each year from 2016 to 2020, see Table 2.
Section 13 of CRU’s PR4 decision paper sets out how the allowed revenues are to be updated
annually within the five year period.
Table 2: Overview of price review timeline
Overview of price review process
Year Scope of Review
2015
Five year price review, PR4, including:
Ex-post adjustments on the previous five years of expenditure (2011 to 2015).
Ex-ante setting of revenues for the next five years of expenditure (2016 to 2020).
2016
CRU’s annual reviews and updates to revenues. 2017
2018
2019
2020
Five year price review, PR5, including:
Ex-post adjustments on the previous five years of expenditure (2016 to 2020).
Ex-ante setting of revenues for the next five years of expenditure (2021 to 2025).
As part of the annual review process, existing forecast items are updated as appropriate.
Furthermore, an opportunity is provided for the network companies to request revenue for
additional items that were not envisaged or captured at the time of setting the five year
allowances. This paper details the CRU’s decision on all such items and outlines the results
of implementing the yearly update of 2019 revenues, including the associated D-TUoS tariffs
for the period 01 October 2018 to 30 September 2019.
An Coimisiún um Rialáil Fóntas Commission for Regulation of Utilities
12
2.2. Determination of TUoS tariffs for each tariff period
The TUoS tariffs are composed by the Generator Transmission Use of System (G-TUoS)
tariffs and Demand Transmission Use of System (D-TUoS) tariffs, passed on to generators
and energy suppliers respectively. At present, TUoS tariffs make up approximately 8% of a
residential customer’s bill8.
The CRU approves TUoS tariffs on an annual basis to cover the period from 01 October to 30
September. TUoS tariffs are set to recover 26.26%9 of the revenues associated with the first
calendar year included in the tariff period and 73.74% for the second calendar year, as the
revenues are set on a calendar year basis whereas the network charges are set on a tariff
year basis (October to September).
This information paper focuses on the D-TUoS tariffs established for the tariff period from 01
October 2018 to 30 September 2019, and represent 26.26% of 2018 revenue and 73.74% of
2019 revenue.
8 The Distribution Use of System tariffs account for approximately 25% of the average residential electricity’s bill. 9 This is based on the percentage of demand that relates to the relevant period of the year.
An Coimisiún um Rialáil Fóntas Commission for Regulation of Utilities
13
3. CRU’s Revenue Allowance for 2019
This section provides a summary of the TAO and TSO revenues which were allowed in the
PR4 determination, the network companies’ updated request and the CRU’s decision on final
allowances. Following that summary, section 3.2 and 3.3 go into further detail on the costs
associated with the respective network companies’ requests.
3.1 Summary of TAO and TSO Revenue
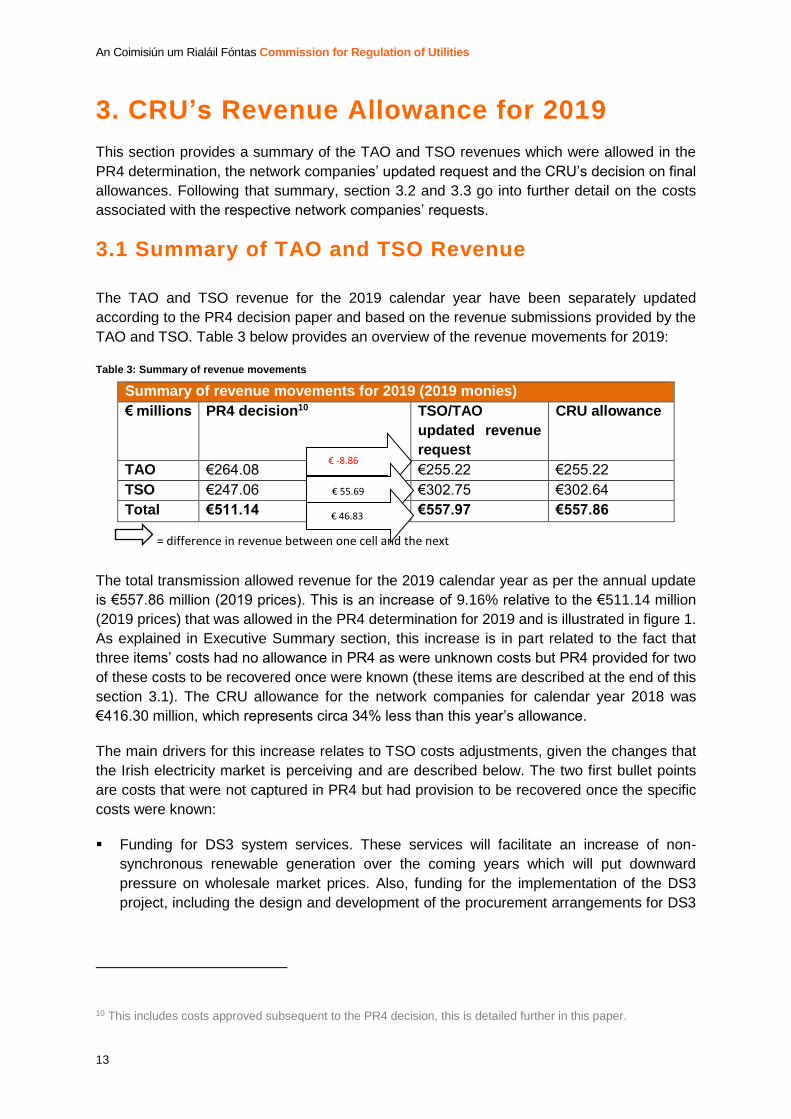
The TAO and TSO revenue for the 2019 calendar year have been separately updated
according to the PR4 decision paper and based on the revenue submissions provided by the
TAO and TSO. Table 3 below provides an overview of the revenue movements for 2019:
Table 3: Summary of revenue movements
Summary of revenue movements for 2019 (2019 monies)
€ millions PR4 decision10 TSO/TAO
updated revenue
request
CRU allowance
TAO €264.08 €255.22 €255.22
TSO €247.06 €302.75 €302.64
Total €511.14 €557.97 €557.86
The total transmission allowed revenue for the 2019 calendar year as per the annual update
is €557.86 million (2019 prices). This is an increase of 9.16% relative to the €511.14 million
(2019 prices) that was allowed in the PR4 determination for 2019 and is illustrated in figure 1.
As explained in Executive Summary section, this increase is in part related to the fact that
three items’ costs had no allowance in PR4 as were unknown costs but PR4 provided for two
of these costs to be recovered once were known (these items are described at the end of this
section 3.1). The CRU allowance for the network companies for calendar year 2018 was
€416.30 million, which represents circa 34% less than this year’s allowance.
The main drivers for this increase relates to TSO costs adjustments, given the changes that
the Irish electricity market is perceiving and are described below. The two first bullet points
are costs that were not captured in PR4 but had provision to be recovered once the specific
costs were known:
Funding for DS3 system services. These services will facilitate an increase of non-
synchronous renewable generation over the coming years which will put downward
pressure on wholesale market prices. Also, funding for the implementation of the DS3
project, including the design and development of the procurement arrangements for DS3
10 This includes costs approved subsequent to the PR4 decision, this is detailed further in this paper.
= difference in revenue between one cell and the next
€ -8.86
€ 55.69
€ 46.83
An Coimisiún um Rialáil Fóntas Commission for Regulation of Utilities
14
System Services and the development of systems to ensure delivery and settlement for
those services.
Funding for the Integrated Single Electricity Market (I-SEM) Implementation Project. The
new I-SEM wholesale market will be a more efficient electricity market that will improve
cross-border trade with the rest of Europe and will put downward pressure on electricity
prices. The first Capacity Remuneration Mechanism auction, part of the implementation
of I-SEM, has been run, generating an amount of €213m savings to Irish and Northern
Irish customers. This will have the effect of reducing the market capacity charge that is
paid by suppliers.
Funding for a set of measures to improve security of supply in the Dublin region, further
detail on these measures will be published in due course.
These key drivers of increase are explained in detail throughout this paper.
3.2 TAO Allowed Revenue for 2019
For the TAO, in 2019 prices, PR4 had provided for €264.08 million for the year 2019. The
updated 2019 figure following the CRU’s annual review process is €255.22 million, which is
approximately 3.35% less than the PR4 allowance and 7.97% more than the 2018
allowance11.
3.2.1. TAO Revenue review formula
The revenue review formula, which is used to keep the TAO’s revenue in line with allowed
costs, is set out in detail in Section 13 of CER/15/296 (PR4) and presented as Equation 1
below. As part of the annual update to revenues, and to take account of the TAO incentive
outturn in year t-2 (in this case the year 2017) that formula has been slightly modified as per
Equation 2. Equation 2 takes the ‘base’ allowed TAO revenue (in 2014 prices), inflates that
revenue into 2019 prices, and adjusts it for specific revenue parameters.
𝑅𝑡 = ∏ 𝑡
2014
[1 + 𝐼𝑛𝑓𝑡 − 𝑋
100] ∗ 𝐵𝑡 + 𝐼𝑁𝐶𝐸𝑁𝑇𝑡 + 𝐾𝐼𝑁𝐶𝐸𝑁𝑇𝑡−1 ∆𝑃𝑡 + ∆𝑈𝑡 + 𝐾𝑡−1 + 𝐾𝑡−2
Equation 1: Price review formula from CER/15/296 (PR4)
𝑅𝑡 = ∏ 𝑡 [1 + 𝐼𝑛𝑓𝑡 − 𝑋
100] ∗ 𝐵𝑡 + 𝐼𝑁𝐶𝐸𝑁𝑇𝑡−2 + ∆𝑃𝑡 + ∆𝑈𝑡 + 𝐾𝑡−2
Equation 1: Price review formula from CER/15/296 (PR4) - annual update to revenues
The terms within Equation 2 are fully explained within CER/15/296 (PR4), apart from,
𝐼𝑁𝐶𝐸𝑁𝑇𝑡−2, which is defined below along with all the elements of equation 2.
11 The 2019 PR4 allowance and the updated 2018 allowance were inflated to 2019 prices for comparative purposes. These figures are €264.08 and €236.39 respectively.
An Coimisiún um Rialáil Fóntas Commission for Regulation of Utilities
15
Elements of equation 2:
Rt, the maximum level of TAO revenue allowed in 2019, is €255.22 million (2019
prices);
Inft, when inflating from 2014 to 2019 values, the relevant figures are inflated based
on actual Irish HICP12 rates of -0.03% in 2015, -0.21% in 2016, and 0.26% in 2017 and
forecast Irish HICP rates of 0.80% in 2018 and 0.90% in 2019;
X, the efficiency factor, is set at zero;
Bt, the level of allowed revenue for the 2019 calendar year in 2014 prices as per the
determination paper CER/15/296 (PR4), is €259.6 million;
INCENTt-2, is the value of incentives in year t-2 (in this case 2017) in € millions in
respect of the penalties or payments. Further details in Section 3.2.3. This feeds into
the Kt-2 figure below;
Pt, the change in TAO external costs (e.g. Local Authority Rates) for 2019 from those
assumed in the determination paper CER/15/296 (PR4), there is no change to the
forecast, therefore this is set to zero;
Ut, the change in TAO uncertain costs for 2019 from those assumed in the
determination paper CER/15/296 (PR4), there is no change to the forecast, therefore
this is also set to zero; and
Kt-2, this is the correction factor (k-factor), which ensures that revenues for 2019 are
adjusted to capture the 2017 allowed outturn. This is minus €8.77 million (2014 prices,
pre-interest). Note that this is a net k-factor figure which includes any incentive
adjustment outlined above.
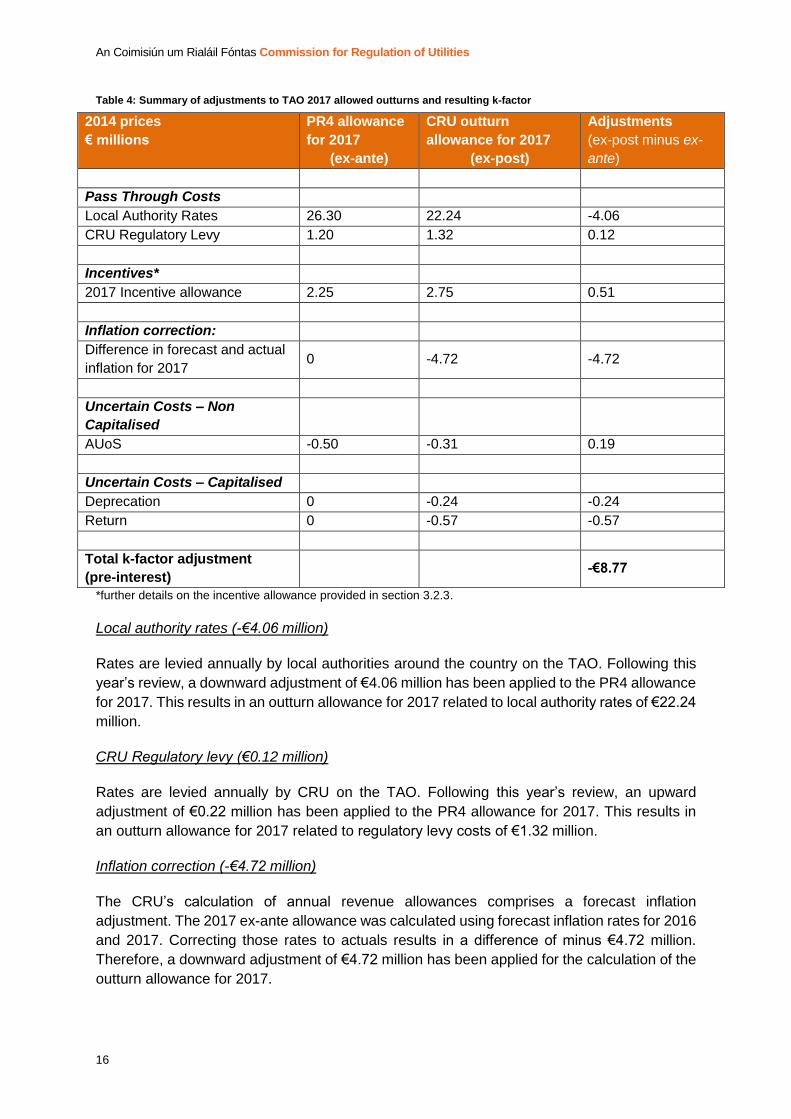
3.2.2 TAO 2017 k-factor
This section outlines the difference between the PR4 allowance for 2017 (determined in 2015)
and the allowed outturn of 2017 (as determined in this paper). The difference between these
figures is known as the 2017 ‘k-factor’. That k-factor feeds into the updated 2019 TAO revenue
allowance.
The k-factor for the TAO in 2017 is minus €8.77 million (2014 prices, pre-interest). Overall the
TAO under spent which will be accounted for by applying an equal downward adjustment to
the TAO’s 2019 revenue allowance. The individual k-factor adjustments are shown in table 4
and explained below the table:
12 Inflation rates for actuals are taken from the Central Statistics Office and for forecasts are taken from the Central Bank Quarterly Reports.
An Coimisiún um Rialáil Fóntas Commission for Regulation of Utilities
16
Table 4: Summary of adjustments to TAO 2017 allowed outturns and resulting k-factor
2014 prices
€ millions
PR4 allowance
for 2017
(ex-ante)
CRU outturn
allowance for 2017
(ex-post)
Adjustments
(ex-post minus ex-
ante)
Pass Through Costs
Local Authority Rates 26.30 22.24 -4.06
CRU Regulatory Levy 1.20 1.32 0.12
Incentives*
2017 Incentive allowance 2.25 2.75 0.51
Inflation correction:
Difference in forecast and actual
inflation for 2017 0 -4.72 -4.72
Uncertain Costs – Non
Capitalised
AUoS -0.50 -0.31 0.19
Uncertain Costs – Capitalised
Deprecation 0 -0.24 -0.24
Return 0 -0.57 -0.57
Total k-factor adjustment
(pre-interest) -€8.77
*further details on the incentive allowance provided in section 3.2.3.
Local authority rates (-€4.06 million)
Rates are levied annually by local authorities around the country on the TAO. Following this
year’s review, a downward adjustment of €4.06 million has been applied to the PR4 allowance
for 2017. This results in an outturn allowance for 2017 related to local authority rates of €22.24
million.
CRU Regulatory levy (€0.12 million)
Rates are levied annually by CRU on the TAO. Following this year’s review, an upward
adjustment of €0.22 million has been applied to the PR4 allowance for 2017. This results in
an outturn allowance for 2017 related to regulatory levy costs of €1.32 million.
Inflation correction (-€4.72 million)
The CRU’s calculation of annual revenue allowances comprises a forecast inflation
adjustment. The 2017 ex-ante allowance was calculated using forecast inflation rates for 2016
and 2017. Correcting those rates to actuals results in a difference of minus €4.72 million.
Therefore, a downward adjustment of €4.72 million has been applied for the calculation of the
outturn allowance for 2017.
An Coimisiún um Rialáil Fóntas Commission for Regulation of Utilities
17
Additional Use of System (AUoS) (€0.19 million)
The Additional Use of System relates to use of the transmission system for purposes other
than the transmission of electricity, such as telecoms. In 2017, in line with the agreed
methodology, ESB Telecoms Ltd paid €317k of AUoS to consumers through the TAO revenue
for 2017.
An increase of €0.19 million has been considered for the calculation of the k-factor to correct
for the difference between the forecast PR4 revenue allowance for 2017 for costs attributable
to the AUoS and the actual allowed 2017 outturn.
3.2.3 Interest Provision for TAO 2017 k-factor
Once the k-factor is calculated, an interest adjustment is applied.
As stated in CER/15/296 (PR4), the mechanism for inter-year adjustments for under or over-
recovery is to apply interest at the three month average Euribor rate. The interest rate (I) that
is applied to under and over-recoveries/ k-factors for transmission revenue for year t-2 is as
follows:
It2 is the mean of the twelve monthly average three month Euribor rate between April and
March of the year t-2 (i.e. April of year t-3 to March year t-2) multiplied by the mean of the
twelve monthly average three month Euribor rate between April and March of the year t-1
(i.e. April of year t-2 to March year t-1).
Applying an interest rate of minus 0.3% in 2017 and minus 0.3% in 2018 to the TAO 2017 k-
factor of minus €8.77 million, results in a net TAO k-factor of minus €8.71 million (2014 prices).
The TAO k-factor in 2019 prices is minus €8.86 million.
3.2.3 TAO 2017 incentives outturn
TAO incentives are made up of scheduled outages incentives; construction and energisation
incentives; and transmission delivery incentives for project milestones.
Based on the TAO’s performance in 2017 on meeting the agreed TAO scheduled outages
programme, delivering the required electricity transmission infrastructure within time and
within budget and on issuing project implementation plans to the TSO, the CRU has allowed
an amount of €2.75 million (2014 monies) to feed into the TAO k-factor.
3.2.4 TAO 2019 Forecast Adjustments
There are no changes being made to the forecast expenditure for 2019.
An Coimisiún um Rialáil Fóntas Commission for Regulation of Utilities
18
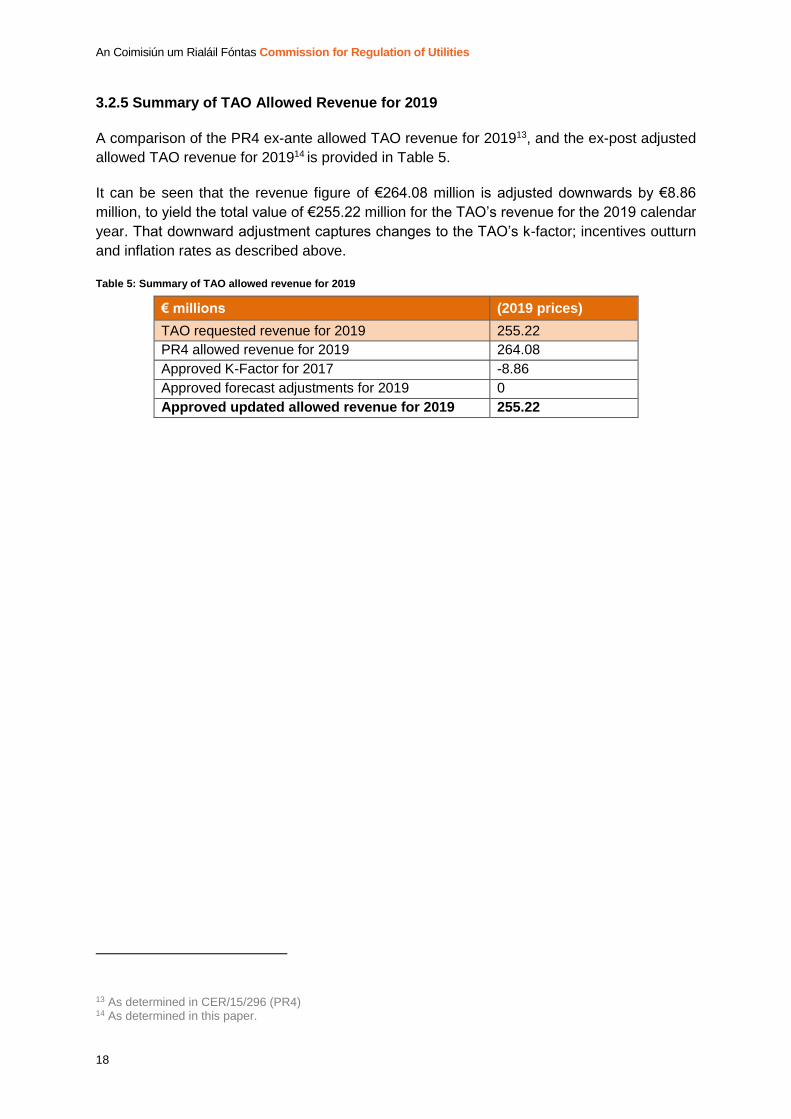
3.2.5 Summary of TAO Allowed Revenue for 2019
A comparison of the PR4 ex-ante allowed TAO revenue for 201913, and the ex-post adjusted
allowed TAO revenue for 201914 is provided in Table 5.
It can be seen that the revenue figure of €264.08 million is adjusted downwards by €8.86
million, to yield the total value of €255.22 million for the TAO’s revenue for the 2019 calendar
year. That downward adjustment captures changes to the TAO’s k-factor; incentives outturn
and inflation rates as described above.
Table 5: Summary of TAO allowed revenue for 2019
€ millions (2019 prices)
TAO requested revenue for 2019 255.22
PR4 allowed revenue for 2019 264.08
Approved K-Factor for 2017 -8.86
Approved forecast adjustments for 2019 0
Approved updated allowed revenue for 2019 255.22
13 As determined in CER/15/296 (PR4) 14 As determined in this paper.
An Coimisiún um Rialáil Fóntas Commission for Regulation of Utilities
19
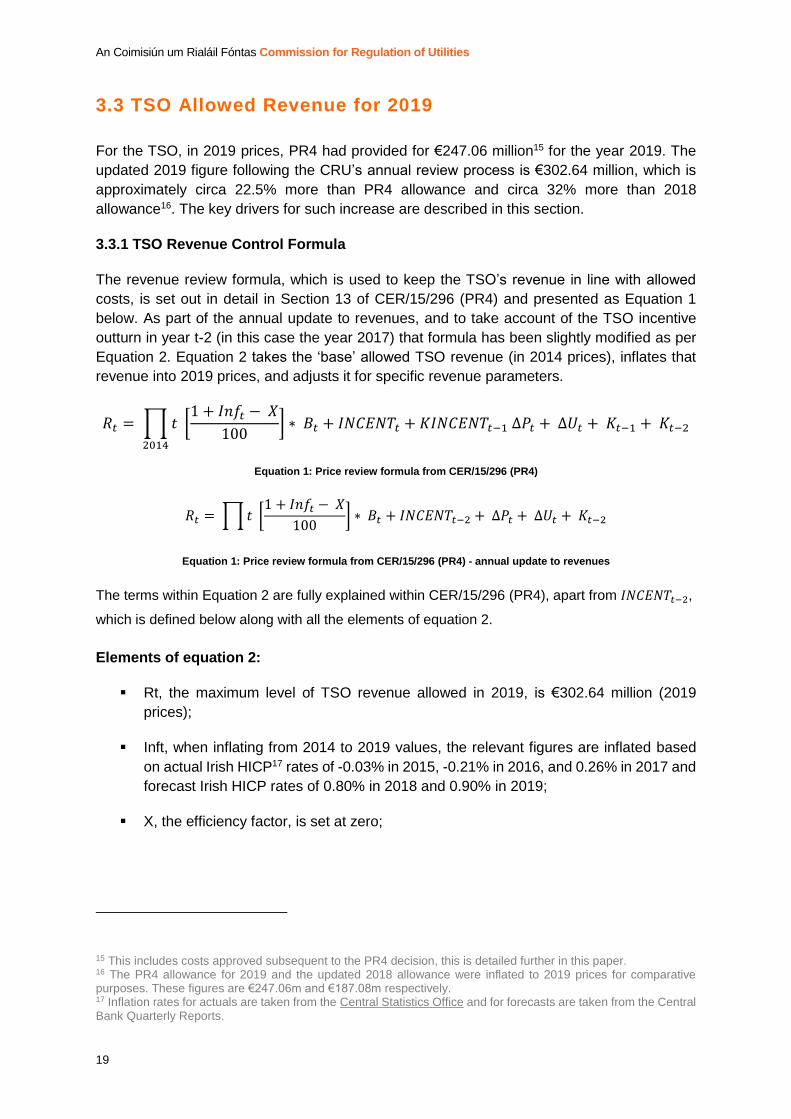
3.3 TSO Allowed Revenue for 2019
For the TSO, in 2019 prices, PR4 had provided for €247.06 million15 for the year 2019. The
updated 2019 figure following the CRU’s annual review process is €302.64 million, which is
approximately circa 22.5% more than PR4 allowance and circa 32% more than 2018
allowance16. The key drivers for such increase are described in this section.
3.3.1 TSO Revenue Control Formula
The revenue review formula, which is used to keep the TSO’s revenue in line with allowed
costs, is set out in detail in Section 13 of CER/15/296 (PR4) and presented as Equation 1
below. As part of the annual update to revenues, and to take account of the TSO incentive
outturn in year t-2 (in this case the year 2017) that formula has been slightly modified as per
Equation 2. Equation 2 takes the ‘base’ allowed TSO revenue (in 2014 prices), inflates that
revenue into 2019 prices, and adjusts it for specific revenue parameters.
𝑅𝑡 = ∏ 𝑡
2014
[1 + 𝐼𝑛𝑓𝑡 − 𝑋
100] ∗ 𝐵𝑡 + 𝐼𝑁𝐶𝐸𝑁𝑇𝑡 + 𝐾𝐼𝑁𝐶𝐸𝑁𝑇𝑡−1 ∆𝑃𝑡 + ∆𝑈𝑡 + 𝐾𝑡−1 + 𝐾𝑡−2
Equation 1: Price review formula from CER/15/296 (PR4)
𝑅𝑡 = ∏ 𝑡 [1 + 𝐼𝑛𝑓𝑡 − 𝑋
100] ∗ 𝐵𝑡 + 𝐼𝑁𝐶𝐸𝑁𝑇𝑡−2 + ∆𝑃𝑡 + ∆𝑈𝑡 + 𝐾𝑡−2
Equation 1: Price review formula from CER/15/296 (PR4) - annual update to revenues
The terms within Equation 2 are fully explained within CER/15/296 (PR4), apart from 𝐼𝑁𝐶𝐸𝑁𝑇𝑡−2,
which is defined below along with all the elements of equation 2.
Elements of equation 2:
Rt, the maximum level of TSO revenue allowed in 2019, is €302.64 million (2019
prices);
Inft, when inflating from 2014 to 2019 values, the relevant figures are inflated based
on actual Irish HICP17 rates of -0.03% in 2015, -0.21% in 2016, and 0.26% in 2017 and
forecast Irish HICP rates of 0.80% in 2018 and 0.90% in 2019;
X, the efficiency factor, is set at zero;
15 This includes costs approved subsequent to the PR4 decision, this is detailed further in this paper. 16 The PR4 allowance for 2019 and the updated 2018 allowance were inflated to 2019 prices for comparative purposes. These figures are €247.06m and €187.08m respectively. 17 Inflation rates for actuals are taken from the Central Statistics Office and for forecasts are taken from the Central Bank Quarterly Reports.
An Coimisiún um Rialáil Fóntas Commission for Regulation of Utilities
20
Bt, the level of allowed revenue for the 2019 calendar year in 2014 prices as per the
determination paper CER/15/296 (PR4), is €155.07 million;
INCENTt-2, is the value of incentives in year t-2 (in this case 2017) in € millions in
respect of the penalties or payments. The value of TSO incentive payments for 2017
is €2.62 million (2014 prices). This feeds into the Kt-2 figure below;
Pt, the change in TSO external costs (e.g. Inter TSO Compensation and Ancillary
Services) for 2019, from those assumed in the determination paper CER/15/296
(PR4). This is €73.82 million (2014 prices);
Ut, the change in TSO uncertain costs for 2019 from those assumed in the
determination paper CER/15/296 (PR4). This is €82.45 million (2014 prices); and
Kt-2, this is the correction factor, which ensures that revenues for 2019 are adjusted
by an amount equal to the over or under recovery in 2017. This is minus €13.84 million
(2014 prices, pre-interest). Note that this is a net k-factor figure which includes any
incentive adjustment outlined above.
3.3.2 TSO 2017 k-factor
While the difference between the PR4 allowance for 2017 (determined in 2015) and the
allowed outturn of 2017 (as determined in this paper) provided a k-factor in the case of the
TAO, for the TSO the k-factor is calculated in a different manner:
a) The first step is the calculation of the difference between the 2016 Tariff Decision for
the 2017 revenues (as determined in 2016) and the approved 2017 updated actual
costs (as determined in this paper).
b) The second step is the subtraction of the approved 2017 updated actual costs (as
determined in this paper) minus the revenue collected in 2017 through the
Transmission Use of System (TUoS) tariffs.
The resulting figure of the subtraction of the approved 2017 updated actual costs minus the
revenues collected through the TUoS tariffs is known as the 2017 ‘k-factor’. That k-factor feeds
into the updated 2019 TSO revenue allowance.
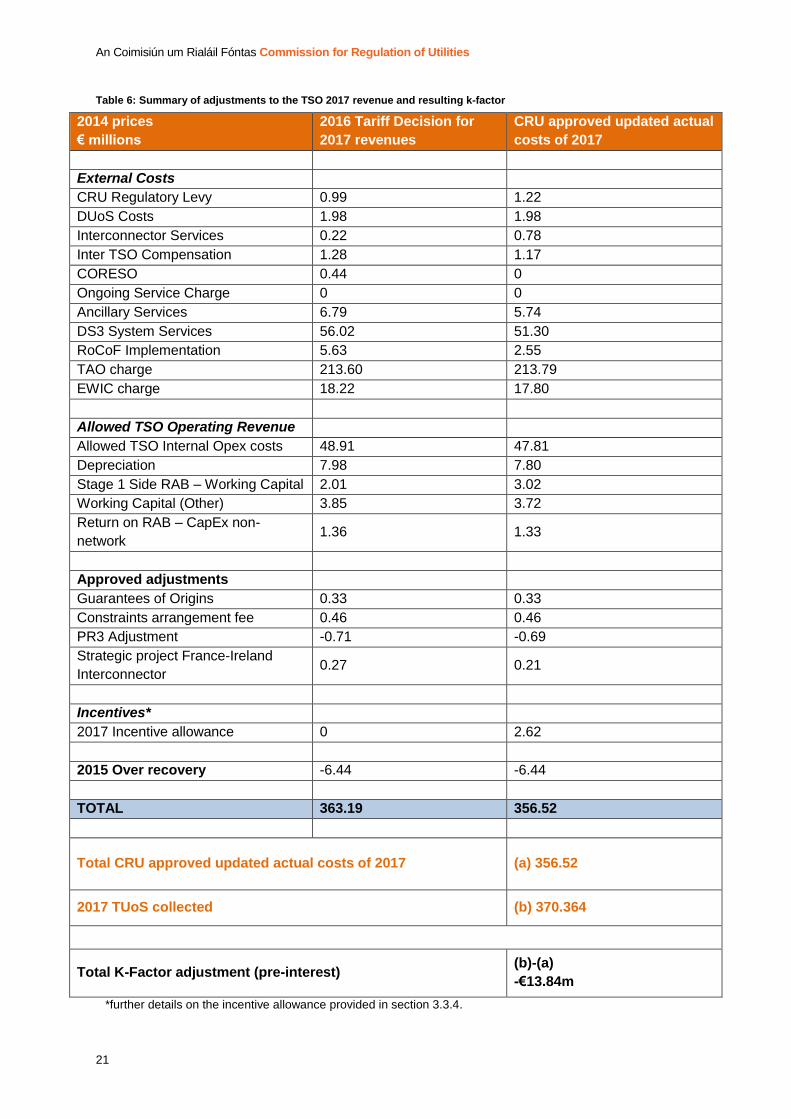
The k-factor calculation shows a total TSO over recovery of €13.84 million (2014 prices, pre-
interest) in 2017. That over recovery will be accounted for by applying an equal downward
adjustment to the TSO’s 2019 revenue allowance. The individual k-factor adjustments (in 2017
monies) are shown in table 7 and explained below the table:
An Coimisiún um Rialáil Fóntas Commission for Regulation of Utilities
21
Table 6: Summary of adjustments to the TSO 2017 revenue and resulting k-factor
2014 prices
€ millions
2016 Tariff Decision for
2017 revenues
CRU approved updated actual
costs of 2017
External Costs
CRU Regulatory Levy 0.99 1.22
DUoS Costs 1.98 1.98
Interconnector Services 0.22 0.78
Inter TSO Compensation 1.28 1.17
CORESO 0.44 0
Ongoing Service Charge 0 0
Ancillary Services 6.79 5.74
DS3 System Services 56.02 51.30
RoCoF Implementation 5.63 2.55
TAO charge 213.60 213.79
EWIC charge 18.22 17.80
Allowed TSO Operating Revenue
Allowed TSO Internal Opex costs 48.91 47.81
Depreciation 7.98 7.80
Stage 1 Side RAB – Working Capital 2.01 3.02
Working Capital (Other) 3.85 3.72
Return on RAB – CapEx non-
network 1.36 1.33
Approved adjustments
Guarantees of Origins 0.33 0.33
Constraints arrangement fee 0.46 0.46
PR3 Adjustment -0.71 -0.69
Strategic project France-Ireland
Interconnector 0.27 0.21
Incentives*
2017 Incentive allowance 0 2.62
2015 Over recovery -6.44 -6.44
TOTAL 363.19 356.52
Total CRU approved updated actual costs of 2017 (a) 356.52
2017 TUoS collected (b) 370.364
Total K-Factor adjustment (pre-interest) (b)-(a)
-€13.84m
*further details on the incentive allowance provided in section 3.3.4.
An Coimisiún um Rialáil Fóntas Commission for Regulation of Utilities
22
3.3.3 Interest Provision for TSO 2017 k-factor
Once the k-factor is calculated, an interest adjustment is applied.
As stated in CER/15/296 (PR4), the mechanism for inter-year adjustments for under or over-
recovery is to apply interest at the three month average Euribor rate. The interest rate (I) that
is applied to under and over-recoveries/ k-factors for transmission revenue for year t-2 is as
follows:
It2 is the mean of the twelve monthly average three month Euribor rate between April
and March of the year t-2 (i.e. April of year t-3 to March year t-2) multiplied by the mean
of the twelve monthly average three month Euribor rate between April and March of
the year t-1 (i.e. April of year t-2 to March year t-1).
Applying an interest rate of minus 0.3% in 2017 and minus 0.3% in 2018 to the TSO 2017 k-
factor of minus €13.84 million, results in a net TSO k-factor of minus €13.78 million (2014
prices). The TSO k-factor in 2019 prices is minus €14.08 million.
3.3.4 TSO 2017 incentives outturn
A total of €2.62 million (2014 prices) has been allowed to account for the TSO’s 2017 incentive
outturn. Details are set out below, with figures displayed in 2014 prices.
TSO 2017 overall incentives outturn (€2.62 million)
TSO incentives are made up of system performance incentives; imperfections costs
incentives; transmission delivery incentives for project milestones and strategic incentives.
The last incentive piece has been introduced as part of the Decision paper on Reporting and
Incentives under PR418.
Table 8 provides a summary of the TSO’s performance against incentive targets and also the
incentives earned. The explanation of each item is described below the table:
18 The Strategic Incentives: Annex F (CER/18/087). This Decision paper introduced a new regime which was implemented in 2018. It is in the context of this framework that the CRU has assessed EirGrid’s performance in 2017.
An Coimisiún um Rialáil Fóntas Commission for Regulation of Utilities
23
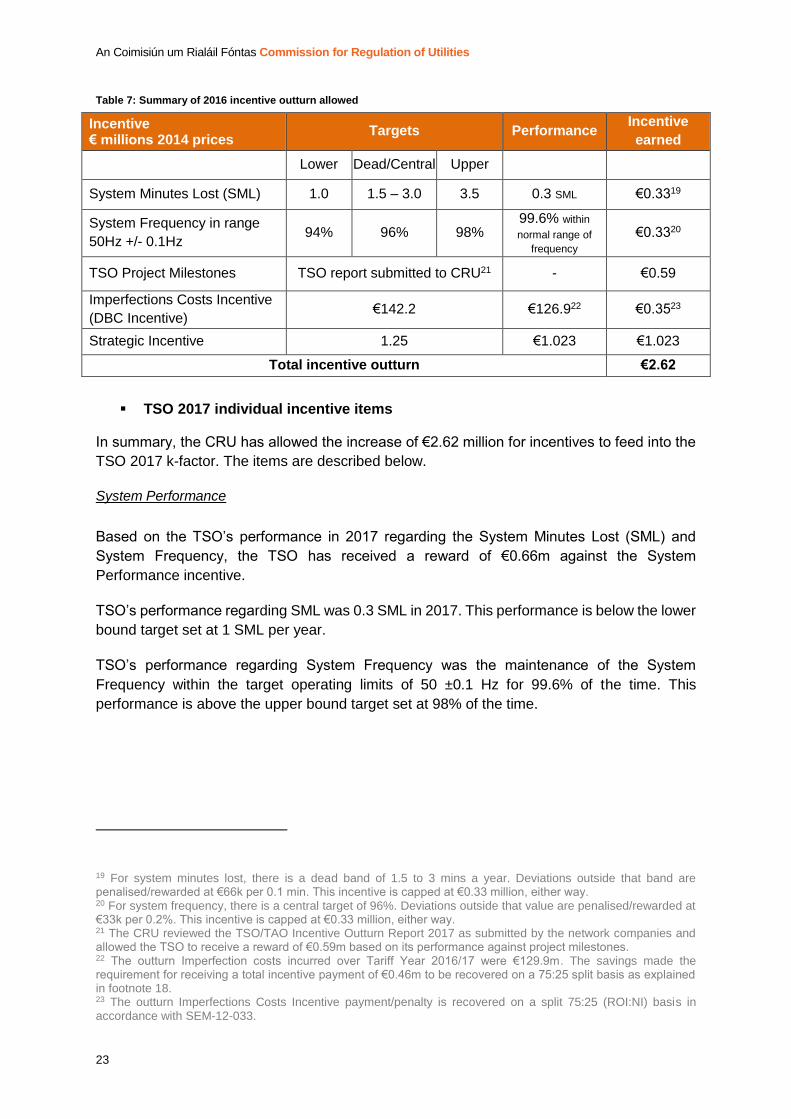
Table 7: Summary of 2016 incentive outturn allowed
Incentive € millions 2014 prices
Targets Performance Incentive
earned
Lower Dead/Central Upper
System Minutes Lost (SML) 1.0 1.5 – 3.0 3.5 0.3 SML €0.3319
System Frequency in range
50Hz +/- 0.1Hz 94% 96% 98%
99.6% within
normal range of
frequency €0.3320
TSO Project Milestones TSO report submitted to CRU21 - €0.59
Imperfections Costs Incentive
(DBC Incentive) €142.2 €126.922 €0.3523
Strategic Incentive 1.25 €1.023 €1.023
Total incentive outturn €2.62
TSO 2017 individual incentive items
In summary, the CRU has allowed the increase of €2.62 million for incentives to feed into the
TSO 2017 k-factor. The items are described below.
System Performance
Based on the TSO’s performance in 2017 regarding the System Minutes Lost (SML) and
System Frequency, the TSO has received a reward of €0.66m against the System
Performance incentive.
TSO’s performance regarding SML was 0.3 SML in 2017. This performance is below the lower
bound target set at 1 SML per year.
TSO’s performance regarding System Frequency was the maintenance of the System
Frequency within the target operating limits of 50 ±0.1 Hz for 99.6% of the time. This
performance is above the upper bound target set at 98% of the time.
19 For system minutes lost, there is a dead band of 1.5 to 3 mins a year. Deviations outside that band are penalised/rewarded at €66k per 0.1 min. This incentive is capped at €0.33 million, either way. 20 For system frequency, there is a central target of 96%. Deviations outside that value are penalised/rewarded at €33k per 0.2%. This incentive is capped at €0.33 million, either way. 21 The CRU reviewed the TSO/TAO Incentive Outturn Report 2017 as submitted by the network companies and allowed the TSO to receive a reward of €0.59m based on its performance against project milestones. 22 The outturn Imperfection costs incurred over Tariff Year 2016/17 were €129.9m. The savings made the requirement for receiving a total incentive payment of €0.46m to be recovered on a 75:25 split basis as explained in footnote 18. 23 The outturn Imperfections Costs Incentive payment/penalty is recovered on a split 75:25 (ROI:NI) basis in accordance with SEM-12-033.
An Coimisiún um Rialáil Fóntas Commission for Regulation of Utilities
24
Transmission Delivery
Based on the TSO’s performance in 2017 (31 project milestones achieved) against the TSO
Project Milestones targets (29.4 project milestones set as the target), the TSO has received a
reward of €0.59m against the Transmission Delivery incentive.
Imperfection Costs incentive
Based on the TSO’s performance in 2017 against the Dispatch Balancing Costs targets, the
TSO has received a reward of €0.35m against Imperfection Cost incentive.
Strategic incentive
The Strategic Incentive was introduced as part of the CRU Decision paper on Reporting and
Incentives under PR4 - CRU/18/087.
The allowed incentive figure following the CRU’s review of the TSO’s request and based on
its performance in 2017 against the Strategic incentive target, is €1.023m.
3.3.5 TSO 2019 forecast Adjustments
This section outlines the difference between the TSO’s 2019 ex-ante revenue allowance
(determined in 2015 as part of PR4) and updated ex-ante revenue allowance (as determined
in this paper), i.e. the changes to forecast expenditure. The resulting figure represents the
total adjustment to forecast revenues for 2019, which feeds into the updated 2019 TSO
revenue allowance.
The updates to forecast figures show a total TSO adjustment for 2019 of €158.97 million (2019
prices). The individual forecast adjustments are detailed in Table 9 and described below the
table.
An Coimisiún um Rialáil Fóntas Commission for Regulation of Utilities
25
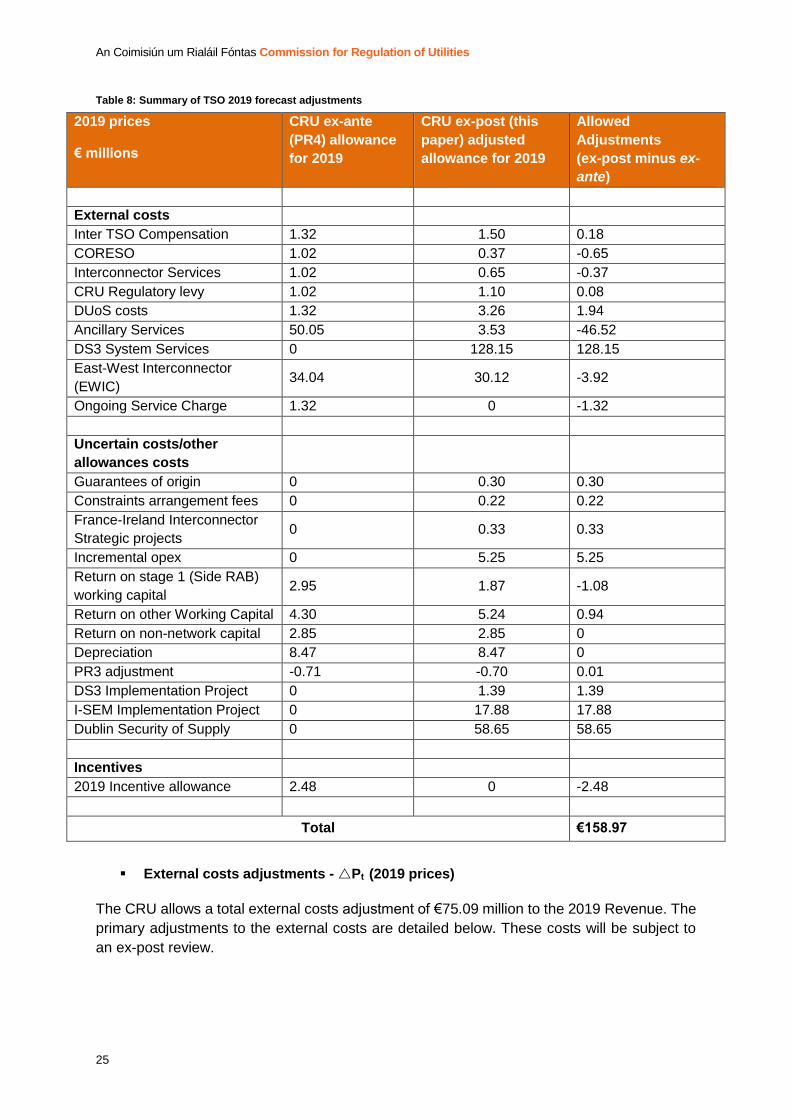
Table 8: Summary of TSO 2019 forecast adjustments
2019 prices
€ millions
CRU ex-ante
(PR4) allowance
for 2019
CRU ex-post (this
paper) adjusted
allowance for 2019
Allowed
Adjustments
(ex-post minus ex-
ante)
External costs
Inter TSO Compensation 1.32 1.50 0.18
CORESO 1.02 0.37 -0.65
Interconnector Services 1.02 0.65 -0.37
CRU Regulatory levy 1.02 1.10 0.08
DUoS costs 1.32 3.26 1.94
Ancillary Services 50.05 3.53 -46.52
DS3 System Services 0 128.15 128.15
East-West Interconnector
(EWIC) 34.04 30.12 -3.92
Ongoing Service Charge 1.32 0 -1.32
Uncertain costs/other
allowances costs
Guarantees of origin 0 0.30 0.30
Constraints arrangement fees 0 0.22 0.22
France-Ireland Interconnector
Strategic projects 0 0.33 0.33
Incremental opex 0 5.25 5.25
Return on stage 1 (Side RAB)
working capital 2.95 1.87 -1.08
Return on other Working Capital 4.30 5.24 0.94
Return on non-network capital 2.85 2.85 0
Depreciation 8.47 8.47 0
PR3 adjustment -0.71 -0.70 0.01
DS3 Implementation Project 0 1.39 1.39
I-SEM Implementation Project 0 17.88 17.88
Dublin Security of Supply 0 58.65 58.65
Incentives
2019 Incentive allowance 2.48 0 -2.48
Total €158.97
External costs adjustments - Pt (2019 prices)
The CRU allows a total external costs adjustment of €75.09 million to the 2019 Revenue. The
primary adjustments to the external costs are detailed below. These costs will be subject to
an ex-post review.
An Coimisiún um Rialáil Fóntas Commission for Regulation of Utilities
26
Inter TSO Compensation (€0.18 million)
Following this year’s review, an upward adjustment of €0.18 million has been applied to the
TSO’s 2019 revenue for costs attributable to Inter TSO Compensation.
This cost is established by ENTSOE for the purpose of compensating transmission system
operators for the costs of losses incurred by national transmission systems as a result of
hosting cross-border flows of electricity and the costs of making infrastructure available to host
cross-border flows of electricity. This upward adjustment provides a total of €1.5 million in the
2019 revenue allowance.
CORESO (-€0.65 million)
Following this year’s review, a downward adjustment of €0.65 million has been applied to the
TSO’s 2019 revenue for costs attributable to the membership of the Regional Security
Coordinator. This adjustment provides a total of €0.37 million in the 2019 revenue allowance
for the CORESO membership.
Interconnector Services (-€0.37 million)
Following this year’s review, a downward adjustment of €0.37 million has been applied to the
TSO’s 2019 revenue for costs attributable to Interconnector Services.
These costs include Admin costs, Error Account and SO Trades, the latter makes up the bulk
of the costs and are annually forecasted by EirGrid reflecting the agreed ROI 75%. This
downward adjustment provides a total of €0.65 million in the 2019 revenue allowance.
Regulatory levy (€0.08 million)
Rates are levied annually by CRU on the TSO. Following this year’s review, an upward
adjustment of €0.08 million has been applied to the TSO’s 2019 revenue to provide a total of
€1.10 million for regulatory levy costs.
DUoS costs (€1.94 million)
An increase of €1.94 million has been applied to the 2019 revenue to reflect new customers
connecting at 110kV on the DSO network or changes in MIC of connected parties. For the
2019 allowance, ESB Networks provided the TSO with a forecast DUoS charge for a number
of additional DG10 110 kV accounts. The TSO is required to pay the DSO based on invoices
received. To account for that, an upward adjustment of €1.94 million has been applied to the
TSO’s 2019 revenue, which gives a total of €3.26 million for DUoS costs.
Ancillary Services (-€46.52 million)
Following this year’s review, a downward adjustment of €46.52 million has been applied to the
TSO’s 2019 revenue for costs attributable to Ancillary Services.
Provision for Ancillary Services in PR4 was on the basis of existing Ancillary Services
requirements in 2015. Ancillary services have been phased into DS3 System Services and
An Coimisiún um Rialáil Fóntas Commission for Regulation of Utilities
27
with that the PR4 forecast figure for ancillary services has been revised downwards by €46.52
million to a total of €3.53 million for 2019.
DS3 System Services (€128.15 million)
Following this year’s review, a figure of €128.15 million has been included in the TSO’s 2019
revenue for costs attributable to DS3 System Services. Last year’s allowance (2019 prices)
was 84.89 million, representing 50.9% less than this year’s allowance. Last year’s allowance
has been included as part of PR4 allowance for 2019 as this cost was identified in PR4 but it
had no allowance at the time of the Decision as the cost was unknown Therefore, there is an
upward adjustment of €43.26 million for this year’s allowance with respect to 2018
The DS3 system services costs capture system services that were not quantified at the time
of PR4 decision, as the costs were unknown at the time of the Decision and for that reason
no allowance was allocated to them but PR4 identified these costs and provided for this item
to be recovered once the costs were known, and also services that had been previously
captured under ancillary services (hence a reduction of -€46.52m to ancillary services as
outlined above).
The estimated all-island spend on DS3 System Services relate to costs associated with new
contracts:
- From May 2018 new contracts were executed for the current 11 system services.
- Additionally, from August 2018 new contracts are expected to be executed for one
additional service, Fast Frequency Response (FFR).
The TSOs conducted two separate procurement processes services for go-live in May 2018
and September 2018.
These services will facilitate an increase of non-synchronous renewable generation over the
coming years which will put downward pressure on wholesale market prices.
East-West Interconnector (EWIC) allowance (-€3.92 million)
This cost item was introduced in the PR3 period. The EWIC charge is not a TSO related cost,
but recoverable under TUoS in accordance with the interconnector licence. The EWIC charge
is treated in the exact same fashion as all the external TSO cost items listed above, i.e. this
charge will be allowed as pass through in PR4 and the CRU will undertake an annual ex-post
adjustment to take account of actual outturn costs and revenues earned by the EWIC24.
The CRU included a forecast annual cost of €33.46 million (2014 monies) in the PR4 decision
to be included in the TUoS tariffs based on the estimated cost for the infrastructure and the
financing arrangements. However, up to date forecasts from those used in the PR4
submission are submitted annually. These up to date forecasts capture the following items in
24 Please refer the CER Information Paper on the EWIC revenue requirement (CER/12/149) which can be found here.
An Coimisiún um Rialáil Fóntas Commission for Regulation of Utilities
28
the calculation: auction receipts, ancillary services receipts and hosting income. Based on the
CRU’s review of these updates, the CRU allows a downward adjustment of minus €3.92 million
to the TSO’s 2019 revenue. This results in a total allowance of €30.12 million towards the
EWIC.
Ongoing Service Charge (-€1.32 million)
Following this year’s review, a downward adjustment of €1.32 million has been applied to the
TSO’s 2019 revenue for costs attributable to Ongoing Service Charge.
This item is charged to customers through their connection agreements. There was provision
for this charge in PR4, and that is the reason of the downward adjustment. However, there is
an allowance of €0 million to the TSO’s 2019 revenue for the Ongoing Service Charge.
Uncertain costs adjustments - Ut. (2019 prices)
The CRU allows a total uncertain costs adjustment of €83.88 million to the 2019 Revenue.
The primary adjustments to the uncertain costs are detailed below. These costs will be subject
to an ex-post review.
Guarantees of origin (€0.30 million)
In CRU’s decision paper CER/11/824 entitled ‘Supervisory Framework for Administration of
Guarantees of Origin’, it was set out that the operational costs and costs involved in setting
up a charging infrastructure for Guarantees of Origin, would be recovered through EirGrid’s
network charges.
The TSO has submitted a request of €0.30 million to conduct the work associated with
Guarantees of Origin. The CRU allows an upward adjustment and total allowance of €0.30
million to the TSO’s 2019 revenue towards these costs.
Constraints arrangement fees (€0.22 million)
The constraint arrangement fee is separate to the general working capital arrangements
contained in the allowed TSO revenue and covers funding arrangements associated with the
all-island Imperfections charge. The CRU allows an upward adjustment and total allowance of
€0.22 million to the TSO’s 2019 revenue.
France-Ireland Interconnector project (€0.33 million)
In 2014 the CRU approved the framework (CER/14/427) for the recovery of phase 1
(feasibility) of the Ireland France Interconnector project. In June 2015, the CRU approved
EirGrid’s costs for this phase of the project. The TSO has submitted a forecast cost of €0.33
million for 2019. The CRU allows an upward adjustment and total allowance of €0.33 million
to the TSO’s 2019 revenue towards the Ireland France Interconnector project.
Incremental opex (€5.25 million)
The TSO made a submission to the CRU on 8th June 2017 regarding the TSO’s incremental
operational requirements that will apply under the new market arrangements, I-SEM, for the
An Coimisiún um Rialáil Fóntas Commission for Regulation of Utilities
29
remainder of the PR4 period. This incremental opex consists of costs for additional staff
resources to operate the system, IT support and maintenance, and professional fees.
For the 2019 revenue requirement, the TSO is requesting €5.25 million. In line with the
established price review process of ex-post review of incurred expenditure, the CRU allows
an increase of €5.25 million to the 2019 revenue. This allowance will serve as a placeholder
for costs attributable to operating the system under the new market arrangements, with the
caveat that these are subject to review by the end of the price review period.
Last year’s allowance (2019 prices) was 4.43 million. This allowance has been included as
part of PR4 allowance for 2018 as this cost was identified in PR4 but it had no allowance at
the time of the Decision as the cost was unknown Therefore, there is an upward adjustment
of €0.82 million for this year’s allowance with respect to 2018
For the avoidance of doubt these costs do not include any of the capitalised costs related to
I-SEM implementation.
Return on stage 1 (Side RAB) working capital (-€1.08 million)
Following this year’s review of the TSO’s revenue request, a downward adjustment of €1.08
million has been applied to the TSO’s 2019 revenue for costs attributable to return on Stage
1 side RAB.
This downward adjustment provides a total of €1.87 million in the 2019 revenue allowance.
Return on other Working Capital (€0.94 million)
Following this year’s review, an upward adjustment of €0.94 million has been applied to the
TSO’s 2019 revenue for costs attributable to return on other Working Capital.
This upward adjustment provides a total of €5.24 million in the 2019 revenue allowance.
PR3 adjustment (€0.01 million)
Following this year’s review, an upward adjustment of €0.01 million has been applied to the
TSO’s 2019 revenue for costs attributable to PR3 adjustment.
This upward adjustment provides a total of -€0.70 million in the 2019 revenue allowance.
DS3 Implementation Project (€1.39 million)
Following a CRU review of the TSO’s revenue request, a figure of €1.39 million has been
applied to the TSO’s 2019 revenue for costs attributable to DS3 Implementation project, with
the caveat that these costs will serve as a placeholder and will be reviewed by the end of the
price review period.
DS3 System Services form a key work stream under the DS3 Programme that was launched
in September 2011. At a high level, the project includes the design and development of the
procurement arrangements for System Services and the development of systems to ensure
An Coimisiún um Rialáil Fóntas Commission for Regulation of Utilities
30
delivery and settlement for those services. The project costs consist of the following three
items:
- Internal resource costs incurred by the TSO on the basis of staff who have been
engaged on the project.
- Third Party Support costs through contracting external advisors or support to
supplement TSO resources (e.g. technical, economic or legal advice).
- System costs through sourcing and implementing new systems to carry out functions
relating to system services (e.g. settlement systems, control centre tools etc).
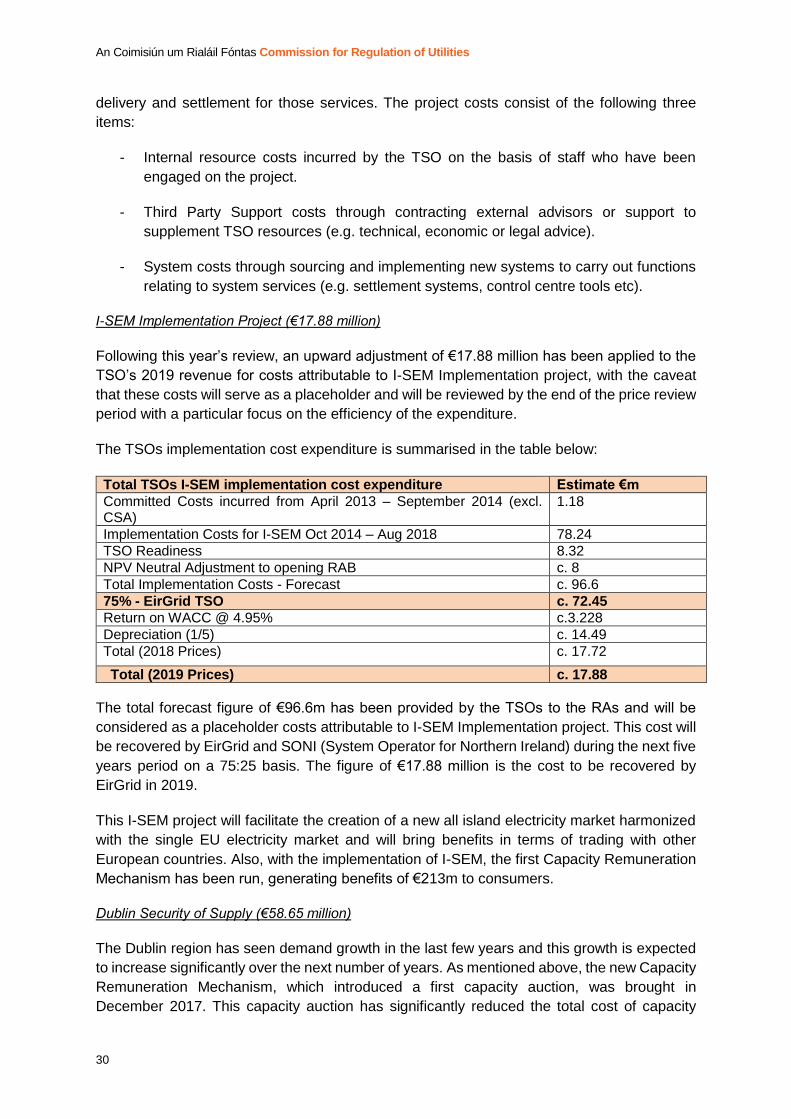
I-SEM Implementation Project (€17.88 million)
Following this year’s review, an upward adjustment of €17.88 million has been applied to the
TSO’s 2019 revenue for costs attributable to I-SEM Implementation project, with the caveat
that these costs will serve as a placeholder and will be reviewed by the end of the price review
period with a particular focus on the efficiency of the expenditure.
The TSOs implementation cost expenditure is summarised in the table below:
Total TSOs I-SEM implementation cost expenditure Estimate €m
Committed Costs incurred from April 2013 – September 2014 (excl. CSA)
1.18
Implementation Costs for I-SEM Oct 2014 – Aug 2018 78.24
TSO Readiness 8.32
NPV Neutral Adjustment to opening RAB c. 8
Total Implementation Costs - Forecast c. 96.6
75% - EirGrid TSO c. 72.45
Return on WACC @ 4.95% c.3.228
Depreciation (1/5) c. 14.49
Total (2018 Prices) c. 17.72
Total (2019 Prices)
c. 17.88
The total forecast figure of €96.6m has been provided by the TSOs to the RAs and will be
considered as a placeholder costs attributable to I-SEM Implementation project. This cost will
be recovered by EirGrid and SONI (System Operator for Northern Ireland) during the next five
years period on a 75:25 basis. The figure of €17.88 million is the cost to be recovered by
EirGrid in 2019.
This I-SEM project will facilitate the creation of a new all island electricity market harmonized
with the single EU electricity market and will bring benefits in terms of trading with other
European countries. Also, with the implementation of I-SEM, the first Capacity Remuneration
Mechanism has been run, generating benefits of €213m to consumers.
Dublin Security of Supply (€58.65 million)
The Dublin region has seen demand growth in the last few years and this growth is expected
to increase significantly over the next number of years. As mentioned above, the new Capacity
Remuneration Mechanism, which introduced a first capacity auction, was brought in
December 2017. This capacity auction has significantly reduced the total cost of capacity
An Coimisiún um Rialáil Fóntas Commission for Regulation of Utilities
31
resulting in consumer savings of approximately €213m across the island. However, this means
that some inefficient high-cost generators will not receive capacity payments and will exit the
market. This is in the long-term interests of consumers, however, it creates some transitional
issues where the inefficient generation is in constrained areas such as Dublin and so is
required until new network infrastructure can be built or new more efficient generation can be
built. In addition significant demand increases in the Dublin region are expected to continue.
Therefore the CRU has included €58.65m in this year’s D-TUoS to cover the costs of a suite
of measures to improve the immediate and long-term security of supply of the Dublin region.
This includes provision for expected Local Reserve Services Agreements with a diverse range
of service providers, and provision for the possible introduction of locational signals.
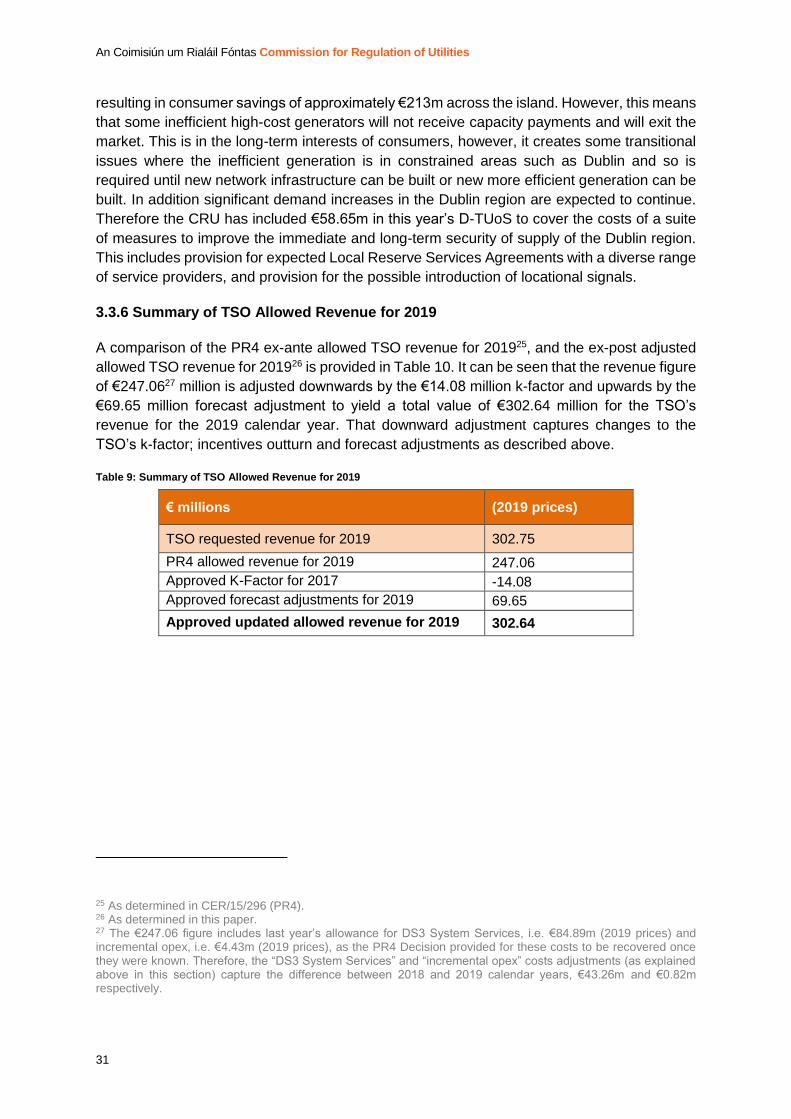
3.3.6 Summary of TSO Allowed Revenue for 2019
A comparison of the PR4 ex-ante allowed TSO revenue for 201925, and the ex-post adjusted
allowed TSO revenue for 201926 is provided in Table 10. It can be seen that the revenue figure
of €247.0627 million is adjusted downwards by the €14.08 million k-factor and upwards by the
€69.65 million forecast adjustment to yield a total value of €302.64 million for the TSO’s
revenue for the 2019 calendar year. That downward adjustment captures changes to the
TSO’s k-factor; incentives outturn and forecast adjustments as described above.
Table 9: Summary of TSO Allowed Revenue for 2019
€ millions (2019 prices)
TSO requested revenue for 2019 302.75
PR4 allowed revenue for 2019 247.06
Approved K-Factor for 2017 -14.08
Approved forecast adjustments for 2019 69.65
Approved updated allowed revenue for 2019 302.64
25 As determined in CER/15/296 (PR4). 26 As determined in this paper. 27 The €247.06 figure includes last year’s allowance for DS3 System Services, i.e. €84.89m (2019 prices) and incremental opex, i.e. €4.43m (2019 prices), as the PR4 Decision provided for these costs to be recovered once they were known. Therefore, the “DS3 System Services” and “incremental opex” costs adjustments (as explained above in this section) capture the difference between 2018 and 2019 calendar years, €43.26m and €0.82m respectively.
An Coimisiún um Rialáil Fóntas Commission for Regulation of Utilities
32
4. TUoS Tariffs for 2018/19
The new all-island Integrated Single Electricity Market (I-SEM) comes into operation on 1st
October 2018. This is the most significant change to the operation of the market since it was
launched in 2007. I-SEM will integrate the all-island market with the EU internal energy market,
increase competition, facilitate renewable electricity generation and deliver benefits for all-
island consumers.
I-SEM will change how generators and service providers earn revenues. They will compete
for capacity revenues from the capacity market and for system service revenues from the
TSO. This will also change some of the costs components in customers’ bills. Therefore, while
the combined transmission and distribution adjustments will result in upward cost pressure for
this year of €13.85 in a typical domestic bill, this will be offset by the reduced costs for capacity
payments.
Allowed revenues are set on a calendar year basis. However, TUoS tariffs are set for periods
that span two calendar years (from 01 October in one year to 30 September the following
year). This means that the TUoS tariffs are set to recover 26.26% of revenues associated with
the first calendar year of the tariff period and 73.74% for the second calendar year28. For the
D-TUoS (Demand Transmission Use of System) tariffs set out in this information note, 26.26%
of 2018 revenues and 73.74% of 2019 revenues have been allocated for recovery within the
01 October 2018 to 30 September 2019 tariff period.
The update of revenues detailed in the previous sections leads to a total revenue figure for
the TUoS tariff period from 01 October 2018 to 30 September 2019 of €520 million. This is
slightly higher than what PR4 allowed and represents nearly a 30% increase relative to the
€402 million that was approved for recovery during the equivalent period for the previous year
(01 October 2017 to 30 September 2018). This is due to the realising of costs that were
identified during PR4 but not quantified at the time, in addition to the factors outlined in the
previous sections.
While the transmission revenue is not collected on a per kWh basis, it is sometimes useful to
compare the Average Unit Price (AUP), that is, the total allowed revenue for the relevant tariff
year (2018/19 in this case) by the forecast energy for the relevant tariff year (2018/19). This is
measured in c/KWh.
The AUP calculation is a straightforward way of comparing average unit prices when moving
from one tariff period (12 month period, starting each October) to the next tariff period. Based
on the 2018/19 tariff year revenue figure of €520m and the forecast demand of 28,700GWh,
the AUP for the period of 01 October 2018 to 30 September 2019 is estimated to be
1.81c/kWh.
The resultant Demand Transmission Use of System tariffs are set out in Appendix A29.
28 This is based on the percentage of demand that relates to the relevant period of the year. 29 Tariff calculations are influenced by Large Energy User rebalancing, as per CER/10/198.
An Coimisiún um Rialáil Fóntas Commission for Regulation of Utilities
33
5. Summary of 2019 Review
The new all-island Integrated Single Electricity Market (I-SEM) comes into operation on 1st
October 2018. This is the most significant change to the operation of the market since it was
launched in 2007. I-SEM will integrate the all-island market with the EU internal energy market,
increase competition, facilitate renewable electricity generation and deliver benefits for all-
island consumers.
I-SEM will change how generators and service providers earn revenues. They will compete
for capacity revenues from the capacity market and for system service revenues from the
TSO. This will also change some of the costs components in customers’ bills. Therefore, while
the combined transmission and distribution adjustments will result in upward cost pressure for
this year of €13.85 in a typical domestic bill, this will be offset by the reduced costs for capacity
payments.
This information paper outlines the application of the PR4 annual update to the 2019
transmission revenue. This revenue is to be collected during calendar year 2019 and will cover
the costs of the TSO and TAO.
The paper outlines:
- The TSO allowed revenue approved for the 2019 calendar year;
- The TAO allowed revenue approved for the 2019 calendar year; and
- The Demand TUoS tariffs approved for implementation during the tariff period from 01
October 2018 to 30 September 201930.
The total transmission allowed revenue for 2019 calendar year as per the annual update is
€557.86 million (2019 prices). This is an increase of 9.16% relative to the €511.14 million
(2019 prices) that was allowed for in the PR4 determination for 2019, inclusive of allowances
made in 2018. The total transmission allowed revenue for the TUoS tariff period from 01
October 2018 to 30 September 2019 is €520 million. This is an increase of circa 30% relative
to the €402 million that was approved for recovery for the period from 01 October 2017 to 30
September 2018.
The transmission AUP for the 2018/2019 period is estimated to be €1.81c/kWh in 2019
prices.31.
The Demand TUoS tariffs that have been approved for implementation during the period from
01 October 2018 to 30 September 2019 are contained in Appendix A of this paper32.
30 The full Statement of Charges will be published by EirGrid under Section 36 of the Electricity Regulation Act 1999 before the commencement of the upcoming tariff period. 31 This is based on the total tariff year revenue amount/GWh sales. 32 Tariff calculations are influenced by Large Energy User rebalancing, as per CER/10/198.
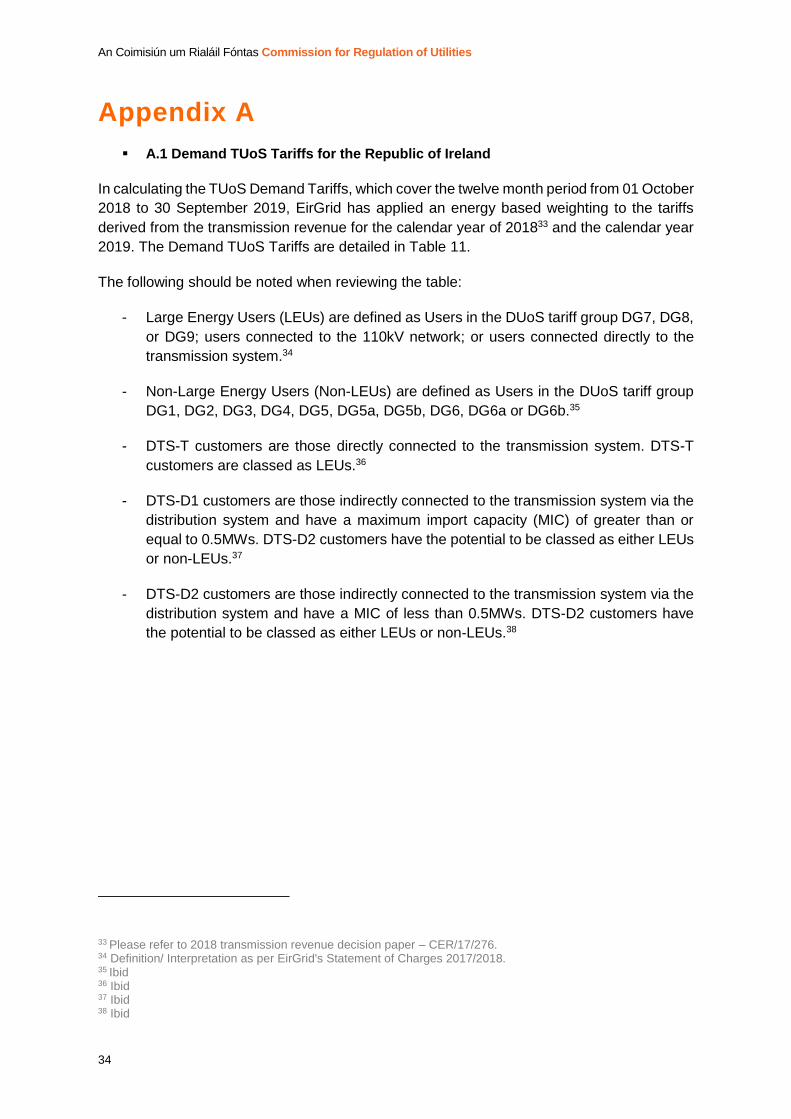
An Coimisiún um Rialáil Fóntas Commission for Regulation of Utilities
34
Appendix A
A.1 Demand TUoS Tariffs for the Republic of Ireland
In calculating the TUoS Demand Tariffs, which cover the twelve month period from 01 October
2018 to 30 September 2019, EirGrid has applied an energy based weighting to the tariffs
derived from the transmission revenue for the calendar year of 201833 and the calendar year
2019. The Demand TUoS Tariffs are detailed in Table 11.
The following should be noted when reviewing the table:
- Large Energy Users (LEUs) are defined as Users in the DUoS tariff group DG7, DG8,
or DG9; users connected to the 110kV network; or users connected directly to the
transmission system.34
- Non-Large Energy Users (Non-LEUs) are defined as Users in the DUoS tariff group
DG1, DG2, DG3, DG4, DG5, DG5a, DG5b, DG6, DG6a or DG6b.35
- DTS-T customers are those directly connected to the transmission system. DTS-T
customers are classed as LEUs.36
- DTS-D1 customers are those indirectly connected to the transmission system via the
distribution system and have a maximum import capacity (MIC) of greater than or
equal to 0.5MWs. DTS-D2 customers have the potential to be classed as either LEUs
or non-LEUs.37
- DTS-D2 customers are those indirectly connected to the transmission system via the
distribution system and have a MIC of less than 0.5MWs. DTS-D2 customers have
the potential to be classed as either LEUs or non-LEUs.38
33 Please refer to 2018 transmission revenue decision paper – CER/17/276. 34 Definition/ Interpretation as per EirGrid's Statement of Charges 2017/2018. 35 Ibid 36 Ibid 37 Ibid 38 Ibid
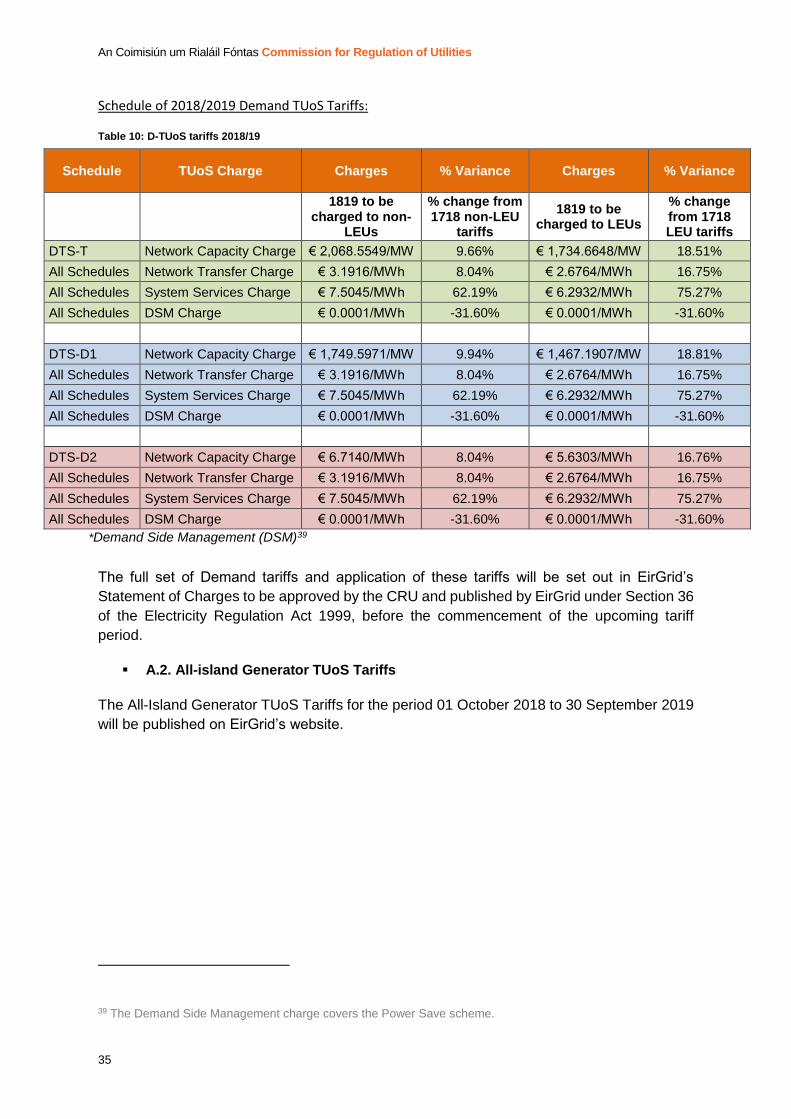
An Coimisiún um Rialáil Fóntas Commission for Regulation of Utilities
35
Schedule of 2018/2019 Demand TUoS Tariffs:
Table 10: D-TUoS tariffs 2018/19
Schedule TUoS Charge Charges % Variance Charges % Variance
1819 to be
charged to non-LEUs
% change from 1718 non-LEU
tariffs
1819 to be charged to LEUs
% change from 1718 LEU tariffs
DTS-T Network Capacity Charge € 2,068.5549/MW 9.66% € 1,734.6648/MW 18.51%
All Schedules Network Transfer Charge € 3.1916/MWh 8.04% € 2.6764/MWh 16.75%
All Schedules System Services Charge € 7.5045/MWh 62.19% € 6.2932/MWh 75.27%
All Schedules DSM Charge € 0.0001/MWh -31.60% € 0.0001/MWh -31.60%
DTS-D1 Network Capacity Charge € 1,749.5971/MW 9.94% € 1,467.1907/MW 18.81%
All Schedules Network Transfer Charge € 3.1916/MWh 8.04% € 2.6764/MWh 16.75%
All Schedules System Services Charge € 7.5045/MWh 62.19% € 6.2932/MWh 75.27%
All Schedules DSM Charge € 0.0001/MWh -31.60% € 0.0001/MWh -31.60%
DTS-D2 Network Capacity Charge € 6.7140/MWh 8.04% € 5.6303/MWh 16.76%
All Schedules Network Transfer Charge € 3.1916/MWh 8.04% € 2.6764/MWh 16.75%
All Schedules System Services Charge € 7.5045/MWh 62.19% € 6.2932/MWh 75.27%
All Schedules DSM Charge € 0.0001/MWh -31.60% € 0.0001/MWh -31.60%
*Demand Side Management (DSM)39
The full set of Demand tariffs and application of these tariffs will be set out in EirGrid’s
Statement of Charges to be approved by the CRU and published by EirGrid under Section 36
of the Electricity Regulation Act 1999, before the commencement of the upcoming tariff
period.
A.2. All-island Generator TUoS Tariffs
The All-Island Generator TUoS Tariffs for the period 01 October 2018 to 30 September 2019
will be published on EirGrid’s website.
39 The Demand Side Management charge covers the Power Save scheme.