Embed Size (px)
Citation preview

NOVEMBER 2016
Electricity Ten Year Statement 2016
UK electricity transmission

HomeThis will take you to the contents page. You can click on the titles to navigate to a section.
ArrowsClick on the arrows to move backwards or forwards a page.
Previous viewClick on the icon to go to the previous page viewed.
A to ZYou will find a link to the glossary on each page.
HyperlinksHyperlinks are highlighted in bold throughout the report. You can click on them to access further information.
How to use this interactive document To help you find the information you need quickly and easily we have published the ETYS as an interactive document.
Electricity Ten Year Statement November 2016

We are in the midst of an energy revolution. The economic landscape, developments in technology and consumer behaviour are changing at an unprecedented rate, creating more opportunities than ever for our industry.
Our Electricity Ten Year Statement, along with our other System Operator publications, aims to encourage and inform debate, leading to changes that ensure a secure, sustainable and affordable energy future.
Your views, knowledge and insight have shaped the publication, helping us to better understand the future of energy. Thank you for this valuable input over the past year.
Now our 2016 analysis is complete, we have been able to look holistically at the results. They point to some important themes and messages. From our future energy scenarios we continue to see increasing north-to-south transmission flows across Scotland and much of northern England to supply southern demand. This is largely influenced by new low-carbon generation in the north, together with fossil fuelled plant closures. Increasing interconnector activity is also putting additional stress on the southern part of the network. These developments mean we see the need to reinforce the transmission system in a timely, economic and efficient way.
We will make appropriate transmission development recommendations through our Network Options Assessment (NOA). The NOA aims to make sure that the transmission system is continuously developed in a timely, economic and efficient way, providing value for our customers. The NOA1, using the assessment results from ETYS 2015, recommended £28 million of development spend on future network reinforcements in 2016 to provide the required transmission capabilities. The results from ETYS 2016 will feed into NOA2 report, which we will publish in January 2017.
Through our NOA, we continue to monitor demand and make sure the transmission network does not put demand security at risk due to insufficient network capacity.
I hope that you find this document, along with our other System Operator publications, useful as a catalyst for wider debate. For more information about all our publications, please see page 3.
Please share your views with us; you can find details of how to contact us on our website www.nationalgrid.com/etys
Richard SmithHead of Network Capability(Electricity)
Electricity Ten Year Statement November 2016 01

The way forward ...................................................1064.1 Continuous development .......................1064.2 Improving your experience ....................108
Appendices overview ...........................................110Meet the team ........................................................112Glossary ..................................................................114
Executive summary ................................................03Key messages ........................................................05Introduction ............................................................081.1 ETYS and the NOA .....................................091.2 ETYS-NOA and TYNDP ............................101.3 ETYS and the SOF ......................................111.4 Improving your experience ......................12
Network development inputs ...............................142.1 Future energy scenarios ..........................152.2 Applying the future energy
scenarios in system planning .................162.2.1 Application of demand data ..........................162.2.2 Application of generation data ......................162.2.2a Security criterion ............................................ 172.2.2b Economy criterion ..........................................182.3 Interconnector information .....................19
The electricity transmission network ................243.1 Introduction .................................................243.2 NETS background ......................................253.3 NETS boundaries .......................................263.4 Network capability and requirements
by region: Scottish boundaries ...............313.5 Network capability and requirements
by region: Northern boundaries .............543.6 Network capability and requirements
by region: Western boundaries ...............663.7 Network capability and requirements
by region: Eastern boundaries ................843.8 Network capability and requirements
by region: Southern boundaries .............923.9 Year-round capability .............................103
Contents
Electricity Ten Year Statement November 2016 02

Executive summary
As System Operator (SO), we are perfectly placed as an enabler, informer and facilitator. The SO publications that we produce every year are intended to be a catalyst for debate, decision making and change.
The starting point for our flagship publications is the Future Energy Scenarios (FES). The FES is published every year and involves input from stakeholders from across the energy industry.
These scenarios are based on the energy trilemma (security of supply, sustainability and affordability) and provide supply and demand projections out to 2050. We use these scenarios to inform the energy industry about network analysis and the investment we are planning, for the benefit of our customers.
For short-term challenges around gas and electricity transmission, we produce the Summer and Winter Outlook Reports every six months. We publish them ahead of each season to provide a view of gas and electricity supply and demand for the coming summer or winter. These publications are designed to support and inform your business planning activities and are complemented by summer and winter consultations and reports.
We build our long-term view of the gas and electricity transmission capability and operability in our Future Energy Scenarios (FES), Ten Year Statements (ETYS and GTYS), Network Options Assessment (NOA), gas Future Operability Planning (FOP) and electricity System Operability Framework (SOF) publications. To help shape these publications, we seek your views and share information across the energy industry that can inform debate.
The Gas Ten Year Statement (GTYS) describes in detail what and where entry and exit capacity is available on the gas National Transmission System (NTS). The GTYS provides an update on projects we are currently working on. It also provides our view of the capability requirements and network development decisions that will be required for the NTS over the next ten years. If you are interested in finding out more about the longer-term view of gas capability and operability, please consider reading our Future Energy Scenarios (FES), and gas Future Operability Planning (FOP) publications.
The Electricity Ten Year Statement (ETYS) tests the FES against models of the GB National Electricity Transmission System (NETS) to identify potential transmission requirements. If you are interested in finding out about the network investment recommendations that we believe will meet these requirements across the GB electricity transmission network, please consider reading Network Options Assessment (NOA). You can find out more about the longer-term view of electricity capability and operability by reading our Future Energy Scenarios (FES) and System Operability Framework (SOF) publications.
National Grid has an important role to play in leading the energy debate across our industry and working with you to make sure that together we secure our shared energy future.
Electricity Ten Year Statement November 2016 03

The Network Options Assessment (NOA) builds upon the future capacity requirements described in ETYS and presents the network investment recommendations that we believe will meet these requirements across the GB electricity transmission network. If you are interested in finding out more about electricity capability and operability, please consider reading our Future Energy Scenarios (FES), Electricity Ten Year Statement (ETYS), and System Operability Framework (SOF) publications.
Our gas Future Operability Planning (FOP) publication describes how changing requirements affect the future capability of the NTS out to 2050. It also considers how these requirements may affect NTS operation and our processes. The FOP may highlight a need to change the way we respond to you or other market signals. This, in turn, may lead us to modify our operational processes and decision making. This publication helps to make sure we continue to maintain a resilient, safe and secure NTS now and into the future. If you are interested in finding out more about the longer-term view of gas capability and operability, please consider reading our Future Energy Scenarios (FES) and Gas Ten Year Statement (GTYS).
The System Operability Framework (SOF) uses the Future Energy Scenarios to examine future requirements for the operability of GB electricity networks. It describes developments in operational needs and provides information that can help towards developing new technology, codes and solutions that improve system operability. If you are interested in finding out more about the longer-term view of electricity capability and operability, please consider reading our Future Energy Scenarios (FES), Electricity Ten Year Statements (ETYS) and Network Options Assessment (NOA) publications.
Executive summary
Electricity Ten Year Statement November 2016 04

Key messages
1. In the years to come, the NETS will potentially face network capacity deficits on a number of its boundary regions due to the following factors:
An increasing amount of large wind generation connecting to the Scottish networks, consequentially increasing transfer requirements from Scotland into England.
Large growth in low carbon generation and interconnectors in the northern England region, consequentially increasing export requirements into the English Midlands.
Reducing conventional generation capacity in the Midlands, particularly the West Midlands, compared with the present level. Therefore, the West Midlands will have to import more power from distant regions.
Unprecedented growth in generation coming from offshore wind on the east coast, connecting to the East Anglia region. Transfer of power from this region to the wider southern NETS will risk stressing this region of the network; and
Interconnections coming in and placing increased stress on the southern English network when these interconnectors export power out of Great Britain.
2. The potential network capacity deficits identified in the ETYS 2016 will undergo the NOA process. From this, the SO preferred options and investment recommendations will be published in January 2017, in the NOA2 report. This process will be similar to the last NOA process, NOA1, which used the results from the ETYS 2015:
For NOA1, we assessed more than seventy Great Britain transmission system investment options. Of these, thirteen were identified through the NOA1 cost– benefit analysis as requiring a decision in 2016. We recommended proceeding with developing eight and delaying five of these investments.
We considered what was really necessary to invest. As a result of our decision we recommended delaying five projects that may have committed £33 million of capital expenditure in 2016.
3. Given the changing energy landscape in which fossil fuelled generation closures are leading to increased reliance on intermittent generation, we’re ensuring the NETS continues facilitate demand security:
We have investigated future situations when intermittent generation may not be available, so that we can make sure that the transmission network does not put demand supply at risk due to insufficient network capacity. We have found that increased south-to-north network capacity could be required to meet all the demand in northern England and Scotland.
Using the 2016 future energy scenarios, we have assessed the National Electricity Transmission System’s (NETS’s) present boundary capabilities against their future requirements. Below, we’ve provided a summary of the main findings from our analysis.
Electricity Ten Year Statement November 2016 05

Electricity Ten Year Statement November 2016 06

Chapter oneIntroduction 08
Electricity Ten Year Statement November 2016 07

C
hapt
er o
ne
This is our fifth ETYS, which we produce in our role as the GB System Operator (SO), with input from the Transmission Owners (TOs) in Scotland (SHE Transmission and SP Transmission), and in England and Wales (the TO business within National Grid).
We publish it for you, our stakeholders, and we want to continue developing it in response to your feedback.
We sought your views on the publication in April 2016 and, as a result, have made further changes. For example, we have included a case study that describes the year-round work we’re doing to look at technical challenges associated with the future planning of the transmission network.
Also, following the split of previous ETYS editions into two standalone documents (the System Operability Framework (SOF) and the Network Options Assessment (NOA) report) we have included information to explain clearly how these documents complement each other.
We hope the changes we’ve made meet your expectation for the ETYS.
Introduction
The Electricity Ten Year Statement (ETYS) presents National Grid’s view as the System Operator (SO) about the future transmission requirements and the current capability of bulk power transfer on the Great Britain (GB) National Electricity Transmission System (NETS). This is a significant part of our annual network planning process because through it we identify the requirements that inform the Network Options Assessment (NOA) process.
Electricity Ten Year Statement November 2016 08

C
hapter one
Also in our role as SO, we assess and make appropriate recommendations about reinforcing the NETS. This is so we can meet our customers’ requirements in an economic and efficient way. We do this in three stages. The first stage starts with establishing the future energy scenarios of electricity, published in the FES in early July this year. The ETYS is the second stage, with the NOA report being the final stage.
The ETYS complements the NOA report, because information about future NETS requirements and current capability described in the ETYS directly feed into the analysis required to produce the NOA report. This relationship ensures the development of projects at the right time, which is essential for the long-term planning of the NETS. The NOA report reviews a variety of options for developing the network to meet the range of potential requirements presented in the ETYS.
In March this year the NOA12 recommended options to develop the NETS based on requirements shown in ETYS 2015. This included a recommended investment of £28 million for NETS development projects that have a total projected value of £2.2 billion over their lifetime. It further recommended delaying five projects which may have committed £33 million of spend in 2016 according to our scenario-based ‘single year least regret’ analysis. The NOA2 report, due in January 2017, will use this year’s ETYS findings in order to present updated recommendations.
In summary, the ETYS helps us communicate on what we expect to see, as to the future requirements of bulk power transfer capability. The NOA report makes recommendations on the SO’s preferred investment options to meet the future transfer requirements.
The NOA also considers arrangements for the development of cross-border (including interconnections with mainland Europe) electricity transmission networks. So, we need to consider the relationship between the ETYS-NOA and the European-wide transmission development described in the ten-year network development plan (TYNDP).
1.1 ETYS and the NOA
The ETYS has changed following Ofgem’s Integrated Transmission Planning and Regulation1 (ITPR) initiative. Its new purpose is to publish information about expected transmission capability requirements of the GB NETS.
1 www.ofgem.gov.uk/electricity/transmission-networks/integrated-transmission-planning-and-regulation2 www2.nationalgrid.com/UK/Industry-information/Future-of-Energy/Network-Options-Assessment/
Electricity Ten Year Statement November 2016 09

C
hapt
er o
ne
Introduction
Although TYNDP and ETYS-NOA all highlight the future of energy networks, there are important differences that separate them. Firstly, the TYNDP is produced every two years, whereas the ETYS and NOA are produced annually. The TYNDP focuses on pan-European projects with the analysis being conducted by European regional groups. The submitted information and analysis is updated every two years. Therefore, there will always be a two-year time lag in respect of the scenario data (termed as ENTSO-E’s energy visions data) and reinforcement options used, compared with the ETYS and NOA.
Finally, different projects qualify for inclusion within each document. In the TYNDP, the list of projects includes the chosen preferred option from NOA, as well as other projects that meet additional criteria of the TYNDP, such as security of supply or market coupling benefits.
You can find more information about the TYNDP at http://tyndp.entsoe.eu/
1.2 ETYS-NOA and TYNDP
The Ten-Year Network Development Plan (TYNDP) is published in accordance with Regulation (EC) 714/2009. The regulation sets out how the European Network of Transmission System Operators for Electricity (ENTSO-E) produces the community-wide TYNDP every two years. The next publication is due in December 2016.
Electricity Ten Year Statement November 2016 10

C
hapter one
Power systems are designed to be both operable (i.e. stable) and capable (i.e. adequate) to transmit power to consumers. The operability of power systems is a complex function of generator technology characteristics and NETS characteristics. The SOF considers this complex function in determining how operable the power system will be in light of the changing mix and distribution of generation technologies across the NETS. So while the SOF focuses on evaluating the operability of the NETS, the ETYS evaluates the NETS’s capability to transmit power.
As a common point, however, both the ETYS and the SOF rely on the Future Energy Scenarios to develop credible generation and demand backgrounds. These are used to influence their respective analyses.
1.3 ETYS and the SOF
In 2015, we produced the SOF3 for the first time as a standalone document. Previously, it had been published as part of the ETYS. This meant that the SOF would be able to provide a more focused and detailed long-term view about the operability of the GB NETS.
3 www2.nationalgrid.com/UK/Industry-information/Future-of-Energy/System-Operability-Framework/
Electricity Ten Year Statement November 2016 11

C
hapt
er o
ne
Introduction
We hope you will benefit from the changes we’ve made to the ETYS 2016 and its sister publications, the NOA, FES and SOF.
You told us you wanted easy and quick access to relevant, user-friendly information. So, we developed a Customer Connection Interface Tool (CCIT). Through this tool, you can view details about current and future generation
connections, sites and development times in the NETS. The latest version of the tool (published alongside the ETYS 2016) provides information about the substations we manage in England and Wales. We are developing it in stages, so we can make sure that it continues complementing the ETYS in the future. This tool can be accessed at www.nationalgrid.com/etys.
1.4 Improving your experience
We have been keen to hear your views as we continue developing the ETYS. This year, we were able to gather feedback from you through face-to-face interactions at our electricity customer seminars, as well as from correspondence sent to our ETYS email address.
Electricity Ten Year Statement November 2016 12
Cha
pter
tw
o
Chapter twoNetwork development inputs 14
Electricity Ten Year Statement November 2016 13

Cha
pter
tw
o
Network development inputs
We are able to produce credible future energy scenarios with the involvement of our stakeholders from across the energy sector and beyond. Our 2016 scenarios have been created following a significant amount of data collection and stakeholder engagement activity.
Our various engagement activities provide an opportunity for our stakeholders to get involved in a way that suits them, including workshops, webinars and bilateral meetings. We then analyse the feedback we have received and use it to influence the development of our scenarios.
We have continued to evolve and improve our stakeholder engagement activities. This year, we have consulted 362 organisations, up by 129 since last year.
Most of the feedback we received on our 2015 scenarios was highly positive. Overwhelmingly our stakeholders told us that they want to see consistency year on year in the FES. This has reaffirmed our approach to FES 2016 and there are no significant changes to our scenarios this year.
We submitted our stakeholder feedback report to Ofgem in January 2016. Following its review, Ofgem told us it was provided with sufficient comfort that we had taken a wide range of views into account. Following this, we carried out detailed analysis and modelling to produce the scenarios described in the FES.
To identify the future transmission requirements needed on the National Electricity Transmission System (NETS) we must first understand the potential future power demand (active and reactive) and generation that may connect to the network. We do this by initially analysing our future energy scenarios, which present a potential envelope of power demand and generation. Then, by applying the industry planning standard, we use these scenarios as a basis for shaping our NETS planning.
Electricity Ten Year Statement November 2016 14

Chapter tw
o
2.1Future energy scenarios
Our 2016 scenarios are once again an evolution from the previous year. We have continued to use the 2X2 matrix, with axes of ‘green ambition’ and ‘prosperity’ to structure our scenarios. We have also continued using the names Gone Green, Slow Progression, No Progression and Consumer Power.
Figure 2.1 provides an overview of each of the scenarios. You can find more information about the 2016 Future Energy Scenarios on our website1.
Figure 2.1The 2016 scenario matrix
Slow ProgressionSlow Progression is a world where economic conditions limit society’s ability to transition as quickly as desired to a low-emissions world. Choices, for residential consumers and businesses, are restricted, yet a range of new technologies and policies do develop. This results in some progress towards decarbonisation but at a slower pace.
Consumer PowerConsumer Power is a market-driven world. High levels of prosperity allow for high investment and innovation, with limited government intervention. New technologies are prevalent and focus on the desires of consumers over and above emissions reductions.
No ProgressionNo Progression is a world where business as usual activities prevail. Society is focused on the short-term, concentrating on security of supply and affordability over and above green ambition. Traditional sources of gas and electricity continue to dominate, with little innovation altering how energy is used.
Gone GreenGone Green is a world where policy interventions and innovation are both ambitious and effective in reducing greenhouse gas emissions. The focus on long-term environmental goals, high levels of prosperity and advanced European harmonisation ensure that the 2050 carbon reduction target is achieved.
Green ambition
Pro
sper
ity
1 www.fes.nationalgrid.com/fes-document/
Mor
e m
oney
Less
mon
ey
avai
labl
e
Less focus More focus
Electricity Ten Year Statement November 2016 15

Cha
pter
tw
o
2.2Applying the future energy scenarios in system planning
2 www2.nationalgrid.com/uk/industry-information/electricity-codes/sqss/the-sqss/
Earlier in this chapter we discussed the content of the future energy scenarios at a high level. We apply the scenario data to the NETS network models so that we can analyse the network and assess its performance. In this section we describe how we do this.
Network development inputs
2.2.1Application of demand data
2.2.2Application of generation data
The future energy scenarios demand backgrounds provide us with forecast average cold spell (ACS) peak demand. To facilitate the planning analysis, we group data by zones
according to their geographic distribution and the network topology. This way all the national electrical demand connected to the NETS is represented.
The NETS Security and Quality of Supply Standard (SQSS)2 outlines the dual criteria (security and economy) method that we use to form the system capability requirement based on generation and demand data – there is more detail about it in Chapter 3.
Here we focus on how the generation data is applied in our assessment to meet national ACS peak demand.
Electricity Ten Year Statement November 2016 16

Chapter tw
o
2.2.2aSecurity criterion
The security criterion requires us to ensure that the NETS’s dispatchable generation scenario predominantly comes from conventional generation plant. This generation dispatch scenario, according to the SQSS, is necessary to assess whether the NETS is capable of supplying demand at times when intermittent low-carbon generation and interconnectors are not available.
To set up the security generation scenario, we start by checking if we need to trim the total generation connected to the NETS to below 120% of the total ACS demand. The 120% is the amount determined appropriate to ensure adequate generation margin. We trim the total generation capacity to 120% by applying a ranking order to help identify the generation units that are most likely to operate and meet 100% ACS peak demand and those which are most likely to provide 20% reserve.
We apply the ranking order considering both future and existing generation.
For existing generation, we apply appropriate ranks, by looking at how the unit operated during the previous two winter periods (beginning of December to the end of January). The method described for ordering plant in terms of operational history is supported by our experiential judgement and market intelligence. For example, a plant may have achieved a low ranking based on the previous winter’s operational data but it could be that this was down to a unique set of circumstances that are unlikely to be repeated in the future (for example, a plant that has been mothballed but market intelligence suggests it may return in the future). So plant rankings may be revised, to make them more realistic for planning purposes.
For future plant, we apply appropriate ranks, by considering the fuel type of the unit. We assume that low-carbon plant is more likely to operate as baseload, and that new thermal plant is likely to be more efficient than existing thermal generation so we give it a higher ranking.
The ranking order we use to determine the operation of future plant is shown in table 2.1.
Rank Fuel type
1 Hydro tranche 1
2 Nuclear (new)
3 Hydro tranche 2
4 Hydro tranche 3
5 Nuclear (existing)
6 CCS
7 Biomass
Rank Fuel type
8 Gas thermal (new)
9 Storage (new)
10 Existing plant per operation calculation and hydro tranche 4 and existing pumped storage
11 Gas turbines
Table 2.1 Ranking order
Electricity Ten Year Statement November 2016 17

Cha
pter
tw
o
2.2.2bEconomy criterion
The economy criterion requires us to ensure that the NETS’s generation scenario predominantly comes from low-carbon generation and interconnectors. This generation dispatch scenario, according to the SQSS, is necessary to ensure an economically efficient transmission capacity is maintained without undue constraint.
To set up the dispatch scenario which represents the economy criterion, we use three categories for generation units: non-contributory, directly scaled and variably scaled. Non-contributory plants, like open cycle gas turbines (OCGTs), are not included in the dispatched generation background. Directly scaled plants, like wind and nuclear, are included in the dispatch scenario using the scaled dispatch factors as specified by the SQSS (and shown in table 2.2 below). Finally we use variably scaled plants to maintain the balance of demand and generation.
This dual-criteria approach allows us to assess the system capability requirement in order to maintain security of supply and facilitate the generation market to operate in the most economic and efficient way.
Chapter 3 explains how we use this dual-criteria approach to determine network capability and regional requirements.
Table 2.2 List of directly scaled plants and the associated scaling factors
Fuel type Scaling factor
Interconnectors importing to GB 100%
Nuclear 85%
Coal-fired stations fitted with CCS 85%
Gas-fired stations fitted with CCS 85%
Wind 70%
Tidal/wave 70%
Pumped storage 50%
Network development inputs
Electricity Ten Year Statement November 2016 18

Chapter tw
o
2.3Interconnector information
The number of interconnectors and total interconnector capacity from FES 2016 has increased compared to FES 2015. This is due to greater regulatory certainty as a result of Ofgem’s cap and floor regime for interconnectors. At times of high GB demand interconnector import to GB is expected to be greater than in previous years. The 2016 FES also suggests that we may see connection to more countries than before, through a diverse spread of connection points.
Current and planned interconnectionYou can find the up-to-date details of transmission contracted interconnectors from the interconnector TEC Register page: www2.nationalgrid.com/UK/Services/Electricity-connections/Industry-products/TEC-Register/.
Further projects have applied for Projects of Common Interest (PCI) status under the EU’s Trans-European Networks (Energy) (TEN-E) regulations. Other projects are already in the public domain, such as in the Ten-Year Network Development Plan (TYNDP). These are set out in Table 2.3 on page 203.
Similar to our approach to the transmission generation backgrounds, we have made assumptions about the connection timescales. Again, we consider a range of factors, including planning consent, contractual connect dates, environment legislation and up-to-date market intelligence.
3 http://ec.europa.eu/energy/infrastructure/pci/doc/2013_pci_projects_country.pdf
Electricity Ten Year Statement November 2016 19

Cha
pter
tw
o
Table 2.3 Interconnectors
Name Owner(s) Connects to Capacity Key Dates
Operational Interconnectors
IFA NGIL and RTE France 2000 MW Operational since 1986
Moyle NI Energy Holdings
Northern Ireland 450 MW to NI (295 MW to GB)
Operational since 2002
BritNed NG and TenneT The Netherlands 1200 MW Operational since 2011
EWIC Eirgrid Ireland 505 MW Operational since 2012
Contracted Interconnectors
ElecLink ElecLink Ltd France 1000 MW Contracted 2016
Nemo NGIL and Elia Belgium 1000 MW Contracted 2018
NSN NGIL and Statnett
Norway 1400 MW Contracted 2019
IFA 2 NGIL and RTE France 1000 MW Contracted 2019
FABLink FabLink Ltd France 1400 MW Contracted 2020
Aquind Aquind Ltd France 2000 MW Contracted 2020
Viking Link NGI Holdings Denmark 1000 MW Contracted 2022
NorthConnect Agder Energi, E-CO, Lyse, & Vattenfall AB
Norway 1400 MW Contracted 2021
Network development inputs
Electricity Ten Year Statement November 2016 20

Chapter tw
o
Table 2.3 Interconnectors (cont.)
Projects of Common Interest or TYNDP Projects (applied for PCI status or pre-feasibility studies)
Name 2016 TYNDP Project Reference
PCI Ref Capacity Connects to
Nemo 74 1.1.1 1000 MW Belgium
Belgium-GB-2 121 1.2 1000 MW Belgium
IFA 2 25 1.7.2 1000 MW France
FABLink 153 1.7.1 1400 MW France
ElecLink 1005 1.7.3 1000 MW France
IceLink 214 1.13 1000 MW Ireland
Greenwire 185 1.9.1 3000 MW Ireland
Codling Park None 1.9.2 and 1.9.3 500-1000 MW Ireland
Energy Bridge None 1.9.4, 1.9.5 and 1.9.6
5000 MW Ireland
Irish-Scottish Isles
189 2.13.1 and 2.13.2 1200 MW Northern Ireland
NSN 110 1.10 1400 MW Norway
NorthConnect 190 1.10 1400 MW Norway
Viking Link 167 1.14 1000 MW Denmark
Second Interconnector
121 None 1000 MW Belgium
New GB-France Interconnector
None None 1000 MW France
New GB-Netherlands Interconnector
None None 1000 MW The Netherlands
Electricity Ten Year Statement November 2016 21

Cha
pter
tw
oElectricity Ten Year Statement November 2016 22

Chapter three
Chapter threeThe electricity transmission network 24
Electricity Ten Year Statement November 2016 23

Cha
pter
thre
e
The electricity transmission network
3.1Introduction
As the GB energy landscape continues to change, the NETS will face significant challenges. The transmission network must respond and adapt so that it can continue to transport power from source to demand safely and reliably. To make sure we develop the network in an efficient, coordinated and economic way, we must first understand the NETS’s future requirements and its present capability.
1 Please note that these boundaries will be reviewed annually and updated as appropriate.2 www2.nationalgrid.com/UK/Industry-information/Electricity-codes/System-Security-and-Quality-of-Supply-Standards/
When we assess future requirements, we need to bear in mind that we have a large number of signed contracts for new generation to connect to the NETS. In addition, the development of interconnectors connecting Great Britain to the rest of the Europe will have a big impact on future transmission requirements.
In our experience it is unlikely that all customers will connect exactly as contracted today. We cannot know exactly how much and when generation will close and new generation will connect, so we use our future energy scenarios to help us decide on credible ranges of future NETS requirements and determine capability. This is done using the system boundary concept. It helps us to calculate the NETS’s boundary capabilities and the future transmission requirements of bulk power transfer capability. The transmission system is split by boundaries1 that cross important power-flow paths where there are limitations to capability or where we expect additional bulk power transfer capability will be needed. We apply the SQSS2 to work out the NETS boundary requirements.
In this chapter we describe the NETS characteristics. We also discuss each of the NETS boundaries, grouped together
by region, to help you gain an overview of the total requirements. In this chapter we provide analysis to show you how, and when in the years to come, the NETS will potentially face network capacity deficits on a number of its boundary regions. We will show you that presently the majority of NETS boundaries have sufficient capability margins to transfer power from where it is generated to where it is demanded.
Historically, the NETS has been designed to support heavy north-to-south power flows. However, with the huge scale generation change which is taking place, it is expected that the NETS will need to ensure that it’s equally capable of facilitating heavy south-to-north flows. We will present a case study of this analysis and a discussion on how future changes in generation and demand scenarios are likely to influence the potential need for future reinforcement to ensure the NETS’s all round capability.
The results presented in this chapter will be used in the NOA2 as part of the assessment of the SO’s preferred reinforcement options and recommendations to address the potential future NETS boundary capacity deficits.
Electricity Ten Year Statement November 2016 24

Chapter three
3.2NETS background
The NETS is mainly made up of 400kV, 275kV and 132kV assets connecting separately owned generators, interconnectors, large demands and distribution systems. As the SO we are responsible for managing system operation of the transmission networks in England, Wales, Scotland and offshore.
3 www.ofgem.gov.uk/system/files/docs/2016/09/electricity_registered_or_service_addresses_new_0.pdf
The ‘transmission’ classification applies to assets at 132kV or above in Scotland or offshore. In England and Wales transmission relates to assets at 275kV and above.
National Grid owns the transmission network in England and Wales. The transmission network in Scotland is owned by two separate transmission companies: SHE Transmission in the north of Scotland and SP Transmission in the south of Scotland. The offshore
transmission systems are also separately owned. Eight licensed offshore transmission owners (OFTOs)3 have been appointed through the transitional tendering process. They connect operational offshore wind farms that were given Crown Estate seabed leases in allocation rounds 1, 2 and 3.
Electricity Ten Year Statement November 2016 25
Cha
pter
thre
e
3.3NETS boundaries
To provide an overview of existing and future transmission requirements, and report the restrictions both present and future that we may see on the NETS, we have developed the concept of boundaries. A boundary splits the system into two adjacent parts, crossing critical circuit paths that carry power between the areas where power flow limitations may be encountered.
The transmission network is designed to ensure that there is enough transmission capacity to send power from areas of generation to areas of demand.
Limiting factors on transmission capacity include thermal circuit rating, voltage constraints and/or system stability. Each factor is assessed to determine the network capability. In this publication, the main focus of our analysis is on thermal and voltage issues. Where there are known stability issues, these are reflected in the analysis presented in this report. The base capability of each boundary in this document refers to the winter 2016/2017 capability.
Defining the NETS boundaries has taken many years of transmission operation and planning experience. The NETS boundaries have developed around major sources of generation, significant route corridors and major demand centres. A number of recognised boundaries are regularly reported for consistency and comparison purposes. When significant transmission system changes occur, new boundaries may be defined and some existing boundaries either removed or amended (an explanation will be given for any changes).
GB NETS boundary mapFigure 3.1 shows all the boundaries we have considered for our ETYS analysis. Over the years we have continuously developed the transmission network to ensure there is sufficient transmission capacity to effectively transport power across the country. As a result of network development, some boundaries are now not reported due to them becoming redundant. In our boundary capability results section, we highlight only the boundaries that are more likely to require further future development to satisfy future NETS requirements.
To help describe related issues we have grouped the boundaries into regions as shown in Figure 3.2.
The electricity transmission network
Electricity Ten Year Statement November 2016 26

Chapter three
Figure 3.1 GB NETS boundaries
To France
To Netherlands
To Ireland
To Northern Ireland
East Anglia
Hornsea
Dogger Bank
Firth of Forth
Moray Firth
Rampion
Connah’s Quay
Middleton
Linnmill
Moffat
Fallago
GalashielsGalashiels
Hawick
Harestanes
Kinlochleven
Tummel Bridge
400kV Substations275 kV Substations132kV Substations
Major Generating Sites Including Pumped Storage
Connected at 400kVConnected at 275 kVHydro Generation
Interconnectors
System Boundaries
Errochty
Tummel
Denny
Crossaig
Corriemoillie
Cashlie
400kV Circuits275kV Circuits220kV Circuits132kV Circuits
SuttonBridge
New Cumnock
Black Law Extension
Hadyard
Kilgallioch
CumbernaldBainsford
Auchenwynd
Robin Rigg
Barrow
Ormonde
Rhyl Flats
Burbo Bank
Kentish Flats
Gunfleet Sands I&II
London Array
Gwynt y Mor
Thanet
Walney I & II
Greater Gabbard 500MW
West of Duddon
Westermost Rough
Humber Gateway
Sheringham Shoal
Greater Gabbard 2nd part
North Hoyle
Lynn
Inner Dowsing
Triton Knoll
Lincs
Race Bank Dudgeon
Teesside
Scroby sands
B4
B5
B4
B5
EC1
B6
B6B7
B7
B11
B11 B16
B16
B7a
B7a
NW1
NW2NW3
NW4
B8
B8
B9
B17
B9B12
B12SC1
B10B15
B13
B13
B10 EC5
EC5
SC1
B15
EC3
B2
B2
B1
B1
B0
B0
SW1
SW1
B1a
B1aB2a
B2a
Penn
PyleIver
Drax
Fleet
Abham
GrainHurst
Wylfa
Blyth
Sundon
Legacy
Stanah
Pentir
Kirkby
Hutton
Walham
Pelham
Harker
Elland
Keadby
MargamWarley
Norton
Cowley
Bolney
Rassau
Minety
Exeter
Fawley
Didcot
Cottam
Seabank
Taunton
Kitwell
Kemsley
Whitson
Laleham
Walpole
Grendon
Padiham
Rugeley
Deeside
Rowdown
Norwich Main
Heysham
Enderby
NinfieldLovedean
Bramford
Bredbury
Nursling
Drakelow
Pitsmoor
NeepsendAldwarke
Sizewell
Melksham
Thornton
Offerton
Aberthaw
Rochdale
Hartmoor
Pembroke
Landulph
Rye House
Sellindge
Tynemouth
Wymondley
Feckenham
Poppleton
Cilfynydd
Axminster
Bridgwater
Bicker Fen
Staythorpe
Mannington
Ffestiniog
Spennymoor
Penwortham
Osbaldwick
Shrewsbury
Willington
Chickerell
Cellarhead
EatonSocon
Creyke Beck
Trawsfynydd
Grimsby West
Chesterfield
Burwell Main
Alverdiscott
Langage
Indian Queens
Hinkley Point
Dinorwig
Rainhill
Capenhurst Frodsham
WashwayFarm
South Manchester
Carrington
DainesFiddlersFerry
Macclesfield
Kearsley Whitegate
Stalybridge
Dungeness
CanterburyNorth
Braintree
WalthamCross
Swansea North
Baglan Bay
CardiffEast
Tremorfa
Alpha SteelUpper Boat Uskmouth
ImperialPark
Iron Acton
Marchwood
Botley Wood
Bramley
Culham
Quernmore
Coventry
Nechells
Willenhall Bustleholm
Hams Hall
BerkswellOldbury
Bishops Wood
Ironbridge
Ocker Hill
SpaldingNorth
PatfordBridge
Ferrybridge Eggborough
ThorpeMarsh
Thurcroft
Brinsworth
HighMarnham
TempleboroughWestMelton
Norton LeesJordanthorpe
Sheffield City
Winco BankStocksbridge West
Burton
SaltendNorth
Saltend South
SouthHumberBank
BradfordWest Kirkstall Skelton
Grange MonkFryston
KillingholmeHumber Refinery
East Claydon
Rayleigh Main
Coryton
SinglewellKingsnorth
Littlebrook
WimbledonBeddington
Chessington
West Weybridge
St JohnsWood
EalingWillesden
Watford Elstree
Tottenham Redbridge
Barking
LeightonBuzzard
Amersham Main
TilburyCity Rd
NewCross
Hackney
Brimsdown
South ShieldsWest Boldon
Hawthorne Pit
HartlepoolTod Point
Grangetown Greystones
Lackenby
Stella West
Fourstones
Sloy
Shin
Orrin
Aigas
Quoich
Lochay
Foyers
Rannoch
Glenlee
Clachan
Cassley
Tongland
Errochty
Fasnakyle
Invergarry
Brora
Elgin
Keith
Eccles
Beauly
Thurso
Tealing
Torness
Kintore
Mybster
Dunbeath
Arbroath
Port Ann
Dalmally
Dounreay
LongannetCockenzie
Inveraray
Carradale
Peterhead
Hunterston
St. Fergus
Auchencrosh
Blackhillock
Fort Augustus
KilmarnockSouth
Alness
Nairn
MossfordGrudie Bridge
Macduff
Dingwall
Inverness
Lairg
Luichart
DeanieCulligran
Kilmorack
Boat ofGarten
Broadford
Dunvegan
Stornoway
Harris
TaynuiltCruachan
Whistlefield
Nant
Fort William
Killin Finlarig
Errochty Power Station
Clunie
Fraserburgh
DycePersley
Willowdale
Clayhills
Redmoss
Fiddes
TarlandCraigiebuckler
WoodhillGlenMorrison
Caennacroc
DudhopeMilton of Craigie
Glenagnes
Lyndhurst
CharlestonBurghmuir
Glenrothes
Westfield
Dunoon
AyrCoylton
Maybole
Coalburn
Elvanfoot
Carsfad
Earlstoun
Chapelcross
GretnaDumfries Ecclefechan
Berwick
SCOTTISH HYDRO-ELECTRICTRANSMISSION
St. Fillans
DunbarInverkeithing
Dudhope
NewtonStewart
Glenluce
SP TRANSMISSION LTDSaltcoats
Meadowhead
Kilwinning
Kaimes
PortobellloShrubhill
MossmorranGlenniston
Redhouse
Leven
Cupar
Currie
GorgieTelford Rd.
Livingston
Bathgate
Grangemouth
DunfemlineKincardineDevonside
Stirling
Bonnybridge
Easterhouse
Newarthill
WishawBlack LawStrathaven
Clydes Mill
EastKilbrideSouth
BusbyWhitelee
KilmarnockTown
Neilston
ErskineDevolMoor
Helensburgh
StrathlevenSpangoValley
LambhillBroxburn
West Ham
NorthfleetEast
West Thurrock
Windyhill
Stoke Bardolph
Bushbury
Bodelwyddan
Knaresborough
Saltholme
Hedon
Clyde (South)
Clyde (North)
Kendoon
Marshall Meadows
Whitelee Extn
SmeatonCoatbridge
Inverarnan
Whitehouse
Knocknagael
Crystal Rig
Dunlaw Extension
To Ireland
Ratcliffeon Soar
Cleve Hill
Mill Hill
Markhill
Arecleoch
Glendoe
Rocksavage
Ardmore
Strichen
North
Hunterston
HunterstonEast
Necton
B14
B3b
B3b
SC2
SC2
Electricity Ten Year Statement November 2016 27

Cha
pter
thre
e
Figure 3.2 Regional map
The electricity transmission network
Electricity Ten Year Statement November 2016 28

Chapter three
Determination of NETS boundary present capability and future requirements We use the SQSS to both determine boundary capability and future requirements. We determine NETS’s boundary capability and future requirements across two types of boundaries: local and wider.
Local boundaries – are those drawn around small areas of the NETS where a lack of generation diversity produces a high probability of stressing the local transmission network due to coincidental generation operation. Against this generation and demand background the NETS’s current capability and future requirements are established according to the SQSS.
Wider boundaries – are those drawn around large areas of the NETS where there is a lot of generation diversity. In our capability and future requirement assessment of wider system boundaries we apply both the security and economy criteria, as defined in the SQSS. These criteria take into account both the geographical and technological effects of generation. This allows for a more robust capability and requirements assessment of the NETS.
The security criterion – evaluates the NETS’s boundary transfer requirements when demand is met with low reliance on intermittent generators or imports from interconnectors. Against this generation and demand background the NETS’s present capability and future requirements are established according to the SQSS Appendices C and D. As we move into a low carbon economy, the energy landscape will change. The existing criteria set by the NETS SQSS is being reviewed as part of the SQSS review group activity with a mind to update the standard to reflect developments in generation, demand and interconnectors.
The economy criterion – defines the NETS’s boundary transfer requirements when demand is met with heavy reliance on intermittent and low-carbon generators and imports from interconnectors. Against this generation and demand background the NETS’s present capability and future requirements are established according to the SQSS Appendices E and F.
Electricity Ten Year Statement November 2016 29

Cha
pter
thre
e
Interpreting the boundary graphsWhen presenting the required transfers and present capability results for the NETS boundaries, it is not practical to show everything at once. This is because there would be extensive overlapping of results and far more information than could be displayed clearly. So we have simplified the boundary graphs using the style shown in Figure 3.3. In this figure the varying plots are illustrative of the future transfer requirements from our four future energy scenarios – both from last year and this year. The grey horizontal line represents the present MW capability of the boundary as shown in the y-axis. On the x-axis the year refers to the winter peak of that year.
For example 2016 represents December 2016 – February 2017.
For most boundaries, in which both the security and economy criteria have a boundary required transfer in the same direction a single graph is shown with one requirement line for each Future Energy Scenario. Each point in each single scenario line is the largest magnitude value of both the economy and security criteria.
For boundaries in which the economy and security criteria can produce boundary flows in different directions two separate graphs are shown. This mostly applies to the North of England and Scottish boundaries.
Figure 3.3 Example of required transfer and base capability for a boundary
Stakeholder engagement If you have feedback on any of the content of this document please send it to [email protected], catch up with us at one of our consultation events or visit us at National Grid House, Warwick.
The electricity transmission network
Gone Green 2016Slow Progression 2016No Progression 2016Consumer Power 2016
Base CapabilityGone Green 2015Slow Progression 2015No Progression 2015Consumer Power 2015
GW
2
0
4
6
8
10
12
14
2016 2018 2020 2022 2024 2026 2028 2030 2032 2034 2036 2038 2040
Electricity Ten Year Statement November 2016 30

Chapter three
Figure 3.4 Scottish transmission network
3.4Network capability and requirements by region: Scottish boundaries
IntroductionThe following section describes the Scottish transmission networks up to the transmission ownership boundary with the England and Wales transmission network. The onshore transmission network in Scotland is owned by SHE Transmission and SP Transmission but is operated by National Grid as System Operator (SO). The Scottish NETS is divided
into B0, B1, B1a, B2, B2a, B3b, B4, B5 and B6 (the B6 boundary is shared with National Grid TO). The following boundary information has been provided by the two Scottish transmission owners. The figure below shows likely power flow directions in the years to come up to 2026. The arrows in the diagram are meant to illustrate power flow directions, but are not drawn to scale to reflect the magnitude of power flows.
To Northern Ireland
Firth of Forth
Moray Firth
Linnmill
Moffat
Fallago
GalashielsGalashiels
Hawick
Harestanes
Kinlochleven
Tummel Bridge
Errochty
Tummel
Denny
Crossaig
Corriemoillie
Cashlie
New Cumnock
Black Law Extension
Hadyard
Kilgallioch
CumbernaldBainsford
Auchenwynd
Blyth
Harker
Offerton
TynemouthSouth ShieldsWest BoldonStella West
Fourstones
Sloy
Shin
Orrin
Aigas
Quoich
Lochay
Foyers
Rannoch
Glenlee
Clachan
Cassley
Tongland
Errochty
Fasnakyle
Invergarry
Brora
Elgin
Keith
Eccles
Beauly
Thurso
Tealing
Torness
Kintore
Mybster
Dunbeath
Arbroath
Port Ann
Dalmally
Dounreay
LongannetCockenzie
Inveraray
Carradale
Peterhead
Hunterston
St. Fergus
Auchencrosh
Blackhillock
Fort Augustus
KilmarnockSouth
Alness
Nairn
MossfordGrudie Bridge
Macduff
Dingwall
Inverness
Lairg
Luichart
DeanieCulligran
Kilmorack
Boat ofGarten
Broadford
Dunvegan
Stornoway
Harris
TaynuiltCruachan
Whistlefield
Nant
Fort William
Killin Finlarig
Errochty Power Station
Clunie
Fraserburgh
DycePersley
Willowdale
Clayhills
Redmoss
Fiddes
TarlandCraigiebuckler
WoodhillGlenMorrison
Caennacroc
DudhopeMilton of Craigie
Glenagnes
Lyndhurst
CharlestonBurghmuir
Glenrothes
Westfield
Dunoon
AyrCoylton
Maybole
Coalburn
Elvanfoot
Carsfad
Earlstoun
Chapelcross
GretnaDumfries Ecclefechan
Berwick
SCOTTISH HYDRO-ELECTRICTRANSMISSION
St. Fillans
DunbarInverkeithing
Dudhope
NewtonStewart
Glenluce
SP TRANSMISSION LTDSaltcoats
Meadowhead
Kilwinning
Kaimes
PortobellloShrubhill
MossmorranGlenniston
Redhouse
Leven
Cupar
Currie
GorgieTelford Rd.
Livingston
Bathgate
Grangemouth
DunfemlineKincardineDevonside
Stirling
Bonnybridge
Easterhouse
Newarthill
WishawBlack LawStrathaven
Clydes Mill
EastKilbrideSouth
BusbyWhitelee
KilmarnockTown
Neilston
ErskineDevolMoor
Helensburgh
StrathlevenSpangoValley
LambhillBroxburnWindyhill
Clyde (South)
Clyde (North)
Kendoon
Marshall Meadows
Whitelee Extn
SmeatonCoatbridge
Inverarnan
Whitehouse
Knocknagael
Crystal Rig
Dunlaw Extension
Markhill
Arecleoch
Glendoe
Ardmore
Strichen
North
Hunterston
HunterstonEast
Electricity Ten Year Statement November 2016 31

Cha
pter
thre
e
Primary challenge statementScotland is experiencing large growth in renewable generation capacity in remote locations of the network.
Regional driversThe restrictions of the Scottish boundaries are often caused by the rapid increasing generation capacity leading to a deficit in Scottish boundary capacities. This rapid generation is mostly from renewable sources, mainly wind, connecting within Scotland. Across all future energy scenarios the fossil fuel generating capacity drops significantly, while interconnector capacity steadily increases.
By 2035, the scenarios (shown in Figure SD.1) suggest a total Scottish generating capacity of between 15 and 25 GW. This indicates increasingly dynamic Scottish network behaviour depending on factors such as weather condition and price of electricity. With demand in Scotland not expected to exceed 4.7 GW (shown in Figure SD.2) by 2035 which is much less than the Scottish generation capacity, the region is likely to export power south, out of Scotland into England, for a significant amount of time. At times of low renewable output Scotland may however need to import power from England.
The electricity transmission network
Electricity Ten Year Statement November 2016 32

Chapter three
Figure SD.1 Generation mix scenarios for the Scottish boundaries region
Figure SD.2 Gross demand scenarios for the Scottish boundaries region
Low carbon (including renewables) Fossil fuel Interconnectors and storageGone Green Slow Progression Consumer PowerNo Progression
0
30
20
10
25
15
5
2020 2025 2030 20352020 2025 2030 20352020 2025 2030 203520202015/16
2025 2030 2035
GW
Gone Green Slow Progression Consumer Power No Progression
0.0
2.0
5.0
4.0
3.0
1.0
GW
2015 2020 2025 2030 2035 2015 2020 2025 2030 2035 2015 2020 2025 2030 2035 2015 2020 2025 2030 2035
Electricity Ten Year Statement November 2016 33

Cha
pter
thre
e
The anticipated increase in renewable generation in Scotland is increasing power transfer across these boundaries. On a local basis, with the anticipated generation development in the north of Scotland there may be limitations on power transfer from generation in the remote Scottish NETS locations to the main transmission routes (B0, B1).
Furthermore, the area around Peterhead is experiencing significant activity with Moray Offshore Windfarm and North Connect interconnector contracted to connect alongside the existing CCGT station. Hence a local boundary assessment is required, to show potential for high generation output and interconnector import and the resulting network limitations (B2a).
The Argyll and the Kintyre peninsula is an area with significant renewable generation activity and low demand. Following completion of the Kintyre–Hunterston project, the Argyll and Kintyre network is no longer radial in nature and will therefore be considered as part of the Main Interconnected Transmission System (MITS) as it is now interconnected. The boundary covering this area is B3b.
As generation within these areas increases over time because of the high volume of new contracted renewable generation seeking connection in the SHE transmission area, boundary transfers across the Scottish NETS boundaries (B1, B1a, B2, B2a, B3b, B4 and B5) also increase. The present capability of some of these boundaries is insufficient to satisfy the boundary transfer requirements for the first few years under some future energy scenarios. This is because of generation being connected ahead of the required reinforcement, in accordance with the Connect and Manage access framework.
The potential future increase in renewable generation in Scotland is against a backdrop of recent closures or reduced capacity of convential generation at Longannet, Cockenzie Fife and Peterhead. This represents a 4.7 GW reduction in conventional generation plant in Scotland operating within the wholesale market since 2010. Consequently, from winter 2016/17 both Boundaries B5 and B6 have Planned and Required Transfer values with power flows from south to north, when assessed in accordance with the ‘Security Background’ criteria set out in the SQSS.
While the absolute magnitude of the south to north 'Security' transfers is lower than the north to south 'Economy' transfers, the transmission system requires to be secured for both.
The need for network reinforcement to address the above mentioned potential capability issues will be evaluated in the NOA2 cost–benefit analysis. Following the evaluation, the preferred reinforcements for the Scotland region will be recommended.
The electricity transmission network
Electricity Ten Year Statement November 2016 34

Chapter three
Figure B0.1 Geographic representation of boundary B0
Boundary B0 – Upper North SHE Transmission
Boundary B0 separates the area north of Beauly, comprising north Highland, Caithness, Sutherland and Orkney. The existing transmission infrastructure north of Beauly is relatively sparse.
The boundary cuts across the existing 275kV double circuit and 132kV double circuits
extending north from Beauly. The 275kV overhead line takes a direct route north from Beauly to Dounreay, while the 132kV overhead line takes a longer route along the east coast and serves the local grid supply points at Alness, Shin, Brora, Mybster and Thurso. The Orkney demand is fed via a 33kV subsea link from Thurso.
Moray Firth
Corriemoillie
B0
B0
Shin
Orrin
Aigas
Cassley
Fasnakyle
Brora
Elgin
Keith
Beauly
Thurso
Kintore
Mybster
Dunbeath
Dounreay
Peterhead
St. Fergus
Blackhillock
Alness
Nairn
MossfordGrudie Bridge
Macduff
Dingwall
Inverness
Lairg
Luichart
DeanieCulligran
KilmorackDunvegan
Stornoway
Harris
Fraserburgh
DycePersley
Knocknagael
Ardmore
Strichen
Electricity Ten Year Statement November 2016 35

Cha
pter
thre
e
Figure B0.2 Required transfer and base capability for boundary B0
Boundary requirements and capabilityFigure B0.2 above shows the required boundary transfers for B0 from 2016 to 2040. The boundary capability is currently around 250 MW.
The power transfer through B0 is increasing due to the substantial growth of renewable generation north of the boundary. This generation is primarily onshore wind, with the prospect of significant marine generation resource in the Pentland Firth and Orkney waters in the longer term.
All scenarios suggest that reinforcement of boundary B0 is required and the Caithness–Moray reinforcement project is presently being implemented to achieve this. This approved project is due for completion in 2018 and comprises an HVDC link between a new substation at Spittal in Caithness and Blackhillock in Moray, along with associated onshore reinforcement works. The onshore works include rebuilding the 132kV double circuit line between Dounreay and Spittal at 275kV, a short section of new 132kV line between Spittal and Mybster, new 275/132kV substations at Fyrish (near Alness), Loch Buidhe (to the east of Shin), Spittal (5km north of Mybster) and Thurso.
The electricity transmission network
Gone Green 2016Slow Progression 2016No Progression 2016Consumer Power 2016
Base CapabilityGone Green 2015Slow Progression 2015No Progression 2015Consumer Power 2015
GW
0.20.0
0.40.60.81.01.2
1.81.61.4
2016 2018 2020 2022 2024 2026 2028 2030 2032 2034 2036 2038 2040
Electricity Ten Year Statement November 2016 36

Chapter three
Figure B1.1 Geographic representation of boundary B1
Boundary B1 – North West SHE Transmission
Boundary B1 runs from the Moray coast near Macduff to the west coast near Oban, separating the north-west of Scotland from the southern and eastern regions. The area to the north and west of boundary B1 includes Moray, north Highland, Caithness, Sutherland, Western Isles, Skye, Mull and Orkney. The boundary crosses the 275kV double circuit running eastwards from Beauly, the 275/132kV interface at Keith and the new Beauly to Denny 400kV and 275kV double circuit running south from Fort Augustus.
Two key reinforcement projects have been recently completed to allow for the increasing requirement to export power across boundary B1. The Beauly to Denny reinforcement extends from Beauly in the north to Denny in the south, providing additional capability for boundary B1 as well as boundaries B1a, B2 and B4. The second project comprised the replacement of conductors on the 275kV line between Beauly, Blackhillock and Kintore with a higher rated conductor.
Firth of Forth
Kinlochleven
Tummel Bridge
Errochty
Tummel
Corriemoillie
Cashlie
B1Sloy
Orrin
Aigas
Quoich
Lochay
Foyers
Rannoch
Clachan
Errochty
Fasnakyle
Invergarry
Elgin
Keith
Beauly
Tealing
Kintore
Arbroath
Dalmally
Inveraray
Peterhead
St. Fergus
Blackhillock
Fort Augustus
Alness
Nairn
MossfordGrudie Bridge
Macduff
Dingwall
Inverness
Luichart
DeanieCulligran
Kilmorack
Boat ofGarten
Broadford
Dunvegan
TaynuiltCruachan
Nant
Fort William
Killin Finlarig
Errochty Power Station
Clunie
Fraserburgh
DycePersley
Willowdale
Clayhills
Redmoss
Fiddes
TarlandCraigiebuckler
WoodhillGlenMorrison
Caennacroc
DudhopeMilton of Craigie
Glenagnes
Lyndhurst
CharlestonBurghmuir
Glenrothes
Westfield
SCOTTISH HYDRO-ELECTRICTRANSMISSION
St. Fillans
Dudhope
Leven
Cupar
Devonside
Inverarnan
Knocknagael
Glendoe
Ardmore
Strichen
Electricity Ten Year Statement November 2016 37

Cha
pter
thre
e
Figure B1.2 Required transfer and base capability for boundary B1
Boundary requirements and capability Figure B1.2 above shows the required boundary transfers for B1 from 2016 to 2040. The boundary capability is currently around 1875 MW.
New renewable generation connections north of the boundary are expected to result in a significant increase in export requirements across the boundary (see Figure B1.2). All generation north of boundary B0 also lies behind boundary B1.
In all the scenarios there is an increase in the power transfer through B1 due to the large volume of renewable generation connecting to the north of this boundary (see Figure B1.2). Although this is primarily onshore wind and hydro, there is the prospect of significant
additional wind, wave and tidal generation resources being connected in the longer term. Contracted generation behind boundary B1 includes the renewable generation on the Western Isles, Orkney and the Shetland Isles as well as a considerable volume of large and small onshore wind developments. A large new pump storage generator is also planned in the Fort Augustus area. Some marine generation is also expected to connect in this region during the ETYS time period. This is supplemented by existing generation, which comprises around 800 MW of hydro and 300 MW of pumped storage at Foyers.
The Caithness–Moray HVDC scheme presently under development with expected delivery in 2018 will provide further enhancement to the B1 boundary capability.
The electricity transmission network
Gone Green 2016Slow Progression 2016No Progression 2016Consumer Power 2016
Base CapabilityGone Green 2015Slow Progression 2015No Progression 2015Consumer Power 2015
GW
1.0
0.0
2.0
3.0
4.04.5
0.5
1.5
2.5
3.5
2016 2018 2020 2022 2024 2026 2028 2030 2032 2034 2036 2038 2040
Electricity Ten Year Statement November 2016 38

Chapter three
Figure B1a.1 Geographic and schematic representation of boundary B1a
Boundary B1a – North West 1a SHE Transmission
Boundary B1a runs from the Moray coast near Macduff to the west coast near Oban, separating the North West of Scotland from the southern and eastern regions. The boundary crosses the 275kV double circuit running eastwards from Blackhillock to Kintore on a direct route and another 275kV double circuit running eastwards from Keith to Peterhead
and Kintore and the 400kV and 275kV double circuit running south from Fort Augustus. High renewables output causes high transfers across this boundary. This is a new boundary for the ETYS 2016 and its main difference from the existing boundary B1 is that Blackhillock substation is north of the boundary.
Firth of Forth
Kinlochleven
Tummel Bridge
Errochty
Tummel
Corriemoillie
Cashlie
Sloy
Orrin
Aigas
Quoich
Lochay
Foyers
Rannoch
Clachan
Errochty
Fasnakyle
Invergarry
Elgin
Keith
Beauly
Tealing
Kintore
Arbroath
Dalmally
Inveraray
Peterhead
St. Fergus
Blackhillock
Fort Augustus
Alness
Nairn
MossfordGrudie Bridge
Macduff
Dingwall
Inverness
Luichart
DeanieCulligran
Kilmorack
Boat ofGarten
Broadford
Dunvegan
TaynuiltCruachan
Nant
Fort William
Killin Finlarig
Errochty Power Station
Clunie
Fraserburgh
DycePersley
Willowdale
Clayhills
Redmoss
Fiddes
TarlandCraigiebuckler
WoodhillGlenMorrison
Caennacroc
DudhopeMilton of Craigie
Glenagnes
Lyndhurst
CharlestonBurghmuir
Glenrothes
Westfield
SCOTTISH HYDRO-ELECTRICTRANSMISSION
St. Fillans
Dudhope
Leven
Cupar
Devonside
Inverarnan
Knocknagael
Glendoe
Ardmore
Strichen
B1a
Kinlochleven
TARLAND
INVERNESS
KNOCKNAGAEL
FOYERS
DUNVEGAN
KINTORE
KEITH
FORT AUGUSTUS
FASNAKYLE
GLENFARCLAS
FORT WILLIAM
BLACKHILLOCK
BEAULY
DOUNREAY
BROADFORD
DALLAS
SHIN
GLENDOE
EDINBANE
HARRIS
ALNESS
BRORA DUNBEATH
MYBSTER
THURSO
FARRWIND FARM
ORRIN
LUICHART
MOSSFORD
GRUDIEBRIDGE
KILMORACK
AIGAS
CULLIGRAN
DEANIE
LAIRG
CASSLEY
BOAT OFGARTEN
NAIRN ELGIN
FETTERESSO
B1a
B1a
Electricity Ten Year Statement November 2016 39

Cha
pter
thre
e
Figure B1a.2 Required transfer and base capability for boundary B1a
Boundary requirements and capability Figure B1a.2 above shows the required boundary transfers for B1a from 2015 to 2040. The boundary capability is currently around 2 GW.
New renewable generation connections north of the boundary are expected to result in a significant increase in export requirements across the boundary. All generation north of boundaries B0 and B1 also lies behind boundary B1a.
In all the future energy scenarios there is an increase in the power transfer through B1a due to the large volume of renewable generation connecting to the north of this
boundary. Although this is primarily onshore wind and hydro, there is the prospect of significant additional wind, wave and tidal generation resources being connected in the longer term. Contracted generation behind boundary B1a includes the renewable generation on the Western Isles, Orkney and the Shetland Isles with a considerable volume of large and small onshore wind developments. A large new pump storage generator is also planned in the Fort Augustus area. Some marine generation is also expected to connect in this region during the ETYS time period. This is supplemented by existing generation, which comprises around 800 MW of hydro and 300 MW of pumped storage at Foyers.
The electricity transmission network
Gone Green 2016Slow Progression 2016No Progression 2016Consumer Power 2016
Base CapabilityGone Green 2015Slow Progression 2015No Progression 2015Consumer Power 2015
GW
1.0
0.0
2.0
3.0
5.0
6.0
4.0
2016 2018 2020 2022 2024 2026 2028 2030 2032 2034 2036 2038 2040
Electricity Ten Year Statement November 2016 40
Chapter three
Figure B2.1 Geographic representation of boundary B2
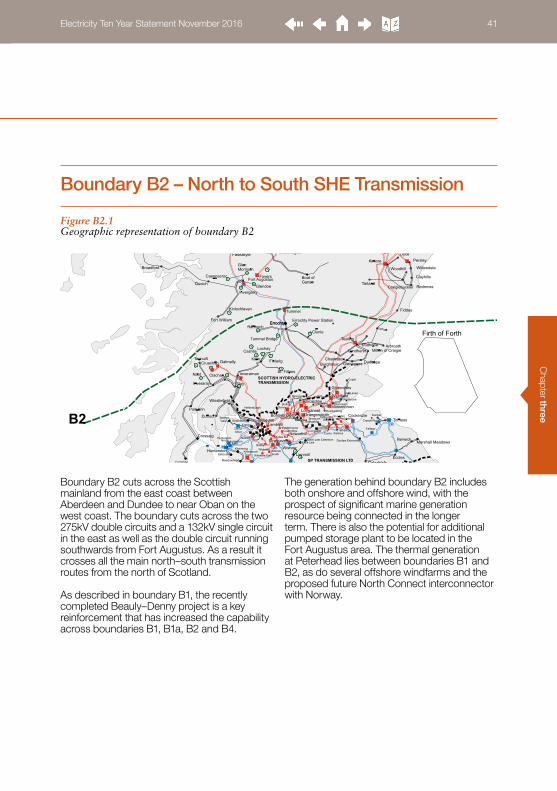
Boundary B2 – North to South SHE Transmission
Boundary B2 cuts across the Scottish mainland from the east coast between Aberdeen and Dundee to near Oban on the west coast. The boundary cuts across the two 275kV double circuits and a 132kV single circuit in the east as well as the double circuit running southwards from Fort Augustus. As a result it crosses all the main north–south transmission routes from the north of Scotland. As described in boundary B1, the recently completed Beauly–Denny project is a key reinforcement that has increased the capability across boundaries B1, B1a, B2 and B4.
The generation behind boundary B2 includes both onshore and offshore wind, with the prospect of significant marine generation resource being connected in the longer term. There is also the potential for additional pumped storage plant to be located in the Fort Augustus area. The thermal generation at Peterhead lies between boundaries B1 and B2, as do several offshore windfarms and the proposed future North Connect interconnector with Norway.
Firth of Forth
Linnmill
Fallago
Kinlochleven
Tummel Bridge
Errochty
Tummel
Denny
Crossaig
Cashlie
Black Law Extension
CumbernaldBainsfordB2
Sloy
Quoich
Lochay
Foyers
Rannoch
Clachan
Errochty
Invergarry
Eccles
Tealing
Torness
Kintore
Arbroath
Port Ann
Dalmally
LongannetCockenzie
Inveraray
Hunterston
Fort Augustus Boat ofGarten
Broadford
TaynuiltCruachan
Whistlefield
Nant
Fort William
Killin Finlarig
Errochty Power Station
Clunie
Persley
Willowdale
Clayhills
Redmoss
Fiddes
TarlandCraigiebuckler
WoodhillGlenMorrison
Caennacroc
DudhopeMilton of Craigie
Glenagnes
Lyndhurst
CharlestonBurghmuir
Glenrothes
Westfield
Dunoon
Berwick
SCOTTISH HYDRO-ELECTRICTRANSMISSION
St. Fillans
DunbarInverkeithing
Dudhope
SP TRANSMISSION LTDSaltcoats
Meadowhead
Kilwinning
Kaimes
PortobellloShrubhill
MossmorranGlenniston
Redhouse
Leven
Cupar
Currie
GorgieTelford Rd.
Livingston
Bathgate
Grangemouth
DunfemlineKincardineDevonside
Stirling
Bonnybridge
Easterhouse
Newarthill
WishawBlack LawStrathaven
Clydes Mill
EastKilbrideSouth
BusbyWhitelee
KilmarnockTown
Neilston
ErskineDevolMoor
Helensburgh
StrathlevenSpangoValley
LambhillBroxburnWindyhill
Marshall Meadows
Whitelee Extn
SmeatonCoatbridge
Inverarnan
Whitehouse
Crystal Rig
Dunlaw Extension
Glendoe
North
Hunterston
HunterstonEast
Electricity Ten Year Statement November 2016 41
Cha
pter
thre
e
Figure B2.2 Required transfer and base capability for boundary B2
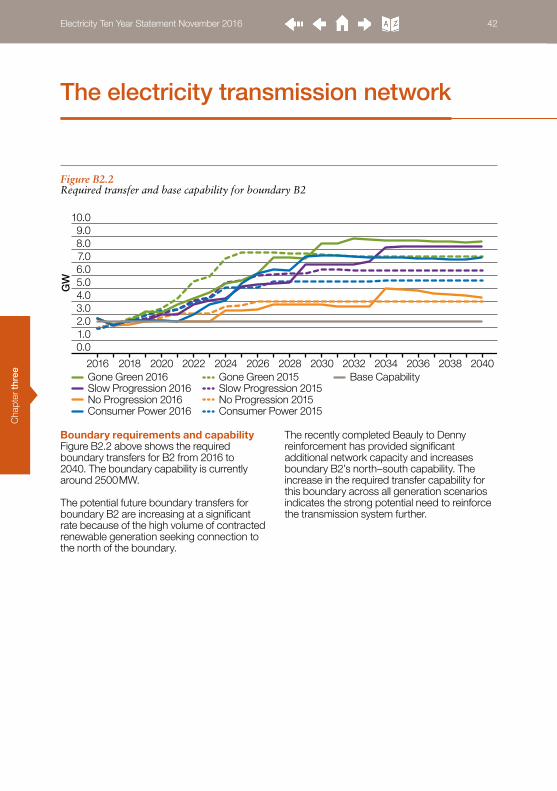
Boundary requirements and capability Figure B2.2 above shows the required boundary transfers for B2 from 2016 to 2040. The boundary capability is currently around 2500 MW.
The potential future boundary transfers for boundary B2 are increasing at a significant rate because of the high volume of contracted renewable generation seeking connection to the north of the boundary.
The recently completed Beauly to Denny reinforcement has provided significant additional network capacity and increases boundary B2’s north–south capability. The increase in the required transfer capability for this boundary across all generation scenarios indicates the strong potential need to reinforce the transmission system further.
The electricity transmission network
Gone Green 2016Slow Progression 2016No Progression 2016Consumer Power 2016
Base CapabilityGone Green 2015Slow Progression 2015No Progression 2015Consumer Power 2015
GW
2.0
0.0
4.0
6.0
8.0
10.0
1.0
3.0
5.0
7.0
9.0
2016 2018 2020 2022 2024 2026 2028 2030 2032 2034 2036 2038 2040
Electricity Ten Year Statement November 2016 42

Chapter three
Figure B2a.1 Geographic and schematic representation of boundary B2a
Boundary B2a – Peterhead
Boundary B2a is a local boundary enclosing the Peterhead area. The boundary cuts across the 275kV circuits from Peterhead to Blackhillock and Peterhead to Kintore, the 275kV circuit from Kintore to Blackhillock via Keith and the 275kV double circuit from Peterhead to Kintore via Persley. Peterhead power station is connected in this area and Moray Offshore Windfarm and North Connect interconnector are contracted to connect in
this area as well. There is limited capacity on the existing 275kV circuits to accommodate this and other generation connected to the 132kV network served by the 275kV network in this area.
A new local boundary, B2a, was created to facilitate the assessment of local network capacity requirements to accommodate power flows in this area.
Moray Firth
B2a
B2a
Keith
Kintore
Peterhead
St. FergusMacduffFraserburgh
DycePersley
WillowdaleWoodhill
Strichen
FRASERBURGH
STRICHENST. FERGUSMOBIL
ST. FERGUS GASPETERHEADGRANGE
MILTON OF CRAIGIE
FIDDES
CRAIGIEBUCKLER
BRECHIN GRID
TARLAND
ARBROATH
TEALING
PERSLEY
PETERHEAD
KINTORE
FETTERESSO
B2a
B2a
Electricity Ten Year Statement November 2016 43

Cha
pter
thre
e
The electricity transmission network
Figure B2a.2 Required transfer and base capability for boundary B2a
Boundary requirements and capability Figure B2a.2 above shows the required boundary transfers for B2a from 2015 to 2040. The boundary capability is currently around 1300 MW.
Consumer Power 2016No Progression 2016Slow Progression 2016Gone Green 2016
Base Capability
GW
1.0
0.0
2.0
3.0
4.04.5
0.5
1.5
2.5
3.5
2016 2018 2020 2022 2024 2026 2028 2030 2032 2034 2036 2038 2040
Electricity Ten Year Statement November 2016 44

Chapter three
Figure B3b.1 Geographic and single-line representation of boundary B3b
Boundary B3b – Argyll and Kintyre
In the Argyll and Kintyre area the 132kV network is relatively weak with a low capacity, so a local boundary assessment is used to show limitations to generation power flow. Boundary B3b encompasses the Argyll and the Kintyre peninsula, cutting across the existing 132kV circuits between Inveraray and Sloy substations.
A key reinforcement has recently been completed in the Kintyre area, comprising two 220kV AC subsea cables between a new substation at Crossaig (to the north of Carradale) on Kintyre and Hunterston in Ayrshire. A 15km section of existing 132kV double circuit line between Crossaig and Carradale has also been rebuilt.
B3b
B3b
AN SUIDHE
CRUACHAN
DALMALLY
PORT ANN
CARRADALE
FERNOCH
INVERARNAN
KILLIN
INVERARAY
FORT AUGUSTUS
DUNOON
TAYNUILT
FORT WILLIAM
BROADFORD
STRATHLEVEN
SLOY
GLENDOE
CROSSAIG
Linnmill
Moffat
Harestanes
Tummel Bridge
Denny
Crossaig
Cashlie
New Cumnock
Black Law Extension
Hadyard
CumbernaldBainsford
Auchenwynd
Sloy
Lochay
Clachan
Tealing
Port Ann
Dalmally
Longannet
Inveraray
Carradale
Hunterston
KilmarnockSouth
TaynuiltCruachan
Whistlefield
Nant
Killin Finlarig
Clunie
CharlestonBurghmuir
Glenrothes
Westfield
Dunoon
AyrCoylton
Maybole
Coalburn
Elvanfoot
SCOTTISH HYDRO-ELECTRICTRANSMISSION
St. Fillans
Inverkeithing
SP TRANSMISSION LTDSaltcoats
Meadowhead
Kilwinning
Kaimes
PortobellloShrubhill
MossmorranGlenniston
Redhouse
Cupar
Currie
GorgieTelford Rd.
Livingston
Bathgate
Grangemouth
DunfemlineKincardineDevonside
Stirling
Bonnybridge
Easterhouse
Newarthill
WishawBlack LawStrathaven
Clydes Mill
EastKilbrideSouth
BusbyWhitelee
KilmarnockTown
Neilston
ErskineDevolMoor
Helensburgh
StrathlevenSpangoValley
LambhillBroxburnWindyhill
Clyde (South)
Clyde (North)
Whitelee Extn
SmeatonCoatbridge
Inverarnan
Whitehouse
North
Hunterston
HunterstonEastB3b
B3b
Electricity Ten Year Statement November 2016 45

Cha
pter
thre
e
The electricity transmission network
Figure B3b.2 Required transfer and base capability for boundary B3b
Boundary requirements and capability Figure B3b.2 above gives the required capability of the B3b boundary and a view of the maximum and minimum transfer requirements from 2016 to 2040. The current boundary capability is around 420 MW.
The potential future power transfers across boundary B3b are increasing at a significant rate because of the high volume of connected
and contracted renewable generation seeking connection in Argyll and Kintyre. The recently completed Kintyre-Hunterston link has increased the capability of the boundary to 420 MW. There is still significant interest and proposed connection activity in the area, and it is likely that further reinforcement of this network will be required in the future.
Gone Green 2016Slow Progression 2016No Progression 2016Consumer Power 2016
Base CapabilityGone Green 2015Slow Progression 2015No Progression 2015Consumer Power 2015
GW
0.10.0
0.20.3
0.5
0.80.70.6
0.4
2016 2018 2020 2022 2024 2026 2028 2030 2032 2034 2036 2038 2040
Electricity Ten Year Statement November 2016 46
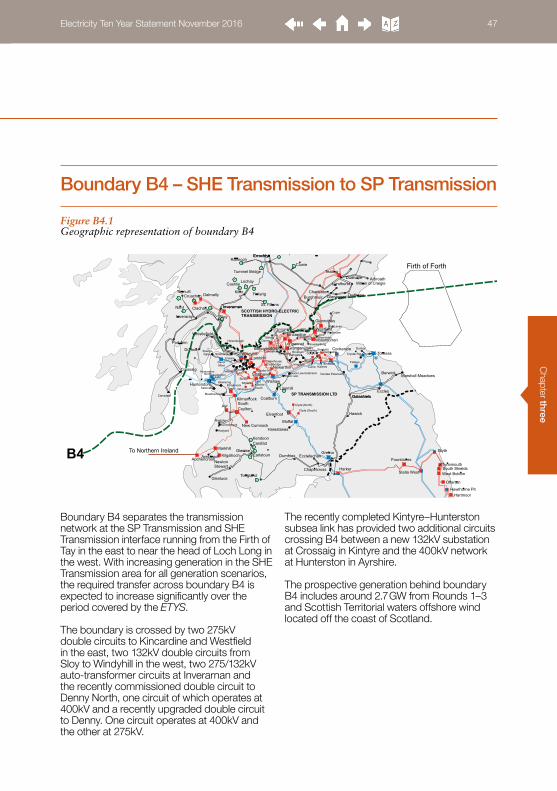
Chapter three
Figure B4.1 Geographic representation of boundary B4
Boundary B4 – SHE Transmission to SP Transmission
Boundary B4 separates the transmission network at the SP Transmission and SHE Transmission interface running from the Firth of Tay in the east to near the head of Loch Long in the west. With increasing generation in the SHE Transmission area for all generation scenarios, the required transfer across boundary B4 is expected to increase significantly over the period covered by the ETYS.
The boundary is crossed by two 275kV double circuits to Kincardine and Westfield in the east, two 132kV double circuits from Sloy to Windyhill in the west, two 275/132kV auto-transformer circuits at Inverarnan and the recently commissioned double circuit to Denny North, one circuit of which operates at 400kV and a recently upgraded double circuit to Denny. One circuit operates at 400kV and the other at 275kV.
The recently completed Kintyre–Hunterston subsea link has provided two additional circuits crossing B4 between a new 132kV substation at Crossaig in Kintyre and the 400kV network at Hunterston in Ayrshire.
The prospective generation behind boundary B4 includes around 2.7 GW from Rounds 1–3 and Scottish Territorial waters offshore wind located off the coast of Scotland.
B4
Inverarnan
To Northern Ireland
Firth of Forth
Linnmill
Moffat
Fallago
GalashielsGalashiels
Hawick
Harestanes
Tummel Bridge
Denny
Crossaig
Cashlie
New Cumnock
Black Law Extension
Hadyard
Kilgallioch
CumbernaldBainsford
Auchenwynd
Blyth
Harker
Offerton
Hartmoor
TynemouthSouth ShieldsWest Boldon
Hawthorne Pit
Stella West
Fourstones
Sloy
Lochay
Rannoch
Glenlee
Clachan
Tongland
Eccles
Tealing
Torness
Arbroath
Port Ann
Dalmally
LongannetCockenzie
Inveraray
Carradale
Hunterston
Auchencrosh
KilmarnockSouth
TaynuiltCruachan
Whistlefield
Nant
Killin Finlarig
Clunie
DudhopeMilton of Craigie
Glenagnes
Lyndhurst
CharlestonBurghmuir
Glenrothes
Westfield
Dunoon
AyrCoylton
Maybole
Coalburn
Elvanfoot
Carsfad
Earlstoun
Chapelcross
GretnaDumfries Ecclefechan
Berwick
SCOTTISH HYDRO-ELECTRICTRANSMISSION
St. Fillans
DunbarInverkeithing
Dudhope
NewtonStewart
Glenluce
SP TRANSMISSION LTDSaltcoats
Meadowhead
Kilwinning
Kaimes
PortobellloShrubhill
MossmorranGlenniston
Redhouse
Leven
Cupar
Currie
GorgieTelford Rd.
Livingston
Bathgate
Grangemouth
DunfemlineKincardineDevonside
Stirling
Bonnybridge
Easterhouse
Newarthill
WishawBlack LawStrathaven
Clydes Mill
EastKilbrideSouth
BusbyWhitelee
KilmarnockTown
Neilston
ErskineDevolMoor
Helensburgh
StrathlevenSpangoValley
LambhillBroxburnWindyhill
Clyde (South)
Clyde (North)
Kendoon
Marshall Meadows
Whitelee Extn
SmeatonCoatbridge
Inverarnan
Whitehouse
Crystal Rig
Dunlaw Extension
Markhill
Arecleoch
North
Hunterston
HunterstonEast
Electricity Ten Year Statement November 2016 47

Cha
pter
thre
e
The electricity transmission network
Figure B4.2 Required transfer and base capability for boundary B4
Boundary requirements and capability Figure B4.2 above shows the required boundary transfers for B4 from 2016 to 2040. The current boundary capability is 3024 MW.
In all of the future energy scenarios, the power transfer through boundary B4 increases because of the significant volumes of generation connecting north of the boundary. This is primarily onshore and
offshore wind generation, with the prospect of significant marine generation resource being connected in the longer term. The contracted generation behind boundary B4 includes around 2.7 GW of offshore and over 5 GW of large onshore wind generation.
The increase in the potential required transfer capability clearly indicates the strong potential need to reinforce the transmission network across boundary B4.
Gone Green 2016Slow Progression 2016No Progression 2016Consumer Power 2016
Base CapabilityGone Green 2015Slow Progression 2015No Progression 2015Consumer Power 2015
GW
2
0
4
6
8
10
12
2016 2018 2020 2022 2024 2026 2028 2030 2032 2034 2036 2038 2040
Electricity Ten Year Statement November 2016 48

Chapter three
Figure B5.1 Geographic representation of boundary B5
Boundary B5 – North to South SP Transmission
Boundary B5 is internal to the SP Transmission system and runs from the Firth of Clyde in the west to the Firth of Forth in the east. The generating station at Cruachan, together with the demand groups served from Windyhill, Lambhill, Bonnybridge and Westfield 275kV substations, are located to the north of
boundary B5. The existing transmission network across the boundary comprises three 275kV double circuit routes: one from Windyhill 275kV substation in the west and one from each of Kincardine and Longannet 275kV substations in the east.
B5
Inverarnan
To Northern Ireland
Firth of Forth
Linnmill
Moffat
Fallago
GalashielsGalashiels
Hawick
Harestanes
Tummel Bridge
Denny
Crossaig
Cashlie
New Cumnock
Black Law Extension
Hadyard
Kilgallioch
CumbernaldBainsford
Auchenwynd
Blyth
Harker
Offerton
Hartmoor
TynemouthSouth ShieldsWest Boldon
Hawthorne Pit
Stella West
Fourstones
Sloy
Lochay
Rannoch
Glenlee
Clachan
Tongland
Eccles
Tealing
Torness
Arbroath
Port Ann
Dalmally
LongannetCockenzie
Inveraray
Carradale
Hunterston
Auchencrosh
KilmarnockSouth
TaynuiltCruachan
Whistlefield
Nant
Killin Finlarig
Clunie
DudhopeMilton of Craigie
Glenagnes
Lyndhurst
CharlestonBurghmuir
Glenrothes
Westfield
Dunoon
AyrCoylton
Maybole
Coalburn
Elvanfoot
Carsfad
Earlstoun
Chapelcross
GretnaDumfries Ecclefechan
Berwick
SCOTTISH HYDRO-ELECTRICTRANSMISSION
St. Fillans
DunbarInverkeithing
Dudhope
NewtonStewart
Glenluce
SP TRANSMISSION LTDSaltcoats
Meadowhead
Kilwinning
Kaimes
PortobellloShrubhill
MossmorranGlenniston
Redhouse
Leven
Cupar
Currie
GorgieTelford Rd.
Livingston
Bathgate
Grangemouth
DunfemlineKincardineDevonside
Stirling
Bonnybridge
Easterhouse
Newarthill
WishawBlack LawStrathaven
Clydes Mill
EastKilbrideSouth
BusbyWhitelee
KilmarnockTown
Neilston
ErskineDevolMoor
Helensburgh
StrathlevenSpangoValley
LambhillBroxburnWindyhill
Clyde (South)
Clyde (North)
Kendoon
Marshall Meadows
Whitelee Extn
SmeatonCoatbridge
Inverarnan
Whitehouse
Crystal Rig
Dunlaw Extension
Markhill
Arecleoch
North
Hunterston
HunterstonEast
Electricity Ten Year Statement November 2016 49

Cha
pter
thre
e
The electricity transmission network
Figure B5.2 Required transfer and base capability for boundary B5
Boundary requirements and capability Figure B5.2 above shows the required boundary transfers for B5 from 2016 to 2040.
The capability of the boundary is presently limited by thermal considerations to around 3.8 GW.
In all of the future energy scenarios there is an initial significant reduction in required transfer capability across boundary B5 due to the cessation of generation at Longannet. This is followed by an increase in export (north to south) requirement over time, due to a large volume of generation connections throughout the north of Scotland, primarily on and offshore wind.
Gone Green 2016Slow Progression 2016No Progression 2016Consumer Power 2016
Base CapabilityGone Green 2015Slow Progression 2015No Progression 2015Consumer Power 2015
GW
2.0
0.0
4.0
6.0
8.0
10.0
1.0
3.0
5.0
7.0
9.0
2016 2018 2020 2022 2024 2026 2028 2030 2032 2034 2036 2038 2040
Electricity Ten Year Statement November 2016 50

Chapter three
Figure B6.1 Geographic representation of boundary B6
Boundary B6 – SP Transmission to NGET
Boundary B6 separates the SP Transmission and the National Grid Electricity Transmission (NGET) systems. The existing transmission network across the boundary primarily consists of two double-circuit 400kV routes. There are also some 132kV circuits across the boundary, which are of limited capacity. The key 400kV routes are from Gretna to Harker and from Eccles to Stella West. Peak power flow requirements are typically from north to south at times of high renewable generation output.
Conventional generation in Scotland such as the nuclear units at Hunterston and Torness continue to play a vital role in managing security of supply across Scotland. To secure the peak demand in Scotland can be met at times of low wind generation output, approximately 3 GW of other types of generation is required in Scotland.
This generation could be provided by a variety of sites such as Torness, Hunterston, various pump storage and hydro schemes, and Peterhead. After the Western HVDC link is completed for 2017/18, this generation requirement is expected to fall to approximately 2.0 GW.
To Northern Ireland
Linnmill
Moffat
Fallago
GalashielsGalashiels
Hawick
Harestanes
Crossaig
New Cumnock
Black Law Extension
Hadyard
Kilgallioch
CumbernaldBainsford
Auchenwynd
Robin Rigg
Wigtown Bay Teesside
B6
B6
Blyth
Harker
Norton
Offerton
Hartmoor
Tynemouth
Spennymoor
South ShieldsWest Boldon
Hawthorne Pit
HartlepoolTod Point
Grangetown Greystones
Lackenby
Stella West
Fourstones
Glenlee
Tongland
Eccles
Torness
Carradale
Hunterston
Auchencrosh
KilmarnockSouthAyrCoylton
Maybole
Coalburn
Elvanfoot
Carsfad
Earlstoun
Chapelcross
GretnaDumfries Ecclefechan
Berwick
NewtonStewart
Glenluce
SP TRANSMISSION LTDSaltcoats
Meadowhead
Kilwinning
Kaimes
Portobelllo
Currie
Gorgie
Livingston
Bathgate
Easterhouse
Newarthill
WishawBlack LawStrathaven
Clydes Mill
EastKilbrideSouth
BusbyWhitelee
KilmarnockTown
Neilston
ErskineDevolMoor
StrathlevenLambhill
BroxburnWindyhill
Saltholme
Clyde (South)
Clyde (North)
Kendoon
Marshall Meadows
Whitelee Extn
SmeatonCoatbridge
Whitehouse
Crystal Rig
Dunlaw Extension
Markhill
Arecleoch
North
Hunterston
HunterstonEast
Electricity Ten Year Statement November 2016 51
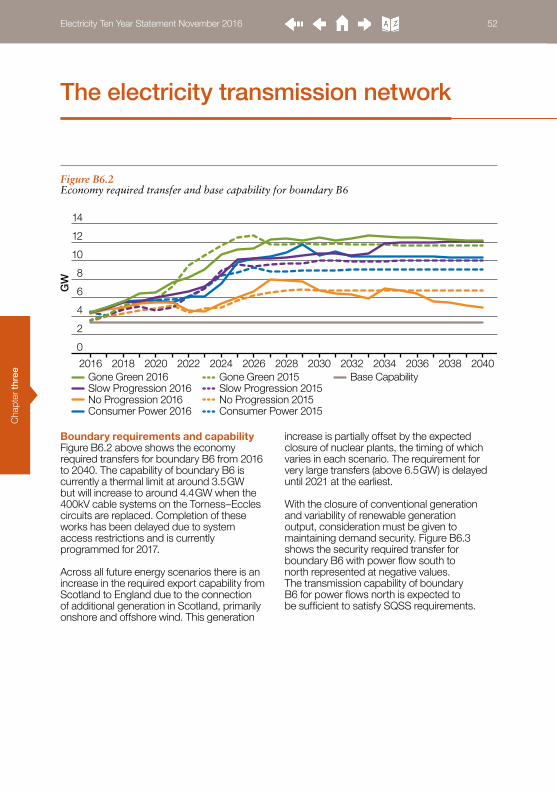
Cha
pter
thre
e
The electricity transmission network
Figure B6.2 Economy required transfer and base capability for boundary B6
Boundary requirements and capability Figure B6.2 above shows the economy required transfers for boundary B6 from 2016 to 2040. The capability of boundary B6 is currently a thermal limit at around 3.5 GW but will increase to around 4.4 GW when the 400kV cable systems on the Torness–Eccles circuits are replaced. Completion of these works has been delayed due to system access restrictions and is currently programmed for 2017.
Across all future energy scenarios there is an increase in the required export capability from Scotland to England due to the connection of additional generation in Scotland, primarily onshore and offshore wind. This generation
increase is partially offset by the expected closure of nuclear plants, the timing of which varies in each scenario. The requirement for very large transfers (above 6.5 GW) is delayed until 2021 at the earliest.
With the closure of conventional generation and variability of renewable generation output, consideration must be given to maintaining demand security. Figure B6.3 shows the security required transfer for boundary B6 with power flow south to north represented at negative values. The transmission capability of boundary B6 for power flows north is expected to be sufficient to satisfy SQSS requirements.
Gone Green 2016Slow Progression 2016No Progression 2016Consumer Power 2016
Base CapabilityGone Green 2015Slow Progression 2015No Progression 2015Consumer Power 2015
GW
2
0
4
6
8
10
12
14
2016 2018 2020 2022 2024 2026 2028 2030 2032 2034 2036 2038 2040
Electricity Ten Year Statement November 2016 52

Chapter three
Figure B6.3 Security required transfer and base capability for boundary B6
Gone Green 2016Slow Progression 2016No Progression 2016Consumer Power 2016
Base CapabilityGone Green 2015Slow Progression 2015No Progression 2015Consumer Power 2015
GW
-2.5
-3.5-3.0
-2.0-1.5
5
1.5
-50
1.0
-1.0
2016 2018 2020 2022 2024 2026 2028 2030 2032 2034 2036 2038 2040
Electricity Ten Year Statement November 2016 53

Cha
pter
thre
e
The electricity transmission network
Figure 3.5 North England transmission network
3.5Network capability and requirements by region: Northern boundaries
IntroductionThe North of England transmission region includes the transmission network between the Scottish border and the North Midlands. This includes the upper north boundaries B7, B7a and, enclosing the Humber region,
boundary EC1. The figure below shows likely power flow directions in the years to come up to 2026. The arrows in the diagram are meant to illustrate power flow directions, but are not drawn to scale to reflect the magnitude of power flows.
To Ireland
To Northern Ireland
Middleton
Moffat
GalashielsGalashiels
Hawick
HarestanesNew Cumnock
Hadyard
Kilgallioch
Auchenwynd
Robin Rigg
Wigtown Bay
Barrow
Ormonde
Rhyl Flats
Burbo Bank
Gwynt y Mor
Walney I & II
West of Duddon
Westermost Rough
Humber Gateway
North Hoyle
Teesside
Drax
Wylfa
Blyth
Stanah
Kirkby
Hutton
Harker
Elland
Keadby
Norton
Cottam
Padiham
Heysham
Bredbury
Pitsmoor
NeepsendAldwarke
Thornton
Offerton
Rochdale
Hartmoor
Tynemouth
Poppleton
Spennymoor
Penwortham
Osbaldwick
Creyke Beck
Grimsby WestRainhill
WashwayFarm
Carrington
DainesFiddlersFerry
Kearsley Whitegate
Stalybridge
Quernmore
Ferrybridge Eggborough
ThorpeMarsh
Thurcroft
Brinsworth
TempleboroughWestMelton
Sheffield City
Winco BankStocksbridge West
Burton
SaltendNorth
Saltend South
SouthHumberBank
BradfordWest Kirkstall Skelton
Grange MonkFryston
KillingholmeHumber Refinery
South ShieldsWest Boldon
Hawthorne Pit
HartlepoolTod Point
Grangetown Greystones
Lackenby
Stella West
Fourstones
Glenlee
Tongland
EcclesCarradale
Auchencrosh
KilmarnockSouthAyrCoylton
Maybole
Coalburn
Elvanfoot
Carsfad
Earlstoun
Chapelcross
GretnaDumfries Ecclefechan
NewtonStewart
Glenluce
SP TRANSMISSION LT DMeadowhead
Knaresborough
Saltholme
Hedon
Clyde (South)
Clyde (North)
Kendoon
To Ireland
Markhill
Arecleoch
Rocksavage
Electricity Ten Year Statement November 2016 54

Chapter three
Primary challenge statementThe connection of new generation and power flow through the region from Scotland heading south has the potential to cause overloading on the limited number of circuits across northern England. Future power transfer requirements could be more than double compared to what they are today.
Regional driversAccording to the future energy scenarios graph below (Figure NB.1), the northern transmission region could expect between 15 and 25 GW of generation connected by 2035. Depending on which scenario develops, the generation could trend towards increased renewables including offshore wind farms or could see growth in conventional generation. The demand in the region, as shown in Figure NB.2 could reasonably be expected to decrease as can be seen for most of the scenarios.
Electricity Ten Year Statement November 2016 55

Cha
pter
thre
e
Figure NB.1 Generation mix scenarios for the Northern boundaries region
Figure NB.2 Gross demand scenarios for the Northern boundaries region
The electricity transmission network
Low carbon (including renewables) Fossil fuel Interconnectors and storage
0
30
20
10
25
15
5
2020 2025 2030 20352020 2025 2030 20352020 2025 2030 203520202015/16
2025 2030 2035
Gone Green Slow Progression Consumer PowerNo Progression
GW
GW
Gone Green Slow Progression Consumer Power No Progression
0.0
8.0
14.0
12.0
10.0
4.0
6.0
2.0
2015 2020 2025 2030 2035 2015 2020 2025 2030 2035 2015 2020 2025 2030 2035 2015 2020 2025 2030 2035
Electricity Ten Year Statement November 2016 56
Chapter three
Presently, most of the northern transmission network is oriented for north–south power flows with connections for demand and generation along the way. At times of high generation the power flow will mostly be from north to south, with power coming from both internal boundary generation and generation further north in Scotland. The small number of circuits running north to south means that transmission capability can be very limited. The loss of one of the north to south routes will have a very high impact on the remaining circuits.
There are current ongoing works to increase northern boundaries’ capability, particularly with the Western HVDC Link and the series and shunt compensation project, to handle high power transfer from Scotland to England.
In addition, voltages in the northern region and Scotland are being managed carefully with operational reactive switching. This helps to manage the significant voltage drop due to reactive power demands which arise when high levels of power flow on long circuits. Operational reactive switching solutions are also used to manage light loading conditions when the voltage can rise to unacceptable levels.
The high concentration of large conventional generators around Humber and South Yorkshire means that system configuration can be limited by high fault levels. Therefore some potential network capability restrictions in the north can be due to the inability to configure the network as desired due to fault level concerns.
As the potential future requirement to transfer more power from Scotland to England increases, B7 and B7a are likely to reach their capability limits and may need network reinforcement. The potential future restrictions to be overcome across B7 and B7a are summarised: Limitation on power transfer out of North
East England (boundary B7) is caused by the north to south flow across two sets of 400kV double circuits: Norton–Osbaldwick–Thornton and Lackenby–Thornton. As the North East England area increases its exports, these circuits will eventually reach their thermal loading limit.
Limitation on power transfer from Cumbria to Lancashire (boundary B7a) occurs as power flows via two branches of circuits: a 400kV branch of Penwortham–Padiham/Carrington and a 275kV branch of Penwortham–Kirkby. As the power flow increases in the future, the two branches will be stressed to their thermal loading limit.
The need for network reinforcement to address the above mentioned potential capability issues will be evaluated in the NOA2 cost–benefit analysis. Following the evaluation, the preferred reinforcements for the North of England region will be recommended.
Electricity Ten Year Statement November 2016 57

Cha
pter
thre
e
The electricity transmission network
Figure B7.1 Geographic representation of boundary B7
Boundary B7 – Upper North
Boundary B7 bisects England south of Teesside. It is characterised by three 400kV double circuits: two in the east and one in the west. The area between boundaries B6 and B7 used to have a surplus of generation so exported power – when added to the exported power from Scotland, this was putting significant requirements on boundary B7. However, since the generation in the area
between boundaries B6 and B7 has reduced, the requirement on B7 is now driven mainly by the Scottish exports. The area north of boundary B7 has also seen a reduction in demand due to increase in embedded generation. This coupled with future onshore and offshore wind connecting north of the boundary will increase transfer requirements for B7.
To Ireland
Hornsea
Middleton
Kilgallioch
Robin Rigg
Wigtown Bay
Barrow
Ormonde
Burbo Bank
Walney I & II
West of Duddon
Westermost Rough
Humber Gateway
Triton Knoll
Teesside
B7
Drax
Stanah
Hutton
Harker
Elland
Keadby
Norton
Padiham
Heysham
Thornton
Offerton
Rochdale
Hartmoor
Tynemouth
Poppleton
Spennymoor
Penwortham
Osbaldwick
Creyke Beck
WashwayFarm Kearsley Whitegate
Quernmore
Ferrybridge Eggborough
ThorpeMarsh
Templeborough
SaltendNorth
Saltend South
BradfordWest Kirkstall Skelton
Grange MonkFryston
KillingholmeHumber Refinery
South ShieldsWest Boldon
Hawthorne Pit
HartlepoolTod Point
Grangetown Greystones
Lackenby
Stella West
Fourstones
Tongland
AuchencroshEarlstoun
Chapelcross
Dumfries EcclefechanNewtonStewart
Glenluce
Knaresborough
Saltholme
Hedon
To Ireland
Arecleoch
B7
Electricity Ten Year Statement November 2016 58

Chapter three
Figure B7.2 Economy required transfer and base capability for boundary B7
Boundary requirements and capability Figure B7.2 above shows the economy required transfers for boundary B7 from 2016 to 2040. The boundary capability is currently limited by voltage compliance at 4.3 GW for a fault on the circuits from Hutton to Penwortham and Heysham.
All the future energy scenarios suggest an increase in future requirements due to the increase of generation north of boundary B7. Although ageing coal, gas and nuclear plants are closing north of the boundary across these scenarios, this is offset by the vast amount of onshore and offshore wind being commissioned. The only scenario not showing a significant build-up is No Progression – this is mainly due to the lack of significant offshore and onshore wind connections after 2021.
The required transfer for B7 will also greatly vary depending on the operation of the several interconnectors planned to connect north of the boundary. With these interconnectors importing to the GB system, B7 required transfers would increase. The security required transfer for boundary B7 places requirement for capability for south to north power flow as shown in figure B7.3. Capability is expected to be sufficient to meet the capability requirements in the near future, with potential need to improve capability further in the future.
Gone Green 2016Slow Progression 2016No Progression 2016Consumer Power 2016
Base CapabilityGone Green 2015Slow Progression 2015No Progression 2015Consumer Power 2015
GW
2
0
4
6
8
10
12
16
14
2016 2018 2020 2022 2024 2026 2028 2030 2032 2034 2036 2038 2040
Electricity Ten Year Statement November 2016 59

Cha
pter
thre
e
The electricity transmission network
Figure B7.3 Security required transfer for boundary B7
Gone Green 2016Slow Progression 2016No Progression 2016Consumer Power 2016
Base CapabilityGone Green 2015Slow Progression 2015No Progression 2015Consumer Power 2015
GW
-6-5-4
0
321
-2-1
-3
2016 2018 2020 2022 2024 2026 2028 2030 2032 2034 2036 2038 2040
Electricity Ten Year Statement November 2016 60

Chapter three
Figure B7a.1 Geographic representation of boundary B7a
Boundary B7a – Upper North
Boundary B7a bisects England south of Teesside and into the Mersey Ring area. It is characterised by three 400kV double circuits (two in the east, one in the west) and one 275kV circuit. Between boundaries B6 and B7a was traditionally an exporting area with a surplus
of generation – when added to the exported power from Scotland this puts significant requirements on boundary B7a. In the future a large amount of onshore and offshore wind connecting north of this boundary increases the transfer requirements.
To Ireland
Hornsea
Connah’s Quay
MiddletonBarrow
Ormonde
Rhyl Flats
Burbo Bank
Gwynt y Mor
Walney I & II
Docking Shoal
West of Duddon
Westermost Rough
Humber Gateway
Sheringham Shoal
North Hoyle
Lynn
Inner Dowsing
Triton Knoll
Lincs
Race Bank Dudgeon
B7 a
B7 a
Drax
Wylfa
Legacy
Stanah
Pentir
Kirkby
Hutton
Elland
Keadby
Cottam
Padiham
Deeside
Heysham
Bredbury
Pitsmoor
NeepsendAldwarke
Thornton
Rochdale
Poppleton
Bicker Fen
Staythorpe
Ffestiniog
Penwortham
Osbaldwick
Cellarhead
Creyke Beck
Grimsby West
ChesterfieldDinorwig
Rainhill
Capenhurst Frodsham
WashwayFarm
South Manchester
Carrington
DainesFiddlersFerry
Macclesfield
Kearsley Whitegate
Stalybridge
Quernmore
Ferrybridge Eggborough
ThorpeMarsh
Thurcroft
Brinsworth
HighMarnham
TempleboroughWestMelton
Norton LeesJordanthorpe
Sheffield City
Winco BankStocksbridge West
Burton
SaltendNorth
Saltend South
SouthHumberBank
BradfordWest Kirkstall Skelton
Grange MonkFryston
KillingholmeHumber Refinery
Grangetown
Lackenby
Stoke Bardolph
Bodelwyddan
Knaresborough
Hedon
To Ireland
Rocksavage
Electricity Ten Year Statement November 2016 61

Cha
pter
thre
e
The electricity transmission network
Figure B7a.2 Economy required transfer and base capability for boundary B7a
Boundary requirements and capability Figure B7a.2 above shows the economy required transfers for boundary B7a from 2016 to 2040. The boundary capability is currently thermally limited at around 6 GW for an overlapping fault involving the Penwortham–SGT6 and Carrington–Penwortham circuit which overloads the Padiham–Penwortham circuit. The commissioning of the Western HVDC Link will increase the boundary transfer capability to around 8.7 GW (a thermal limit for a double fault on the Padiham–Penwortham and Carrington–Penwortham circuits overloading one of the Penwortham–Washway Farm circuits).
Across all future energy scenarios the required transfer increases until 2019 when No Progression declines for the next 4 years. Other scenarios will still see the growth where in particular Gone Green has a higher rate compared to others. The rapid increase is due to a number of onshore and offshore wind farm connections in England and Scotland, fewer of these are part of the No Progression scenario.
Similar to the other boundaries further north with a lot of wind capacity behind them, boundary B7a has a security requirement to ensure demand is met when the intermittent generation is not operational. Figure B7a.3 below shows the security required transfer for boundary B7a.
Gone Green 2016Slow Progression 2016No Progression 2016Consumer Power 2016
Base CapabilityGone Green 2015Slow Progression 2015No Progression 2015Consumer Power 2015
GW
2 0
4 6 8
10 12
20
16 18
14
2016 2018 2020 2022 2024 2026 2028 2030 2032 2034 2036 2038 2040
Electricity Ten Year Statement November 2016 62

Chapter three
Figure B7a.3 Security required transfer for boundary B7a
Gone Green 2016Slow Progression 2016No Progression 2016Consumer Power 2016
Base CapabilityGone Green 2015Slow Progression 2015No Progression 2015Consumer Power 2015
GW
-8
0
6
4
2
-4
-2
-6
2016 2018 2020 2022 2024 2026 2028 2030 2032 2034 2036 2038 2040
Electricity Ten Year Statement November 2016 63

Cha
pter
thre
e
The electricity transmission network
Figure EC1.1 Geographic and single-line representation of boundary EC1
Boundary EC1 – Humber
Boundary EC1 is an enclosed local boundary consisting of four 400kV substations: Killingholme, Humber Refinery, South Humber Bank and Grimsby West with their interconnecting transmission circuits. There are
only two outgoing double circuits connected to the external grid. There are offshore wind farms being proposed such as Hornsea and Dogger Bank and new gas-fired power plants such as new Killingholme CCGT generation.
EC1
BANK
1 2
HUMBER
GRIMSBYWEST
KEADBY
WEST BURTON
KILLINGHOLME
BECK
SALTEND
CREYKEHUMBER
NORTH
HEDON
SALTEND
REFINERYSOUTH
3
Humber Gateway
EC1Drax
Keadby
Cottam
Grimsby West
Eggborough
ThorpeMarsh
WestBurton
SaltendNorth
Saltend South
SouthHumberBank
KillingholmeHumber Refinery
Hedon
Electricity Ten Year Statement November 2016 64

Chapter three
Figure EC1.2 Boundary export requirements and base capability for boundary EC1
Boundary requirements and capability Figure EC1.2 above shows export requirements for boundary EC1 from 2016 to 2040. The boundary capability is thermally limited at 4.7 GW for a double-circuit fault on Cottam–Keadby overloading Drax–Thornton and Keadby–West Burton double circuits.
This region becomes a less congested area of the transmission system due to the closures of some of the existing conventional generation. These closures, when they happen, result in extra capability for the new connections of renewable generations to the existing transmission network. Our future energy scenarios consider the potential for new offshore wind farms connections, as well as closures across the existing conventional power plants.
The Gone Green and Consumer Power scenarios show an increase in required transfer until 2022 due to the new connection of offshore wind power park modules. From then until 2026 the required transfer remains fairly flat. After 2026, however, the required transfer increases due to the new gas-fired power plants connecting to the network.
In comparison, the Slow Progression and No Progression scenarios exhibit a delayed increase in boundary transfer with relatively lower degree until 2022 due to the later commissioning of offshore wind power park modules. The Slow Progression decommissions the existing CCGT gas-fired power plant. Therefore there is a sharp decrease in 2029. However, the CCGT plant exists all the time in the No Progression scenario.
Gone Green 2016Slow Progression 2016No Progression 2016Consumer Power 2016
Base CapabilityGone Green 2015Slow Progression 2015No Progression 2015Consumer Power 2015
GW
1
0
2
3
5
6
4
2016 2018 2020 2022 2024 2026 2028 2030 2032 2034 2036 2038 2040
Electricity Ten Year Statement November 2016 65

Cha
pter
thre
e
The electricity transmission network
Figure 3.6 Wales and Midlands transmission network
3.6Network capability and requirements by region: Western boundaries
IntroductionThe Western transmission region includes boundaries in Wales and the Midlands. This includes the North Wales boundaries (NW1, NW2 and NW3), which are closely related, and the South Wales boundary (SW1). This region also covers large wider boundaries such as
B8, B9 and B17 in the English Midlands region. The figure below shows likely power flow directions in the years to come up to 2026. The arrows in the diagram are to illustrate power flow directions but are not drawn to scale to reflect the magnitude of power flows.
To Ireland
Connah’s Quay
Shell Flats
Burbo Bank
r
North Hoyle
Penn
Pyle
Drax
Fleet
Wylfa
Legacy
Stanah
Pentir
Kirkby
Walham
Elland
Margam
Cowley
Rassau
Minety Didcot
Seabank
Kitwell
Whitson
Padiham
Rugeley
Deeside
Enderby
y
Drakelow
Pitsmoor
NeepsendAldwarke
MelkshamAberthaw
Rochdale
Pembroke
Feckenham
Poppleton
Cilfynydd
Staythorpe
Ffestiniog
Penwortham
Shrewsbury
Willington
Cellarhead
Trawsfynydd
ChesterfieldDinorwig
Rainhill
Capenhurst Frodsham
WashwayFarm
South Manchester
Carrington
DainesFiddlersFerry
Macclesfield
Kearsley e
Swansea North
Baglan Bay
CardiffEast
Tremorfa
Alpha SteelUpper Boat Uskmouth
ImperialPark
Iron Acton
Bramley
Culham
Coventry
Nechells
Willenhall Bustleholm
Hams Hall
BerkswellOldbury
Bishops Wood
Ironbridge
Ocker Hill
PatfordBridge
Ferrybridge Eggborough
ThorpeMarsh
Thurcroft
Brinsworth
HighMarnham
TempleboroughWestMelton
Norton LeesJordanthorpe
Sheffield City
Kirkstall SkeltonGrange Monk
Fryston
East Claydon
Stoke Bardolph
Bushbury
Bodelwyddan
To Ireland
Ratcliffeon Soar
RocksavageBredbur
Whitegat
StalybridgeStocksbridgeWinco Bank
Rhyl Flats
Gwynt y Mo
Electricity Ten Year Statement November 2016 66

Chapter three
Primary challenge statementFuture nuclear generation connecting in North Wales, low-carbon and embedded generation in the South Wales regions, and the new interconnectors with Ireland have the potential to drive increased power flows eastward into the Midlands where power plant closures are set to occur and demand set to remain fairly high. This together with increasing north to south flows driven by increased renewable generation in Scotland will result in heavy circuit loading and voltage depression. This is because the Midlands region will no longer benefit from local voltage support from the closed plants.
Regional driversBy 2035, all the future energy scenarios indicate an overall reduction in the total amount of generation in the region (Figure WB.1). At present, this region has significant levels of fossil fuel (about 20 GW) which is set to close and be replaced by a combination of low carbon technologies, Interconnectors and Storage.
Figure WB.2 shows that the demand as seen from the transmission network in the region will reduce across all scenarios except the Gone Green Scenario which sees increases
in demand from 2025. The reduction in demand is primarily driven by increase in embedded generation, predominantly in South Wales.
Figure WB.1 Generation mix scenarios for the Western boundaries region
Low carbon (including renewables) Fossil fuel Interconnectors and storageGone Green Slow Progression Consumer PowerNo Progression
0
30
20
10
25
15
5
2020 2025 2030 20352020 2025 2030 20352020 2025 2030 203520202015/16
2025 2030 2035
GW
Electricity Ten Year Statement November 2016 67

Cha
pter
thre
e
The electricity transmission network
Figure WB.2 Gross demand scenarios for the Western boundaries region
The majority of expected westerly increases in generation are from low carbon technologies, embedded generation and interconnectors. Most of this is expected in the Wales region.
The transmission network in North Wales consists of only nine 400kV double circuits with limited capacity which are likely to be stressed to their capability limits if much of the new future generation connects. The potential limitation on future power exports are covered by boundaries NW1, NW2 and NW3.
From South Wales (boundary SW1) power flows to the South Midlands and the South of England may be driven by the large amount of low-carbon generation, mainly tidal and battery storage, as well as embedded generation that are in the future energy scenarios. The transmission network in the area is connected by seven 275kV double circuits and only six
400kV double circuits with limited capacity which will likely be stressed to their capability limits if future generation connects.
The loss of local generator support to Midlands demand (covered by boundaries B8, B9, B17) due to fossil fuelled plant closures will create large power flows through the networks around the Midlands as the demand needs to be supplied from other areas. The generation closures within the Midlands means the much needed dynamic voltage support is lost that facilitates the large transfers to this heavy demand region, potentially leading to voltage depression.
The NOA2 will consider scenarios and accordingly recommend preferred reinforcements for this Western transmission region.
Gone Green Slow Progression Consumer Power No Progression
0.0
8.0
16.0
14.0
12.0
10.0
4.0
6.0
2.0
GW
2015 2020 2025 2030 2035 2015 2020 2025 2030 2035 2015 2020 2025 2030 2035 2015 2020 2025 2030 2035
Electricity Ten Year Statement November 2016 68

Chapter three
Figure B8.1 Geographic representation of boundary B8
Boundary B8 – North to Midlands
The North to Midlands boundary B8 is one of the wider boundaries that intersects the centre of GB, separating the northern generation zones including Scotland, Northern England and North Wales from the Midlands and southern demand centres. The boundary crosses four major 400kV double circuits,
with two of those passing through the East Midlands while the other two pass through the West Midlands, and a limited 275kV connection to South Yorkshire. Power generated from Scotland continues to be transported south, leading to the high transfer level across B8.
To Ireland
NorfolkConnah’s Quay
SuttonBridge
Shell Flats
Rhyl Flats
Burbo Bank
Gwynt y Mor
Docking Shoal
Humber Gateway
Sheringham Shoal
North Hoyle
Lynn
Inner Dowsing
Triton Knoll
Lincs
Race Bank Dudgeon
Scroby sands
B8
B8
Penn
Drax
Wylfa
Legacy
Pentir
Kirkby
Elland
Keadby
Cottam
Kitwell
Walpole
Grendon
Rugeley
Deeside
Norwich Main
Enderby
Bramford
Bredbury
Drakelow
Pitsmoor
NeepsendAldwarke
Sizewell
Rochdale
Feckenham
Bicker Fen
Staythorpe
Ffestiniog
Penwortham
Shrewsbury
Willington
Cellarhead
EatonSocon
Trawsfynydd
Grimsby West
Chesterfield
Burwell Main
Dinorwig
Rainhill
Capenhurst Frodsham
WashwayFarm
South Manchester
Carrington
DainesFiddlersFerry
Macclesfield
Kearsley Whitegate
Stalybridge
Coventry
Nechells
Willenhall Bustleholm
Hams Hall
BerkswellOldbury
Bishops Wood
Ironbridge
Ocker Hill
SpaldingNorth
Ferrybridge Eggborough
ThorpeMarsh
Thurcroft
Brinsworth
HighMarnham
TempleboroughWestMelton
Norton LeesJordanthorpe
Sheffield City
Winco BankStocksbridge West
Burton
Saltend South
SouthHumberBank
KillingholmeHumber Refinery
Stoke Bardolph
Bushbury
Bodelwyddan
Hedon
To Ireland
Ratcliffeon Soar
Rocksavage
Necton
Electricity Ten Year Statement November 2016 69

Cha
pter
thre
e
The electricity transmission network
Figure B8.2 Required transfer and base capability for boundary B8
Boundary requirements and capability Figure B8.2 above shows the required transfers for boundary B8 from 2016 to 2040. The boundary capability is a thermal loading limit at 10.9 GW when a double-circuit fault on the Legacy–Shrewsbury & Legacy–Ironbridge circuits overloads the Cellarhead–Drakelow circuit.
Across all future energy scenarios there is a steady increase in the required transfer until 2028, when the Slow Progression and Consumer Power scenarios flatten out and the No Progression scenario decreases. The Gone Green scenario continues to increase until 2033 after which it declines and flattens out. The required transfer between Gone Green 2015 and 2016 starts to diverge significantly after year 2021 as plants are closed earlier than expected.
Gone Green 2016Slow Progression 2016No Progression 2016Consumer Power 2016
Base CapabilityGone Green 2015Slow Progression 2015No Progression 2015Consumer Power 2015
GW
2 0
4 6 8
10 12
20
16 18
14
2016 2018 2020 2022 2024 2026 2028 2030 2032 2034 2036 2038 2040
Electricity Ten Year Statement November 2016 70

Chapter three
Figure B9.1 Geographic representation of boundary B9
Boundary B9 – Midlands to South
The Midlands to South boundary B9 separates the northern generation zones and the southern demand centres. The boundary crosses five major 400kV double circuits, transporting power from the north over a long distance to the southern demand hubs,
including London. Developments in the East Coast and the East Anglia regions, such as the locations of offshore wind generation connection and the network infrastructure requirements, will affect the transfer requirements and capability of boundary B9.
To Ireland
NorfolkConnah’s Quay
SuttonBridge
Shell Flats
Rhyl Flats
Burbo Bank
Gwynt y Mor
Docking Shoal
Humber Gateway
Sheringham Shoal
North Hoyle
Lynn
Inner Dowsing
Triton Knoll
Lincs
Race Bank Dudgeon
Scroby sands
B9
B9
Penn
Drax
Wylfa
Legacy
Pentir
Kirkby
Elland
Keadby
Cottam
Kitwell
Walpole
Grendon
Rugeley
Deeside
Norwich Main
Enderby
Bramford
Bredbury
Drakelow
Pitsmoor
NeepsendAldwarke
Sizewell
Rochdale
Feckenham
Bicker Fen
Staythorpe
Ffestiniog
Penwortham
Shrewsbury
Willington
Cellarhead
EatonSocon
Trawsfynydd
Grimsby West
Chesterfield
Burwell Main
Dinorwig
Rainhill
Capenhurst Frodsham
WashwayFarm
South Manchester
Carrington
DainesFiddlersFerry
Macclesfield
Kearsley Whitegate
Stalybridge
Coventry
Nechells
Willenhall Bustleholm
Hams Hall
BerkswellOldbury
Bishops Wood
Ironbridge
Ocker Hill
SpaldingNorth
Ferrybridge Eggborough
ThorpeMarsh
Thurcroft
Brinsworth
HighMarnham
TempleboroughWestMelton
Norton LeesJordanthorpe
Sheffield City
Winco BankStocksbridge West
Burton
Saltend South
SouthHumberBank
KillingholmeHumber Refinery
Stoke Bardolph
Bushbury
Bodelwyddan
Hedon
To Ireland
Ratcliffeon Soar
Rocksavage
Necton
Electricity Ten Year Statement November 2016 71

Cha
pter
thre
e
The electricity transmission network
Figure B9.2 Required transfer and base capability for boundary B9
Boundary requirements and capability Figure B9.2 above shows the required transfers for boundary B9 from 2016 to 2040. The boundary capability is thermally limited at 12.3 GW for a double-circuit fault on the Feckenham–Ironbridge–Bishops Wood circuits which overloads the Drakelow– Hams Hall circuit.
Across all future energy scenarios there is large gap between this year and last year required transfers for boundary B9. This is mainly due to early closure of existing plants and later replacement by wind generation. Also, with the amount of interconnectors planning to connect north of the boundary, the required transfers of boundary B9 will vary greatly depending on the operation of these interconnectors.
Gone Green 2016Slow Progression 2016No Progression 2016Consumer Power 2016
Base CapabilityGone Green 2015Slow Progression 2015No Progression 2015Consumer Power 2015
GW
2
0
4
6
8
10
12
14
2016 2018 2020 2022 2024 2026 2028 2030 2032 2034 2036 2038 2040
Electricity Ten Year Statement November 2016 72
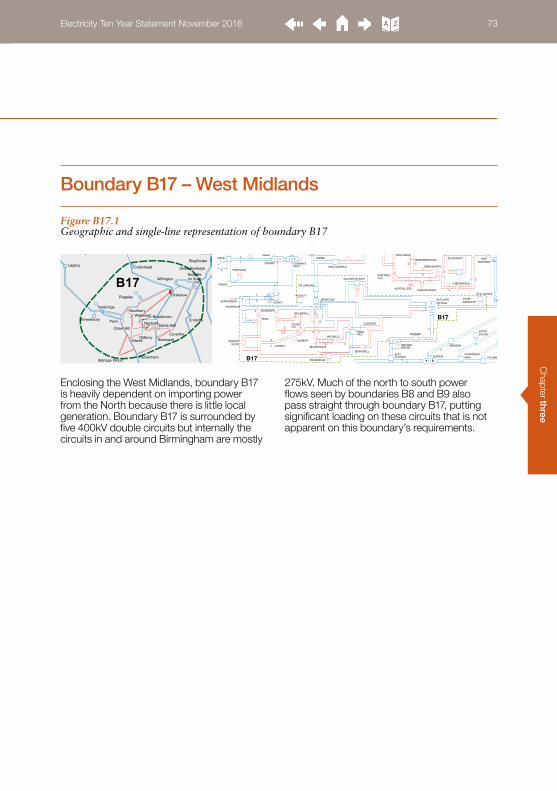
Chapter three
Figure B17.1 Geographic and single-line representation of boundary B17
Boundary B17 – West Midlands
Enclosing the West Midlands, boundary B17 is heavily dependent on importing power from the North because there is little local generation. Boundary B17 is surrounded by five 400kV double circuits but internally the circuits in and around Birmingham are mostly
275kV. Much of the north to south power flows seen by boundaries B8 and B9 also pass straight through boundary B17, putting significant loading on these circuits that is not apparent on this boundary’s requirements.
B17
Penn
Legacy
Kitwell
Rugeley
Enderby
Drakelow
Feckenham
Staythorpe
Shrewsbury
Willington
Cellarhead
Coventry
Nechells
Willenhall Bustleholm
Hams Hall
BerkswellOldbury
Bishops Wood
Ironbridge
Ocker Hill
Stoke Bardolph
Bushbury
Ratcliffeon Soar
B17
B17
1
1 2
1 21 2
1
2
2
1
DRAKELOW
FFESTINIOG
1 2
CHESTERFIELD
STAYTHORPE
1
2
OCKER
BISHOPSWOOD
1
RUGELEY
LEGACY
1
1
1
112
2
2
2 2
2
2COVENTRY
HAMSHALL
1
IRONBRIDGE
PENN
BUSHBURY
HILL
WILLENHALL
CELLARHEAD
FECKENHAM
BERKSWELL
NECHELLS
BUSTLEHOLM
OLDBURY
KITWELL
ON SOARRATCLIFFE
1
2
WILLINGTON EAST
1
2
DEESIDE
1
21
1
1
1
2
2
2
2
THURCROFT
BRINSWORTH
DAINES HIGH
JORDANTHORPENORTON LEES
TEMPLEBOROUGH
SHEFFIELDCITY
MACCLESFIELD
MARNHAM
EATONSOCON
PELHAMSUNDONWYMONDLEYMAIN
GRENDON
ENDERBY
1
12
2
2
SHREWSBURY
PATFORDBRIDGE
EASTCLAYDON
21
1
2 1
STOKEBARDOLPH
EIRGRID
CONNAH’SQUAY
21
Electricity Ten Year Statement November 2016 73

Cha
pter
thre
e
The electricity transmission network
Figure B17.2 Required transfer and base capability for boundary B17
Boundary requirements and capability Figure B17.2 above shows the required transfers for boundary B17 from 2016 to 2040. The boundary capability is voltage compliance limited to 7.4 GW for a double circuit fault on Legacy–Shrewsbury and Legacy–Ironbridge circuits, affecting Ironbridge substation’s ability to stay above the SQSS minimum voltage limits. The required transfers resulting from the future energy scenarios suggest a general
increase in the importing requirements after 2017 – this is due to reducing output from the enclosed thermal generation, rather than a significant increase in local demand.
Reduced availability of local thermal generation poses some challenges for boundary B17. The resulting reduction of reactive power support to maintain voltage compliance decreases the boundary capability to support local demand.
Gone Green 2016Slow Progression 2016No Progression 2016Consumer Power 2016
Base CapabilityGone Green 2015Slow Progression 2015No Progression 2015Consumer Power 2015
GW
2
0
4
6
8
10
1
3
5
7
9
2016 2018 2020 2022 2024 2026 2028 2030 2032 2034 2036 2038 2040
Electricity Ten Year Statement November 2016 74

Chapter three
Figure NW.1 Geographic representation of North Wales boundaries
The onshore network in North Wales comprises a 400kV circuit ring that connects Pentir, Deeside and Trawsfynydd substations. A 400kV double-circuit spur crossing the Menai Strait and running the length of Anglesey connects the now decommissioned nuclear power station at Wylfa to Pentir. A short 400kV double-circuit cable spur from Pentir connects Dinorwig pumped storage power station.
In addition, a 275kV spur traverses north of Trawsfynydd to Ffestiniog pumped storage power station. Most of these circuits are of double-circuit tower construction. However, Pentir and Trawsfynydd within the Snowdonia National Park are connected by a single 400kV circuit, which is the main limiting factor for capacity in this area.
North Wales – overview
To Ireland
Connah’s Quay
MiddletonBarrow
Ormonde
Rhyl Flats
Burbo Bank
Gwynt y Mor
Walney I & II
West of Duddon
North Hoyle
NW1
NW2
NW3Penn
Pyle
Wylfa
Legacy
Stanah
Pentir
Kirkby
Hutton
Walham
Margam
Rassau
Seabank
Whitson
Padiham
Rugeley
Deeside
Heysham
Aberthaw
Rochdale
PembrokeCilfynydd
Ffestiniog
Penwortham
Shrewsbury
Trawsfynydd
Dinorwig
Rainhill
Capenhurst Frodsham
WashwayFarm
South Manchester
Carrington
DainesFiddlersFerry
Kearsley Whitegate
Swansea North
Baglan Bay
CardiffEast
Tremorfa
Alpha SteelUpper Boat Uskmouth
ImperialPark
Iron Acton
Quernmore
Bishops Wood
Ironbridge
Ocker Hill
Bodelwyddan
To Ireland
Rocksavage
Electricity Ten Year Statement November 2016 75

Cha
pter
thre
e
The electricity transmission network
Figure NW1.1 Geographic and single-line representation of boundary NW1
Boundary NW1 – Anglesey
Boundary NW1 is a local boundary crossing the 400kV double circuit that runs along Anglesey between Wylfa and Pentir substations.
To Ireland
Connah’s Quay
MiddletonBarrow
Rhyl Flats
Burbo Bank
Gwynt y Mor
Walney I & II
West of Duddon
North Hoyle
NW1
Penn
Wylfa
Legacy
Stanah
Pentir
Kirkby
Padiham
Deeside
Heysham
Rochdale
Ffestiniog
Penwortham
Shrewsbury
Trawsfynydd
Dinorwig
Rainhill
Capenhurst Frodsham
WashwayFarm
South Manchester
Carrington
FiddlersFerry
Kearsley
Quernmore
Bishops Wood
Ironbridge
Bodelwyddan
To Ireland
Rocksavage
NW1
NW1
1 2
1 2
1
2
FFESTINIOG
1
1
2
2
WYLFA
PENTIR
DINORWIG
RUGELEY
LEGACY
1
2
IRONBRIDGE
CELLARHEAD
1
2
TRAWSFYNYDD
DEESIDE
1
1
1
1
1
1
22
2
2
2
2
DAINES
BIRKENHEAD
FRODSHAM
SHREWSBURY
21EIRGRID
CARRINGTON
BODELWYDDAN
CONNAH’SQUAY
ROCKSAVAGE
21
Electricity Ten Year Statement November 2016 76

Chapter three
Figure NW1.2 Boundary export requirements and base capability for boundary NW1
Boundary requirements and capability Figure NW1.2 above shows the export requirements for boundary NW1 from 2016 to 2040. The boundary transfer capability is limited by the infrequent infeed loss risk criterion set in the SQSS, which is currently 1,800 MW. If the infrequent infeed loss risk is exceeded, the boundary will need to be reinforced by adding a new transmission route across the boundary.
The future energy scenarios all show a similar requirement until 2026 where they diverge. The only large-scale generation expected behind NW1 is a new nuclear power station which appears in the background in two stages and within different time horizons. This power station is not expected to be in the background generation as per the No Progression energy scenario.
Gone Green 2016Slow Progression 2016No Progression 2016Consumer Power 2016
Base CapabilityGone Green 2015Slow Progression 2015No Progression 2015Consumer Power 2015
GW
-0.5
0
0.5
2.5
3.0
1.5
2.0
1.0
2016 2018 2020 2022 2024 2026 2028 2030 2032 2034 2036 2038 2040
Electricity Ten Year Statement November 2016 77

Cha
pter
thre
e
The electricity transmission network
Figure NW2.1 Geographic and single-line representation of boundary NW2
Boundary NW2 – Anglesey and Caernarvonshire
This local boundary bisects the North Wales mainland close to Anglesey and crosses through the Pentir to Deeside 400kV double circuit and Pentir to Trawsfynydd 400kV single circuit.
To Ireland
Connah’s Quay
Middleton
NW2
Barrow
Rhyl Flats
Burbo Bank
Gwynt y Mor
Walney I & II
West of Duddon
North Hoyle
Penn
Wylfa
Legacy
Stanah
Pentir
Kirkby
Padiham
Deeside
Heysham
Rochdale
Ffestiniog
Penwortham
Shrewsbury
Trawsfynydd
Dinorwig
Rainhill
Capenhurst Frodsham
WashwayFarm
South Manchester
Carrington
FiddlersFerry
Kearsley
Quernmore
Bishops Wood
Ironbridge
Bodelwyddan
To Ireland
Rocksavage
NW2
NW2
1 2
1 2
1
2
FFESTINIOG
1
1
2
2
WYLFA
PENTIR
DINORWIG
RUGELEY
LEGACY
1
2
IRONBRIDGE
CELLARHEAD
1
2
TRAWSFYNYDD
DEESIDE
1
1
1
1
1
1
22
2
2
2
2
DAINES
BIRKENHEAD
FRODSHAM
SHREWSBURY
21EIRGRID
CARRINGTON
BODELWYDDAN
CONNAH’SQUAY
ROCKSAVAGE
21
Electricity Ten Year Statement November 2016 78

Chapter three
Figure NW2.2 Boundary export requirements and base capability for boundary NW2
Boundary requirements and capability Figure NW2.2 above shows the export requirements for boundary NW2 from 2016 to 2040. The boundary capability is thermally limited at 1.4 GW for a double circuit fault on the Deeside–Pentir circuits which overloads the Pentir–Trawsfynydd single circuit.
The future energy scenarios all show a similar requirement until 2024 where they diverge due to different assumptions of connection time and dispatching of potential interconnector, wind and nuclear generation behind this boundary.
Gone Green 2016Slow Progression 2016No Progression 2016Consumer Power 2016
Base CapabilityGone Green 2015Slow Progression 2015No Progression 2015Consumer Power 2015
GW
1
0
2
3
5
7
6
4
2016 2018 2020 2022 2024 2026 2028 2030 2032 2034 2036 2038 2040
Electricity Ten Year Statement November 2016 79

Cha
pter
thre
e
The electricity transmission network
Figure NW3.1 Geographic and single-line representation of boundary NW3
Boundary NW3 – Anglesey and Caernarvonshire and Merionethshire
Boundary NW3 provides transfer capability for further generation connections in addition to those behind NW1 and NW2. This boundary is defined by a pair of 400kV double circuits from Pentir to Deeside and Trawsfynydd to the Treuddyn Tee.
To Ireland
Connah’s Quay
Middleton
NW3
Barrow
Rhyl Flats
Burbo Bank
Gwynt y Mor
Walney I & II
West of Duddon
North Hoyle
Penn
Wylfa
Legacy
Stanah
Pentir
Kirkby
Padiham
Deeside
Heysham
Rochdale
Ffestiniog
Penwortham
Shrewsbury
Trawsfynydd
Dinorwig
Rainhill
Capenhurst Frodsham
WashwayFarm
South Manchester
Carrington
FiddlersFerry
Kearsley
Quernmore
Bishops Wood
Ironbridge
Bodelwyddan
To Ireland
Rocksavage
NW3
NW3
1 2
1 2
1
2
FFESTINIOG
1
1
2
2
WYLFA
PENTIR
DINORWIG
RUGELEY
LEGACY
1
2
IRONBRIDGE
CELLARHEAD
1
2
TRAWSFYNYDD
DEESIDE
1
1
1
1
1
1
22
2
2
2
2
DAINES
BIRKENHEAD
FRODSHAM
SHREWSBURY
21EIRGRID
CARRINGTON
BODELWYDDAN
CONNAH’SQUAY
ROCKSAVAGE
21
Electricity Ten Year Statement November 2016 80

Chapter three
Figure NW3.2 Boundary export requirements and base capability for boundary NW3
Boundary requirements and capability Figure NW3.2 above shows the export requirements for boundary NW3 from 2016 to 2040. The boundary capability is thermally limited at 5.6 GW for a double-circuit fault on the Trawsfynydd–Treuddyn Tee circuits which overloads the Deeside–Bodelwyddan Tee circuits.
The future energy scenarios all show a similar requirement until 2024 where they diverge due to different assumptions of connection time and dispatching of potential interconnector, wind and nuclear generation behind this boundary.
Gone Green 2016Slow Progression 2016No Progression 2016Consumer Power 2016
Base CapabilityGone Green 2015Slow Progression 2015No Progression 2015Consumer Power 2015
GW
1
0
2
3
5
7
6
4
2016 2018 2020 2022 2024 2026 2028 2030 2032 2034 2036 2038 2040
Electricity Ten Year Statement November 2016 81

Cha
pter
thre
e
The electricity transmission network
Figure SW1.1 Geographic representation of boundary SW1
Boundary SW1 – South Wales
Boundary SW1 encloses South Wales and is considered a local boundary. Within the boundary are a number of thermal generators powered by coal. Some of the older power stations are expected to close in the future but significant amounts of new generation capacity
are expected to connect, including generators powered by wind, gas and tidal.
South Wales includes demand consumptions from the major cities, including Swansea and Cardiff, and the surrounding industry.
SW1
SW1Pyle
Walham
Margam
Rassau
Minety
Seabank
Taunton
Whitson
MelkshamAberthaw
PembrokeCilfynydd
Bridgwater
Alverdiscott
Hinkley Point
Swansea North
Baglan Bay
CardiffEast
Tremorfa
Alpha SteelUpper Boat Uskmouth
ImperialPark
Iron Acton
Electricity Ten Year Statement November 2016 82

Chapter three
Figure SW1.2 Boundary export requirements and base capability for boundary SW1
Boundary requirements and capability Figure SW1.2 above shows the export requirements for boundary SW1 from 2016 to 2040. The boundary capability is thermally limited at 3.9 GW for a fault on the Rassau–Walham and Cilfynydd–Whitson–Seabank circuits overloading the remaining circuits.
The plots for the future energy scenarios and sensitivities show a short-term reduction in requirements between 2018 and 2020 due to the expected closures of some existing generation.
The rapid increase in requirements after 2025 across all scenarios is caused by the connection of some new thermal plants, and large amounts of renewable generation in later years in some of the scenarios.
Gone Green 2016Slow Progression 2016No Progression 2016Consumer Power 2016
Base CapabilityGone Green 2015Slow Progression 2015No Progression 2015Consumer Power 2015
GW
1
0
2
3
5
8
7
6
4
2016 2018 2020 2022 2024 2026 2028 2030 2032 2034 2036 2038 2040
Electricity Ten Year Statement November 2016 83

Cha
pter
thre
e
The electricity transmission network
Figure 3.7 East England transmission network
3.7 Network capability and requirements by region: Eastern boundaries
IntroductionThe East of England region includes the counties of Norfolk and Suffolk. The transmission boundaries EC3 and EC5 cover the transmission network in the area. Both boundaries are considered local, based on the generation and demand currently connected.
The figure below shows likely power flow directions in the years to come up to 2026. The arrows in the diagram are meant to illustrate power flow directions and are not drawn to scale to reflect the magnitude of power flows.
To Netherlands
SuttonBridge
Kentish Flats
Gunfleet Sands I&II
London Array
Thanet
Docking Shoal
Greater Gabbard 500MW
Sheringham Shoal
Greater Gabbard 2nd part
Lynn
Scroby sands
GrainHurst
SundonPelham
Warley
Kemsley
Walpole
Rowdown
Norwich Main
Bramford
Sizewell
Rye House
Wymondley
Bicker Fen
EatonSocon
Burwell Main
CanterburyNorth
Braintree
WalthamCross
SpaldingNorth
Rayleigh Main
Coryton
SinglewellKingsnorth
Littlebrook
WimbledonBeddington
Chessington
St JohnsWood
EalingWillesden
Elstree
Tottenham Redbridge
Barking
TilburyCity Rd
NewCross
Hackney
Brimsdown
West Ham
NorthfleetEast
West Thurrock
Cleve Hill
Mill Hill
Necton
Electricity Ten Year Statement November 2016 84

Chapter three
Primary challenge statementWith the large amount of generation contracted to be connected, predominantly offshore wind and nuclear, in the area, supply may significantly exceed the local demand which could cause heavy circuit loading, voltage depressions and stability issues.
Regional driversThe future energy scenarios highlight that generation between 6.5 and 18 GW could be expected to connect within this region by 2035. All scenarios show that, in the years to come, large amounts of low carbon generation, predominantly wind, can be expected to connect. Fossil fuel generation can also be expected to connect within this region. The total generation in all the scenarios will exceed the local demand; thus East Anglia will be a power exporting region.
Figure EB.1 Generation mix scenarios for the Eastern boundaries region
Low carbon (including renewables) Fossil fuel Interconnectors and storage
GW
0
8
20
16
12
4
6
18
14
10
2
2020 2025 2030 20352020 2025 2030 20352020 2025 2030 203520202015/16
2025 2030 2035
Gone Green Slow Progression Consumer PowerNo Progression
Electricity Ten Year Statement November 2016 85

Cha
pter
thre
e
The electricity transmission network
Figure EB.2 Gross demand scenarios for the Eastern boundaries region
Gone Green Slow Progression Consumer Power No Progression
GW
0.0
2.0
5.0
4.0
3.0
1.0
2015 2020 2025 2030 2035 2015 2020 2025 2030 2035 2015 2020 2025 2030 2035 2015 2020 2025 2030 2035
Electricity Ten Year Statement November 2016 86

Chapter three
Peak demand in the Eastern region is expected to lie between 3.5 and 4.5 GW by 2035. The graph above shows snapshots of the peak demand for the east England across the four different future energy scenarios.
The East Anglia transmission network to which the future energy scenarios generation will connect has six 400kV double circuits. The potential future increase in generation within this region could force the network to experience very heavy circuit loading, stability issues and voltage depressions – for power transfer scenarios from East Anglia to London and South East England. This is explained as follows: The East England region is connected by
several sets of long 400kV double circuits, including Bramford Pelham/Braintree, Walpole–Spalding North/Bicker Fen and Walpole–Burwell Main. During a fault on any one set of these circuits, power exported from this region is forced to reroute. This causes some of the power to flow through a much longer distance to reach the rest of the system, predominantly the Greater London and South East England networks via the East Anglia region. As a result, the reactive power losses in these high impedance routes will also increase. If these losses are not compensated they will eventually lead to voltage depressions within the region.
Stability becomes an additional concern when some of the large generators connect, further increasing the size of the generation group in the area connected to the network. Losing a set of double circuits when a fault occurs will lead to significant increases in the impedance of the connection between this large generation group and the remainder of the system. As a result, the system may be exposed to a risk of instability as power transfer increases.
It is also important to ensure that all the transmission routes in the area will have sufficient thermal capacity to cope with the increase in export requirement under post-fault conditions.
The NOA2 will assess the impact of the above mentioned potential scenarios and accordingly recommend preferred reinforcements for the East of England transmission region.
Electricity Ten Year Statement November 2016 87

Cha
pter
thre
e
The electricity transmission network
Figure EC3.1 Geographic and single-line representation of boundary EC3
Boundary EC3 – Wash
Boundary EC3 is a local boundary surrounding the Walpole substation. It includes six 400kV circuits out of Walpole; two single circuits (Walpole–Bicker Fen and Walpole–Spalding North), and two double circuits (Walpole–Norwich and Walpole–Burwell Main). Walpole
is a critical substation in supporting significant generation connections, high demand and high network power flows along the East Coast network, which is why it is selected for local boundary assessment.
SuttonBridge
Docking Shoal
Sheringham ShoalLynn
Inner Dowsing
Lincs
Race Bank Dudgeon
Scroby sands
EC3
Walpole
Norwich Main
Bicker Fen
SpaldingNorth Necton
EC3
NORWICHMAIN
WALPOLE12
SPALDINGNORTH
NECTON
SUTTONBRIDGE
Electricity Ten Year Statement November 2016 88

Chapter three
Figure EC3.2 Boundary export requirements and base capability for boundary EC3
Boundary requirements and capability Figure EC3.2 above shows the export requirements for boundary EC3 from 2016 to 2040. The boundary capability is currently a thermal limit at 3.1 GW for a double circuit fault on the Bicker Fen–West Burton double circuits which overloads the Walpole–Burwell Main circuits.
The plots show that the export requirements of the boundary increase across all future energy scenarios but that the present capability should be sufficient for at least the next few years.
Gone Green 2016Slow Progression 2016No Progression 2016Consumer Power 2016
Base CapabilityGone Green 2015Slow Progression 2015No Progression 2015Consumer Power 2015
GW
-0.5
0
0.5
2.5
3.5
3.0
1.5
2.0
1.0
2016 2018 2020 2022 2024 2026 2028 2030 2032 2034 2036 2038 2040
Electricity Ten Year Statement November 2016 89

Cha
pter
thre
e
The electricity transmission network
Figure EC5.1 Geographic and single-line representation of boundary EC5
Boundary EC5 – East Anglia
Boundary EC5 is a local boundary enclosing most of East Anglia with 400kV substations at Norwich, Sizewell and Bramford. It crosses four 400kV circuits that mainly export power towards London.
The coastline and waters around East Anglia are attractive for the connection of offshore wind projects including the large East Anglia Round 3 offshore zone that lies directly to the east. The existing nuclear generation site at Sizewell is one of the approved sites selected for new nuclear generation development.
To Netherlands
Norfolk
Kentish Flats
Gunfleet Sands I&II
London Array
Thanet
Docking Shoal
Greater Gabbard 500MW
Sheringham Shoal
Greater Gabbard 2nd part
Lynn
Inner Dowsing
Lincs
Race Bank Dudgeon
Scroby sands
EC5
EC5
Grain
Warley
Kemsley
Norwich Main
Bramford
Sizewell
CanterburyNorth
Braintree
Rayleigh Main
Coryton
SinglewellKingsnorth
Littlebrook
Tilbury
NorthfleetEast Cleve Hill
Necton
EC5
NORWICHMAIN
BURWELLMAIN
BRAMFORD
SIZEWELL
RAYLEIGH MAIN
NECTON
Electricity Ten Year Statement November 2016 90

Chapter three
Figure EC5.2 Boundary export requirements and base capability for boundary EC5
Boundary requirements and capability Figure EC5.2 above shows the export requirements for boundary EC5 from 2016 to 2040. The boundary capability is currently a voltage compliance limit at 3.8 GW for a double-circuit fault on the Bramford– Pelham and Bramford–Braintree–Rayleigh Main circuits.
The offshore wind and nuclear generation contracted to connect behind this boundary greatly increase the transfer capability requirements. This is particularly prominent with the Gone Green scenario.
The present boundary capability is sufficient for today’s needs but potentially grossly short of the future capability requirement needs.
Gone Green 2016Slow Progression 2016No Progression 2016Consumer Power 2016
Base CapabilityGone Green 2015Slow Progression 2015No Progression 2015Consumer Power 2015
GW
2
0
4
6
8
10
12
16
14
2016 2018 2020 2022 2024 2026 2028 2030 2032 2034 2036 2038 2040
Electricity Ten Year Statement November 2016 91

Cha
pter
thre
e
The electricity transmission network
Figure 3.8 South England transmission network
3.8 Network capability and requirements by region: Southern boundaries
IntroductionThe South of England transmission region includes boundaries B13, B14, SC1 and SC2. The region includes the high demand area of London, generation around the Thames estuary and the long set of circuits that run around the south coast. Interconnection to Central Europe is connected along the South
East Coast and this interconnection has significant influence on power flows in the region by being able to both import and export power with Europe. The figure below shows likely power flow directions in the years to come up to 2026. The arrows in the diagram are meant to give illustration to power flows but are not to scale.
To France
To Netherlands
Rampion
Kentish Flats
Gunfleet Sands I&II
London Array
Thanet
Greater Gabbard 2nd part
Iver
Fleet
Abham
GrainHurst
Warley
Cowley
Bolney
Minety
Exeter
Fawley
Didcot
Seabank
Taunton
KemsleyLaleham
Rowdown
NinfieldLovedean
Nursling
Melksham
Landulph
Rye House
Sellindge
Wymondley
Axminster
Bridgwater
Mannington
Chickerell
Langage
Indian Queens
Hinkley Point
Dungeness
CanterburyNorth
WalthamCross
Iron Acton
Marchwood
Botley Wood
Bramley
Culham Rayleigh Main
Coryton
SinglewellKingsnorth
Littlebrook
WimbledonBeddington
Chessington
West Weybridge
St JohnsWood
EalingWillesden
Watford Elstree
Tottenham Redbridge
Barking
LeightonBuzzard
Amersham Main
TilburyCity Rd
NewCross
Hackney
Brimsdown
West Ham
NorthfleetEast
West Thurrock
Cleve Hill
Mill Hill
Electricity Ten Year Statement November 2016 92

Chapter three
Primary challenge statementEuropean interconnector developments along the south coast could potentially drive very high circuit flows leading to circuit overloads and voltage management issues.
Regional driversThe future energy scenarios suggest that up to 15 GW of connection capacity in the south could be from European interconnection and energy storage. As interconnectors and storage are bi-directional, the south could see their capacity act as up to 15 GW power injection or 15 GW increased demand. This variation could place a very heavy burden on the transmission network. Most of the interconnectors will be connected south of boundary SC1 so the impact on them can be seen later in this chapter from the SC1 requirements.
Peak demand in the south as seen by the transmission network is not expected to change significantly but some reduction may be expected due to greater consumer energy
efficiency and increasing embedded generation capacity. The graph below shows snapshots of the peak demand for the south for the four different future energy scenarios.
Figure SB.1 Generation mix scenarios for the Southern boundaries region
Low carbon (including renewables) Fossil fuel Interconnectors and storageGone Green Slow Progression Consumer PowerNo Progression
0
30
20
10
25
15
5
2020 2025 2030 20352020 2025 2030 20352020 2025 2030 203520202015/16
2025 2030 2035
GW
Electricity Ten Year Statement November 2016 93

Cha
pter
thre
e
The electricity transmission network
Figure SB.2 Gross demand scenarios for the Southern boundaries region
The transmission network in the south is heavily meshed in and around London (B14) and the Thames estuary, but below there and towards the west the network becomes more radial with relatively long distances between substations.
In the future, the southern network could potentially see a number of issues driven by future connections and their behaviour. If the interconnectors export power to Europe at the same time that high demand power is drawn both into and through London then the northern circuits feeding London will be thermally overloaded. The high demand and power flows may also lead to voltage depression in London and the south-east.
If the south-east interconnectors are importing from the continent and there is a double circuit fault south of Kemsley, then the south-east circuits may overload and there could be significant voltage depression along the circuits to Lovedean.
With future additional interconnector connections, the south region will potentially be unable to support all interconnectors importing or exporting simultaneously without network reinforcement. Overloading can be expected on many of the southern circuits. The connection of the new nuclear generating units at Hinkley may also require reinforcing the areas surrounding Hinkley. With new interconnector and generation connections boundaries SC1, SC2 and B13 will need to be able to support large power flows in both directions which is different from today when power flow is predominantly in one direction.
The NOA2 will assess the impact of the above mentioned potential scenarios and accordingly recommend preferred reinforcements for the South of England transmission region.
GW
Gone Green Slow Progression Consumer Power No Progression
0.0
8.0
22.0
16.0
12.0
4.06.0
20.018.0
14.0
10.0
2.0
2015 2020 2025 2030 2035 2015 2020 2025 2030 2035 2015 2020 2025 2030 2035 2015 2020 2025 2030 2035
Electricity Ten Year Statement November 2016 94

Chapter three
Figure B13.1 Geographic and single-line representation of boundary B13
Boundary B13 – South West
Wider boundary B13 is defined as the southernmost tip of the UK below the Severn Estuary, encompassing Hinkley Point in the South West and stretching as far east as Mannington. The boundary crossing circuits are the Hinkley Point to Melksham double circuit and the Mannington circuits to Nursling and Fawley. The southwest peninsula is a region with a high level of localised generation
and demand. The boundary is currently an importing boundary, with the demand being higher than the generation at peak demand conditions. With the potential connection of new generation and interconnectors to the South West – including new nuclear and wind generation – the boundary is expected to change to export power more often than import.
B1 3
B1 3
Abham
Exeter
Fawley
Taunton Nursling
MelkshamAberthaw
Landulph
Axminster
Bridgwater
Mannington
Chickerell
Alverdiscott
Langage
Indian Queens
Hinkley Point
CardiffEast
Tremorfa
Marchwood
Bramley
B13
B13BRIDGWATER
CHICKERELL
SEABANK
INDIANQUEENS EXETER
AXMINSTERMANNINGTON NURSLING
FAWLEY
WOOD
1
21
11 2
2
2
1 2HINKLEYPOINT
TAUNTON
1
1
1
FLEET
ABERTHAW
ALVERDISCOTT
2
2
2
LANDULPH
ABHAM
1
2
LANGAGE
MARCHWOOD
2
1
Electricity Ten Year Statement November 2016 95

Cha
pter
thre
e
The electricity transmission network
Figure B13.2 Required transfer and base capability for boundary B13
Boundary requirements and capability Figure B13.2 above shows the required transfers for boundary B13 from 2016 to 2040. The boundary capability is voltage limited at -3.0 GW for a double-circuit fault on the Fawley–Mannington and Nursling–Mannington circuits.
It can be seen that until new generation or interconnectors connects there is very little variation in boundary requirements, and that the current importing boundary capability is sufficient to meet the short-term needs. The large size of the potential new generators wishing to connect close to boundary B13 is likely to push it to large exports and require additional boundary capacity.
Gone Green 2016Slow Progression 2016No Progression 2016Consumer Power 2016
Base CapabilityGone Green 2015Slow Progression 2015No Progression 2015Consumer Power 2015
GW
-4
-3
-2
2
4
0
1
3
-1
2016 2018 2020 2022 2024 2026 2028 2030 2032 2034 2036 2038 2040
Electricity Ten Year Statement November 2016 96

Chapter three
Figure B14.1 Geographic and single-line representation of boundary B14
Boundary B14 – London
Boundary B14 encloses London and is characterised by high local demand and a small amount of generation. London’s energy import relies heavily on surrounding 400kV and 275kV circuits. The circuits entering from the north can be particularly heavily loaded at peak demand conditions. The circuits are further
stressed when the European interconnectors export as power is drawn through London to feed the interconnectors along the south coast. The North London circuits can also be a bottleneck for power flow from the East Coast and East Anglia regions as power flows through London from north to south.
Iver
Fleet
Hurst
SundonPelham
Warley
Laleham
Rowdown
Rye House
WymondleyBraintree
WalthamCross
Singlewell
Littlebrook
WimbledonBeddington
Chessington
West Weybridge
St JohnsWood
EalingWillesden
Watford Elstree
Tottenham Redbridge
Barking
LeightonBuzzard
TilburyCity Rd
NewCross
Hackney
Brimsdown
West Ham
NorthfleetEast
West Thurrock
Mill Hill
B14
B14/B14e
11 21 2
1
2
1 2
12HACKNEY
1 1WIMBLEDON
22 LITTLEBROOKHURSTNEW CROSS
LOVEDEAN
BARKING
1
2
2
2
1 1
1
BRAINTREE
22
2
RYE HOUSE
1
2
2
1
1
1 1
1
1
1 1 1 1
1
11
1
11
1
2
21
W E
34
IVER WATFORDSOUTH
LALEHAM
EALING WILLESDEN
2
1WESTWEYBRIDGE
DIDCOT
COWLEY
CULHAM JET
MAINAMERSHAM
BRAMLEY
FLEET
ST. JOHN’SWOOD
ROAD
1
1
2
2
1
BEDDINGTON
CHESSINGTON1
22
ROWDOWN
22
2
2 2 2 2
2
2 2 2
1
TILBURY
2
22
2
BARKINGREDBRIDGE
BRIMSDOWN
WALTHAMCROSS
WARLEYELSTREE
MILL HILL
BUZZARD
NORTHFLEETEAST
CITY
1
SINGLEWELL
WESTHAM
WEST THURROCK
3 1
2
TOTTENHAM
Electricity Ten Year Statement November 2016 97

Cha
pter
thre
e
The electricity transmission network
Figure B14.2 Required transfer and base capability for boundary B14
Boundary requirements and capability Figure B14.2 above shows the required transfers for boundary B14 from 2016 to 2040. The boundary capability is currently limited by voltage constraints at 12.3 GW for a double-circuit fault on the Pelham–Rye House–Waltham Cross circuits.
As the transfer across this boundary is mostly dictated by the contained demand, the Future Energy Scenario requirements mostly follow the demand with little deviation due to generation changes.
The Slow Progression shows a lower boundary requirement than the Gone Green as the few conventional plants within the boundary are expected to continue operation in that scenario.
Our future energy scenarios consider that during peak demand conditions the European interconnectors may export power to GB. This alleviates loading stress on the North London circuits. Consideration has also been given to interconnectors exporting power out of GB which draws power southwards across London. This increases the north London circuit loading which decreases the boundary capability as less circuit capacity remains to supply London demand.
Gone Green 2016Slow Progression 2016No Progression 2016Consumer Power 2016
Base CapabilityGone Green 2015Slow Progression 2015No Progression 2015Consumer Power 2015
GW
2
0
4
6
8
10
12
14
2016 2018 2020 2022 2024 2026 2028 2030 2032 2034 2036 2038 2040
Electricity Ten Year Statement November 2016 98

Chapter three
Figure SC1.1 Geographic representation of boundary SC1
Boundary SC1 – South Coast
The South Coast boundary SC1 runs parallel with the South Coast of England between the Severn and Thames Estuaries. At times of peak winter GB demand the power flow is typically north to south across the boundary, with more demand enclosed in the south of the boundary than supporting generation. Interconnector
activity can significantly influence the boundary power flow. The current interconnectors to France and the Netherlands connect at Sellindge and Grain respectively. Crossing the boundary are three 400kV double circuits with one in the east, one west and one in the middle between Fleet and Bramley.
To France
Rampion
Kentish FlatsThanet
SC1
SC1
PyleIver
Fleet
Abham
GrainHurst
Margam
Bolney
Exeter
Fawley
Seabank
Taunton
Kemsley
Whitson
Laleham
Rowdown
NinfieldLovedean
Nursling
MelkshamAberthaw
Landulph
Sellindge
Axminster
Bridgwater
Mannington
Chickerell
Alverdiscott
Langage
Indian Queens
Hinkley Point
Dungeness
CanterburyNorth
CardiffEast
Tremorfa
Alpha SteelUskmouth Iron Acton
Marchwood
Botley Wood
Bramley
Coryton
SinglewellKingsnorth
Littlebrook
WimbledonBeddington
Chessington
West Weybridge
St JohnsWood
EalingWillesden Barking
TilburyCity Rd
NewCross
West Ham
NorthfleetEast
West Thurrock
Cleve Hill
Electricity Ten Year Statement November 2016 99

Cha
pter
thre
e
The electricity transmission network
Figure SC1.2 Required transfer and base capability for boundary SC1
Boundary requirements and capability Figure SC1.2 above shows the required transfers produced from the 2016 future energy scenarios for boundary SC1 from 2016 to 2040. Positive values represent power flow across the boundary from north to south. The boundary capability is currently limited by thermal loading at 5.6 GW for a double-circuit fault on the Bramley–Didcot circuits.
The interconnectors to Europe have a massive impact on the power transfers across SC1. A 2 GW interconnector such as IFA can make 4 GW of difference on the boundary if it moves from importing power to export. Some of the
future energy scenarios suggest that up to 15 GW of interconnector capacity could connect below SC1 by 2030.
The volatility of interconnector activity can be seen in the required transfers as the requirements swing from power flow south and north. The SQSS calculation of required transfers does not place high loading on the interconnectors so the transfers are not seen to peak at very high values. Credible sensitivities of the interconnectors operating at their rated capacities suggest that boundary power transfers could exceed 10 GW which is well outside current network capability.
Gone Green 2016Slow Progression 2016No Progression 2016Consumer Power 2016
Base CapabilityGone Green 2015Slow Progression 2015No Progression 2015Consumer Power 2015
GW
-6
2
8
6
4
-2
0
-4
2016 2018 2020 2022 2024 2026 2028 2030 2032 2034 2036 2038 2040
Electricity Ten Year Statement November 2016 100

Chapter three
Figure SC2.1 Geographic and schematic representation of boundary SC2
Boundary SC2 – South East Coast
The new South East Coast boundary SC2 is a subset of the SC1 boundary created to capture transmission issues specifically in the south part of the network between Kemsley and Lovedean. The relatively long 400kV route between Kemsley and Lovedean feeds significant demand and connects both large generators and interconnection to Europe.
A fault at either end of the route can cause it to become a long radial feeder which puts all loading on the remaining two circuits which can be restrictive due to circuit ratings and cause voltage issues.
Additional generation and interconnectors are contracted for connection below SC2 which can place additional burden on the region.
CANTERBURYNORTH
2
CLEVEHILL
1
KEMSLEY
E de F
1
1 1 1 1212
2 2 2 2BOLNEY
NINFIELD
DUNGENESS SELLINDGE
(270kV DC)
21 1 2
1
BEDDINGTON
CHESSINGT ON1
22
ROWDOWN
3 1
2
SC2
SC2
To France
To Netherlands
Rampion
Kentish Flats
Gunfleet Sands I&II
London Array
Thanet
Greater Gabbard 2nd part
Iver
Fleet
GrainHurst
Warley
Cowley
Bolney
Didcot
KemsleyLaleham
Rowdown
NinfieldLovedean
Rye House
Sellindge
Wymondley
Dungeness
CanterburyNorth
Braintree
WalthamCross
Culham Rayleigh Main
Coryton
SinglewellKingsnorth
Littlebrook
WimbledonBeddington
Chessington
West Weybridge
St JohnsWood
EalingWillesden
Watford Elstree
Tottenham Redbridge
Barking
LeightonBuzzard
Amersham Main
TilburyCity Rd
NewCross
Hackney
Brimsdown
West Ham
NorthfleetEast
West Thurrock
Cleve Hill
Mill Hill
SC2
SC2
Electricity Ten Year Statement November 2016 101

Cha
pter
thre
e
The electricity transmission network
Figure SC2.2 Required transfer and base capability for boundary SC2
Boundary requirements and capability Figure SC2.2 above shows the required transfers for boundary SC2 from 2016 to 2040. Positive values represent exporting power flows out of the south east area enclosed by the boundary. The boundary capability is currently voltage stability limited at 3.3 GW.
The interconnectors with Europe have a massive impact on the power transfers across SC2 as a 2 GW interconnector can make 4 GW of difference on the boundary if it moves from import to export. The future energy scenarios suggest that up to 5.4 GW of interconnector capacity could connect below SC1 by 2026.
The volatility of interconnector activity can be seen in the required transfers as the requirements move around significantly. The SQSS calculation of required transfers does not place high loading on the interconnectors so the transfers are not seen to peak at very high values. Credible sensitivities of the interconnectors operating at their rated capacities suggest that boundary power transfers could exceed 6 GW which is well outside current network capability.
Gone Green 2016Slow Progression 2016No Progression 2016Consumer Power 2016
Base CapabilityGone Green 2015Slow Progression 2015No Progression 2015Consumer Power 2015
GW
1
0
-1
2
3
5
6
4
2016 2018 2020 2022 2024 2026 2028 2030 2032 2034 2036 2038 2040
Electricity Ten Year Statement November 2016 102

Chapter three
3.9 Year-round capability
IntroductionThe presentation of the network capability in this chapter focuses on winter peak power flows and winter peak capability. However, to ensure that the network is adequately designed for full year-round operation, further work is done on evaluating other key times of the year. This can include summer peak, summer minimum and other times such as autumn and spring peaks. The type of power transfer limits associated with the network will remain, such as thermal, voltage and stability. However, the absolute limits of the network would be expected to change.
Seasonal factorsThere are many reasons why constraints manifest themselves at times other than winter peak including changes due to the network configuration, generation and demand patterns, transmission equipment outage patterns or the characteristics of transmission equipment related to ambient temperatures. Evaluating the system based on whole year- round planning conditions will allow a future network design to be the most economic and efficient based on expected full year- round operation.
Seasonal circuit ratings – the current-carrying capability of circuits typically reduces during the warmer seasons as the capability of circuit to dissipate heat is reduced. The rating of a typical 400kV overhead line may be 20 per cent lower in the summer than in winter. The use of dynamic circuit ratings is being considered to actively change circuit ratings based on monitored conditions.
Voltage management – at times of low demand especially low reactive power demand the voltages on the NETS can increase naturally due to capacitive gain of the lightly loaded transmission and distribution networks. High voltages need to be controlled in order to avoid voltages rising above equipment ratings and damaging the equipment. There must be enough reactive compensation and switching options to allow effective voltage control.
System stability – with reduced power demand and a tendency for higher system voltages during the summer months, fewer generators will operate. This condition has a tendency to reduce the dynamic stability of the NETS, so we usually analyse network stability for summer minimum demand conditions as well as other key periods. This would normally represent the most onerous condition.
Generation profiles – the winter peak is when the greatest number of generators are operational; at other times of the year the number of generators running can be greatly reduced. Variation of generator operation can be much higher in the summer because generators undergo maintenance, peak demand is reduced and intermittent generation becomes more sporadic. We ensure that all regions are adequately supported at all times.
Electricity Ten Year Statement November 2016 103

Cha
pter
thre
e
The electricity transmission network
A case study of the north, which has recently been evaluated based on year-round capacity, is briefly outlined below.
As well as assessments at winter peak (highlighted in the previous section), we consider year-round conditions to ensure continued demand security and system operability.
This case study considers the northern part of the network from boundary B7a north, including Scotland. The northern area is now predominantly supplied by wind farms and ageing nuclear generators supported by some hydro plant. The nuclear generators are reaching end of life and once they close the north will be very dependent on wind farm output. Some other generation types will remain in the north including hydro, pumped storage and some other generation, but if the nuclear generators close and the wind farms are unavailable the northern electricity demand will become very dependent on supply from the south.
The network has been analysed taking into account different times of year and associated generation and demand backgrounds. Potential issues investigated include: Winter peak – security of winter peak
demand with a deficit of northern generation. Summer peak – security of summer peak
demand with a deficit of northern generation and a depleted network due to seasonal system access requirements and reduced summer circuit ratings.
Summer minimum – under low generation and demand conditions, when the network can be lightly loaded, leading to high voltages.
Stability – system instability may present itself due to a shortage of synchronous machines.
From the investigations the following points have been identified: Large thermal and nuclear plants in
Scotland still play a vital role in managing short-term security of supply issues across Scotland. Securing the peak demand in Scotland at times of low wind generation output requires a variety of generation. This can be provided from various pumped storage and hydro schemes across Scotland, and from further generation at Peterhead, Torness and Hunterston.
Some generation closures will lead to the need to reinforce some parts of the NGET and SPT networks to avoid some circuit overloading and issues associated with low fault-level in the future.
While challenging, we are confident that the voltage and stability of the northern part of the network can be maintained within the required limits from peak to minimum demand conditions. However we have identified under some scenarios that network investment will be required.
The situation will continue to be monitored for change and actions taken as appropriate to ensure system security is maintained.
Case study: Northern security
Electricity Ten Year Statement November 2016 104

Chapter fo
ur
Chapter fourThe way forward 106
Electricity Ten Year Statement November 2016 105

Cha
pter
four
The way forward
The ETYS now completely focuses on communicating future transmission requirements while the Network Options Assessment (NOA2) report (to be published in January 2017) will recommend the SO preferred options for network reinforcements to meet those recognised future transmission requirements. We will continue to discuss with our regulator, Ofgem, how best to use the ETYS and the NOA report as a way to communicate to our stakeholders about the future development, opportunities and challenges in the NETS.
We would like to hear your views on how we should shape both documents to meet your expectations. An indicative timetable for our 2017 ETYS/NOA stakeholder activities programme is shown in Figure 4.1.
4.1 Continuous development
The ETYS and our annual planning process continue to evolve. The changes we’re making reflect developments within the industry, such as the Integrated Transmission Planning and Regulation (ITPR), and the feedback we receive from you, our stakeholders.
Electricity Ten Year Statement November 2016 106

Chapter fo
ur
We welcome your views on this year’s ETYS, and would like to know what you think works well and what you would like us to improve. Please complete our survey at www.surveymonkey.com/r/ETYS2016 and take part in our written consultation (planned for April 2017 for ETYS). Our various stakeholder activities are a great way for us to: learn more about the views and opinions of all
our stakeholders provide opportunities for constructive feedback
and debate create open, two-way communication with
our stakeholders about assumptions, analyses and findings
let stakeholders know how we have taken their views into consideration and the outcomes of our engagement activities.
We are always happy to listen to our stakeholders’ views. We do this through: consultation events as part of the
customer seminars operational forums responses to
[email protected] bilateral stakeholder meetings.
Figure 4.1 ETYS/NOA stakeholder activities programme
ETYS 2017 form submitted to Ofgem
ETYS form written industry consultation
ETYS 2017 published
ETYS 2017 document development
FES 2017 published
NOA3 methodology submitted to Ofgem
ETYS 2016 launch survey
ETYS 2016 published
DecNov AprFeb JunJan MayMar SepAugJul Oct NovNOA3/
ETYS 2018 development
ETYS/NOA Stakeholder engagement/ industry consultation
NOA2 published
Electricity Ten Year Statement November 2016 107

Cha
pter
four
The way forward
You can use our Customer Connection Interface Tool (CCIT) to find out more about our sites, current and future generation connections and timeframes for connecting customers to the Electricity Transmission System in England and Wales. You can also use it to understand the challenges we face in developing the NETS.
Since we introduced Connect and Manage in February 2011, we have been offering connection dates to our generation customers based on the time taken to complete a project's 'enabling works'. Enabling works are those that must be completed to allow local generation to connect to the NETS. Once connected, generators can then access the wider transmission system. The results we present in the ETYS only refer to the requirements for potential wider transmission system reinforcements and not to the enabling works.
You can find more information about Connect and Manage at: www2.nationalgrid.com/UK/Services/Electricity-connections/Industry-products/connect-and-manage/
You can find the latest version of the CCIT on the ETYS website www.nationalgrid.com/etys
4.2 Improving your experience
We have created an interactive tool to help you access network information in a user-friendly way.
Electricity Ten Year Statement November 2016 108

C
hapter five
Chapter fiveAppendices overview 110
Meet the team 112
Glossary 114
Disclaimer 119
Electricity Ten Year Statement November 2016 109

C
hapt
er five
Appendices overview
Appendix A includes a set of system schematics and geographic drawings of the current NETS, with the approximate locations of existing power stations and reactive compensation plants shown. The schematics also show the NETS boundaries and ETYS zones we have used in our analysis.
You can view the system schematics at: www.nationalgrid.com/etys
You can view the geographic drawings at: www.nationalgrid.com/etys
To allow modelling of the transmission network, basic network parameters such as connectivity and impedances are provided in appendix B. The expected changes in the network based on the previous year’s development decisions are also provided.
You can view the system technical data at: www.nationalgrid.com/etys
To demonstrate the impact of future changes on the transmission network, a set of winter peak power flow diagrams are presented in appendix C. These show snapshots of present and future power flows along major circuit routes for the Gone Green scenario. The expected changes in the network are based on the previous year’s development decisions.
You can view the diagrams at: www.nationalgrid.com/etys
Appendix A System schematics and geographic drawings
Appendix B System technical data
Appendix C Power flow diagrams
Electricity Ten Year Statement November 2016 110

C
hapter five
Appendix D gives indications of peak GB fault levels at nodal level for the current and future transmission network. The fault levels are at peak generation and demand conditions and can used to investigate local area system strength.
You can find out more at: www.nationalgrid.com/etys
You can view the fault–level data at: www.nationalgrid.com/etys
Appendix D Fault levels
Electricity Ten Year Statement November 2016 111

C
hapt
er five
Richard SmithHead of Network Capability (Electricity)[email protected]
Julian LeslieElectricity Network Development [email protected]
Graham SteinElectricity Policy and Performance [email protected]
In addition to publishing the ETYS we are responsible for developing a holistic strategy for the NETS. This includes performing the following key activities: The management and implementation of the
Network Options Assessment (NOA) process in order to assess the need to progress wider transmission system reinforcements.
Producing recommendations on preferred options for NETS investment under the new ITPR arrangements and publishing results annually in the NOA report.
Managing the technical activities relating to offshore electricity network design.
Facilitating system access for NETS development or maintenance activities while ensuring the system can be operated both securely and economically.
You can contact us to discuss about:
Network requirements and Electricity Ten Year Statement
Nicholas HarveyGB System Capability [email protected]
Cost–benefit analysis and Network Options Assessment
Keith DanTechnical and Economic Assessment [email protected]
Electricity network development
Meet the ETYS team
Electricity Ten Year Statement November 2016 112

C
hapter five
We are responsible for a variety of power system issues including generator and HVDC compliance. We develop and produce the System Operability Framework each year and provide power system models and datasets for network analysis. Our works also include managing the technical aspects of the GB and European electricity frameworks, codes and standards that are applicable to network development.
Contact details to discuss the network data used in ETYS are:
Stuart BoyleData and Modelling [email protected]
Strategic network planning and producing the ETYS requires support and information from many people. Parties who provide support and information that makes our work possible include: National Grid Electricity Transmission
Asset Management SHE Transmission and SP Transmission our customers.
Don’t forget you can also email us with your views on ETYS at: [email protected]
You can also join our mailing list to receive ETYS email updates at: www.nationalgrid.com/updates
Electricity policy and performance
Supporting parties
Electricity Ten Year Statement November 2016 113

C
hapt
er five
Acronym Term Description
ACS Average cold spell Average cold spell is defined as a particular combination of weather elements which gives rise to a level of winter peak demand which has a 50% chance of being exceeded as a result of weather variation alone. There are different definitions of ACS peak demand for different purposes.
Ancillary services Services procured by a system operator to balance demand and supply and to ensure the security and quality of electricity supply across the transmission system. These services include reserve, frequency control and voltage control. In GB these are known as balancing services and each service has different parameters that a provider must meet.
BEIS Department of Business, Energy & Industrial Strategy
A UK government department. The Department of Business, Energy & Industrial Strategy (BEIS) works to make sure the UK has secure, clean, affordable energy supplies and promote international action to mitigate climate change. These activities were formerly the responsibility of the Department of Energy and Climate Change (DECC) which closed in July 2016.
Boundary allowance An allowance in MW to be added in whole or in part to transfers arising out of the NETS SQSS economy planned transfer condition to take some account of year-round variations in levels of generation and demand. This allowance is calculated by an empirical method described in Appendix F of the security and quality of supply standards (SQSS).
Boundary transfer capacity
The maximum pre-fault power that the transmission system can carry from the region on one side of a boundary to the region on the other side of the boundary while ensuring acceptable transmission system operating conditions will exist following one of a range of different faults.
CBA Cost–benefit analysis A method of assessing the benfits of a given project in comparison to the costs. This tool can help to provide a comparative base for all projects to be considered.
CCGT Combined cycle gas turbine
Gas turbine that uses the combustion of natural gas or diesel to drive a gas turbine generator to generate electricity. The residual heat from this process is used to produce steam in a heat recovery boiler which in turn, drives a steam turbine generator to generate more electricity.
CCS Carbon capture and storage
Carbon (CO2) Capture and Storage (CCS) is a process by which the CO2 produced in the combustion of fossil fuels is captured, transported to a storage location and isolated from the atmosphere. Capture of CO2 can be applied to large emission sources like power plants used for electricity generation and industrial processes. The CO2 is then compressed and transported for long-term storage in geological formations or for use in industrial processes.
CHP Combined heat and power
A system whereby both heat and electricity are generated simultaneously as part of one process. Covers a range of technologies that achieve this.
Climate change targets Targets for share of energy use sourced from renewable sources. The 2020 UK targets are defined in the Directive 2009/28/EC of the European Parliament and of the Council of the European Union, see http://eur-lex.europa.eu/legal-content/EN/TXT/HTML/?uri=CELEX:32009L0028&from=EN#ntc1-L_2009140EN.01004601-E0001.
Contracted generation A term used to reference any generator who has entered into a contract to connect with the National Electricity Transmission System (NETS) on a given date while having a transmission entry capacity (TEC) figure as a requirement of said contract.
CP Consumer Power A Future Energy Scenario. Consumer Power is a world of relative wealth, fast-paced research and development and spending. Innovation is focused on meeting the needs of consumers, who focus on improving their quality of life.
DNO Distribution Network Operator
Distribution network operators own and operate electricity distribution networks.
Glossary
Electricity Ten Year Statement November 2016 114

C
hapter five
Acronym Term Description
Double circuit overhead line
In the case of the onshore transmission system, this is a transmission line which consists of two circuits sharing the same towers for at least one span in SHE Transmission's system or NGET’s transmission system or for at least two miles in SP Transmission's system. In the case of an offshore transmission system, this is a transmission line which consists of two circuits sharing the same towers for at least one span.
DSR Demand-side response A deliberate change to an industrial and commercial user’s natural pattern of metered electricity or gas consumption, brought about by a signal from another party.
Embedded generation Power generating stations/units that don’t have a contractual agreement with the National Electricity Transmission System Operator (NETSO). They reduce electricity demand on the National Electricity Transmission System.
ENTSO-E European Network of Transmission System Operators – Electricity
ENTSO-E is an association of European electricity TSOs. ENTSO-E was established and given legal mandates by the EU’s Third Legislative Package for the Internal Energy Market in 2009, which aims at further liberalising electricity markets in the EU.
EU European Union A political and economic union of 28 member states that are located primarily in Europe.
FES Future energy scenarios
The future energy scenarios are a range of credible futures which have been developed in conjunction with the energy industry. They are a set of scenarios covering the period from now to 2050, and are used to frame discussions and perform stress tests. They form the starting point for all transmission network and investment planning, and are used to identify future operability challenges and potential solutions.
GB Great Britain A geographical, social and economic grouping of countries that contains England, Scotland and Wales.
GEP Grid entry point A point at which a generating unit directly connects to the national electricity transmission system. The default point of connection is taken to be the busbar clamp in the case of an air insulated substation, gas zone separator in the case of a gas-insulated substation, or equivalent point as may be determined by the relevant transmission licensees for new types of substation. When offshore, the GEP is defined as the low voltage busbar on the platform substation.
GG Gone Green A future energy scenario. Gone Green is a world where green ambition is not restrained by financial limitations. New technologies are introduced and embraced by society, enabling all carbon and renewable targets to be met on time.
GSP Grid supply point A point of supply from the GB transmission system to a distribution network or transmission-connected load. Typically only large industrial loads are directly connected to the transmission system.
GTYS Gas Ten Year Statement The GTYS illustrates the potential future development of the (gas) National Transmission System (NTS) over a ten-year period and is published on an annual basis.
GW Gigawatt 1,000,000,000 watts, a measure of power.
GWh Gigawatt hour 1,000,000,000 watt hours, a unit of energy.
HVAC High voltage alternating current
Electric power transmission in which the voltage varies in a sinusoidal fashion, resulting in a current flow that periodically reverses direction. HVAC is presently the most common form of electricity transmission and distribution, since it allows the voltage level to be raised or lowered using a transformer.
HVDC High voltage direct current
The transmission of power using continuous voltage and current as opposed to alternating current. HVDC is commonly used for point to point long-distance and/or subsea connections. HVDC offers various advantages over HVAC transmission, but requires the use of costly power electronic converters at each end to change the voltage level and convert it to/from AC.
Electricity Ten Year Statement November 2016 115

C
hapt
er five
Acronym Term Description
IED Industrial Emissions Directive
The Industrial Emissions Directive is a European Union directive which commits member states to control and reduce the impact of industrial emissions on the environment post-2015 when the Large Combustion Plant Directive (LCPD) expires.
Interconnector Electricity interconnectors are transmission assets that connect the GB market to Europe and allow suppliers to trade electricity between markets.
ITPR Integrated Transmission Planning and Regulation
Ofgem’s Integrated Transmission Planning and Regulation (ITPR) project examined the arrangements for planning and delivering the onshore, offshore and cross-border electricity transmission networks. Ofgem published the final conclusions in March 2015.
LCPD Large Combustion Plant Directive
The Large Combustion Plant Directive is a European Union Directive which introduced measures to control the emissions of sulphur dioxide, oxides of nitrogen and dust from large combustion plant.
Load factor The average power output divided by the peak power output over a period of time.
LV Low voltage Low voltage is the voltage typically below 1kV according to both the International Electrotechnical Commission (IEC) and the British Standard BS 7671:2008
Marine technologies Tidal streams, tidal lagoons and energy from wave technologies (see http://www.emec.org.uk/).
Merit order An ordered list of generators, sorted by the marginal cost of generation.
MITS Main Interconnected Transmission System
This comprises all the 400kV and 275kV elements of the onshore transmission system and, in Scotland, the132kV elements of the onshore transmission system operated in parallel with the supergrid, and any elements of an offshore transmission system operated in parallel with the supergrid, but excludes generation circuits, transformer connections to lower voltage systems, external interconnections between the onshore transmission system and external systems, and any offshore transmission systems radially connected to the onshore transmission system via single interface points.
MVA Mega volt amps Mega volt amperes is the apparent power in an electrical circuit, equal to the product of the root mean square (RMS) voltage, the RMS current and a factor of 1 billion units.
MW Megawatt 1,000,000 watts, a measure of power.
MWh Megawatt hour 1,000,000 watt hours, a measure of power usage or consumption in 1 hour.
NETS National Electricity Transmission System
The National Electricity Transmission System comprises the onshore and offshore transmission systems of England, Wales and Scotland. It transmits high-voltage electricity from where it is produced to where it is needed throughout the country. The system is made up of high-voltage electricity wires that extend across Britain and nearby offshore waters. It is owned and maintained by regional transmission companies, while the system as a whole is operated by a single system operator (SO).
NETSO National Electricity Transmission System Operator
National Grid acts as the NETSO for the whole of Great Britain while owning the transmission assets in England and Wales. In Scotland, transmission assets are owned by Scottish Hydro Electricty Transmission Ltd (SHE Transmission) in the north of the country and Scottish Power Transmission SP Transmission in the south.
NETS SQSS National Electricity Transmission System Security and Quality of Supply Standards
A set of standards used in the planning and operation of the national electricity transmission system of Great Britain. For the avoidance of doubt the national electricity transmission system is made up of both the onshore transmission system and the offshore transmission systems.
Network access Maintenance and system access is typically undertaken during the spring, summer and autumn seasons when the system is less heavily loaded and access is favourable. With circuits and equipment unavailable the integrity of the system is reduced. The planning of the system access is carefully controlled to ensure system security is maintained.
NGET National Grid Electricity Transmission plc
National Grid Electricity Transmission plc (No. 2366977) whose registered office is 1-3 Strand, London, WC2N 5EH
Glossary
Electricity Ten Year Statement November 2016 116

C
hapter five
Acronym Term Description
NOA Network Options Assessment
The NOA is the process for assessing options for reinforcing the National Electricity Transmission System (NETS) to meet the requirements that the sytem operator (SO) finds from its analysis of the future energy scenarios (FES).
NP No Progression A Future Energy Scenario. No Progression is a world focused on achieving security of supply at the lowest possible cost. With low economic growth, traditional sources of gas and electricity dominate, with little innovation affecting how we use energy.
NTS National Transmission System
A high-pressure gas transportation system consisting of compressor stations, pipelines, multijunction sites and offtakes. NTS pipelines transport gas from terminals to NTS offtakes and are designed to operate up to pressures of 94 barg.
OCGT Open cycle gas turbine Gas turbines in which air is first compressed in the compressor element before fuel is injected and burned in the combustor.
Ofgem Office of Gas and Electricity Markets
The UK’s independent National Regulatory Authority, a non-ministerial government department. Their principal objective is to protect the interests of existing and future electricity and gas consumers.
Offshore This term means wholly or partly in offshore waters.
Offshore transmission circuit
Part of an offshore transmission system between two or more circuit breakers which includes, for example, transformers, reactors, cables, overhead lines and DC converters but excludes busbars and onshore transmission circuits.
Onshore This term refers to assets that are wholly on land.
Onshore transmission circuit
Part of the onshore transmission system between two or more circuit-breakers which includes, for example, transformers, reactors, cables and overhead lines but excludes busbars, generation circuits and offshore transmission circuits.
pa Per annum per year.
Peak demand The maximum power demand in any one fiscal year: Peak demand typically occurs at around 5:30pm on a week-day between December and February. Different definitions of peak demand are used for different purposes.
Planned transfer A term to describe a point at which demand is set to the National Peak when analysing boundary capability.
Power supply background (aka generation background)
The sources of generation across Great Britain to meet the power demand.
PV Photovoltaic A method of converting solar energy into direct current electricity using semi-conducting materials.
Ranking order A list of generators sorted in order of likelihood of operation at time of winter peak and used by the NETS SQSS.
Reactive power Reactive power is a concept used by engineers to describe the background energy movement in an alternating current (AC) system arising from the production of electric and magnetic fields. These fields store energy which changes through each AC cycle. Devices which store energy by virtue of a magnetic field produced by a flow of current are said to absorb reactive power; those which store energy by virtue of electric fields are said to generate reactive power.
Real power This term (sometimes referred to as “Active Power”) provides the useful energy to a load. In an AC system, real power is accompanied by reactive power for any power factor other than 1.
Seasonal circuit ratings The current-carrying capability of circuits. Typically, this reduces during the warmer seasons as the circuit’s capability to dissipate heat is reduced. The rating of a typical 400kV overhead line may be 20% less in the summer than in winter.
SGT Supergrid transformer A term used to describe transformers on the NETS that operate in the 275–400kV range.
Electricity Ten Year Statement November 2016 117

C
hapt
er five
Acronym Term Description
SHE Transmission Scottish Hydro-Electric Transmission (No.SC213461) whose registered office is situated at Inveralmond HS, 200 Dunkeld Road, Perth, Perthshire PH1 3AQ.
SP Slow Progression A Future Energy Scenario. Slow Progression is a world where slower economic growth restricts market conditions. Money that is available is spent focusing on low cost long-term solutions to achieve decarbonisation, albeit it later than the target dates.
SP Transmission Scottish Power Transmission plc (No. SC189126) whose registered office is situated at 1 Atlantic Quay, Robertson Street, Glasgow G2 8SP.
Summer minimum The minimum power demand off the transmission network in any one fiscal year: Minimum demand typically occurs at around 06:00am on a Sunday between May and September.
Supergrid That part of the national electricity transmission system operated at a nominal voltage of 275kV and above.
Switchgear The term used to describe components of a substation that can be used to carry out switching activities. This can include, but is not limited to, isolators/disconnectors and circuit breakers.
System inertia The property of the system that resists changes. This is provided largely by the rotating synchronous generator inertia that is a function of the rotor mass, diameter and speed of rotation. Low system inertia increases the risk of rapid system changes.
System operability The ability to maintain system stability and all of the asset ratings and operational parameters within pre-defined limits safely, economically and sustainably.
SO System Operator An entity entrusted with transporting energy in the form of natural gas or power on a regional or national level, using fixed infrastructure. Unlike a TSO, the SO may not necessarily own the assets concerned. For example, National Grid operates the electricity transmission system in Scotland, which is owned by Scottish Hydro Electricity Transmission and Scottish Power Transmission.
SOF System Operabiltiy Framework
The SOF identifies the challenges and opportunities which exist in the operation of future electricity networks and identifies measures to ensure the future operability.
System stability With reduced power demand and a tendency for higher system voltages during the summer months fewer generators will operate and those that do run could be at reduced power factor output. This condition has a tendency to reduce the dynamic stability of the NETS. Therefore network stability analysis is usually performed for summer minimum demand conditions as this represents the limiting period.
TEC Transmission entry capacity
The maximum amount of active power deliverable by a power station at its grid entry point (which can be either onshore or offshore). This will be the maximum power deliverable by all of the generating units within the power station, minus any auxiliary loads.
TO Transmission Owners A collective term used to describe the three transmission asset owners within Great Britain, namely National Grid Electricity Transmission, Scottish Hydro-Electric Transmission Limited and SP Transmission Limited.
Transmission circuit This is either an onshore transmission circuit or an offshore transmission circuit.
Transmission losses Power losses that are caused by the electrical resistance of the transmission system.
TSO Transmission System Operators
An entity entrusted with transporting energy in the form of natural gas or power on a regional or national level, using fixed infrastructure.
Glossary
Electricity Ten Year Statement November 2016 118

C
hapter five
Disclaimer
The information contained within the Electricity Ten Year Statement document (“the Document”) is disclosed voluntarily and without charge. The Document replaces the Seven Year Statement (SYS) and the Offshore Development Information Statement (ODIS) and is published in accordance with the relevant Licence conditions.
National Grid would wish to emphasise that the information must be considered as illustrative only and no warranty can be or is made as to the accuracy and completeness of the information contained within this Document. Neither National Grid Electricity Transmission, National Grid Gas nor the other companies within the National Grid group, nor the directors, nor the employees of any such company shall be under any liability for any error
or misstatement or opinion on which therecipient of this Document relies or seeks to rely other than fraudulent misstatement or fraudulent misrepresentation and does not accept any responsibility for any use which is made of the information or Document which or (to the extent permitted by law) for any damages or losses incurred. Copyright National Grid 2016, all rights reserved.
No part of this Document or this site may be reproduced in any material form (including photocopying and restoring in any medium or electronic means and whether or not transiently or incidentally) without the written permission of National Grid except in accordance with the provisions of the Copyright, Designs and Patents Act 1988.
Electricity Ten Year Statement November 2016 119

C
hapt
er five
Electricity Ten Year Statement November 2016 120

Join our mailing list to receive emailupdates for ETYS or any of ourFuture of Energy documents.http://www.nationalgrid.com/updates
Email us with your viewson ETYS at:[email protected] we will get in touch.
Access our current and pastETYS documents and data at:http://www.nationalgrid.com/etys
Keep up to date on key issuesrelating to National Grid via ourConnecting website:www.nationalgridconnecting.com
You can write to us at:GBSC, Electricity Network DevelopmentNational Grid HouseWarwick Technology ParkGallows HillWarwickCV34 6DA
Continuing the conversation
National Grid UK
@nationalgriduk
NationalGridUK
National Grid

National Grid plcNational Grid House, Warwick Technology Park, Gallows Hill, Warwick. CV34 6DA United KingdomRegistered in England and Wales No. 4031152
www.nationalgrid.com