Embed Size (px)
Citation preview
Electricity Technology in a Carbon-Constrained Future
Utah Climate Change SymposiumMay 8, 2007
Bryan Hannegan, Ph.D. Vice President - Environment
2© 2007 Electric Power Research Institute, Inc. All rights reserved.
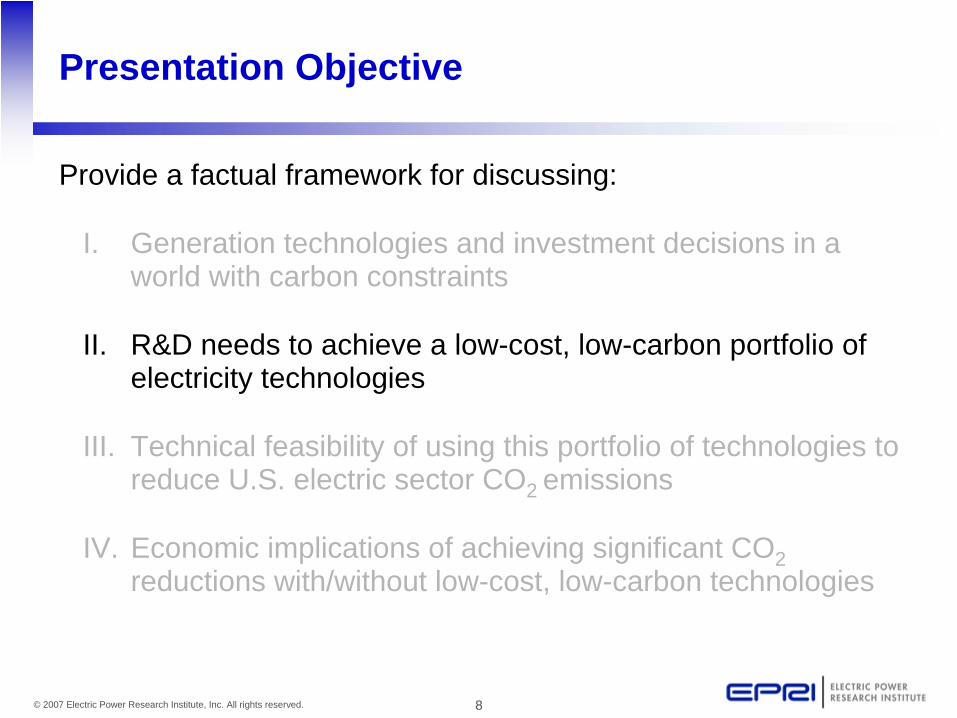
Presentation Objective
Provide a factual framework for discussing:
I. Generation technologies and investment decisions in a world with carbon constraints
II. R&D needs to achieve a low-cost, low-carbon portfolio of electricity technologies
III. Technical feasibility of using this portfolio of technologies to reduce U.S. electric sector CO2 emissions
IV. Economic implications of achieving significant CO2 reductions with/without low-cost, low-carbon technologies
3© 2007 Electric Power Research Institute, Inc. All rights reserved.
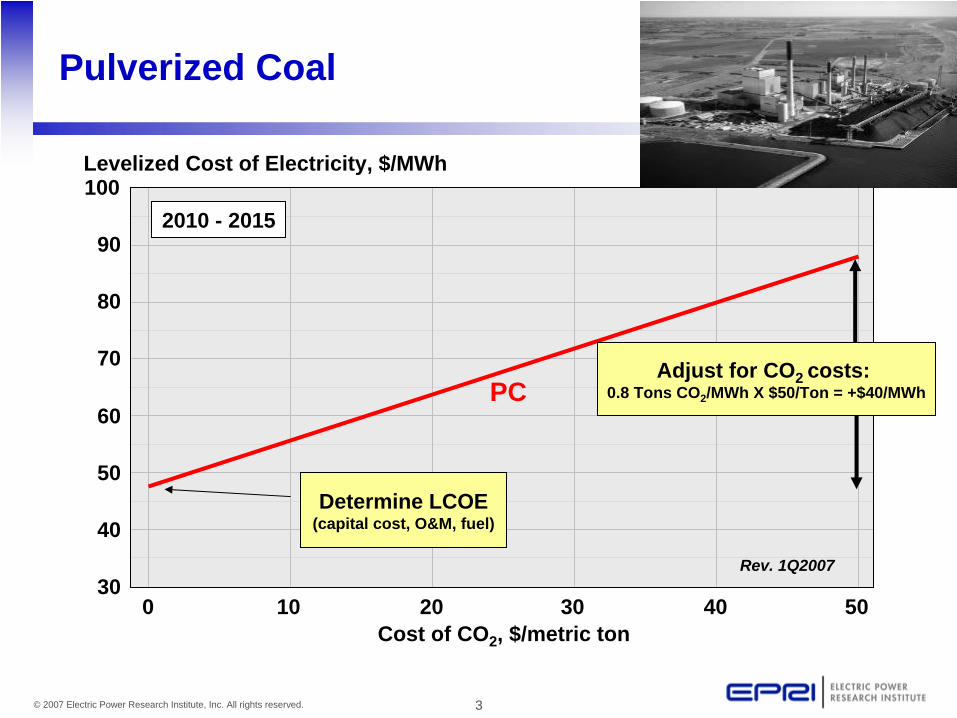
Pulverized Coal
30
40
50
60
70
80
90
100
0 10 20 30 40 50Cost of CO2 , $/metric ton
Levelized Cost of Electricity, $/MWh
2010 - 2015
PC
Rev. 1Q2007
Determine LCOE (capital cost, O&M, fuel)
Adjust for CO2 costs: 0.8 Tons CO2 /MWh X $50/Ton = +$40/MWh
4© 2007 Electric Power Research Institute, Inc. All rights reserved.
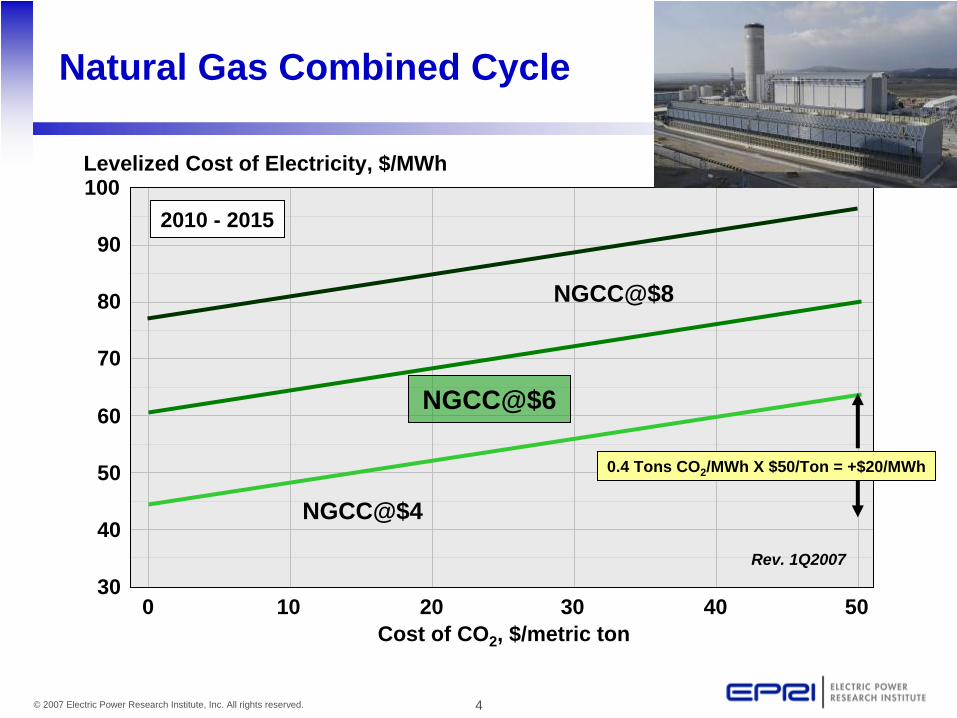
Natural Gas Combined Cycle
30
40
50
60
70
80
90
100
0 10 20 30 40 50Cost of CO2 , $/metric ton
Levelized Cost of Electricity, $/MWh
NGCC@$8
NGCC@$4
2010 - 2015
NGCC@$6
Rev. 1Q2007
0.4 Tons CO2 /MWh X $50/Ton = +$20/MWh
5© 2007 Electric Power Research Institute, Inc. All rights reserved.
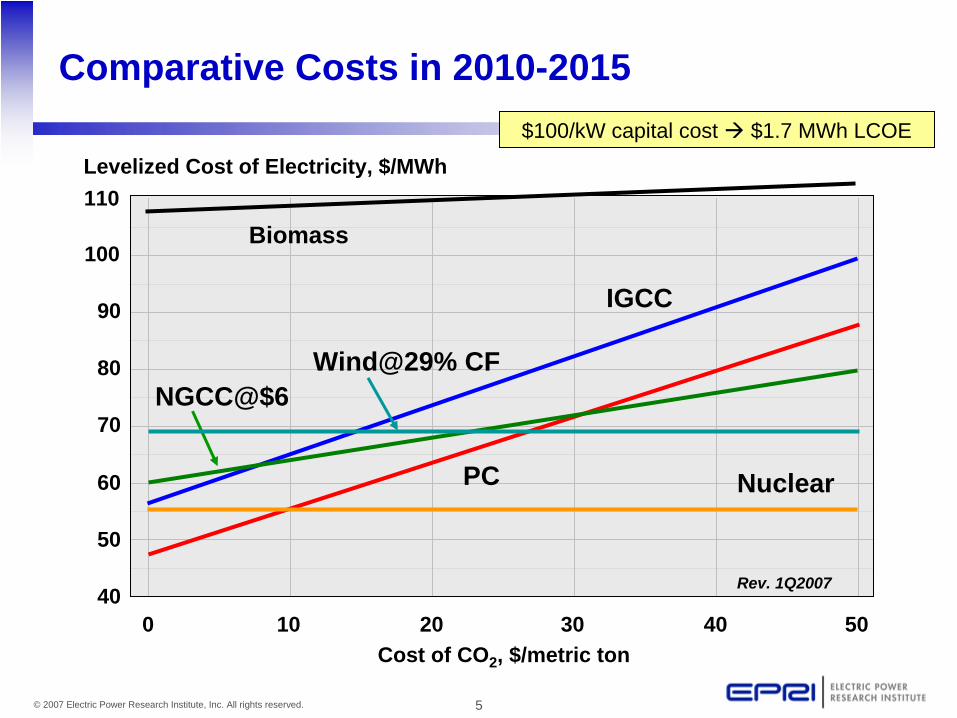
Comparative Costs in 2010-2015
40
50
60
70
80
90
100
0 10 20 30 40 50Cost of CO2 , $/metric ton
Levelized Cost of Electricity, $/MWh
Wind@29% CF
PC
IGCC
Biomass
Rev. 1Q2007
110
Nuclear
NGCC@$6
$100/kW capital cost $1.7 MWh LCOE
6© 2007 Electric Power Research Institute, Inc. All rights reserved.
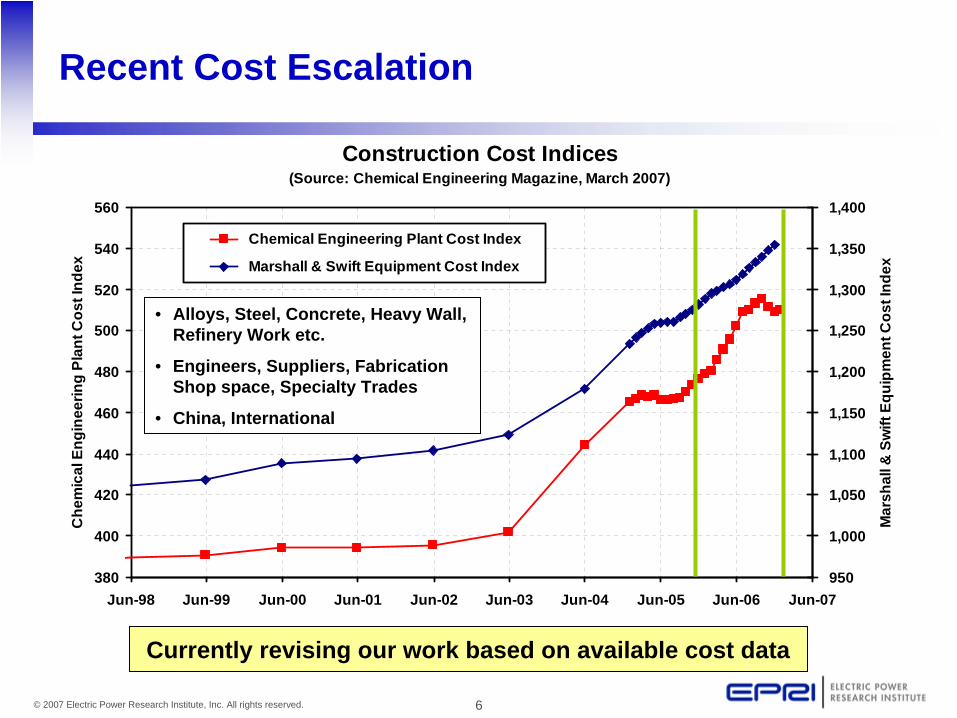
Recent Cost Escalation
Construction Cost Indices(Source: Chemical Engineering Magazine, March 2007)
380
400
420
440
460
480
500
520
540
560
Jun-98 Jun-99 Jun-00 Jun-01 Jun-02 Jun-03 Jun-04 Jun-05 Jun-06 Jun-07
Che
mic
al E
ngin
eerin
g Pl
ant C
ost I
ndex
950
1,000
1,050
1,100
1,150
1,200
1,250
1,300
1,350
1,400
Mar
shal
l & S
wift
Equ
ipm
ent C
ost I
ndex
Chemical Engineering Plant Cost Index
Marshall & Swift Equipment Cost Index
• Alloys, Steel, Concrete, Heavy Wall, Refinery Work etc.
• Engineers, Suppliers, Fabrication Shop space, Specialty Trades
• China, International
Currently revising our work based on available cost data
7© 2007 Electric Power Research Institute, Inc. All rights reserved.
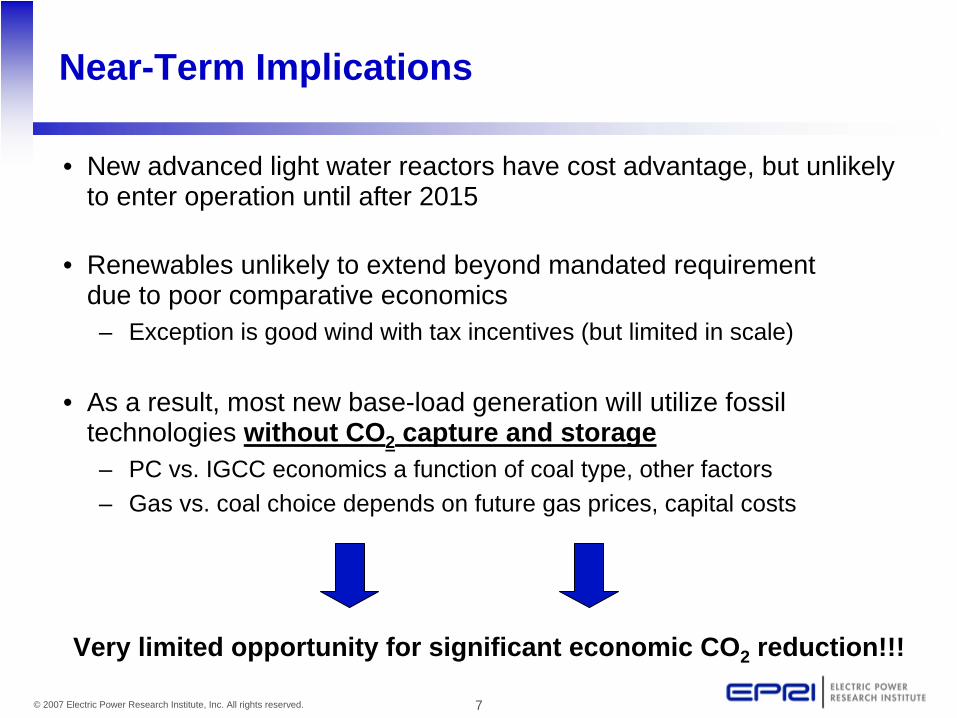
Near-Term Implications
• New advanced light water reactors have cost advantage, but unlikely to enter operation until after 2015
• Renewables unlikely to extend beyond mandated requirement due to poor comparative economics– Exception is good wind with tax incentives (but limited in scale)
• As a result, most new base-load generation will utilize fossil technologies without CO2 capture and storage– PC vs. IGCC economics a function of coal type, other factors – Gas vs. coal choice depends on future gas prices, capital costs
Very limited opportunity for significant economic CO2 reduction!!!
8© 2007 Electric Power Research Institute, Inc. All rights reserved.
Presentation Objective
Provide a factual framework for discussing:
I. Generation technologies and investment decisions in a world with carbon constraints
II. R&D needs to achieve a low-cost, low-carbon portfolio of electricity technologies
III. Technical feasibility of using this portfolio of technologies to reduce U.S. electric sector CO2 emissions
IV. Economic implications of achieving significant CO2 reductions with/without low-cost, low-carbon technologies
9© 2007 Electric Power Research Institute, Inc. All rights reserved.
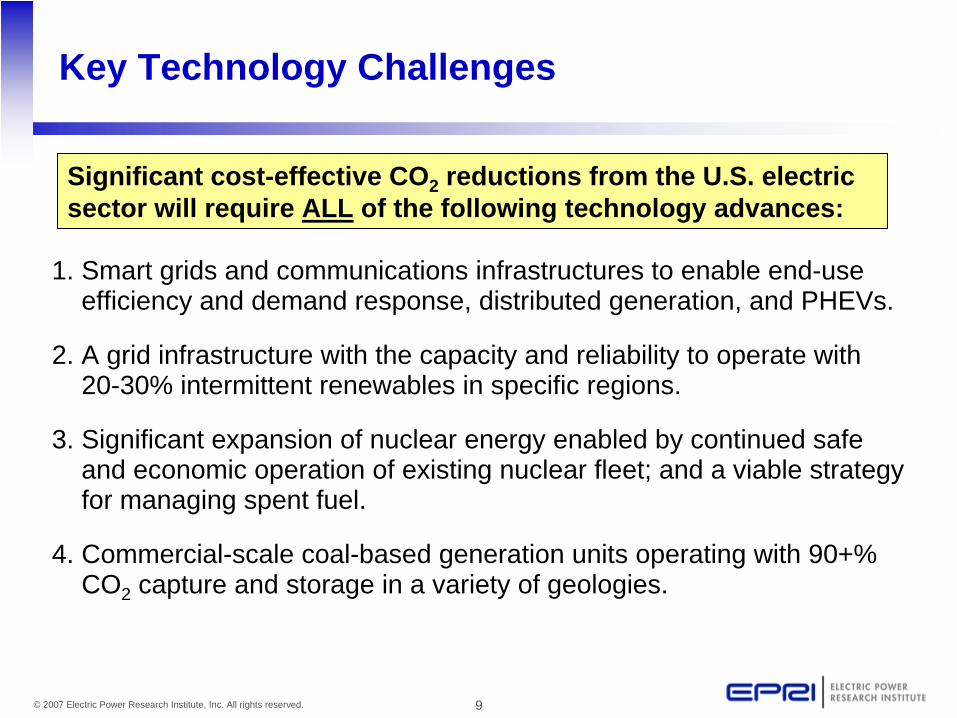
Key Technology Challenges
1. Smart grids and communications infrastructures to enable end-use efficiency and demand response, distributed generation, and PHEVs.
2. A grid infrastructure with the capacity and reliability to operate with 20-30% intermittent renewables in specific regions.
3. Significant expansion of nuclear energy enabled by continued safe and economic operation of existing nuclear fleet; and a viable strategy for managing spent fuel.
4. Commercial-scale coal-based generation units operating with 90+% CO2 capture and storage in a variety of geologies.
Significant cost-effective CO2 reductions from the U.S. electric sector will require ALL of the following technology advances:
10© 2007 Electric Power Research Institute, Inc. All rights reserved.
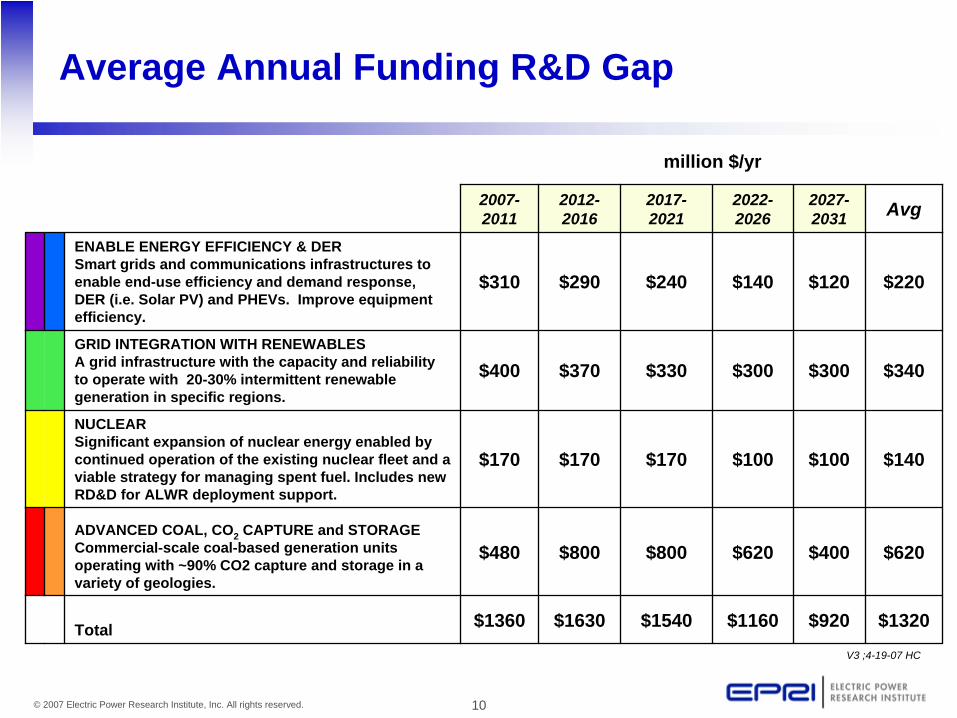
Average Annual Funding R&D Gap
2007- 2011
2012- 2016
2017- 2021
2022- 2026
2027- 2031 Avg
ENABLE ENERGY EFFICIENCY & DER Smart grids and communications infrastructures to enable end-use efficiency and demand response, DER (i.e. Solar PV) and PHEVs. Improve equipment efficiency.
$310 $290 $240 $140 $120 $220
GRID INTEGRATION WITH RENEWABLESA grid infrastructure with the capacity and reliability to operate with 20-30% intermittent renewable generation in specific regions.
$400 $370 $330 $300 $300 $340
NUCLEAR Significant expansion of nuclear energy enabled by continued operation of the existing nuclear fleet and a viable strategy for managing spent fuel. Includes new RD&D for ALWR deployment support.
$170 $170 $170 $100 $100 $140
ADVANCED COAL, CO2 CAPTURE and STORAGE Commercial-scale coal-based generation units operating with ~90% CO2 capture and storage in a variety of geologies.
$480 $800 $800 $620 $400 $620
Total $1360 $1630 $1540 $1160 $920 $1320V3 ;4-19-07 HC
million $/yr
11© 2007 Electric Power Research Institute, Inc. All rights reserved.
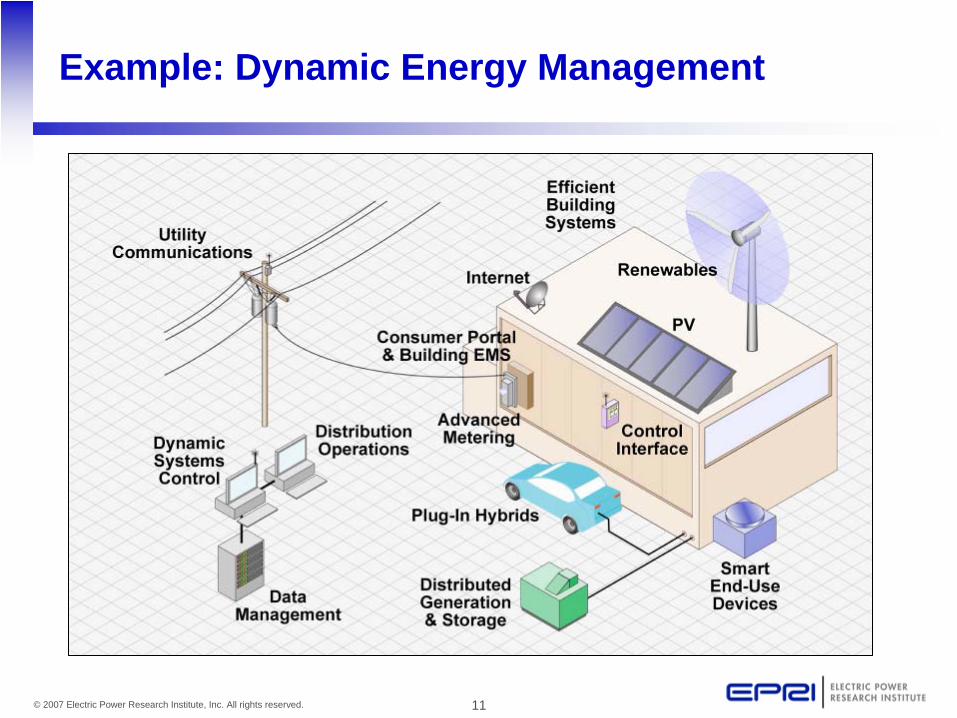
Example: Dynamic Energy Management
12© 2007 Electric Power Research Institute, Inc. All rights reserved.
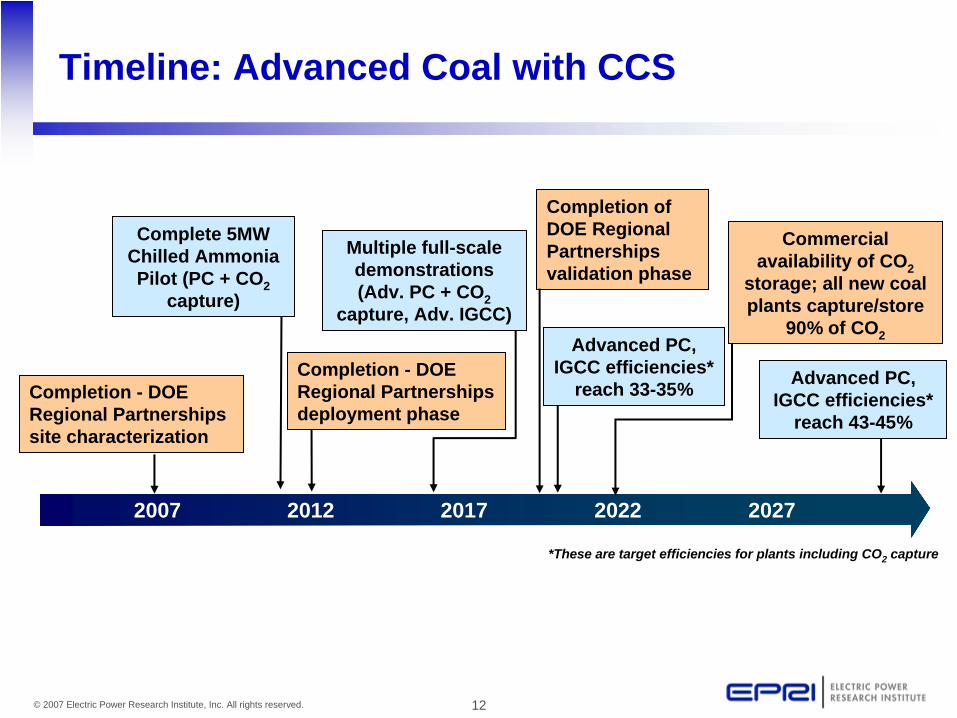
2007 2012 2017 20272022
Complete 5MW Chilled Ammonia Pilot (PC + CO2
capture)
Multiple full-scale demonstrations (Adv. PC + CO2
capture, Adv. IGCC)
Commercial availability of CO2
storage; all new coal plants capture/store
90% of CO2Advanced PC, IGCC efficiencies*
reach 33-35% Advanced PC, IGCC efficiencies*
reach 43-45%
Completion - DOE Regional Partnerships deployment phase
Completion of DOE Regional Partnerships validation phase
Completion - DOE Regional Partnerships site characterization
*These are target efficiencies for plants including CO2 capture
Timeline: Advanced Coal with CCS
13© 2007 Electric Power Research Institute, Inc. All rights reserved.
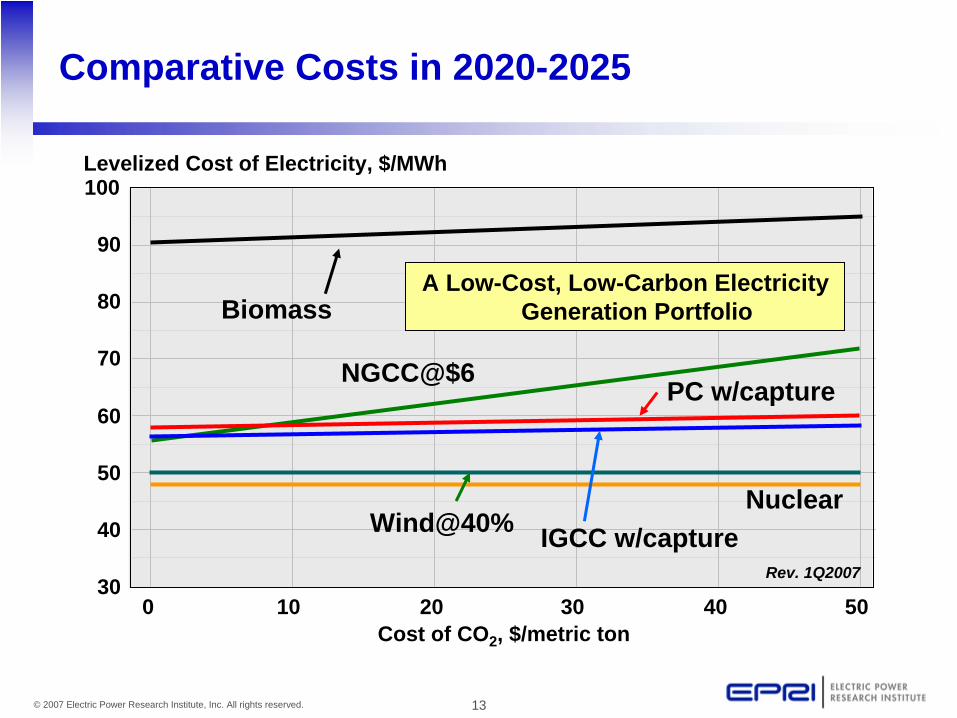
Comparative Costs in 2020-2025
30
40
50
60
70
80
90
100
0 10 20 30 40 50Cost of CO2 , $/metric ton
Levelized Cost of Electricity, $/MWh
NuclearWind@40%
Biomass
NGCC@$6
A Low-Cost, Low-Carbon Electricity Generation Portfolio
IGCC w/capture
PC w/capture
Rev. 1Q2007
14© 2007 Electric Power Research Institute, Inc. All rights reserved.
Presentation Objective
Provide a factual framework for discussing:
I. Generation technologies and investment decisions in a world with carbon constraints
II. R&D needs to achieve a low-cost, low-carbon portfolio of electricity technologies
III. Technical feasibility of using this portfolio of technologies to reduce U.S. electric sector CO2 emissions
IV. Economic implications of achieving significant CO2 reductions with/without low-cost, low-carbon technologies
15© 2007 Electric Power Research Institute, Inc. All rights reserved.
0
500
1000
1500
2000
2500
3000
3500
1990 1995 2000 2005 2010 2015 2020 2025 2030
U.S
. Ele
ctric
Sec
tor
CO
2 Em
issi
ons
(mill
ion
met
ric to
ns)
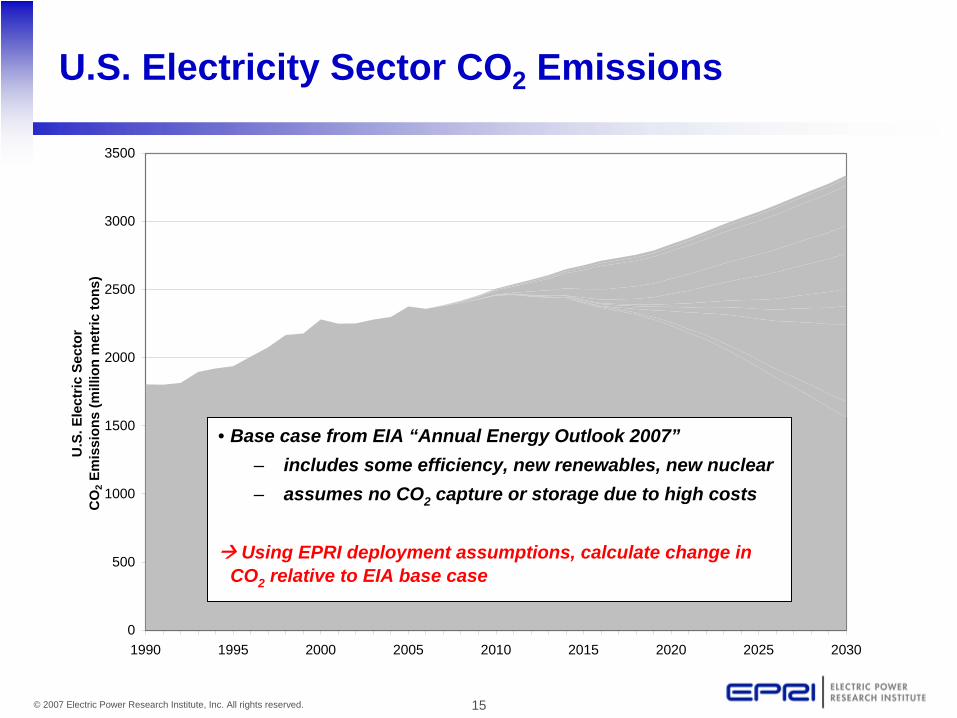
U.S. Electricity Sector CO2 Emissions
• Base case from EIA “Annual Energy Outlook 2007”– includes some efficiency, new renewables, new nuclear– assumes no CO2 capture or storage due to high costs
Using EPRI deployment assumptions, calculate change in CO2 relative to EIA base case
16© 2007 Electric Power Research Institute, Inc. All rights reserved.
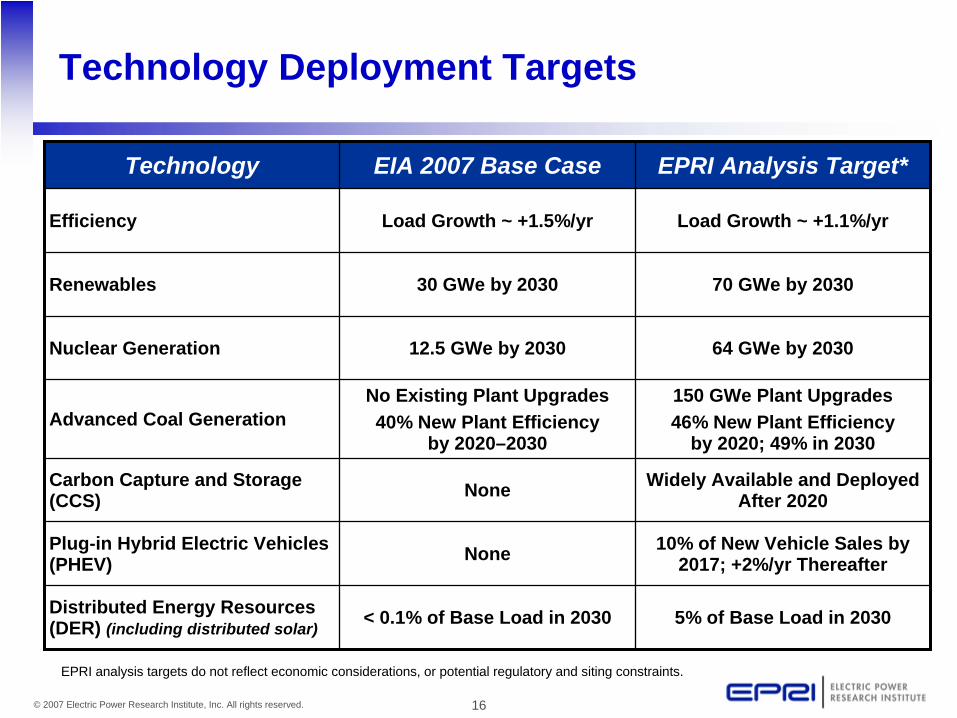
Technology Deployment Targets
Technology EIA 2007 Base Case EPRI Analysis Target*
Efficiency Load Growth ~ +1.5%/yr Load Growth ~ +1.1%/yr
Renewables 30 GWe by 2030 70 GWe by 2030
Nuclear Generation 12.5 GWe by 2030 64 GWe by 2030
Advanced Coal GenerationNo Existing Plant Upgrades40% New Plant Efficiency
by 2020–2030
150 GWe Plant Upgrades46% New Plant Efficiency
by 2020; 49% in 2030
Carbon Capture and Storage (CCS) None Widely Available and Deployed
After 2020
Plug-in Hybrid Electric Vehicles (PHEV) None 10% of New Vehicle Sales by
2017; +2%/yr Thereafter
Distributed Energy Resources (DER) (including distributed solar) < 0.1% of Base Load in 2030 5% of Base Load in 2030
EPRI analysis targets do not reflect economic considerations, or potential regulatory and siting constraints.
17© 2007 Electric Power Research Institute, Inc. All rights reserved.
0
500
1000
1500
2000
2500
3000
3500
1990 1995 2000 2005 2010 2015 2020 2025 2030
U.S
. Ele
ctric
Sec
tor
CO
2 Em
issi
ons
(mill
ion
met
ric to
ns)
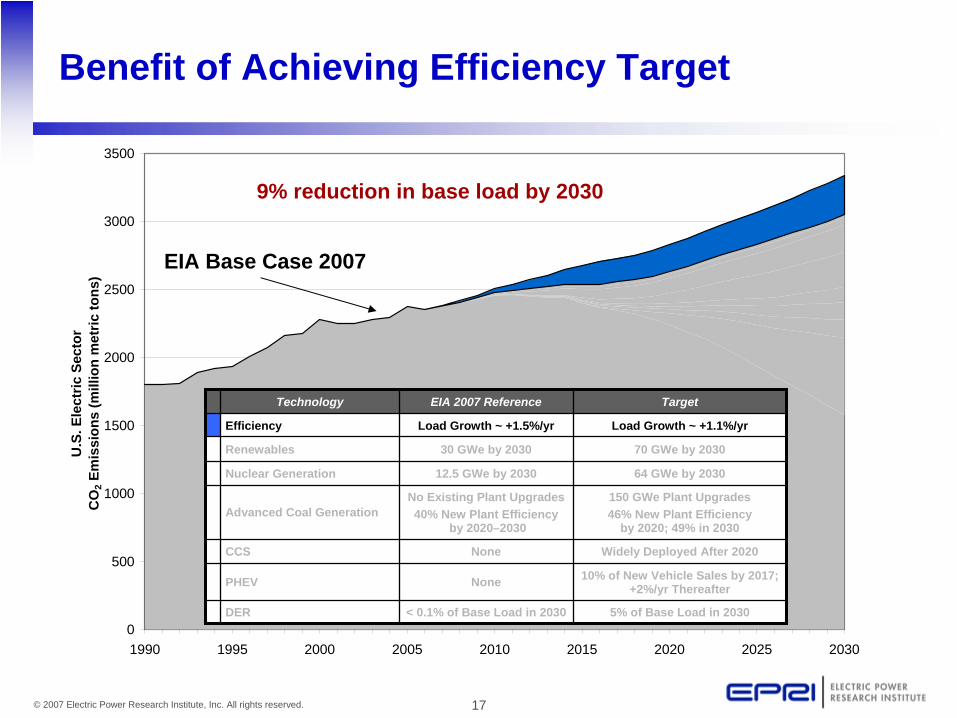
EIA Base Case 2007
9% reduction in base load by 2030
Benefit of Achieving Efficiency Target
Technology EIA 2007 Reference Target
Efficiency Load Growth ~ +1.5%/yr Load Growth ~ +1.1%/yr
Renewables 30 GWe by 2030 70 GWe by 2030
Nuclear Generation 12.5 GWe by 2030 64 GWe by 2030
Advanced Coal GenerationNo Existing Plant Upgrades40% New Plant Efficiency
by 2020–2030
150 GWe Plant Upgrades46% New Plant Efficiency
by 2020; 49% in 2030
CCS None Widely Deployed After 2020
PHEV None 10% of New Vehicle Sales by 2017; +2%/yr Thereafter
DER < 0.1% of Base Load in 2030 5% of Base Load in 2030
18© 2007 Electric Power Research Institute, Inc. All rights reserved.
0
500
1000
1500
2000
2500
3000
3500
1990 1995 2000 2005 2010 2015 2020 2025 2030
U.S
. Ele
ctric
Sec
tor
CO
2 Em
issi
ons
(mill
ion
met
ric to
ns) EIA Base Case 2007
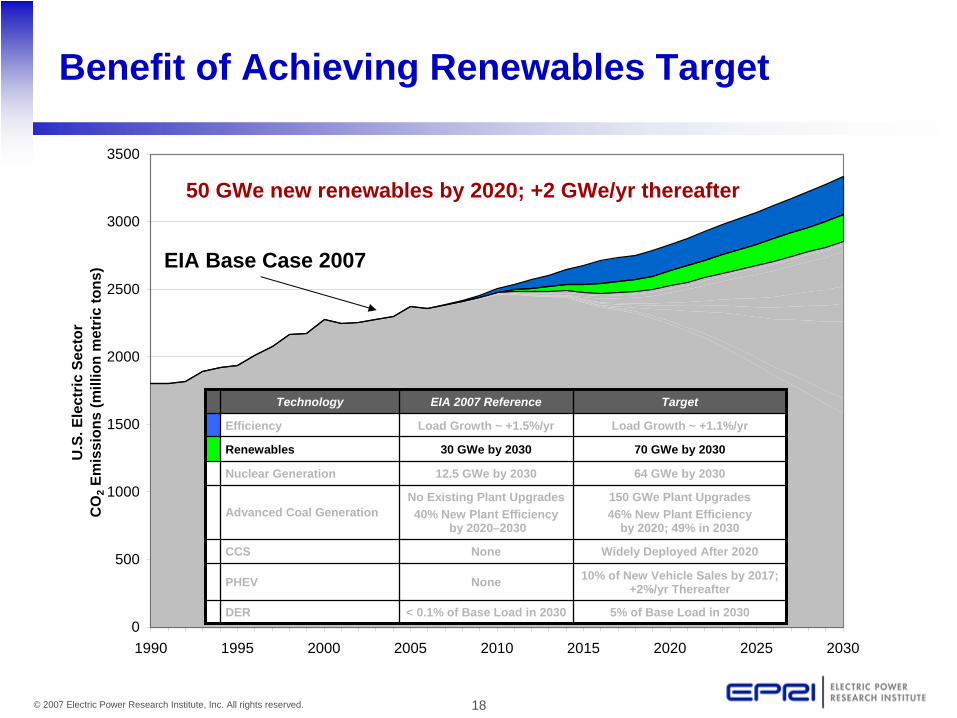
Benefit of Achieving Renewables Target
50 GWe new renewables by 2020; +2 GWe/yr thereafter
Technology EIA 2007 Reference Target
Efficiency Load Growth ~ +1.5%/yr Load Growth ~ +1.1%/yr
Renewables 30 GWe by 2030 70 GWe by 2030
Nuclear Generation 12.5 GWe by 2030 64 GWe by 2030
Advanced Coal GenerationNo Existing Plant Upgrades40% New Plant Efficiency
by 2020–2030
150 GWe Plant Upgrades46% New Plant Efficiency
by 2020; 49% in 2030
CCS None Widely Deployed After 2020
PHEV None 10% of New Vehicle Sales by 2017; +2%/yr Thereafter
DER < 0.1% of Base Load in 2030 5% of Base Load in 2030
19© 2007 Electric Power Research Institute, Inc. All rights reserved.
0
500
1000
1500
2000
2500
3000
3500
1990 1995 2000 2005 2010 2015 2020 2025 2030
U.S
. Ele
ctric
Sec
tor
CO
2 Em
issi
ons
(mill
ion
met
ric to
ns)
EIA Base Case 2007
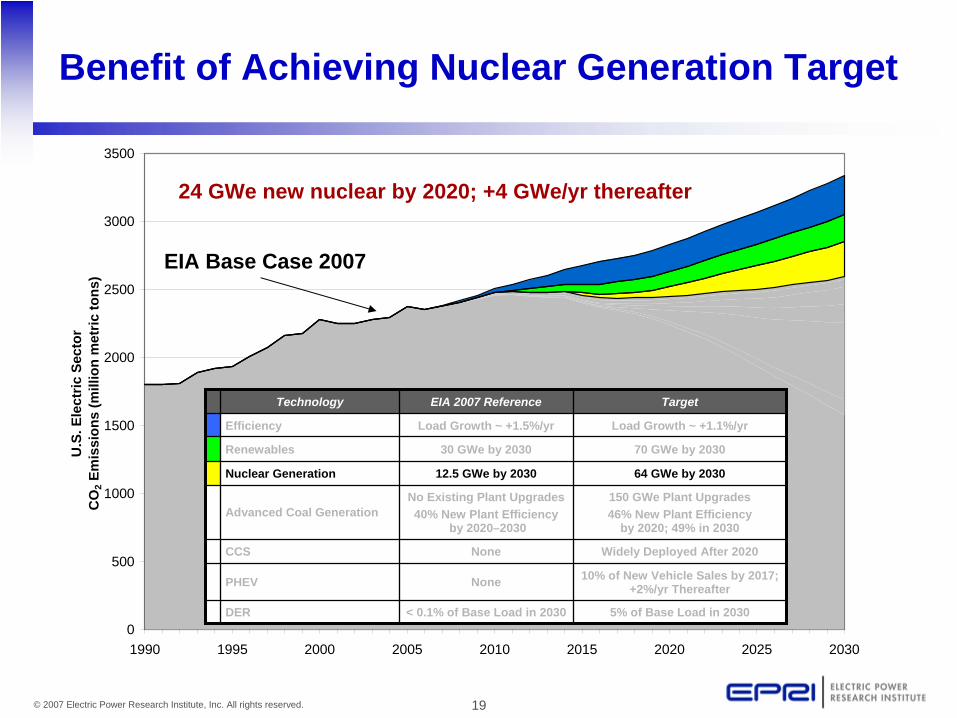
Benefit of Achieving Nuclear Generation Target
24 GWe new nuclear by 2020; +4 GWe/yr thereafter
Technology EIA 2007 Reference Target
Efficiency Load Growth ~ +1.5%/yr Load Growth ~ +1.1%/yr
Renewables 30 GWe by 2030 70 GWe by 2030
Nuclear Generation 12.5 GWe by 2030 64 GWe by 2030
Advanced Coal GenerationNo Existing Plant Upgrades40% New Plant Efficiency
by 2020–2030
150 GWe Plant Upgrades46% New Plant Efficiency
by 2020; 49% in 2030
CCS None Widely Deployed After 2020
PHEV None 10% of New Vehicle Sales by 2017; +2%/yr Thereafter
DER < 0.1% of Base Load in 2030 5% of Base Load in 2030
20© 2007 Electric Power Research Institute, Inc. All rights reserved.
0
500
1000
1500
2000
2500
3000
3500
1990 1995 2000 2005 2010 2015 2020 2025 2030
U.S
. Ele
ctric
Sec
tor
CO
2 Em
issi
ons
(mill
ion
met
ric to
ns)
EIA Base Case 2007
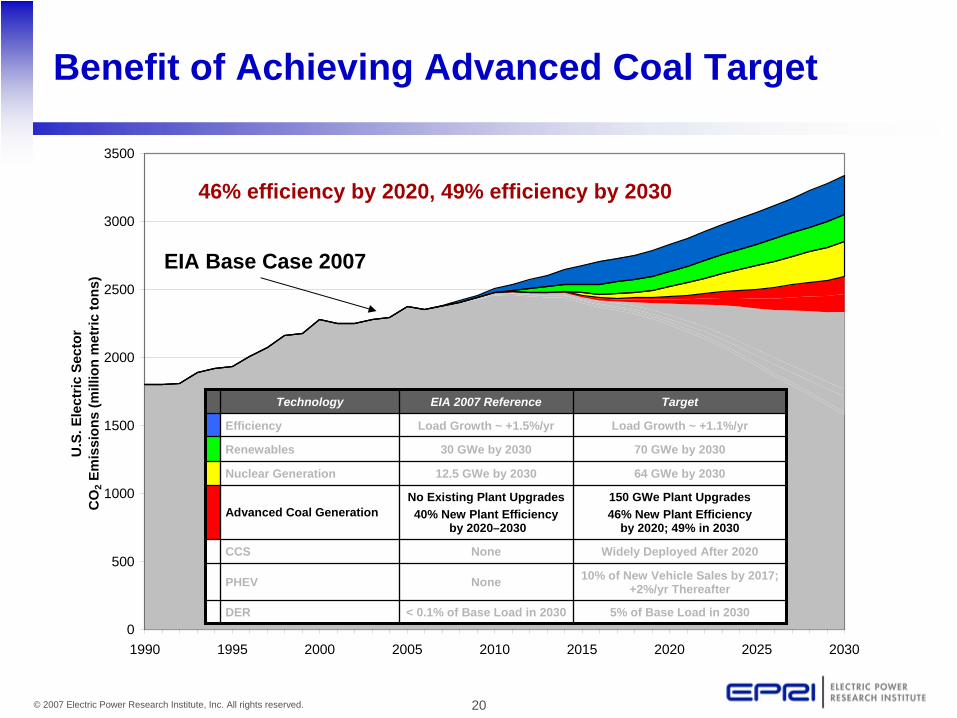
Benefit of Achieving Advanced Coal Target
46% efficiency by 2020, 49% efficiency by 2030
Technology EIA 2007 Reference Target
Efficiency Load Growth ~ +1.5%/yr Load Growth ~ +1.1%/yr
Renewables 30 GWe by 2030 70 GWe by 2030
Nuclear Generation 12.5 GWe by 2030 64 GWe by 2030
Advanced Coal GenerationNo Existing Plant Upgrades40% New Plant Efficiency
by 2020–2030
150 GWe Plant Upgrades46% New Plant Efficiency
by 2020; 49% in 2030
CCS None Widely Deployed After 2020
PHEV None 10% of New Vehicle Sales by 2017; +2%/yr Thereafter
DER < 0.1% of Base Load in 2030 5% of Base Load in 2030
21© 2007 Electric Power Research Institute, Inc. All rights reserved.
0
500
1000
1500
2000
2500
3000
3500
1990 1995 2000 2005 2010 2015 2020 2025 2030
U.S
. Ele
ctric
Sec
tor
CO
2 Em
issi
ons
(mill
ion
met
ric to
ns)
EIA Base Case 2007
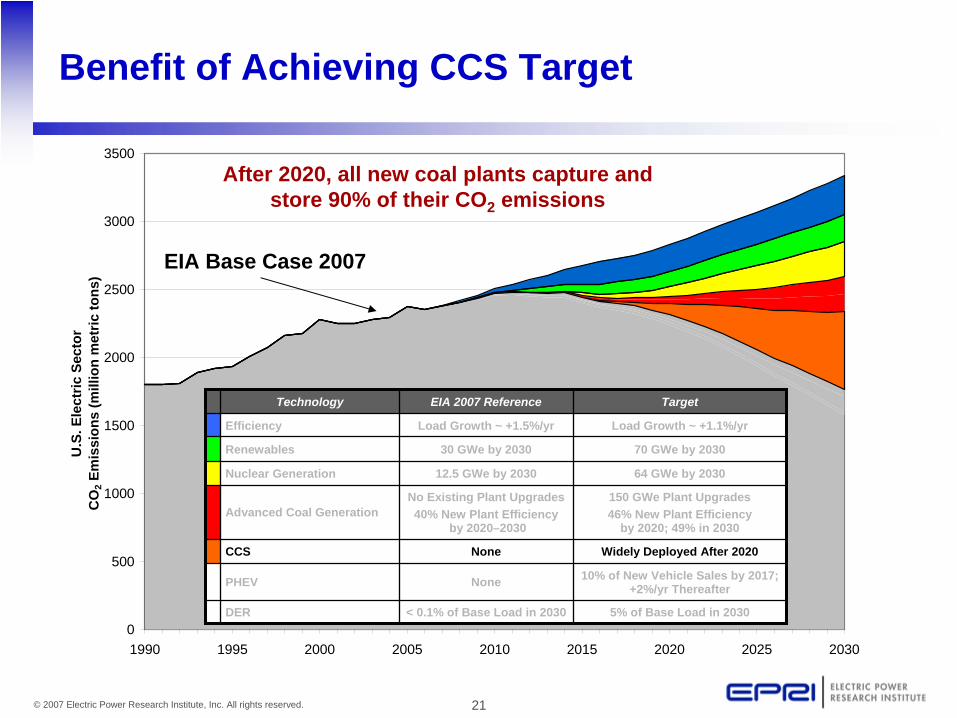
Benefit of Achieving CCS Target
After 2020, all new coal plants capture and store 90% of their CO2 emissions
Technology EIA 2007 Reference Target
Efficiency Load Growth ~ +1.5%/yr Load Growth ~ +1.1%/yr
Renewables 30 GWe by 2030 70 GWe by 2030
Nuclear Generation 12.5 GWe by 2030 64 GWe by 2030
Advanced Coal GenerationNo Existing Plant Upgrades40% New Plant Efficiency
by 2020–2030
150 GWe Plant Upgrades46% New Plant Efficiency
by 2020; 49% in 2030
CCS None Widely Deployed After 2020
PHEV None 10% of New Vehicle Sales by 2017; +2%/yr Thereafter
DER < 0.1% of Base Load in 2030 5% of Base Load in 2030
22© 2007 Electric Power Research Institute, Inc. All rights reserved.
0
500
1000
1500
2000
2500
3000
3500
1990 1995 2000 2005 2010 2015 2020 2025 2030
U.S
. Ele
ctric
Sec
tor
CO
2 Em
issi
ons
(mill
ion
met
ric to
ns)
EIA Base Case 2007
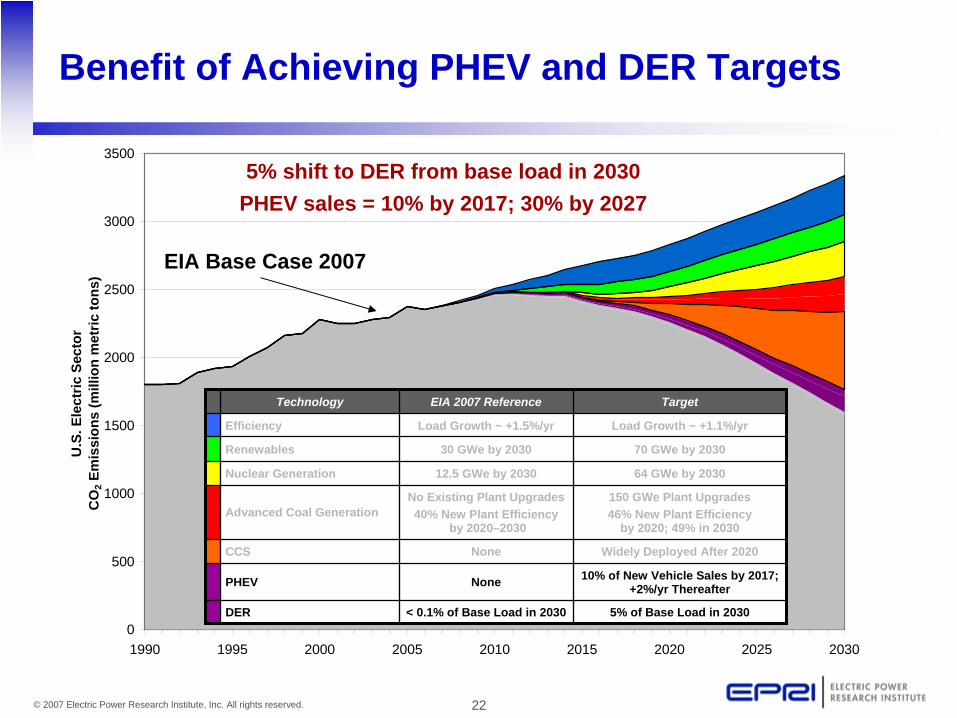
Benefit of Achieving PHEV and DER Targets
5% shift to DER from base load in 2030PHEV sales = 10% by 2017; 30% by 2027
Technology EIA 2007 Reference Target
Efficiency Load Growth ~ +1.5%/yr Load Growth ~ +1.1%/yr
Renewables 30 GWe by 2030 70 GWe by 2030
Nuclear Generation 12.5 GWe by 2030 64 GWe by 2030
Advanced Coal GenerationNo Existing Plant Upgrades40% New Plant Efficiency
by 2020–2030
150 GWe Plant Upgrades46% New Plant Efficiency
by 2020; 49% in 2030
CCS None Widely Deployed After 2020
PHEV None 10% of New Vehicle Sales by 2017; +2%/yr Thereafter
DER < 0.1% of Base Load in 2030 5% of Base Load in 2030
23© 2007 Electric Power Research Institute, Inc. All rights reserved.
0
500
1000
1500
2000
2500
3000
3500
1990 1995 2000 2005 2010 2015 2020 2025 2030
U.S
. Ele
ctric
Sec
tor
CO
2 Em
issi
ons
(mill
ion
met
ric to
ns)
EIA Base Case 2007
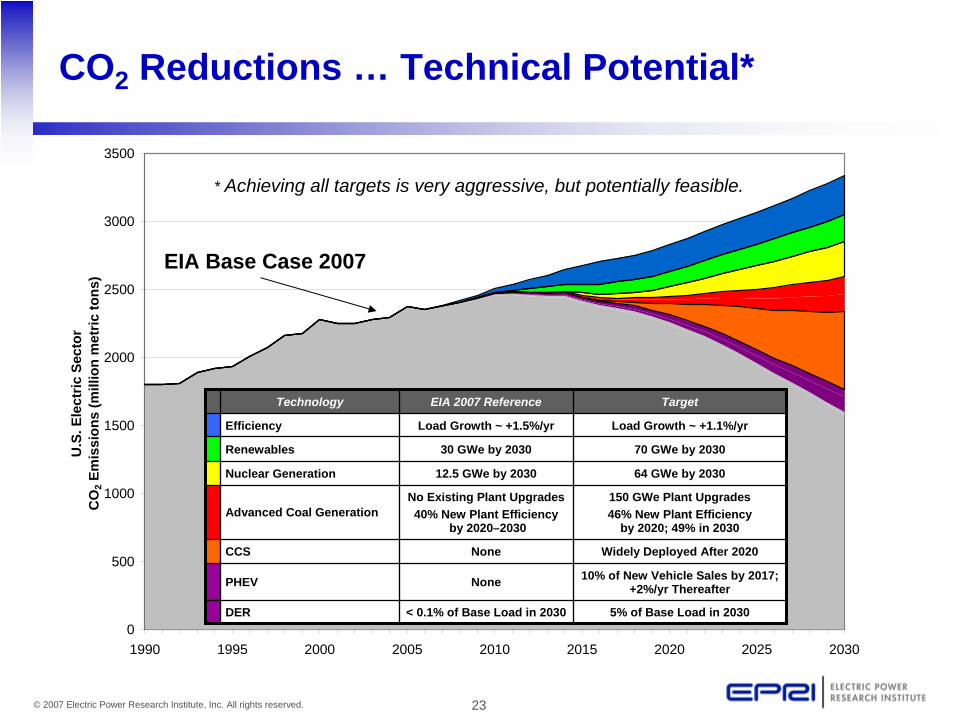
CO2 Reductions … Technical Potential*
Technology EIA 2007 Reference Target
Efficiency Load Growth ~ +1.5%/yr Load Growth ~ +1.1%/yr
Renewables 30 GWe by 2030 70 GWe by 2030
Nuclear Generation 12.5 GWe by 2030 64 GWe by 2030
Advanced Coal GenerationNo Existing Plant Upgrades40% New Plant Efficiency
by 2020–2030
150 GWe Plant Upgrades46% New Plant Efficiency
by 2020; 49% in 2030
CCS None Widely Deployed After 2020
PHEV None 10% of New Vehicle Sales by 2017; +2%/yr Thereafter
DER < 0.1% of Base Load in 2030 5% of Base Load in 2030
* Achieving all targets is very aggressive, but potentially feasible.
24© 2007 Electric Power Research Institute, Inc. All rights reserved.
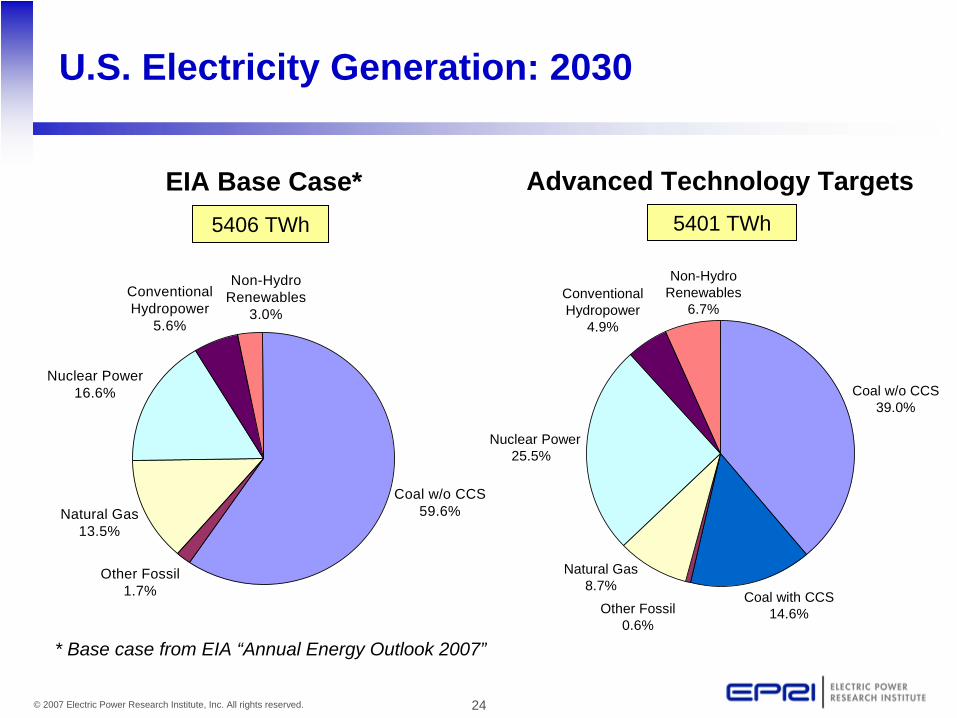
U.S. Electricity Generation: 2030
Other Fossil1.7%
Natural Gas13.5%
Coal w/o CCS59.6%
Non-Hydro Renewables
3.0%Conventional Hydropower
5.6%
Nuclear Power16.6%
5406 TWh
Nuclear Power25.5%
Coal with CCS14.6%
Coal w/o CCS39.0%
Other Fossil0.6%
Natural Gas8.7%
Conventional Hydropower
4.9%
Non-Hydro Renewables
6.7%
5401 TWh
EIA Base Case* Advanced Technology Targets
* Base case from EIA “Annual Energy Outlook 2007”
25© 2007 Electric Power Research Institute, Inc. All rights reserved.
Presentation Objective
Provide a factual framework for discussing:
I. Generation technologies and investment decisions in a world with carbon constraints
II. R&D needs to achieve a low-cost, low-carbon portfolio of electricity technologies
III. Technical feasibility of using this portfolio of technologies to reduce U.S. electric sector CO2 emissions
IV. Economic implications of achieving significant CO2 reductions with/without low-cost, low-carbon technologies
26© 2007 Electric Power Research Institute, Inc. All rights reserved.
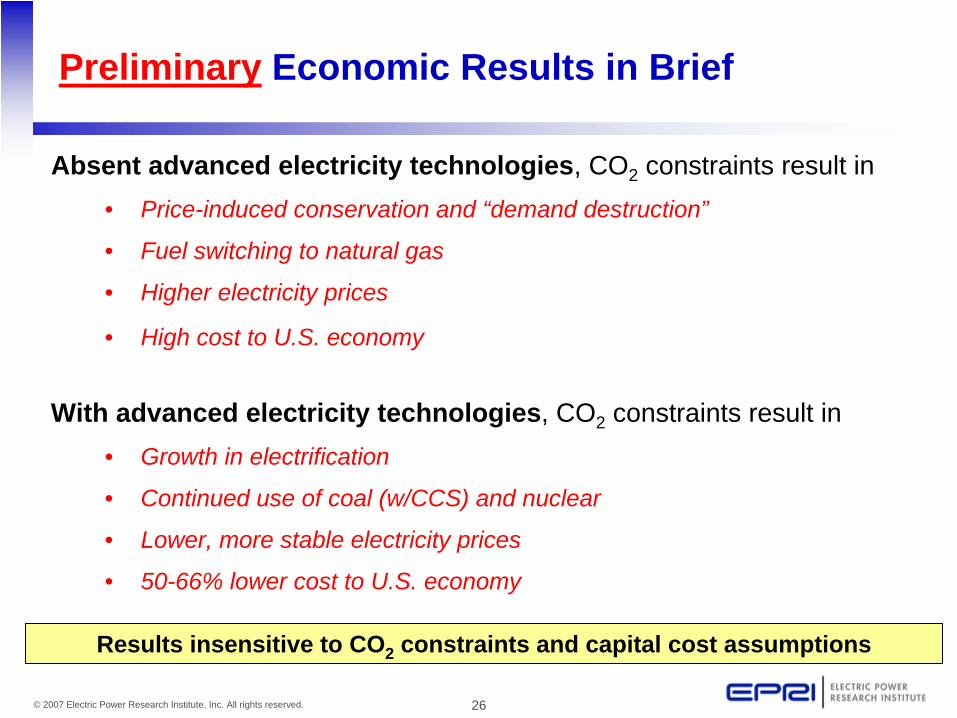
Preliminary Economic Results in Brief
Absent advanced electricity technologies, CO2 constraints result in • Price-induced conservation and “demand destruction”
• Fuel switching to natural gas
• Higher electricity prices
• High cost to U.S. economy
With advanced electricity technologies, CO2 constraints result in • Growth in electrification
• Continued use of coal (w/CCS) and nuclear
• Lower, more stable electricity prices
• 50-66% lower cost to U.S. economy
Results insensitive to CO2 constraints and capital cost assumptions