Embed Size (px)
Citation preview
ELECTRICITY PRICING
METHODOLOGY 2013
EFFECTIVE 1 APRIL 2013
DISCLOSED IN ACCORDANCE WITH SECTION 2.4.1 OF THE ELECTRICITY
DISTRIBUTION INFORMATION DISCLOSURE DETERMINATION 2012
Powerco Limited | Electricity Pricing Methodology 2013 2
CONTENTS PAGE
1. Definitions .................................................................................................................. 3
2. Background ............................................................................................................... 7
3. Legal Requirements ................................................................................................... 8
4. Changes to the methodology ................................................................................... 13
5. Overview of the pricing methodology ....................................................................... 15
6. Powerco’s Pricing Strategy ...................................................................................... 17
7. Summary of Pricing Process .................................................................................... 18
8. Quantification of Key Components of Costs and Revenues ..................................... 19
9. Eastern Region pricing Methodology ....................................................................... 21
10. Western Region pricing Methodology ...................................................................... 31
11. Revenue Summary .................................................................................................. 39
12. Approach to setting prices for non-standard contracts ............................................. 41
13. Compliance with Electricity Authority’s Pricing Principles ......................................... 44
14. Summary of Compliance with clauses 2.4.1 to 2.4.5 of the Electricity Information
Disclosure Determination 2012 ................................................................................ 54
15. Certification of Year Beginning Disclosure ............................................................... 57
Annex A: Characteristics of Powerco’s Eastern and Western Network ................................ 58
Powerco Limited | Electricity Pricing Methodology 2013 3
1. DEFINITIONS
This pricing methodology uses industry standard terms where possible. A glossary of
common terms is included for clarity. Additional information on definitions used in the
document can be found in:
Powerco’s Distributed Generation Policy and Asset Management Plan1; and
The Commerce Commission’s electricity default price-quality path notice and
information disclosure requirements.2
“Anytime Maximum Demand” (AMD) means, in respect of a Western Region
Consumer, on a 12-month rolling basis the highest kVA peak occurring at anytime for
that Consumer. In respect of an Eastern Region Consumer, AMD means the highest
kW peak occurring any time in the twelve month period from 1 January to 31
December, the result of which is applied in the subsequent Price Year commencing 1
April.
“Avoided Cost of Transmission” (ACOT) is the amount equal to the actual reduction
in the interconnection charges of new investment charges that are payable by
Powerco to Transpower under the Grid Network Agreement. ACOT charges are a
substitute for what otherwise would have been Transpower charges.
“Coincident Maximum Demand” (CMD) see “On Peak Demand”
“Connection” or “Point of Connection” means each point of connection at which a
supply of electricity may flow between the Distribution Network and the Consumer’s
installation, as defined by the Distributor.
“Consumer” means a purchaser of electricity from the Retailer where the electricity is
delivered via the Distribution Network.
“Customer” means a direct Customer or a Retailer (where the Retailer is the
Customer).
“Default Price Path – DPP” means Powerco’s compliance with clause 8 of the
Commerce Act (Electricity Distribution Default Price Quality Path) Determination
2010.3
“Demand” means the rate of expending electrical energy expressed in kilowatts (kW)
or kilovolt amperes (kVA).
“Distributed Generation” or “Embedded Generation” means electricity generation
that is connected and distributed within the Network.
“Distributed Generator” or “Embedded Generator” means an electricity generation
plant producing Embedded Generation.
1 Available at www.powerco.co.nz. 2 Available at www.comcom.govt.nz.
3 The DPP is described in more detail on the Commerce Commission’s website,
http://www.comcom.govt.nz/electricity-default-price-quality-path/
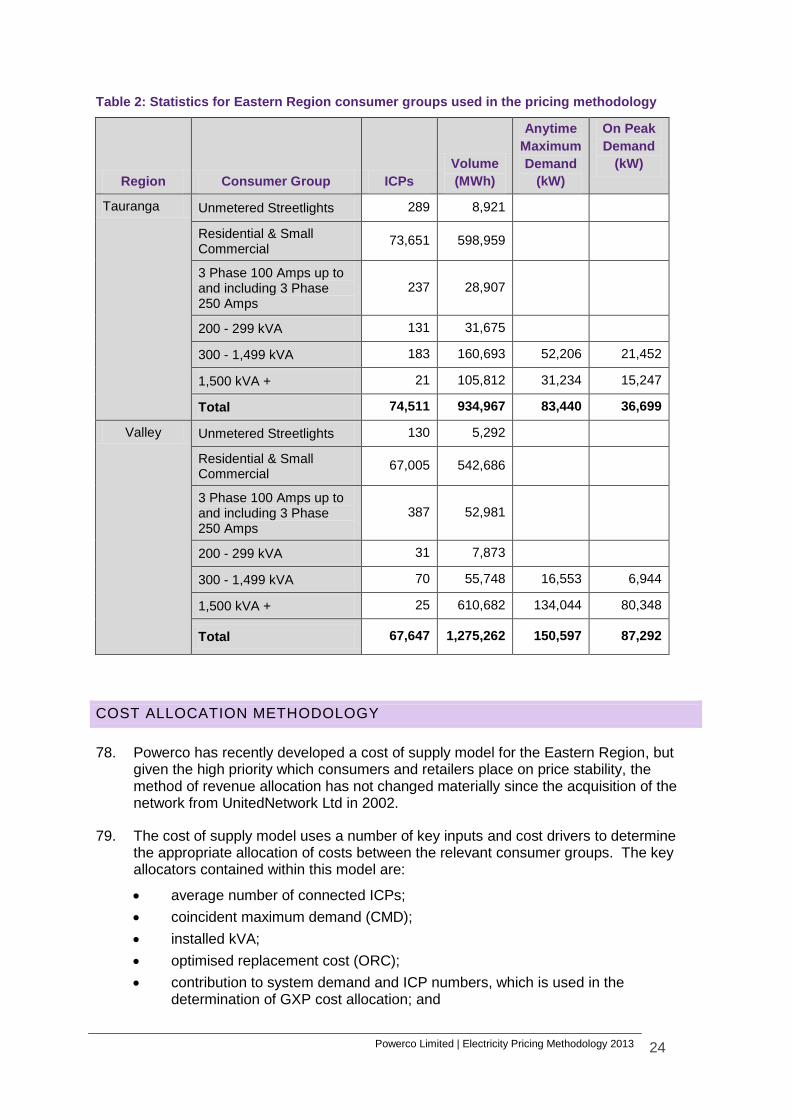
Powerco Limited | Electricity Pricing Methodology 2013 4
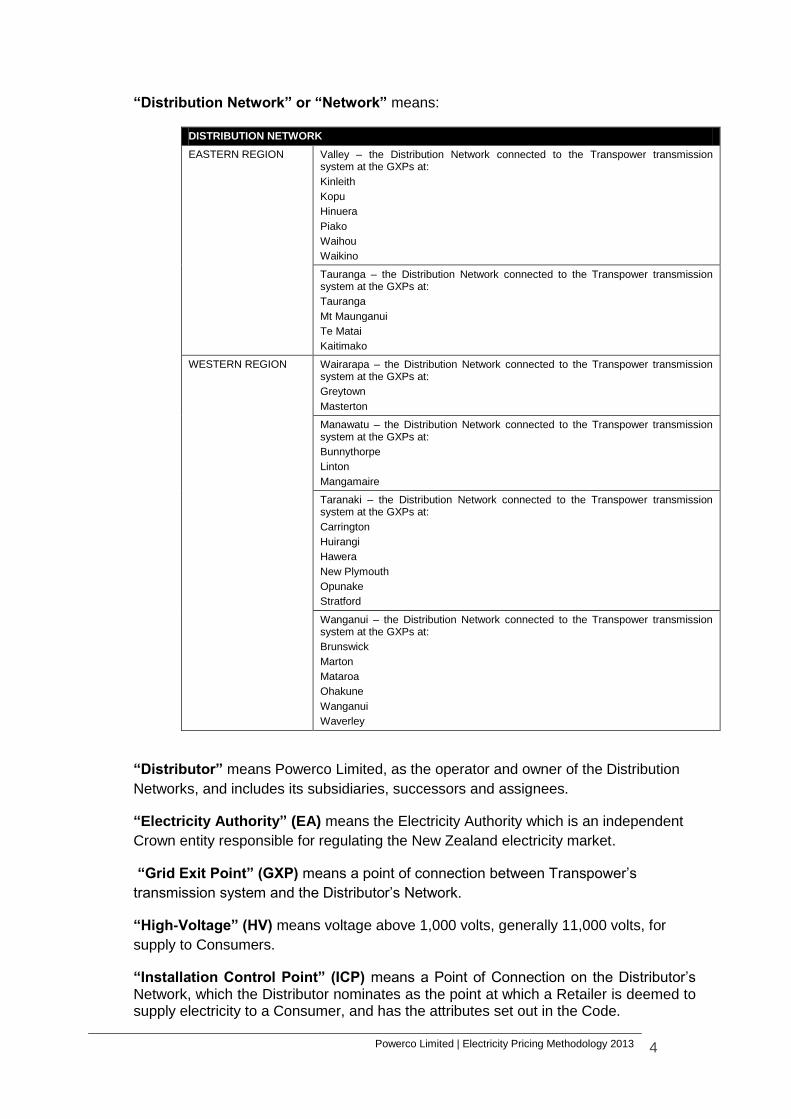
“Distribution Network” or “Network” means:
DISTRIBUTION NETWORK
EASTERN REGION
Valley – the Distribution Network connected to the Transpower transmission system at the GXPs at:
Kinleith
Kopu
Hinuera
Piako
Waihou
Waikino
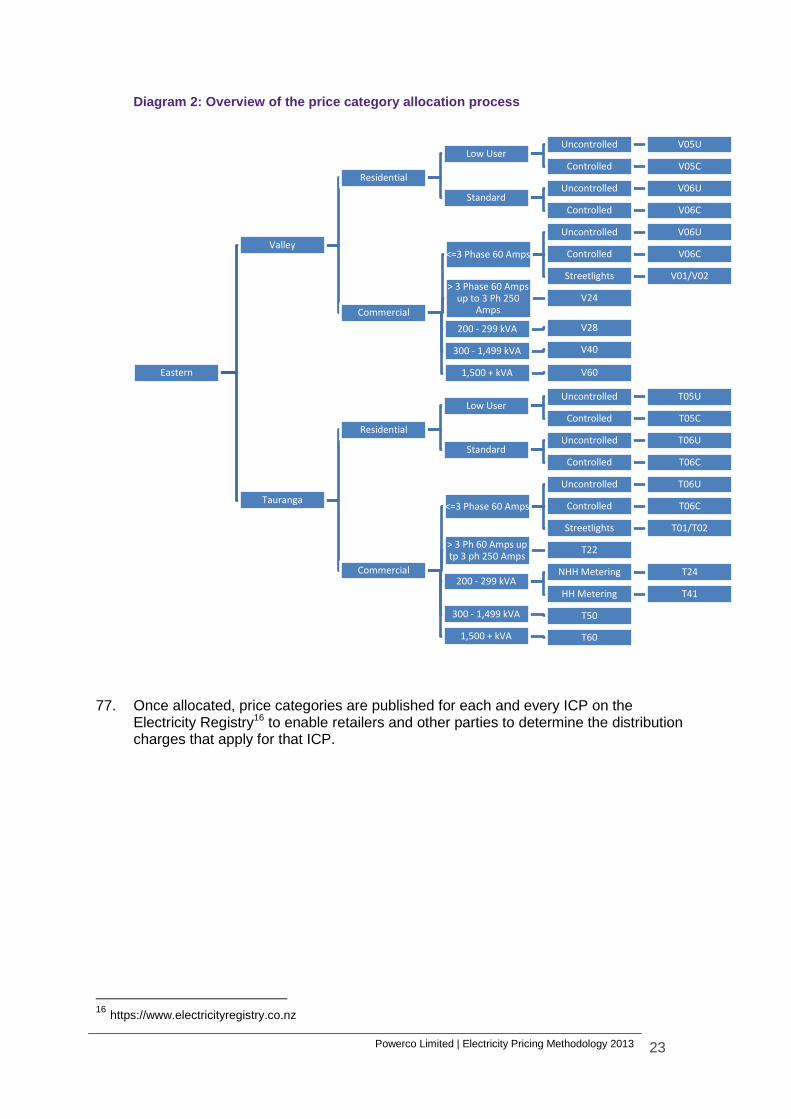
Tauranga – the Distribution Network connected to the Transpower transmission system at the GXPs at:
Tauranga
Mt Maunganui
Te Matai
Kaitimako
WESTERN REGION
Wairarapa – the Distribution Network connected to the Transpower transmission system at the GXPs at:
Greytown
Masterton
Manawatu – the Distribution Network connected to the Transpower transmission system at the GXPs at:
Bunnythorpe
Linton
Mangamaire
Taranaki – the Distribution Network connected to the Transpower transmission system at the GXPs at:
Carrington
Huirangi
Hawera
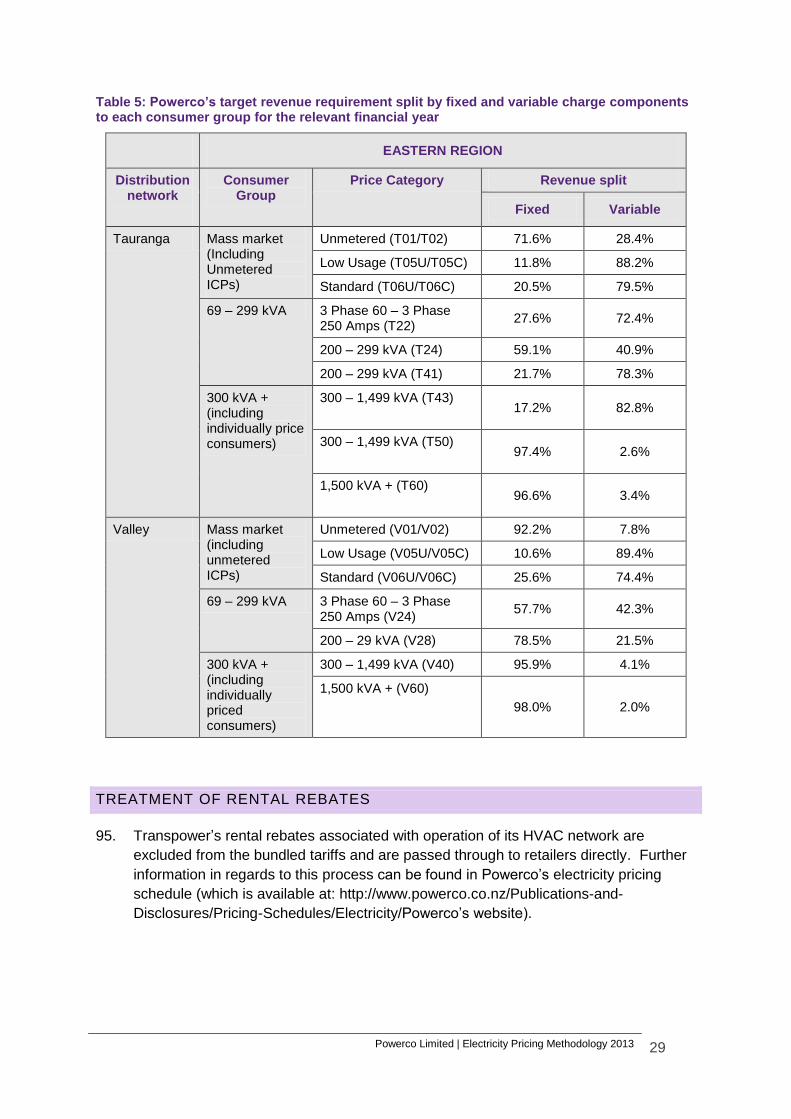
New Plymouth
Opunake
Stratford
Wanganui – the Distribution Network connected to the Transpower transmission system at the GXPs at:
Brunswick
Marton
Mataroa
Ohakune
Wanganui
Waverley
“Distributor” means Powerco Limited, as the operator and owner of the Distribution
Networks, and includes its subsidiaries, successors and assignees.
“Electricity Authority” (EA) means the Electricity Authority which is an independent
Crown entity responsible for regulating the New Zealand electricity market.
“Grid Exit Point” (GXP) means a point of connection between Transpower’s
transmission system and the Distributor’s Network.
“High-Voltage” (HV) means voltage above 1,000 volts, generally 11,000 volts, for
supply to Consumers.
“Installation Control Point” (ICP) means a Point of Connection on the Distributor’s Network, which the Distributor nominates as the point at which a Retailer is deemed to supply electricity to a Consumer, and has the attributes set out in the Code.
Powerco Limited | Electricity Pricing Methodology 2013 5
“kVA” means kilovolt–ampere (amp). “kVAh” means kilovolt ampere hour. “kVAr” means kilovolt ampere reactive. “kW” means kilowatt. “kWh” means kilowatt hour. “Line Charges” means the charges levied by the Distributor on Customers for the use of the Distribution Network, as described in the Pricing Schedule. “Low Voltage” (LV) means voltage of value up to 1,000 volts, generally 230 or 400 volts for supply to Consumers.
“MVA” means Megavolt Ampere. “Network” see Distribution Network. “Optimised Deprival Value” (ODV) means, in respect of the Distributor’s assets, the value attributed by applying the ODV methodology, as set out in the Handbook for Optimised Deprival Valuation of System Fixed Assets of Electricity Line Businesses published by the Commerce Commission in 2004. “Optimised Replacement Cost” (ORC) is an estimate of the current cost of replacing the asset with one that can provide the required service in the most efficient way. Under this approach, asset values are adjusted if assets exhibit excess capacity, are over-engineered, are poorly designed (compared with modern technology) or are poorly located. “Optimised Depreciated Replacement Cost” (ODRC) is an estimate of the ORC value, less an allowance for depreciation that reflects the age of the asset. “On Peak Demand” (OPD) is the average of Consumer’s demand during the 100 regional peak periods as notified by Transpower. The 100 regional peak periods will be between 1 September 2010 and 31 August 2011 for the Price Year effective 1 April 2012. The OPD is used in calculating the Line Charges of a Consumer on an asset-based load group such as the V40, T50, V60 and T60 load groups. “Point of Connection” means the point at which electricity may flow between the Network and the Consumer’s Installation and to which an Installation Control Point is allocated. “Powerco” means Powerco Limited and any of its subsidiaries, successors and assignees. “Price Category” means the relevant price category selected by the Distributor from this Pricing Schedule to define the Line Charges applicable to a particular ICP. “Price Year” means the 12-month period between 1 April and 31 March. “Recoverable Costs” has the meaning specified in clause 3.1.3 of the Commerce Act (Electricity Distribution Services Input Methodologies) Determination 2012.
Powerco Limited | Electricity Pricing Methodology 2013 6
“Region” means the Eastern Region or the Western Region as the case may be. “Registry” means the Electricity Authority central Registry. “Retailer” means the supplier of electricity to Consumers with installations connected to the Distribution Network. “Time of Use Meter” (TOU) means metering that measures the electricity consumed for a particular period (usually half-hourly) and complies with Part 10 of the Code. “Tariff Option” means the price option within a Price Category where such a Price Category provides for Retailer choice amongst two or more options, subject to a particular configuration of metering and Load Control Equipment. “Transmission Charge” has the meaning specified in section 4 of the Electricity Distribution Services Default Price-Quality Path Determination 2010.
Powerco Limited | Electricity Pricing Methodology 2013 7
2. BACKGROUND
1. Powerco is a utility network ownership and management business. It is New Zealand’s
largest provincial distributor of electricity and gas, with around 420,000 consumers
connected to its networks. Powerco’s electricity networks are located in Tauranga,
Thames Valley, Coromandel Peninsula, Eastern and Southern Waikato, Taranaki,
Whanganui, Rangitikei, Manawatu and Wairarapa. Our gas pipeline networks are in
Hutt Valley, Porirua, Wellington, Horowhenua, Manawatu, Taranaki and Hawke’s Bay.
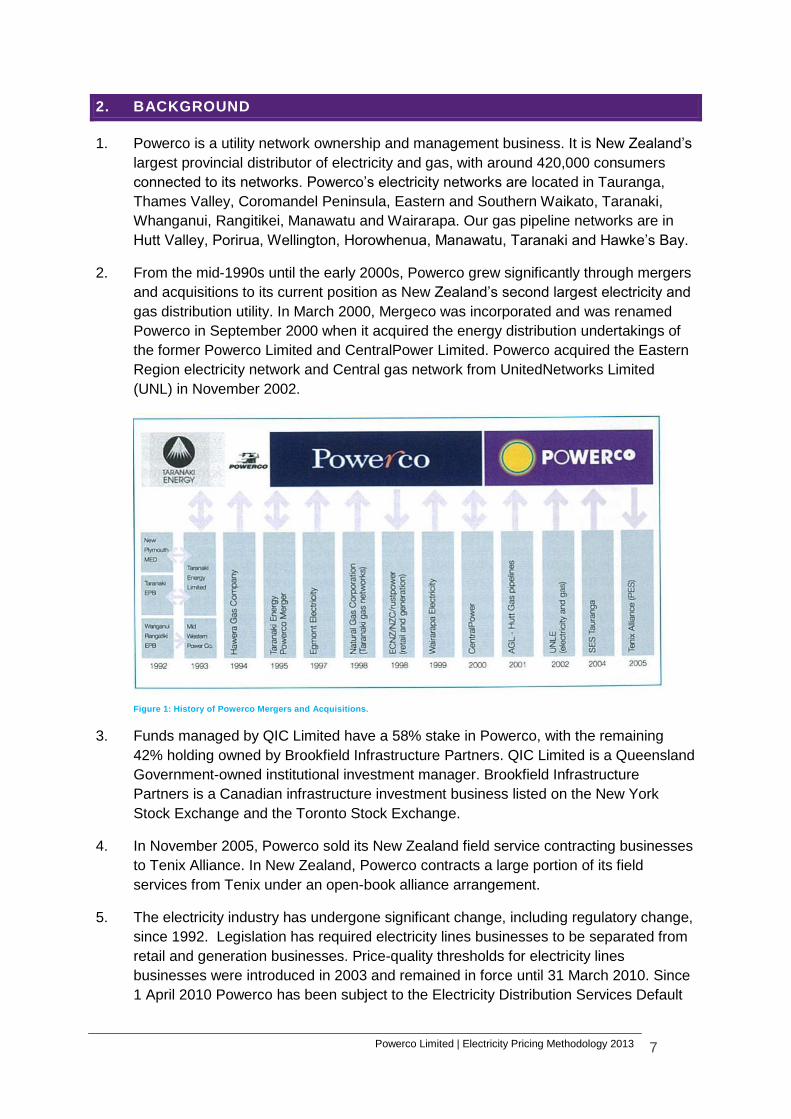
2. From the mid-1990s until the early 2000s, Powerco grew significantly through mergers
and acquisitions to its current position as New Zealand’s second largest electricity and
gas distribution utility. In March 2000, Mergeco was incorporated and was renamed
Powerco in September 2000 when it acquired the energy distribution undertakings of
the former Powerco Limited and CentralPower Limited. Powerco acquired the Eastern
Region electricity network and Central gas network from UnitedNetworks Limited
(UNL) in November 2002.
Figure 1: History of Powerco Mergers and Acquisitions.
3. Funds managed by QIC Limited have a 58% stake in Powerco, with the remaining
42% holding owned by Brookfield Infrastructure Partners. QIC Limited is a Queensland
Government-owned institutional investment manager. Brookfield Infrastructure
Partners is a Canadian infrastructure investment business listed on the New York
Stock Exchange and the Toronto Stock Exchange.
4. In November 2005, Powerco sold its New Zealand field service contracting businesses
to Tenix Alliance. In New Zealand, Powerco contracts a large portion of its field
services from Tenix under an open-book alliance arrangement.
5. The electricity industry has undergone significant change, including regulatory change,
since 1992. Legislation has required electricity lines businesses to be separated from
retail and generation businesses. Price-quality thresholds for electricity lines
businesses were introduced in 2003 and remained in force until 31 March 2010. Since
1 April 2010 Powerco has been subject to the Electricity Distribution Services Default
Powerco Limited | Electricity Pricing Methodology 2013 8
Price-Quality Path Determination 20104, which is enforced pursuant to Part 4 of the
Commerce Act 1986.
6. On 1 October 2012 the Electricity Distribution Information Disclosure Determination 2012 came into force, which inter alia requires Powerco and other non-exempt lines businesses to disclose specified pricing and related information.
3. LEGAL REQUIREMENTS
7. This document contains the information that must be disclosed in accordance with
clauses 2.4.1 to 2.4.5 of the Electricity Distribution Information Disclosure
Determination 2012. Part of this required information is a demonstration of the extent
to which the pricing methodology is consistent with the Electricity Authority’s pricing
principles5 and, if necessary, an explanation of the reasons for any inconsistency
between the pricing methodology and the pricing principles6. We do not believe there
is any inconsistency between this pricing methodology and the pricing principles.
8. Other legal requirements that affect distribution pricing are contained in the Commerce
Act (Electricity Distribution Default Price-Quality Path) Determination 2010 (DPP) and
the Electricity (Low Fixed Charge Tariff for Domestic Consumers) Regulations 2004
(Low Fixed Tariff Regulations).
9. Detailed below are:
the disclosure requirements;
the Electricity Authority’s pricing principles;
the pricing implications of the DPP;
the pricing implications of the Low Fixed Tariff Regulations.
ELECTRICITY DISTRIBUTION INFORMATION DISCLOSURE DETERMINATION
2012 – CLAUSES 2.4.1 TO 2.4.5
The Commerce Commission’s Electricity Distribution Information Disclosure
Determination 2012 came into force on 1 October 2012. Clauses 2.4.1 to 2.4.5 of the
Determination state:
Disclosure of pricing methodologies
2.4.1 Every EDB must publicly disclose, before the start of each disclosure year, a
pricing methodology which-
(1) Describes the methodology, in accordance with clause 2.4.3 below, used to
calculate the prices payable or to be payable;
4 Originally styled the Commerce Act (Electricity Distribution Default Price-Quality-Path) Determination 2010. 5 As specified in Distribution Pricing Principles and Information Disclosure Guidelines, originally
published by the Electricity Commission in March 2010. 6 Clause 2.4.3(1) of the Electricity Distribution Information Disclosure Determination 2012 refers.
Powerco Limited | Electricity Pricing Methodology 2013 9
(2) Describes any changes in prices and target revenues;
(3) Explains, in accordance with clause 2.4.5 below, the approach taken with
respect to pricing in non-standard contracts and distributed generation (if any);
(4) Explains whether, and if so how, the EDB has sought the views of consumers,
including their expectations in terms of price and quality, and reflected those
views in calculating the prices payable or to be payable. If the EDB has not
sought the views of consumers, the reasons for not doing so must be disclosed.
2.4.2 Any change in the pricing methodology or adoption of a different pricing
methodology, must be publicly disclosed at least 20 working days before prices
determined in accordance with the change or the different pricing methodology take
effect.
2.4.3 Every disclosure under clause 2.4.1 above must-
(1) Include sufficient information and commentary to enable interested persons to
understand how prices were set for each consumer group, including the
assumptions and statistics used to determine prices for each consumer group;
(2) Demonstrate the extent to which the pricing methodology is consistent with the
pricing principles and explain the reasons for any inconsistency between the
pricing methodology and the pricing principles;
(3) State the target revenue expected to be collected for the disclosure year to which
the pricing methodology applies;
(4) Where applicable, identify the key components of target revenue required to
cover the costs and return on investment associated with the EDB’s provision of
electricity lines services. Disclosure must include the numerical value of each of
the components;
(5) State the consumer groups for whom prices have been set, and describe–
(a) the rationale for grouping consumers in this way;
(b) the method and the criteria used by the EDB to allocate consumers to each of
the consumer groups;
(6) If prices have changed from prices disclosed for the immediately preceding
disclosure year, explain the reasons for changes, and quantify the difference in
respect of each of those reasons;
(7) Where applicable, describe the method used by the EDB to allocate the target
revenue among consumer groups, including the numerical values of the target
revenue allocated to each consumer group, and the rationale for allocating it in
this way;
(8) State the proportion of target revenue (if applicable) that is collected through
each price component as publicly disclosed under clause 2.4.18.
Powerco Limited | Electricity Pricing Methodology 2013 10
2.4.4 Every disclosure under clause 2.4.1 above must, if the EDB has a pricing
strategy-
(1) Explain the pricing strategy for the next 5 disclosure years (or as close to 5 years
as the pricing strategy allows), including the current disclosure year for which
prices are set;
(2) Explain how and why prices for each consumer group are expected to change as
a result of the pricing strategy;
(3) If the pricing strategy has changed from the preceding disclosure year, identify
the changes and explain the reasons for the changes.
2.4.5 Every disclosure under clause 2.4.1 above must–
(1) Describe the approach to setting prices for non-standard contracts, including–
(a) the extent of non-standard contract use, including the number of ICPs
represented by non-standard contracts and the value of target revenue
expected to be collected from consumers subject to non-standard contracts;
(b) how the EDB determines whether to use a non-standard contract, including
any criteria used;
(c) any specific criteria or methodology used for determining prices for
consumers subject to non-standard contracts and the extent to which these
criteria or that methodology are consistent with the pricing principles;
(2) Describe the EDB’s obligations and responsibilities (if any) to consumers subject
to non-standard contracts in the event that the supply of electricity lines services
to the consumer is interrupted. This description must explain-
(a) the extent of the differences in the relevant terms between standard contracts
and non-standard contracts;
(b) any implications of this approach for determining prices for consumers
subject to non-standard contracts;
(3) Describe the EDB’s approach to developing prices for electricity distribution
services provided to consumers that own distributed generation, including any
payments made by the EDB to the owner of any distributed generation, and
including the-
(a) prices; and
(b) value, structure and rationale for any payments to the owner of the distributed
generation.
Powerco Limited | Electricity Pricing Methodology 2013 11
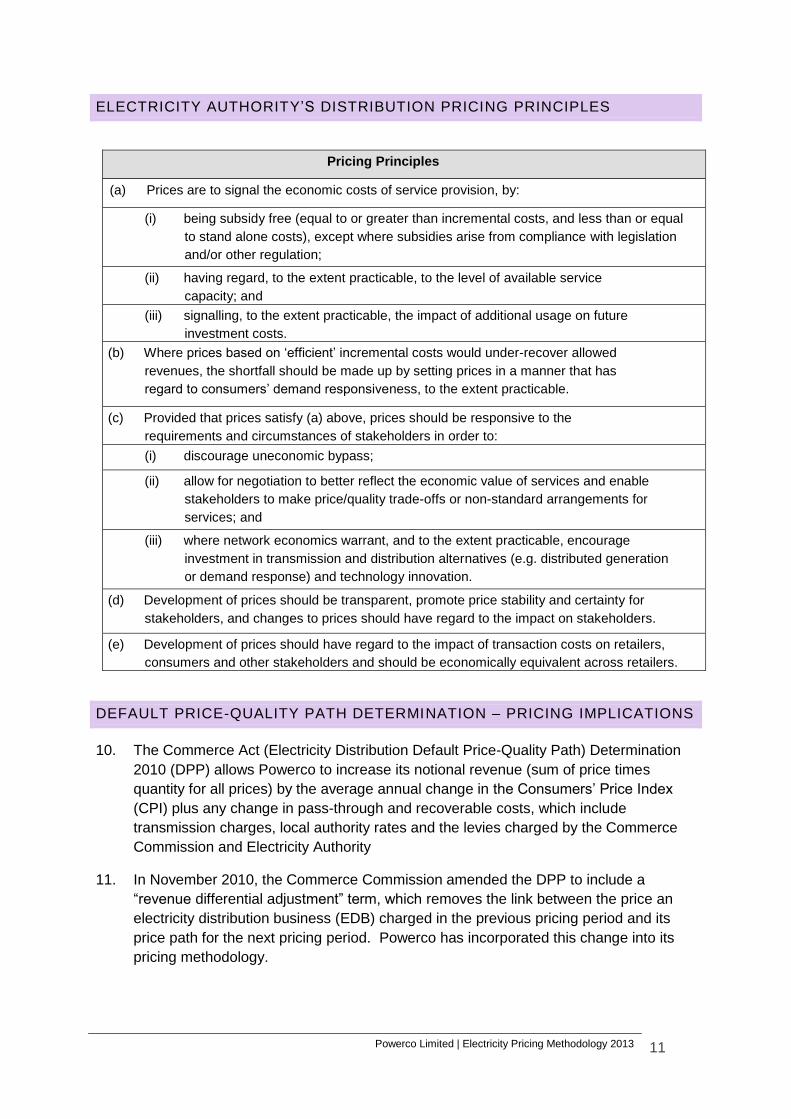
ELECTRICITY AUTHORITY’S DISTRIBUTION PRICING PRINCIPLES
Pricing Principles
(a) Prices are to signal the economic costs of service provision, by:
(i) being subsidy free (equal to or greater than incremental costs, and less than or equal
to stand alone costs), except where subsidies arise from compliance with legislation
and/or other regulation;
(ii) having regard, to the extent practicable, to the level of available service
capacity; and
(iii) signalling, to the extent practicable, the impact of additional usage on future
investment costs.
(b) Where prices based on ‘efficient’ incremental costs would under-recover allowed
revenues, the shortfall should be made up by setting prices in a manner that has
regard to consumers’ demand responsiveness, to the extent practicable.
(c) Provided that prices satisfy (a) above, prices should be responsive to the
requirements and circumstances of stakeholders in order to:
(i) discourage uneconomic bypass;
(ii) allow for negotiation to better reflect the economic value of services and enable
stakeholders to make price/quality trade-offs or non-standard arrangements for
services; and
(iii) where network economics warrant, and to the extent practicable, encourage
investment in transmission and distribution alternatives (e.g. distributed generation
or demand response) and technology innovation.
(d) Development of prices should be transparent, promote price stability and certainty for
stakeholders, and changes to prices should have regard to the impact on stakeholders.
(e) Development of prices should have regard to the impact of transaction costs on retailers,
consumers and other stakeholders and should be economically equivalent across retailers.
DEFAULT PRICE-QUALITY PATH DETERMINATION – PRICING IMPLICATIONS
10. The Commerce Act (Electricity Distribution Default Price-Quality Path) Determination
2010 (DPP) allows Powerco to increase its notional revenue (sum of price times
quantity for all prices) by the average annual change in the Consumers’ Price Index
(CPI) plus any change in pass-through and recoverable costs, which include
transmission charges, local authority rates and the levies charged by the Commerce
Commission and Electricity Authority
11. In November 2010, the Commerce Commission amended the DPP to include a
“revenue differential adjustment” term, which removes the link between the price an
electricity distribution business (EDB) charged in the previous pricing period and its
price path for the next pricing period. Powerco has incorporated this change into its
pricing methodology.
Powerco Limited | Electricity Pricing Methodology 2013 12
12. In November 2012, the Commerce Commission finalised a mid-period starting price
adjustment for the DPP applying to electricity distribution businesses7.Changes to
electricity line charges with effect from 1 April 2013 reflect changes that result from this
starting price adjustment.
LOW FIXED TARIFF REGULATIONS – PRICING IMPLICATIONS
13. The Electricity (Low Fixed Charge Tariff for Domestic Consumers) Regulations 2004
require that, for every residential standard tariff option that is available, another tariff
option must also made available for residential consumers for which the fixed charge
component is no more than 15 cents per day and the total charges per year for the
average residential consumer are the same or no more than those incurred under the
standard option. Consequently, changes to the annual charges under the low fixed
charge option for the average8 residential consumer must be no more than the
changes to the annual charges incurred under the standard option for the same
consumer.
POWERCO’S PRICING OBJECTIVE AND PRACTICE
14. Powerco’s principal objective when allocating its annual revenue requirement is to set
prices to ensure that the company recovers its operating and recoverable cost (chiefly
transmission costs) and earns the permitted regulatory return on (and of) its capital.
15. When determining its prices, Powerco balances a number of considerations, including:
the price signals or incentives required to ensure efficient use of the network;
the ability of consumers/retailers to respond to these signals or provide these same signals without dilution to end consumers;
minimising business risk, particularly in relation to costs that are outside Powerco’s control;
the need to take account of customer preferences and the effect of rate shocks when adjusting rates;
the transaction and compliance costs that affect its stakeholders;
the expectations of its shareholders; and
the need to comply with all legal requirements.
16. Because Powerco has grown through mergers and acquisitions it has inherited
different pricing methodologies and pricing groups from its predecessor businesses. In
order to achieve greater equity, and reduce transaction costs, Powerco has been
gradually moving towards greater alignment of its pricing methodologies and fewer
customer groups. By 2010 37 price groups had been consolidated into 16 groups.
Powerco is currently undertaking a pricing review with the aim of better aligning its
Eastern and Western pricing methodologies, consistent with the Electricity Authority’s
7 The adjustment reset the 2010-15 default price-quality paths for 16 electricity distributors,.
8 Average consumer is defined as an 8000 kWh per annum consumer in accordance with the
Electricity (Low Fixed Charge Tariff Option for Domestic Consumers) Regulations 2004.
Powerco Limited | Electricity Pricing Methodology 2013 13
pricing principles and draft decision-making and economic framework, and the
requirements of the Electricity Distribution Information Disclosure Determination 2012.
4. CHANGES TO THE METHODOLOGY
17. There have been no material changes to Powerco’s pricing methodology since the
previous methodology was published in March 2012. From 1 April 2013 we have,
however, incorporated some minor tariff rationalisation and adjustments as detailed
below.
18. In the Eastern region we have reclassified the V24 and T22 load groups in the Valley
and Tauranga regions respectively from “3 Phase 100 Amps to 3 Phase 250 Amps” to
“greater than 3 Phase 60 Amps to 3 Phase 250 Amps”. This change was implemented
to make it explicit that any fuse sizes greater than 3 Phase 60 Amps were to be
classified as V24 or T22.
19. In the Eastern region we have created a new tariff option of 24DG for the T05, T06,
V05 and V06 load groups. This tariff option is only for separately metered export
volumes and has been created to allow retailers to submit volumes separately from
any connections that have the ability to generate and inject electricity into Powerco’s
network.
20. Across the Eastern and Western regions we have reviewed and revised a number of
loss factors to reflect the average reconciliation losses over the previous 24 month
period. Specifically, in the Valley network area we have revised the loss factors for the
loss factor codes VYLALV, and VYMALV. In the Western region we have revised the
loss factors for the loss factor codes BPE, BRK, CST, GYT, HUI, LTN, NPL, MGM,
MST, MTN, MTR, OKN, SFD, WGN, and WVY.
21. In the Tauranga network we have migrated 88 ICPs from the closed load group of T43
(300 – 1,499 kVA) to the equivalent T50 (300 – 1,499 kVA) load group. This is part of
an ongoing process to migrate ICPs from the legacy load group of T43 (which has a
combination of variable and fixed charges and has been closed to new connections
since 1 April 2005) to the T50 load group where the charges are individually
determined and, as a result, more cost reflective.
22. With regard to the changes outlined in paragraph 16, to minimise the impact on
existing consumers in this price category, Powerco decided that this change would
only apply to existing connections where the potential increase to the lines charges
was less than or equal to 25%9. This approach was discussed in our consultations
with retailers before being implemented and no feedback was received that suggested
that any alternative approach was preferred. We will continue to migrate the remaining
connections from the T43 to the T50 load group in future pricing years and regularly
consult with retailers with regard to the further transitional arrangements.
9 As determined by Powerco based on historical usage.
Powerco Limited | Electricity Pricing Methodology 2013 14
23. In the Thames Valley network we have re-balanced the fixed and variable charges for
the V24 and V28 load groups in order to reduce the disparity between the fixed
charges for these load groups and the equivalent fixed charges for the load groups of
T22 and T24 in the Tauranga region. In order to minimise the rate shocks to individual
connections this re-balancing will be implemented in stages over the next three pricing
years. We will consult with retailers during each stage of this process.
24. In the Tauranga network we have cancelled the CTUD dual meter tariff option for the
T06U/T06C load groups and migrated these connections to the equivalent 24UC tariff
option. The CTUD tariff option was historically only for commercial connections in the
T20 load group (greater than 3 Phase 20 amps) and has been closed to new
connections since 1 April 2010 – this was because, in April 2010, the commercial load
group of T20 merged with the mass market load group of T06 which consequently
required us to create an equivalent CTUD tariff option for the T06 load group for
transitional purposes only.
25. In the Western region we have reduced the daily fixed charge for connections in the
E1C load group from 10 cents/day to 0 cents/day. This change was introduced to
provide increased load control incentives to the connections on our Western network
which have some form of controllable load10 and to more closely align the incentives
between Powerco’s Eastern and Western regions. During our consultations a number
of retailers supported increasing the incentive but suggested that a variable pricing
signal (like the CTRL tariff option in the Eastern region) would be a more efficient
method of sharing the benefits of controllable load with consumers. This was duly
considered, but the nature of Powerco’s pricing methodology in the Western region
limits our ability to achieve this change. Therefore, the only viable option to provide an
increased incentive within the existing methodology was to reduce the daily fixed
charge.
26. In the Western region we have revised the definition of the E100 and E300 price
categories from “connections with installed capacity of less than 300 kVA” and
“connections with installed capacity of 300 kVA and greater” respectively to
“connections with installed capacity of less than or equal to 300 kVA” and “connections
with installed capacity of greater than 300 kVA”. These changes were made to
remove an existing anomaly in the applicable price category for any connections with
300 kVA of connected capacity. This has resulted in 21 connections with 300 kVA of
installed capacity being migrated from the E300 to the E100 price category. In order to
mitigate the impact of this change only connections that had an increase of less than
10% were migrated this year. Transitional arrangements for the remaining four
connections will be discussed with retailers in due course.
27. In the Western region, for a small number of large commercial/industrial connections in
the SPECIAL load group we have chosen to apply a power factor charge11 from 1 May
2013. This was is in response to Powerco noticing a deteriorating power factor among
these specific connections and to better align the treatment of power factor charges
across the Western and Eastern regions. The charge provides an incentive for the
10 As defined in Powerco’s Price Schedule which can be found at: http://www.powerco.co.nz/Publications-and-
Disclosures/Pricing-Schedules/Electricity/ 11 As per the terms and conditions set out in the price schedule.
Powerco Limited | Electricity Pricing Methodology 2013 15
consumer to take some form of corrective action. Powerco has provided three months’
notice of this charge applying to allow sufficient time for the consumer to take the
necessary steps to remedy the situation prior to the charge applying (if they choose to
do so).
28. This document has also been revised to include more information that may be helpful
to the Electricity Authority, Commerce Commission, consumers and interested
persons.
5. OVERVIEW OF THE PRICING METHODOLOGY
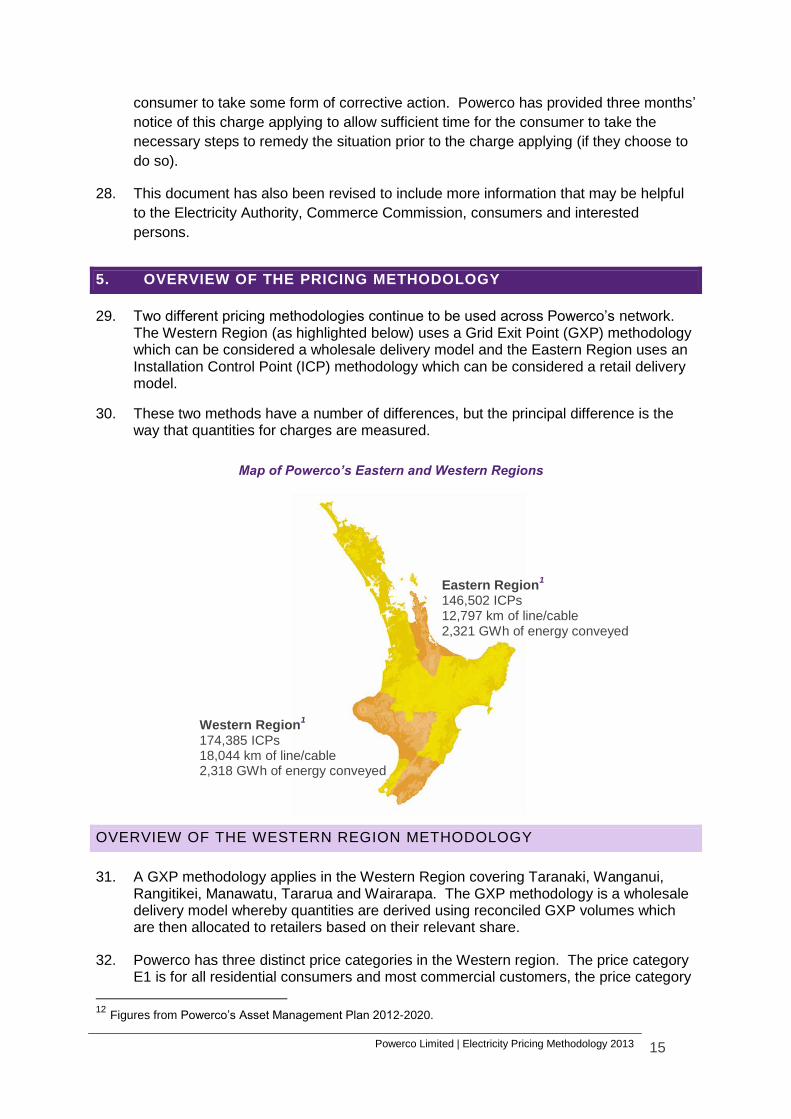
29. Two different pricing methodologies continue to be used across Powerco’s network. The Western Region (as highlighted below) uses a Grid Exit Point (GXP) methodology which can be considered a wholesale delivery model and the Eastern Region uses an Installation Control Point (ICP) methodology which can be considered a retail delivery model.
30. These two methods have a number of differences, but the principal difference is the way that quantities for charges are measured.
Map of Powerco’s Eastern and Western Regions12
OVERVIEW OF THE WESTERN REGION METHODOLOGY
31. A GXP methodology applies in the Western Region covering Taranaki, Wanganui, Rangitikei, Manawatu, Tararua and Wairarapa. The GXP methodology is a wholesale delivery model whereby quantities are derived using reconciled GXP volumes which are then allocated to retailers based on their relevant share.
32. Powerco has three distinct price categories in the Western region. The price category E1 is for all residential consumers and most commercial customers, the price category
12 Figures from Powerco’s Asset Management Plan 2012-2020.
Eastern Region1
146,502 ICPs 12,797 km of line/cable 2,321 GWh of energy conveyed
Western Region1
174,385 ICPs 18,044 km of line/cable 2,318 GWh of energy conveyed
Powerco Limited | Electricity Pricing Methodology 2013 16
E100 is for commercial customers with installed capacity of 100 kVA or greater (up to and including 300 kVA), and the price category E300 is for commercial customers with installed capacity of greater than 300 kVA.
33. These price categories were defined as such due to the different levels of demand that each of these consumer groups place on particular components of the network such as sub-transmission, high voltage (11kV), and low voltage (400V) assets and the on-site assets at each connection. For example, in most cases a mass market (E1) connection makes use of all network assets but has limited on-site assets, whereas an industrial connection in the E300 price category has many more on-site assets but makes limited use of the low voltage (400V) network assets. The use of these consumer groups makes it possible to more accurately recover the costs actually incurred by different classes of customer.
34. Each price category in the Western region has different tariffs by region which reflect a grouping of GXPs with similar characteristics such as network density and geographical location. High density networks typically have lower costs per customer than low density networks.
35. Essentially all sales for service take place at the GXP. Volumes and demand data for industrial consumers, normally 11kV network users, are calculated from half hour metering data, adjusted for losses, with the balance of volume and demand inputs derived from the reconciliation process and retailer ICP counts accessed from the industry registry.
36. For the majority of consumers, minimal market segmentation occurs under the GXP method, which should reduce barriers to a competitive retail market and promote innovation in retailer designed consumer tariffs.
OVERVIEW OF THE EASTERN REGION METHODOLOGY
37. An Installation Control Point (ICP) methodology is used for the Eastern Region. This methodology has not been significantly altered since the acquisition of the UnitedNetworks (UNL) networks in the Tauranga, Thames Valley and Coromandel regions in 2002.
38. This methodology is a retail delivery model whereby the sale for service takes place at the consumer’s metering point.
39. Powerco has two separate price schedules in the Eastern region reflecting the tariff structure since the acquisition of the UNL networks in 2002. These different schedules are based on geographical location of our consumers and are defined as Thames Valley (or Valley, which includes the Coromandel) and Tauranga.
40. Each of these price schedules consist of around six different price categories, again reflecting the tariff structure since the acquisition of the UNL networks in 2002. The price categories are:
1. T01/T02 and V01/V02 − for all unmetered connections in the Valley and Tauranga regions;
2. T05/T06 and V05/V06 − for all residential consumers and small commercial consumers with a fuse size of 3 Phase 60 Amps or less;
Powerco Limited | Electricity Pricing Methodology 2013 17
3. T22/V24 − for commercial customers with a fuse size of greater than 3 Phase 60 Amps up to and including 3 Phase 250 Amps;
4. T24/T41/V28 − for commercial customers with an installed capacity of 200 – 299 kVA;
5. T43/T50/V40 − for commercial customers with an installed capacity of 300 – 1499 kVA; and
6. T60/V60 − for commercial customers with an installed capacity of 1,500 kVA and greater.
41. These price categories were defined around consumer groups with similar load characteristics such as installation type (such as Unmetered, Non-Half Hour (NHH), and Half Hour (HH)), fuse size and installed capacity of the consumer’s installation.
42. The granularity of the groupings for each price category will always be a trade-off between practicality, fairness and cost reflectiveness and Powerco will continue to consult with retailers and consumers to ensure an appropriate balance is maintained.
43. This ICP based methodology is more consistent with retailer tariffs and consequently makes it possible to provide a greater number of targeted price signals to specific groups or individual market segments of consumers to encourage efficient use of the network.
6. POWERCO’S PRICING STRATEGY
44. Powerco grew rapidly from its first merger in 1995, to its current footprint, which incorporates eleven businesses that existed in the late 1980s. The focus of pricing since the last merger in 2002 has been a consolidation from 47 to 16 price categories. This change has been driven by administrative efficiency and the desire to treat customers equitably.
45. An important principle of the consolidation process was to minimise the impact on consumers and retailers. For example, Powerco operates quite different pricing methodologies in its Eastern and Western regions and the pricing methodology for the Eastern Region has not been substantially changed since it was inherited by Powerco in 2002. Rather than adopting a “big bang” approach to align pricing, Powerco has followed an incremental strategy, thereby minimising the change for consumers and retailers.
46. In 2010, the first stage of the consolidation process was completed. Powerco is now undertaking a pricing review with the aim of better aligning Eastern and Western pricing and preparing Powerco to respond to future challenges and opportunities, including those created by regulatory changes, and technological developments, such as the roll out of advanced metering infrastructure. How consumer prices might change as a result of this review is not yet known.
47. Until the pricing review has been completed, Powerco will continue to use its existing pricing methodology. Changes to electricity line charges with effect from 1 April 2013 reflect increases in charges that result from the Commerce Commission’s 30 November 2012 starting price adjustment13,and a pass through of increases to specific
13
The adjustment reset the 2010-15 default price-quality paths for 16 electricity distributors.
Powerco Limited | Electricity Pricing Methodology 2013 18
pass through and recoverable costs, which include transmission charges (Transpower’s interconnection and connection charges, Transpower’s charges under customer investment contracts and avoided cost of transmission (ACOT) payments to embedded generators), local authority rates, and Commerce Commission and Electricity Authority levies.
48. Powerco’s medium term pricing objective is to achieve better alignment between four revenue requirement by price category and region and the underlying cost of supply. Accordingly, from 1 April 2013, a number of price categories across the Western and Eastern regions have had a slightly higher (or lower) than average increase in order align the resulting revenue more closely to the outputs of the cost of supply model. To minimise the impact of this realignment on retailers and consumers, Powerco is making these adjustments over a three to five year period.
7. SUMMARY OF PRICING PROCESS
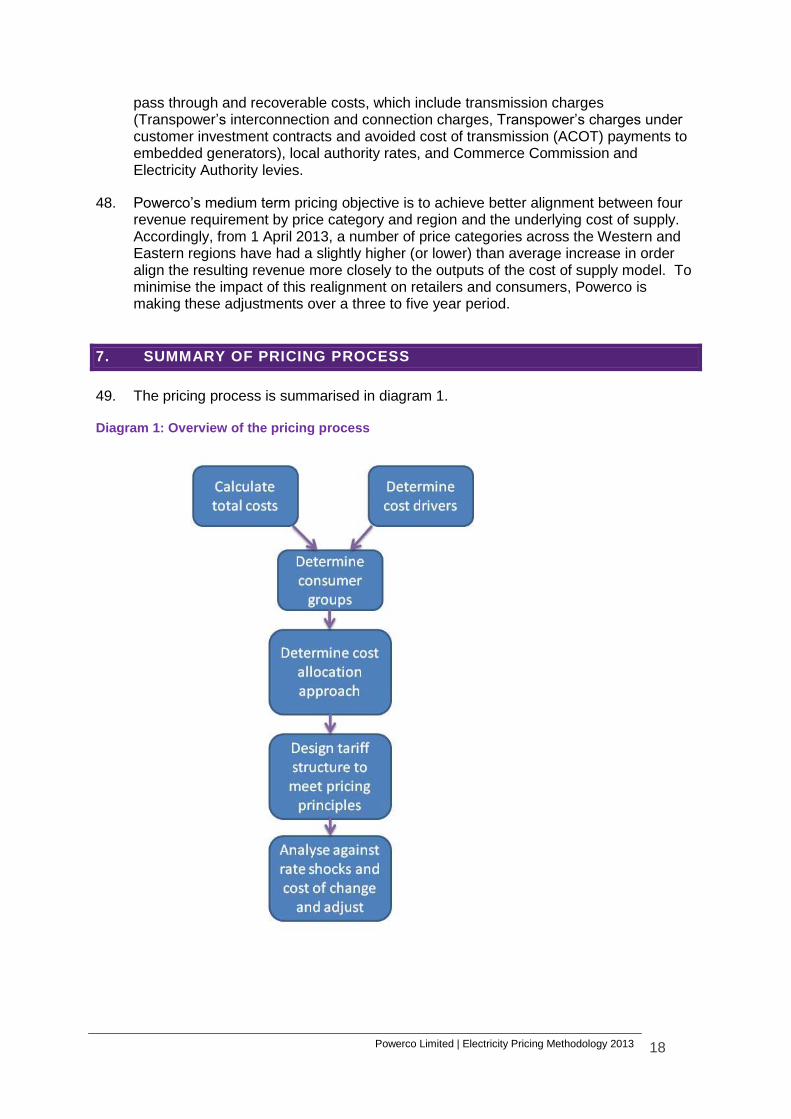
49. The pricing process is summarised in diagram 1.
Diagram 1: Overview of the pricing process
Powerco Limited | Electricity Pricing Methodology 2013 19
50. A description of the pricing process is:
calculate total costs for the relevant period; these include transmission costs (including ACOT), capital costs, operating costs, maintenance costs and administration costs;
determine the key drivers of network expenditure;
determine suitable groupings of connections across each network based on similarities of network and consumer characteristics such as geography, rural/urban connection density, mains size, protection rating and/or transformer capacity;
determine the allocation of costs (such as operating costs, transmission costs and cost of capital) across each network and tariff category;
calculate prices based on the relevant cost allocations, ensuring compliance with the relevant legal requirements;
assess the pricing structure to take account of the effect of rate shocks and adjust as needed.
8. QUANTIFICATION OF KEY COMPONENTS OF COSTS AND REVENUES
51. The key components of network costs and revenue for Powerco’s Eastern and Western Regions are summarised below. Network assets, customer density and system length largely drive these costs. Consequently, these costs are largely fixed and independent of the volume of electricity consumed across our network.
OPERATING COSTS
52. These are costs associated with the provision of electricity distribution services, including:
statutory charges and levies (excluding those that are pass through costs);
network planning and asset management costs;
network management and dispatch costs;
network operation costs;
the cost of support services such as billing, record management, planning, contract administration, regulatory compliance and resource costs;
depreciation on electricity lines business assets; and
tax.
53. Detailed information on Powerco’s historical costs are disclosed each year in Powerco’s annual information disclosure to the Commerce Commission. This information is publicly disclosed on Powerco’s website, including by cost category.
54. Powerco’s asset management plan contains forecasts of capital and operating expenditure over a ten year period which helps to form a view of future costs. This information is also publicly disclosed on Powerco’s website.
55. Powerco’s operating costs relating to the electricity business are allocated directly to each relevant region. Where this is not possible, the allocation between regions is based on each region’s total optimised replacement cost (ORC).
Powerco Limited | Electricity Pricing Methodology 2013 20
56. Powerco’s indirect operating costs relating to the electricity business are allocated between regions and customer groups using a weighted average of each group’s contribution to system demand and ICP numbers.
TRANSMISSION COSTS
57. These are the costs charged by Transpower for transmission services and those charged by other parties that provide services that substitute for transmission or distribution services. Transmission costs include Transpower’s interconnection, connection and new investment charges and any avoided cost of transmission (ACOT) payments made by Powerco.
58. Transmission costs are allocated between customer groups using a weighted average of the regional coincident maximum demand (based on the 100 regional coincident peak demands) attributable to each load group and the number of ICPs within each load group.
COST OF CAPITAL
59. This is the cost of capital (both debt and equity) invested in Powerco. Powerco requires large amounts of capital to maintain and develop network assets to meet increased demand, satisfy quality standards and legal compliance requirements, and achieve performance targets for safety and reliability. Historical capital expenditure by drivers (e.g. system growth, replacement and renewal) is available on Powerco’s website.
60. Powerco’s asset management plan provides a large amount of detail on the drivers of capital expenditure for the network.14
61. Capital costs are allocated between regions based on the optimised replacement cost of the assets within each group.
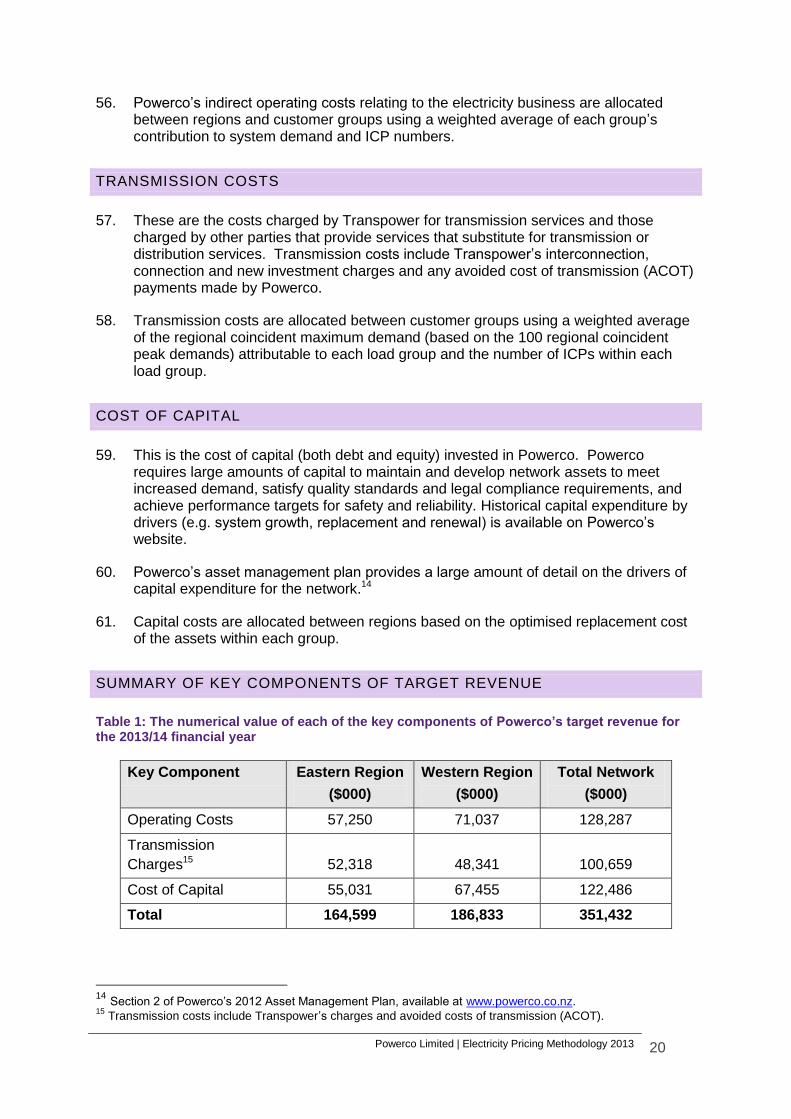
SUMMARY OF KEY COMPONENTS OF TARGET REVENUE
Table 1: The numerical value of each of the key components of Powerco’s target revenue for the 2013/14 financial year
Key Component Eastern Region
($000)
Western Region
($000)
Total Network
($000)
Operating Costs 57,250 71,037 128,287
Transmission
Charges15 52,318 48,341 100,659
Cost of Capital 55,031 67,455 122,486
Total 164,599 186,833 351,432
14 Section 2 of Powerco’s 2012 Asset Management Plan, available at www.powerco.co.nz. 15
Transmission costs include Transpower’s charges and avoided costs of transmission (ACOT).
Powerco Limited | Electricity Pricing Methodology 2013 21
9. EASTERN REGION PRICING METHODOLOGY
CONSUMER GROUPS
RATIONALE FOR CONSUMER GROUPS
62. Powerco uses six consumer groups in the Eastern Region for pricing purposes:
T01/T02 and V01/V02 − for all unmetered connections such as streetlights in the Valley and Tauranga regions;
T05/T06 and V05/V06 − for all residential consumers and small commercial consumers with a fuse size of 3 Phase 60 Amps or less;
T22/V24 − for commercial customers with a fuse size of greater than 3 Phase 60 Amps up to and including 3 Phase 250 Amps;
T24/T41/V28 − for commercial customers with an installed capacity of 200 – 299 kVA;
T43/T50/V40 − for commercial customers with an installed capacity of 300 – 1499 kVA; and
T60/V60 − for commercial customers with an installed capacity of 1,500 kVA and greater.
63. These price categories are based around consumer groups with similar load characteristics such as demand, fuse size and installed capacity of the consumer’s installation as well as groups which use specific sets of assets. Annex A provides information on the characteristics of the network and consumers in the Eastern Region.
64. The characteristics of each consumer group are provided in Table 2. Ideally Powerco would have more information on anytime maximum demand and on peak demand. However, this information is only available for connections that have half hour meters and therefore assumptions on the load profile of the remaining consumer connections have to be made.
65. The T01/T02 and V01/V02 price categories are for unmetered streetlights which, due to the unmetered nature of the load and the associated dedicated equipment, require special consideration when determining our revenue requirement.
66. The T05/T06 and V05/V06 price categories are for all residential consumers and small commercial consumers with a fuse size of 3 Phase 60 amps or less. Any consumers with a fuse size of up to 3 Phase 60 Amps are typically considered to be residential or small commercial consumers and, as such, individually place minimal demands on our network and require minimal investment in on-site and upstream assets.
67. The T22/V24 price categories are for connections with a fuse size of greater than 3 Phase 60 amps up to 250 amps. Any connections with these fuse sizes are typically commercial consumers with higher average volumes than the T05/T06 and V05/V06 price categories. Therefore, this group places increased demands on different components of our network and requires a slightly larger investment in on-site and upstream assets.
Powerco Limited | Electricity Pricing Methodology 2013 22
68. The T24/T41/V28 price categories are for connections with an installed capacity of greater than 200 kVA up to 299 kVA. Any connections with this level of installed capacity are typically medium sized commercial consumers with significantly higher average volumes than the T22/V24 price categories. Therefore, this group places increased demands on the upstream network assets and requires a slightly larger investment in on-site and upstream assets.
69. The T43/T50/V40 price categories are for connections with an installed capacity of greater than 300 kVA up to 1,499 kVA. Any connections with this level of installed capacity are typically large commercial consumers which require dedicated transformers and associated switch gear to meet their supply requirements.
70. The T60/V60 price categories are for connections with an installed capacity of greater than 1,500 kVA. Any connections with this level of installed capacity are typically very large commercial/industrial consumers which place increased demand on upstream network assets and require dedicated on-site transformers and dedicated feeders to meet their supply requirements.
71. Because connections in the V40, T50, T60 and V60 price categories typically require dedicated on-site and upstream assets they are all individually priced based on their specific on-site and upstream assets and contribution to peak demands. While these consumers are charged a constant daily rate this rate is reviewed each year based on the consumer’s previous year’s peak demands. This ensures that their charges are regularly updated to reflect their individual contribution to network costs.
72. The ICP pricing methodology more closely reflects retailer tariffs and consequently makes it possible to provide a greater number of targeted price signals to specific groups or individual market segments of consumers to encourage efficient use of the network.
73. Powerco’s charges are structured so that the fixed revenue component increases as the connected capacity of each price category increases. This is to ensure that our overall charges reflect the level of demand that consumers place on different components of our network such as sub-transmission, high voltage (11kV) and low voltage (400V).
74. The granularity of the groupings for each price category will always be a trade-off between practicality, fairness and cost reflectiveness and Powerco will continue to consult with retailers and consumers to strike the preferred balance.
METHOD FOR DETERMINING THE ALLOCATION OF CONSUMERS
75. Consumers in the Eastern Region are allocated to one of the two distribution networks of Valley and Tauranga based on the grid exit point that is associated with the consumer’s ICP.
76. Consumers are then allocated into an appropriate price category based on the market segment attributable to the consumer, mains size, dedicated transformer capacity, metering type and/or availability of controllable load (as shown in diagram 2).
Powerco Limited | Electricity Pricing Methodology 2013 23
Diagram 2: Overview of the price category allocation process
77. Once allocated, price categories are published for each and every ICP on the Electricity Registry16 to enable retailers and other parties to determine the distribution charges that apply for that ICP.
16 https://www.electricityregistry.co.nz
Eastern
Valley
Residential
Low User Uncontrolled V05U
Controlled V05C
Standard Uncontrolled V06U
Controlled V06C
Commercial
<=3 Phase 60 Amps
Uncontrolled V06U
Controlled V06C
Streetlights V01/V02 > 3 Phase 60 Amps
up to 3 Ph 250 Amps
V24
200 - 299 kVA V28
300 - 1,499 kVA V40
1,500 + kVA V60
Tauranga
Residential
Low User Uncontrolled T05U
Controlled T05C
Standard Uncontrolled T06U
Controlled T06C
Commercial
<=3 Phase 60 Amps
Uncontrolled T06U
Controlled T06C
Streetlights T01/T02
> 3 Ph 60 Amps up tp 3 ph 250 Amps
T22
200 - 299 kVA NHH Metering T24
HH Metering T41
300 - 1,499 kVA T50
1,500 + kVA T60
Powerco Limited | Electricity Pricing Methodology 2013 24
Table 2: Statistics for Eastern Region consumer groups used in the pricing methodology
Region Consumer Group ICPs
Volume
(MWh)
Anytime
Maximum
Demand
(kW)
On Peak
Demand
(kW)
Tauranga Unmetered Streetlights 289 8,921
Residential & Small Commercial
73,651 598,959
3 Phase 100 Amps up to and including 3 Phase 250 Amps
237 28,907
200 - 299 kVA 131 31,675
300 - 1,499 kVA 183 160,693 52,206 21,452
1,500 kVA + 21 105,812 31,234 15,247
Total 74,511 934,967 83,440 36,699
Valley Unmetered Streetlights 130 5,292
Residential & Small Commercial
67,005 542,686
3 Phase 100 Amps up to and including 3 Phase 250 Amps
387 52,981
200 - 299 kVA 31 7,873
300 - 1,499 kVA 70 55,748 16,553 6,944
1,500 kVA + 25 610,682 134,044 80,348
Total 67,647 1,275,262 150,597 87,292
COST ALLOCATION METHODOLOGY
78. Powerco has recently developed a cost of supply model for the Eastern Region, but given the high priority which consumers and retailers place on price stability, the method of revenue allocation has not changed materially since the acquisition of the network from UnitedNetwork Ltd in 2002.
79. The cost of supply model uses a number of key inputs and cost drivers to determine the appropriate allocation of costs between the relevant consumer groups. The key allocators contained within this model are:
average number of connected ICPs;
coincident maximum demand (CMD);
installed kVA;
optimised replacement cost (ORC);
contribution to system demand and ICP numbers, which is used in the determination of GXP cost allocation; and
Powerco Limited | Electricity Pricing Methodology 2013 25
contribution to coincident maximum demand and ICP numbers, which is used in the allocation of costs between load groups.
80. For the purposes of cost allocation the cost of supply model aggregates costs into one of three groups rather than the six price categories mentioned earlier. This is to allow consistency between regions and to simplify the resulting analysis. The three groups consist of:
mass market (which includes unmetered, residential and small commercial consumer groups);
commercial consumers with a capacity greater than 69 kVA but less than 299 kVA;
commercial consumers with a capacity greater than or equal to 300 kVA (this includes individually priced consumers in the V40, T50 , V60 and T60 groups).
81. Where possible, Powerco’s operating costs in relation to the electricity business are allocated directly to each relevant region. Where this is not possible the allocation between regions is based on each region’s optimised replacement cost (ORC).
82. Transmission costs are allocated directly to each relevant region due to the fact that all costs can be directly attributed to specific GXPs. Capital costs are allocated to regions based on the optimised depreciated replacement cost (ODRC) of the assets within each group.
83. Powerco’s operating costs, transmission costs and capital costs are then subsequently allocated between price categories using a 80:20 weighted average of the contribution to regional coincident peak demand and ICP numbers for each group in accordance with the formula below:
( )
∑ ( )
where A is the cost allocator;
I is the number of ICPs for each price category i;
D is the contribution to regional coincident peak demand for each price category i.
84. Given the data available, this approach is reasonably cost-reflective and provides some incentive to flatten peak demands. Powerco could use other methods, such as only ICP numbers or electricity volume. However, these allocators are not as related to cost drivers and would not send as good a price signal.
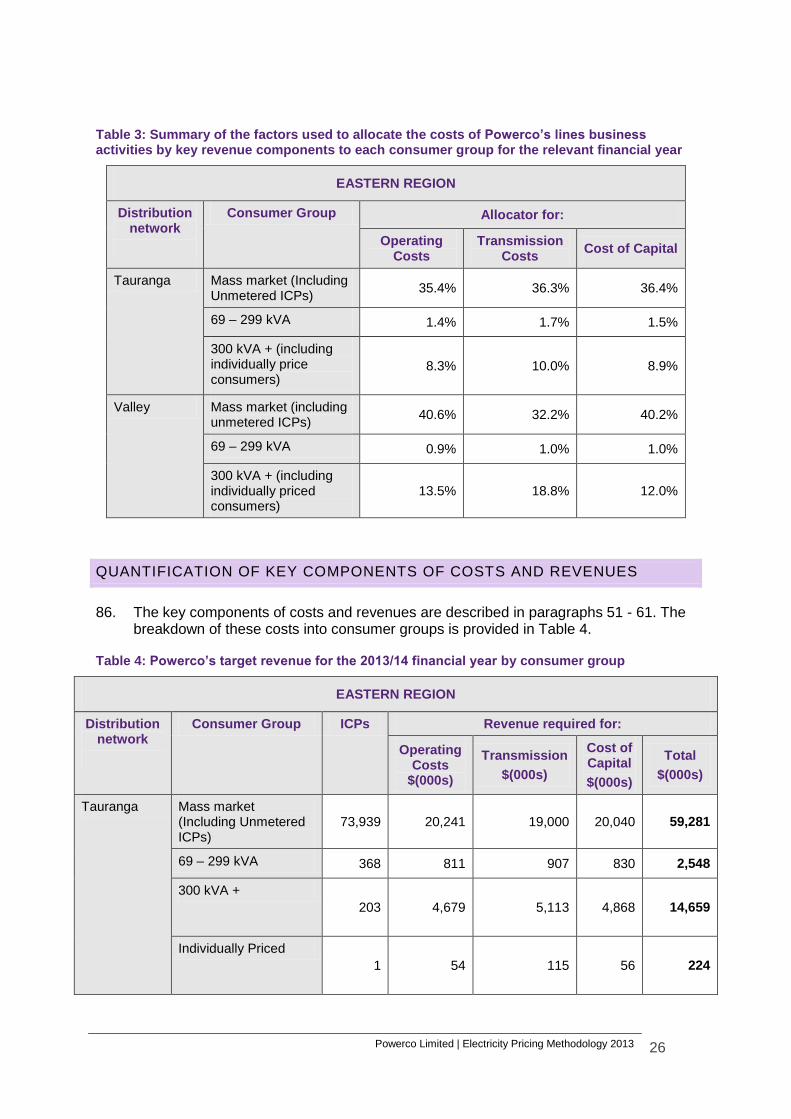
85. Table 3 provides a summary of the allocation factors used in the cost of supply model to allocate costs between regions and price categories for the Eastern region.
Powerco Limited | Electricity Pricing Methodology 2013 26
Table 3: Summary of the factors used to allocate the costs of Powerco’s lines business activities by key revenue components to each consumer group for the relevant financial year
EASTERN REGION
Distribution network
Consumer Group Allocator for:
Operating Costs
Transmission Costs
Cost of Capital
Tauranga Mass market (Including Unmetered ICPs)
35.4% 36.3% 36.4%
69 – 299 kVA 1.4% 1.7% 1.5%
300 kVA + (including individually price consumers)
8.3% 10.0% 8.9%
Valley Mass market (including unmetered ICPs)
40.6% 32.2% 40.2%
69 – 299 kVA 0.9% 1.0% 1.0%
300 kVA + (including individually priced consumers)
13.5% 18.8% 12.0%
QUANTIFICATION OF KEY COMPONENTS OF COSTS AND REVENUES
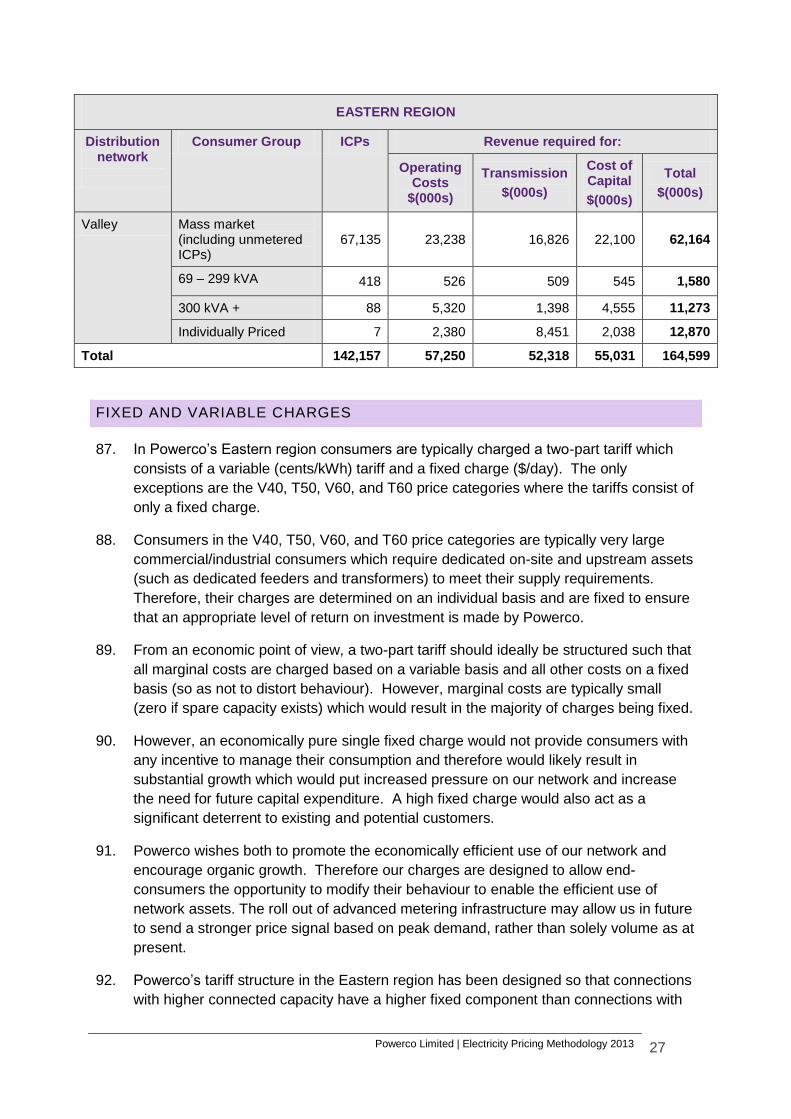
86. The key components of costs and revenues are described in paragraphs 51 - 61. The breakdown of these costs into consumer groups is provided in Table 4.
Table 4: Powerco’s target revenue for the 2013/14 financial year by consumer group
EASTERN REGION
Distribution network
Consumer Group ICPs Revenue required for:
Operating Costs
$(000s)
Transmission
$(000s)
Cost of Capital
$(000s)
Total
$(000s)
Tauranga Mass market (Including Unmetered ICPs)
73,939 20,241 19,000 20,040 59,281
69 – 299 kVA 368 811 907 830 2,548
300 kVA +
203 4,679 5,113 4,868 14,659
Individually Priced
1 54 115 56 224
Powerco Limited | Electricity Pricing Methodology 2013 27
EASTERN REGION
Distribution network
Consumer Group ICPs Revenue required for:
Operating Costs
$(000s)
Transmission
$(000s)
Cost of Capital
$(000s)
Total
$(000s)
Valley Mass market (including unmetered ICPs)
67,135 23,238 16,826 22,100 62,164
69 – 299 kVA 418 526 509 545 1,580
300 kVA + 88 5,320 1,398 4,555 11,273
Individually Priced 7 2,380 8,451 2,038 12,870
Total 142,157 57,250 52,318 55,031 164,599
FIXED AND VARIABLE CHARGES
87. In Powerco’s Eastern region consumers are typically charged a two-part tariff which
consists of a variable (cents/kWh) tariff and a fixed charge ($/day). The only
exceptions are the V40, T50, V60, and T60 price categories where the tariffs consist of
only a fixed charge.
88. Consumers in the V40, T50, V60, and T60 price categories are typically very large
commercial/industrial consumers which require dedicated on-site and upstream assets
(such as dedicated feeders and transformers) to meet their supply requirements.
Therefore, their charges are determined on an individual basis and are fixed to ensure
that an appropriate level of return on investment is made by Powerco.
89. From an economic point of view, a two-part tariff should ideally be structured such that
all marginal costs are charged based on a variable basis and all other costs on a fixed
basis (so as not to distort behaviour). However, marginal costs are typically small
(zero if spare capacity exists) which would result in the majority of charges being fixed.
90. However, an economically pure single fixed charge would not provide consumers with
any incentive to manage their consumption and therefore would likely result in
substantial growth which would put increased pressure on our network and increase
the need for future capital expenditure. A high fixed charge would also act as a
significant deterrent to existing and potential customers.
91. Powerco wishes both to promote the economically efficient use of our network and
encourage organic growth. Therefore our charges are designed to allow end-
consumers the opportunity to modify their behaviour to enable the efficient use of
network assets. The roll out of advanced metering infrastructure may allow us in future
to send a stronger price signal based on peak demand, rather than solely volume as at
present.
92. Powerco’s tariff structure in the Eastern region has been designed so that connections
with higher connected capacity have a higher fixed component than connections with
Powerco Limited | Electricity Pricing Methodology 2013 28
lower connected capacity. This benefits both Powerco and its customers by making
charges more predictable and more closely related to the actual cost of supply.
93. This approach also helps to ensure that no perverse incentives exist for customers to
under or over state their capacity requirements in order to alter their allocated load
group. The larger capacity price categories have the bulk of the charges fixed, while
lower capacity connections have the fixed component set at around 25% of their total
line charge (as shown in Table 5).
94. However, Powerco’s ability to amend the existing fixed and variable rate structure is
somewhat restricted by the limitations imposed on residential fixed charges by the
Electricity (Low Fixed Charge Tariff for Domestic Consumers) Regulations 2004, the
constraint imposed on total revenue by the Commerce Act (Electricity Distribution
Default Price-Quality Path) Determination 2010 and Powerco’s own policy of avoiding
price shocks to end-consumers. Consequently, Powerco determines the proportion of
fixed and variable charges by reference to existing rates while recognising the largely
fixed nature of the underlying costs. Regulations have a large influence on the level of
the fixed and variable components for residential groups.
Powerco Limited | Electricity Pricing Methodology 2013 29
Table 5: Powerco’s target revenue requirement split by fixed and variable charge components to each consumer group for the relevant financial year
EASTERN REGION
Distribution network
Consumer Group
Price Category Revenue split
Fixed Variable
Tauranga Mass market (Including Unmetered ICPs)
Unmetered (T01/T02) 71.6% 28.4%
Low Usage (T05U/T05C) 11.8% 88.2%
Standard (T06U/T06C) 20.5% 79.5%
69 – 299 kVA 3 Phase 60 – 3 Phase 250 Amps (T22)
27.6% 72.4%
200 – 299 kVA (T24) 59.1% 40.9%
200 – 299 kVA (T41) 21.7% 78.3%
300 kVA + (including individually price consumers)
300 – 1,499 kVA (T43) 17.2% 82.8%
300 – 1,499 kVA (T50) 97.4% 2.6%
1,500 kVA + (T60) 96.6% 3.4%
Valley Mass market (including unmetered ICPs)
Unmetered (V01/V02) 92.2% 7.8%
Low Usage (V05U/V05C) 10.6% 89.4%
Standard (V06U/V06C) 25.6% 74.4%
69 – 299 kVA 3 Phase 60 – 3 Phase 250 Amps (V24)
57.7% 42.3%
200 – 29 kVA (V28) 78.5% 21.5%
300 kVA + (including individually priced consumers)
300 – 1,499 kVA (V40) 95.9% 4.1%
1,500 kVA + (V60)
98.0% 2.0%
TREATMENT OF RENTAL REBATES
95. Transpower’s rental rebates associated with operation of its HVAC network are
excluded from the bundled tariffs and are passed through to retailers directly. Further
information in regards to this process can be found in Powerco’s electricity pricing
schedule (which is available at: http://www.powerco.co.nz/Publications-and-
Disclosures/Pricing-Schedules/Electricity/Powerco’s website).
Powerco Limited | Electricity Pricing Methodology 2013 30
SHARING VALUE OF DEFERRAL OF INVESTMENT
96. Powerco recognises that the ability to control and shift load during peak times via load
signalling equipment has the potential to defer investment.
97. Because of this potential to defer investment Powerco continues to offer a number of
tariff options such as AICO and CTRL in the Valley and Tauranga distribution networks
that provide discounts to consumers based on the availability and degree of load
control at the consumer’s ICP.
98. Powerco also provides a number of discounted “NITE” tariff options within these
networks which are designed to incentivise consumers to shift load from peak to off-
peak periods in order to flatten peaks and consequently reduce the need for new
investment. A detailed description of these tariffs is available on Powerco’s website.
99. Powerco continues to encourage embedded and distributed generation by providing
payments to generators equivalent to Powerco’s avoided costs of transmission
(subject to Powerco’s Distributed Generation (DG) Policy).
Powerco Limited | Electricity Pricing Methodology 2013 31
10. WESTERN REGION PRICING METHODOLOGY
CONSUMER GROUPS
RATIONALE FOR CONSUMER GROUPS
100. Powerco uses three price categories of consumer group for cost allocation and charging purposes in the Western Region. The three categories are:
E1, which applies to all connections with a connected capacity of less than 100 kVA connections (which includes unmetered connections);
E100, which applies to all connections with a connected capacity of between 100 and 300 kVA;
E300, which applies to all connections with a connected capacity of greater than 300kVA (which includes connections with individually assessed pricing).
101. These price categories are based around groups of consumers with similar characteristics relating to their installed capacity and associated demand as these groups place different demands on different components of our network such as sub-transmission, high voltage (11kV) and low voltage (400V) network assets as well as onsite assets such as transformers and associated switchgear. Annex A provides information on the characteristics of the network and consumers in the Western Region.
102. The characteristics of each consumer group are provided in Table 6. Ideally, Powerco would have more information on anytime maximum demand and on peak demand but currently this information is only readily available for connections with half hourly metering. Where this information is not available assumptions have been made about the load profiles of the relevant consumers.
103. The E1 price category is for all connections with a connected capacity of less than 100 kVA which represents all residential and the majority of commercial consumers. The E1 price category has been limited to less than 100 kVA to provide a relatively simple price structure for the vast majority of consumers while excluding all connections which require dedicated on-site and/or up-stream assets.
104. The E100 price category is for all connections with a connected capacity of between 100 and 300 kVA, which equates to medium-large commercial consumers. This price category has been defined because connections with this level of capacity place different levels of demand on different components of our network assets such as sub-transmission, high voltage (11kV) and low voltage (400V) assets and typically require dedicated on-site assets such as transformers and associated switchgear.
105. The E300 price category is for all connections with a connected capacity of greater than 300 kVA which equates to large commercial / industrial consumers. This price category has been defined because connections with this level of capacity place different levels of demand on different components of our network assets such as sub-transmission, high voltage (11kV) and low voltage (400V) assets and typically require a higher level of dedicated on-site and up-stream assets (such as transformers, switchgear and feeders) than the E100 price category.
106. The specification of separate price categories for the E100 and E300 groups makes the underlying costs of supplying these consumers more transparent.
Powerco Limited | Electricity Pricing Methodology 2013 32
107. In addition to these price categories Powerco also has non-standard charges which apply in cases where our standard charges are not appropriate. This is typically only for connections with capacity greater than 1,500 kVA where there is significant network investment required for the connection and/or unique commercial arrangements that require special consideration. This is discussed in further detail in paragraphs 140 – 143.
RATIONALE FOR PRICING ZONES
108. Within each price category the individual charges are classified by a pricing zone which is a grouping of GXPs with similar characteristics such as rural/urban connection density and geographical location.
109. Pricing zones allow our tariff structure to have the ability to reflect the difference in the costs of supplying consumers within specific regions across the Western network. This allows us the ability to reflect a fairer allocation of the operating costs, transmission charges and capital costs within each geographical location rather than across the entire network.
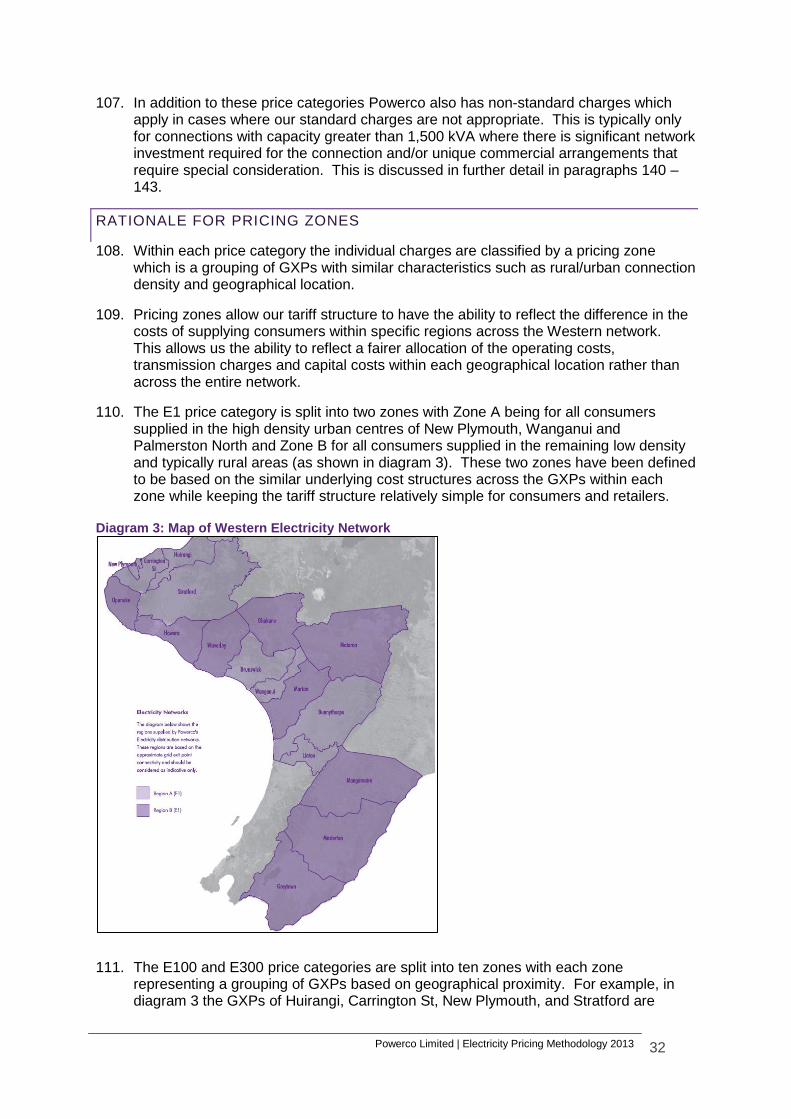
110. The E1 price category is split into two zones with Zone A being for all consumers supplied in the high density urban centres of New Plymouth, Wanganui and Palmerston North and Zone B for all consumers supplied in the remaining low density and typically rural areas (as shown in diagram 3). These two zones have been defined to be based on the similar underlying cost structures across the GXPs within each zone while keeping the tariff structure relatively simple for consumers and retailers.
Diagram 3: Map of Western Electricity Network
111. The E100 and E300 price categories are split into ten zones with each zone representing a grouping of GXPs based on geographical proximity. For example, in diagram 3 the GXPs of Huirangi, Carrington St, New Plymouth, and Stratford are
Powerco Limited | Electricity Pricing Methodology 2013 33
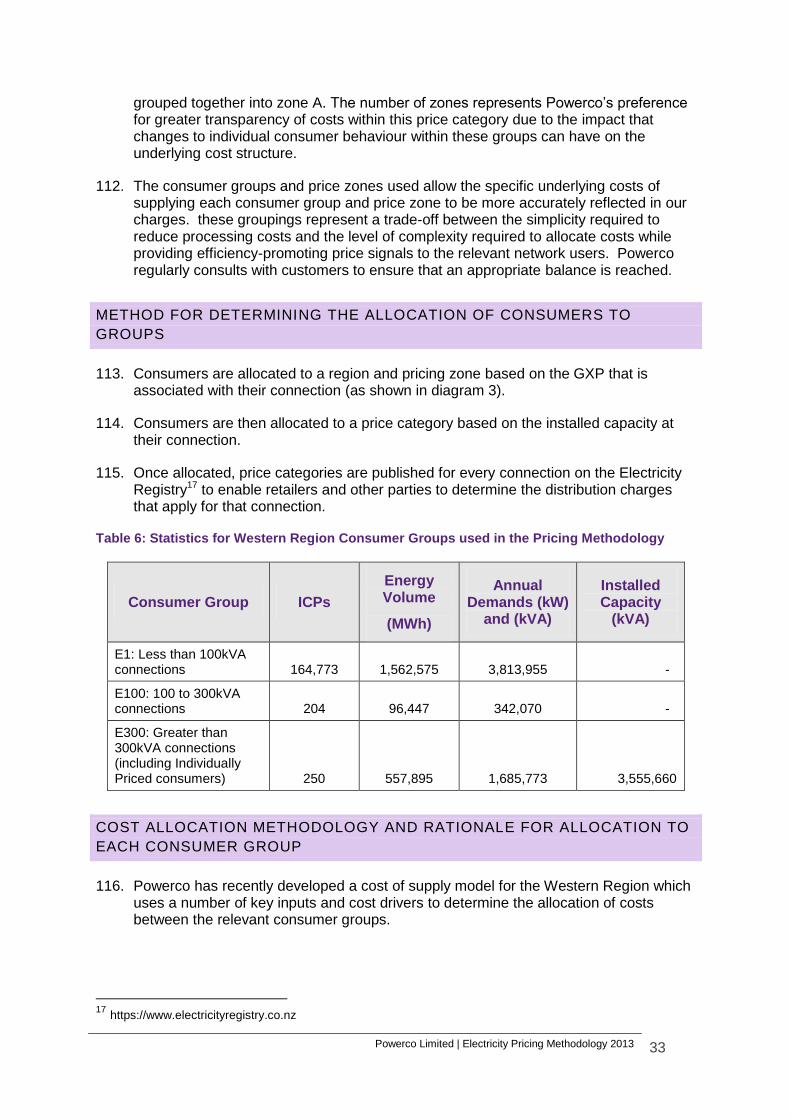
grouped together into zone A. The number of zones represents Powerco’s preference for greater transparency of costs within this price category due to the impact that changes to individual consumer behaviour within these groups can have on the underlying cost structure.
112. The consumer groups and price zones used allow the specific underlying costs of supplying each consumer group and price zone to be more accurately reflected in our charges. these groupings represent a trade-off between the simplicity required to reduce processing costs and the level of complexity required to allocate costs while providing efficiency-promoting price signals to the relevant network users. Powerco regularly consults with customers to ensure that an appropriate balance is reached.
METHOD FOR DETERMINING THE ALLOCATION OF CONSUMERS TO
GROUPS
113. Consumers are allocated to a region and pricing zone based on the GXP that is associated with their connection (as shown in diagram 3).
114. Consumers are then allocated to a price category based on the installed capacity at their connection.
115. Once allocated, price categories are published for every connection on the Electricity Registry17 to enable retailers and other parties to determine the distribution charges that apply for that connection.
Table 6: Statistics for Western Region Consumer Groups used in the Pricing Methodology
Consumer Group ICPs
Energy Volume
(MWh)
Annual Demands (kW)
and (kVA)
Installed Capacity
(kVA)
E1: Less than 100kVA connections
164,773
1,562,575
3,813,955 -
E100: 100 to 300kVA connections
204
96,447
342,070 -
E300: Greater than 300kVA connections (including Individually Priced consumers)
250
557,895
1,685,773 3,555,660
COST ALLOCATION METHODOLOGY AND RATIONALE FOR ALLOCATION TO
EACH CONSUMER GROUP
116. Powerco has recently developed a cost of supply model for the Western Region which uses a number of key inputs and cost drivers to determine the allocation of costs between the relevant consumer groups.
17 https://www.electricityregistry.co.nz
Powerco Limited | Electricity Pricing Methodology 2013 34
117. The key allocators contained within this model are:
average number of connected ICPs;
coincident maximum demand (CMD);
installed kVA;
optimised replacement cost (ORC);
contribution to system demand and ICP numbers, which is used in the determination of GXP cost allocation; and
contribution to coincident maximum demand and ICP numbers, which is used in the allocation of costs between load groups.
118. For the purposes of cost allocation the cost of supply model aggregates costs into one of three groups aligned with the three price categories mentioned earlier. The three groups consist of:
E1, which are all residential and most commercial consumers including unmetered connections);
E100, which includes all connections with an installed capacity of greater than 100 kVA up to 300 kVA;
E300, which includes all connections with an installed capacity of greater than 300 kVA, including non-standard connections.
119. Where possible, Powerco’s operating costs in relation to the electricity business are allocated directly to each relevant region. Where this is not possible the allocation between regions is based on each region’s optimised replacement cost (ORC).
120. Transmission costs are allocated directly to each relevant region due to the fact that all costs can be directly attributed to specific GXPs.
121. Capital costs are allocated to regions based on the optimised depreciated replacement cost of the assets within each group.
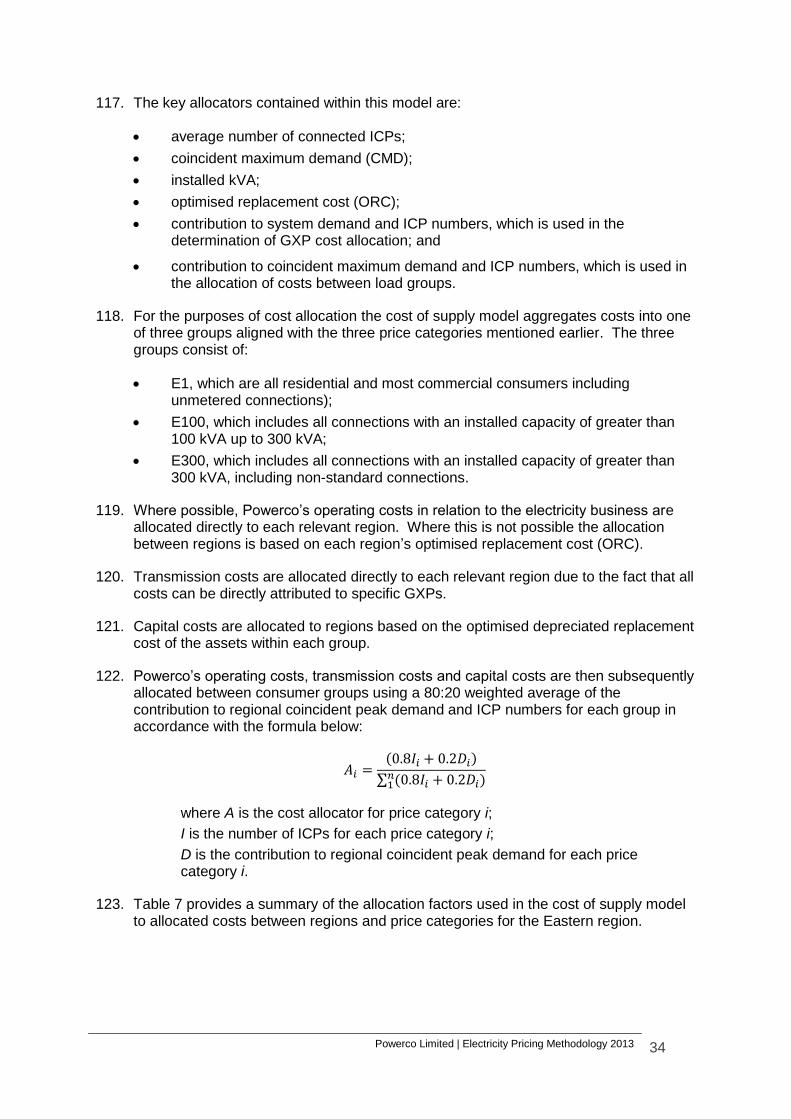
122. Powerco’s operating costs, transmission costs and capital costs are then subsequently allocated between consumer groups using a 80:20 weighted average of the contribution to regional coincident peak demand and ICP numbers for each group in accordance with the formula below:
( )
∑ ( )
where A is the cost allocator for price category i;
I is the number of ICPs for each price category i;
D is the contribution to regional coincident peak demand for each price category i.
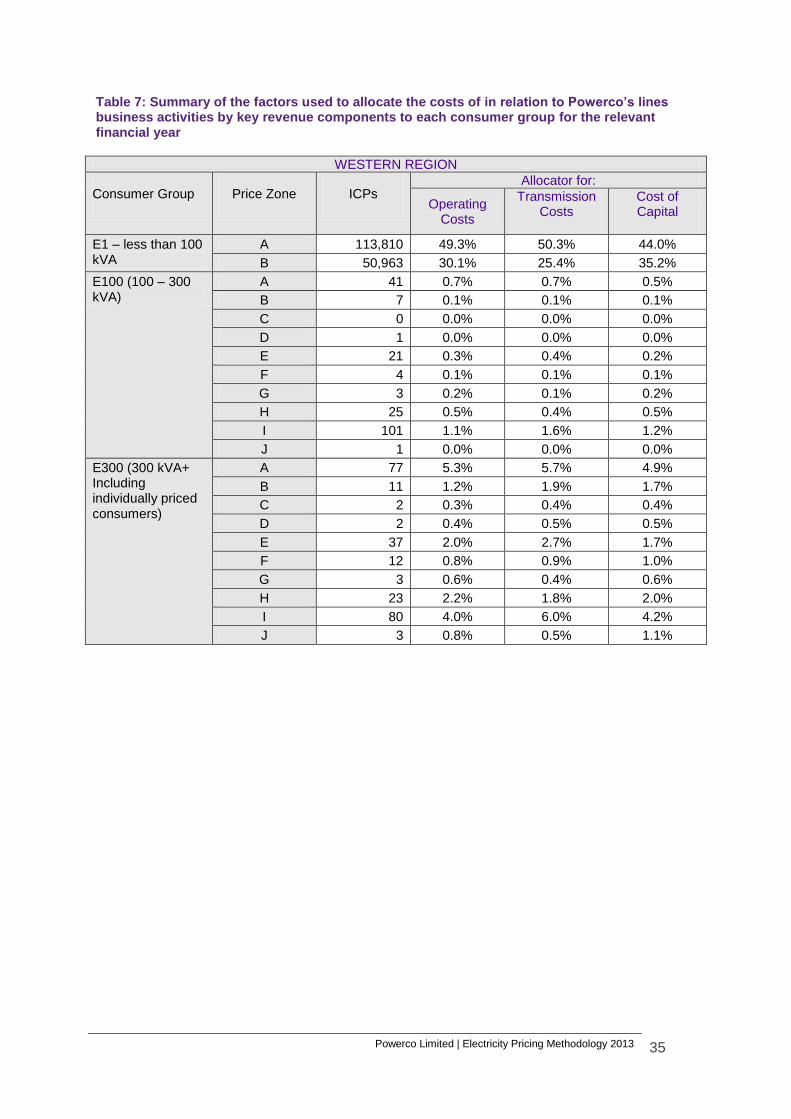
123. Table 7 provides a summary of the allocation factors used in the cost of supply model to allocated costs between regions and price categories for the Eastern region.
Powerco Limited | Electricity Pricing Methodology 2013 35
Table 7: Summary of the factors used to allocate the costs of in relation to Powerco’s lines business activities by key revenue components to each consumer group for the relevant financial year
WESTERN REGION
Consumer Group Price Zone ICPs Allocator for:
Operating Costs
Transmission Costs
Cost of Capital
E1 – less than 100 kVA
A 113,810 49.3% 50.3% 44.0%
B 50,963 30.1% 25.4% 35.2%
E100 (100 – 300 kVA)
A 41 0.7% 0.7% 0.5%
B 7 0.1% 0.1% 0.1%
C 0 0.0% 0.0% 0.0%
D 1 0.0% 0.0% 0.0%
E 21 0.3% 0.4% 0.2%
F 4 0.1% 0.1% 0.1%
G 3 0.2% 0.1% 0.2%
H 25 0.5% 0.4% 0.5%
I 101 1.1% 1.6% 1.2%
J 1 0.0% 0.0% 0.0%
E300 (300 kVA+ Including individually priced consumers)
A 77 5.3% 5.7% 4.9%
B 11 1.2% 1.9% 1.7%
C 2 0.3% 0.4% 0.4%
D 2 0.4% 0.5% 0.5%
E 37 2.0% 2.7% 1.7%
F 12 0.8% 0.9% 1.0%
G 3 0.6% 0.4% 0.6%
H 23 2.2% 1.8% 2.0%
I 80 4.0% 6.0% 4.2%
J 3 0.8% 0.5% 1.1%
Powerco Limited | Electricity Pricing Methodology 2013 36
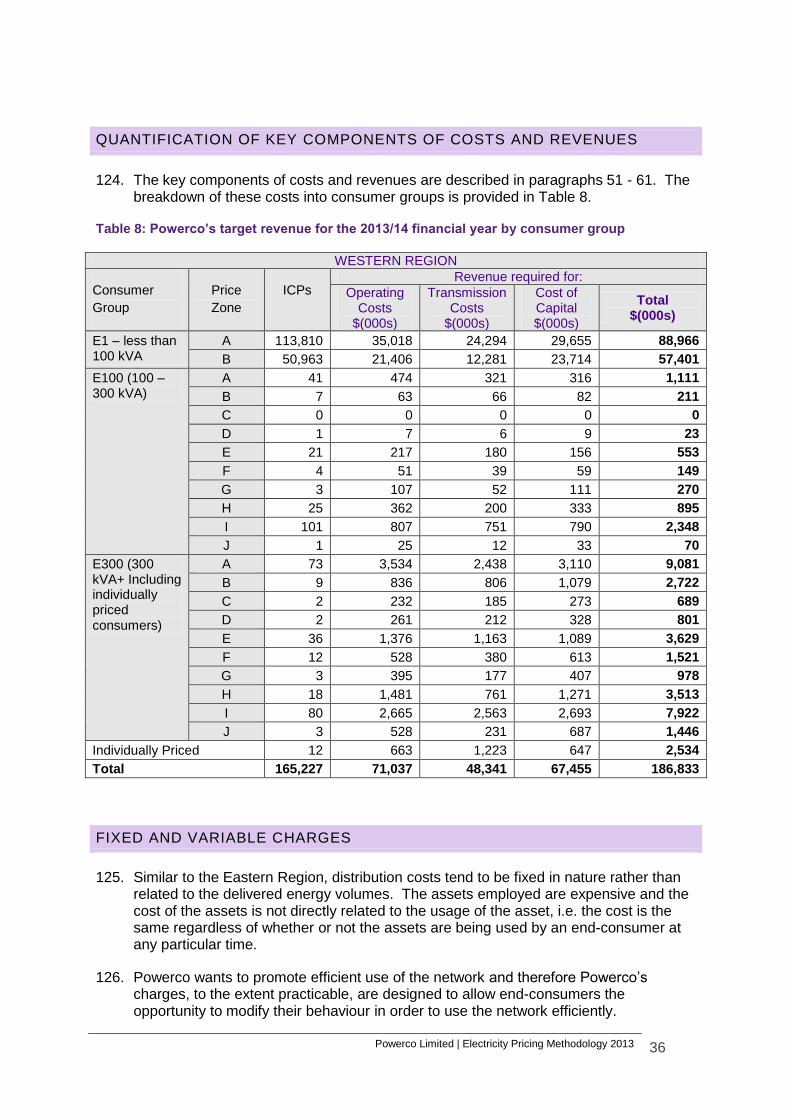
QUANTIFICATION OF KEY COMPONENTS OF COSTS AND REVENUES
124. The key components of costs and revenues are described in paragraphs 51 - 61. The breakdown of these costs into consumer groups is provided in Table 8.
Table 8: Powerco’s target revenue for the 2013/14 financial year by consumer group
WESTERN REGION
Consumer
Group
Price
Zone
ICPs Revenue required for:
Operating Costs
$(000s)
Transmission Costs
$(000s)
Cost of Capital $(000s)
Total $(000s)
E1 – less than 100 kVA
A 113,810 35,018 24,294 29,655 88,966
B 50,963 21,406 12,281 23,714 57,401
E100 (100 – 300 kVA)
A 41 474 321 316 1,111
B 7 63 66 82 211
C 0 0 0 0 0
D 1 7 6 9 23
E 21 217 180 156 553
F 4 51 39 59 149
G 3 107 52 111 270
H 25 362 200 333 895
I 101 807 751 790 2,348
J 1 25 12 33 70
E300 (300 kVA+ Including individually priced consumers)
A 73 3,534 2,438 3,110 9,081
B 9 836 806 1,079 2,722
C 2 232 185 273 689
D 2 261 212 328 801
E 36 1,376 1,163 1,089 3,629
F 12 528 380 613 1,521
G 3 395 177 407 978
H 18 1,481 761 1,271 3,513
I 80 2,665 2,563 2,693 7,922
J 3 528 231 687 1,446
Individually Priced 12 663 1,223 647 2,534
Total 165,227 71,037 48,341 67,455 186,833
FIXED AND VARIABLE CHARGES
125. Similar to the Eastern Region, distribution costs tend to be fixed in nature rather than related to the delivered energy volumes. The assets employed are expensive and the cost of the assets is not directly related to the usage of the asset, i.e. the cost is the same regardless of whether or not the assets are being used by an end-consumer at any particular time.
126. Powerco wants to promote efficient use of the network and therefore Powerco’s charges, to the extent practicable, are designed to allow end-consumers the opportunity to modify their behaviour in order to use the network efficiently.
Powerco Limited | Electricity Pricing Methodology 2013 37
127. In Powerco’s Western region consumers are typically charged a tariff which consists of a variable tariff (cents/kWh) and/or a demand tariff ($/kVA or $/kW) and a fixed charge (either $/day or $/kVA per day).
128. From an economic point of view, these tariffs should ideally be structured such that all marginal costs are charged based on a variable basis and all other costs on a fixed basis (so as not to distort behaviour). As marginal costs are typically small (zero if spare capacity exists) this would result in the majority of charges being fixed.
129. However, an economically pure single fixed charge would not provide consumers with any incentive to manage their consumption and therefore would likely result in substantial consumption growth which would put increased pressure on our network and increase the need for future capital expenditure.
130. In the E1 price category Powerco has three types of charges which apply to all consumers in this price category. A variable volume charge (c/kwh) with different rates for consumption during the Day and Night periods, a variable demand charge for the single anytime maximum demand for the month ($/kW) and a fixed charge ($/day).
131. The E100 and E300 price categories only have a variable demand charge ($/kVA/month) which is based on the average anytime maximum demand over the prior 12 months and a fixed charge (either $/day for the E100 group or $/kVA based on installed capacity per day).
132. The demand charges across all three price categories were initially set to reflect the costs that Powerco incurs as a result of consumers using its network during peak times, with the other variable and fixed charges set at a level which provides the balance of revenue across the price categories.
133. Consumers in the E100 and E300 price categories are typically very large commercial/industrial consumers which require dedicated on-site and upstream assets (such as dedicated feeders and transformers) to meet their supply requirements. Therefore, the fixed charge component of these price categories is typically higher than the other price categories to ensure that an appropriate return on investment is earned by Powerco.
134. Powerco’s ability to amend the existing fixed and variable rate structure is somewhat
restricted by the limitations imposed on residential fixed charges by the Electricity (Low
Fixed Charge Tariff for Domestic Consumers) Regulations 2004, the constraint
imposed on total revenue by the Commerce Act (Electricity Distribution Default Price-
Quality Path) Determination 2010 and Powerco’s own policy of avoiding price shocks
to end-consumers. Consequently, Powerco determines the proportion of fixed and
variable charges by reference to existing rates while recognising the largely fixed
nature of the underlying costs. Regulations have a large influence on the level of the
fixed and variable components for residential groups.
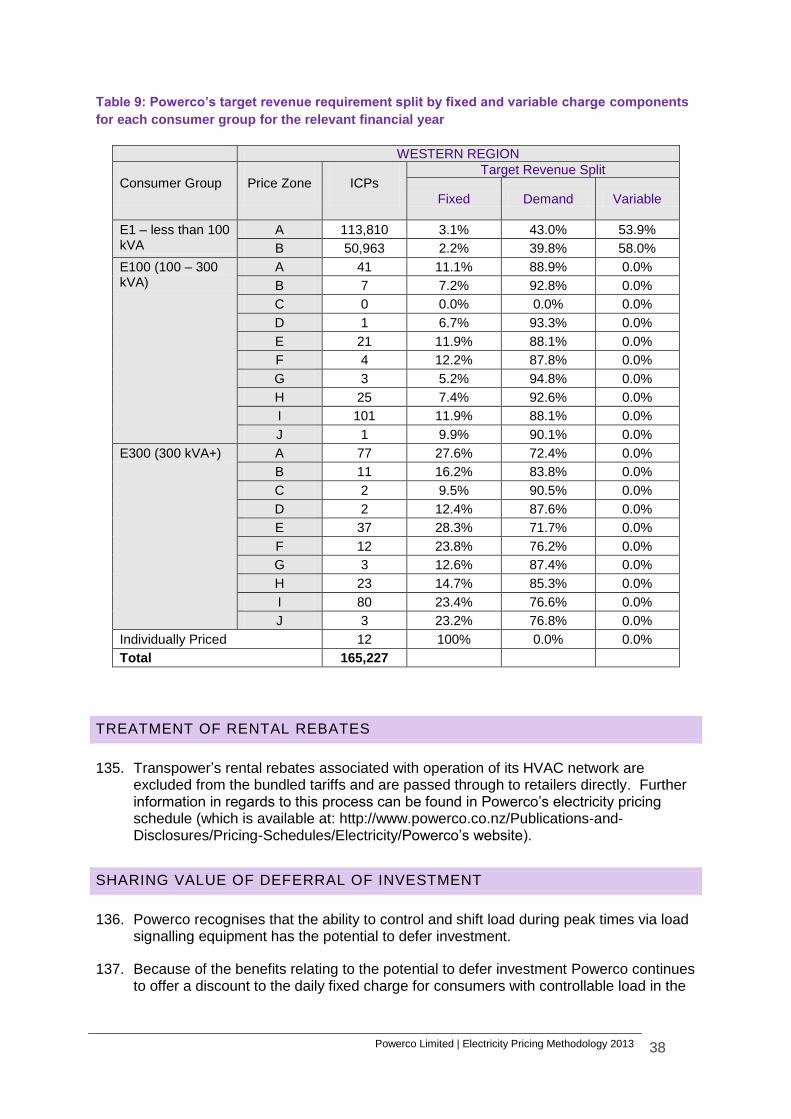
Powerco Limited | Electricity Pricing Methodology 2013 38
Table 9: Powerco’s target revenue requirement split by fixed and variable charge components
for each consumer group for the relevant financial year
WESTERN REGION
Consumer Group Price Zone ICPs Target Revenue Split
Fixed Demand Variable
E1 – less than 100 kVA
A 113,810 3.1% 43.0% 53.9%
B 50,963 2.2% 39.8% 58.0%
E100 (100 – 300 kVA)
A 41 11.1% 88.9% 0.0%
B 7 7.2% 92.8% 0.0%
C 0 0.0% 0.0% 0.0%
D 1 6.7% 93.3% 0.0%
E 21 11.9% 88.1% 0.0%
F 4 12.2% 87.8% 0.0%
G 3 5.2% 94.8% 0.0%
H 25 7.4% 92.6% 0.0%
I 101 11.9% 88.1% 0.0%
J 1 9.9% 90.1% 0.0%
E300 (300 kVA+) A 77 27.6% 72.4% 0.0%
B 11 16.2% 83.8% 0.0%
C 2 9.5% 90.5% 0.0%
D 2 12.4% 87.6% 0.0%
E 37 28.3% 71.7% 0.0%
F 12 23.8% 76.2% 0.0%
G 3 12.6% 87.4% 0.0%
H 23 14.7% 85.3% 0.0%
I 80 23.4% 76.6% 0.0%
J 3 23.2% 76.8% 0.0%
Individually Priced 12 100% 0.0% 0.0%
Total 165,227
TREATMENT OF RENTAL REBATES
135. Transpower’s rental rebates associated with operation of its HVAC network are excluded from the bundled tariffs and are passed through to retailers directly. Further information in regards to this process can be found in Powerco’s electricity pricing schedule (which is available at: http://www.powerco.co.nz/Publications-and-Disclosures/Pricing-Schedules/Electricity/Powerco’s website).
SHARING VALUE OF DEFERRAL OF INVESTMENT
136. Powerco recognises that the ability to control and shift load during peak times via load signalling equipment has the potential to defer investment.
137. Because of the benefits relating to the potential to defer investment Powerco continues to offer a discount to the daily fixed charge for consumers with controllable load in the
Powerco Limited | Electricity Pricing Methodology 2013 39
E1 consumer group of 15 cents per day (compared to the maximum low volume rate of 15 cents per day for consumers without controllable load).
138. Powerco’s volume charges to the mass market group (E1) in the Western region are also structured to encourage consumers to shift load to off-peak periods by offering a significant discount of 4.5-6.0 cents/kWh for consumption during the off-peak night period (11p.m. – 7a.m.). A detailed description of the Western Region price structures is available on Powerco’s website.
139. Powerco also continues to encourage embedded and distributed generation by providing payments to generators equivalent to Powerco’s avoided costs of transmission (subject to Powerco’s Distributed Generation (DG) Policy).
11. REVENUE SUMMARY
140. The tables below summarise the projected revenue from Powerco charges for the Eastern and Western regions for each consumer group and provide a comparison with the previous year.
141. The changes in revenue from 2012/13 to 2013/14 year are due to:
a) changes to the underlying charges that have resulted from the application of the starting price adjustment (as detailed in paragraphs 10 – 12), which include changes due to increases to transmission charges and other pass through costs such as council rates and Electricity Authority and Commerce Commission levies;
b) adjustments to Powerco’s estimates of chargeable quantities, including the number of ICPs and associated volume and demand growth;
c) the migration of consumers between consumer groups and other changes as detailed in paragraphs 18 - 27;
d) the re-balancing of charges to align Powerco’s revenue requirement more closely with the underlying costs of supply (in accordance with Powerco’s pricing strategy detailed in paragraph 48).
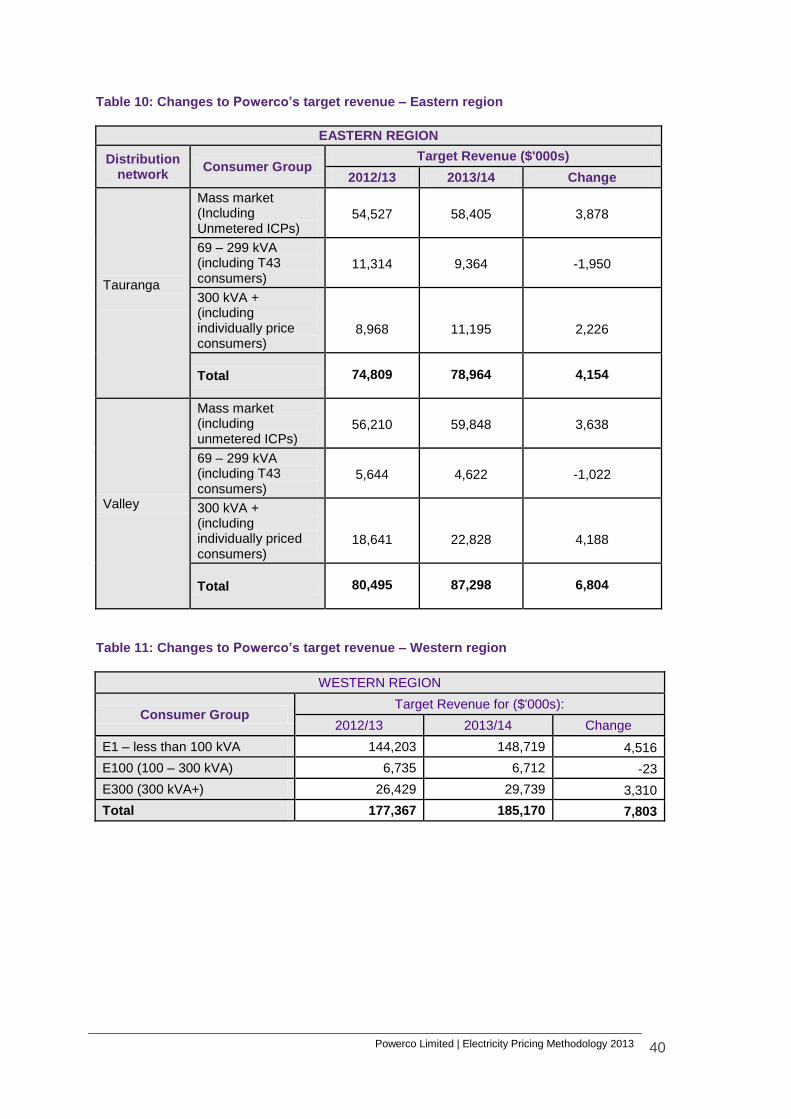
Powerco Limited | Electricity Pricing Methodology 2013 40
Table 10: Changes to Powerco’s target revenue – Eastern region
EASTERN REGION
Distribution network
Consumer Group Target Revenue ($'000s)
2012/13 2013/14 Change
Tauranga
Mass market (Including Unmetered ICPs)
54,527 58,405 3,878
69 – 299 kVA (including T43 consumers)
11,314 9,364 -1,950
300 kVA + (including individually price consumers)
8,968 11,195 2,226
Total 74,809 78,964 4,154
Valley
Mass market (including unmetered ICPs)
56,210 59,848 3,638
69 – 299 kVA (including T43 consumers)
5,644 4,622 -1,022
300 kVA + (including individually priced consumers)
18,641 22,828 4,188
Total 80,495 87,298 6,804
Table 11: Changes to Powerco’s target revenue – Western region
WESTERN REGION
Consumer Group Target Revenue for ($'000s):
2012/13 2013/14 Change
E1 – less than 100 kVA 144,203 148,719 4,516
E100 (100 – 300 kVA) 6,735 6,712 -23
E300 (300 kVA+) 26,429 29,739 3,310
Total 177,367 185,170 7,803
Powerco Limited | Electricity Pricing Methodology 2013 41
12. APPROACH TO SETTING PRICES FOR NON-STANDARD CONTRACTS
EXTENT OF NON-STANDARD CONTRACT USE
NUMBER OF ICPS REPRESENTED BY NON-STANDARD CONTRACTS AND
THE VALUE OF TARGET REVENUE EXPECTED TO BE COLLECTED FROM
CONSUMERS SUBJECT TO NON-STANDARD CONTRACTS
142. The number, size and characteristics of non-standard customers on Powerco’s
network are described in Tables 4 and 8 and in Annex A.
HOW POWERCO DETERMINES WHETHER TO USE A NON-STANDARD
CONTRACT, INCLUDING ANY CRITERIA USED
143. Powerco’s practice is to offer non-standard pricing and individual account
management to industrial and large commercial customers to address the risk of
uneconomic bypass and to enable arrangements that are tailored to customers’ needs.
Powerco’s approach to non-standard pricing includes taking into account customers’
individual capacity and demand to ensure, to the extent practicable, that the price is
cost reflective.
144. Through these processes, Powerco discourages uneconomic bypass of its network
and promotes direct negotiation to tailor its services to the specific needs of the
business. For example, a number of years ago Powerco determined that a large
industrial consumer group in the Wairarapa region presented a potential by-pass threat
due to its size and location. Powerco subsequently reached agreed commercial terms
with this consumer group to mitigate the risk of uneconomic by-pass. Further details
on non-standard pricing is available on Powerco’s website at
http://www.powerco.co.nz/uploaded_files/Publications-and-Disclosures/Pricing/Pricing-
Disclosures/Electricity-Price-Schedule-2011-2012.pdf
145. This approach is consistent with pricing principle (c)(i).
POWERCO’S OBLIGATIONS AND RESPONSIBILITIES TO CONSUMERS
SUBJECT TO NON-STANDARD CONTRACTS IN THE EVENT THAT THE
SUPPLY OF ELECTRICITY LINES SERVICES IS INTERRUPTED
146. Non-standard contracted consumers are generally significant commercial or industrial
loads, and thus arrangements between the parties include provision for response to
planned and unplanned interruptions. For example, such customers are given direct
contact with Powerco’s Network Operations Centre which enables them to liaise
directly should a network event occur and help co-ordinate restoration. Some non-
standard agreements include operational protocols detailing the management of load
in the event of maximum demand levels being reached, or management in the event of
abnormal network configurations.
Powerco Limited | Electricity Pricing Methodology 2013 42
147. These arrangements have no direct effect on the determination of prices for these
consumers.
POWERCO’S APPROACH TO DEVELOPING PRICES FOR ELECTRICITY
DISTRIBUTION SERVICES PROVIDED TO CONSUMERS THAT OWN
DISTRIBUTED GENERATION
148. Powerco currently does not impose any standard on-going charges in relation to
distributed generation, but we do apply connection charges for the connection of
distributed generation. These charges are negotiated directly with the customer.
149. The connection charges are based on the incremental costs of providing connection
services to the distributed generation, assuming recovery of the reasonable costs
incurred by Powerco to connect the generator and to comply with Powerco’s
connection and operation standards. The incremental cost is net of the transmission
and distribution costs that an efficient service provider would be able to avoid as a
result of the connection of the distributed generation.
150. Where the incremental costs are negative the generator is deemed to be providing
“network support services” (also referred to as “avoided cost of transmission” (ACOT))
and may invoice Powerco for this service providing the generator can provide evidence
to Powerco that the generator is, in fact, providing “network support services” to
Powerco’s network as described above, and complies with all relevant legal obligations
(including tax obligations).
151. ACOT is determined in the following way:
1. The annual interconnection charge18 that Powerco pays to Transpower is
determined based on Powerco’s offtake at the GXP coincident with the regional
peak demand periods occurring during the capacity measurement period for the
applicable Pricing Year.
2. ACOT will be calculated using the Transpower Interconnection Rate applicable to
the pricing year.
3. The annual ACOT amount will be the difference between:
a) the average of the regional coincident peak demand at the GXP (as notified
by Transpower); and
b) the average of Powerco’s net offtake (in kW), as measured at the GXP, plus
the net electricity (in kW) injected into Powerco’s network by the generation
station at the generator’s grid connection point for each regional peak
demand period.
152. Any payment due to the customer in respect of the ACOT payment may be netted off
by Powerco against any network charges due and payable by the generator to
Powerco.
18
All terms are as defined in the transmission pricing methodology set out in Schedule 12.4 to Part 12 of the Electricity Industry Participation Code 2010.
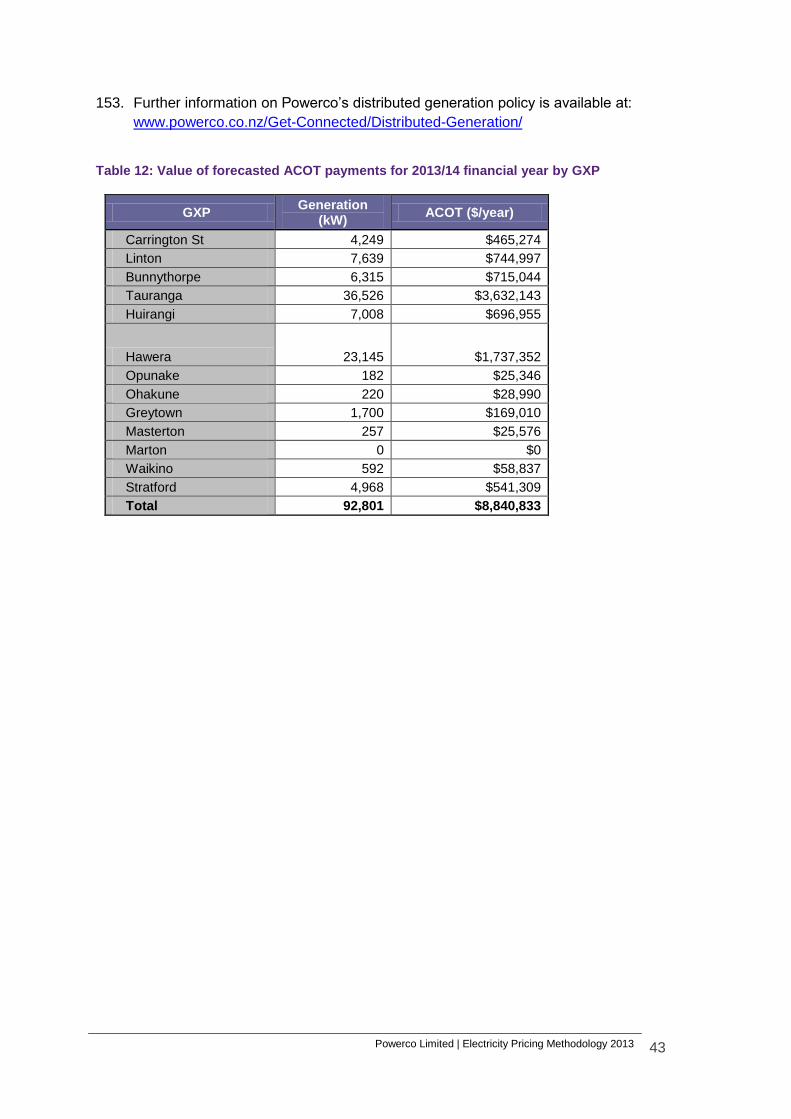
Powerco Limited | Electricity Pricing Methodology 2013 43
153. Further information on Powerco’s distributed generation policy is available at:
www.powerco.co.nz/Get-Connected/Distributed-Generation/
Table 12: Value of forecasted ACOT payments for 2013/14 financial year by GXP
GXP Generation
(kW) ACOT ($/year)
Carrington St 4,249 $465,274
Linton 7,639 $744,997
Bunnythorpe 6,315 $715,044
Tauranga 36,526 $3,632,143
Huirangi 7,008 $696,955
Hawera 23,145 $1,737,352
Opunake 182 $25,346
Ohakune 220 $28,990
Greytown 1,700 $169,010
Masterton 257 $25,576
Marton 0 $0
Waikino 592 $58,837
Stratford 4,968 $541,309
Total 92,801 $8,840,833
Powerco Limited | Electricity Pricing Methodology 2013 44
13. COMPLIANCE WITH ELECTRICITY AUTHORITY’S PRICING PRINCIPLES
154. This section demonstrates how Powerco’s pricing methodology complies with the
Electricity Authority’s pricing principles.
155. The pricing principles are based on sound economic theory, but it can be difficult to
demonstrate compliance using quantitative information. Powerco considers that it is
currently compliant with the pricing principles. However, we will continue to gather and
analyse more information on consumers’ behaviour and assess that information
against the principles.
156. Particular matters we will continue to investigate and monitor over the medium-term
are:
1. the impact a stronger peak demand pricing signal would have on different types
of consumers’ electricity usage;
2. the benefits and consequences of greater alignment of the pricing approaches
used in the Eastern and Western regions; and
3. the willingness of consumers to accept price adjustments.
a) i) Prices are to signal the economic costs of service provision, by being
subsidy free (equal to or greater than incremental costs, and less than or
equal to standalone costs), except where subsidies arise from compliance
with legislation and/or other regulation.
INCREMENTAL COST
157. The term “incremental cost” (IC) is defined as the cost of the next additional unit of
production and “long run incremental cost” (LRIC) is defined as the cost of providing
an additional unit, including the capital cost of increasing the capacity of the network.
The LRIC may be the present value of the cost of a future addition to the network.
158. Incremental costs are difficult to evaluate in a meaningful way for electricity distribution
businesses (EDBs). Much of the time the IC is zero, meaning that the next unit of
electricity can be distributed to a customer within the existing capacity of the network
system. Once in a while the IC will be a very large number, meaning that the next unit
of electricity would require additional installed capacity to be distributed.
159. In addition, the “unit” being supplied could be an extra unit of capacity to an existing
customer, or providing a connection for a new customer. To calculate IC, Powerco has
analysed the forecasted level of growth on the network over the next ten years against
the forecasted customer connection and system growth capex. This results in a proxy
for incremental cost of 0.0098 c/kWh.
160. Powerco is required by legislation to supply some consumers at prices below the
marginal cost of connection. This is mainly in remote locations, with characteristically
few customers, where electricity supply was built predominantly through public
subsidisation and the cost of renewing the assets is greater than the sum of line
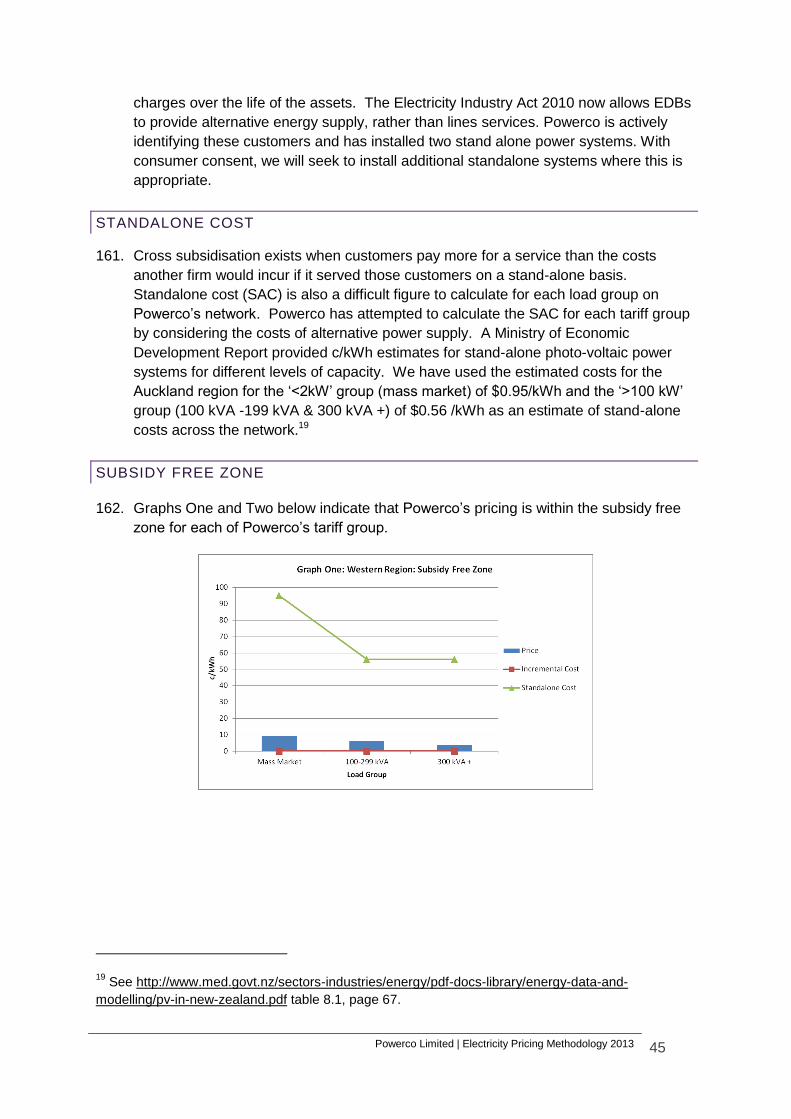
Powerco Limited | Electricity Pricing Methodology 2013 45
charges over the life of the assets. The Electricity Industry Act 2010 now allows EDBs
to provide alternative energy supply, rather than lines services. Powerco is actively
identifying these customers and has installed two stand alone power systems. With
consumer consent, we will seek to install additional standalone systems where this is
appropriate.
STANDALONE COST
161. Cross subsidisation exists when customers pay more for a service than the costs
another firm would incur if it served those customers on a stand-alone basis.
Standalone cost (SAC) is also a difficult figure to calculate for each load group on
Powerco’s network. Powerco has attempted to calculate the SAC for each tariff group
by considering the costs of alternative power supply. A Ministry of Economic
Development Report provided c/kWh estimates for stand-alone photo-voltaic power
systems for different levels of capacity. We have used the estimated costs for the
Auckland region for the ‘<2kW’ group (mass market) of $0.95/kWh and the ‘>100 kW’
group (100 kVA -199 kVA & 300 kVA +) of $0.56 /kWh as an estimate of stand-alone
costs across the network.19
SUBSIDY FREE ZONE
162. Graphs One and Two below indicate that Powerco’s pricing is within the subsidy free
zone for each of Powerco’s tariff group.
19 See http://www.med.govt.nz/sectors-industries/energy/pdf-docs-library/energy-data-and-
modelling/pv-in-new-zealand.pdf table 8.1, page 67.
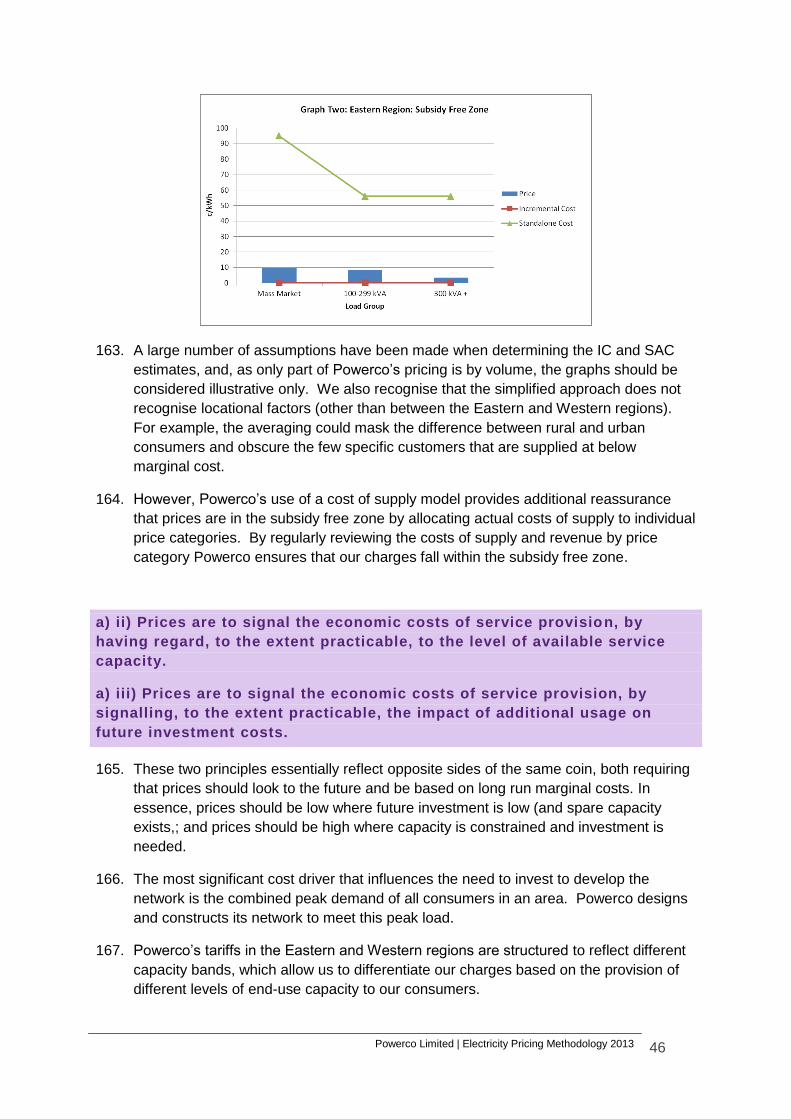
Powerco Limited | Electricity Pricing Methodology 2013 46
163. A large number of assumptions have been made when determining the IC and SAC
estimates, and, as only part of Powerco’s pricing is by volume, the graphs should be
considered illustrative only. We also recognise that the simplified approach does not
recognise locational factors (other than between the Eastern and Western regions).
For example, the averaging could mask the difference between rural and urban
consumers and obscure the few specific customers that are supplied at below
marginal cost.
164. However, Powerco’s use of a cost of supply model provides additional reassurance
that prices are in the subsidy free zone by allocating actual costs of supply to individual
price categories. By regularly reviewing the costs of supply and revenue by price
category Powerco ensures that our charges fall within the subsidy free zone.
a) ii) Prices are to signal the economic costs of service provision, by
having regard, to the extent practicable, to the level of available service
capacity.
a) iii) Prices are to signal the economic costs of service provision, by
signalling, to the extent practicable, the impact of additional usage on
future investment costs.
165. These two principles essentially reflect opposite sides of the same coin, both requiring
that prices should look to the future and be based on long run marginal costs. In
essence, prices should be low where future investment is low (and spare capacity
exists,; and prices should be high where capacity is constrained and investment is
needed.
166. The most significant cost driver that influences the need to invest to develop the
network is the combined peak demand of all consumers in an area. Powerco designs
and constructs its network to meet this peak load.
167. Powerco’s tariffs in the Eastern and Western regions are structured to reflect different
capacity bands, which allow us to differentiate our charges based on the provision of
different levels of end-use capacity to our consumers.
Powerco Limited | Electricity Pricing Methodology 2013 47
168. Our tariffs across both regions also provide differentials between peak and off-peak
consumption in order to reflect the difference in long term costs associated with
investment in additional network capacity.
169. Powerco’s demand charge in the Western region for both mass market and larger
commercial/industrial customers is designed to signal the cost of new investment by
ensuring that consumers that contribute towards the peak demand on our network are
charged accordingly.
170. In addition, Powerco offers discounted charges for customers who opt for load control
tariffs. Configured well, load control systems are highly effective at reducing demands
at peak times by deferring non-time-critical power usage. The benefits of load-control
systems include more predictable peak demand magnitudes, fewer peaking generation
plants and deferred transmission and distribution capacity augmentations. The benefits
accrue across the entire electricity sector.
171. Transmission costs are a function of transmission capacity and signal the economic
costs of service provision on the Transpower network. These costs represent around
25% of distribution prices, so also work to ensure distribution prices meet this principle.
Powerco Limited | Electricity Pricing Methodology 2013 48
b) Where prices based on ‘efficient’ incremental costs would under-recover
allowed revenues, the shortfall should be made up by setting prices in a
manner that has regard to consumers’ demand responsiveness, to the
extent practicable.
172. Given the nature of distribution networks, prices based on efficient incremental costs
are likely to under-recover allowed revenues. However, setting prices based on a
precise definition of price responsiveness, or price elasticity of demand, is difficult for
electricity distribution for a number of reasons. First, there is limited information on the
actual price elasticity of demand for electricity in New Zealand. Second, retailers re-
bundle distribution prices into a final retail price for their consumers. In many cases,
the structure of distributors’ prices (i.e. the extent to which prices are charged on a
daily or per unit of energy basis) is changed by retailers. It is therefore very difficult to
discern customers’ responsiveness to changes in distribution prices alone.
173. The Commerce Commission, in its work on the pricing methodologies of regulated
suppliers, has acknowledged the difficulty of this issue. It has stated that it would
judge this principle by checking to see if certain rules have been followed. For
example, where one group of consumers is less price-responsive than another group
of consumers of the same service, then, all else being equal, one would expect the
prices of the less price-responsive consumers to be higher.
174. Graphs one and two on page 38 show that, as consumers’ capacity increases, the unit
cost expressed as a c/kWh charge reduces. Larger consumers tend to exhibit a higher
price elasticity of demand, because they are typically better able to modify their usage
patterns to consume during low cost periods or switch to alternative energy sources
(e.g. gas) if the cost of electricity rises. As larger consumers also face, on average,
lower prices per unit, this is consistent with the Commerce Commission’s
expectation.20
c) i) Provided that prices satisfy (a) above, prices should be responsive to
the requirements and circumstances of stakeholders in order to discourage
uneconomic bypass.
175. The main risk of bypass of the distribution network is large consumers opting to
connect directly to the Transpower’s network or install generation. Powerco’s practice
is to offer non standard pricing and individual account management to industrial and
large commercial customers to address the risk of uneconomic bypass and to enable
arrangements that are tailored to customers’ needs. Powerco’s approach to non-
standard pricing includes taking into account customers’ individual capacity and
demand to ensure, to the extent practicable, that the price is cost reflective.
176. Through these processes, Powerco discourages uneconomic bypass of its network
and promotes direct negotiation to tailor its services to the specific needs of the
business. For example, a number of years ago Powerco determined that a large
20 Research on how elasticity of electricity consumers based on size is very limited. However, in Powerco’s
experience large electricity consumers demonstrate a stronger interest in price signals to shift load. See Powerco’s Consumer Report 2009-2011 for a summary of the feedback from consumers.
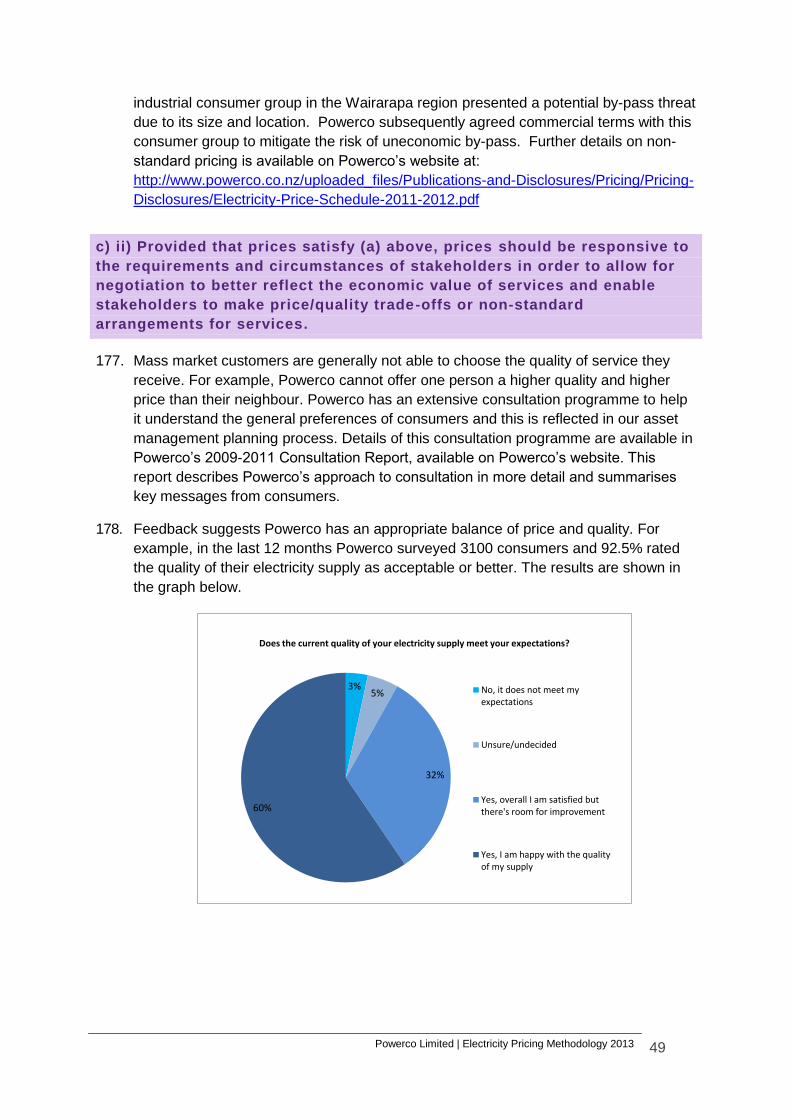
Powerco Limited | Electricity Pricing Methodology 2013 49
industrial consumer group in the Wairarapa region presented a potential by-pass threat
due to its size and location. Powerco subsequently agreed commercial terms with this
consumer group to mitigate the risk of uneconomic by-pass. Further details on non-
standard pricing is available on Powerco’s website at:
http://www.powerco.co.nz/uploaded_files/Publications-and-Disclosures/Pricing/Pricing-
Disclosures/Electricity-Price-Schedule-2011-2012.pdf
c) ii) Provided that prices satisfy (a) above, prices should be responsive to
the requirements and circumstances of stakeholders in order to allow for
negotiation to better reflect the economic value of services and enable
stakeholders to make price/quality trade-offs or non-standard
arrangements for services.
177. Mass market customers are generally not able to choose the quality of service they
receive. For example, Powerco cannot offer one person a higher quality and higher
price than their neighbour. Powerco has an extensive consultation programme to help
it understand the general preferences of consumers and this is reflected in our asset
management planning process. Details of this consultation programme are available in
Powerco’s 2009-2011 Consultation Report, available on Powerco’s website. This
report describes Powerco’s approach to consultation in more detail and summarises
key messages from consumers.
178. Feedback suggests Powerco has an appropriate balance of price and quality. For
example, in the last 12 months Powerco surveyed 3100 consumers and 92.5% rated
the quality of their electricity supply as acceptable or better. The results are shown in
the graph below.
3% 5%
32%
60%
Does the current quality of your electricity supply meet your expectations?
No, it does not meet myexpectations
Unsure/undecided
Yes, overall I am satisfied butthere's room for improvement
Yes, I am happy with the qualityof my supply
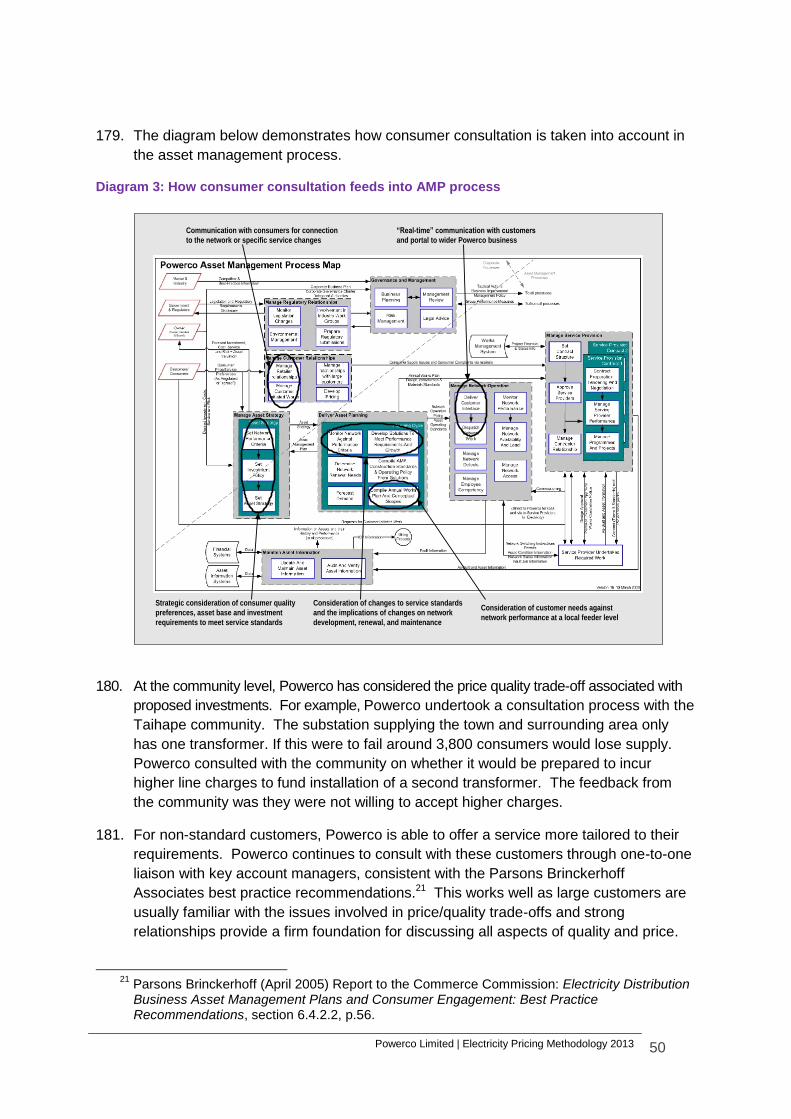
Powerco Limited | Electricity Pricing Methodology 2013 50
179. The diagram below demonstrates how consumer consultation is taken into account in
the asset management process.
Diagram 3: How consumer consultation feeds into AMP process
180. At the community level, Powerco has considered the price quality trade-off associated with
proposed investments. For example, Powerco undertook a consultation process with the
Taihape community. The substation supplying the town and surrounding area only
has one transformer. If this were to fail around 3,800 consumers would lose supply.
Powerco consulted with the community on whether it would be prepared to incur
higher line charges to fund installation of a second transformer. The feedback from
the community was they were not willing to accept higher charges.
181. For non-standard customers, Powerco is able to offer a service more tailored to their
requirements. Powerco continues to consult with these customers through one-to-one
liaison with key account managers, consistent with the Parsons Brinckerhoff
Associates best practice recommendations.21 This works well as large customers are
usually familiar with the issues involved in price/quality trade-offs and strong
relationships provide a firm foundation for discussing all aspects of quality and price.
21
Parsons Brinckerhoff (April 2005) Report to the Commerce Commission: Electricity Distribution Business Asset Management Plans and Consumer Engagement: Best Practice Recommendations, section 6.4.2.2, p.56.
Communication with consumers for connection
to the network or specific service changes
“Real-time” communication with customers
and portal to wider Powerco business
Strategic consideration of consumer quality
preferences, asset base and investment
requirements to meet service standards
Consideration of changes to service standards
and the implications of changes on network
development, renewal, and maintenance
Consideration of customer needs against
network performance at a local feeder level
Powerco Limited | Electricity Pricing Methodology 2013 51
182. The number, size and characteristics of non-standard customers on Powerco’s
network are described in tables 2 and 6 and in Annex A.
c) iii) Provided that prices satisfy (a) above, prices should be responsive to
the requirements and circumstances of stakeholders in order to , where
network economics warrant, and to the extent practicable, encourage
investment in transmission and distribution alternatives (e.g. distributed
generation or demand response) and technology innovation
183. Section 4.4.5 of Powerco’s AMP reviews distribution alternatives and technological
innovation. Powerco’s pricing methodology aims to complement this asset
management approach. Below are some examples of how this works:
1. Demand-side management is encouraged through demand-based network
charges in some cases.
2. Load control is used to reduce demand peaks. This has been proposed to modify
the timing of irrigation pump use in areas where voltage complaints have arisen.
3. Power factor correction is best applied at customers’ installations and this is set
out in Powerco’s connection standard. In some cases it is applied to the
distribution network, particularly in the Valley area, with shunt capacitors
(generally 750kVA banks) used at key locations on distribution feeders.
Powerco’s pricing provides an incentive to manage the power factor and recover
costs.
4. Load transfer through the distribution network is considered prior to any
substation capacity upgrade, and the effectiveness of price signals to manage
demand.
5. Solar-powered installations have been supplied in place of network extensions
for some remote small loads, such as electric fence units.
6. Micro-grids and remote-area power systems are being implemented in some
remote rural areas. As explained earlier, the recent changes in the Electricity
Industry Act 2010 allow Powerco to work with consumers to install alternative
energy supply. An example of this is Powerco’s “BASEPOWER” product which
provides a continuous and reliable supply of electricity, similar or better than grid
supply. BASEPOWER is a modular system with a generator, energy storage
and innovative energy management system combined with renewable supplies
from PV solar panels, micro hydro and, potentially, wind turbines.22 This also
provides Powerco with information about changes to standalone costs.
22 More information on adoption rates and pricing is available from Powerco on request.
Powerco Limited | Electricity Pricing Methodology 2013 52
d) Development of prices should be transparent, promote price stability
and certainty for stakeholders, and changes to prices should have regard
to the impact on stakeholders.
TRANSPARENCY
184. Powerco’s prices for 2012 are available to customers through a range of media
channels and locations:
two advertisements each year in the Wairarapa Times Age, Manawatu Standard, Wanganui Chronicle, Taranaki Daily News, Bay of Plenty Times and Waikato Times;
pricing schedules are sent to all customers with whom Powerco has a use of system agreement;
Powerco’s website; and
available to view on request or at our offices by appointment.
185. This pricing methodology is also published on Powerco’s website.
PRICE STABILITY, CERTAINTY AND IMPACT ON CUSTOMERS
186. The impact on customers of changes to the established allocation methodology is a
central consideration in the pricing process. This is the reason that Powerco has
moved away from the pricing it inherited from UNL very cautiously.
187. Powerco’s pricing methodology has not changed materially over the last five years. In
particular, the level of differential between peak and off-peak charges has not changed
materially, which provides retailers and consumers with a degree of certainty when
making decisions about investment in energy saving and off-peak devices.
188. Powerco is, however, continually looking to improve its pricing methodology to ensure
that the balance between price categories, fixed and variable charges and the peak
and off-peak differentials are appropriate. Our pricing methodology must also
complement technological developments, such as the roll out of advanced metering
infrastructure, the fall in cost of photovoltaic technology and the uptake of plug-in
electric vehicles.
189. Powerco consults with retailers and other customers a number of times throughout the
year to discuss our pricing methodology (including potential improvements) and the
impact of any pending review of our prices. A description of this process is available on
request from Powerco.
190. For non-standard customers, Powerco continues to consult with customers through
one-to-one liaison with key account managers which provides a channel for
discussions around all aspects of quality and price.
Powerco Limited | Electricity Pricing Methodology 2013 53
e) Development of prices should have regard to the impact of transaction
costs on retailers, consumers and other stakeholders and should be
economically equivalent across retailers.
191. Powerco is very aware of transaction costs and seeks to minimise them where
feasible. Some examples of transaction costs that exist when Powerco transacts with
key groups, and how we take these into account, are:
192. Retailers: Transaction costs can occur when billing systems, the pricing strategy
and/or risk management strategy are amended to accommodate large distribution
price changes. Fourteen retailers operate on Powerco’s network and we have a
detailed consultation process, generally with three rounds of consultation on prices
with retailers. The pricing methodology has not changed materially from last year but
we will continue to rationalise our price categories and tariff options to ensure that
retailers’ transactions costs are minimised.
193. Consumers: Consumers make medium to long term investments based on electricity
price structures. For example, a very low night rate may provide an incentive to invest
in a storage heater. Powerco is aware that consumers value pricing certainty and aims
to minimise any large changes that impact these types of investment decisions. We
mainly collect feedback from retailers (as they have responsibility for the ultimate price
signal), but also collect information from consumer consultation.
194. Powerco also takes the impact on the following stakeholders into account when setting
prices. An overview of our relationship with these stakeholders is described in section
2 of Powerco’s Asset Management Plan.
Transpower;
Commerce Commission;
Ministry of Business, Innovation and Employment;
Electricity Authority;
Electricity and Gas Complaints Commission.
ECONOMIC EQUIVALENCE ACROSS RETAILERS
195. Powerco’s pricing methodology is applied consistently to all retailers. Al;l retailers in
the same region face the same tariff options, applicable charges and/or calculation
methodology. Therefore we consider our prices to be economically equivalent across
retailers.
196. Powerco’s annual consultation process with retailers also allows them to raise any
concerns over pricing at an early stage of the pricing process.
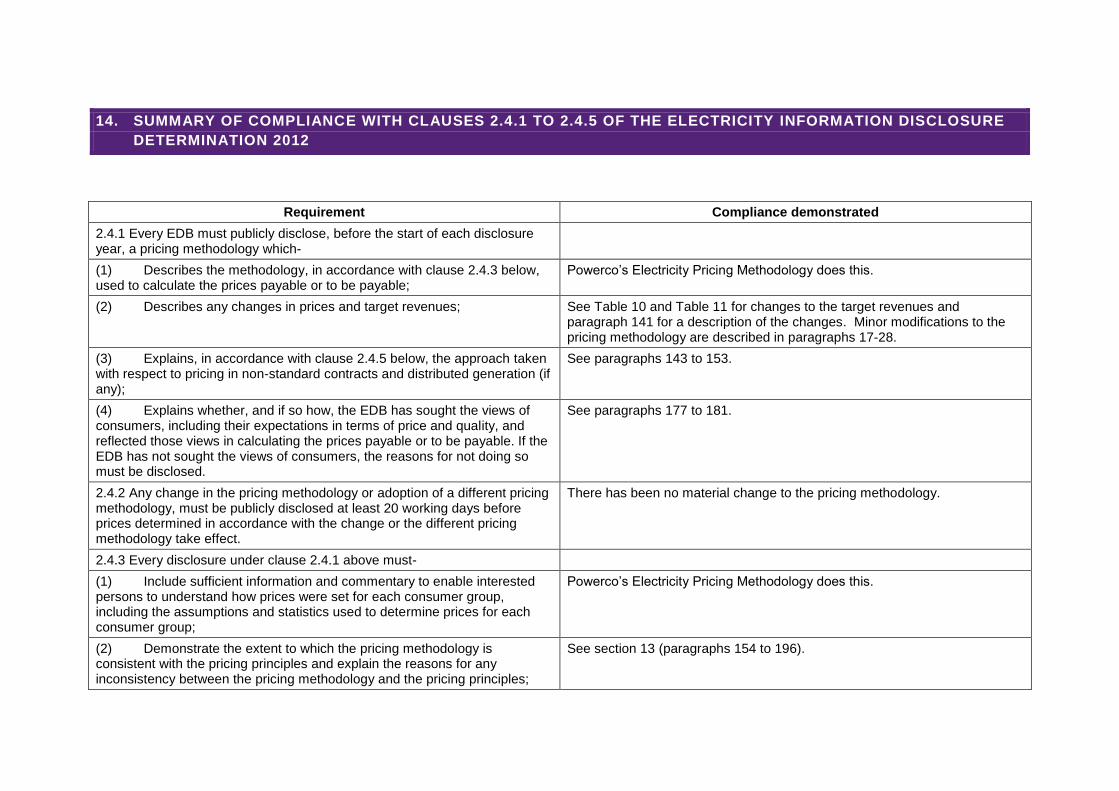
14. SUMMARY OF COMPLIANCE WITH CLAUSES 2.4.1 TO 2.4.5 OF THE ELECTRICITY INFORMATION DISCLOSURE
DETERMINATION 2012
Requirement Compliance demonstrated
2.4.1 Every EDB must publicly disclose, before the start of each disclosure year, a pricing methodology which-
(1) Describes the methodology, in accordance with clause 2.4.3 below, used to calculate the prices payable or to be payable;
Powerco’s Electricity Pricing Methodology does this.
(2) Describes any changes in prices and target revenues; See Table 10 and Table 11 for changes to the target revenues and paragraph 141 for a description of the changes. Minor modifications to the pricing methodology are described in paragraphs 17-28.
(3) Explains, in accordance with clause 2.4.5 below, the approach taken with respect to pricing in non-standard contracts and distributed generation (if any);
See paragraphs 143 to 153.
(4) Explains whether, and if so how, the EDB has sought the views of consumers, including their expectations in terms of price and quality, and reflected those views in calculating the prices payable or to be payable. If the EDB has not sought the views of consumers, the reasons for not doing so must be disclosed.
See paragraphs 177 to 181.
2.4.2 Any change in the pricing methodology or adoption of a different pricing methodology, must be publicly disclosed at least 20 working days before prices determined in accordance with the change or the different pricing methodology take effect.
There has been no material change to the pricing methodology.
2.4.3 Every disclosure under clause 2.4.1 above must-
(1) Include sufficient information and commentary to enable interested persons to understand how prices were set for each consumer group, including the assumptions and statistics used to determine prices for each consumer group;
Powerco’s Electricity Pricing Methodology does this.
(2) Demonstrate the extent to which the pricing methodology is consistent with the pricing principles and explain the reasons for any inconsistency between the pricing methodology and the pricing principles;
See section 13 (paragraphs 154 to 196).
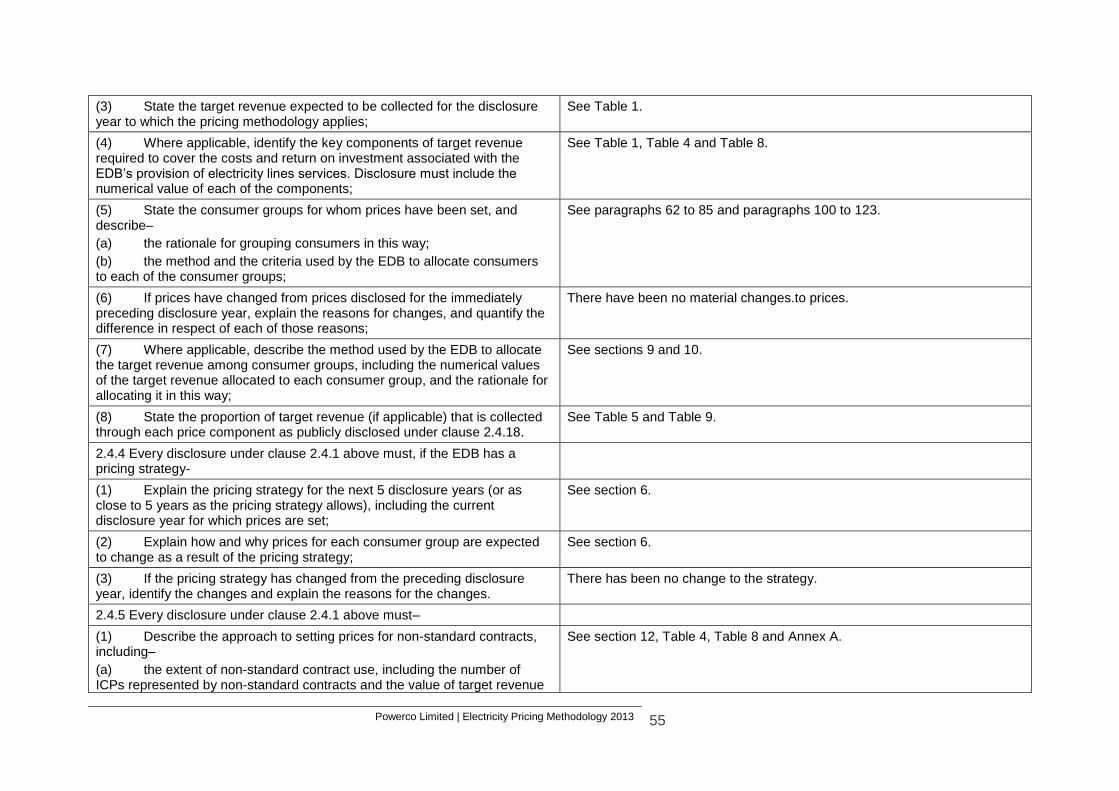
Powerco Limited | Electricity Pricing Methodology 2013 55
(3) State the target revenue expected to be collected for the disclosure year to which the pricing methodology applies;
See Table 1.
(4) Where applicable, identify the key components of target revenue required to cover the costs and return on investment associated with the EDB’s provision of electricity lines services. Disclosure must include the numerical value of each of the components;
See Table 1, Table 4 and Table 8.
(5) State the consumer groups for whom prices have been set, and describe–
(a) the rationale for grouping consumers in this way;
(b) the method and the criteria used by the EDB to allocate consumers to each of the consumer groups;
See paragraphs 62 to 85 and paragraphs 100 to 123.
(6) If prices have changed from prices disclosed for the immediately preceding disclosure year, explain the reasons for changes, and quantify the difference in respect of each of those reasons;
There have been no material changes.to prices.
(7) Where applicable, describe the method used by the EDB to allocate the target revenue among consumer groups, including the numerical values of the target revenue allocated to each consumer group, and the rationale for allocating it in this way;
See sections 9 and 10.
(8) State the proportion of target revenue (if applicable) that is collected through each price component as publicly disclosed under clause 2.4.18.
See Table 5 and Table 9.
2.4.4 Every disclosure under clause 2.4.1 above must, if the EDB has a pricing strategy-
(1) Explain the pricing strategy for the next 5 disclosure years (or as close to 5 years as the pricing strategy allows), including the current disclosure year for which prices are set;
See section 6.
(2) Explain how and why prices for each consumer group are expected to change as a result of the pricing strategy;
See section 6.
(3) If the pricing strategy has changed from the preceding disclosure year, identify the changes and explain the reasons for the changes.
There has been no change to the strategy.
2.4.5 Every disclosure under clause 2.4.1 above must–
(1) Describe the approach to setting prices for non-standard contracts, including–
(a) the extent of non-standard contract use, including the number of ICPs represented by non-standard contracts and the value of target revenue
See section 12, Table 4, Table 8 and Annex A.
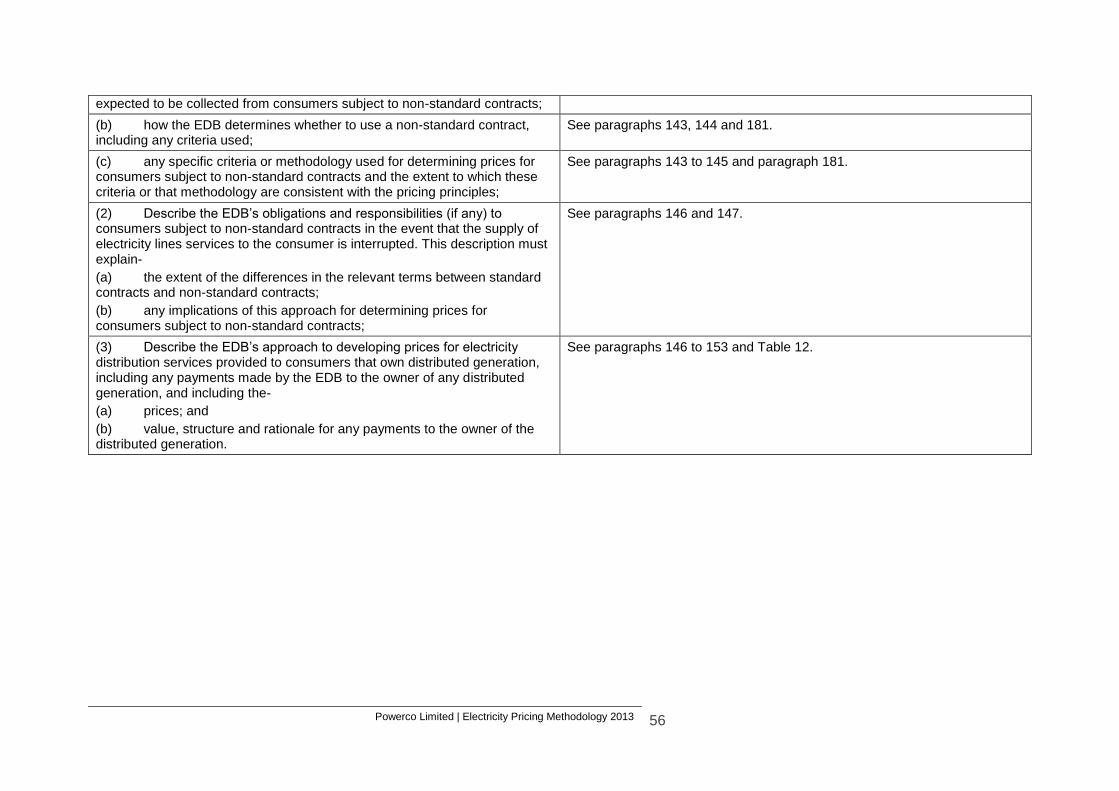
Powerco Limited | Electricity Pricing Methodology 2013 56
expected to be collected from consumers subject to non-standard contracts;
(b) how the EDB determines whether to use a non-standard contract, including any criteria used;
See paragraphs 143, 144 and 181.
(c) any specific criteria or methodology used for determining prices for consumers subject to non-standard contracts and the extent to which these criteria or that methodology are consistent with the pricing principles;
See paragraphs 143 to 145 and paragraph 181.
(2) Describe the EDB’s obligations and responsibilities (if any) to consumers subject to non-standard contracts in the event that the supply of electricity lines services to the consumer is interrupted. This description must explain-
(a) the extent of the differences in the relevant terms between standard contracts and non-standard contracts;
(b) any implications of this approach for determining prices for consumers subject to non-standard contracts;
See paragraphs 146 and 147.
(3) Describe the EDB’s approach to developing prices for electricity distribution services provided to consumers that own distributed generation, including any payments made by the EDB to the owner of any distributed generation, and including the-
(a) prices; and
(b) value, structure and rationale for any payments to the owner of the distributed generation.
See paragraphs 146 to 153 and Table 12.
Powerco Limited | Electricity Pricing Methodology 2013 58
ANNEX A: CHARACTERISTICS OF POWERCO’S EASTERN AND WESTERN
NETWORK
AREA NETWORK DESCRIPTIONS
197. Powerco has two contiguous networks, but within these there used to be several
previously separate distribution network entities. By virtue of their history, each of
these network parts has its own unique characteristics that need to be taken into
account in the pricing methodology.
WESTERN REGION
198. The Western region has four areas: Manawatu, Taranaki, Wairarapa and Wanganui.
Due to the size of the region, consumer groups are separated by GXP to more
accurately reflect costs.
199. The Manawatu region has three areas, based on the areas of the electricity supply
authorities that used to operate them. These are Manawatu, Palmerston North and
Tararua. The Manawatu rural subtransmission network (ex-Manawatu Oroua EPB)
consists of open 33kV rings feeding four substations around the periphery of
Palmerston North and 33kV radial feeders to Sanson and Kimbolton via Feilding.
200. The Taranaki area comprises three areas, based on the areas of the electricity supply
authorities that used to operate them. These are New Plymouth, Taranaki and
Egmont. The New Plymouth subtransmission network consists of two 33kV cables
supplying City Substation from Carrington GXP, two 33kV lines from Carrington GXP
and one 33kV line from Huirangi GXP supplying Bell Block Substation, two 33kV
cables owned by Powerco linking New Plymouth Power Station (NPPS) and
MoturoaGXP, and two 33kV lines from Huirangi GXP to Mamaku Rd Substation.
201. The Taranaki subtransmission network is an interconnected network supplying 12
zone substations from Huirangi GXP and Stratford GXP. The distribution network
around Inglewood operates at 6.6kV – conversion may take place to 11kV or to 22kV.
Some of the towns have load control via pilot wire and this can be complicated to
reinstate If It fails.
202. The Egmont subtransmission network supplies the south Taranaki area and consists
of Cambria Substation supplied via two oil-filled 33kV cables, and four zone
substations supplied via two 33kV line closed rings from Hawera GXP. It also supplies
three zone substations from Opunake GXP via an interconnected 33kV line network.
One of these feeds the Oaonui Shore Station.
203. The Wairarapa region covers the Wairarapa area from south of Eketahuna to Cape
Palliser. Masterton has significant industrial load. The Wairarapa area has
predominantly dairy farming load, although there are also many orchards and
vineyards. The network is supplied from Masterton GXP and Greytown GXP.
204. The Whanganui region covers the area from Waiouru in the north to Bulls in the
south, and includes the Rangitikei and Whanganui areas. The Whanganui network
Powerco Limited | Electricity Pricing Methodology 2013 59
consists of four areas, Wanganui, Marton, Taihape and Raetihi. Wanganui and
Marton have significant industrial load. The rural area has a predominantly mixed
farming load.
205. The Whanganui area is supplied from two Transpower GXPs at opposite sides of the
city, Wanganui GXP and Brunswick GXP. A 33kV line runs between these, passing
through substations at Peat St, Castlecliff, Beach Rd and Taupo Quay on the way.
Hatricks Wharf Substation is connected by 33kV line to Wanganui GXP and by 33kV
cable and line to Peat St. A radial line connects Peat St to Kai Iwi Substation, and
another connects Brunswick GXP to Roberts Ave Substation. A radial line connects
Wanganui GXP to Wanganui East Substation, and two short radial lines connect
Wanganui GXP to the adjacent Blink Bonnie Substation.
TAURANGA NETWORK: EASTERN REGION
206. The Tauranga region covers the western Bay of Plenty area from near Athenree,
north of Katikati to Otamarakau, east of Te Puke. Tauranga has significant industrial
load and a major port. The Bay of Plenty area has predominantly dairy and orchard
load, particularly kiwifruit and avocados.
207. Tauranga has two areas based on the electricity supply authorities that used to
operate them. These are the ex-Tauranga Electricity Limited network supplying
Tauranga CBD and the surrounding area, and the former Tauranga EPB network,
which supplies the remainder. These areas used to be separately operated due to
being supplied by transformers with different vector groups, but the Dy11
transformers have now been replaced with Yy0 units, and integration of the networks
is proceeding.
VALLEY NETWORK: EASTERN REGION
208. The Valley region covers the eastern area of the Waikato as far south as Kinleith, plus
Waihi and the Coromandel Peninsula. Several small towns have some industrial load,
but the rural area has predominantly dairy farming load. The region has five grid exit
points supplying Powerco’s network at 66, 33 and 11kV.
209. Kopu GXP supplies six substations on the Coromandel Peninsula and the Hauraki
Plains at 66kV with a mixture of ring and radial feeds. From Waikino GXP, 33kV lines
run to Waihi, Whangamata, WaihiBeach and Paeroa also in a mixture of ring and
radial feeds.
210. Waihou GXP supplies the Piako area. A 33kV meshed network supplies Morrinsville,
Waitoa, Farmer Rd, Piako and Walton Substations, although Walton and Morrinsville
are operated in radial configuration. Tahuna is supplied via a radial spur from Waihou
GXP. Mikkelsen Rd, adjacent to Waihou GXP, is supplied by twin 33kV connections.
211. Hinuera GXP supplies the area around Matamata, Tirau and Putaruru. The network
consists of single radial feeds to Tower Rd, Browne St and Waharoa, and Putaruru
via Tirau. This network can be partially backed up via a 33kV line between Walton
and Browne St.
Powerco Limited | Electricity Pricing Methodology 2013 60
212. Kinleith GXP supplies at 33kV and 11kV. The 33kV network supplies two substations
at Tokoroa, Maraetai Rd and Baird Rd, and the two substations associated with the
water pumping stations for the Kinleith mill at Midway and Lakeside.
213. Supply at 11kV is taken from Kinleith GXP for the Kinleith mill site. A co-generation
plant is connected to the Kinleith GXP.
NETWORK ASSETS BY PREVAILING CUSTOMER TYPE
INDUSTRIAL AND COMMERCIAL (F1)
214. The network configuration for large industrial customers is commensurate with the
nature and capacity of the customer’s load. Typically, for customers with a demand
above 3MVA, dual 11kV feeders are available, providing a no-break supply for
maintenance, or backup in the event of a single fault. Automated or remote control of
11kV switching is provided for some major customers. The cable and conductor sizes
reflect the load size. In general, newer areas have underground reticulation, while
older areas are overhead.
215. Due to the higher load currents, there tends to be limited load transfer capacity
through the 400V networks. Typically radial 400V feeders from the transformer to the
consumer are provided. In some industrial subdivisions 400V interconnection
between feeders is provided using either 240mm2 or 185mm2 aluminium cable, but
load transfer is limited.
KINLEITH MILL SITE
216. There is a significant network owned and operated by Powerco supplying 33kV
subtransmission and 11kV distribution assets located at the Carter Holt Harvey Pulp
Paper Mill at Kinleith, near Tokoroa. The network is highly interconnected, beginning
at the cable terminations of the Transpower switchgear at the Kinleith GXP, and
ending at the low-voltage terminals of the supply transformers. The system is mainly
underground, comprising 29 11kV feeders, and including one 33kV circuit that
supplies Midway and Lakeside substations.
TE REREHAU WINDFARM SITE
217. An underground cable reticulation system links wind turbines in the Manawatu area
and connects them to the Tararua 3 transmission GIP. This comprises 28km of 33kV
underground cable, presently 81 33kV/400V distribution transformers, an optical fibre
network and a 33kV switching station.
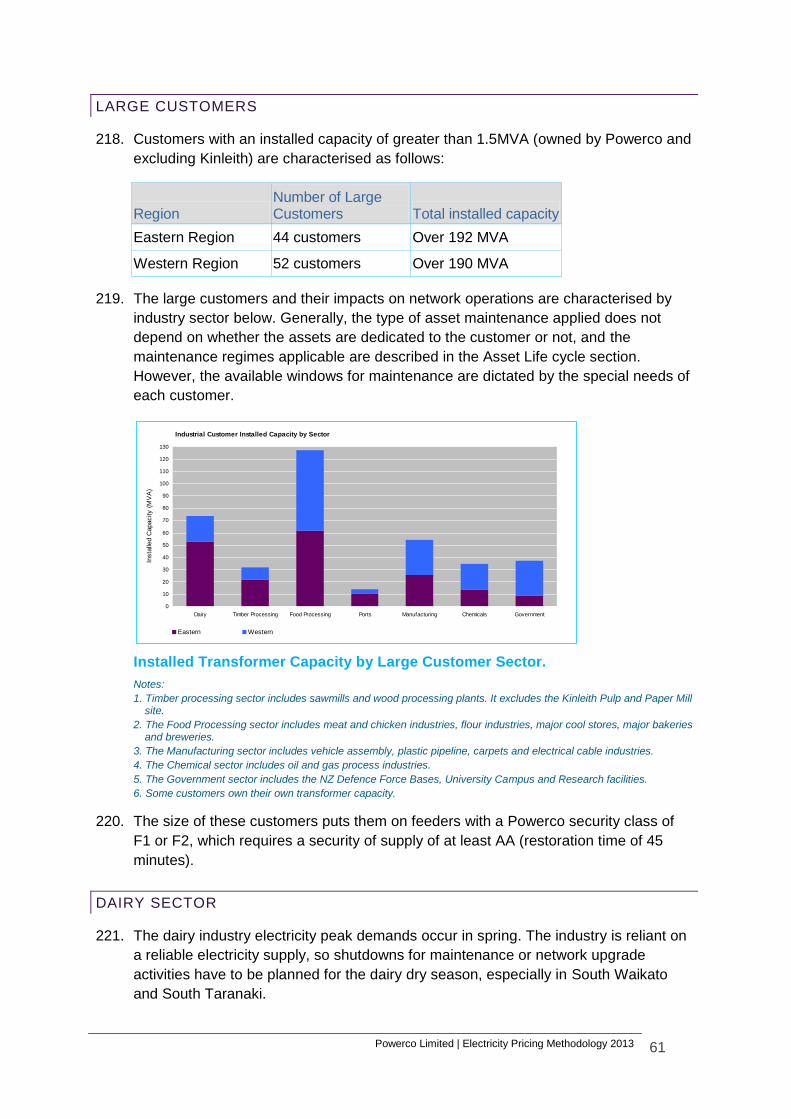
Powerco Limited | Electricity Pricing Methodology 2013 61
LARGE CUSTOMERS
218. Customers with an installed capacity of greater than 1.5MVA (owned by Powerco and
excluding Kinleith) are characterised as follows:
Region Number of Large Customers Total installed capacity
Eastern Region 44 customers Over 192 MVA
Western Region 52 customers Over 190 MVA
219. The large customers and their impacts on network operations are characterised by
industry sector below. Generally, the type of asset maintenance applied does not
depend on whether the assets are dedicated to the customer or not, and the
maintenance regimes applicable are described in the Asset Life cycle section.
However, the available windows for maintenance are dictated by the special needs of
each customer.
Installed Transformer Capacity by Large Customer Sector.
Notes:
1. Timber processing sector includes sawmills and wood processing plants. It excludes the Kinleith Pulp and Paper Mill site.
2. The Food Processing sector includes meat and chicken industries, flour industries, major cool stores, major bakeries and breweries.
3. The Manufacturing sector includes vehicle assembly, plastic pipeline, carpets and electrical cable industries.
4. The Chemical sector includes oil and gas process industries.
5. The Government sector includes the NZ Defence Force Bases, University Campus and Research facilities.
6. Some customers own their own transformer capacity.
220. The size of these customers puts them on feeders with a Powerco security class of
F1 or F2, which requires a security of supply of at least AA (restoration time of 45
minutes).
DAIRY SECTOR
221. The dairy industry electricity peak demands occur in spring. The industry is reliant on
a reliable electricity supply, so shutdowns for maintenance or network upgrade
activities have to be planned for the dairy dry season, especially in South Waikato
and South Taranaki.
Industrial Customer Installed Capacity by Sector
0
10
20
30
40
50
60
70
80
90
100
110
120
130
Dairy Timber Processing Food Processing Ports Manufacturing Chemicals Government
Insta
lled C
apacity (
MV
A)
Eastern Western
Powerco Limited | Electricity Pricing Methodology 2013 62
222. At an individual farm level, operations are intensifying and amalgamating. There is
greater use of irrigation and new technologies. The overall impact is that the load is
increasing and the operations require higher reliability of supply and better quality of
supply than was previously the case. This is consuming existing spare capacity,
creating a greater onus on effective network planning and operations.
TIMBER PROCESSING SECTOR
223. Timber processing facilities may be located in remote areas where there is low
network security. This means that outage planning may involve extensive customer
consultation and that voltage fluctuations may occur.
FOOD PROCESSING SECTOR
224. Outage requirements for customers in this sector can usually be co-ordinated if
sufficient notice is given. Unplanned outages can lead to spoiled products, causing
expensive wastage and staff disruption. Cool stores are significant growth packages
and can have heavy, peaky loads. Careful planning is needed to ensure adequate
backfeed capability is allowed for these loads. Backup capacities to the full site
capacities are becoming more difficult to provide due to the size of the loads.
TRANSPORTATION SECTOR
225. Port operations are based around shipping movements and the quick turnaround of
ships is important. When ships are in port, the facilities make heavy demands on the
electricity distribution network and at these times a highly reliable supply is needed to
ensure a fast turnaround. A secure supply (N-1) is therefore needed by ports.
Continued drive for efficiency and increasing demands in this sector has been
squeezing the windows available for maintenance. Both of the main ports supplied by
Powerco are on growth paths. The port in Tauranga is highly competitive with a large
expansion planned. Improvements in the capacity of the rail link between New
Plymouth and Marton have occurred but the closure of the rail link from Stratford to
Taumarunui could constrain Westgate’s future growth path.
MANUFACTURING SECTOR
226. The manufacturing sector is dependent on the prevailing general economic conditions
and the economic conditions within the industry’s particular niche. The requirements
on the electricity distribution network can therefore vary accordingly.
CHEMICALS SECTOR
227. The chemical sector is heavily reliant on a reliable supply of electricity with few
voltage disturbances. Some of the machines in this industry can create large voltage
dips on the network when they start. This needs ongoing co-ordination with the
customers.
Powerco Limited | Electricity Pricing Methodology 2013 63
GOVERNMENT SECTOR AND RESEARCH FACILITIES
228. Some of the Government sector organisations have on-site generation which needs
to be co-ordinated with Powerco’s network operations.
CENTRAL BUSINESS DISTRICT NETWORKS
229. The networks in the Tauranga, Palmerston North, New Plymouth, Whanganui,
Tokoroa and Masterton central business districts (CBDs) consist of highly
interconnectable 11kV radial feeders. Switching points are provided at most
11kV/400V transformer locations. There is a high level of interconnection between
adjacent 11kV feeders. The reticulation in the CBDs is 100% underground, with cable
sizes ranging from 70mm2 to 300mm2, aluminium or copper. In some areas there are
express feeder inter-ties of up to 630mm2. In key locations 11kV switch automation is
being progressively introduced, and provision for future automation is being provided
at less critical locations. This configuration allows quick restoration of supply in fault
situations.
230. The 400V network consists of radial circuits with a high degree of interconnection.
The interconnection between distribution substations is made at junction boxes
located along the 400V circuits. The cable sizes are typically large (up to 0.5 sq. inch
copper). The 400V network is 100% underground in the CBDs. Load can be
transferred across the 400V network in some locations.
231. The main streets of most towns and suburban centres in Powerco’s network have a
typical urban network configuration. In these centres the business district is largely or
completely underground.
232. Large retail business customers include 88 The Square in Palmerston North, Bayfair
in Mt Maunganui and Centre City Shopping Centre in New Plymouth.
RESIDENTIAL NETWORKS
233. Both 11kV and 400V residential distribution networks (F3 in Tables 4.3and 8.3) are
interconnectable radial networks. The level of interconnectability is moderate,
commensurate with the reliability requirements. In general, newer areas have
underground reticulation while older areas are overhead. In some urban areas, the
distance and/or load between switching points is such that Powerco’s planning criteria
are not fully met.
234. Low-voltage networks in residential areas tend to be extensive, with transformer
capacities of around 200kVA typically supplying 50 or more ICPs. Load can be
transferred across the 400V network in some locations either through link boxes or
through temporary jumpers.
RURAL NETWORKS (F4)
235. The rural network consists of 11kV lines with isolators installed every 1-2km in some
regions (F4 in Tables 4.3and 8.3). This enables flexibility of switching, but presents a
Powerco Limited | Electricity Pricing Methodology 2013 64
maintenance and reliability liability. Generally, 11kV spur lines may be fused with
dropout fuses. There is some interconnection between feeders to allow backfeeding
in maintenance and fault situations. Feeders are overhead lines on wooden or
concrete poles.
236. Line reclosers and sectionalisers are used in rural areas. Typically reclosers are
placed at the transition between urban and rural loads and between rural and remote
rural loads. Sectionalisers are used on some spur lines. Many reclosers are SCADA-
controlled.
237. Low-voltage networks may be short supplying up to around five ICPs and transformer
capacities of up to around 100kVA are common.
REMOTE RURAL NETWORKS (F5)
238. Remote rural feeders are generally radial with limited or no interconnection between
adjacent feeders. In some areas, 11kV isolators and 11kV dropout fuses are used to
provide discrimination and sectionalising under fault conditions. Some remote areas
are supplied by two-phase lines, and a small number are supplied by single-wire earth
return (SWER).
239. Due to the scattered nature of the population there are no significant rural 400V
networks. Typically, the 400V network extends 100-200m under the main distribution
voltage lines from the distribution transformer to supply nearby loads. Distribution
transformers would typically have a capacity of 15 or 30kVA.
240. Many of the remote rural coastal communities have been undergoing subdivision,
leading to stress on the electricity networks that supply them, particularly during
holiday periods. Furthermore, there is a tendency that the consumers moving to these
communities are used to urban supply reliability and have consequent high
expectations.