Embed Size (px)
Citation preview
Electricity Market Reform: Will it work and if so how?
Michael Pollitt
www.eprg.group.cam.ac.uk
Michael PollittJudge Business School
Beesley Lecture
8 November 2012
Note: These slides reflect my own analysis and should not be taken to represent the views of any other member of the EPRG orother organisation with which I am associated.
Outline
• Setting the scene
• Proposed Electricity Market Reforms in the UK
• EMR impact analysis
www.eprg.group.cam.ac.uk
• EMR impact analysis
• Is EMR a model for other countries to follow?
• If not EMR, then what?
Setting the scene
www.eprg.group.cam.ac.uk
EMR – Electricity Market Reform
• Four elements proposed in December 2010:
• 1. Fixed prices for low carbon generation (CfD-FiTs)
• 2. Carbon Price Support (CPS)
• 3. Capacity Market (CM)
• 4. Emissions Performance Standard (EPS)
www.eprg.group.cam.ac.uk
• 4. Emissions Performance Standard (EPS)
• Draft Energy Bill issued in May 2012, due to be legislated in 2013.
• Summary of talk: Q. Will it work? A. No.
The objectives of UK energy policy
• The impossible trinity:
–Competitiveness
–Energy Security
–Decarbonisation
www.eprg.group.cam.ac.uk
• The other ones:
–Elimination of (energy) poverty
–Renewables
–Green jobs/economy/technology
UK Decarbonisation targets
• UK in 2011 GHGs: -28.3% relative to 1990
• Kyoto Target: -12.5% by 2012; UK Target -34% by 2020
• 2008 Climate Change Act:
– 80% reduction by 2050
– Climate Change Committee
www.eprg.group.cam.ac.uk
– Climate Change Committee
– Five Year Carbon budgeting
– Latest projections: 90%+ decarbonisation of electricity by 2030
– Latest target: -50% relative to 1990 by 2023-27.
UK Renewables Targets
• UK committed to 15% target for renewables contribution to total final energy consumption in 2020 (2009/28/EC) (3.8% in 2011)
• Currently support regime only envisages 15.4%
www.eprg.group.cam.ac.uk
• Currently support regime only envisages 15.4% renewables in electricity by 2015-16. (8.6% in 2011)
• 2010 target of 10% for electricity from renewables (2001/77/EC). 7.3% was achieved.
• Clearly, current policies not working.
15
20
25
30
35
EU
A P
ric
e /
Eu
ro
Spot price
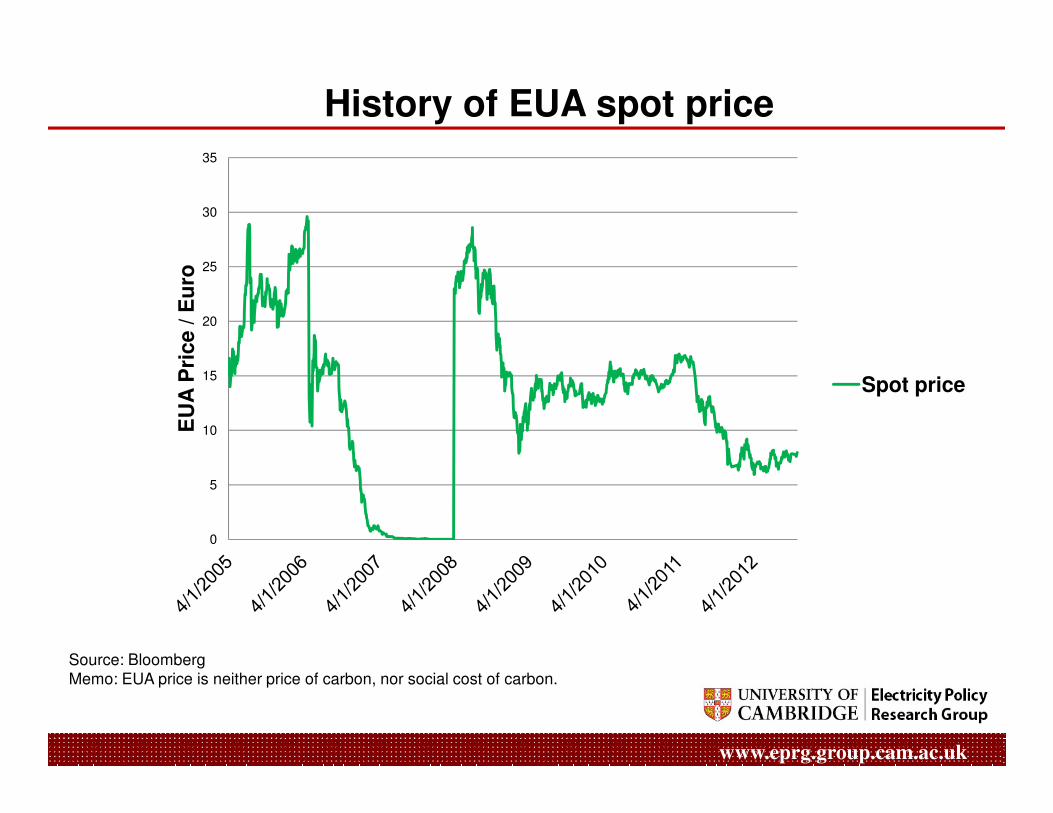
History of EUA spot price
www.eprg.group.cam.ac.uk
Source: BloombergMemo: EUA price is neither price of carbon, nor social cost of carbon.
0
5
10EU
A P
ric
e /
Eu
ro
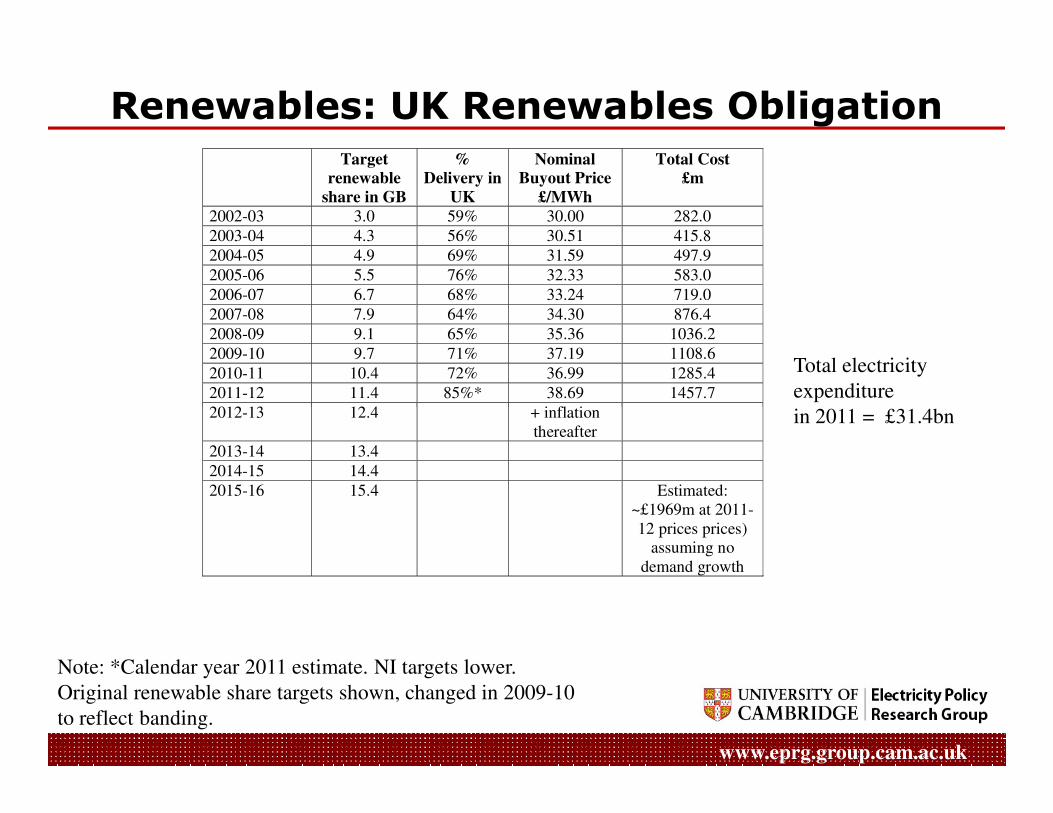
Renewables: UK Renewables Obligation Target
renewable
share in GB
%
Delivery in
UK
Nominal
Buyout Price
£/MWh
Total Cost
£m
2002-03 3.0 59% 30.00 282.0
2003-04 4.3 56% 30.51 415.8
2004-05 4.9 69% 31.59 497.9
2005-06 5.5 76% 32.33 583.0
2006-07 6.7 68% 33.24 719.0
2007-08 7.9 64% 34.30 876.4
2008-09 9.1 65% 35.36 1036.2
2009-10 9.7 71% 37.19 1108.6
2010-11 10.4 72% 36.99 1285.4
2011-12 11.4 85%* 38.69 1457.7
2012-13 12.4 + inflation
Total electricity
expenditure
in 2011 = £31.4bn
www.eprg.group.cam.ac.uk
2012-13 12.4 + inflation
thereafter
2013-14 13.4
2014-15 14.4
2015-16 15.4 Estimated:
~£1969m at 2011-
12 prices prices)
assuming no
demand growth
Note: *Calendar year 2011 estimate. NI targets lower.
Original renewable share targets shown, changed in 2009-10
to reflect banding.
in 2011 = £31.4bn
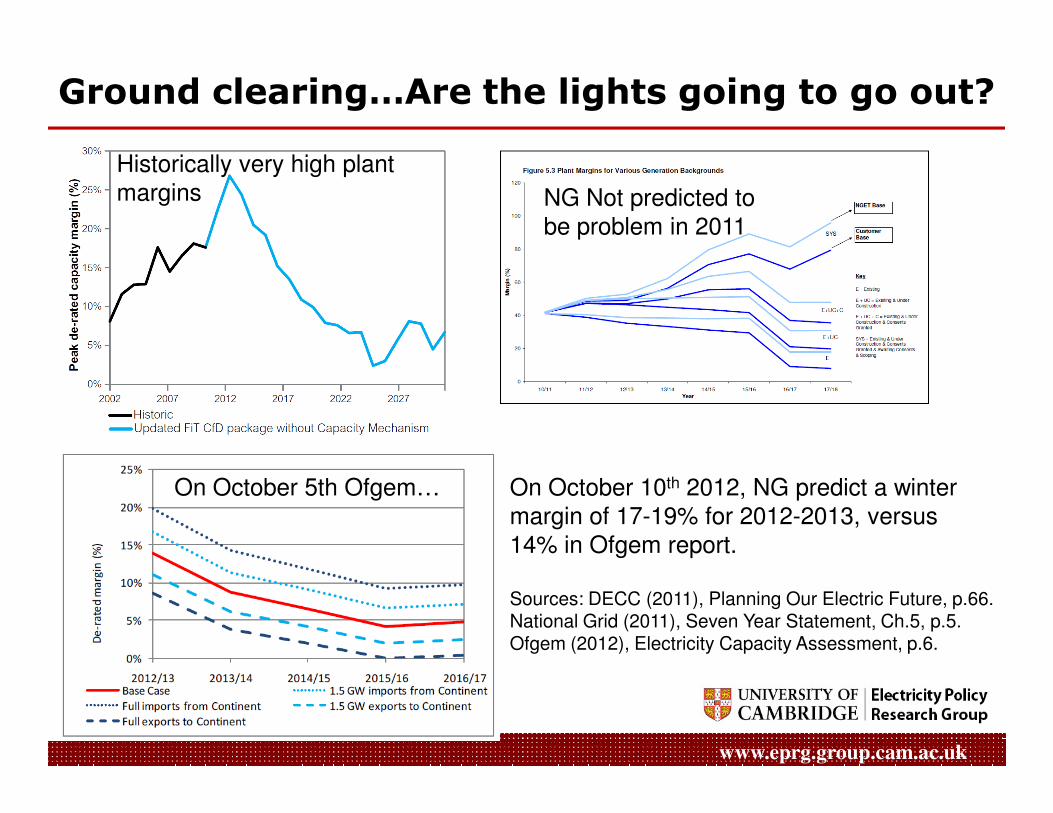
Ground clearing…Are the lights going to go out?
Historically very high plantmargins NG Not predicted to
be problem in 2011
www.eprg.group.cam.ac.uk
On October 5th Ofgem… On October 10th 2012, NG predict a winter margin of 17-19% for 2012-2013, versus14% in Ofgem report.
Sources: DECC (2011), Planning Our Electric Future, p.66.National Grid (2011), Seven Year Statement, Ch.5, p.5.Ofgem (2012), Electricity Capacity Assessment, p.6.
Are the lights going to go out?
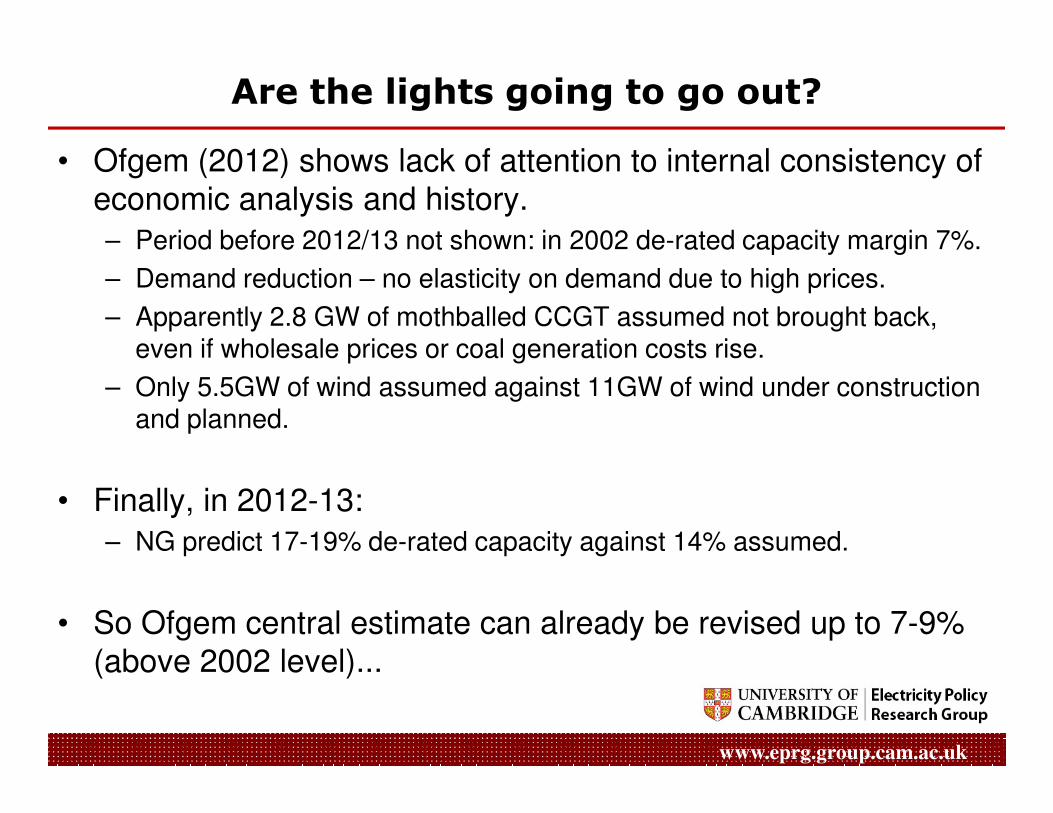
• Ofgem (2012) shows lack of attention to internal consistency of economic analysis and history.– Period before 2012/13 not shown: in 2002 de-rated capacity margin 7%.
– Demand reduction – no elasticity on demand due to high prices.
– Apparently 2.8 GW of mothballed CCGT assumed not brought back, even if wholesale prices or coal generation costs rise.
– Only 5.5GW of wind assumed against 11GW of wind under construction and planned.
www.eprg.group.cam.ac.uk
and planned.
• Finally, in 2012-13:– NG predict 17-19% de-rated capacity against 14% assumed.
• So Ofgem central estimate can already be revised up to 7-9% (above 2002 level)...
Ground clearing…Green growth important
• Green jobs:
– BIS (2012) report suggests 939,000 ‘green’ jobs in UK in 2010/11.
– However this includes water, windows and forestry and lots of other non-subsidised jobs…unrelated to renewable subsidies.
– Apparently there are 94,000 jobs in the UK wind industry.
– There are only 102,000 in German Wind, of which, only 40,000 in manufacturing and supply of turbines) (see Wind industry in Germany, Economic Report, 2011)
www.eprg.group.cam.ac.uk
Economic Report, 2011)
– Significant general equilibrium effect of rise in electricity prices across industry (e.g. Hughes, 2011), implying job losses elsewhere.
– Constable (2011): subsidy per wind industry job £57,000 p.a.
• Energy is important for economic growth:
– Low energy prices central to UK historical economic growth (Allen, 2009), and our historic economic development.
– Positive energy price shocks do reduce GDP and induce recessions (Kilian, 2006). So don’t engineer one!
Opening remarks on the electricity market
• Fundamentally, the question behind the EMR is what
sort of market it would take to deliver secure power,
renewables and carbon reduction simultaneously?
• Economists can design a set of markets to do this, so there is a more markets, not less solution. Including:
– Complete power markets
www.eprg.group.cam.ac.uk
– Complete power markets
– Supplier non-delivery penalties for residential customers
– A comprehensive carbon market (within the EU)
– An EU green certificate market (for ‘learning’)
– Nodal pricing of network access
– Merchant transmission links
• However markets do produce certain risks and raise (solvable) distributional issues.
Opening remarks on the electricity market
• At the other extreme we have a more interventionist solution, this would see the re-emergence of integrated companies capable of simply undertaking investments imposed on them by regulators/government (the ‘bad’ ‘old’ days).
• In between, achieving renewables and carbon targets without proper market incentives requires some variant of a single
www.eprg.group.cam.ac.uk
proper market incentives requires some variant of a single buyer model for low carbon generation.
• The fundamental problems with this are:
– how to put market ideas back in box.
– more explicit government direction of the industry likely to result in political paralysis of investment.
Opening remarks on the electricity market
• Markets are not dead in single buyer world. However the single buyer does remove some of the functions of market:
– The ability to quickly react to new information.
– Long term commodity price risk management.
– Decentralised portfolio optimisation.
www.eprg.group.cam.ac.uk
– Decentralised portfolio optimisation.
– Competition in planning for the future.
– Reduction of technology based lobbying.
– Responsibility for long term planning failures.
• Clearly single buyers pick winners (or losers).
An analysis of proposed
Electricity Market Reforms
www.eprg.group.cam.ac.uk
Electricity Market Reforms(EMR) in UK
Origins of EMR proposals
• Nov 2008: Climate Change Act (passes 463-3 on third reading in
HoC).
• December 2008: First report of Committee on Climate Change:– sets up electricity as lead sector for decarbonisation, with 90% per kWh
decarbonisation by 2030.
– Electricity identified as key to decarbonising heat and transport.
• 12 October 2009: Committee on Climate Change First Progress
www.eprg.group.cam.ac.uk
• 12 October 2009: Committee on Climate Change First Progress Report details key EMR elements.
• May 2010: Coalition Agreement, somewhat surprisingly, specifies 4 elements of EMR.
• Dec 2010 DECC publishes EMR proposals…
• It is absolutely clear that motivation for EMR lies with Committee on Climate Change, 5 year carbon budgeting and the Climate Change Act.
How the four EMR elements fit together
• Need to achieve carbon and renewables targets. Electricity is first sector in line for large scale decarbonisation.
• CfD-FiTs offer price (energy+carbon) certainty and are high enough to support low carbon generation such as nuclear etc.
• CPS needed to raise price of carbon for fossil generation to encourage switching and have added benefit of reducing CfDpayments and raising some tax revenue.
www.eprg.group.cam.ac.uk
payments and raising some tax revenue.
• Under CfD-FiTs and CPS, fossil generation gets pushed to margin and has low plant utilisation, but is needed to back up intermittent sources such as wind, therefore needs an availability payment, via capacity market.
• Then just in case, we don’t get price based incentives right, EPS ensures that high CO2 fossil plants do not get built.
• There is a logic, is it good economics?
(i) Support for Low Carbon Generation
The reform proposes the setting up of a system of contracts for differences (CFD-FITs) whereby the government would contract with low-carbon generators to supply electricity at fixed prices for a prolonged period. These contracts would pay the
www.eprg.group.cam.ac.uk
prolonged period. These contracts would pay the generators the difference between the average wholesale price of electricity and the contract price.
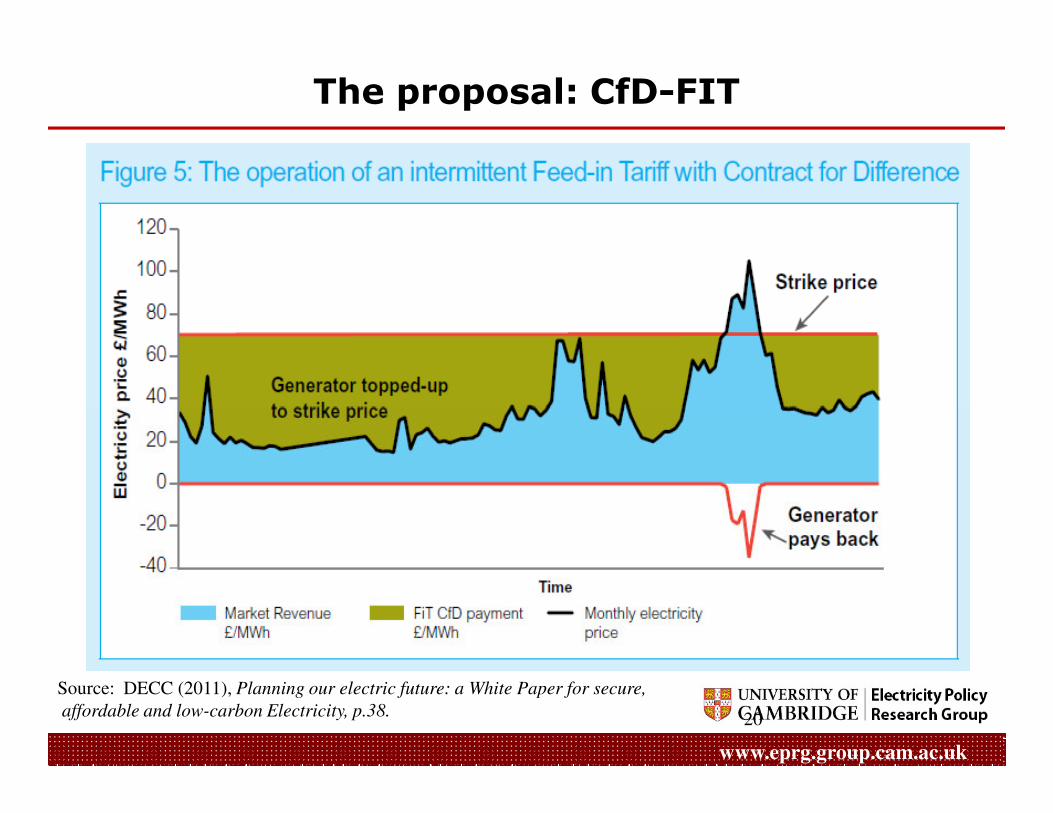
The proposal: CfD-FIT
www.eprg.group.cam.ac.uk
20
Source: DECC (2011), Planning our electric future: a White Paper for secure,
affordable and low-carbon Electricity, p.38.
The argument for CfDs
• The argument is around the volatility of the EUETS price. EUETS is not volatile if hedged by a simple buying strategy, but the average price is low.
• CfD-FiTs will raise the average price, however no real evidence that it will reduce the cost of capital (as is claimed).
• Any remaining risk is transferred to the counterparty. This will be the consumer, but ultimately the government. It does not go away.
www.eprg.group.cam.ac.uk
• The main risks for nuclear are construction risk and appropriation of cash flows once built (as in Germany) these are not addressed.
• CfD-FITs are still subject to uncertainty around the strike price of future plants (e.g. second and third nuclear plants).
• In the end the theoretical argument for CfD-FiTs versus a price of carbon does not pay sufficient attention to the theory of finance.
Some Practical Problems with CfD-FiTs
• What will be the reference price? Over 40 years it is not at all clear that there will be one meaningful market price for residual fossil generation.
• Who will be the counterparty? The System Operator (NG) has apparently refused to take this role. It seems that it will be the government and
www.eprg.group.cam.ac.uk
role. It seems that it will be the government and CfD payments will be a state aid.
• How will there be competition in the CfD-FiT
market for low carbon generation, especially if there is technology banding? Only one company still in the first nuclear competition.
(ii) Carbon Pricing
The reform has already introduced a carbon price support (CPS) based on the existing climate change levy (CCL). This involves increasing the rate and coverage of the climate change levy to effectively increase the price of
www.eprg.group.cam.ac.uk
change levy to effectively increase the price of carbon emissions from the electricity sector in the UK above that in the rest of the EU.
Begins in April 2013, target CO2 price is £30/tonne (in 2009 terms) –forward EUA price + CPS - by 2020 (possibly £70/tonne by 2030). Note: that with inflation CO2 price in UK could easily be 50 Euros per
tonne by 2020.
CPS – a theoretical analysis
• The CPS is fundamentally a tax policy. It needs to be analysed in the light of the principles of optimal tax theory.
• It is a carbon tax implemented on electricity, not on domestic gas or any other source of CO2, and hence distorts the use of electricity relative to other energy carriers.
• The CPS distorts international competition and trade in electricity. Energy intensive industry will shift to continental
www.eprg.group.cam.ac.uk
electricity. Energy intensive industry will shift to continental Europe and electricity imports (which cant be taxed on trade grounds) will be encouraged. This is simple tax arbitrage.Diamond and Mirrlees (1971) show that industry should be exempted from intermediate goods taxes for these reasons.
• The CPS will directly impact the wholesale price via raising the price of marginal fossil generation. In 2014 it will raise household bills by 3-6% on top of CfD-FiT effects.
Practical problems with CPS
• There is also a political problem, unlikely that HMT will want to reduce the total revenue from the tax to zero from its initially highly significant level, so the rate may not be increased as expected.
• CPS complicates the economics of CCS and CHP which will require more subsidy at higher carbon
www.eprg.group.cam.ac.uk
which will require more subsidy at higher carbon prices.
• CPS will lead to messy exemptions with arbitrary cut off points for energy intensive users.
• CPS, like CfD-FiTs, by reducing the number of EUA permits required by the UK undermines the EUETS.
(iii) Capacity Mechanism
The reform proposes the introduction of a (market wide?) capacity mechanism (CM) to contract for the necessary amount of capacity to maintain security of supply. This would involve the introduction of payments to generators for maintaining availability, supplementing the
www.eprg.group.cam.ac.uk
maintaining availability, supplementing the market for units of electrical energy that exists at the moment. This deals with predicted low capacity margins by 2018.
Note: The amount of capacity to be contracted for would be decided by the government. The date of introduction could be in the 2020s!
Theory of Capacity Markets
• This is the theory of supply and demand. In most capital intensive goods markets payment is for production, not capacity.
• Indeed competitive markets strongly incentivise excess capacity (while government owned industries, usually suffer from shortages due to unwillingness to raise finance for new capacity), due to strong non-delivery penalties and duplication of reserves.
• The actual issue is not capacity but willingness to pay to avoid interruption. This is not well expressed by households (in the absence of smart meters),
www.eprg.group.cam.ac.uk
This is not well expressed by households (in the absence of smart meters), but can be captured directly by regulatory non-delivery penalties.
• What is clear is that capacity mechanisms in electricity (e.g. in the US) only seem to be necessary when energy prices are capped at arbitrarily low levels (Texas considering raising its cap).
• A case for capacity payments may emerge at high levels of renewables but only to encourage entry of small intermittent generators who will find it difficult to contract with fossil generators directly for back up generation. In such cases a capacity market might emerge privately.
Practical problems with Capacity Markets
• Who decides what the required level of capacity is? Is it the government and if so, how.
• Recent US experience suggests that far from guaranteeing revenue for generators, capacity markets can be used by governments to appropriate revenue from generators by licensing new capacity to drive down capacity market prices (e.g. FERC vs New Jersey, who was accused of monopsony
www.eprg.group.cam.ac.uk
(e.g. FERC vs New Jersey, who was accused of monopsony activity in the capacity market).
• National capacity markets are problematic in the EU. It may not be possible to stop EU generators bidding into the capacity markets via interconnectors (who are also avoiding the CPS), thus supporting capacity in other countries rather than the UK (if for instance capacity markets are deemed a form of public service obligation).
(iv) Emissions Performance Standard
New supercritical coal fired generation has average CO2 emissions of around 790g/kWh; a modern gas-fired power plant about 360g/kWh. The reform proposes an emissions performance standard (EPS) for all new power plants of 450g/kWh, designed to rule out the building of
www.eprg.group.cam.ac.uk
450g/kWh, designed to rule out the building of new coal-fired power plants without carbon capture and storage (CCS) technology fitted (to a substantial part of a new plant).
Note: that new peaking plant will be permitted as maximum emissions are calculated at an 85% load factor.
EPS
• This is a backstop command and control approach to environmental regulation.
• It appears to be innocuous in that no-one currently wants to build the plants that it rules out.
• However it does introduce an instrument which could be ratcheted up to eliminate the building of new gas fired power plants.
www.eprg.group.cam.ac.uk
plants.
• Given the problems that California, Italy, Germany and Japan have had from environmental standards ruling out ‘any’ timely new build/operation of large conventional power plants. It is a significant threat.
• Given that it serves no useful function in terms of renewables or decarbonisation, it has no place in the EMR package.
EMR Impact Analysis
www.eprg.group.cam.ac.uk
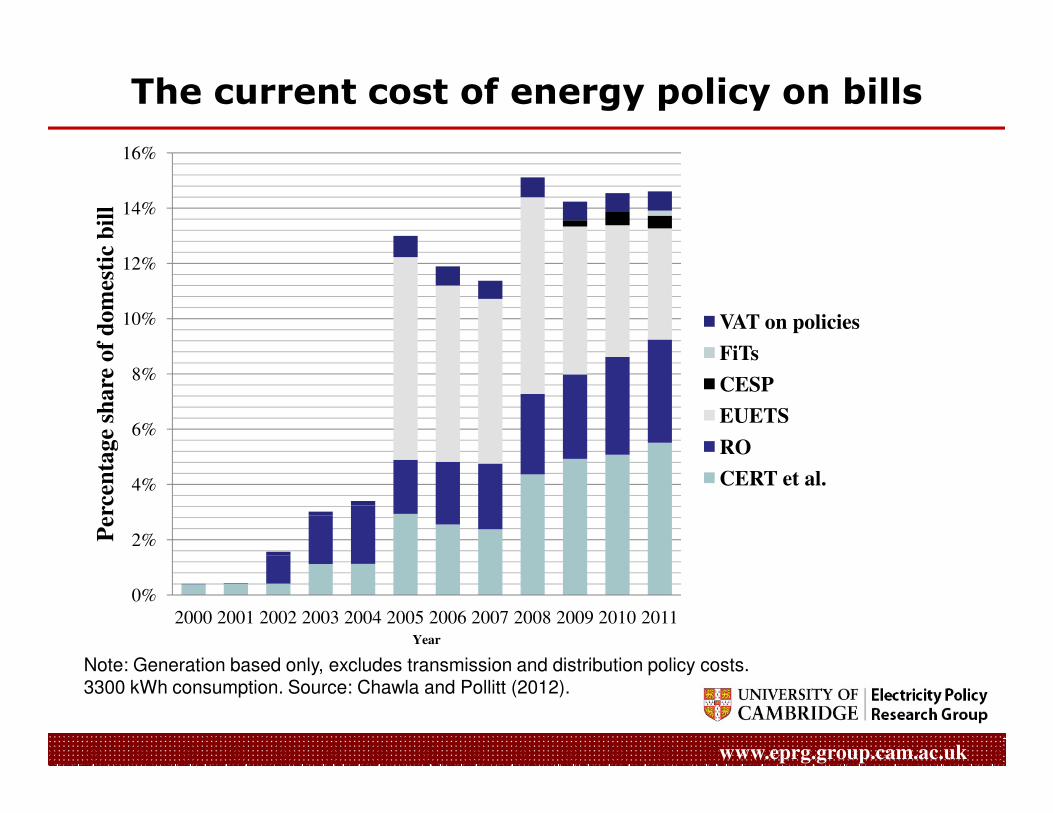
The current cost of energy policy on bills
8%
10%
12%
14%
16%
share
of
dom
esti
c b
ill
VAT on policies
FiTs
CESP
EUETS
www.eprg.group.cam.ac.uk
0%
2%
4%
6%
2000 2001 2002 2003 2004 2005 2006 2007 2008 2009 2010 2011
Per
cen
tage
share
of
dom
esti
c b
ill
Year
EUETS
RO
CERT et al.
Note: Generation based only, excludes transmission and distribution policy costs.3300 kWh consumption. Source: Chawla and Pollitt (2012).
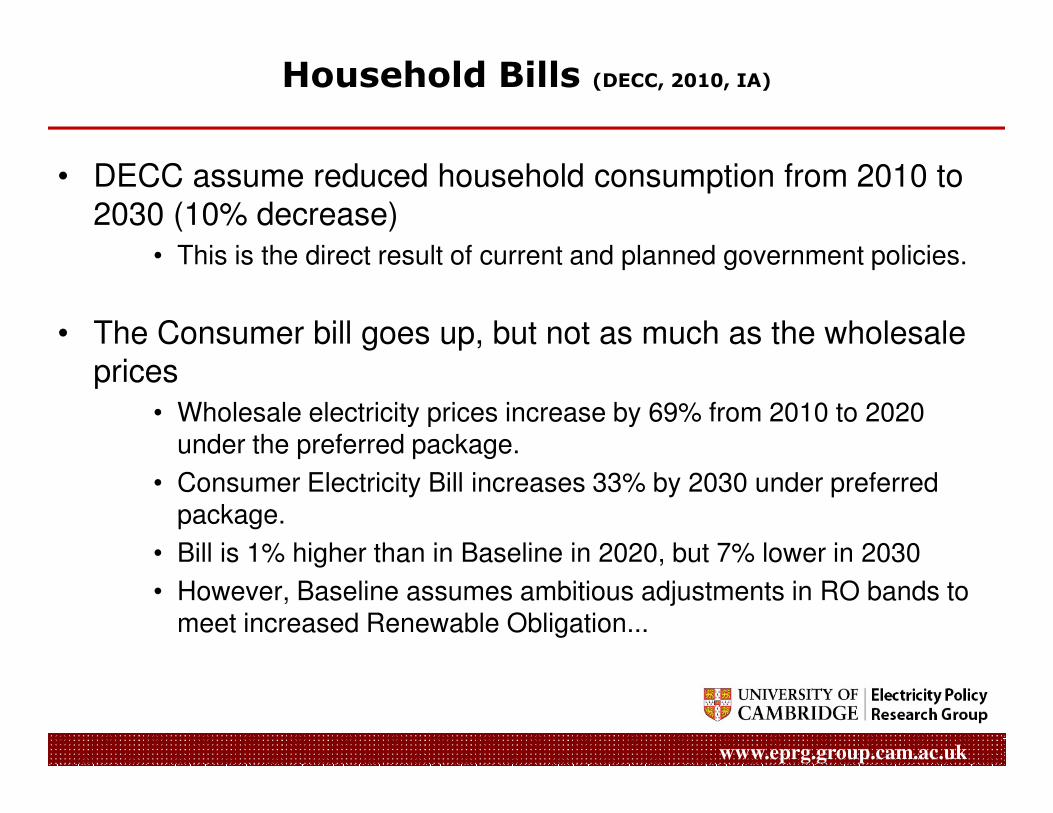
Household Bills (DECC, 2010, IA)
• DECC assume reduced household consumption from 2010 to 2030 (10% decrease)
• This is the direct result of current and planned government policies.
• The Consumer bill goes up, but not as much as the wholesale prices
• Wholesale electricity prices increase by 69% from 2010 to 2020
www.eprg.group.cam.ac.uk
• Wholesale electricity prices increase by 69% from 2010 to 2020 under the preferred package.
• Consumer Electricity Bill increases 33% by 2030 under preferred package.
• Bill is 1% higher than in Baseline in 2020, but 7% lower in 2030
• However, Baseline assumes ambitious adjustments in RO bands to meet increased Renewable Obligation...
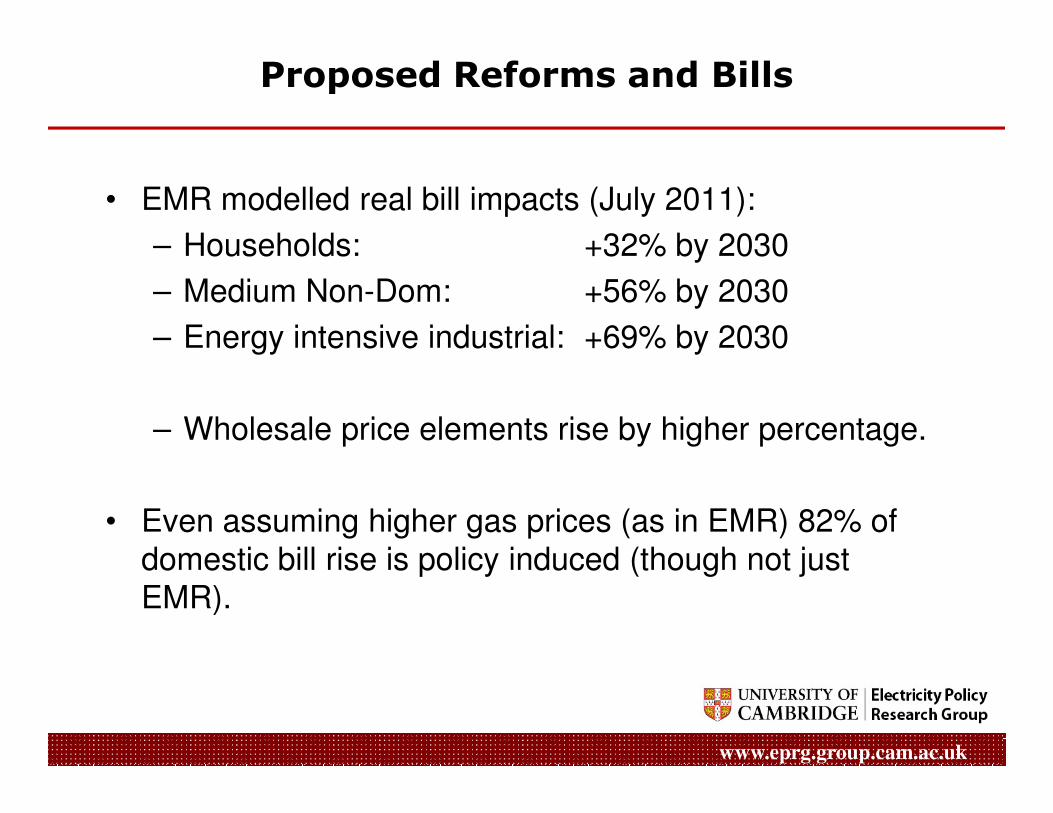
Proposed Reforms and Bills
• EMR modelled real bill impacts (July 2011):
– Households: +32% by 2030
– Medium Non-Dom: +56% by 2030
– Energy intensive industrial: +69% by 2030
www.eprg.group.cam.ac.uk
– Wholesale price elements rise by higher percentage.
• Even assuming higher gas prices (as in EMR) 82% of domestic bill rise is policy induced (though not just EMR).
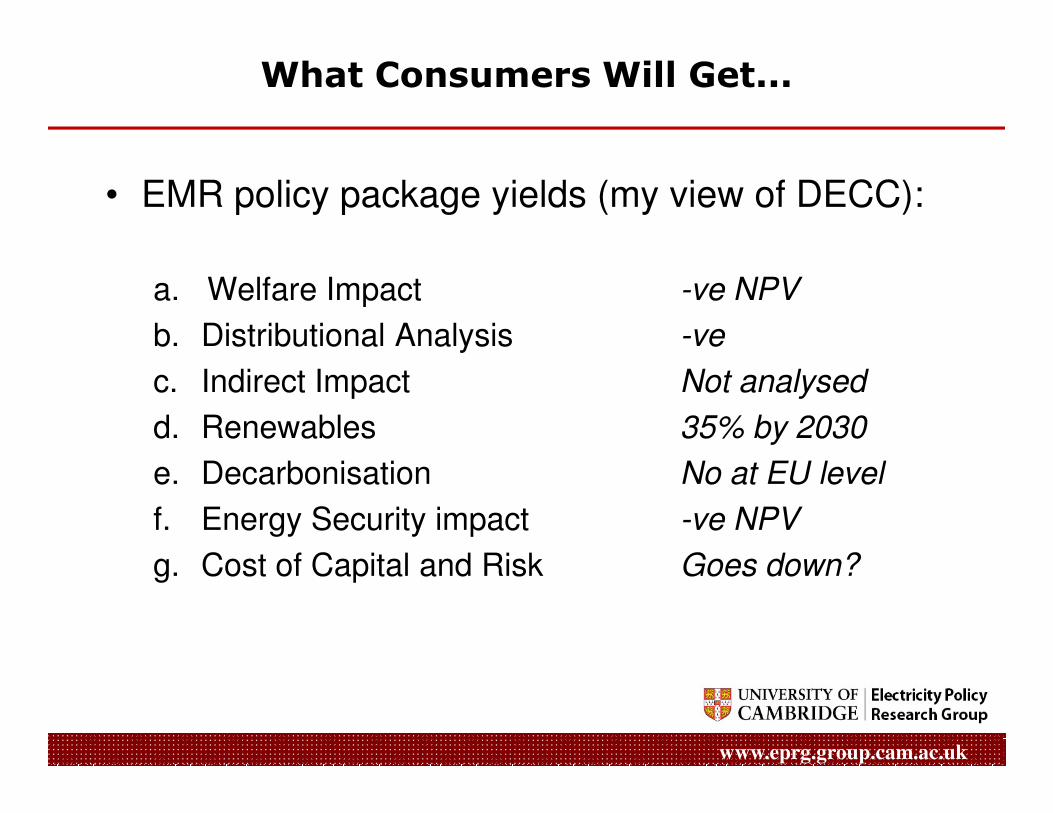
What Consumers Will Get...
• EMR policy package yields (my view of DECC):
a. Welfare Impact -ve NPV
b. Distributional Analysis -ve
c. Indirect Impact Not analysed
www.eprg.group.cam.ac.uk
d. Renewables 35% by 2030
e. Decarbonisation No at EU level
f. Energy Security impact -ve NPV
g. Cost of Capital and Risk Goes down?
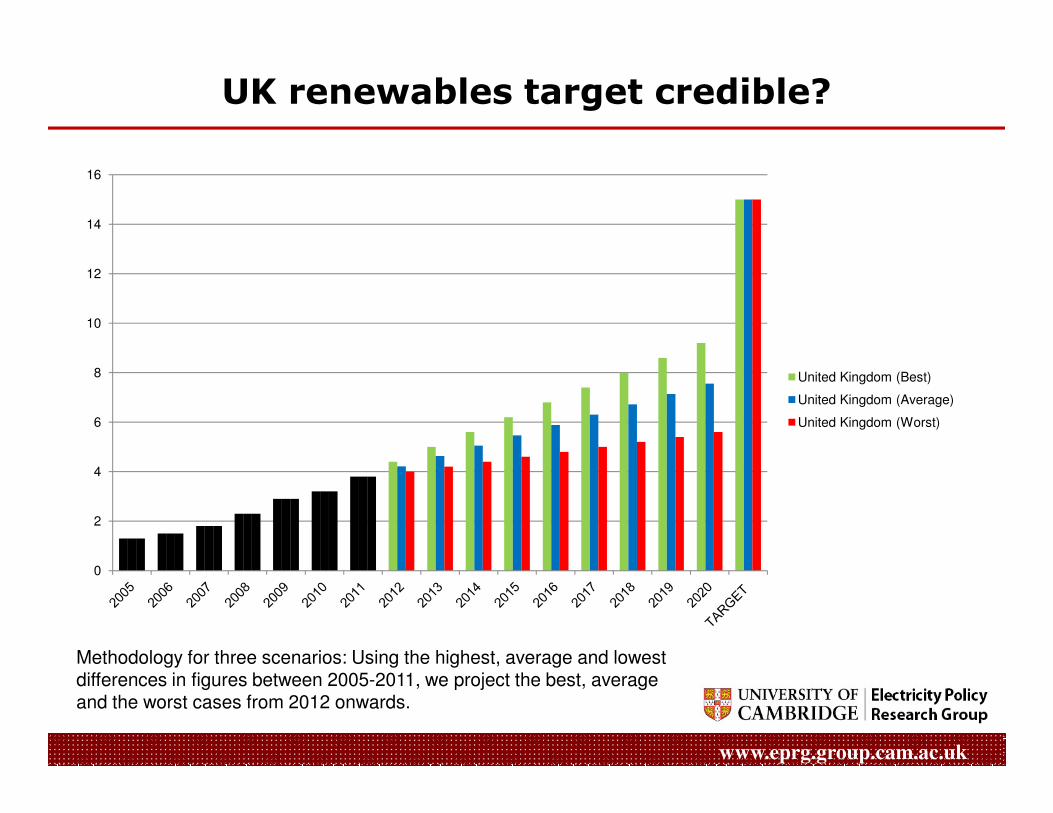
UK renewables target credible?
8
10
12
14
16
United Kingdom (Best)
United Kingdom (Average)
www.eprg.group.cam.ac.uk
Methodology for three scenarios: Using the highest, average and lowest differences in figures between 2005-2011, we project the best, average and the worst cases from 2012 onwards.
0
2
4
6 United Kingdom (Worst)
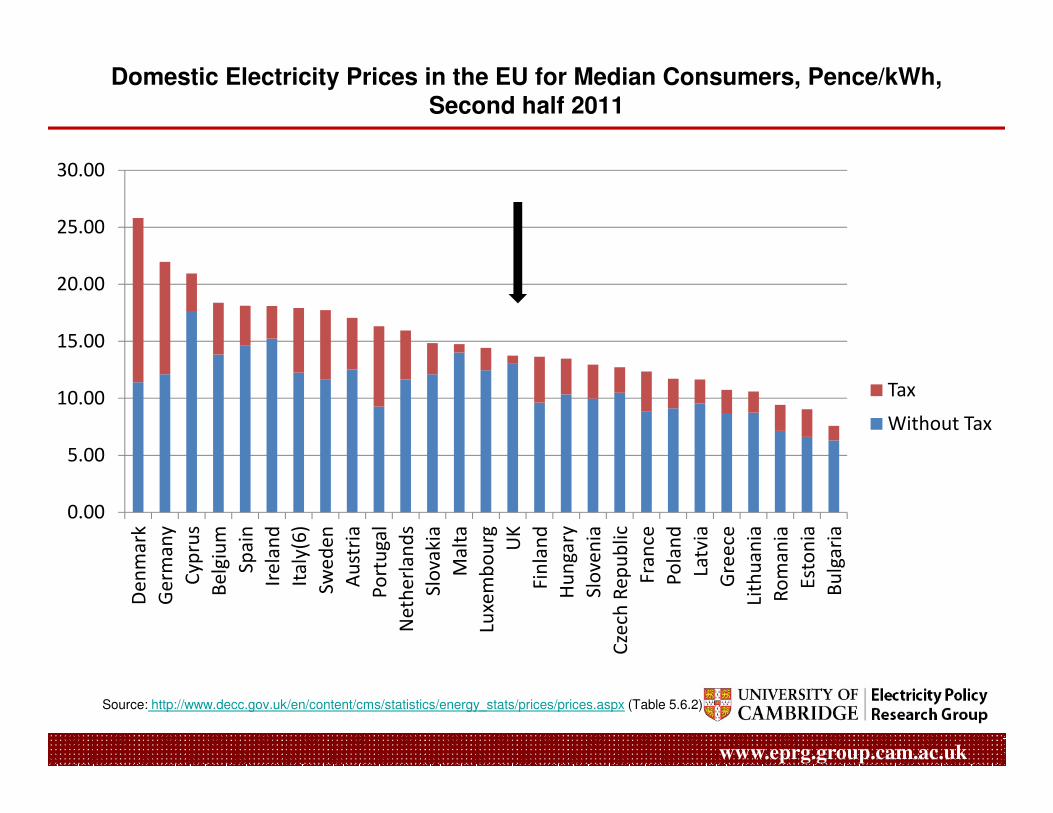
Domestic Electricity Prices in the EU for Median Consumers, Pence/kWh, Second half 2011
10.00
15.00
20.00
25.00
30.00
Tax
www.eprg.group.cam.ac.uk
Source: http://www.decc.gov.uk/en/content/cms/statistics/energy_stats/prices/prices.aspx (Table 5.6.2)
0.00
5.00
10.00
De
nm
ark
Ge
rma
ny
Cyp
rus
Be
lgiu
m
Sp
ain
Ire
lan
d
Ita
ly(6
)
Sw
ed
en
Au
stri
a
Po
rtu
ga
l
Ne
the
rla
nd
s
Slo
vakia
Ma
lta
Luxe
mb
ou
rg UK
Fin
lan
d
Hu
ng
ary
Slo
ven
ia
Cze
ch R
ep
ub
lic
Fra
nce
Po
lan
d
Latv
ia
Gre
ece
Lith
ua
nia
Ro
ma
nia
Est
on
ia
Bu
lga
ria
Without Tax
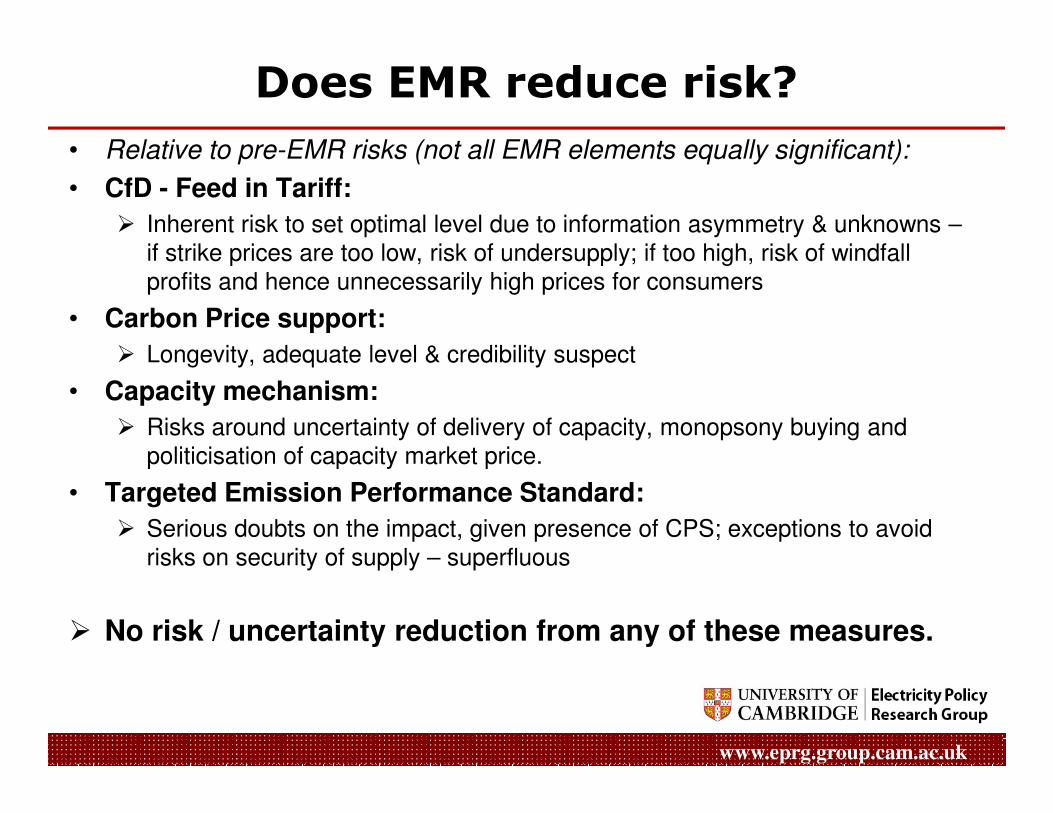
Does EMR reduce risk?
• Relative to pre-EMR risks (not all EMR elements equally significant):
• CfD - Feed in Tariff:
� Inherent risk to set optimal level due to information asymmetry & unknowns –if strike prices are too low, risk of undersupply; if too high, risk of windfall profits and hence unnecessarily high prices for consumers
• Carbon Price support:
� Longevity, adequate level & credibility suspect
• Capacity mechanism:
www.eprg.group.cam.ac.uk
� Risks around uncertainty of delivery of capacity, monopsony buying and politicisation of capacity market price.
• Targeted Emission Performance Standard:
� Serious doubts on the impact, given presence of CPS; exceptions to avoid risks on security of supply – superfluous
� No risk / uncertainty reduction from any of these measures.
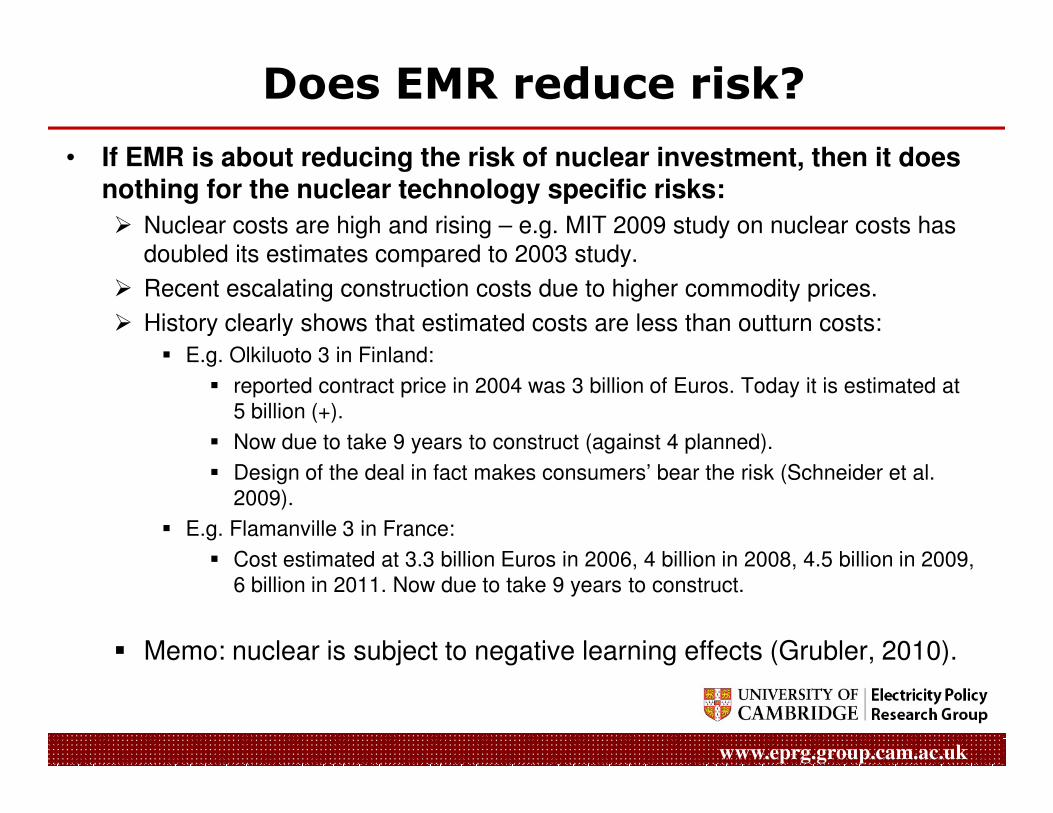
Does EMR reduce risk?
• If EMR is about reducing the risk of nuclear investment, then it does nothing for the nuclear technology specific risks:
� Nuclear costs are high and rising – e.g. MIT 2009 study on nuclear costs has doubled its estimates compared to 2003 study.
� Recent escalating construction costs due to higher commodity prices.
� History clearly shows that estimated costs are less than outturn costs:
� E.g. Olkiluoto 3 in Finland:
� reported contract price in 2004 was 3 billion of Euros. Today it is estimated at 5 billion (+).
www.eprg.group.cam.ac.uk
5 billion (+).
� Now due to take 9 years to construct (against 4 planned).
� Design of the deal in fact makes consumers’ bear the risk (Schneider et al. 2009).
� E.g. Flamanville 3 in France:
� Cost estimated at 3.3 billion Euros in 2006, 4 billion in 2008, 4.5 billion in 2009, 6 billion in 2011. Now due to take 9 years to construct.
� Memo: nuclear is subject to negative learning effects (Grubler, 2010).

Is EMR a model for othercountries to follow?
www.eprg.group.cam.ac.uk
countries to follow?
Combining subsidies and market via EMR
• Policy impacts significant, but largely fail SCBA test:
Bills rise substantially, large welfare transfers to companies, risks transferred to consumers, no impact on global carbon emissions, but more renewables (in UK, but not necessarily elsewhere). Public support for climate change and renewables policy is undermined.
• Policy consistency not addressed for investors:
EMR increases policy complexity, international carbon strategy undermined.
www.eprg.group.cam.ac.uk
EMR increases policy complexity, international carbon strategy undermined. Policy specific risks increased.
• Individual policy design not same as a consistent strategy:
EMR is not a fundamental redesign of the market based on sound economic principles. Two of four elements redundant, some movement towards comprehensive set of carbon taxes, RES support not rationalised, energy security socialised, need for optimal commodity tax policy not addressed, EU and global policies undermined.
Combining subsidies and market via EMRs
• Macro-economic impact of EMR for UK not analysed, but impact on real consumption (rather than GDP) high:
– Headline rise in bills suggests for electricity of 33% of £14.495 bn (households) and 62% of £15.315 bn (non-households) = £14.275 bn of extra energy expenditure
www.eprg.group.cam.ac.uk
(from Dukes 2012, Table 1.4). This is 1% of GDP (some of this is tax and profit transfer).
– Effect on jobs, 225k jobs in energy intensive industry not assessed.
– Long term effect on GDP and consumption per head likely to be negative for no benefit (see Krupnick and McLaughlin, 2011).
Is EMR a model for other countries?
• A key issue is whether national EMRs could be part of a global solution to climate change.
• Only if EMR can replicate the cooperative solution in equilibrium, but the following undermine this:
www.eprg.group.cam.ac.uk
equilibrium, but the following undermine this:
– seams issues – how national policies interact;
– free riding – how is cheating reduced;
– inability to calculate national share of global solution.
Conclusion on EMR
• EMR displays a huge amount of economic illiteracy:
– on the theory of finance
– on the theory of optimal taxation
– on the nature of supply and demand in markets
– on economic instruments for reducing externalities…
• EMR also suffers from a host of practical and implementation problems and has little empirical efficacy basis.
www.eprg.group.cam.ac.uk
problems and has little empirical efficacy basis.
• EMR, if it is ever seriously implemented in the UK, will fail to deliver at reasonable cost.
• The contrast between the UK government’s unwillingness
to accept economic analysis vs. its willingness to accept
climate change science is striking.
If not EMR, then what?
www.eprg.group.cam.ac.uk

Starting principles for new approach
• Impossible Trinity needs to be honestly admitted. Decarbonisation is expensive even if we keep costs to a minimum (Stern Review was wrong to imply it was cheap!).
• Some combination of higher prices and higher taxes necessary to decarbonise and have lots of renewables.
• Cost is important: we already spend c.0.3% of GDP on environmental/efficiency measures for electricity and gas and we have just
www.eprg.group.cam.ac.uk
environmental/efficiency measures for electricity and gas and we have just started!
• We need to abandon our current renewable energy target if we are to preserve our 80% CO2 target.
• The EUETS has to be at the centre of UK decarbonisation strategy for now, with tightening of cap and widening of sectors covered priorities.
• Properly functioning market mechanisms, not government planning must be allowed to drive delivery.
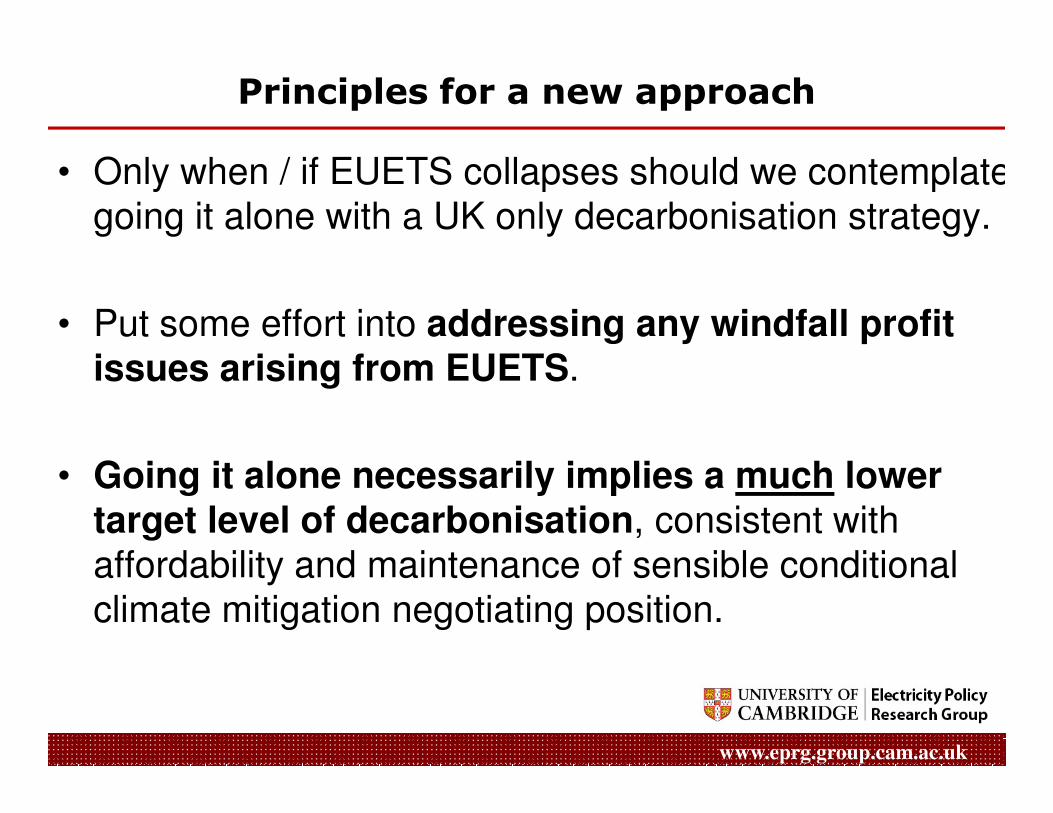
Principles for a new approach
• Only when / if EUETS collapses should we contemplate going it alone with a UK only decarbonisation strategy.
• Put some effort into addressing any windfall profit issues arising from EUETS.
www.eprg.group.cam.ac.uk
• Going it alone necessarily implies a much lower target level of decarbonisation, consistent with affordability and maintenance of sensible conditional climate mitigation negotiating position.
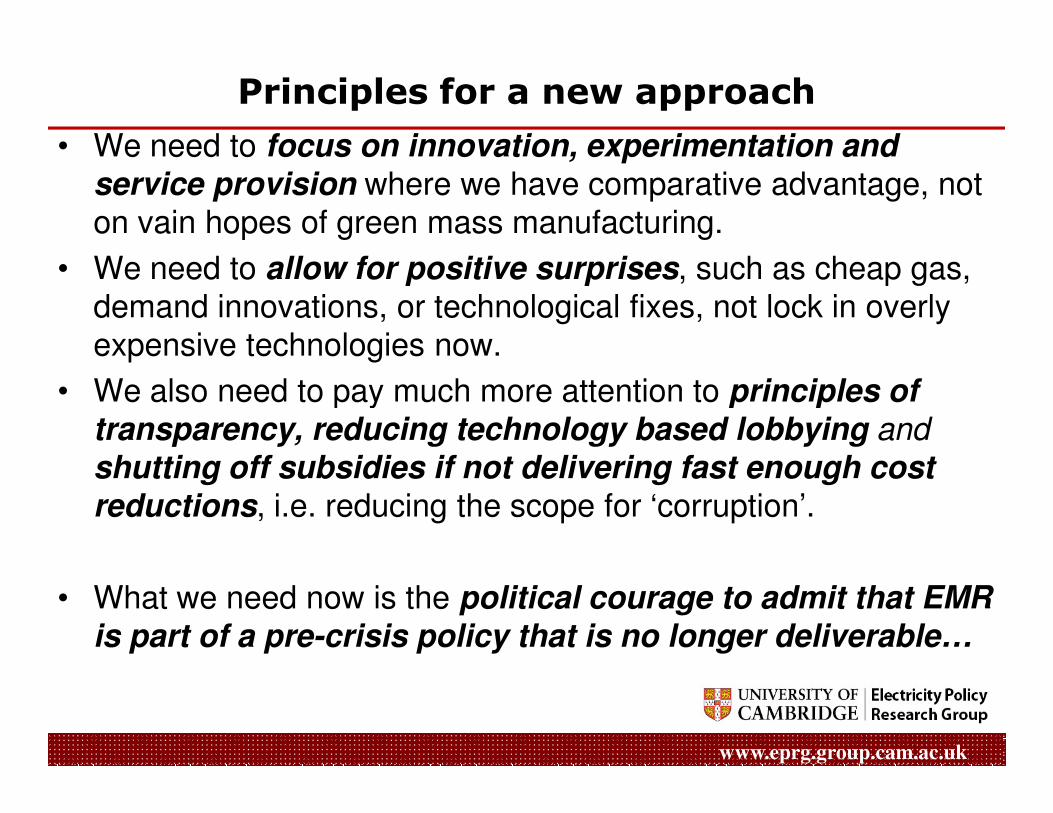
Principles for a new approach
• We need to focus on innovation, experimentation and
service provision where we have comparative advantage, not on vain hopes of green mass manufacturing.
• We need to allow for positive surprises, such as cheap gas, demand innovations, or technological fixes, not lock in overly expensive technologies now.
• We also need to pay much more attention to principles of
www.eprg.group.cam.ac.uk
• We also need to pay much more attention to principles of
transparency, reducing technology based lobbying and
shutting off subsidies if not delivering fast enough cost
reductions, i.e. reducing the scope for ‘corruption’.
• What we need now is the political courage to admit that EMR
is part of a pre-crisis policy that is no longer deliverable…
Selected References
• Allen, R.C. (2009), The British Industrial Revolution in Global Perspective, Cambridge: Cambridge University Press.
• BIS (2012), Low Carbon Environmental Goods and Services, Report for 2010/11, Commissioned from KMatrix, May 2012, London: BIS.
• Chawla, M. and Pollitt, M. (2012), Energy-efficiency and environmental policies & income supplements in the UK: Their evolution and distributional impact in relation to
domestic energy bills, EPRG Working Paper, forthcoming.
• Constable, J. (2011), The Green Mirage: Why a Low-carbon Economy May be Further Off Than We Think, London: Civitas.
• DECC (2010) Electricity Market Reform: Impact Assessment. London, Department of Energy and Climate Change.
• DECC (2010a) Electricity Market Reform: Consultation Document. London, Department of Energy and Climate Change.
• DECC (2010b) Estimated impacts of energy and climate change policies on energy prices and bills. London, Department of Energy and Climate Change.
• DECC (2011a) Electricity Market Reform: Impact Assessment. London: Department of Energy and Climate Change.
• DECC (2011b) Planning our electric future: a White Paper for secure, affordable and low-carbon Electricity, London: DECC.
• Diamond, P. and Mirrlees, J. (1971), ‘Optimal Taxation and Public Production I: Production Efficiency’, American Economic Review, 61 (1): 8-27.
• Grubb, M., Jamasb, T. and Pollitt, M. (eds.), Delivery a low-carbon electricity system, Cambridge: Cambridge University Press.
• Grubler, A. (2010) ‘The costs of the French nuclear scale up: a case of negative learning by doing’, Energy Policy, 38 (9): 5174-5188.
• Hughes, G. (2011), The Myth of Green Jobs, GWPF No.3, London: Global Warming Policy Foundation.
• Kilian, L. (2006), Exogenous Oil Supply Shocks: How Big Are They and How Much Do They Matter for the U.S. Economy?, mimeo.
www.eprg.group.cam.ac.uk
• Krupnick, A.J. and McLaughlin, D. (2011), GDP, Consumption, Jobs, and Costs: Tracking the Effects of Energy Policy, Resources for the Future, Issue Brief, 11-08.
• Lange, R.J. (2010), Optimal support for renewable deployment: A case study in German photovoltaic, Presentation at EPRG Spring Seminar, May 14th, http://www.eprg.group.cam.ac.uk/wp-content/uploads/2010/05/Lange.pdf
• MIT (2003), The Future of Nuclear Power – An interdisciplinary MIT study, Cambridge MA: MIT.
• MIT (2009), Update of the 2003 Future Future of Nuclear Power – An interdisciplinary MIT study, Cambridge, MA: MIT.
• Noel, P. and Pollitt, M. (2010), ‘Don’t Lose Power’, Parliamentary Brief, Vol.12, Issue 11, pp.6-8.
• OECD (2011), OECD Economic Surveys: United Kingdom 2011, Paris, OECD Publishing.
• Ofgem (2012), Electricity Capacity Assessment, London: Ofgem.
• Platchkov, L., Pollitt, M. and I. Shaorshadze (2011), The implications of recent UK energy policy for the consumer: a report for the Consumers’ Association, Available at: http://www.eprg.group.cam.ac.uk/wp-content/uploads/2011/05/ReportforCAFinal100511EPRG.pdf
• Pollitt, M. (2010), UK Renewable Energy Policy since 1990, EPRG Working Paper No.1002.
• Pollitt, M. (2011), ‘Thumbs up? A little early for that Mr Hulne’, Parliamentary Brief, http://www.parliamentarybrief.com/2011/01/thumbs-up-a-little-early-for-that-mr-huhne#all
• Stern, N. (2007), The Economics of Climate Change, Cambridge: Cambridge University Press
• Latest EMR information from DECC is available at:
http://www.decc.gov.uk/en/content/cms/meeting_energy/markets/electricity/electricity.aspx
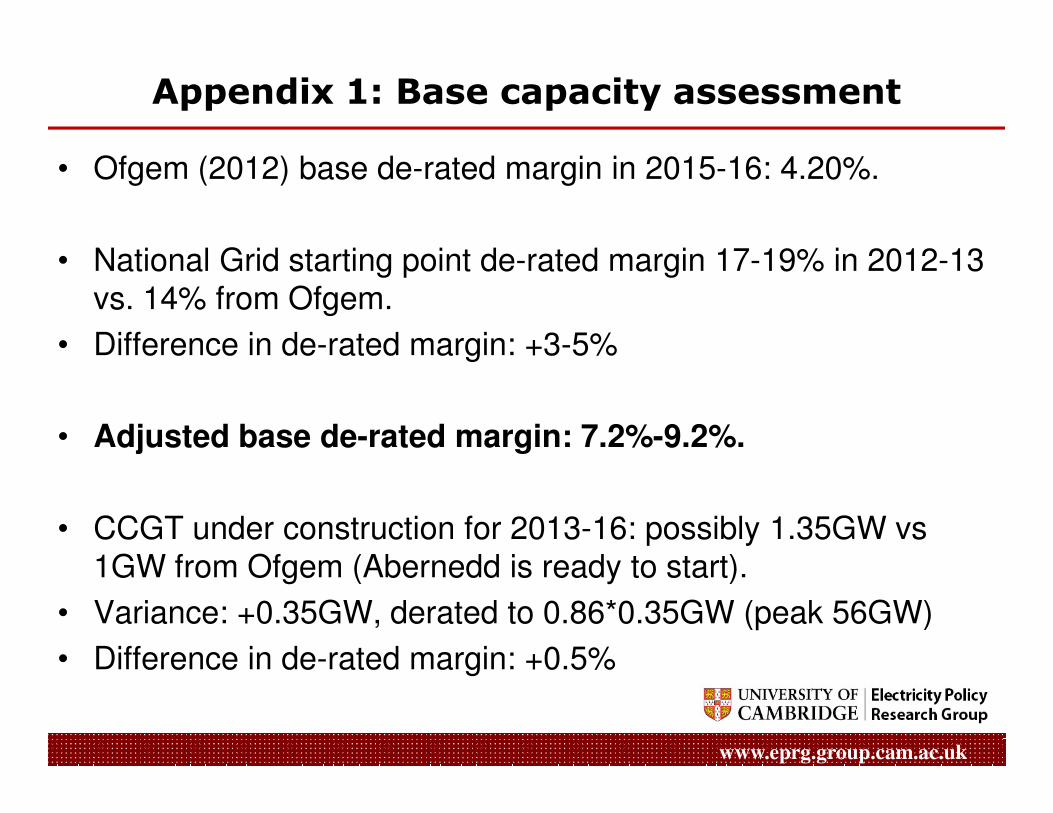
Appendix 1: Base capacity assessment
• Ofgem (2012) base de-rated margin in 2015-16: 4.20%.
• National Grid starting point de-rated margin 17-19% in 2012-13 vs. 14% from Ofgem.
• Difference in de-rated margin: +3-5%
www.eprg.group.cam.ac.uk
• Adjusted base de-rated margin: 7.2%-9.2%.
• CCGT under construction for 2013-16: possibly 1.35GW vs1GW from Ofgem (Abernedd is ready to start).
• Variance: +0.35GW, derated to 0.86*0.35GW (peak 56GW)
• Difference in de-rated margin: +0.5%
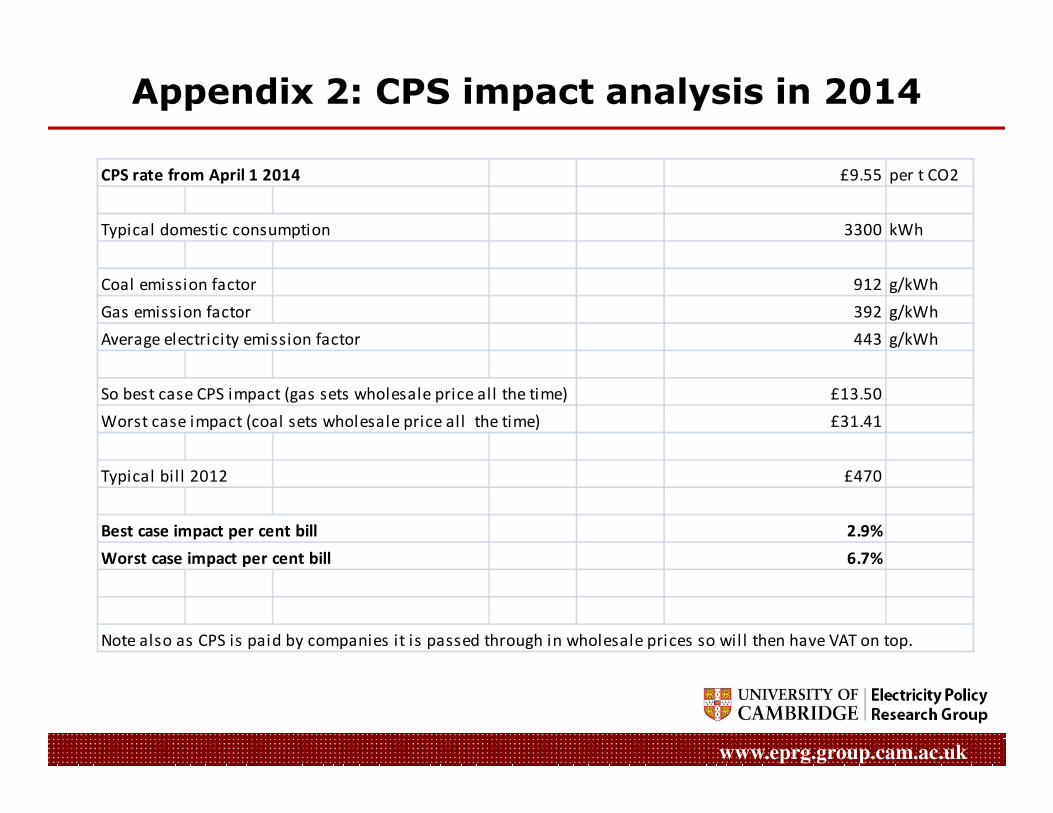
Appendix 2: CPS impact analysis in 2014
CPS rate from April 1 2014 £9.55 per t CO2
Typical domestic consumption 3300 kWh
Coal emission factor 912 g/kWh
Gas emission factor 392 g/kWh
Average electricity emission factor 443 g/kWh
So best case CPS impact (gas sets wholesale price all the time) £13.50
www.eprg.group.cam.ac.uk
Worst case impact (coal sets wholesale price all the time) £31.41
Typical bil l 2012 £470
Best case impact per cent bill 2.9%
Worst case impact per cent bill 6.7%
Note also as CPS is paid by companies it is passed through in wholesale prices so wil l then have VAT on top.
Appendix 3: Capacity markets and monopsony
• See: http://energy.aol.com/2011/12/19/pjm-capacity-market-faces-uprising/
• Both New Jersey and Maryland have tried to defy FERC and build state supported new generation (2000
www.eprg.group.cam.ac.uk
FERC and build state supported new generation (2000 MW in NJ and up to 1500 MW in Maryland) in constrained zones of the PJM market in order to reduce consumer capacity payments.
• FERC has opposed this on the grounds that this will have market wide impact on the price in the capacity market and therefore is a form of monopsony.

Appendix 4: Price impact of EMR (July 2011)
• Key issue is what is BAU? Need to look at EMR Fossil Fuel Assumptions impact on today’s energy mix.
• Assume: Coal cost: £70 per tonne *40m tonnes =£2800m; Gas cost: £0.6 per therm /29.3 KWh per therm * 342,000m KWh = £5889m. Actual costs for coal appear to be higher and gas lower.
• If coal falls to £50 per tonne and gas rises to £0.761 per therm then total fuel cost rise is £1089m if households take 37.4% of this, then cost per household (25m households) should be an extra £16.30 per household at constant consumption. This is a baseline for the absence of climate/renewable policy. This ignores market modelling (+ve or –ve) and household demand reduction (-ve).
www.eprg.group.cam.ac.uk
market modelling (+ve or –ve) and household demand reduction (-ve).
• Even assuming wholesale prices rise by 27% (the rise in the gas price) and demand falls by 10%, the wholesale component of the household bill (assumed to be £190 in 2010) would only rise by £26.90. This is an upper end of (a moderately EMR consistent) BAU.
• Under the EMR central case rise bills (2009 prices) with energy saving is £485 to £642 from 2010 to 2030 (32%). Thus 82-100+% of this can be taken to be policy induced (mostly EMR, though some from RO and network costs)
• Worth pointing out that 2012 price of gas at 65p therm is below the central base price (of 60p) in 2009 money.
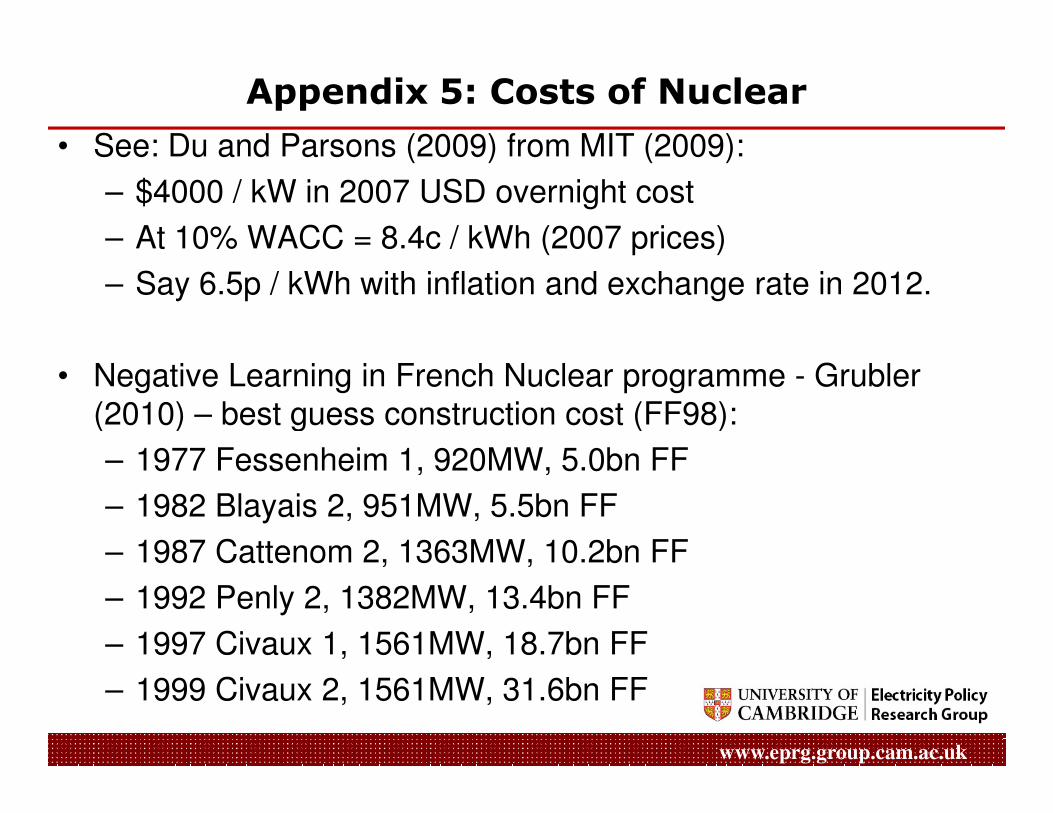
Appendix 5: Costs of Nuclear
• See: Du and Parsons (2009) from MIT (2009):
– $4000 / kW in 2007 USD overnight cost
– At 10% WACC = 8.4c / kWh (2007 prices)
– Say 6.5p / kWh with inflation and exchange rate in 2012.
• Negative Learning in French Nuclear programme - Grubler(2010) – best guess construction cost (FF98):
www.eprg.group.cam.ac.uk
(2010) – best guess construction cost (FF98):
– 1977 Fessenheim 1, 920MW, 5.0bn FF
– 1982 Blayais 2, 951MW, 5.5bn FF
– 1987 Cattenom 2, 1363MW, 10.2bn FF
– 1992 Penly 2, 1382MW, 13.4bn FF
– 1997 Civaux 1, 1561MW, 18.7bn FF
– 1999 Civaux 2, 1561MW, 31.6bn FF
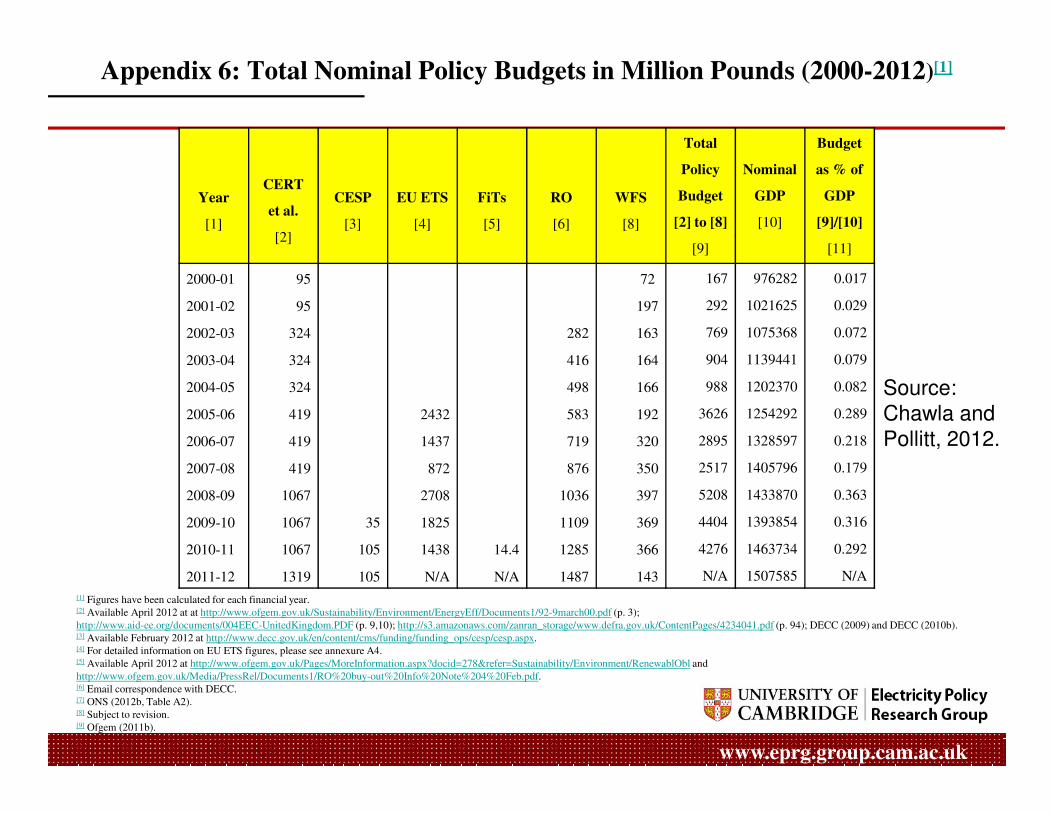
Appendix 6: Total Nominal Policy Budgets in Million Pounds (2000-2012)[1]
Year
[1]
CERT
et al.
[2]
CESP
[3]
EU ETS
[4]
FiTs
[5]
RO
[6]
WFS
[8]
Total
Policy
Budget
[2] to [8]
[9]
Nominal
GDP
[10]
Budget
as % of
GDP
[9]/[10]
[11]
2000-01 95 72 167 976282 0.017
2001-02 95 197 292 1021625 0.029
2002-03 324 282 163 769 1075368 0.072
2003-04 324 416 164 904 1139441 0.079
2004-05 324 498 166 988 1202370 0.082
2005-06 419 2432 583 192 3626 1254292 0.289
Source:Chawla and
www.eprg.group.cam.ac.uk
2005-06 419 2432 583 192 3626 1254292 0.289
2006-07 419 1437 719 320 2895 1328597 0.218
2007-08 419 872 876 350 2517 1405796 0.179
2008-09 1067 2708 1036 397 5208 1433870 0.363
2009-10 1067 35 1825 1109 369 4404 1393854 0.316
2010-11 1067 105 1438 14.4 1285 366 4276 1463734 0.292
2011-12 1319 105 N/A N/A 1487 143 N/A 1507585 N/A
[1] Figures have been calculated for each financial year.[2] Available April 2012 at at http://www.ofgem.gov.uk/Sustainability/Environment/EnergyEff/Documents1/92-9march00.pdf (p. 3);
http://www.aid-ee.org/documents/004EEC-UnitedKingdom.PDF (p. 9,10); http://s3.amazonaws.com/zanran_storage/www.defra.gov.uk/ContentPages/4234041.pdf (p. 94); DECC (2009) and DECC (2010b). [3] Available February 2012 at http://www.decc.gov.uk/en/content/cms/funding/funding_ops/cesp/cesp.aspx.[4] For detailed information on EU ETS figures, please see annexure A4.[5] Available April 2012 at http://www.ofgem.gov.uk/Pages/MoreInformation.aspx?docid=278&refer=Sustainability/Environment/RenewablObl and
http://www.ofgem.gov.uk/Media/PressRel/Documents1/RO%20buy-out%20Info%20Note%204%20Feb.pdf. [6] Email correspondence with DECC.[7] ONS (2012b, Table A2). [8] Subject to revision. [9] Ofgem (2011b).
Chawla andPollitt, 2012.