Embed Size (px)
Citation preview
ELECTRICITY MARKET DESIGN: Market Models for Coordination and Pricing
William W. Hogan
Mossavar-Rahmani Center for Business and Government John F. Kennedy School of Government
Harvard University Cambridge, Massachusetts 02138
Energy Information Administration Washington, DC
April 8, 2008
1
ELECTRICITY MARKET Electricity Restructuring
The case of electricity restructuring presents examples of fundamental problems that challenge regulation of markets.
• Marriage of Engineering and Economics. o Loop Flow. o Reliability Requirements. o Incentives and Equilibrium.
• Devilish Details.
o Retail and Wholesale Electricity Systems. o Market Power Mitigation. o Coordination for Competition.
• Jurisdictional Disputes.
o US State vs. Federal Regulators. o European Subsidiarity Principle.
2
ELECTRICITY MARKET Energy Market Pricing Consider three cases of interest that present difficult challenges for regulators. A focus on pricing illustrates an important thread of modeling and analysis. Constrained optimization provides a central organizing framework.
• Design Framework: “Locational Marginal Pricing” LMP. Bid-based, security constrained economic dispatch.
• Design Implementation: Scarcity Pricing
Better scarcity pricing to support resource adequacy.
• Design Limitation: Uplift Payments Unit commitment and lumpy decisions. Coordination and bid guarantees.
3
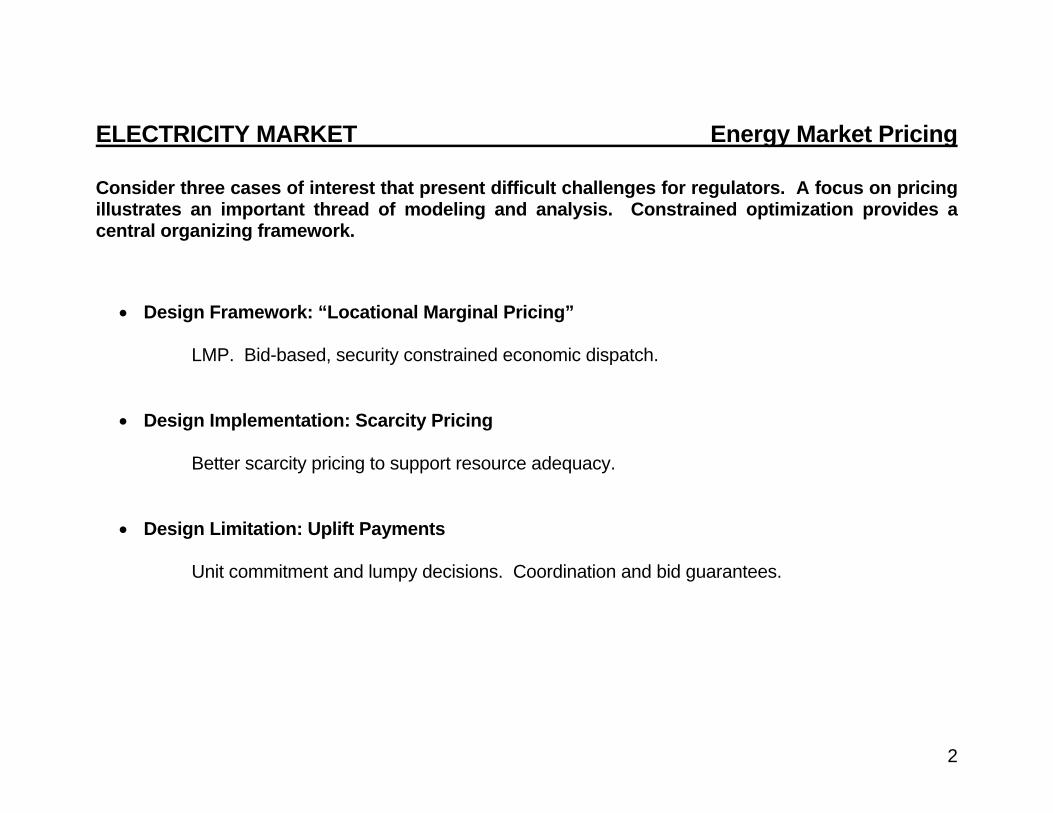
ELECTRICITY MARKET Transmission Management Defining and managing transmission usage is a principal challenge in electricity markets.
Contract Path Flow-Based Paths Point-to-Point
Contract Path Fiction Parallel Flows Flows Implicit
Transmission Capacity Definitions
OASIS Schedulesand TLR
Flowgate RightsFGRs
Financial TransmissionRightsFTRs
4
ELECTRICITY MARKET Order 888 and the Contract Path Under Order 888 the FERC made a crucial choice regarding a central complication of the electricity system.
“A contract path is simply a path that can be designated to form a single continuous electrical path between the parties to an agreement. Because of the laws of physics, it is unlikely that the actual power flow will follow that contract path. … Flow-based pricing or contracting would be designed to account for the actual power flows on a transmission system. It would take into account the "unscheduled flows" that occur under a contract path regime.” (FERC, Order 888, April 24, 1996, footnotes 184-185, p. 93.)
Why is this important? A quick tutorial follows.
5
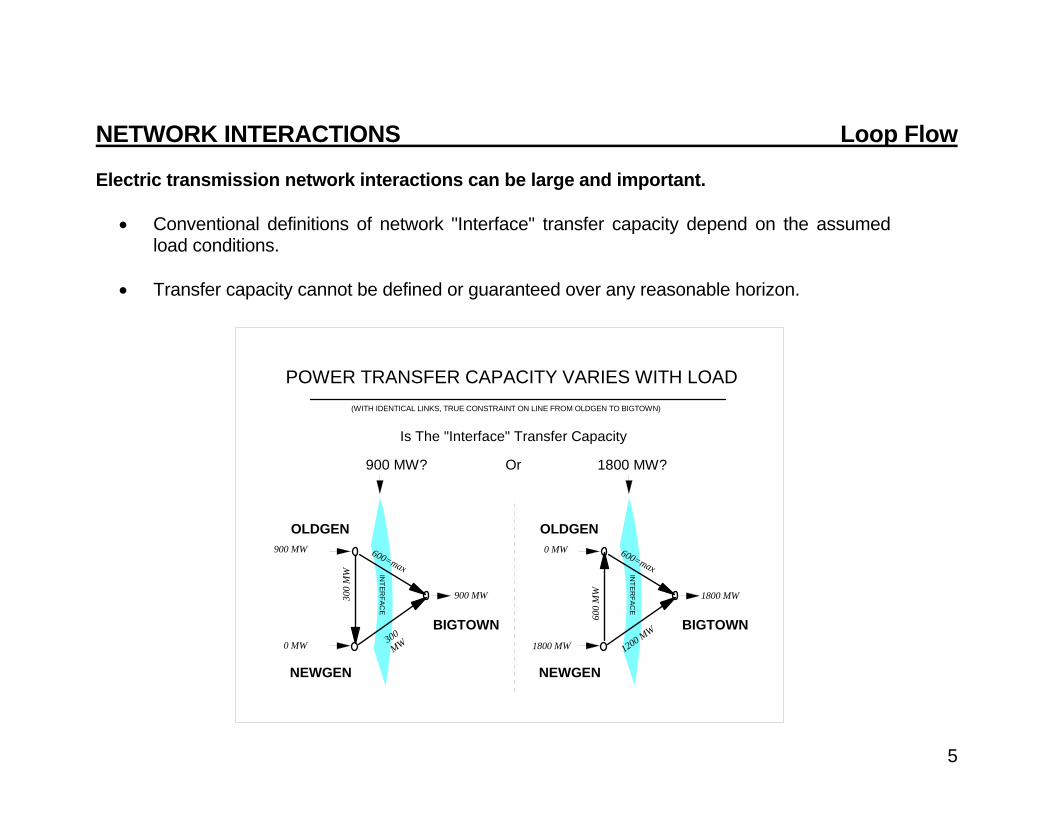
NETWORK INTERACTIONS Loop Flow Electric transmission network interactions can be large and important.
• Conventional definitions of network "Interface" transfer capacity depend on the assumed load conditions.
• Transfer capacity cannot be defined or guaranteed over any reasonable horizon.
OLDGEN
BIGTOWN
NEWGEN
300
MW
600=max
0 MW
900 MW
900 MW
POWER TRANSFER CAPACITY VARIES WITH LOAD(WITH IDENTICAL LINKS, TRUE CONSTRAINT ON LINE FROM OLDGEN TO BIGTOWN)
300
MW
900 MW? Or 1800 MW?
Is The "Interface" Transfer Capacity
OLDGEN
BIGTOWN
NEWGEN
600
MW
600=max
1800 MW
1800 MW
0 MW
1200 MW
INTER
FACE
INTER
FACE
6
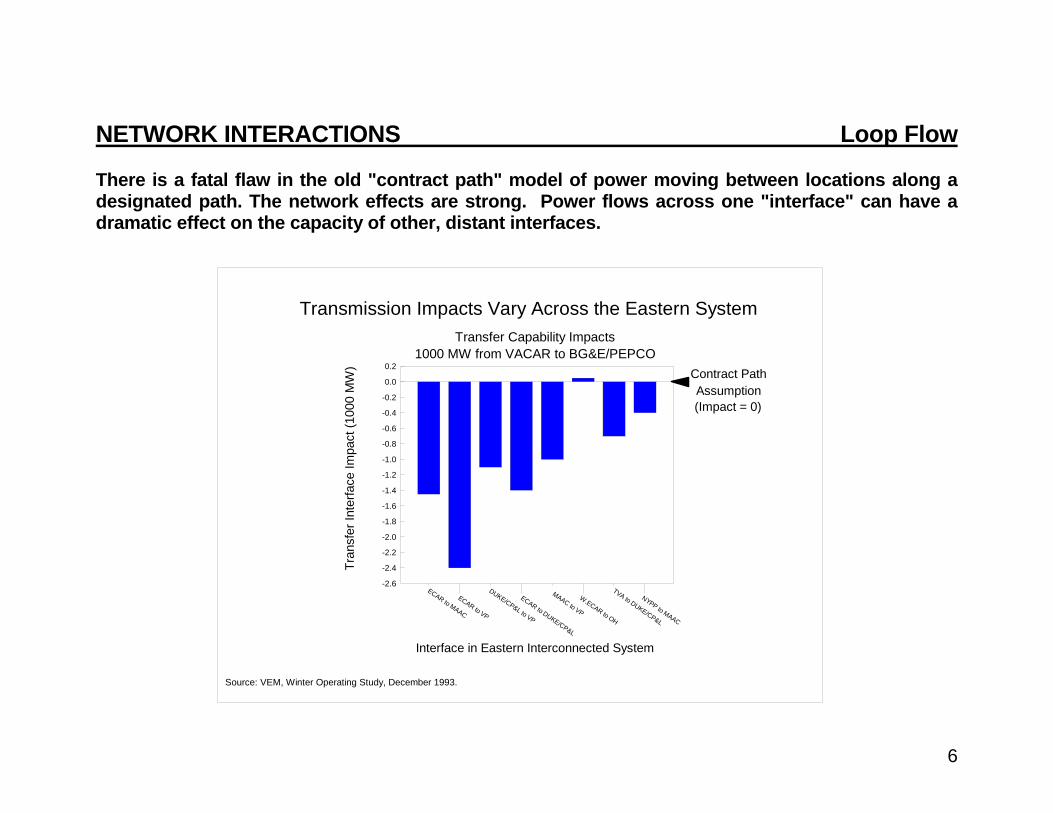
NETWORK INTERACTIONS Loop Flow There is a fatal flaw in the old "contract path" model of power moving between locations along a designated path. The network effects are strong. Power flows across one "interface" can have a dramatic effect on the capacity of other, distant interfaces.
Transfer Capability Impacts1000 MW from VACAR to BG&E/PEPCO
Tran
sfer
Inte
rface
Impa
ct (1
000
MW
)
ECAR to MAAC
ECAR to VP
DUKE/CP&L to VP
ECAR to DUKE/CP&L
MAAC to VP
W.ECAR to OH
TVA to DUKE/CP&L
NYPP to MAAC
0.2
0.0
-0.2
-0.4
-0.6
-0.8
-1.0
-1.2
-1.4
-1.6
-1.8
-2.0
-2.2
-2.4
-2.6
Transmission Impacts Vary Across the Eastern System
Interface in Eastern Interconnected System
Source: VEM, Winter Operating Study, December 1993.
Contract PathAssumption(Impact = 0)
7
ELECTRICITY MARKET Order 888 and the Contract Path Under Order 888 the FERC made a crucial choice regarding a central complication of the electricity system.
“A contract path is simply a path that can be designated to form a single continuous electrical path between the parties to an agreement. Because of the laws of physics, it is unlikely that the actual power flow will follow that contract path. … Flow-based pricing or contracting would be designed to account for the actual power flows on a transmission system. It would take into account the "unscheduled flows" that occur under a contract path regime.” (FERC, Order 888, April 24, 1996, footnotes 184-185, p. 93.) “We will not, at this time, require that flow-based pricing and contracting be used in the electric industry. In reaching this conclusion, we recognize that there may be difficulties in using a traditional contract path approach in a non-discriminatory open access transmission environment, as described by Hogan and others. At the same time, however, contract path pricing and contracting is the longstanding approach used in the electric industry and it is the approach familiar to all participants in the industry. To require now a dramatic overhaul of the traditional approach such as a shift to some form of flow-based pricing and contracting could severely slow, if not derail for some time, the move to open access and more competitive wholesale bulk power markets. In addition, we believe it is premature for the Commission to impose generically a new pricing regime without the benefit of any experience with such pricing. We welcome new and innovative proposals, but we will not impose them in this Rule.” (FERC, Order 888, April 24, 1996, p. 96.)
Hence, although the fictional contract path approach would not work in theory, maintaining the fiction would be less disruptive in moving quickly to open access and an expanded competitive market!
8
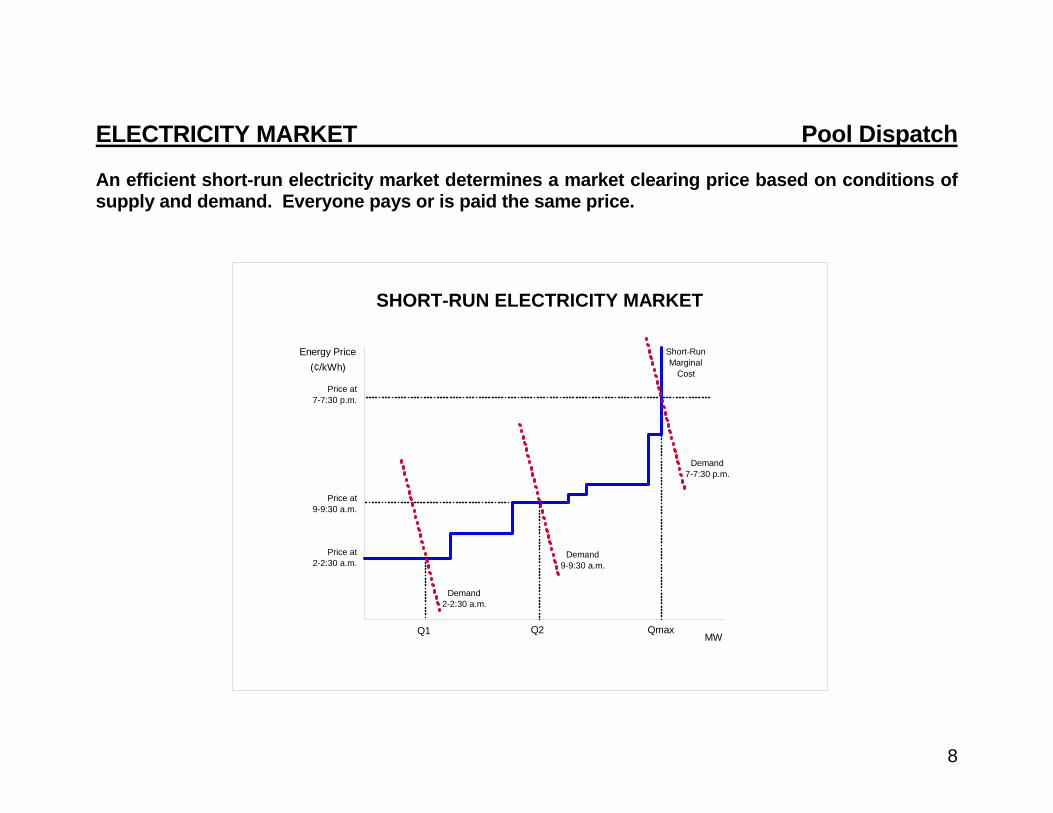
ELECTRICITY MARKET Pool Dispatch An efficient short-run electricity market determines a market clearing price based on conditions of supply and demand. Everyone pays or is paid the same price.
MW
Energy Price(¢/kWh)
Q1 Q2 Qmax
Demand2-2:30 a.m.
Demand9-9:30 a.m.
Demand7-7:30 p.m.
Short-RunMarginal
Cost
Price at7-7:30 p.m.
Price at9-9:30 a.m.
Price at2-2:30 a.m.
SHORT-RUN ELECTRICITY MARKET
9
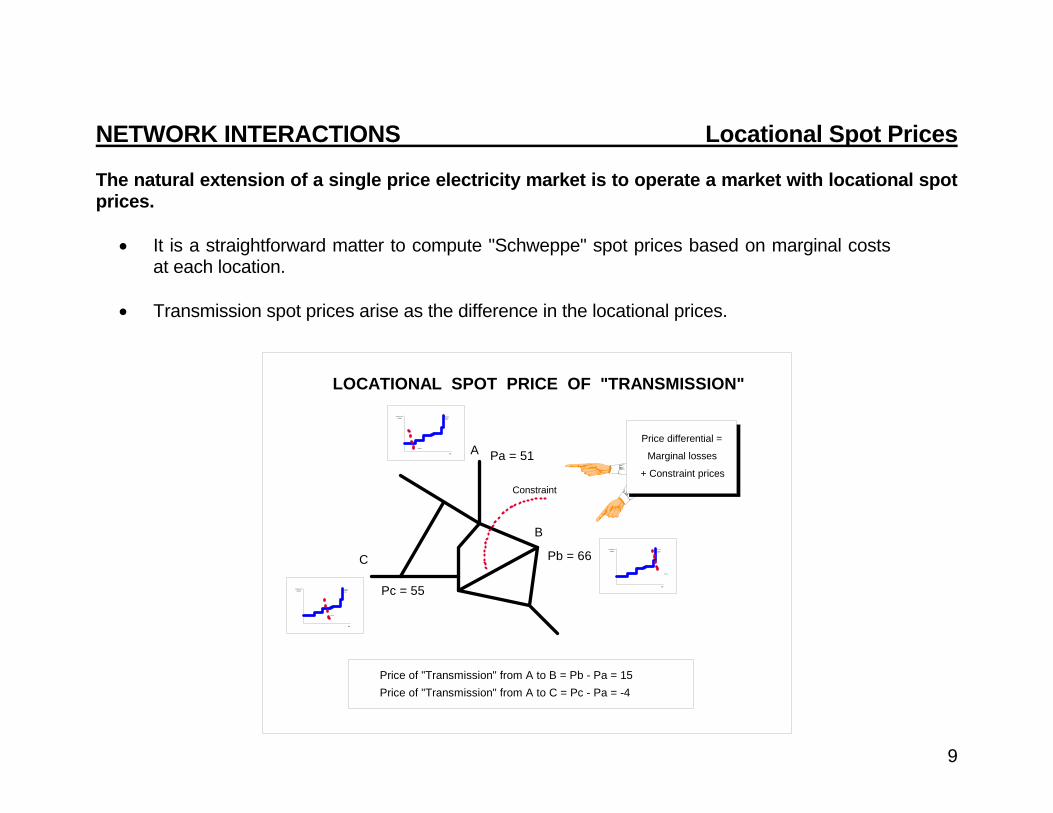
NETWORK INTERACTIONS Locational Spot Prices The natural extension of a single price electricity market is to operate a market with locational spot prices.
• It is a straightforward matter to compute "Schweppe" spot prices based on marginal costs
at each location.
• Transmission spot prices arise as the difference in the locational prices.
LOCATIONAL SPOT PRICE OF "TRANSMISSION"
Pa = 51
Pc = 55
Pb = 66
Price of "Transmission" from A to B = Pb - Pa = 15Price of "Transmission" from A to C = Pc - Pa = -4
Price differential =
Marginal losses
+ Constraint prices
A
C
B
MW
Energy Price(¢/kWh)
Demand
Short-RunMarginal
Cost
MW
Energy Price(¢/kWh)
Demand
Short-RunMarginalCost
MW
Energy Price(¢/kWh)
Demand
Short-RunMarginalCost
Constraint
10
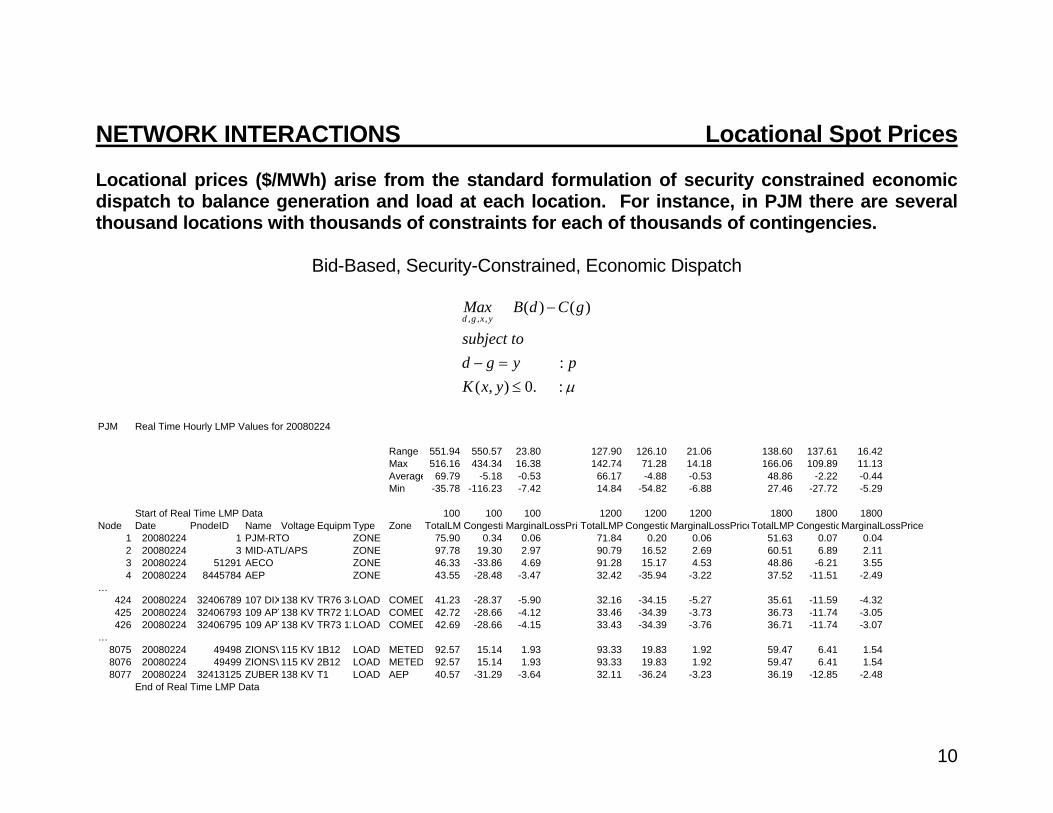
NETWORK INTERACTIONS Locational Spot Prices Locational prices ($/MWh) arise from the standard formulation of security constrained economic dispatch to balance generation and load at each location. For instance, in PJM there are several thousand locations with thousands of constraints for each of thousands of contingencies.
Bid-Based, Security-Constrained, Economic Dispatch
, , ,( ) ( )
:( , ) 0. :
d g x yMax B d C g
subject tod g y pK x y μ
−
− =≤
PJM Real Time Hourly LMP Values for 20080224
Range 551.94 550.57 23.80 127.90 126.10 21.06 138.60 137.61 16.42Max 516.16 434.34 16.38 142.74 71.28 14.18 166.06 109.89 11.13Average 69.79 -5.18 -0.53 66.17 -4.88 -0.53 48.86 -2.22 -0.44Min -35.78 -116.23 -7.42 14.84 -54.82 -6.88 27.46 -27.72 -5.29
Start of Real Time LMP Data 100 100 100 1200 1200 1200 1800 1800 1800Node Date PnodeID Name Voltage Equipm Type Zone TotalLM CongestioMarginalLossPricTotalLMP CongestioMarginalLossPriceTotalLMP CongestioMarginalLossPrice
1 20080224 1 PJM-RTO ZONE 75.90 0.34 0.06 71.84 0.20 0.06 51.63 0.07 0.042 20080224 3 MID-ATL/APS ZONE 97.78 19.30 2.97 90.79 16.52 2.69 60.51 6.89 2.113 20080224 51291 AECO ZONE 46.33 -33.86 4.69 91.28 15.17 4.53 48.86 -6.21 3.554 20080224 8445784 AEP ZONE 43.55 -28.48 -3.47 32.42 -35.94 -3.22 37.52 -11.51 -2.49
…424 20080224 32406789 107 DIX138 KV TR76 34LOAD COMED 41.23 -28.37 -5.90 32.16 -34.15 -5.27 35.61 -11.59 -4.32425 20080224 32406793 109 APT138 KV TR72 12LOAD COMED 42.72 -28.66 -4.12 33.46 -34.39 -3.73 36.73 -11.74 -3.05426 20080224 32406795 109 APT138 KV TR73 12LOAD COMED 42.69 -28.66 -4.15 33.43 -34.39 -3.76 36.71 -11.74 -3.07
…8075 20080224 49498 ZIONSV115 KV 1B12 LOAD METED 92.57 15.14 1.93 93.33 19.83 1.92 59.47 6.41 1.548076 20080224 49499 ZIONSV115 KV 2B12 LOAD METED 92.57 15.14 1.93 93.33 19.83 1.92 59.47 6.41 1.548077 20080224 32413125 ZUBER 138 KV T1 LOAD AEP 40.57 -31.29 -3.64 32.11 -36.24 -3.23 36.19 -12.85 -2.48
End of Real Time LMP Data
11
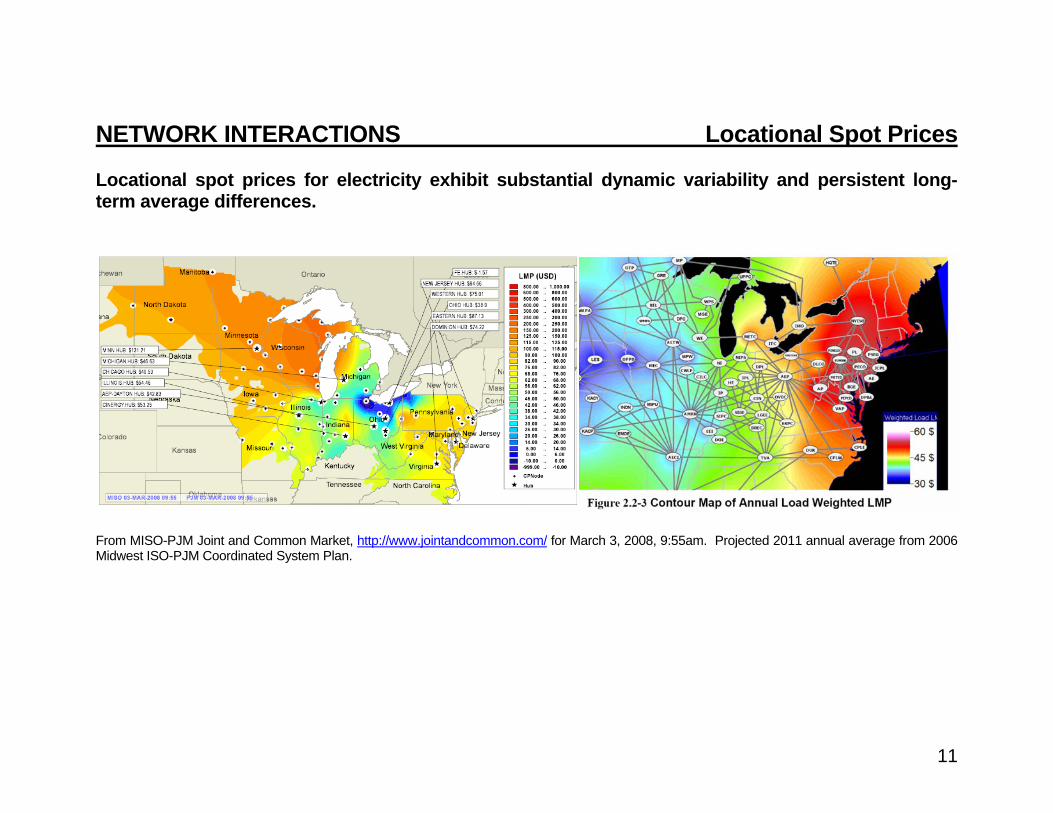
NETWORK INTERACTIONS Locational Spot Prices Locational spot prices for electricity exhibit substantial dynamic variability and persistent long-term average differences.
From MISO-PJM Joint and Common Market, http://www.jointandcommon.com/ for March 3, 2008, 9:55am. Projected 2011 annual average from 2006 Midwest ISO-PJM Coordinated System Plan.

12
NETWORK INTERACTIONS Financial Transmission Rights A mechanism for hedging volatile transmission prices can be established by defining financial transmission rights to collect the congestion rents inherent in efficient, short-run spot prices.
DEFINE TRANSMISSION CONGESTION CONTRACTS BETWEEN LOCATIONS. FOR SIMPLICITY, TREAT LOSSES AS OPERATING COSTS. RECEIVE CONGESTION PAYMENTS FROM ACTUAL USERS; MAKECONGESTION PAYMENTS TO HOLDERS OF CONGESTION CONTRACTS. TRANSMISSION CONGESTION CONTRACTS PROVIDE PROTECTIONAGAINST CHANGING LOCATIONAL DIFFERENCES.
NETWORK TRANSMISSION FINANCIAL RIGHTSPa = 51
Pc = 55
Pb = 66
Price of "Transmission" from A to B = Pb - Pa = 15Price of "Transmission" from A to C = Pc - Pa = -4
A
C
B
Constraint
13
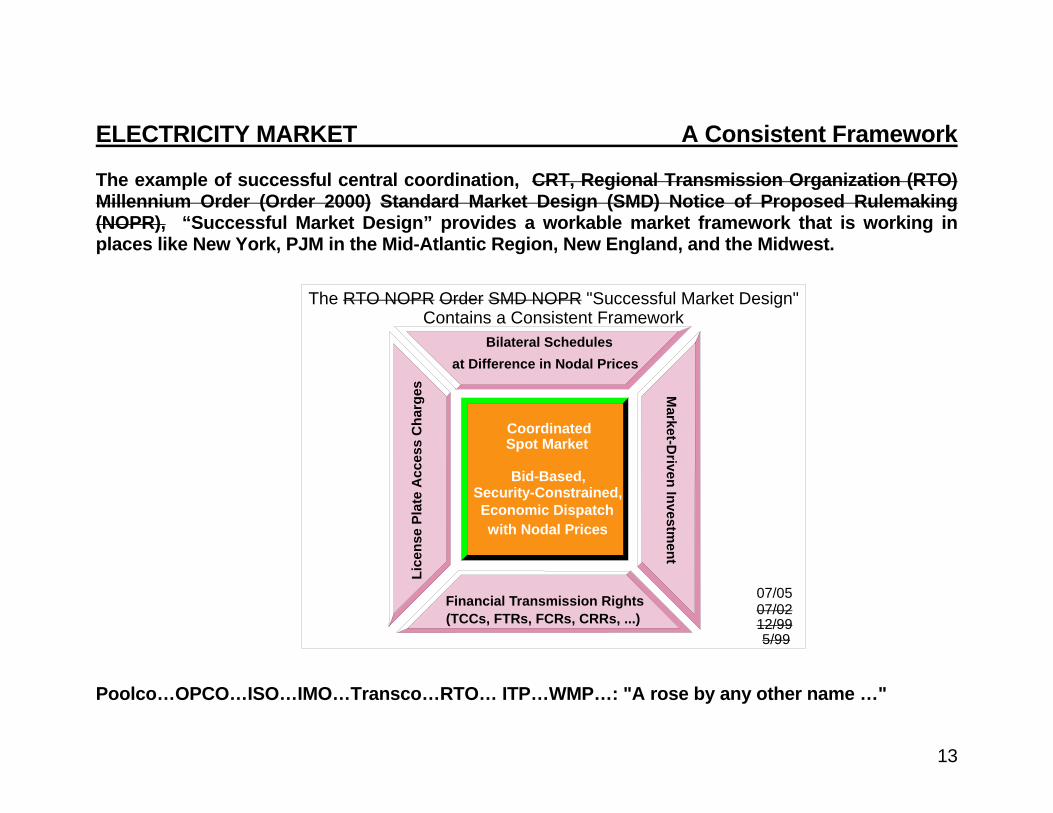
ELECTRICITY MARKET A Consistent Framework The example of successful central coordination, CRT, Regional Transmission Organization (RTO) Millennium Order (Order 2000) Standard Market Design (SMD) Notice of Proposed Rulemaking (NOPR), “Successful Market Design” provides a workable market framework that is working in places like New York, PJM in the Mid-Atlantic Region, New England, and the Midwest.
Poolco…OPCO…ISO…IMO…Transco…RTO… ITP…WMP…: "A rose by any other name …"
CoordinatedSpot Market
Bid-Based,Security-Constrained,Economic Dispatchwith Nodal Prices
The RTO NOPR Order SMD NOPR "Successful Market Design" Contains a Consistent Framework
07/05
Bilateral Schedules
Financial Transmission Rights
Lice
nse
Plat
e A
cces
s C
harg
es Market-D
riven Investment
at Difference in Nodal Prices
(TCCs, FTRs, FCRs, CRRs, ...)5/99
12/9907/02
14
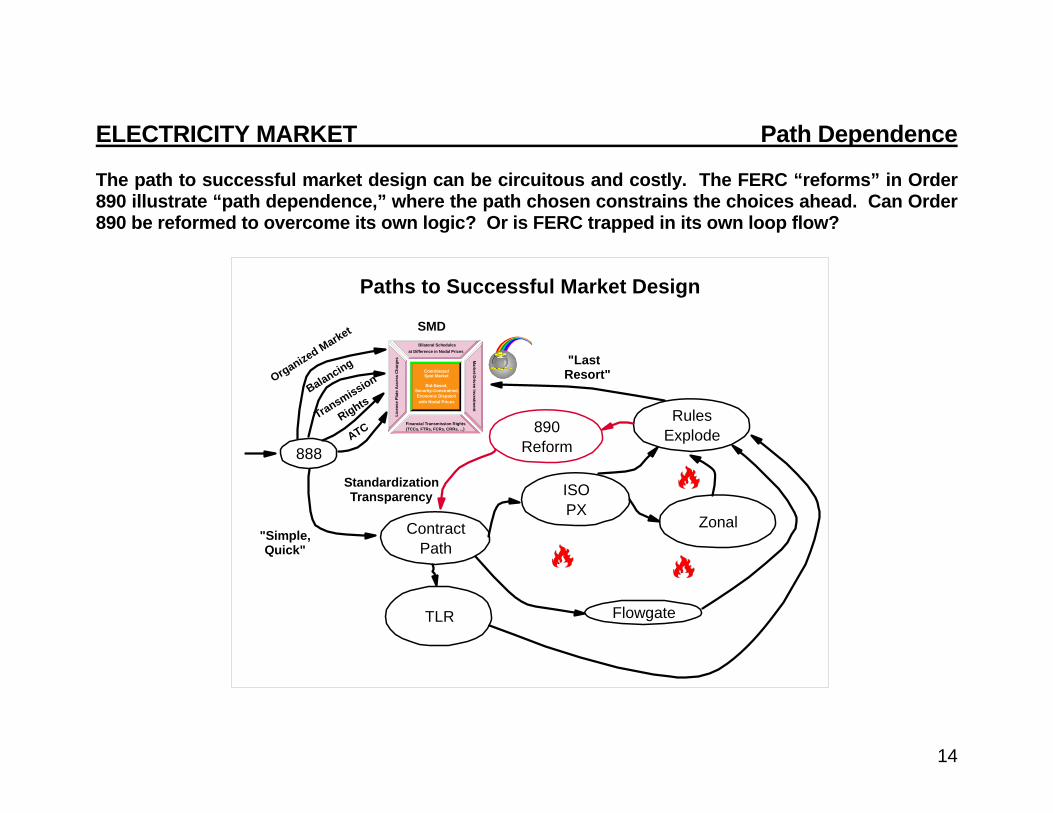
ELECTRICITY MARKET Path Dependence The path to successful market design can be circuitous and costly. The FERC “reforms” in Order 890 illustrate “path dependence,” where the path chosen constrains the choices ahead. Can Order 890 be reformed to overcome its own logic? Or is FERC trapped in its own loop flow?
Paths to Successful Market Design
CoordinatedSpot Market
Bid-Based,Security-Constrained,Economic Dispatchwith Nodal Prices
Bilateral Schedules
Financial Transmission Rights
Lice
nse
Plat
e A
cces
s C
harg
es Market-D
riven Investment
at Difference in Nodal Prices
(TCCs, FTRs, FCRs, CRRs, ...)
888
TLR
ContractPath
ISOPX
Flowgate
Zonal
RulesExplode
SMD
"Simple,Quick"
"Last Resort"
ATCTransmission
RightsBalancing
Organized Market
890Reform
StandardizationTransparency
15
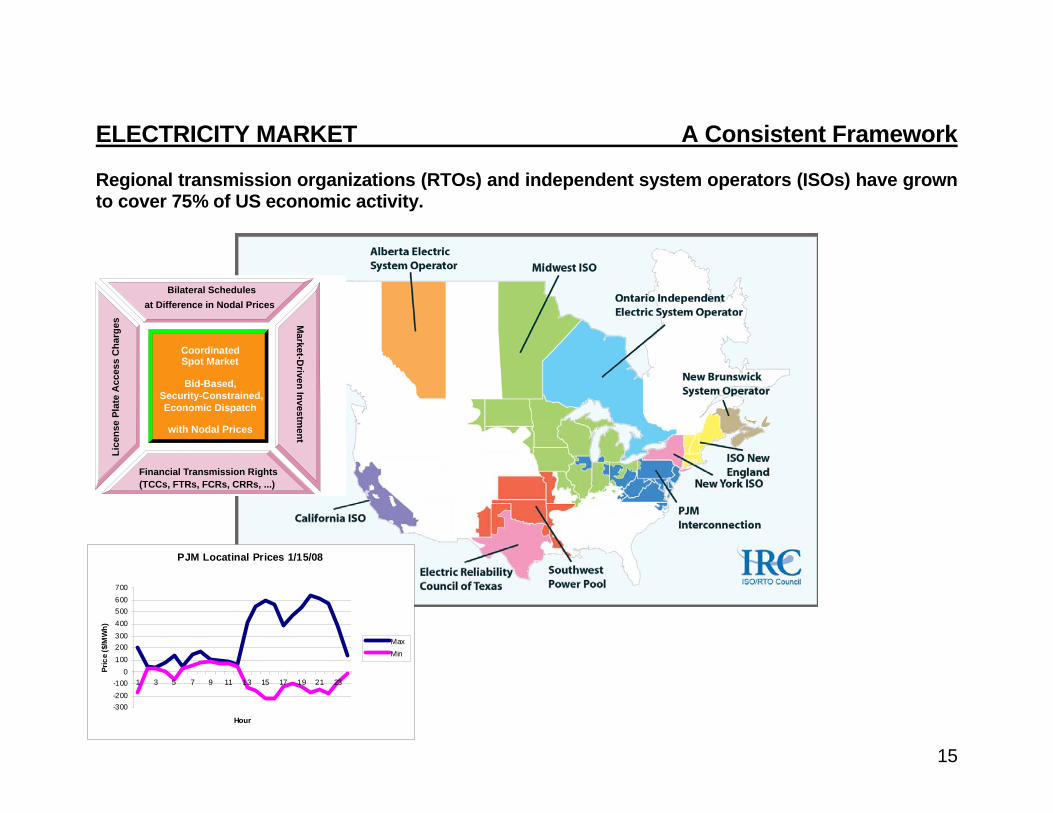
ELECTRICITY MARKET A Consistent Framework Regional transmission organizations (RTOs) and independent system operators (ISOs) have grown to cover 75% of US economic activity.
CoordinatedSpot Market
Bid-Based,Security-Constrained,Economic Dispatch
with Nodal Prices
Bilateral Schedules
Financial Transmission Rights
Lice
nse
Plat
e A
cces
s C
harg
es Market-D
riven Investment
at Difference in Nodal Prices
(TCCs, FTRs, FCRs, CRRs, ...)
PJM Locatinal Prices 1/15/08
-300-200-100
0100200300400500600700
1 3 5 7 9 11 13 15 17 19 21 23
Hour
Pric
e ($
/MW
h)
MaxMin
16
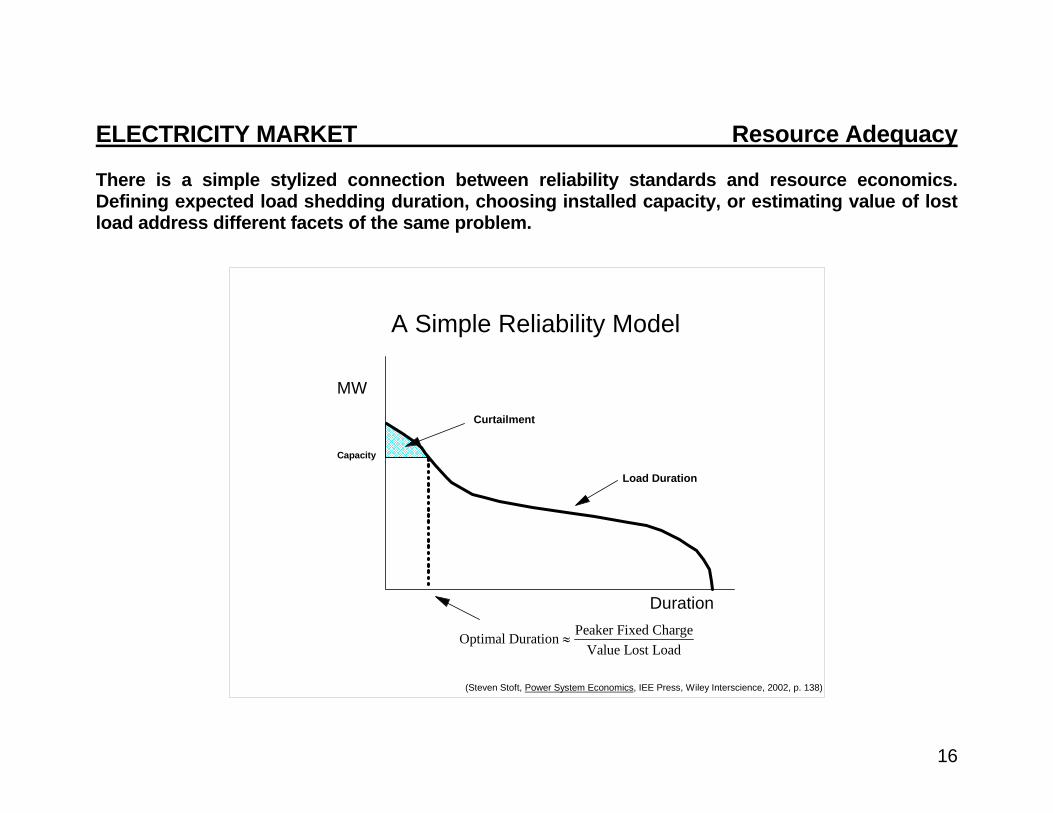
MW
A Simple Reliability Model
Duration
Capacity
Load Duration
Curtailment
Peaker Fixed ChargeOptimal DurationValue Lost Load
≈
(Steven Stoft, Power System Economics, IEE Press, Wiley Interscience, 2002, p. 138)
ELECTRICITY MARKET Resource Adequacy There is a simple stylized connection between reliability standards and resource economics. Defining expected load shedding duration, choosing installed capacity, or estimating value of lost load address different facets of the same problem.
17
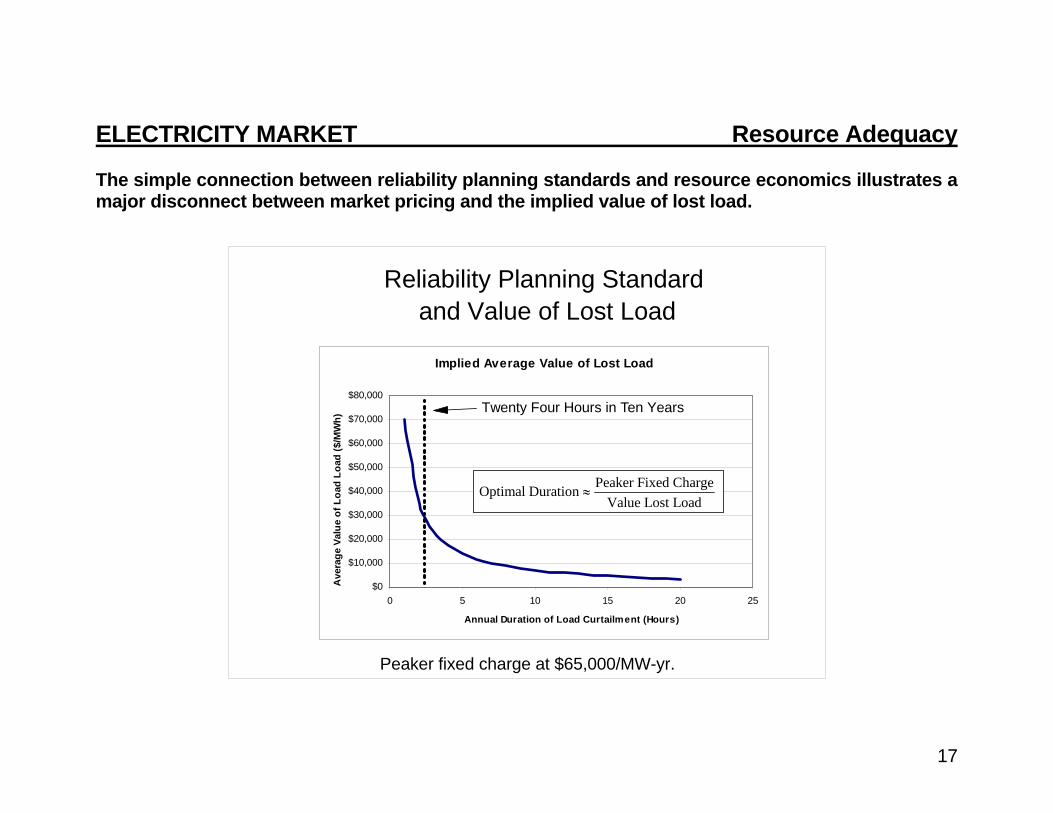
ELECTRICITY MARKET Resource Adequacy The simple connection between reliability planning standards and resource economics illustrates a major disconnect between market pricing and the implied value of lost load.
Reliability Planning Standard and Value of Lost Load
Peaker fixed charge at $65,000/MW-yr.
Implied Average Value of Lost Load
$0
$10,000
$20,000
$30,000
$40,000
$50,000
$60,000
$70,000
$80,000
0 5 10 15 20 25
Annual Duration of Load Curtailment (Hours)
Ave
rage
Val
ue o
f Loa
d Lo
ad ($
/MW
h)
Twenty Four Hours in Ten Years
Peaker Fixed ChargeOptimal DurationValue Lost Load
≈
18
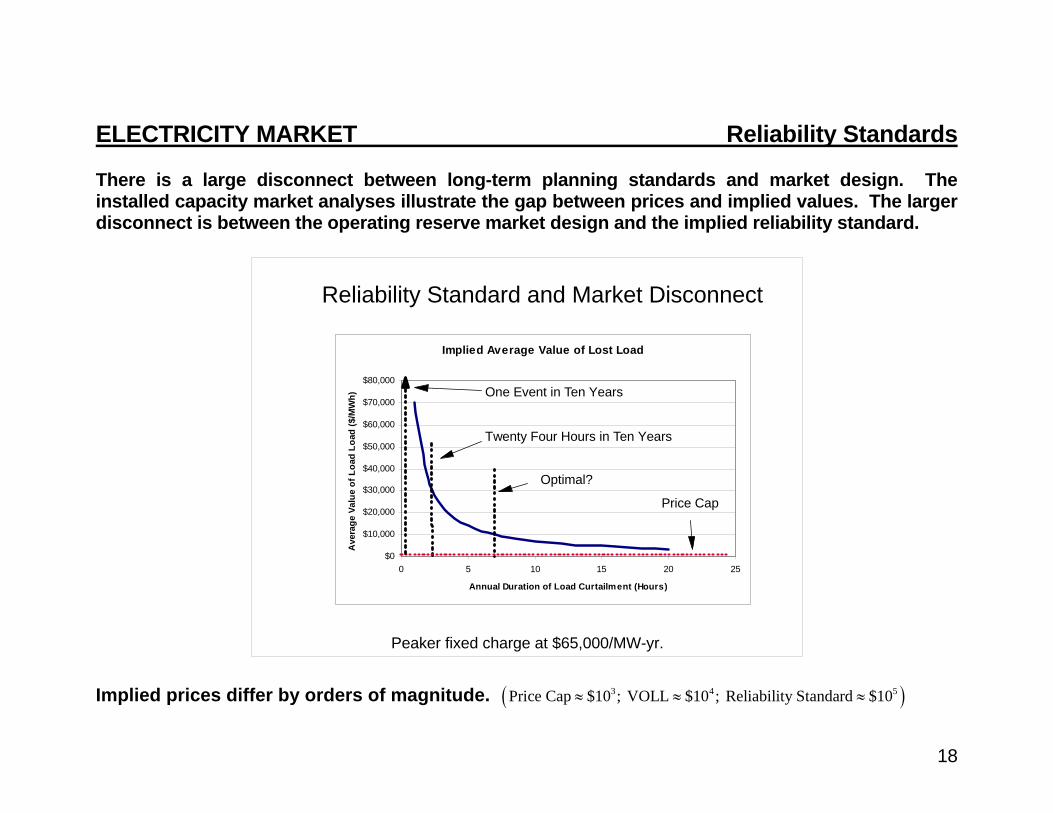
ELECTRICITY MARKET Reliability Standards There is a large disconnect between long-term planning standards and market design. The installed capacity market analyses illustrate the gap between prices and implied values. The larger disconnect is between the operating reserve market design and the implied reliability standard. Implied prices differ by orders of magnitude. ( )3 4 5Price Cap $10 ; VOLL $10 ; Reliability Standard $10≈ ≈ ≈
Reliability Standard and Market Disconnect
Peaker fixed charge at $65,000/MW-yr.
Implied Average Value of Lost Load
$0
$10,000
$20,000
$30,000
$40,000
$50,000
$60,000
$70,000
$80,000
0 5 10 15 20 25
Annual Duration of Load Curtailment (Hours)
Ave
rage
Val
ue o
f Loa
d Lo
ad ($
/MW
h)
Twenty Four Hours in Ten Years
Optimal?
Price Cap
One Event in Ten Years
19
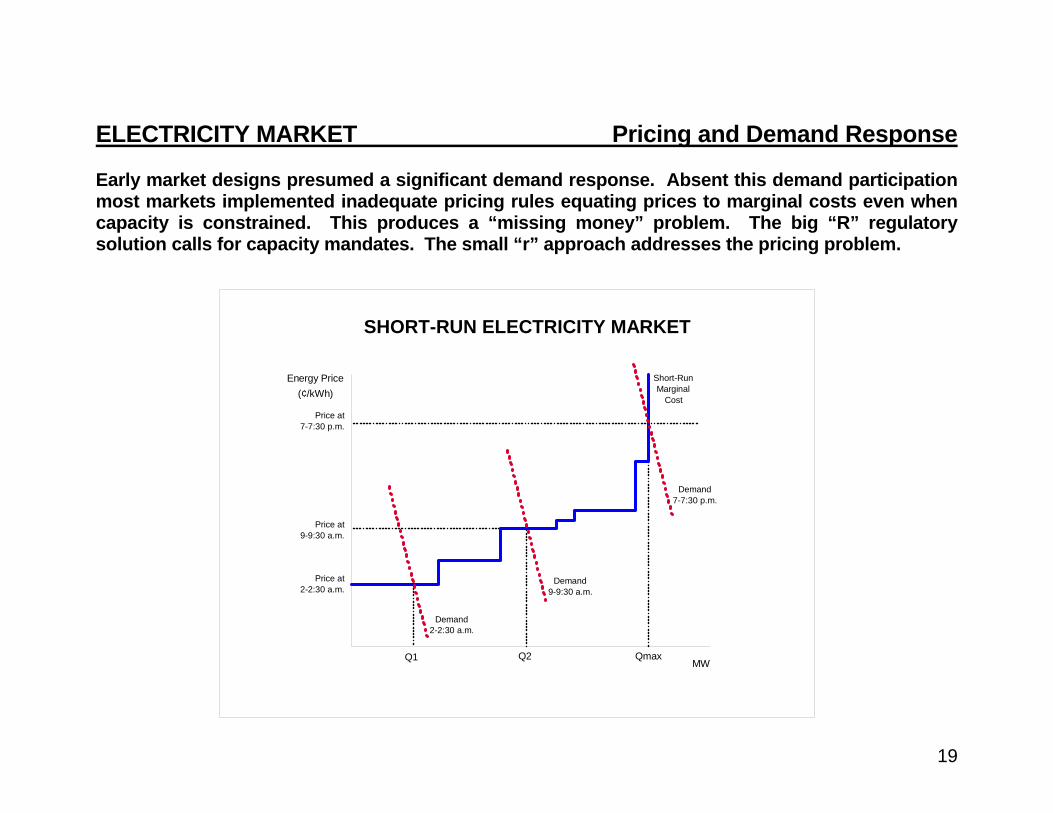
ELECTRICITY MARKET Pricing and Demand Response Early market designs presumed a significant demand response. Absent this demand participation most markets implemented inadequate pricing rules equating prices to marginal costs even when capacity is constrained. This produces a “missing money” problem. The big “R” regulatory solution calls for capacity mandates. The small “r” approach addresses the pricing problem.
MW
Energy Price(¢/kWh)
Q1 Q2 Qmax
Demand2-2:30 a.m.
Demand9-9:30 a.m.
Demand7-7:30 p.m.
Short-RunMarginal
Cost
Price at7-7:30 p.m.
Price at9-9:30 a.m.
Price at2-2:30 a.m.
SHORT-RUN ELECTRICITY MARKET
20
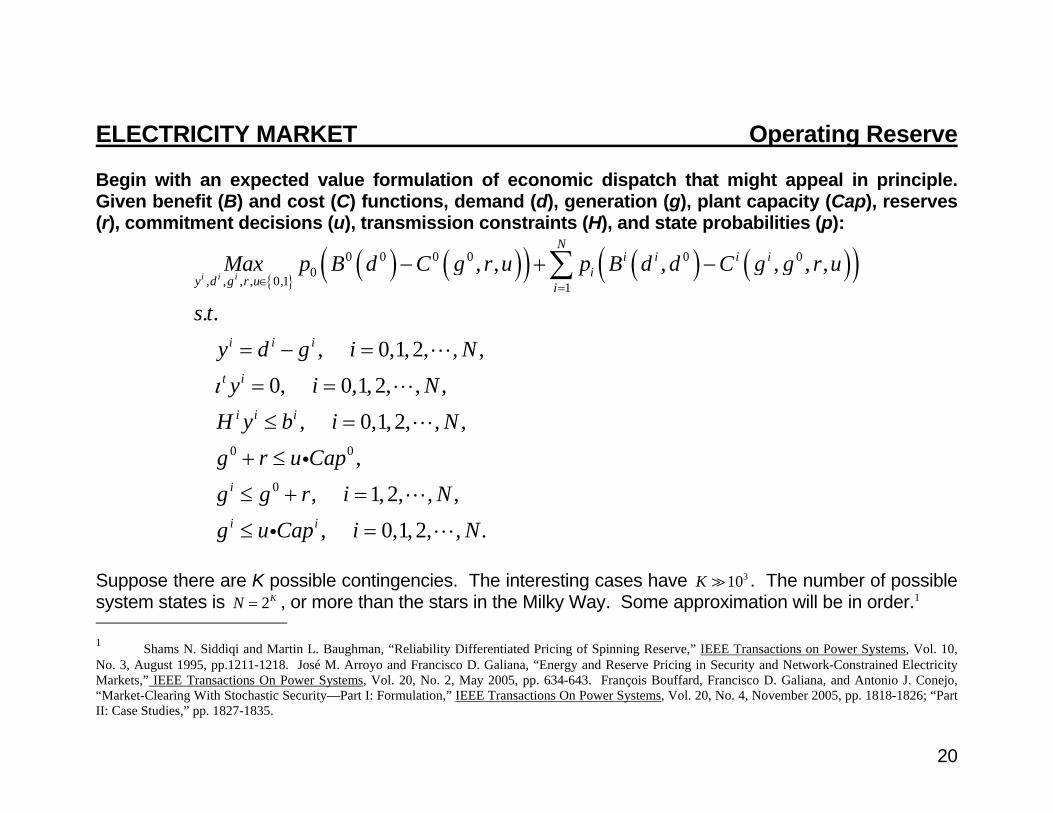
ELECTRICITY MARKET Operating Reserve Begin with an expected value formulation of economic dispatch that might appeal in principle. Given benefit (B) and cost (C) functions, demand (d), generation (g), plant capacity (Cap), reserves (r), commitment decisions (u), transmission constraints (H), and state probabilities (p):
{ }( ) ( )( ) ( ) ( )( )0 0 0 0 0 0
0, , , , 0,1 1
0 0
0
, , , , , ,
. ., 0,1,2, , ,
0, 0,1, 2, , ,, 0,1, 2, , ,
,, 1, 2, , ,, 0,1, 2, , .
i i i
Ni i i i
iy d g r u i
i i i
t i
i i i
i
i i
Max p B d C g r u p B d d C g g r u
s ty d g i N
y i NH y b i Ng r u Capg g r i Ng u Cap i N
ι
∈ =
− + −
= − =
= =
≤ =
+ ≤
≤ + =
≤ =
∑
i
i
Suppose there are K possible contingencies. The interesting cases have 310K . The number of possible system states is 2KN = , or more than the stars in the Milky Way. Some approximation will be in order.1 1 Shams N. Siddiqi and Martin L. Baughman, “Reliability Differentiated Pricing of Spinning Reserve,” IEEE Transactions on Power Systems, Vol. 10, No. 3, August 1995, pp.1211-1218. José M. Arroyo and Francisco D. Galiana, “Energy and Reserve Pricing in Security and Network-Constrained Electricity Markets,” IEEE Transactions On Power Systems, Vol. 20, No. 2, May 2005, pp. 634-643. François Bouffard, Francisco D. Galiana, and Antonio J. Conejo, “Market-Clearing With Stochastic Security—Part I: Formulation,” IEEE Transactions On Power Systems, Vol. 20, No. 4, November 2005, pp. 1818-1826; “Part II: Case Studies,” pp. 1827-1835.
21
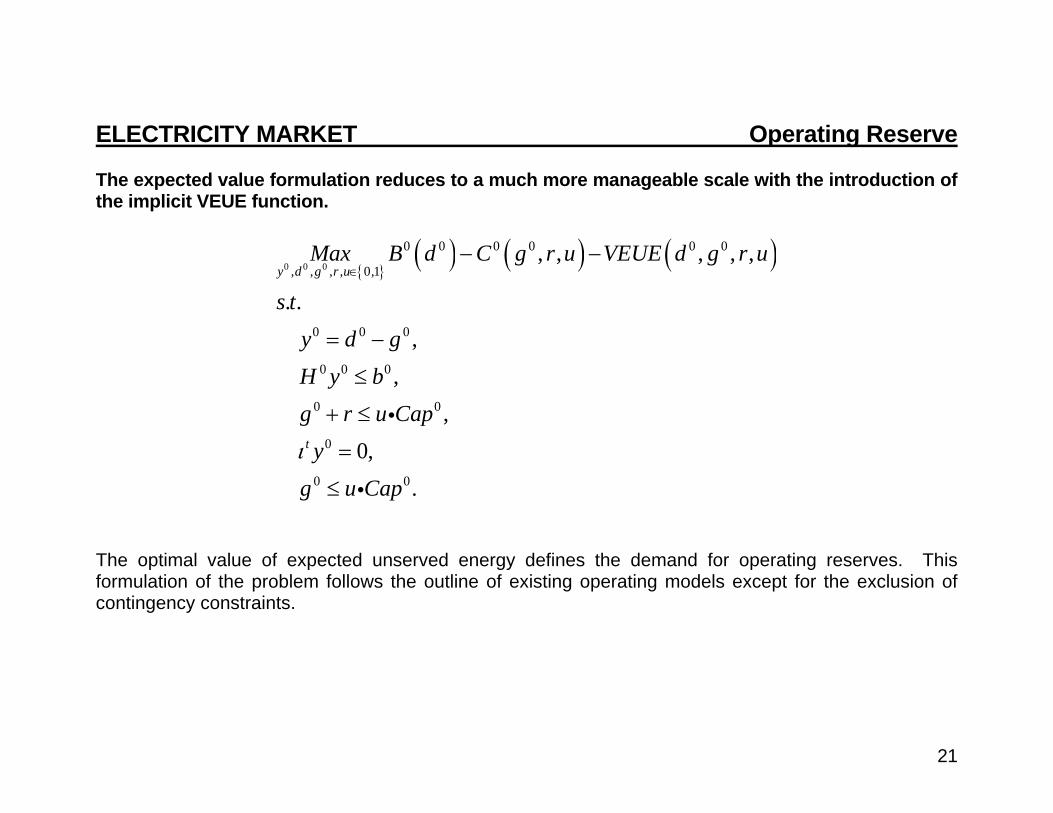
ELECTRICITY MARKET Operating Reserve The expected value formulation reduces to a much more manageable scale with the introduction of the implicit VEUE function.
{ }( ) ( ) ( )0 0 0
0 0 0 0 0 0
, , , , 0,1
0 0 0
0 0 0
0 0
0
0 0
, , , , ,
. .,
,,
0,.
y d g r u
t
Max B d C g r u VEUE d g r u
s ty d gH y bg r u Cap
yg u Capι
∈− −
= −
≤
+ ≤
=
≤
i
i
The optimal value of expected unserved energy defines the demand for operating reserves. This formulation of the problem follows the outline of existing operating models except for the exclusion of contingency constraints.
22
Operating Reserve Demand
0
2,000
4,000
6,000
8,000
10,000
12,000
0 500 1000 1500 2000 2500
Q (MW)
P ($
/MW
h)Security Minimum
Marginal VEUE
Demand=Minimum + Marginal VEUE
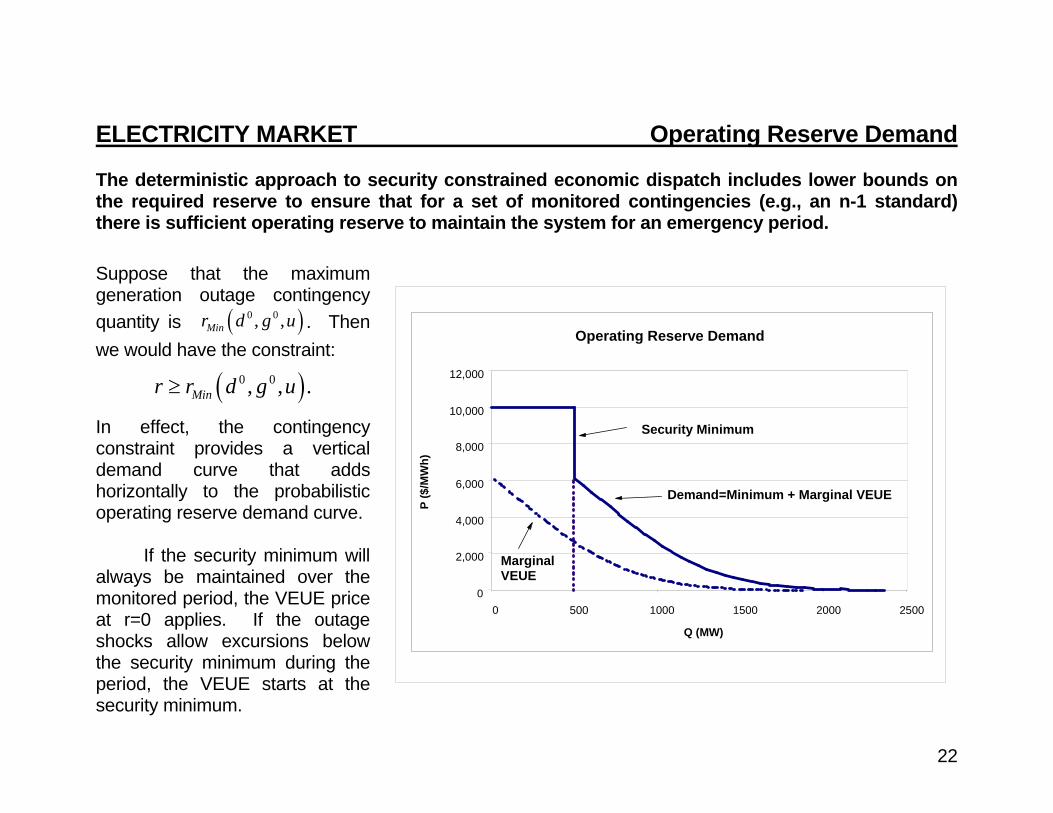
ELECTRICITY MARKET Operating Reserve Demand The deterministic approach to security constrained economic dispatch includes lower bounds on the required reserve to ensure that for a set of monitored contingencies (e.g., an n-1 standard) there is sufficient operating reserve to maintain the system for an emergency period. Suppose that the maximum generation outage contingency quantity is ( )0 0, ,Minr d g u . Then we would have the constraint:
( )0 0, , .Minr r d g u≥
In effect, the contingency constraint provides a vertical demand curve that adds horizontally to the probabilistic operating reserve demand curve.
If the security minimum will always be maintained over the monitored period, the VEUE price at r=0 applies. If the outage shocks allow excursions below the security minimum during the period, the VEUE starts at the security minimum.
23
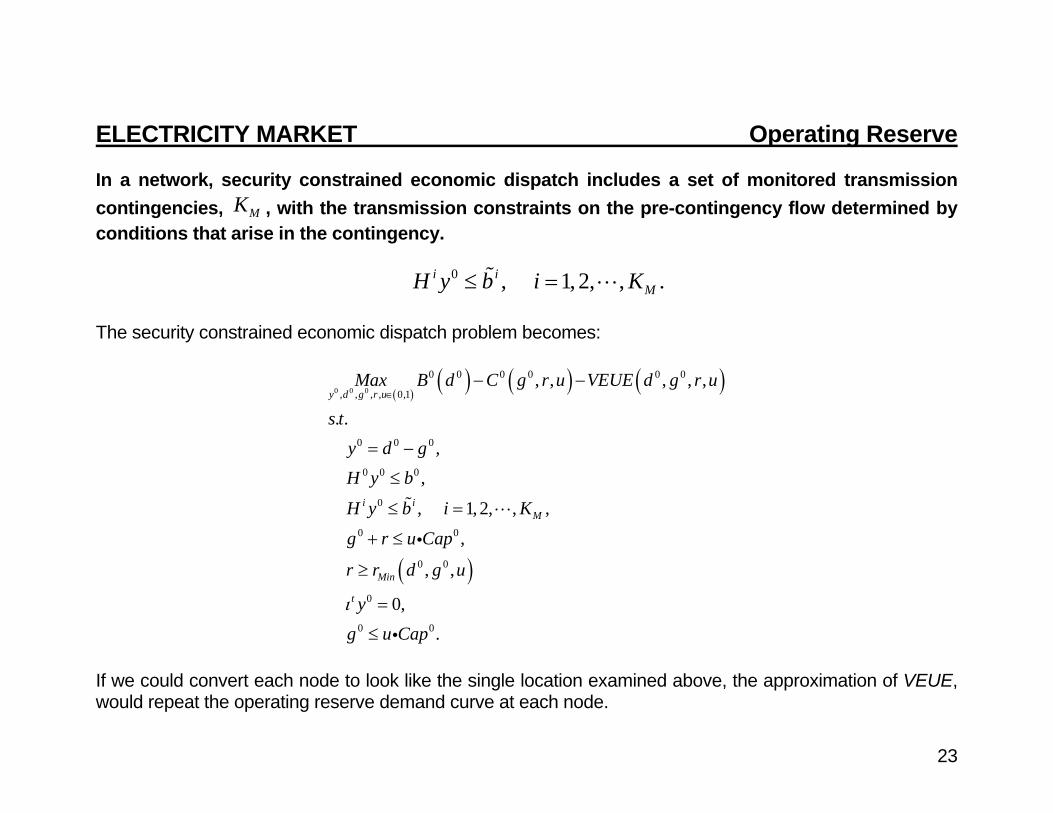
ELECTRICITY MARKET Operating Reserve In a network, security constrained economic dispatch includes a set of monitored transmission contingencies, MK , with the transmission constraints on the pre-contingency flow determined by conditions that arise in the contingency.
0 , 1, 2, , .i iMH y b i K≤ =
The security constrained economic dispatch problem becomes:
( )( ) ( ) ( )
( )
0 0 0
0 0 0 0 0 0
, , , , 0,1
0 0 0
0 0 0
0
0 0
0 0
0
0 0
, , , , ,
. .,
,
, 1, 2, , ,
,
, ,
0,.
y d g r u
i iM
Min
t
Max B d C g r u VEUE d g r u
s ty d gH y b
H y b i K
g r u Cap
r r d g u
yg u Capι
∈− −
= −
≤
≤ =
+ ≤
≥
=
≤
i
i
If we could convert each node to look like the single location examined above, the approximation of VEUE, would repeat the operating reserve demand curve at each node.
24
ELECTRICITY MARKET Energy Pricing and Uplift Payments Energy dispatch is continuous but unit commitment requires discrete decisions. Bid-based, security constrained, combined unit commitment and economic dispatch presents a challenge in defining market-clearing prices.
• Continuous convex economic dispatch o System marginal costs provide locational, market-clearing, linear prices o Linear prices support the economic dispatch
• Discrete, economic, unit commitment and dispatch o Start up and minimum load restrictions enter the model o System marginal costs not always well-defined o There may be no linear prices that support the commitment and dispatch solution
25
Marginal Cost Illustration
Marginal Variable Cost
0
20
40
60
80
100
120
0 100 200 300 400 500
Load
Mar
gina
l Cos
t ($/
MW
h)
A
B
A&B
Total Variable Cost
0
5000
10000
15000
20000
25000
30000
35000
0 100 200 300 400 500
Load
Tota
l Cos
t
A
B
A&B
Aggregate Cost Illustration
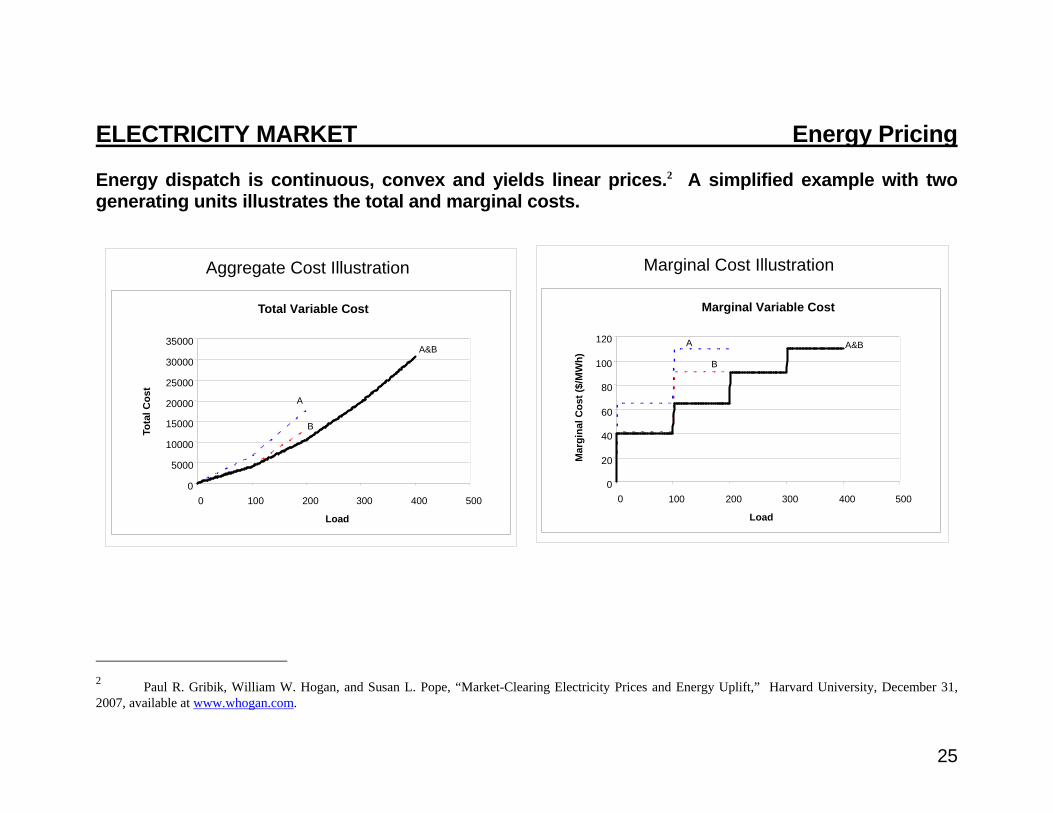
ELECTRICITY MARKET Energy Pricing Energy dispatch is continuous, convex and yields linear prices.2 A simplified example with two generating units illustrates the total and marginal costs.
2 Paul R. Gribik, William W. Hogan, and Susan L. Pope, “Market-Clearing Electricity Prices and Energy Uplift,” Harvard University, December 31, 2007, available at www.whogan.com.
26
Aggregate Cost: Two Generator Example
Total Commitment and Dispatch Cost
0
5000
10000
15000
20000
25000
30000
35000
40000
0 100 200 300 400 500
Load
Tota
l Cos
t
A
A&B
V
Marginal Cost: Two Generator Example
Marginal Cost
0
20
40
60
80
100
120
0 100 200 300 400 500
Load
Mar
gina
l Cos
t ($/
MW
h)
MC v
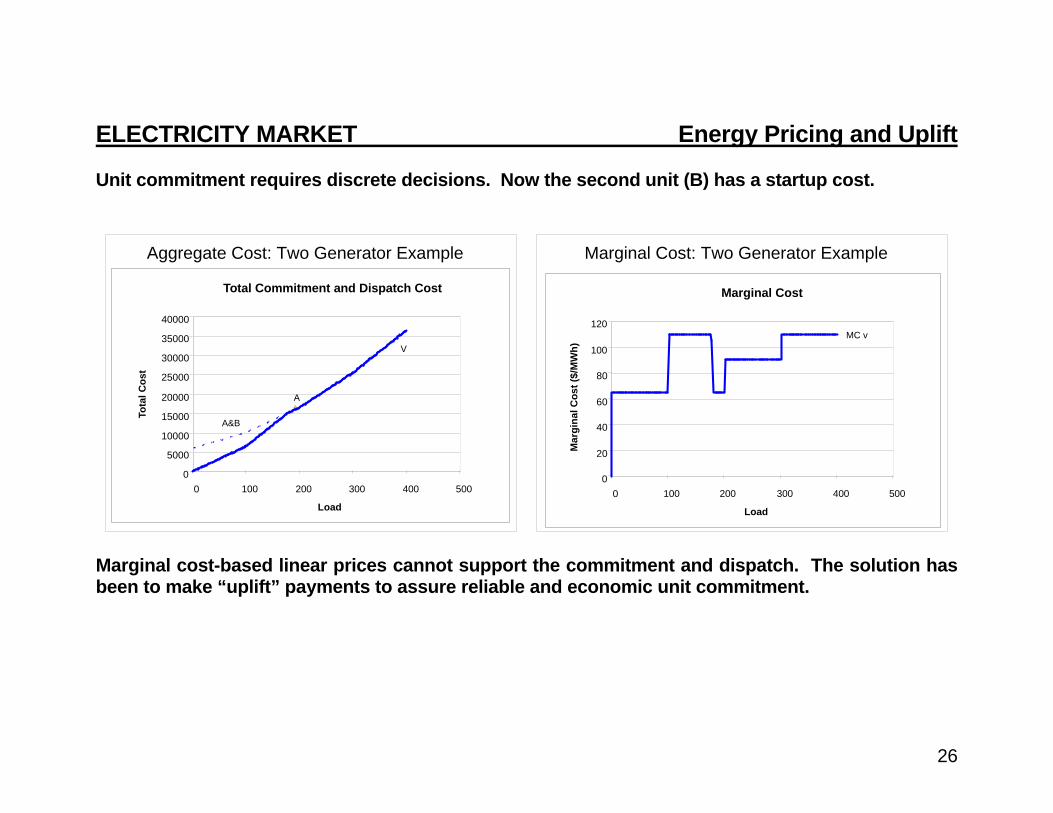
ELECTRICITY MARKET Energy Pricing and Uplift Unit commitment requires discrete decisions. Now the second unit (B) has a startup cost.
Marginal cost-based linear prices cannot support the commitment and dispatch. The solution has been to make “uplift” payments to assure reliable and economic unit commitment.
27
ELECTRICITY MARKET Energy Pricing and Uplift Selecting the appropriate approximation model for defining energy and uplift prices involves practical tradeoffs. All involve “uplift” payments to guarantee payments for bid-based cost to participating bidders (generators and loads), to support the economic commitment and dispatch.
Uplift with Given Energy Prices=Optimal Profit – Actual Profit
• Restricted Model (r)
o Fix the unit commitment at the optimal solution. o Determine energy prices from the convex economic dispatch.
• Dispatchable Model (d)
o Relax the discrete constraints and treat commitment decisions as continuous. o Determine energy prices from the relaxed, continuous, convex model.
• Convex Hull Model (h)
o Select the energy prices from the Lagrangean relaxation (i.e., usual dual problem for pricing the joint constraints).
o Resulting energy prices minimize the total uplift.
28
ELECTRICITY MARKET Minimum Uplift Economic commitment and dispatch is a special case of a general optimization problem.
( ) ( )( ). . .
x Xv y Min f x
s t g x y∈
=
=
From the perspective of a price-taking bidder, uplift is the difference between actual and optimal profits.
Actual profits: ( ) ( ),p y py v yπ = −
Optimal Profits: ( ) ( ){ }*
zp Max pz v zπ = −
( ) ( ) ( )*, ,Uplift p y p p yπ π= − Classical Lagrangean relaxation and pricing creates a familiar dual problem.
( ) ( ) ( )( ), ,L y x p f x p y g x= + −
( ) ( ) ( )( ){ }ˆ ,x X
L y p Inf f x p y g x∈
= + −
( ) ( ) ( ) ( )( ){ }{ }* ˆ ,p p x X
L y Sup L y p Sup Inf f x p y g x∈
= = + −
The optimal dual solution minimizes the uplift, and the “duality gap” is equal to the minimum uplift.
( ) ( ) ( )* , .p
v y L y Inf Uplift p y− =
29
Comparison of Example Marginal Costs
Implied Marginal Cost
0
20
40
60
80
100
120
140
0 100 200 300 400 500
Load
Mar
gina
l Cos
t ($/
MW
h)
MC rMC h
MC d
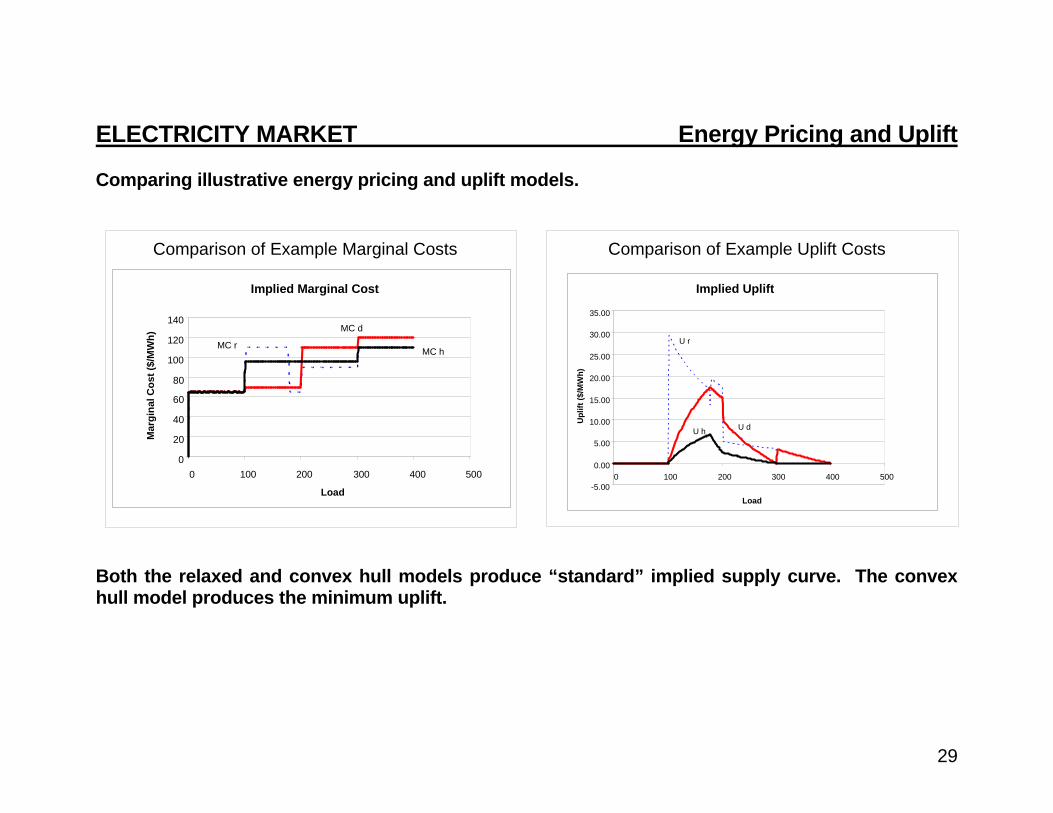
ELECTRICITY MARKET Energy Pricing and Uplift Comparing illustrative energy pricing and uplift models.
Comparison of Example Uplift Costs
-5.00
0.00
5.00
10.00
15.00
20.00
25.00
30.00
35.00
0 100 200 300 400 500
Load
Upl
ift ($
/MW
h)
U r
U dU h
Implied Uplift
Both the relaxed and convex hull models produce “standard” implied supply curve. The convex hull model produces the minimum uplift.
30
ELECTRICITY MARKET Energy Pricing and Uplift Alternative pricing models have different features and raise additional questions.
• Computational Requirements. Relaxed model easiest case, convex hull model the hardest. But not likely to be a significant issue.
• Network Application. All models compatible with network pricing and reduce to standard LMP in the convex case.
• Operating Reserve Demand. All models compatible with existing and proposed operating reserve demand curves.
• Solution Independence. Restricted model sensitive to actual commitment. Relaxed and convex hull models (largely) independent of actual commitment and dispatch.
• Day-ahead and real-time interaction. With uncertainty in real-time and virtual bids, expected real-time price is important, and may be similar under all pricing models.
31
ELECTRICITY MARKET Electricity Restructuring Summary With current technology, property rights are difficult to define and there is a continuing need for coordination to support markets. Regulation must adapt to the requirements of hybrid markets. • Little “r’ regulation: Design rules and policies that are the “best possible mix” to support
competitive wholesale electricity markets. o Necessary functions for energy markets.
Real-time, bid-based, security constrained economic dispatch with locational prices. o Necessary functions for energy markets with effective long-term hedges.
Financial transmission rights (FTRs). o Valuable functions for energy markets with effective long-term hedges.
Day-ahead energy market with associated reliability unit commitment. Transmission planning and investment protocols.
o Necessary features of everything else Rules and pricing incentives compatible with the above.
• Ancillary Services • Resource Adequacy
• Big “R” regulation: Frame every problem in its own terms—inadequate demand response,
insufficient infrastructure investment, or market power—and design ad hoc regulatory fixes that accumulate to undermine market incentives. The slippery slope.

32
William W. Hogan is the Raymond Plank Professor of Global Energy Policy, John F. Kennedy School of Government, Harvard University and a Director of LECG, LLC. This paper draws on work for the Harvard Electricity Policy Group and the Harvard-Japan Project on Energy and the Environment. The author is or has been a consultant on electric market reform and transmission issues for Allegheny Electric Global Market, American Electric Power, American National Power, Australian Gas Light Company, Avista Energy, Barclays, Brazil Power Exchange Administrator (ASMAE), British National Grid Company, California Independent Energy Producers Association, California Independent System Operator, Calpine Corporation, Canadian Imperial Bank of Commerce, Centerpoint Energy, Central Maine Power Company, Chubu Electric Power Company, Citigroup, Comision Reguladora De Energia (CRE, Mexico), Commonwealth Edison Company, Conectiv, Constellation Power Source, Coral Power, Credit First Suisse Boston, Detroit Edison Company, Deutsche Bank, Duquesne Light Company, Dynegy, Edison Electric Institute, Edison Mission Energy, Electricity Corporation of New Zealand, Electric Power Supply Association, El Paso Electric, GPU Inc. (and the Supporting Companies of PJM), Exelon, GPU PowerNet Pty Ltd., GWF Energy, Independent Energy Producers Assn, ISO New England, Luz del Sur, Maine Public Advocate, Maine Public Utilities Commission, Merrill Lynch, Midwest ISO, Mirant Corporation, JP Morgan, Morgan Stanley Capital Group, National Independent Energy Producers, New England Power Company, New York Independent System Operator, New York Power Pool, New York Utilities Collaborative, Niagara Mohawk Corporation, NRG Energy, Inc., Ontario IMO, Pepco, Pinpoint Power, PJM Office of Interconnection, PPL Corporation, Public Service Electric & Gas Company, PSEG Companies, Reliant Energy, Rhode Island Public Utilities Commission, San Diego Gas & Electric Corporation, Sempra Energy, SPP, Texas Genco, Texas Utilities Co, Tokyo Electric Power Company, Toronto Dominion Bank, TransÉnergie, Transpower of New Zealand, Westbrook Power, Western Power Trading Forum, Williams Energy Group, and Wisconsin Electric Power Company. The views presented here are not necessarily attributable to any of those mentioned, and any remaining errors are solely the responsibility of the author. (Related papers can be found on the web at www.whogan.com ).