Embed Size (px)
Citation preview

Electricity Asset Management Plan Update 2017
Date: 31 March 2017 Vector Limited Page 1 of 39
Electricity Asset Management Plan Update
Information Disclosure 2017

Electricity Asset Management Plan Update 2017
Date: 31 March 2017 Vector Limited Page 2 of 39
CONTENTS
1 Introduction ................................................................................................................................. 3
2 Context ................................................................................................................................. 3
3 Network Development Planning Update .................................................................................. 5
4 Life-Cycle Asset Management Update ...................................................................................... 6
5 Risk Management ..................................................................................................................... 10
6 Network Performance ............................................................................................................... 10
7 Asset Management Maturity Update ....................................................................................... 10
8 Capital Expenditure Forecast .................................................................................................. 11
9 Operational Expenditure Forecast .......................................................................................... 13
10 Appendix ............................................................................................................................... 14
Appendix 1 Report on Forecast Capital Expenditure ............................................................... 15
Appendix 2 Report on Forecast Operational Expenditure ....................................................... 21
Appendix 3 Report on Asset Condition .................................................................................... 23
Appendix 4 Report on Forecast Capacity ................................................................................ 26
Appendix 5 Report on Forecast Network Demand ................................................................... 31
Appendix 6 Report on Forecast Interruptions and Duration (reported by sub-network) .......... 34
Appendix 7 Schedule 14a Mandatory Explanatory Notes on Forecast Information ................ 36
Appendix 8 Schedule 17 Certification for Year-beginning Disclosures .................................... 38
List of Figures Figure 1: Average household electricity consumption ............................................................................ 4 Figure 2: Movement between this AMP and the previous AMP’s capital expenditure forecast ........... 12 Figure 3: Movement between this AMP and the previous AMP’s operational expenditure forecast .... 13 List of Tables Table 1 : Proposed capital expenditure forecast .................................................................................. 11 Table 2 : Capital expenditure forecast disclosed in the 2016 AMP escalated to 2018 prices .............. 11 Table 3 : Comparison between this AMP and the previous AMP’s capital expenditure forecast ......... 12 Table 4 : Proposed operational expenditure forecast ........................................................................... 13 Table 5 : Operational expenditure forecast disclosed in the 2016 AMP escalated to 2018 prices ....... 13 Table 6 : Comparison between this AMP and the previous AMP’s operational expenditure forecast .. 14

Electricity Asset Management Plan Update 2017
Date: 31 March 2017 Vector Limited Page 3 of 39
1 INTRODUCTION
This Asset Management Plan (AMP) Update has been prepared to inform Vector’s customers and other stakeholders of material changes and updates to its asset management planning since 31 March 2016, when the last Electricity AMP (2016-2026) was published.1 In particular it contains updated 10-year capital investment and maintenance programmes for the electricity distribution network. These have been revised to reflect new improvement programmes initiated over the course of the last year, ongoing analysis of the performance, condition and forecast future growth and reinforcement requirements of the network assets.
2 CONTEXT
In the world of electricity, innovation and disruption is occurring across the entire value chain. As a company, Vector is embracing such change. While it may be early days, customers now have the ability to generate, store, use and sell electricity - all against the backdrop of a much greater customer focus on sustainability. These abilities are only going to be enhanced as technology improves and customer adoption grows.
As a company, we are at the front end of having to meet Auckland’s growth, which even by global standards, is extremely high. Such exceptional and simultaneous population growth, city expansion and intensification is also occurring in the context of increased weather volatility associated with climate change and the need to decarbonise our lifestyles and economy. This requires new thinking around infrastructure investment, a shift to clean energy technology and a changing role for the end consumer in energy management to deliver resilience and reduce carbon emissions.
We are providing customers options to support Auckland consumers’ long term interests including the support of clean energy solutions. Such options, including solar, battery, demand side solutions and electric vehicle technology are increasingly popular internationally and are what Auckland customers will quickly come to expect.
Further underscoring the need for flexibility, careful network investment and a more sophisticated understanding of the dynamics occurring on the network, is that average household consumption is declining. This is a result of people renovating, building standards improving, adoption of energy efficient appliances and lighting, and responsive technology allowing demand response options at peak times. When this is considered against the backdrop of Auckland undergoing unprecedented growth and the significant impact that evolving technology like electric vehicles and battery storage will have on the network, information on customer trends and behaviours is fundamental to our ability to deploy capital efficiently as well as to ensure customers get solutions they require. The current transmission pricing uncertainty also highlights the need for flexibility. Current proposals suggest that Aucklanders end up paying considerably more in transmission costs than was previously the case, resulting in a possible change in consumption patterns. Vector’s strategy of enhancing our data analytical capability and focusing on enabling integration platforms to manage the convergence of customer and network data will continue over this period.
1 A copy of this AMP is available on the Vector website, at http://vector.co.nz/disclosures/electricity/amp

Electricity Asset Management Plan Update 2017
Date: 31 March 2017 Vector Limited Page 4 of 39
Figure 1: Average household electricity consumption
The value we can realise in embracing and understanding change in the way we utilise assets on the network, while also meeting Auckland’s growing and urgent infrastructure needs, is value that consumers don’t have to fund. This is an approach informed and supported by our majority consumer trust owner, Entrust.
The period covered by the current AMP will continue to trial new, sustainable technology solutions on the network and beyond the customer’s point of connection to realise this value. This will include Vector aiming to become a global leader in the field of network control platforms to ensure multiple devices and connections can be managed and coordinated whether these are customer or network centric. This update to the AMP also reflects the continuation of our strategy to use digital channels to communicate and interface with customers.
The safety of our staff and the public is a key driver underpinning the forecasted investment. The adoption of de-energised work practices and other safety improvement initiatives, as expected, has had an impact on the cost of planning and executing the works program. This updated AMP reflects this change, but we are still working with our service providers and our customers to establish the appropriate level of costs.
Vector's adoption of industry-leading and continually evolving workplace safety practices has also had a significant impact on Vector’s ability to maintain the reliability target set by the regulator using historic work practices. In addition, the increase in congestion on Auckland’s roads and a noticeable increase in vegetation related faults from trees and debris outside the allowable, regulatory cut zone have had a significant impact on our ability to meet fault response targets set on past data. We have not increased expenditure to compensate for the change in work practices, traffic congestion or out of zone vegetation, since the associated costs can only be recovered from our customers. Our strategy is to continue to work with the economic and safety regulators to set appropriate targets and have targeted investment programs for areas on the network where the actual service levels are impacting our customers.
5,000
5,500
6,000
6,500
7,000
7,500
8,000
8,500
9,000
9,500
10,000
RY07 RY08 RY09 RY10 RY11 RY12 RY13 RY14 RY15 RY16
Ele
ctric
ity C
onsu
med
(kW
h)
Residential Electricity Consumption (kWh)Time Series
Average Consumption per ICP

Electricity Asset Management Plan Update 2017
Date: 31 March 2017 Vector Limited Page 5 of 39
3 NETWORK DEVELOPMENT PLANNING UPDATE
This section discusses factors that have led to material changes to the network development plan described in section 5 of Vector’s 2016 AMP and the subsequent 2017 AMP Update.
Future Network Technology
Vector is actively researching and implementing a number of new, sustainable technology initiatives to improve future network performance and development. These include various energy storage systems for the applications of network peak-shaving and backup supply, with the potential to provide grid support services. A key project delivered under this stream of work was a 1MW / 2.3MWh network-scale energy storage system installed at the Glen Innes zone substation in FY17.
With the increasing availability and improved economics of connected devices, there are a number of projects investigating ways of achieving a much more advanced level of visibility, reporting, control and automation on the electricity network. Similarly, a programme is underway to review the existing hot water load management scheme and to consider modern replacements for this infrastructure. A partnership between Entrust, Auckland Council and Vector, has been established and it will deliver free hot water heat control units, up to 15,000 LED lightbulbs, and energy advice to homeowners in Papakura and Takanini.
Auckland growth
Auckland’s population is forecast to grow at an annual rate of 1.7% over the next ten years, increasing the number of electricity connections on Vector’s network by approximately 10,000 per annum. This growth is driving investment in new reticulation assets or smart technology to enable existing assets to meet the demand.
The increasing population is placing considerable strain on Auckland’s transport infrastructure driving a number of road widening projects by Auckland Transport and NZTA, resulting in considerable investment in the relocation of existing electricity assets.
The current AMP reflects Vector’s initial assessments of the impacts of declining usage per customer and a growing population. The network impacts of emerging technology such as electric vehicles, home energy management systems and incentives for off peak consumption via retail tariffs have the potential to significantly affect the mid to longer term planning horizon.
Across the globe the energy industry is in a period of significant transition driven by changing consumer requirements, the digitisation of the energy value chain and the development and adoption of new (and at times competing) technology. Considerable uncertainty underpins this transition, disrupting the traditional practice of long term planning by creating a number of possible and at times divergent energy futures.
In response to this uncertainty, Vector has developed a detailed network scenario model that allows multivariate scenario analysis to be applied to the network. The scenarios have been supported by detailed customer research that provides a foundation of understanding of the customer lead disruption.
Vector is looking to incorporate the results of this scenario analysis into the future Asset Management Plans.
Network Planning Criteria
The security of supply standards have been updated since the 2016 AMP. The changes made are designed to actively identify and manage risks associated with high impact, low probability events, recognition of the large loads and risks associated with meshed sub transmission networks, while maintaining the impetus to improve utilisation of network assets. The distribution load thresholds have been normalised to 1.5MVA, (as against 2.5MVA for overhead and 1MVA for underground

Electricity Asset Management Plan Update 2017
Date: 31 March 2017 Vector Limited Page 6 of 39
networks), acknowledgement of N security presented by distribution substations with minimal 400V distribution back-up, while targeting future 400V networks with an improved level of connectivity over that currently available.
Two criteria are directed towards use of network batteries where they add value. The two applications envisaged are where demand marginally exceeds the security levels of existing zone substations and the installation of batteries may defer a major reinforcement project. The second area is to provide distribution network support during outages and voltage support during normal operation. Applications are also being explored within solar and batteries micro-grid solutions particularly in locations at the extremities of the network that suffer poor reliability.
The last item targets critical spares by placing limits on the time the network may remain on reduced security.
The revised standard contains a mix of demand and customer-based targets while offering an opportunity to use emerging technologies as solutions.
4 LIFE-CYCLE ASSET MANAGEMENT UPDATE
This section discusses aspects that have led to material changes to Vector’s asset life-cycle management practices compared to those previously described in Section 6 of the 2016 AMP and the subsequent 2017 AMP Update.
Asset Maintenance and Inspection
Maintenance Standards Review
A full review of all maintenance standards is underway and will be completed by the end of FY17. As these reviews are completed, new standards will supersede the existing documents referenced in the 2016 AMP. No major changes to maintenance requirements are planned, the review will focus on accurate observation reporting (refer to section 6.1 of the 2016 AMP), although some improvement / optimisation of maintenance activities will be included.
Vector has also significantly changed the way it undertakes work on the overhead network, completing a higher proportion of work de-energised in order to reduce the risk to worker safety. This has meant a knock-on impact to customer experience due to the higher number of outages required to complete maintenance tasks. A review will be undertaken before the end of FY17 of the frequency of all preventative maintenance tasks, aiming to ensure they are aligned in such a way that they can be completed together, reducing the impact to customers.
Risk Based Prioritisation
Vector is developing a risk-based maintenance prioritisation framework. At the moment, Vector schedules the majority of its preventative maintenance inspections using a time-based philosophy. Notable observations requiring corrective actions, including replacement, are assigned a ‘priority’ rating based on a specified time period in which a corrective action is required. Although some observations are allocated a standard priority, as a result of the requirements of the maintenance standards, most are determined on site by the inspector using a combination of expected failure timeframe and anticipated consequences. These observations are then recorded as a corrective action task in Vector’s SAP-PM system.
The new risk-based prioritisation framework will utilise specific asset failure modes, condition data, site exposure factors and assessment of consequences by asset failure mode. This will enable Vector to better prioritise the corrective actions resulting from the maintenance inspections, which will result in a more optimal investment outcome. We anticipate to have this framework in place

Electricity Asset Management Plan Update 2017
Date: 31 March 2017 Vector Limited Page 7 of 39
during FY18 and the output from the model will improve steadily over the next 2-3 years as better observation data is recorded as part of the planned maintenance inspections.
Pending the deployment of the risk based prioritisation tools, the FY17 and FY18 annual maintenance plans have been compiled based on the present data contained within the asset notification pool, focusing first on public safety and then on network reliability.
Overhead Lines (and hardware)
The inspection frequency for overhead network condition assessment (ONCA) has been changed from yearly to 2-yearly. This was decided based on the results of multiple annual maintenance inspections which showed a large number of asset condition notifications re-noted multiple times without any evidence of further deterioration. This change affects the visual inspections of Vector’s overhead hardware including: poles, lines, crossarms, overhead switchgear, overhead transformers, pole mounted capacitors and pole cable risers / terminations.
A programme of proactive small diameter conductor replacement is scheduled to be completed in FY17. The programme targets areas with a known high failure rate, with a particular emphasis on populated areas where the risk of a broken conductor is much higher than in rural areas.
Overhead Structures
The inspection standard for poles (ENS-0057) has been updated to amend the requirements around inspection of concrete poles. The previous routine 10-yearly inspection for structural design has been amended to be trigged on a condition assessment basis as part of the two-yearly routine inspections. Poles showing signs of stress are identified in order to prevent climbing and to allow further inspection and structural analysis. Those that do not meet the serviceability requirements, in accordance with AS/NZS 7000, are managed though Vector’s ‘tagged pole’ processes. The requirement for inspections on wooden poles has not changed.
A network-wide survey of all Vector owned steel towers is due to commence in FY17. This survey will include a structural analysis and detailed condition assessment of the structure, line hardware and foundation. Any remedial works will be scheduled for completion in FY18.
Ground Mounted Distribution Switchgear
Triggered by an event in Western Australia, Vector issued a safety alert preventing access to a switchgear oil tank when any component within the tank remains live. This has prevented Vector from continuing with condition-based maintenance of oil filled switchgear based on the results of a live tank oil sample (LTOS) test. Internal inspections are now undertaken de-energised and programmed on a time based programme at an 8-yearly frequency.
At the start of FY17, Vector became aware of a number of oil-filled switchgear units whose maintenance inspections had been delayed, resulting in the last inspection date exceeding the required 8-year inspection period. The delays were primarily due to the difficulty in arranging outages with large commercial customers and the high SAIDI impact of outages on key network switching points. In recognition of the safety risk this presents, affected units have been prohibited from live operation until maintenance is completed. An accelerated programme of maintenance is underway and is expected to be completed in FY18.
Asset Replacement and Renewal
Primary Switchboard Replacement Programme for Zone Substations
The primary purpose of circuit breakers (CBs) is to distribute electricity from zone substations to the distribution network and from there to customers in a safe and reliable manner. There are three distinct technologies used in the switchgear in Vector’s zone substations. The technology is

Electricity Asset Management Plan Update 2017
Date: 31 March 2017 Vector Limited Page 8 of 39
representative of the age as well as the operational risks associated with each type: the oldest technology is the oil type switchboards that are reaching end of life.
Vector has 68 zone substations that contains oil filled CBs and 20 have been identified from Vector’s periodic risk assessment as having serious risk of failure within the short term (the short term risk period is estimated as five years). Failure in medium voltage electrical switchgear can be sudden and catastrophic and can cause extensive collateral damage, and have the potential to cause injury or death to persons.
Vector is undertaking a program to replace the 11kV switchgear in 20 zone substations over the next five years. The projects will be undertaken in bundles to achieve economy of scale cost savings for both installation and procurement of plant.
Asset Condition Notifications (High Priority Review)
The capital expenditure forecast in the previous AMP for the distribution network, starting from FY21, was increased. During compilation of the FY17 and FY18 maintenance plans, it was determined that the previous forecast increase from FY21 should be brought forward to address high priority notifications that may present a risk to public safety. An additional $20m has been included in FY18 for the distribution network. $15m of this expenditure will target high priority notifications. The remaining $5m will be added to the existing programme of works on non-Vector owned Right of Way (ROW) assets. However, the total capital investment on the distribution network is forecast to decrease from the investment level in FY18. It is anticipated that the increased understanding of risk from the risk based prioritisation model previously described, will support this forecast, although this position will be reviewed once the risk based prioritisation process is fully implemented.
Right of Way Assets
Vector has continued to allocate a significant portion of capital investment into Right of Way (ROW) maintenance, aiming to address the increasing rate of deterioration and failure of non-Vector owned assets, deployed on service lines along Right of Ways. As a result, the capital expenditure forecast for FY18 has increased $5m from $8m to $13m to reflect the potential public safety risk these third party owned assets present.
Sub-Transmission Cables
Vector still operates two 22kV gas-filled PILC cables that are approaching the end of their economic service life.
The first is a 22kV gas-filled cable between Kingsland zone substation 22kV bus and transformer T1 in Ponsonby zone substation. This cable is due for replacement in FY19 and FY20. Two (in parallel) 22kV paper insulated cables that supply transformer T2 in Ponsonby from Kingsland were installed in 1949 and will also be replaced under the project to replace the gas-filled cable.
The second cable is a 22kV gas-filled cable between Liverpool zone substation and Quay St zone substation. This cable is located between the Liverpool zone substation 22kV bus and Quay St 22kV bus in Auckland’s CBD. Over the last number of years parts of the 11kV network in the CBD have been converted to 22kV which has reinforced the backstop capability between these two centre-city nodes. As a result of this reinforcement, a review is being undertaken to assess the need to replace the gas-filled cable between Liverpool and Quay zone substations.
Distribution Transformers
The high-priority programme to retrofit additional support brackets to overhead distribution transformers and mitigate the risk of the transformer falling from the pole is progressing. However, site investigations have found that not all sites were able to be rectified with the retrofit support
Electricity Asset Management Plan Update 2017
Date: 31 March 2017 Vector Limited Page 9 of 39
bracket due to a range of historical site specific transformer installation designs. Further investigation work to rectify the remainder of the transformers is underway.
Mobile Generator Connection Units
Vector owns two mobile generator connection units (MGCU) which are 10 years old. A number of refurbishment tasks have been identified with the transformers and connecting cables. In addition, Vector has identified a number of operational improvements which will improve safety for the staff operating the units. Refurbishment plans are currently being developed and the refurbishment of the two units is expected to be completed in FY18.
16mm² Bare Copper 11kV Overhead lines
A number of areas exist predominantly in Vector’s northern overhead network in which 16mm² bare Copper conductors were used in the 11kV network at the time of installation in the 1970s. The conductors were fit for purpose at the time from both an electrical and mechanical point of view but failure of these type of conductors is becoming more frequent now that these conductors have been in service for 40 plus years. Vector is developing a plan to upgrade the network in a staged approach over a number of years. Ancillary plant such as post insulators, strain insulators, crossarms, and stays will be replaced to suit the new Aluminium conductors that will provide both increased energy transfer capacity and mechanical strength.
Oil-filled 11kV Ring Main Units
Vector owns and operates a sizeable fleet, ~9300, of oil-filled ground-mounted ring main units (RMUs) in its 11kV network and more than half of this population has reached or is approaching a service life of 40 years. There has been disruptive failures of a number of oil-filled units and Vector has implemented switching restrictions preventing operation of certain types of RMU while energised while for other types a remote switching initiating device must be used to switch RMUs while energised. Due to the significant number of oil-filled RMUs in Vector’s network, switching restrictions have resulted in substantially increased network switching to bypass oil-filled switches that are believed to pose risk during live operation.
Many ageing oil-filled RMUs exist in the Auckland CBD where development is presently unprecedented with a large number of new substations being installed to service new building developments. The increased volume and complexity of switching operations to isolate 11kV circuits in order to install new substations may have increased the likelihood of switching error or incident. Increased switching and resultant outages are also leading to customer dissatisfaction.
Vector is developing a program to replace oil-filled ground mounted distribution switches that have the highest risk of failure and/or are in locations where live operation poses a risk to the public or to the building in which it is located. This program is anticipated be undertaken over a number of years.
Vegetation management
The impact of vegetation on Vector’s network over last four regulatory years has been significant. Vegetation becomes particularly problematic during high winds. The rights electricity distributors have to address vegetation are governed by the Electricity (Hazards from Trees) Regulations 2003 (the Tree Regulations). The Tree Regulations specify specific cut-zones for different conductor types. In Vector’s experience, these cut-zones have proved to be ineffective, especially during high wind events, where a significant proportion of vegetation contacts have resulted from vegetation residing outside of the cut zone.
The other challenge of the Tree Regulations, has been the obligation of the “first cut”. This refers to the requirement for the electricity distributor to bear the burden of the cost for cutting vegetation within the circumferences defined by the Tree Regulations. Vector had originally considered the
Electricity Asset Management Plan Update 2017
Date: 31 March 2017 Vector Limited Page 10 of 39
requirement in the Tree Regulations applied on a “property” basis – i.e. where the cost of the first cut is borne where the electricity distributor visits a property to cut offending vegetation. Subsequent advice has indicated the Tree Regulations must be interpreted on a vegetation basis. Therefore, Vector is still incurring costs for “first cuts” 12 years after the Tree Regulations came into effect. The requirement to do “first cuts” in many instances has very limited reliability benefits for the network. In this respect, Vector welcomes the government’s forthcoming review of the Tree Regulations to ensure they meet the purposes of network businesses.
5 RISK MANAGEMENT
Vector is continuously looking for ways to improve safe work practices. In July 2015, Vector introduced a policy requiring de-energised working. A comprehensive and robust risk assessment process adapted from international practices (UK) was introduced that only allows live work in very exceptional circumstances. Initially the new process focused on high voltage (glove and barrier) work, but it is now extended to work on the low voltage network too.
In practise, the change has meant a total re-think of how work is performed on the network. A significant amount of effort and resource has been invested into developing systems for the coordination and planning of work meaning a smaller number of larger shutdowns and increased efficiency of crews during outages, which has decreased the impact of outages. The increased costs associated with more upfront planning is somewhat offset by the efficiencies seen completing work in volume within an area.
In addition, Vector has also changed how it responds to potential ‘low lines’ reported by the public. The new risk based process results in the line being immediately de-energised through the HV network until a fault person arrives on site to confirm the potential electrical risk to the public.
6 NETWORK PERFORMANCE
The Commerce Commission sets the SAIDI and SAIFI reliability limits with regard to a snapshot of historical reliability data, the reference period. For the most recent Default Price Path (DPP) the Commission used a 10-year historic average from regulatory year 2005 to 2014. The extension of the reference period to 10 years captures a relatively benign period of weather on the upper North Island. Vector also notes the setting of reliability targets based on historical data fails to address changes to the operating environment not as apparent in historical data. In this respect, Vector notes the rapidly increasing passenger fleet in the Auckland region is creating challenges for its business not as apparent during the reference period. As discussed, the more recent change to Vector’s health and safety practices on its network in relation to energised/de-energised works and remote isolations for sagging or down lines is having an impact on our reliability performance that is not reflected in reference period reliability results.
Vector is currently reviewing the existing customer service levels (SAIDI/SAIFI) as a result of safety improvement initiatives which have reduced the use of live-line work practices. It is expected that updated forecasts will be published in the 2018 AMP once tangible evidence of the change impact has been collated to support a revision to the forecasted targets.
7 ASSET MANAGEMENT MATURITY UPDATE
A number of initiatives are underway to improve asset condition data capture, storage, reporting and analysis. To support these initiatives, Vector’s current review of its maintenance standards will now include the specific data requirements for each asset class. This will better inform what

Electricity Asset Management Plan Update 2017
Date: 31 March 2017 Vector Limited Page 11 of 39
changes are required to Vector’s asset management systems and processes, improve consistency and quality of data captured across Vector’s field service providers and support network-wide improvements in asset information. Further improvements are also expected in business intelligence and analytical systems to improve the data and tools available for decision making, specifically in relation to asset performance and risk.
8 CAPITAL EXPENDITURE FORECAST
This section describes the capital expenditure forecasts for the electricity distribution network assets for the next 10-year planning period, and provides a comparison with the 10-year forecast prepared and disclosed in the 2016 AMP (disclosed in March 2016).
Capital Expenditure Forecast
Table 1 below shows the forecast capital expenditure during the planning period, broken down into the asset categories defined in the Commerce Commission’s Electricity Distribution Information Disclosure Determination 2012. The figures are presented in 2018. For reference purposes, Vector has also included the corresponding capital expenditure forecast disclosed in the 2016 AMP escalated to 2018 prices using a PPI of 2% (Table 2).
Table 1 : Proposed capital expenditure forecast
Table 2 : Capital expenditure forecast disclosed in the 2016 AMP escalated to 2018 prices
Comparison to Previous AMP
Figure 2 and Table 3 below shows changes in the capital expenditure forecast by expenditure category between this AMP and the last published AMP (covering the period 1 April 2016 to 31 March 2026).
FY18 FY19 FY20 FY21 FY22 FY23 FY24 FY25 FY26 FY27
Consumer connection 56,585 42,209 37,813 37,346 37,741 38,135 35,611 35,935 36,277 36,610System growth 38,000 44,097 46,674 43,425 43,820 36,419 35,248 39,158 33,636 33,842Asset replacement and renewal 95,620 88,310 88,811 87,410 84,343 70,494 69,721 64,572 65,407 65,178Asset relocations 20,647 19,375 18,461 14,397 14,384 12,753 12,753 12,753 12,753 12,753Reliability, safety and environment:
Quality of supply - - - - - - - - - -Legislative and regulatory - - - - - - - - - -Other reliability, safety and environment 2,203 1,690 1,690 1,690 1,690 1,690 1,924 1,690 1,690 1,690
Non network assets 24,680 18,777 12,415 14,710 12,404 12,441 14,930 14,051 12,587 14,344Total Capital Expenditure 237,735 214,458 205,864 198,978 194,382 171,932 170,188 168,159 162,350 164,417
FY17 AMPFinancial Year ($000)
FY18 FY19 FY20 FY21 FY22 FY23 FY24 FY25 FY26
Consumer connection 48,367 42,871 41,641 41,301 39,067 39,201 38,570 38,932 34,025System growth 43,009 35,714 43,009 36,944 40,628 36,756 40,002 36,257 33,609Asset replacement and renewal 78,755 70,839 80,389 76,764 76,616 80,372 67,393 72,364 64,669Asset relocations 16,066 9,959 10,346 10,346 10,346 10,346 10,346 10,346 10,346Reliability, safety and environment:
Quality of supply - - - - - - - - - Legislative and regulatory - - - - - - - - - Other reliability, safety and environment 1,894 1,722 1,722 1,722 1,722 1,722 1,961 1,722 1,722
Non network assets 12,296 9,226 14,698 11,555 11,309 10,544 12,402 11,254 12,020Total Capital Expenditure 200,388 170,331 191,805 178,632 179,689 178,941 170,675 170,875 156,391
FY16 AMPFinancial Year ($000)

Electricity Asset Management Plan Update 2017
Date: 31 March 2017 Vector Limited Page 12 of 39
Figure 2: Movement between this AMP and the previous AMP’s capital expenditure forecast
Table 3 : Comparison between this AMP and the previous AMP’s capital expenditure forecast
Explanation of Major Capital Expenditure Variances
This section highlights the significant changes in capital expenditure over the 9-year period for which the 2016 AMP and the 2017 AMP overlap, reflect the following key changes:
A $47M increase in asset renewal spend is forecast to address condition notifications of distributed assets that have potential risks to cause public harm, to expedite protection and control measures with the deployment of smart devices, and to allow for an increase in costs associated with de-energised safe work practises.
A $40M increase is asset relocation with $20M cost associated with the City Railway Loop project and various Transpower led initiatives to replace outdoor switchgear to indoor switchgear.
An increase of $32M in non-network spend that is largely attributed to investment in network system optimisation and management platform.
An increase in system growth capex ($15M) is in keeping with Auckland growth projection and continual investment in new network technologies. This is partially offset by a reduction in consumer connection capex due to a lower estimated reticulation and connection charge per site that resulted in a lower overall cost despite higher number of forecast development sites.
0
50
100
150
200
250
FY18 FY19 FY20 FY21 FY22 FY23 FY24 FY25 FY26
Cap
ex Spen
d $M
AMP Movement FY16 v FY17
FY16 AMP FY17 AMP
FY18 FY19 FY20 FY21 FY22 FY23 FY24 FY25 FY26 Total
Consumer connection 8,217 (662) (3,828) (3,955) (1,326) (1,066) (2,959) (2,997) 2,252 (6,322)
System growth (5,009) 8,383 3,666 6,482 3,192 (337) (4,754) 2,901 27 14,550Asset replacement and renewal 16,864 17,471 8,422 10,646 7,727 (9,878) 2,328 (7,793) 738 46,525Asset relocations 4,581 9,416 8,115 4,050 4,038 2,407 2,407 2,407 2,407 39,827Reliability, safety and environment:
Quality of supply - - - - - - - - - -Legislative and regulatory - - - - - - - - - -Other reliability, safety and environment 310 (32) (32) (32) (32) (32) (37) (32) (32) 48
Non network assets 12,385 9,551 (2,283) 3,155 1,095 1,897 2,528 2,797 567 31,691Total Capital Expenditure 37,347 44,127 14,059 20,346 14,694 (7,010) (487) (2,717) 5,959 126,320
2016/2017 AMP VariancesFinancial Year ($000)

Electricity Asset Management Plan Update 2017
Date: 31 March 2017 Vector Limited Page 13 of 39
9 OPERATIONAL EXPENDITURE FORECAST
This section describes the operational expenditure forecasts for the electricity distribution network assets for the next 10-year planning period, and provides a comparison with the 10-year forecast prepared and disclosed in the 2016 AMP (disclosed in March 2016).
Operational Expenditure Forecast
Table 4 below shows the forecast operational expenditure during the planning period, broken down into the asset categories defined in the Commerce Commission’s Electricity Distribution Information Disclosure Determination. The figures are presented in 2018. For reference, Vector has also included the corresponding operational expenditure forecast disclosed in the 2016 AMP escalated to 2018 prices using a PPI of 2% (Table 5).
Table 4 : Proposed operational expenditure forecast
Table 5 : Operational expenditure forecast disclosed in the 2016 AMP escalated to 2018 prices
Comparison to previous AMP
Figure 3 and Table 6 below shows the changes in the operational expenditure forecasts by expenditure category between this AMP and the last published AMP (covering the period 1 April 2016 to 31 March 2026).
Figure 3: Movement between this AMP and the previous AMP’s operational expenditure forecast
FY18 FY19 FY20 FY21 FY22 FY23 FY24 FY25 FY26 FY27
Service interruptions and emergencies 10,024 10,098 10,172 10,247 10,323 10,399 10,476 10,554 10,632 10,711Vegetation management 4,946 4,985 5,024 5,063 5,103 5,143 5,183 5,224 5,265 5,306Routine and corrective maintenance and inspection 15,746 13,849 13,984 14,119 14,255 14,391 14,527 14,664 14,802 14,940
Asset replacement and renewal 13,848 16,974 17,060 17,148 17,236 16,814 16,901 16,988 17,076 17,164System operations and network support 34,839 34,866 34,894 34,922 34,949 34,978 35,006 35,034 35,063 35,092Business support 39,265 39,265 39,265 39,265 39,265 39,265 39,265 39,265 39,265 39,265Total Operational Expenditure 118,667 120,037 120,399 120,763 121,130 120,989 121,358 121,729 122,103 122,479
2017 AMPFinancial Year ($000)
FY18 FY19 FY20 FY21 FY22 FY23 FY24 FY25 FY26
Service interruptions and emergencies 9,687 9,761 9,837 9,653 9,468 9,282 9,096 9,169 9,242Vegetation management 4,432 4,466 4,500 4,534 4,568 4,603 4,638 4,673 4,708Routine and corrective maintenance and inspection 12,361 12,586 12,817 13,055 13,293 13,532 13,771 14,011 14,251
Asset replacement and renewal 15,377 18,496 18,496 18,496 18,496 16,417 16,417 16,417 16,417System operations and network support 43,690 43,782 43,814 43,847 43,880 43,914 43,947 43,981 44,015Business support 29,679 29,679 29,679 29,679 29,679 29,679 29,679 29,679 29,679Total Operational Expenditure 115,226 118,770 119,142 119,263 119,384 117,426 117,548 117,929 118,312
2016 AMPFinancial Year ($000)
0
20
40
60
80
100
120
140
FY18 FY19 FY20 FY21 FY22 FY23 FY24 FY25 FY26
Opex Sp
end $M
AMP Movement FY16 v FY17
FY16 AMP FY17 AMP

Electricity Asset Management Plan Update 2017
Date: 31 March 2017 Vector Limited Page 14 of 39
Table 6 : Comparison between this AMP and the previous AMP’s operational expenditure forecast
Explanation of Major Operational Expenditure Variances
This section highlights the significant changes in operational expenditure over the 9-year period for which the 2016 AMP and the 2017 AMP overlap, reflect the following key changes:
Non-network costs have increased overall by $6M. There is an increase in business support largely driven by an increase in the electricity cost share with the sale of the gas transmission and non-Auckland gas distribution businesses. This is partially offset by a decrease in system operations and network support cost, largely as the result of Vector Limited entering into a new agreement for the provision of the telecommunications services, which will result in a replacement of operating expenditure with capital expenditure.
An increase of $11M in expected routine and corrective maintenance and inspection costs to reflect a catch up of costs relating to oil switchgear, additional costs for the inspection of low lines and vegetation surveys and a 5% increase in costs associated with de-energisation.
An increase of $8M in expected service interruptions and emergencies to reflect the growing size of the network each year and a 17.5% increase in costs associated with de-energised works.
An increase of $5M in vegetation management costs based on the FY17 forecast costs which includes an additional expenditure beyond the Top 40 feeder focus.
Compared to the historical level of expenditure, additional resource is forecast in asset replacement and renewal to respond to the increased number of defects in the asset condition notification pool. However, the forecast increase in the 2016 AMP was relatively aggressive, and is moderated (reduced) in the 2017 AMP. The decrease in costs has been partially offset by a 5% increase in costs associated with de-energised works.
10 APPENDIX
FY18 FY19 FY20 FY21 FY22 FY23 FY24 FY25 FY26 Total
Service interruptions and emergencies 337 336 335 594 855 1,117 1,380 1,385 1,390 7,731Vegetation management 514 519 524 530 535 540 545 551 556 4,815Routine and corrective maintenance and inspection 3,385 1,263 1,167 1,064 961 859 756 653 551 10,659
Asset replacement and renewal (1,529) (1,522) (1,435) (1,348) (1,260) 398 484 572 659 (4,982)System operations and network support (8,852) (8,915) (8,921) (8,926) (8,931) (8,936) (8,942) (8,947) (8,952) (80,321)Business support 9,586 9,586 9,586 9,586 9,586 9,586 9,586 9,586 9,586 86,273Total Operational Expenditure 3,441 1,267 1,256 1,500 1,746 3,563 3,810 3,800 3,791 24,175
2016/2017 AMP VariancesFinancial Year ($000)

Electricity Asset Management Plan Update 2017
Date: 31 March 2017 Vector Limited Page 15 of 39
Electricity Asset Management Plan Update
Information Disclosure 2017
Appendix 1 Report on Forecast Capital Expenditure

Electricity Asset Management Plan Update 2017
Date: 31 March 2017 Vector Limited Page 16 of 39
Company NameAMP Planning Period
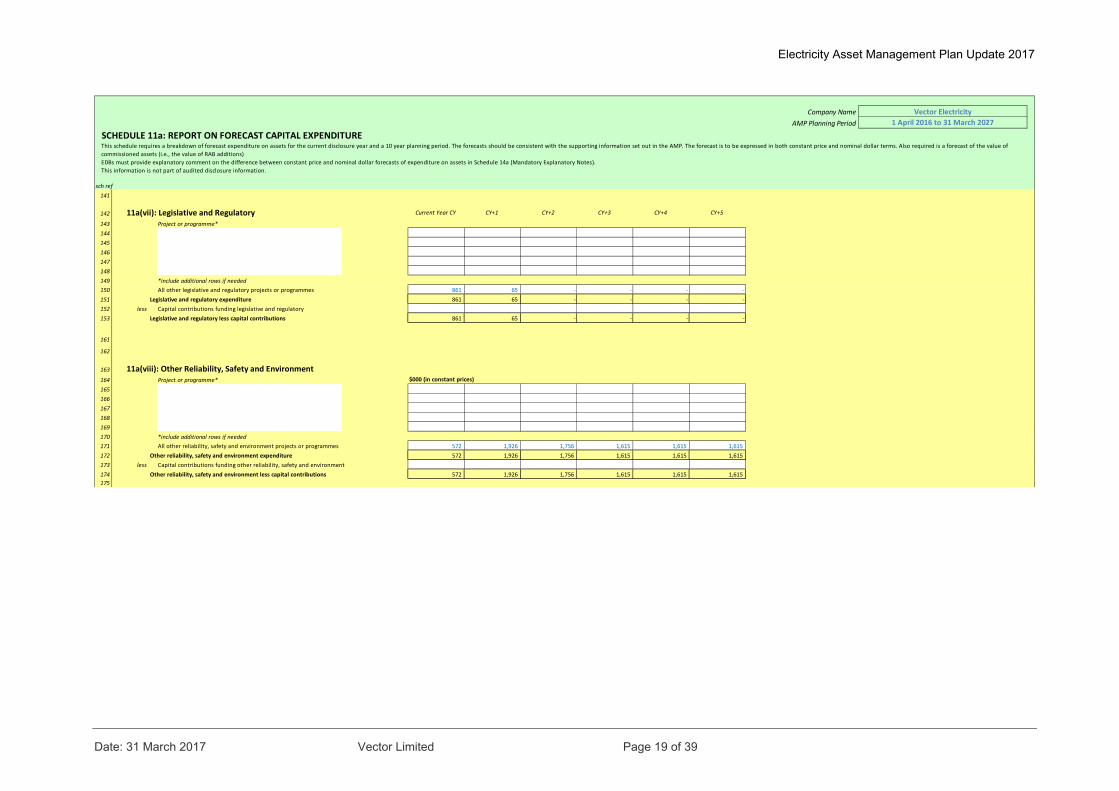
SCHEDULE 11a: REPORT ON FORECAST CAPITAL EXPENDITURE
sch ref
7 Current Year CY CY+1 CY+2 CY+3 CY+4 CY+5 CY+6 CY+7 CY+8 CY+9 CY+10
8 RY17 RY18 RY19 RY20 RY21 RY22 RY23 RY24 RY25 RY26 RY27
9 11a(i): Expenditure on Assets Forecast $000 (in nominal dollars)
10 Consumer connection 56,291 57,829 46,128 39,984 39,265 40,242 41,476 40,309 40,676 41,879 43,113
11 System growth 33,984 36,078 42,004 46,338 45,424 45,793 40,884 38,728 42,437 39,698 39,074
12 Asset replacement and renewal 83,545 95,225 90,391 90,762 91,612 90,622 80,320 77,448 74,415 75,143 76,689
13 Asset relocations 18,625 21,648 19,731 19,106 16,072 15,303 14,278 14,112 14,394 14,682 14,976
14 Reliability, safety and environment:
15 Quality of supply 1,511 988 ‐ ‐ ‐ ‐ ‐ ‐ ‐ ‐ ‐
16 Legislative and regulatory 861 66 ‐ ‐ ‐ ‐ ‐ ‐ ‐ ‐ ‐
17 Other reliability, safety and environment 572 1,965 1,828 1,715 1,749 1,784 1,820 2,051 1,959 1,931 1,970
18 Total reliability, safety and environment 2,944 3,019 1,828 1,715 1,749 1,784 1,820 2,051 1,959 1,931 1,970
19 Expenditure on network assets 195,389 213,799 200,082 197,905 194,122 193,744 178,778 172,648 173,881 173,333 175,822
20 Non‐network assets 12,213 21,970 20,496 14,460 14,888 13,944 13,621 15,990 16,269 15,061 16,492
21 Expenditure on assets 207,602 235,769 220,578 212,365 209,010 207,688 192,399 188,638 190,150 188,394 192,314
2223 plus Cost of financing 3,787 4,221 4,135 4,146 4,069 4,057 3,710 3,595 3,679 3,609 3,648
24 less Value of capital contributions 50,770 52,084 43,829 38,997 36,533 36,752 36,964 35,776 36,134 37,175 38,243
25 plus Value of vested assets
2627 Capital expenditure forecast 160,619 187,906 180,884 177,514 176,546 174,993 159,145 156,457 157,695 154,828 157,719
2829 Value of commissioned assets 247,345 188,113 182,352 179,940 179,852 174,026 160,366 155,459 159,400 153,812 159,427
30 Current Year CY CY+1 CY+2 CY+3 CY+4 CY+5 CY+6 CY+7 CY+8 CY+9 CY+10
32 $000 (in constant prices)33 Consumer connection 56,291 56,671 44,321 37,652 36,250 36,424 36,805 35,068 34,693 35,019 35,344
34 System growth 33,984 35,356 40,358 43,636 41,936 41,448 36,279 33,692 36,195 33,195 32,033
35 Asset replacement and renewal 83,545 93,319 86,850 85,469 84,578 82,024 71,274 67,378 63,470 62,834 62,869
36 Asset relocations 18,625 21,215 18,958 17,992 14,838 13,851 12,670 12,277 12,277 12,277 12,277
37 Reliability, safety and environment:
38 Quality of supply 1,511 968 ‐ ‐ ‐ ‐ ‐ ‐ ‐ ‐ ‐
39 Legislative and regulatory 861 65 ‐ ‐ ‐ ‐ ‐ ‐ ‐ ‐ ‐
40 Other reliability, safety and environment 572 1,926 1,756 1,615 1,615 1,615 1,615 1,784 1,671 1,615 1,615
41 Total reliability, safety and environment 2,944 2,959 1,756 1,615 1,615 1,615 1,615 1,784 1,671 1,615 1,615
42 Expenditure on network assets 195,389 209,520 192,243 186,364 179,217 175,362 158,643 150,199 148,306 144,940 144,138
43 Non‐network assets 12,213 21,530 19,693 13,617 13,745 12,621 12,087 13,911 13,876 12,594 13,520
44 Expenditure on assets 207,602 231,050 211,936 199,981 192,962 187,983 170,730 164,110 162,182 157,534 157,658
4546 Subcomponents of expenditure on assets (where known)47 Energy efficiency and demand side management, reduction of energy losses
48 Overhead to underground conversion 2,169 8,992 6,895 6,875 6,875 6,875 6,875 6,875 6,875 6,875 6,875
49 Research and development 8,390 6,719 5,319 5,319 5,319 5,319 5,319 5,319 5,319 5,319 5,319
Vector Electricity1 April 2016 to 31 March 2027
This schedule requires a breakdown of forecast expenditure on assets for the current disclosure year and a 10 year planning period. The forecasts should be consistent with the supporting information set out in the AMP. The forecast is to be expressed in both constant price and nominal dollar terms. Also required is a forecast of the value of
commissioned assets (i.e., the value of RAB additions)
EDBs must provide explanatory comment on the difference between constant price and nominal dollar forecasts of expenditure on assets in Schedule 14a (Mandatory Explanatory Notes).
This information is not part of audited disclosure information.

Electricity Asset Management Plan Update 2017
Date: 31 March 2017 Vector Limited Page 17 of 39
Company NameAMP Planning Period
SCHEDULE 11a: REPORT ON FORECAST CAPITAL EXPENDITURE
sch ref
57 Current Year CY CY+1 CY+2 CY+3 CY+4 CY+5 CY+6 CY+7 CY+8 CY+9 CY+105859 Difference between nominal and constant price forecasts $000
60 Consumer connection ‐ 1,158 1,807 2,332 3,015 3,818 4,671 5,241 5,983 6,860 7,769
61 System growth ‐ 722 1,646 2,702 3,488 4,345 4,605 5,036 6,242 6,503 7,041
62 Asset replacement and renewal ‐ 1,906 3,541 5,293 7,034 8,598 9,046 10,070 10,945 12,309 13,820
63 Asset relocations ‐ 433 773 1,114 1,234 1,452 1,608 1,835 2,117 2,405 2,699
64 Reliability, safety and environment:
65 Quality of supply ‐ 20 ‐ ‐ ‐ ‐ ‐ ‐ ‐ ‐ ‐
66 Legislative and regulatory ‐ 1 ‐ ‐ ‐ ‐ ‐ ‐ ‐ ‐ ‐
67 Other reliability, safety and environment ‐ 39 72 100 134 169 205 267 288 316 355
68 Total reliability, safety and environment ‐ 60 72 100 134 169 205 267 288 316 355
69 Expenditure on network assets ‐ 4,279 7,839 11,541 14,905 18,382 20,135 22,449 25,575 28,393 31,684
70 Non‐network assets ‐ 440 803 843 1,143 1,323 1,534 2,079 2,393 2,467 2,972
71 Expenditure on assets ‐ 4,719 8,642 12,384 16,048 19,705 21,669 24,528 27,968 30,860 34,656
72
73 CY+1 CY+2 CY+3 CY+4 CY+5
74 11a(ii): Consumer Connection75 Consumer types defined by EDB* $000 (in constant prices)
76 Service Connection 12,726 16,446 13,849 13,670 13,899 14,131
Customer Substations 9,679 13,145 11,840 7,965 7,023 7,023
77 Business subdivisions 2,984 2,495 2,185 2,069 2,001 1,979
78 Residential Subdivisions 25,404 19,953 12,665 10,338 9,717 9,681
Capacity Changes 4,166 3,380 3,271 3,271 3,271 3,271
79 Street Lighting 1,321 1,252 511 339 339 339
Relocations ‐ ‐ ‐ ‐ ‐ ‐
80 Easements 11 ‐ ‐ ‐ ‐ ‐
81 *include additional rows if needed82 Consumer connection expenditure 56,291 56,671 44,321 37,652 36,250 36,424
83 less Capital contributions funding consumer connection 41,055 43,040 34,129 29,366 28,458 28,649
84 Consumer connection less capital contributions 15,236 13,631 10,192 8,286 7,792 7,775
85 11a(iii): System Growth86 Subtransmission 819 1,397 296 3,170 1,453 662
87 Zone substations 20,496 10,228 23,980 27,206 25,557 22,548
88 Distribution and LV lines 167 ‐ ‐ ‐ ‐ ‐
89 Distribution and LV cables 6,462 11,737 9,253 7,941 9,607 12,919
90 Distribution substations and transformers 1,378 ‐ ‐ ‐ ‐ ‐
91 Distribution switchgear 178 8,317 6,762 5,319 5,319 5,319
92 Other network assets 4,484 3,677 67 ‐ ‐ ‐
93 System growth expenditure 33,984 35,356 40,358 43,636 41,936 41,448
94 less Capital contributions funding system growth
95 System growth less capital contributions 33,984 35,356 40,358 43,636 41,936 41,448
Vector Electricity1 April 2016 to 31 March 2027
Current Year CY
This schedule requires a breakdown of forecast expenditure on assets for the current disclosure year and a 10 year planning period. The forecasts should be consistent with the supporting information set out in the AMP. The forecast is to be expressed in both constant price and nominal dollar terms. Also required is a forecast of the value of
commissioned assets (i.e., the value of RAB additions)
EDBs must provide explanatory comment on the difference between constant price and nominal dollar forecasts of expenditure on assets in Schedule 14a (Mandatory Explanatory Notes).
This information is not part of audited disclosure information.

Electricity Asset Management Plan Update 2017
Date: 31 March 2017 Vector Limited Page 18 of 39
Company NameAMP Planning Period
SCHEDULE 11a: REPORT ON FORECAST CAPITAL EXPENDITURE
sch ref
103 Current Year CY CY+1 CY+2 CY+3 CY+4 CY+5104
105 11a(iv): Asset Replacement and Renewal $000 (in constant prices)
106 Subtransmission 243 51 5,863 4,742 968 2,028
107 Zone substations 17,128 24,598 22,439 25,511 31,424 28,760
108 Distribution and LV lines 34,194 39,126 32,668 29,974 26,989 25,994
109 Distribution and LV cables 3,580 3,459 3,418 3,394 3,394 3,394
110 Distribution substations and transformers 14,119 12,275 10,822 10,539 10,539 10,539
111 Distribution switchgear 12,036 10,440 9,182 8,937 8,937 8,937
112 Other network assets 2,245 3,370 2,458 2,372 2,327 2,372
113 Asset replacement and renewal expenditure 83,545 93,319 86,850 85,469 84,578 82,024
114 less Capital contributions funding asset replacement and renewal
115 Asset replacement and renewal less capital contributions 83,545 93,319 86,850 85,469 84,578 82,024
116 11a(v):Asset Relocations117 Project or programme*118 Overground to underground conversions 2,169 8,992 6,895 6,875 6,875 6,875
119120121
123 *include additional rows if needed124 All other asset relocations projects or programmes 16,456 12,223 12,063 11,117 7,963 6,976
125 Asset relocations expenditure 18,625 21,215 18,958 17,992 14,838 13,851
126 less Capital contributions funding asset relocations 9,715 8,001 7,983 7,357 5,270 4,616
127 Asset relocations less capital contributions 8,910 13,214 10,975 10,635 9,568 9,235
128
129 11a(vi):Quality of Supply130 Project or programme*131132133134135136 *include additional rows if needed137 All other quality of supply projects or programmes 1,511 968 ‐ ‐ ‐ ‐
138 Quality of supply expenditure 1,511 968 ‐ ‐ ‐ ‐
139 less Capital contributions funding quality of supply
140 Quality of supply less capital contributions 1,511 968 ‐ ‐ ‐ ‐
141
Vector Electricity1 April 2016 to 31 March 2027
This schedule requires a breakdown of forecast expenditure on assets for the current disclosure year and a 10 year planning period. The forecasts should be consistent with the supporting information set out in the AMP. The forecast is to be expressed in both constant price and nominal dollar terms. Also required is a forecast of the value of
commissioned assets (i.e., the value of RAB additions)
EDBs must provide explanatory comment on the difference between constant price and nominal dollar forecasts of expenditure on assets in Schedule 14a (Mandatory Explanatory Notes).
This information is not part of audited disclosure information.
Electricity Asset Management Plan Update 2017
Date: 31 March 2017 Vector Limited Page 19 of 39
Company NameAMP Planning Period
SCHEDULE 11a: REPORT ON FORECAST CAPITAL EXPENDITURE
sch ref141
142 11a(vii): Legislative and Regulatory Current Year CY CY+1 CY+2 CY+3 CY+4 CY+5
143 Project or programme*144145146147148149 *include additional rows if needed150 All other legislative and regulatory projects or programmes 861 65 ‐ ‐ ‐ ‐
151 Legislative and regulatory expenditure 861 65 ‐ ‐ ‐ ‐
152 less Capital contributions funding legislative and regulatory
153 Legislative and regulatory less capital contributions 861 65 ‐ ‐ ‐ ‐
161
162
163 11a(viii): Other Reliability, Safety and Environment164 Project or programme* $000 (in constant prices)
165166167168169170 *include additional rows if needed171 All other reliability, safety and environment projects or programmes 572 1,926 1,756 1,615 1,615 1,615
172 Other reliability, safety and environment expenditure 572 1,926 1,756 1,615 1,615 1,615
173 less Capital contributions funding other reliability, safety and environment
174 Other reliability, safety and environment less capital contributions 572 1,926 1,756 1,615 1,615 1,615
175
Vector Electricity1 April 2016 to 31 March 2027
This schedule requires a breakdown of forecast expenditure on assets for the current disclosure year and a 10 year planning period. The forecasts should be consistent with the supporting information set out in the AMP. The forecast is to be expressed in both constant price and nominal dollar terms. Also required is a forecast of the value of
commissioned assets (i.e., the value of RAB additions)
EDBs must provide explanatory comment on the difference between constant price and nominal dollar forecasts of expenditure on assets in Schedule 14a (Mandatory Explanatory Notes).
This information is not part of audited disclosure information.

Electricity Asset Management Plan Update 2017
Date: 31 March 2017 Vector Limited Page 20 of 39
Company NameAMP Planning Period
SCHEDULE 11a: REPORT ON FORECAST CAPITAL EXPENDITURE
sch ref176177
178 11a(ix): Non‐Network Assets Current Year CY CY+1 CY+2 CY+3 CY+4 CY+5
179 Routine expenditure180 Project or programme*181182183184185186 *include additional rows if needed187 All other routine expenditure projects or programmes 7,458 13,161 12,041 8,326 8,404 7,717
188 Routine expenditure 7,458 13,161 12,041 8,326 8,404 7,717
189 Atypical expenditure190 Project or programme*191192193194195196 *include additional rows if needed197 All other atypical projects or programmes 4,755 8,369 7,652 5,291 5,341 4,904
198 Atypical expenditure 4,755 8,369 7,652 5,291 5,341 4,904
199200 Non‐network assets expenditure 12,213 21,530 19,693 13,617 13,745 12,621
Vector Electricity1 April 2016 to 31 March 2027
This schedule requires a breakdown of forecast expenditure on assets for the current disclosure year and a 10 year planning period. The forecasts should be consistent with the supporting information set out in the AMP. The forecast is to be expressed in both constant price and nominal dollar terms. Also required is a forecast of the value of
commissioned assets (i.e., the value of RAB additions)
EDBs must provide explanatory comment on the difference between constant price and nominal dollar forecasts of expenditure on assets in Schedule 14a (Mandatory Explanatory Notes).
This information is not part of audited disclosure information.

Electricity Asset Management Plan Update 2017
Date: 31 March 2017 Vector Limited Page 21 of 39
Electricity Asset Management Plan Update
Information Disclosure 2017
Appendix 2 Report on Forecast Operational
Expenditure

Electricity Asset Management Plan Update 2017
Date: 31 March 2017 Vector Limited Page 22 of 39
Company NameAMP Planning Period
SCHEDULE 11b: REPORT ON FORECAST OPERATIONAL EXPENDITURE
sch ref7 Current Year CY CY+1 CY+2 CY+3 CY+4 CY+5 CY+6 CY+7 CY+8 CY+9 CY+108 for year ended 31 Mar 17 31 Mar 18 31 Mar 19 31 Mar 20 31 Mar 21 31 Mar 22 31 Mar 23 31 Mar 24 31 Mar 25 31 Mar 26 31 Mar 27
9 Operational Expenditure Forecast $000 (in nominal dollars)10 Service interruptions and emergencies 8,678 9,713 10,283 10,569 10,860 11,159 11,466 11,782 12,107 12,440 12,783
11 Vegetation management 5,349 4,938 5,076 5,219 5,365 5,515 5,670 5,829 5,992 6,159 6,332
12 Routine and corrective maintenance and inspection 12,042 15,445 14,613 14,520 14,955 15,400 15,858 16,330 16,814 17,311 17,822
13 Asset replacement and renewal 10,898 13,288 16,519 17,735 18,183 18,641 18,689 19,019 19,499 19,991 20,496
14 Network Opex 36,966 43,384 46,490 48,043 49,364 50,715 51,683 52,960 54,412 55,902 57,433
15 System operations and network support 29,800 34,730 35,563 36,313 37,071 37,840 38,628 39,434 40,256 41,093 41,949
16 Business support 37,975 39,123 40,057 40,870 41,689 42,521 43,371 44,241 45,126 46,027 46,947
17 Non‐network opex 67,775 73,853 75,621 77,182 78,760 80,361 81,999 83,676 85,382 87,120 88,896
18 Operational expenditure 104,741 117,237 122,111 125,226 128,124 131,076 133,682 136,635 139,795 143,022 146,329
19 Current Year CY CY+1 CY+2 CY+3 CY+4 CY+5 CY+6 CY+7 CY+8 CY+9 CY+1020 for year ended 31 Mar 17 31 Mar 18 31 Mar 19 31 Mar 20 31 Mar 21 31 Mar 22 31 Mar 23 31 Mar 24 31 Mar 25 31 Mar 26 31 Mar 27
21 $000 (in constant prices)22 Service interruptions and emergencies 8,678 9,519 9,880 9,953 10,026 10,100 10,175 10,250 10,326 10,403 10,480
23 Vegetation management 5,349 4,839 4,877 4,915 4,953 4,992 5,031 5,071 5,110 5,150 5,191
24 Routine and corrective maintenance and inspection 12,042 15,136 14,040 13,674 13,806 13,939 14,072 14,206 14,340 14,475 14,610
25 Asset replacement and renewal 10,898 13,023 15,871 16,701 16,787 16,873 16,585 16,545 16,630 16,716 16,803
26 Network Opex 36,966 42,517 44,668 45,243 45,572 45,904 45,863 46,072 46,407 46,744 47,084
27 System operations and network support 29,800 34,035 34,169 34,196 34,223 34,251 34,278 34,306 34,334 34,362 34,390
28 Business support 37,975 38,341 38,487 38,487 38,487 38,487 38,487 38,487 38,487 38,487 38,487
29 Non‐network opex 67,775 72,376 72,656 72,683 72,710 72,738 72,765 72,793 72,821 72,849 72,877
30 Operational expenditure 104,741 114,894 117,324 117,926 118,283 118,642 118,628 118,865 119,228 119,593 119,961
31 Subcomponents of operational expenditure (where known)323334 Direct billing*
35 Research and Development ‐ ‐ ‐ ‐ ‐ ‐ ‐ ‐ ‐ ‐ ‐
36 Insurance 2,619 2,524 2,575 2,627 2,680 2,733 2,788 2,844 2,901 2,959 3,018
37 * Direct billing expenditure by suppliers that direct bill the majority of their consumers3839 Current Year CY CY+1 CY+2 CY+3 CY+4 CY+5 CY+6 CY+7 CY+8 CY+9 CY+1040
41 Difference between nominal and real forecasts $00042 Service interruptions and emergencies ‐ 194 403 616 834 1,058 1,291 1,532 1,781 2,038 2,303
43 Vegetation management ‐ 99 199 304 412 523 638 758 882 1,009 1,141
44 Routine and corrective maintenance and inspection ‐ 309 573 846 1,149 1,461 1,786 2,124 2,474 2,836 3,211
45 Asset replacement and renewal ‐ 266 648 1,034 1,397 1,768 2,105 2,473 2,869 3,275 3,693
46 Network Opex ‐ 867 1,822 2,801 3,792 4,811 5,820 6,888 8,005 9,157 10,349
47 System operations and network support ‐ 694 1,394 2,117 2,847 3,589 4,350 5,129 5,923 6,731 7,559
48 Business support ‐ 782 1,570 2,382 3,202 4,033 4,884 5,754 6,639 7,540 8,459
49 Non‐network opex ‐ 1,476 2,964 4,499 6,050 7,623 9,234 10,883 12,562 14,271 16,018
50 Operational expenditure ‐ 2,344 4,787 7,300 9,841 12,434 15,054 17,770 20,567 23,428 26,368
Vector Electricity1 April 2017‐ 31 March 2027
This schedule requires a breakdown of forecast operational expenditure for the disclosure year and a 10 year planning period. The forecasts should be consistent with the supporting information set out in the AMP. The forecast is to be expressed in both constant price and nominal dollar terms.
EDBs must provide explanatory comment on the difference between constant price and nominal dollar operational expenditure forecasts in Schedule 14a (Mandatory Explanatory Notes).
This information is not part of audited disclosure information.
Energy efficiency and demand side management, reduction of
energy losses

Electricity Asset Management Plan Update 2017
Date: 31 March 2017 Vector Limited Page 23 of 39
Electricity Asset Management Plan Update
Information Disclosure 2017
Appendix 3 Report on Asset Condition
Electricity Asset Management Plan Update 2017
Date: 31 March 2017 Vector Limited Page 24 of 39
Company NameAMP Planning Period
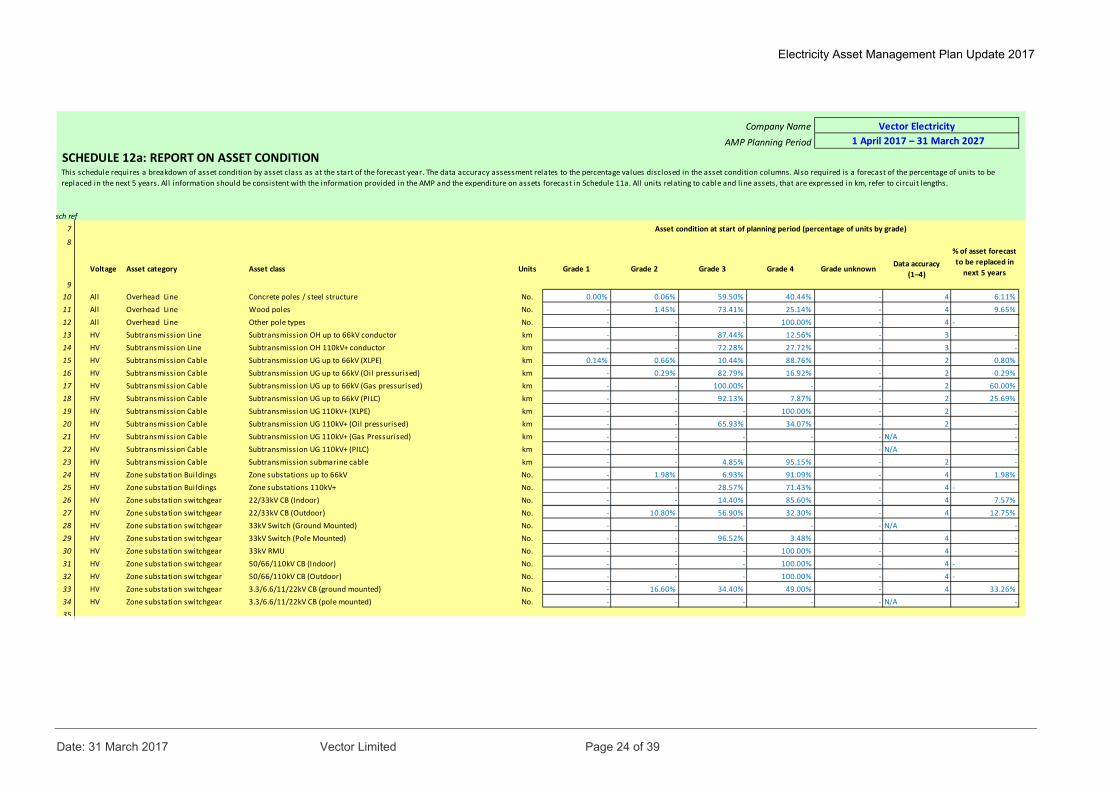
SCHEDULE 12a: REPORT ON ASSET CONDITION
sch ref7
8
9
Voltage Asset category Asset class Units Grade 1 Grade 2 Grade 3 Grade 4 Grade unknown Data accuracy (1–4)
10 All Overhead Line Concrete poles / steel structure No. 0.00% 0.06% 59.50% 40.44% ‐ 4 6.11%
11 All Overhead Line Wood poles No. ‐ 1.45% 73.41% 25.14% ‐ 4 9.65%
12 All Overhead Line Other pole types No. ‐ ‐ ‐ 100.00% ‐ 4 ‐
13 HV Subtransmission Line Subtransmission OH up to 66kV conductor km ‐ ‐ 87.44% 12.56% ‐ 3 ‐
14 HV Subtransmission Line Subtransmission OH 110kV+ conductor km ‐ ‐ 72.28% 27.72% ‐ 3 ‐
15 HV Subtransmission Cable Subtransmission UG up to 66kV (XLPE) km 0.14% 0.66% 10.44% 88.76% ‐ 2 0.80%
16 HV Subtransmission Cable Subtransmission UG up to 66kV (Oil pressurised) km ‐ 0.29% 82.79% 16.92% ‐ 2 0.29%
17 HV Subtransmission Cable Subtransmission UG up to 66kV (Gas pressurised) km ‐ ‐ 100.00% ‐ ‐ 2 60.00%
18 HV Subtransmission Cable Subtransmission UG up to 66kV (PILC) km ‐ ‐ 92.13% 7.87% ‐ 2 25.69%
19 HV Subtransmission Cable Subtransmission UG 110kV+ (XLPE) km ‐ ‐ ‐ 100.00% ‐ 2 ‐
20 HV Subtransmission Cable Subtransmission UG 110kV+ (Oil pressurised) km ‐ ‐ 65.93% 34.07% ‐ 2 ‐
21 HV Subtransmission Cable Subtransmission UG 110kV+ (Gas Pressurised) km ‐ ‐ ‐ ‐ ‐ N/A ‐
22 HV Subtransmission Cable Subtransmission UG 110kV+ (PILC) km ‐ ‐ ‐ ‐ ‐ N/A ‐
23 HV Subtransmission Cable Subtransmission submarine cable km ‐ ‐ 4.85% 95.15% ‐ 2 ‐
24 HV Zone substation Buildings Zone substations up to 66kV No. ‐ 1.98% 6.93% 91.09% ‐ 4 1.98%
25 HV Zone substation Buildings Zone substations 110kV+ No. ‐ ‐ 28.57% 71.43% ‐ 4 ‐
26 HV Zone substation switchgear 22/33kV CB (Indoor) No. ‐ ‐ 14.40% 85.60% ‐ 4 7.57%
27 HV Zone substation switchgear 22/33kV CB (Outdoor) No. ‐ 10.80% 56.90% 32.30% ‐ 4 12.75%
28 HV Zone substation switchgear 33kV Switch (Ground Mounted) No. ‐ ‐ ‐ ‐ ‐ N/A ‐
29 HV Zone substation switchgear 33kV Switch (Pole Mounted) No. ‐ ‐ 96.52% 3.48% ‐ 4 ‐
30 HV Zone substation switchgear 33kV RMU No. ‐ ‐ ‐ 100.00% ‐ 4 ‐
31 HV Zone substation switchgear 50/66/110kV CB (Indoor) No. ‐ ‐ ‐ 100.00% ‐ 4 ‐
32 HV Zone substation switchgear 50/66/110kV CB (Outdoor) No. ‐ ‐ ‐ 100.00% ‐ 4 ‐
33 HV Zone substation switchgear 3.3/6.6/11/22kV CB (ground mounted) No. ‐ 16.60% 34.40% 49.00% ‐ 4 33.26%
34 HV Zone substation switchgear 3.3/6.6/11/22kV CB (pole mounted) No. ‐ ‐ ‐ ‐ ‐ N/A ‐
35
Vector Electricity 1 April 2017 – 31 March 2027
% of asset forecast to be replaced in next 5 years
Asset condition at start of planning period (percentage of units by grade)
This schedule requires a breakdown of asset condition by asset class as at the start of the forecast year. The data accuracy assessment relates to the percentage values disclosed in the asset condition columns. Also required is a forecast of the percentage of units to be
replaced in the next 5 years. All information should be consistent with the information provided in the AMP and the expenditure on assets forecast in Schedule 11a. All units relating to cable and l ine assets, that are expressed in km, refer to circuit lengths.

Electricity Asset Management Plan Update 2017
Date: 31 March 2017 Vector Limited Page 25 of 39
3637
38
Voltage Asset category Asset class Units Grade 1 Grade 2 Grade 3 Grade 4 Grade unknown Data accuracy (1–4)
39 HV Zone Substation Transformer Zone Substation Transformers No. ‐ 1.39% 52.31% 46.30% ‐ 4 9.35%
40 HV Distribution Line Distribution OH Open Wire Conductor km ‐ 0.00% 67.33% 32.67% ‐ 3 0.26%
41 HV Distribution Line Distribution OH Aerial Cable Conductor km ‐ ‐ ‐ ‐ ‐ N/A ‐
42 HV Distribution Line SWER conductor km ‐ ‐ ‐ ‐ ‐ N/A ‐
43 HV Distribution Cable Distribution UG XLPE or PVC km 0.05% 0.21% 4.65% 95.09% ‐ 2 1.07%
44 HV Distribution Cable Distribution UG PILC km 0.11% 0.80% 42.61% 56.47% ‐ 2 0.91%
45 HV Distribution Cable Distribution Submarine Cable km ‐ ‐ 86.11% 13.89% ‐ 2 ‐
46 HV Distribution switchgear 3.3/6.6/11/22kV CB (pole mounted) ‐ reclosers and sectionalisers No. ‐ ‐ 0.39% 99.61% ‐ 4 11.36%
47 HV Distribution switchgear 3.3/6.6/11/22kV CB (Indoor) No. 0.61% ‐ 29.45% 69.94% ‐ 4 ‐
48 HV Distribution switchgear 3.3/6.6/11/22kV Switches and fuses (pole mounted) No. 2.39% 1.42% 47.47% 48.71% ‐ 4 9.13%
49 HV Distribution switchgear 3.3/6.6/11/22kV Switch (ground mounted) ‐ except RMU No. 0.78% 1.05% 69.08% 29.09% ‐ 3 8.02%
50 HV Distribution switchgear 3.3/6.6/11/22kV RMU No. 0.78% 1.05% 48.90% 49.27% ‐ 3 3.93%
51 HV Distribution Transformer Pole Mounted Transformer No. 0.99% 0.67% 33.09% 65.25% ‐ 3 8.13%
52 HV Distribution Transformer Ground Mounted Transformer No. 4.45% 2.32% 35.26% 57.97% ‐ 3 6.77%
53 HV Distribution Transformer Voltage regulators No. ‐ ‐ ‐ 100.00% ‐ 4 ‐
54 HV Distribution Substations Ground Mounted Substation Housing No. 1.79% 1.31% 74.26% 22.64% ‐ 4 3.10%
55 LV LV Line LV OH Conductor km ‐ ‐ 77.98% 22.01% ‐ 3 0.23%
56 LV LV Cable LV UG Cable km ‐ 0.28% 36.51% 63.17% ‐ 2 0.28%
57 LV LV Streetlighting LV OH/UG Streetlight circuit km ‐ ‐ ‐ ‐ 100.00% 1 0.08%
58 LV Connections OH/UG consumer service connections No. ‐ ‐ ‐ ‐ 100.00% 1 ‐
59 All Protection Protection relays (electromechanical, solid state and numeric) No. ‐ 2.71% 39.82% 57.47% ‐ 3 2.71%
60 All SCADA and communications SCADA and communications equipment operating as a single system Lot ‐ 6.64% 26.92% 66.43% ‐ 4 6.64%
61 All Capacitor Banks Capacitors including controls No. ‐ ‐ 80.41% 19.59% ‐ 3 ‐
62 All Load Control Centralised plant Lot ‐ ‐ 100.00% ‐ ‐ 4 ‐
63 All Load Control Relays No. ‐ ‐ ‐ ‐ ‐ N/A ‐
64 All Civils Cable Tunnels km ‐ ‐ 8.62% 91.38% ‐ 4 ‐
Asset condition at start of planning period (percentage of units by grade)
% of asset forecast to be replaced in next 5 years

Electricity Asset Management Plan Update 2017
Date: 31 March 2017 Vector Limited Page 26 of 39
Electricity Asset Management Plan Update
Information Disclosure 2017
Appendix 4 Report on Forecast Capacity

Electricity Asset Management Plan Update 2017
Date: 31 March 2017 Vector Limited Page 27 of 39
Company Name Vector ElectricityAMP Planning Period 1 April 2017 – 31 March 2027
SCHEDULE 12b: REPORT ON FORECAST CAPACITY
sch ref
7 12b(i): System Growth ‐ Zone Substations
8
Existing Zone SubstationsCurrent Peak Load
(MVA)
Installed Firm Capacity(MVA)
Security of Supply Classification
(type)Transfer Capacity
(MVA)
Utilisation of Installed Firm
Capacity%
Installed Firm Capacity +5 years
(MVA)
Utilisation of Installed Firm Capacity + 5yrs
%
Installed Firm Capacity Constraint +5 years
(cause) Explanation9 Atkinson Road 18.9 24 N‐1 18 79% 24 69% No constraint within +5 years Meets Vector security criteria
10 Auckland Airport 17 25 N‐1 0 68% 25 91% Other Meets customers security criteria
11 Avondale 28.7 24 N‐1 switched 22.1 120% 24 100% No constraint within +5 years Meets Vector security criteria,
12 Bairds 22.2 24 N‐1 20.8 93% 24 92% No constraint within +5 years Meets Vector security criteria
13 Balmain 8.6 0 N 14.9 ‐ ‐ ‐ No constraint within +5 years Meets Vector security criteria
14 Balmoral 12.5 24 N‐1 15.5 52% 24 51% No constraint within +5 years Meets Vector security criteria
15 Belmont 12.8 14 N‐1 10.4 91% 14 79% No constraint within +5 years Meets Vector security criteria
16 Birkdale 23.6 24 N‐1 17.2 98% 24 86% No constraint within +5 years Meets Vector security criteria
17 Brickworks 10.4 0 N 12.8 ‐ 18 84% No constraint within +5 yearsThe constraint will be relieved by the installation of the second
transformer
18 Browns Bay 15.3 10 N‐1 switched 17.2 153% 15 85% No constraint within +5 years The transformers are scheduled for replacement
19 Bush Road 23.4 23.8 N‐1 13.6 98% 24 85% No constraint within +5 years Meets Vector security criteria
20 Carbine 14.5 21.5 N‐1 7.6 67% 22 90% No constraint within +5 years Meets Vector security criteria
21 Chevalier 19.9 18.9 N‐1 switched 14.2 105% 19 104% No constraint within +5 years Meets Vector security criteria
22 Clendon 20.5 24 N‐1 15.7 85% 24 74% No constraint within +5 years Meets Vector security criteria
23 Clevedon 2.9 0 N 2.9 ‐ ‐ ‐ No constraint within +5 years Meets Vector security criteria
24 Coatesvil le 10.1 0 N 9.4 ‐ ‐ ‐ No constraint within +5 years Load forecast to decline. Meets Vector security criteria
25 Drive 25.1 24 N‐1 switched 24.3 105% 24 112% No constraint within +5 years Load transfer to Newmarket South substation
26 East Coast Road 15 0 N 17.6 ‐ ‐ ‐ No constraint within +5 years Meets Vector security criteria
27 East Tamaki 15.9 24 N‐1 7.4 66% 24 87% No constraint within +5 years Meets Vector security criteria
28 Flatbush 8.1 24 N‐1 10.2 34% 24 75% No constraint within +5 years Meets Vector security criteria
29 Forrest Hil l 17.4 20 N‐1 15.1 87% 20 78% No constraint within +5 years Meets Vector security criteria
30 Freemans Bay 17.8 21.6 N‐1 13.9 82% 22 114% No constraint within +5 years Load transfer proposed
31 Glen Innes 12.6 13.4 N‐1 13.5 94% 13 92% No constraint within +5 years Meets Vector security criteria
32 Greenhithe 11.7 0 N 7.8 ‐ ‐ ‐ No constraint within +5 years Load transfer proposed
33 Greenmount 39.2 48 N‐1 25.8 82% 48 84% No constraint within +5 years Meets Vector security criteria
34 Gulf Harbour 7.7 0 N 8.7 ‐ ‐ ‐ No constraint within +5 years Meets Vector security criteria
35 Hans 23.1 24 N‐1 18.4 96% 24 98% Transformer Load transfer to Mangere South substation
36 Hauraki 8.6 0 N 9 ‐ ‐ ‐ No constraint within +5 years Meets Vector security criteria
37 Helensvil le 14.8 9 N‐1 switched 8.6 164% 9 141% No constraint within +5 years Load transfer to Kaukapakapa substation
38 Henderson Valley 16.2 15.2 N‐1 switched 20 107% 15 122% No constraint within +5 years Meets Vector security criteria
39 Highbrook 8.1 19.4 N‐1 0 42% 19 68% No constraint within +5 years Meets Vector security criteria
40 Highbury 12.5 0 N 12.2 ‐ ‐ ‐ No constraint within +5 years Load transfer proposed
41 Hillcrest 22.3 21.7 N‐1 switched 15.2 103% 22 85% No constraint within +5 years Meets Vector security criteria
42 Hillsborough 18.2 24 N‐1 20.5 76% 24 75% No constraint within +5 years Meets Vector security criteria
43 Hobson 110/11kV 21 30 N‐1 11.3 70% 30 78% No constraint within +5 years Meets Vector security criteria
44 Hobson 22/11kV 17.6 18 N‐1 8.8 98% 18 111% No constraint within +5 years Load transfer to 22kV bus
45 Hobson 22kV 44 80 N‐1 26.6 55% 80 93% No constraint within +5 years Meets Vector security criteria
46 Hobsonvil le 24.1 16 N‐1 switched 13.7 151% 16 277% No constraint within +5 years Hload transfer to Hobsonville Point substation
47 Howick 35.8 46 N‐1 15.1 78% 46 70% No constraint within +5 years Meets Vector security criteria
48 James Street 18.7 16 N‐1 switched 18.2 117% 16 107% No constraint within +5 years Meets Vector security criteria
49 Keeling Road 17 24 N‐1 14 71% 24 ‐ No constraint within +5 years Meets Vector security criteria
50 Kingsland 23.1 24 N‐1 19.4 96% 24 96% No constraint within +5 years Meets Vector security criteria
This schedule requires a breakdown of current and forecast capacity and util isation for each zone substation and current distribution transformer capacity. The data provided should be consistent with the information provided in the AMP. Information provided in this
table should relate to the operation of the network in its normal steady state configuration.

Electricity Asset Management Plan Update 2017
Date: 31 March 2017 Vector Limited Page 28 of 39
Company Name Vector ElectricityAMP Planning Period 1 April 2017 – 31 March 2027
SCHEDULE 12b: REPORT ON FORECAST CAPACITY
sch ref
7 12b(i): System Growth ‐ Zone Substations
8
Existing Zone SubstationsCurrent Peak Load
(MVA)
Installed Firm Capacity(MVA)
Security of Supply Classification
(type)Transfer Capacity
(MVA)
Utilisation of Installed Firm
Capacity%
Installed Firm Capacity +5 years
(MVA)
Utilisation of Installed Firm Capacity + 5yrs
%
Installed Firm Capacity Constraint +5 years
(cause) Explanation51 Laingholm 8.8 9 N‐1 9.6 98% 9 85% No constraint within +5 years Meets Vector security criteria
52 Lichfield 17.6 20 N‐1 0 88% 20 88% No constraint within +5 years Meets Vector security criteria
53 Liverpool 35 48 N‐1 19.5 73% 48 86% No constraint within +5 years Meets Vector security criteria
54 Liverpool 22kV 80.8 135 N‐1 57.2 60% 135 67% No constraint within +5 years Meets Vector security criteria
55 Mangere Central 27.6 24 N‐1 switched 12.3 115% 24 121% No constraint within +5 years Load transfer to Managere South substation
56 Mangere East 27.6 24 N‐1 switched 21.5 115% 24 112% No constraint within +5 years Load transfer to Managere South substation
57 Mangere West 17.8 33 N‐1 4.2 54% 33 125% No constraint within +5 years Load transfer to Managere South substation
58 Manly 18.2 14 N‐1 switched 14.1 130% 14 118% No constraint within +5 years Meets Vector security criteria
59 Manukau 32.2 42.9 N‐1 17.9 75% 43 93% No constraint within +5 years Meets Vector security criteria
60 Manurewa 48 46.9 N‐1 switched 28.9 102% 47 95% No constraint within +5 years Meets Vector security criteria
61 Maraetai 7.3 18 N‐1 4.6 41% 18 60% No constraint within +5 years Meets Vector security criteria
62 McKinnon 16.1 23.8 N‐1 12.6 68% 24 86% No constraint within +5 years Meets Vector security criteria
63 Mcleod Road 9.5 0 N 11.6 ‐ ‐ ‐ No constraint within +5 years Meets Vector security criteria
64 McNab 43.9 48 N‐1 26.9 91% 48 93% No constraint within +5 years Meets Vector security criteria
65 Milford 7.7 0 N 7.9 ‐ ‐ ‐ No constraint within +5 years Meets Vector security criteria
66 Mt Albert 7 0 N 6.6 ‐ ‐ ‐ No constraint within +5 years Meets Vector security criteria
67 Mt Wellington 19.2 24 N‐1 18.4 80% 24 79% No constraint within +5 years Meets Vector security criteria
68 New Lynn 14.1 14 N‐1 switched 11.5 101% 14 123% No constraint within +5 years Meets Vector security criteria
69 Newmarket 33.2 48 N‐1 26.1 69% 48 132% No constraint within +5 years Load transfer to Newmarket South substation
70 Newton 20 18.9 N‐1 switched 19.3 106% 19 125% No constraint within +5 years Load transfer to Liverpool 22kV bus
71 Ngataringa Bay 7.2 0 N 6.1 ‐ ‐ ‐ No constraint within +5 years Meets Vector security criteria
72 Northcote 5.8 0 N 6.8 ‐ ‐ ‐ No constraint within +5 years Meets Vector security criteria
73 Onehunga 12 14.7 N‐1 10.7 82% 24 48% No constraint within +5 years Meets Vector security criteria
74 Orakei 21.8 21.6 N‐1 switched 13.8 101% 22 98% No constraint within +5 years Meets Vector security criteria
75 Oratia 5 0 N 8 ‐ ‐ ‐ No constraint within +5 years Meets Vector security criteria
76 Orewa 17.5 15.2 N‐1 switched 9.7 115% 24 85% No constraint within +5 yearsA planned 11kV switchgear upgrade project wil l relieve this
constraint
77 Otara 27.9 30.8 N‐1 22.5 91% 31 90% No constraint within +5 years Meets Vector security criteria
78 Pacific Steel 18.6 44 N‐1 0 42% 44 45% No constraint within +5 years Meets Vector security criteria
79 Pakuranga 22.9 24 N‐1 11.5 95% 24 84% No constraint within +5 years Meets Vector security criteria
80 Papakura 26.7 24 N‐1 switched 8.9 111% 24 115% No constraint within +5 years Meets Vector security criteria
81 Parnell 10.1 13.3 N‐1 10.9 76% 18 70% No constraint within +5 years Scheduled transformer project
82 Ponsonby 15.3 14.4 N‐1 switched 9.6 106% 18 78% No constraint within +5 years Subtransmission upgrade to remove constraints
83 Quay 24.4 24 N‐1 switched 19.6 102% 24 127% No constraint within +5 years Loadf transfer to Quay 22kV bus
84 Quay 22kV 38.6 60 N‐1 31.6 64% 60 83% No constraint within +5 years Meets Vector security criteria
85 Ranui 12 0 N 20.7 ‐ ‐ ‐ No constraint within +5 years Meets Vector security criteria
86 Red Beach 14.2 24 N‐1 12.7 59% 24 78% No constraint within +5 years Meets Vector security criteria
87 Remuera 29.1 24 N‐1 switched 21.1 121% 24 131% No constraint within +5 years Load transfer to Newmarket South substation
88 Riverhead 11.7 9 N‐1 switched 10.7 130% 9 131% No constraint within +5 years Meets Vector security criteria
89 Rockfield 23.9 24 N‐1 25.9 100% 24 106% No constraint within +5 years Meets Vector security criteria
90 Rosebank 22.4 25.8 N‐1 17.5 87% 26 119% No constraint within +5 years Meets Vector security criteria
91 Rosedale 14.5 0 N 8 ‐ 24 68% No constraint within +5 yearsThe constraint wil l be relieved by the installation of the second
transformer
This schedule requires a breakdown of current and forecast capacity and uti lisation for each zone substation and current distribution transformer capacity. The data provided should be consistent with the information provided in the AMP. Information provided in this
table should relate to the operation of the network in its normal steady state configuration.

Electricity Asset Management Plan Update 2017
Date: 31 March 2017 Vector Limited Page 29 of 39
Company Name Vector ElectricityAMP Planning Period 1 April 2017 – 31 March 2027
SCHEDULE 12b: REPORT ON FORECAST CAPACITY
sch ref
7 12b(i): System Growth ‐ Zone Substations
8
Existing Zone SubstationsCurrent Peak Load
(MVA)
Installed Firm Capacity(MVA)
Security of Supply Classification
(type)Transfer Capacity
(MVA)
Utilisation of Installed Firm
Capacity%
Installed Firm Capacity +5 years
(MVA)
Utilisation of Installed Firm Capacity + 5yrs
%
Installed Firm Capacity Constraint +5 years
(cause) Explanation92 Sabulite Road 20.8 14 N‐1 switched 16 149% 14 133% No constraint within +5 years Meets Vector security criteria
93 Sandringham 20.3 24 N‐1 20.4 85% 24 84% No constraint within +5 years Meets Vector security criteria
94 Simpson Road 5 0 N 5.3 ‐ ‐ ‐ No constraint within +5 years Meets Vector security criteria
95 Snells Beach 6.3 0 N 7 ‐ ‐ ‐ No constraint within +5 years Meets Vector security criteria
96 South Howick 27 24 N‐1 switched 14.6 113% 24 102% No constraint within +5 years Meets Vector security criteria
97 Spur Road 10.5 0 N 16.6 ‐ 14 123% No constraint within +5 yearsThe constraint wil l be relieved by the installation of the second
transformer
98 St Heliers 20.4 21 N‐1 15.8 97% 21 92% No constraint within +5 years Meets Vector security criteria
99 St Johns 17.7 24 N‐1 16.3 74% 24 69% No constraint within +5 years Meets Vector security criteria
100 Sunset Road 15.7 14 N‐1 switched 13.7 112% 14 107% No constraint within +5 years Meets Vector security criteria
101 Swanson 10.5 0 N 11.9 ‐ ‐ ‐ No constraint within +5 years Meets Vector security criteria
102 Sylvia Park 19.7 24 N‐1 12.9 82% 24 117% No constraint within +5 years Meets Vector security criteria
103 Takanini 17.4 18 N‐1 19.4 97% 18 136% No constraint within +5 years Transformer upgrade scheduled
104 Takapuna 9.2 0 N 10.3 ‐ 24 64% No constraint within +5 years Second transformer installed in substation
105 Te Atatu 22 14 N‐1 switched 12.4 157% 14 150% No constraint within +5 years Meets Vector security criteria
106 Te Papapa 22.6 22.5 N‐1 switched 9.1 100% 23 109% No constraint within +5 years Meets Vector security criteria
107 Torbay 8.6 0 N 7.7 ‐ ‐ ‐ No constraint within +5 years Meets Vector security criteria
108 Triangle Road 14.1 12 N‐1 switched 15.3 118% 18 83% No constraint within +5 years Transformer replacement project scheduled
109 Victoria 23.4 22.4 N‐1 switched 18.2 104% 22 123% No constraint within +5 years Load transfer to Liverpool 22kV bus
110 Waiake 8.1 0 N 8.6 ‐ ‐ ‐ No constraint within +5 years Meets Vector security criteria
111 Waiheke 11.8 15 N‐1 5.2 79% 15 64% No constraint within +5 years Meets Vector security criteria
112 Waikaukau 7.1 0 N 7.4 ‐ ‐ ‐ No constraint within +5 years Meets Vector security criteria
113 Waimauku 10.5 9 N‐1 9.1 117% 9 ‐ No constraint within +5 years Meets Vector security criteria
114 Wairau Road 17.3 15.2 N‐1 switched 21.4 114% 16 147% No constraint within +5 years Meets Vector security criteria
115 Warkworth 20.1 18 N‐1 switched 1.7 112% 18 134% No constraint within +5 years Load transfer to Warkworth South substation
116 Wellsford 8.2 9 N‐1 5.4 91% 9 73% No constraint within +5 years Meets Vector security criteria
117 Westfield 26.7 24 N‐1 switched 15.2 111% 24 141% No constraint within +5 years Load transfer to McNab substation
118 White Swan 26.2 32.2 N‐1 15.4 81% 32 82% No constraint within +5 years Meets Vector security criteria
119 Wiri 41.4 48 N‐1 21.6 86% 48 121% No constraint within +5 years Load transfer to Wiri West substation
120 Woodford 9.9 0 N 8 ‐ ‐ ‐ No constraint within +5 years Meets Vector security criteria
121 ¹ Extend forecast capacity table as necessary to disclose all capacity by each zone substation
This schedule requires a breakdown of current and forecast capacity and util isation for each zone substation and current distribution transformer capacity. The data provided should be consistent with the information provided in the AMP. Information provided in this
table should relate to the operation of the network in its normal steady state configuration.

Electricity Asset Management Plan Update 2017
Date: 31 March 2017 Vector Limited Page 30 of 39
Schedule 12b Explanatory Notes
Explanatory notes pertaining to Schedule 12b are provided in the box below, in the format required for Schedule 15 of the Electricity Distribution Information Disclosures:
Additional explanatory comment on disclosed information
The security of supply standards have been updated since the 2016 AMP. The changes made are designed to actively identify and manage risks associated with high impact, low probability events, recognition of the large loads and risks associated with meshed sub transmission networks, while maintaining pressure to improve utilisation of network assets.

Electricity Asset Management Plan Update 2017
Date: 31 March 2017 Vector Limited Page 31 of 39
Electricity Asset Management Plan Update
Information Disclosure 2017
Appendix 5 Report on Forecast Network Demand

Electricity Asset Management Plan Update 2017
Date: 31 March 2017 Vector Limited Page 32 of 39
Company Name
AMP Planning Period
SCHEDULE 12C: REPORT ON FORECAST NETWORK DEMAND
sch ref
7 12c(i): Consumer Connections8 Number of ICPs connected in year by consumer type9 Current Year CY CY+1 CY+2 CY+3 CY+4 CY+5
10 for year ended 31 Mar 17 31 Mar 18 31 Mar 19 31 Mar 20 31 Mar 21 31 Mar 22
11 Consumer types defined by EDB*12 Residential & Small Medium Enterprise (SME) 9,582 10,451 9,498 9,592 9,710 9,841
13 Industrial & Commercial 162 178 178 178 178 178
14151617 Connections total 9,744 10,629 9,676 9,770 9,888 10,019
18 *include additional rows if needed19 Distributed generation20 Number of connections 831 812 811 811 812 811
21 Capacity of distributed generation instal led in year (MVA) 3 3 3 3 3 3
22 12c(ii) System Demand23 Current Year CY CY+1 CY+2 CY+3 CY+4 CY+524 Maximum coincident system demand (MW) for year ended 31 Mar 17 31 Mar 18 31 Mar 19 31 Mar 20 31 Mar 21 31 Mar 22
25 GXP demand 1,684 1,750 1,862 1,868 1,871 1,873
26 plus Distributed generation output at HV and above 14 14 14 14 14 14
27 Maximum coincident system demand 1,698 1,764 1,876 1,882 1,885 1,887
28 less Net transfers to (from) other EDBs at HV and above ‐ ‐ ‐ ‐ ‐ ‐
29 Demand on system for supply to consumers' connection points 1,698 1,764 1,876 1,882 1,885 1,887
30 Electricity volumes carried (GWh)31 Electricity supplied from GXPs 8,531 8,554 8,560 8,575 8,589 8,603
32 less Electricity exports to GXPs ‐ ‐ ‐ ‐ ‐ ‐
33 plus Electricity supplied from distributed generation 107 105 105 105 105 105
34 less Net electricity supplied to (from) other EDBs ‐ ‐ ‐ ‐ ‐ ‐
35 Electricity entering system for supply to ICPs 8,638 8,659 8,664 8,680 8,694 8,707
36 less Total energy delivered to ICPs 8,309 8,323 8,330 8,344 8,357 8,370
37 Losses 329 336 335 336 337 338
3839 Load factor 58% 56% 53% 53% 53% 53%
40 Loss ratio 3.8% 3.9% 3.9% 3.9% 3.9% 3.9%
Vector Electricity 1 April 2017 – 31 March 2027
Number of connections
This schedule requires a forecast of new connections (by consumer type), peak demand and energy volumes for the disclosure year and a 5 year planning period. The forecasts should be consistent with the supporting information set out in the AMP as well as the
assumptions used in developing the expenditure forecasts in Schedule 11a and Schedule 11b and the capacity and util isation forecasts in Schedule 12b.

Electricity Asset Management Plan Update 2017
Date: 31 March 2017 Vector Limited Page 33 of 39
Schedule 12c Explanatory Notes
Explanatory notes pertaining to Schedule 12c are provided in the box below, in the format required for Schedule 15 of the Electricity Distribution Information Disclosures:
Additional explanatory comment on disclosed information
There is a reduction in the consumer connections forecast compared to the 2016 AMP. The reduction has been in the outlook in SME connections to reflect the weakening of the 90 day interest rate forecast as sourced from the Reserve Bank Monetary Policy Statement.

Electricity Asset Management Plan Update 2017
Date: 31 March 2017 Vector Limited Page 34 of 39
Electricity Asset Management Plan Update
Information Disclosure 2017
Appendix 6 Report on Forecast Interruptions and Duration (reported by sub-network)
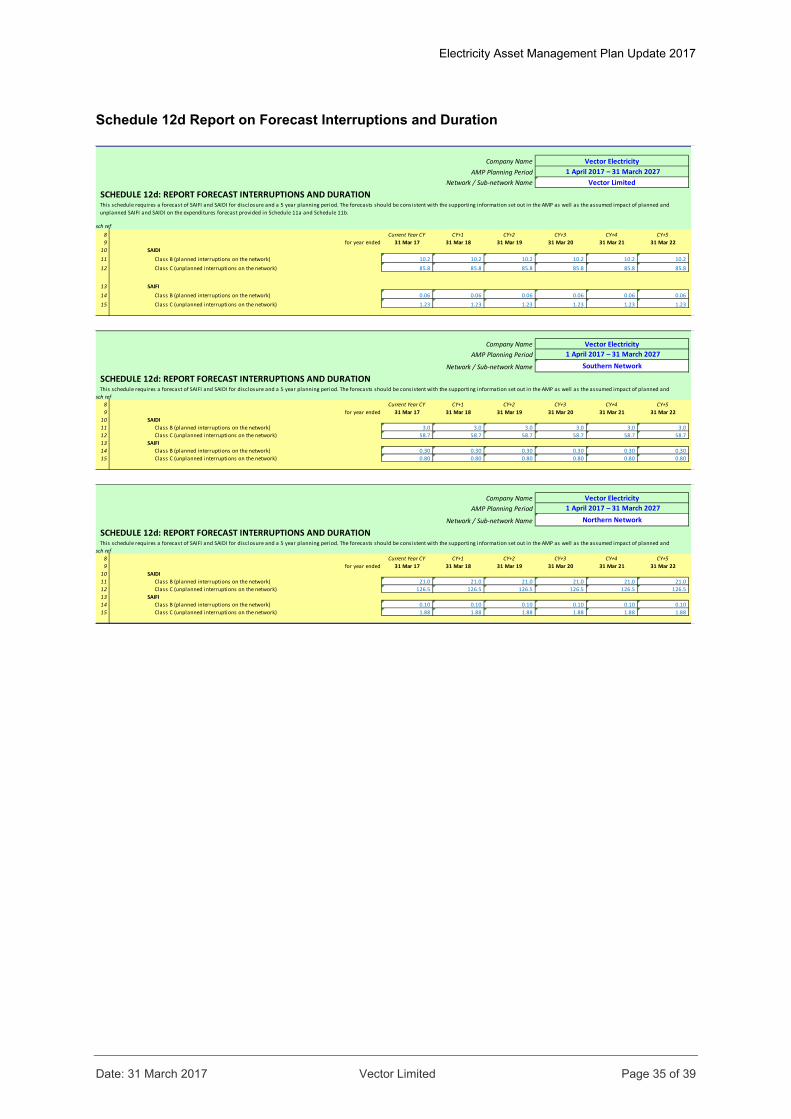
Electricity Asset Management Plan Update 2017
Date: 31 March 2017 Vector Limited Page 35 of 39
Schedule 12d Report on Forecast Interruptions and Duration
Company NameAMP Planning Period
Network / Sub‐network Name
SCHEDULE 12d: REPORT FORECAST INTERRUPTIONS AND DURATION
sch ref8 Current Year CY CY+1 CY+2 CY+3 CY+4 CY+59 for year ended 31 Mar 17 31 Mar 18 31 Mar 19 31 Mar 20 31 Mar 21 31 Mar 22
10 SAIDI11 Class B (planned interruptions on the network) 10.2 10.2 10.2 10.2 10.2 10.2
12 Class C (unplanned interruptions on the network) 85.8 85.8 85.8 85.8 85.8 85.8
13 SAIFI14 Class B (planned interruptions on the network) 0.06 0.06 0.06 0.06 0.06 0.06
15 Class C (unplanned interruptions on the network) 1.23 1.23 1.23 1.23 1.23 1.23
Company NameAMP Planning Period
Network / Sub‐network Name
SCHEDULE 12d: REPORT FORECAST INTERRUPTIONS AND DURATION
sch ref8 Current Year CY CY+1 CY+2 CY+3 CY+4 CY+59 for year ended 31 Mar 17 31 Mar 18 31 Mar 19 31 Mar 20 31 Mar 21 31 Mar 22
10 SAIDI11 Class B (planned interruptions on the network) 3.0 3.0 3.0 3.0 3.0 3.0
12 Class C (unplanned interruptions on the network) 58.7 58.7 58.7 58.7 58.7 58.7
13 SAIFI14 Class B (planned interruptions on the network) 0.30 0.30 0.30 0.30 0.30 0.30
15 Class C (unplanned interruptions on the network) 0.80 0.80 0.80 0.80 0.80 0.80
Company NameAMP Planning Period
Network / Sub‐network Name
SCHEDULE 12d: REPORT FORECAST INTERRUPTIONS AND DURATION
sch ref8 Current Year CY CY+1 CY+2 CY+3 CY+4 CY+59 for year ended 31 Mar 17 31 Mar 18 31 Mar 19 31 Mar 20 31 Mar 21 31 Mar 22
10 SAIDI11 Class B (planned interruptions on the network) 21.0 21.0 21.0 21.0 21.0 21.0
12 Class C (unplanned interruptions on the network) 126.5 126.5 126.5 126.5 126.5 126.5
13 SAIFI14 Class B (planned interruptions on the network) 0.10 0.10 0.10 0.10 0.10 0.10
15 Class C (unplanned interruptions on the network) 1.88 1.88 1.88 1.88 1.88 1.88
Vector Electricity 1 April 2017 – 31 March 2027
Vector Electricity 1 April 2017 – 31 March 2027
Vector Limited
This schedule requires a forecast of SAIFI and SAIDI for disclosure and a 5 year planning period. The forecasts should be consistent with the supporting information set out in the AMP as well as the assumed impact of planned and
unplanned SAIFI and SAIDI on the expenditures forecast provided in Schedule 11a and Schedule 11b.
This schedule requires a forecast of SAIFI and SAIDI for disclosure and a 5 year planning period. The forecasts should be consistent with the supporting information set out in the AMP as well as the assumed impact of planned and
Vector Electricity
Southern Network
This schedule requires a forecast of SAIFI and SAIDI for disclosure and a 5 year planning period. The forecasts should be consistent with the supporting information set out in the AMP as well as the assumed impact of planned and
1 April 2017 – 31 March 2027Northern Network

Electricity Asset Management Plan Update 2017
Date: 31 March 2017 Vector Limited Page 36 of 39
Electricity Asset Management Plan Update
Information Disclosure 2017
Appendix 7 Schedule 14a Mandatory Explanatory
Notes on Forecast Information
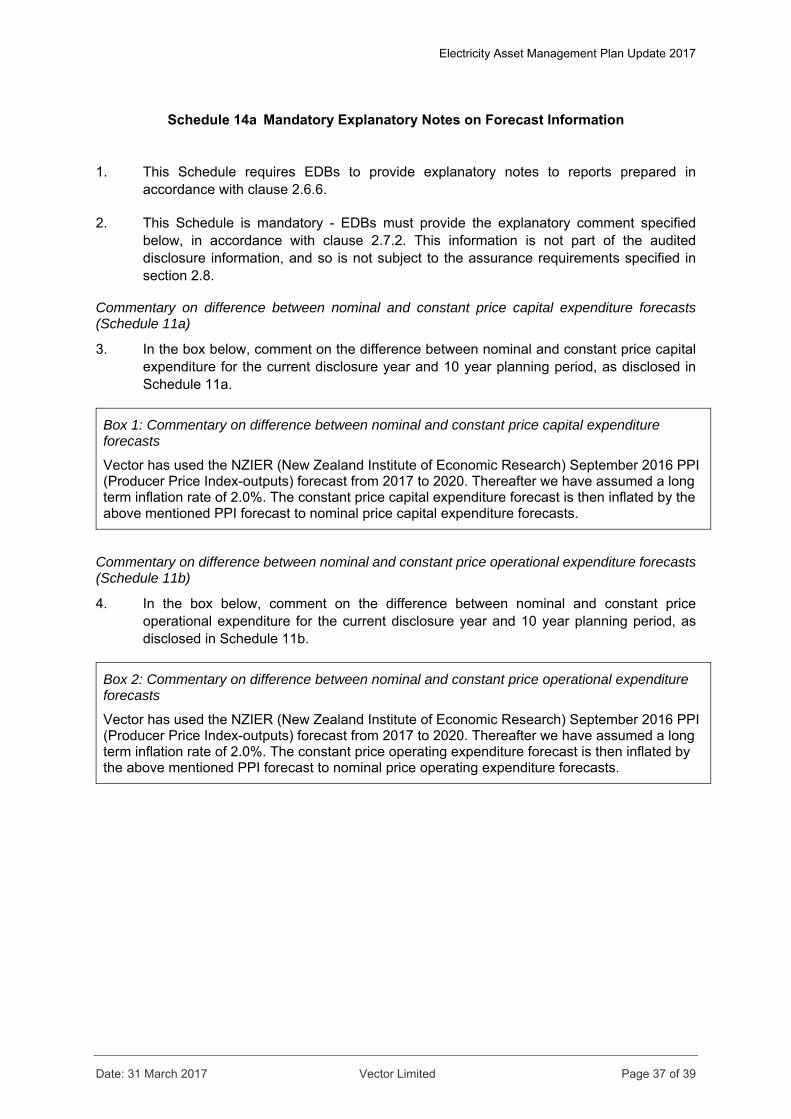
Electricity Asset Management Plan Update 2017
Date: 31 March 2017 Vector Limited Page 37 of 39
Schedule 14a Mandatory Explanatory Notes on Forecast Information 1. This Schedule requires EDBs to provide explanatory notes to reports prepared in
accordance with clause 2.6.6.
2. This Schedule is mandatory - EDBs must provide the explanatory comment specified below, in accordance with clause 2.7.2. This information is not part of the audited disclosure information, and so is not subject to the assurance requirements specified in section 2.8.
Commentary on difference between nominal and constant price capital expenditure forecasts (Schedule 11a)
3. In the box below, comment on the difference between nominal and constant price capital expenditure for the current disclosure year and 10 year planning period, as disclosed in Schedule 11a.
Box 1: Commentary on difference between nominal and constant price capital expenditure forecasts
Vector has used the NZIER (New Zealand Institute of Economic Research) September 2016 PPI (Producer Price Index-outputs) forecast from 2017 to 2020. Thereafter we have assumed a long term inflation rate of 2.0%. The constant price capital expenditure forecast is then inflated by the above mentioned PPI forecast to nominal price capital expenditure forecasts.
Commentary on difference between nominal and constant price operational expenditure forecasts (Schedule 11b)
4. In the box below, comment on the difference between nominal and constant price operational expenditure for the current disclosure year and 10 year planning period, as disclosed in Schedule 11b.
Box 2: Commentary on difference between nominal and constant price operational expenditure forecasts
Vector has used the NZIER (New Zealand Institute of Economic Research) September 2016 PPI (Producer Price Index-outputs) forecast from 2017 to 2020. Thereafter we have assumed a long term inflation rate of 2.0%. The constant price operating expenditure forecast is then inflated by the above mentioned PPI forecast to nominal price operating expenditure forecasts.

Electricity Asset Management Plan Update 2017
Date: 31 March 2017 Vector Limited Page 38 of 39
Electricity Asset Management Plan Update
Information Disclosure 2017
Appendix 8 Schedule 17 Certification for Year-
beginning Disclosures

Electricity Asset Management Plan Update 2017
Date: 31 March 2017 Vector Limited Page 39 of 39


![Subex launches ROC Asset Assurance 2.2 Solution [Company Update]](https://img.pdfslide.us/doc/110x75/577c98841a28ab163a8b678f/subex-launches-roc-asset-assurance-22-solution-company-update.jpg)