Embed Size (px)
Citation preview

Electricity and Heat Production Using Biogas from the Anaerobic Digestion of Livestock
Manure - Literature Review
Authors: Martin Van Haren and Ron Fleming
Ridgetown College – University of Guelph
Ridgetown, Ontario, Canada N0P 2C0
Prepared for: Ontario Ministry of Agriculture, Food and Rural Affairs
October 2005

Table of Contents Introduction ................................................................................................................................... 1 Objectives...................................................................................................................................... 1 State of the Industry..................................................................................................................... 1 Chemical and Biological Processes .......................................................................................... 2
Stage I - Hydrolysis and Fermentation................................................................................. 3 Stage II - Acidogenesis ........................................................................................................... 3 Stage III - Methanogenesis..................................................................................................... 3 Design Parameters .................................................................................................................. 4
Digestion Systems ....................................................................................................................... 6 Plug Flow System .................................................................................................................... 6 Complete Mixed System ......................................................................................................... 6 Fixed Film System ................................................................................................................... 6 Covered Lagoon....................................................................................................................... 7 Centralized Systems................................................................................................................ 7
Optimum Biogas Production....................................................................................................... 9 Theoretical Methane Productivity.......................................................................................... 9 Old vs. Fresh Manure .............................................................................................................. 9
Composition of Biogas ..............................................................................................................10 Using the Biogas ........................................................................................................................11
Heat Boiler...............................................................................................................................11 Flare .........................................................................................................................................11 Internal Combustion Engines ...............................................................................................12 Gas Turbines ..........................................................................................................................13 Microturbines ..........................................................................................................................14 Fuel Cells .................................................................................................................................15 Comparison of Generators ...................................................................................................16 Case Study: Colorado Pork, LLC ........................................................................................17
Technology Description.....................................................................................................17 Export of Electricity....................................................................................................................18
Net Metering ...........................................................................................................................18 Retail Generation...................................................................................................................19
Future Directions ........................................................................................................................19 Stirling Engines.......................................................................................................................19 Microturbine/High Temperature Fuel Cell ..........................................................................20
Conclusions.................................................................................................................................20 References ..................................................................................................................................21

1
Introduction Anaerobic digestion is a process involving the breakdown of organic matter by micro-organisms, in the absence of oxygen. A typical digester is a closed system where a certain temperature is maintained and where the released gas is captured, stored and used. The main component of this biogas is methane gas, which is a fuel. Methane is also one of the Greenhouse Gases implicated in global warming. Capturing and using the gas, therefore, helps reduce the emission of greenhouse gas to the atmosphere. Ontario has some on-farm experience with anaerobic digesters but most digesters are used in non-farm applications as part of waste treatment processes (e.g. industrial or municipal waste treatment). On-farm digesters are more common in other parts of the world and many Ontario farmers are showing a renewed interest in the technology. One of the key considerations for these producers is the most appropriate way to use the methane that is generated. It could be burned directly or used to run an engine that powers an electrical generator, thus producing electricity and heat.
Objectives This report is intended to examine the production and use of biogas on farms in Ontario, with a focus on the most efficient use of the biogas:
• Describe alternatives for producing electricity from biogas derived from livestock manure
• Determine optimum recovery rates of energy from manure • Determine the most appropriate generator system for typical situations • Describe options for connection to the electrical power grid • Determine the profitability and viability of producing electricity and heat from
biogas
State of the Industry Anaerobic digestion is currently in widespread use on farms around the world. Approximately 6 to 8 million digesters, mostly low budget and family-sized, are in service throughout India and China. The biogas produced in these countries is used mainly for cooking and lighting (Wellinger and Lindberg, 2001). Europeans have taken a technology-intensive approach with a focus on methane production and optimization. Germany alone has over 2000 biogas facilities of various capacities and forms. These systems range from digesters built for smaller farms of 100 cows or less to central plants adding organic residuals to boost biogas production (Fischer, 2002). Anaerobic digestion, and in particular biogas production, plays a part in the long-term energy strategy of Denmark. The country of almost 5.5 million people has at least 20 centralized co-digestion plants as well as another 45 farm-based digesters in operation (Holm-Nielson and Al Seadi, 2003). In both Germany and Denmark the popularity of anaerobic digestion has been fuelled by favourable legislation and various research and
2
development grants and subsidies (Wellinger and Lindberg, 2001; Holm-Nielson and Al Seadi, 2003). For example, Germany has set a 20-year minimum price for biogas-generated electricity. Compared to neighbouring countries without such legislation, the biogas industries of Germany and Denmark have experienced much higher growth and development (Köttner, 2002). Anaerobic digestion in North America has progressed at a slower rate. However, the advent of the AgSTAR program in the United States in the 1990’s and its successful farm digester demonstration projects has helped the industry. Government support in both the United States and Canada has also increased. The government of Ontario recently invested $1.6 million dollars in an on-farm anaerobic digestion facility. The US government established the Renewable Systems and Energy Efficiency Improvements program as well as Value Added Producer Grants to make funds available for digesters (Mattocks and Wilson, 2005). The number of digesters in the United States has grown past ‘demonstration’ units to at least 95 (Lusk, 1999). The Canadian farm-based anaerobic digester industry has moved more slowly. A 2001 Statistics Canada report on farm practices states that of the farmers surveyed, not one used anaerobic digestion to treat stored manure (Beaulieu, 2004). There are, however, examples of the technology in Canada: a dairy farm in eastern Ontario and a hog farm in Alberta have been operating and selling excess electricity for a number of years (Anon, 2003; McClinton, 2003).
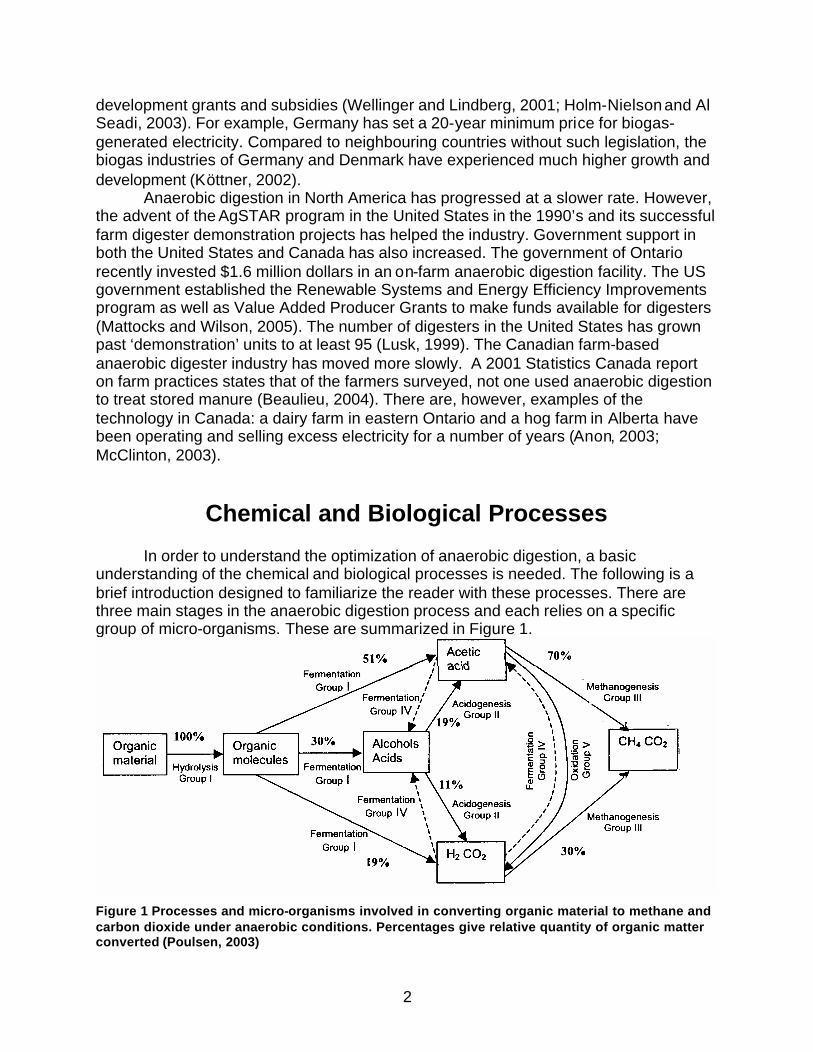
Chemical and Biological Processes In order to understand the optimization of anaerobic digestion, a basic understanding of the chemical and biological processes is needed. The following is a brief introduction designed to familiarize the reader with these processes. There are three main stages in the anaerobic digestion process and each relies on a specific group of micro-organisms. These are summarized in Figure 1.
Figure 1 Processes and micro-organisms involved in converting organic material to methane and carbon dioxide under anaerobic conditions. Percentages give relative quantity of organic matter converted (Poulsen, 2003)

3
Stage I - Hydrolysis and Fermentation Large, insoluble organic molecules are broken down by extra-cellular enzymes through hydrolysis. High amounts of cellulose, or other material that is hydrolyzed slowly, can limit the performance of the entire system (Poulsen, 2003). Short-chain fatty acids (e.g. acetic acid, formic acid) are formed by the enzymes while by-products undergo fermentation to produce alcohols, C02, and H2.
Stage II - Acidogenesis Any short-chain fatty acids longer than acetic acid are oxidized by the acidogenic bacteria to produce formic acid, acetic acid, and H2. Research is currently being conducted on means of promoting the H2 producing feature of acidogenic bacteria for use as an alternative fuel source (Valdez-Vazquez et al, 2004).
Stage III - Methanogenesis Methanogenic bacteria convert the acetic acid and H2 to methane and carbon dioxide. Of the three primary groups of bacteria, the methanogenic are the most unstable (Price and Cheremisinoff, 1981). Figure 1 indicates two more groups (Fermentation Group IV, Oxidation Group V) as being part of the anaerobic process. Group IV can either produce acetic acid or break it down if the concentration of acetate is too high. Group V oxidizes acetic acid to H2 and CO2. Neither group is central to the basic understanding of anaerobic digestion. Figure 2 summarizes the main processes in a simplified flowchart.
Figure 2 Carbon flow in anaerobic environments with active methanogens (Ahring, 2003)
It is also important to note that these processes must be in balance with each other. For example, if the methanogenic bacteria do not use the hydrogen produced by the acidogenic bacteria almost immediately, the higher hydrogen concentration will increase the production of alcohols and fatty acids, causing the system to collapse (Poulsen, 2003).

4
Design Parameters Following is a discussion of the most important parameters which must be considered in the design of an anaerobic digestion system: i) Temperature - Three ranges exist for anaerobic digestion:
• Psychrophilic range - Between 5° and 25°C; characterized by slower methane production and longer retention times.
• Mesophilic range - Between 30° and 40°C; the most widely used of the three (Poulsen, 2003), this range balances heating costs with methane production.
• Thermophilic range – From 50° to 60°C; produces the most methane but is also the most sensitive, due to fewer bacterial species in existence.
Once a stable temperature is reached, fluctuations should be kept within 5°C to avoid killing the desired bacteria (Pos et al, 1981). Thermophilic tolerance is generally less than that of lower temperatures (Price and Cheremisinoff, 1981). Each temperature range at which the digester can be operated has its own advantages. The thermophilic process has been found to be superior to the mesophilic process from an energy balance and, thus, “profit” point of view (Ahring, 1994). Thermophilic digesters usually achieve better degradation of long-chain fatty acids, have a shorter retention time, and require less biomass compared to the quantity of methane produced. The thermophilic process also achieves higher pathogen and weed seed destruction than the mesophilic process alone (El-Mashad et al, 2004). However, the risk of ammonia inhibition is greater and more energy is required to operate a thermophilic digester (Poulsen, 2003). Thermophilic processes are considered to be more prone to instability than mesophilic due to fluctuations in input quality (Earth Tech, 2002; El-Mashad et al, 2004). However, in a study of major centralized biogas plants in Denmark, Ahring (1994) found no significant difference in volatile fatty acid concentrations between the two processes. Ahring (1994) conceded that the start-up time of thermophilic digesters is longer than that of a mesophilic reactor due to the low numbers of thermophilic bacteria in organic waste. Most of the agricultural digesters in the United States are mesophilic (Kramer, 2002). The process is slightly more stable and adaptable to fluctuations in feedstock quality than thermophilic (Earth Tech, 2002). The lower heating requirements of mesophilic temperatures translate into lower costs. Residence time should be at least 15 days for adequate digestion (Earth Tech, 2002). Psychrophilic digesters require a solids retention time approximately twice as long as mesophilic (Price and Cheremisinoff, 1981). These digesters require the least amount of energy input. Biogas production is slow but gas quality and other parameters indicate favourable process stability (Price and Cheremisinoff, 1981). These systems are commonly found in the form of a covered lagoon and, as such, they are usually subject to fluctuations in temperature. ii) Loading Rate – This is expressed as the weight of volatile solids (VS) per unit of volume of digester capacity per unit of time. Loading rates typically range from 1.2 to

5
11.0 kg VS/m3/d for various types of digesters and manure sources (Persson et al, 1979). While high loading rates use the digester volume more efficiently, they also increase solids concentration, retention time and alkalinity, which must be taken into consideration. iii) Retention Time - The Hydraulic Retention Time (HRT) and Solids Retention Time (SRT) are the average lengths of time the liquid or solid portion of manure remains in the digester. Generally, the lower the operating temperature (e.g. psychrophilic digestion) the higher the retention time that is needed. iv) Solids Concentration - Normally reported as the percentage dry matter and the volatile solid percentage of that dry matter, the solids concentration is necessary to determine the loading rate. The solids concentration also helps to determine the most suitable type of digester, as seen in Figure 3.
Figure 3 Appropriate manure characteristics and handling systems for specific types of biogas digester systems (AgSTAR, 2004)
v) Alkalinity and pH - Optimum pH conditions for methanogenic bacteria range from 6.4 to 7.6 (Price and Cheremisinoff, 1981). Other bacterial species are more tolerant to pH levels outside of this range.

6
Digestion Systems Several different systems have been designed for anaerobic digestion. Following are basic descriptions of the more popular systems used on farms.
Plug Flow System The plug flow system usually takes the form of a long concrete tank with a slight grade over the length. Influent is either continuously or intermittently added to one end and flows by gravity to the opposite end. The contents are not mixed mechanically. The retention time is thus a function of channel length, channel grade, and the loading rate. The plug flow digester is best suited for manure with a higher solids content (11 to 13% total solids) such as that of a dairy operation (AgSTAR, 2004). Figure 4 shows the main elements of a plug flow digester system.
Figure 4 Typical plug flow digester system (Timbers and Marshall, 1981)
Complete Mixed System Also known as a Completely Stirred Tank Reactor (CSTR), the complete mixed system is most commonly a circular tank with a mechanical agitator. The mixing prevents settling and maintains contact between bacteria and the manure. It also helps maintain a uniform temperature (Barker, 2001). Electricity input costs are higher due to the intermittent mixing of the digester. However, the mixing can cause foaming in the tank, which is undesirable because it occupies digester volume and can clog gas lines. Complete mix systems are able to handle the widest range of solids concentrations (3 to 10% total solids) (AgSTAR, 2004). Influent is often added to the digester as effluent is excreted in small quantities at regular intervals. Therefore the retention period of manure in a complete mix digester is not necessarily uniform.
Fixed Film System Fixed film digesters contain structures (e.g. corrugated plastic drainage pipe) inside the vessel to help retain more anaerobic bacteria. The structures increase the

7
surface area available for the bacteria to adhere to, thus reducing the numbers of bacteria washed out in the effluent. Consequently the anaerobic process begins faster and stronger compared to a plug -flow or completely mixed system (Timbers and Marshall, 1981). Fixed film digesters are best suited for influent with less than 3% total solids (AgSTAR, 2004). As a result, a solids separator or dilution liquid may be necessary. The advantage of the fixed film system is the shorter retention time - a retention time of 20 days in a conventional completely mixed digester can be shortened to 4 days with fixed film.
Covered Lagoon Covered lagoons are typically not heated, so their use is restricted to areas with a relatively warm climate. The total solids content is limited to less than 3% (AgSTAR, 2004). Hydraulic retention times for covered lagoons range from 40 to 60 days, depending on regional climate. Electricity generation is not usually practical with a covered lagoon because biogas production varies with temperature. Covered lagoon digesters produce less biogas in colder temperatures and little or no gas below 4°C (McNeil Technologies, 2000).
Centralized Systems Centralized systems are much larger anaerobic digesters than the typical on-farm installation. They are designed for large volumes of manure inputs and higher volumes of biogas production. A number of farms within a designated geographical area are usually required for the economical operation of a centralized anaerobic digester. These digesters can be operated as a farmer co-operative or they may be run independently. The advantages of a centralized digester include less individual risk, favourable economies of scale, and less individual farmer involvement. Disadvantages include the typically high travel costs (to haul inputs and outputs), higher capital costs, the likely need to adhere to more stringent municipal by-laws and environmental regulations, and the need for daily management of the digester system by a trained operator. Table 1 compares a centralized digester system to the on-farm alterna tive.

8
Table 1 – Comparison of On-site vs Centralized Anaerobic Digester systems On-site Centralized Advantages Disadvantages Advantages Disadvantages
Transportation No significant transportation costs
Can be expensive and logistically difficult in some areas if distance between farms and digester is significant
Maintenance/ Operation
May be expensive and time consuming for a smaller operation
A trained manager devoted to the facility could handle all tasks proficiently
By-products Readily available products for quick application and use (e.g. heat for the digester, composted solids for sale, liquids for fertilizer)
May not be able to make cost-effective use of all by-products (e.g. sale of excess electricity may not be worthwhile)
Large volumes of saleable by-products may be produced for niche markets. Larger quantities of electricity may be available for sale to a utility at a profit
Costs to transport useable by-products back to the farm operations may be considerable, depending on logistics Biosecurity concerns
Regulations Regulations may not be as stringent for an individual farm compared to a centralized digester operation
Construction/ operation and reporting requirements may be burdensome
Compliance becomes the full responsibility of third party operator
Regulations may be more stringent for a centralized operation
Source: Bothi and Aldrich, 2005.

9
Optimum Biogas Production
Theoretical Methane Productivity Biogas is converted from volatile solids. Therefore, the biogas production potential is limited by the amount of volatile solids added to the digester. Methane productivity in terms of volatile solids destroyed is known as the “theoretical methane yield” - if there is complete degradation of all organic components in the manure. Table 2 shows values calculated by Moller et al (2004). Table 2 – Theoretical methane yield for manure from typical farm livestock Animal Species Methane Productivity
(L CH4 / kg VS) Pig 516 ± 11
Sow 530 ± 6
Cattle 468 ± 6
Source: Moller et al, 2004. The higher theoretical methane yields of pig and sow manure are attributed to the higher proportion of lipid in pig manure (Moller et al, 2004). Hill (1984) found the theoretical methane yield to be relatively constant at 500 L CH4 / kg VS. Fulhage et al (1993), described potential gas yields, which they designated “average values”. Barker (2001) described similar methane production values, but gave no indication of how the figures were reached. Table 3 compares the potential gas yields provided by these two reports. Table 3 – Potential methane yield for main livestock types Author of Report Swine
(L CH4 / kg VS) Dairy (L CH4 / kg VS)
Poultry (L CH4 / kg VS)
Beef (L CH4 / kg VS)
Fulhage et al., 1993
449 288 322 562
Barker, 2001 449 412 486 486
Note: Values converted from (ft3 biogas / lb VS) to (L CH4 / kg VS) assuming 60% methane .
Old vs. Fresh Manure Losses in potential methane production occur as manure is stored. These losses are due to aerobic and anaerobic processes occurring within the manure storage system. The Intergovernmental Panel on Climate Change and the United States Environmental Protection Agency estimate anaerobic lagoon emissions, and therefore loss in methane production potential, using a Methane Conversion Factor (MCF) (Mangino et al, 2002). The MCF is localized and based on temperature variation throughout the year, retention of volatile solids in the system, and management/design

10
considerations associated with the manure handling system. In general, it is agreed that methane emissions from a lagoon increase with corresponding increases in temperature (Mangino et al, 2002; Moller et al, 2004b). However, Moller et al. (2004b) found the actual potential methane emission reduction to be greater than the MCF predicted. This discrepancy is explained by aerobic processes near the surface of the lagoon occurring simultaneously with anaerobic processes below. The MCF only accounts for emissions produced by anaerobic processes. The report claimed a loss in methane production potential of 4.3 to 6.6 % after 15 days and 7.7 to 11.9% after 30 days storage (Moller et al, 2004b).
Composition of Biogas Raw biogas can contain 55 to 70% methane , though 60 to 65% is typical. It contains 30 to 45% carbon dioxide, and trace amounts of H2S, NH3, and H2. The composition of the gas depends largely on the composition of the substrate. The biogas can be used directly or it may be purified before use. Due to the hot, humid environment inside the digester, the resulting biogas is saturated with water vapour. At a temperature of 35°C and relative humidity of 100%, a cubic metre of gas will contain 40 g of water. This vapour can interfere with pressure reducers, boiler orifices, and other devices as well as reduce the energy value of the biogas (Persson et al, 1979). Condensate traps are an effective way of removing the moisture. Hydrogen sulfide (H2S) can also cause problems when using biogas, as it is corrosive even in small concentrations. To avoid corrosion, H2S levels should not exceed 500 to 700 ppm for use in conventional internal combustion engines. Unfortunately, H2S concentrations can reach as high as 6800 ppm. As a result, removal techniques may be needed. Biological removal is accomplished by adding a small amount of air to the gas (2 to 6% by volume). When this is done, micro-organisms convert the hydrogen sulfide to sulfur and sulfate. The sulfate forms sulfuric acid in solution which can be very corrosive. This process is often completed in a separate holding tank where the acid can be neutralized readily. This can be dangerous, as biogas is explosive when air is added in the range of 6 to 12 % by volume. Hydrogen sulfide can be removed chemically using either iron chloride or iron oxide. Dissolved iron chloride is added to the digestate, thereby reacting with the hydrogen sulfide to form iron sulfide. This process is very effective at reducing high concentrations of H2S but less capable of keeping levels low (Wellinger and Lindberg, 2001). This is a relatively expensive solution (Wellinger and Lindberg, 2001; Poulsen, 2003). Iron oxide (rust) also reacts with H2S to produce iron sulfide. Biogas is often passed through chambers of iron oxide pellets to achieve a reaction. The pellets can be regenerated by exposure to air and re-used. Water scrubbing may be used to remove both hydrogen sulfide and carbon dioxide. Since these two gases are more soluble in water than methane, they dissolve. This leaves a high concentration of gaseous methane. However, the spent water is corrosive and either must be regenerated or replaced.

11
Using the Biogas
There are many uses for the gas produced by anaerobic digestion. Biogas can be substituted for any application designed for natural gas. A boiler will convert the methane to heat. Microturbines, gas turbines, internal combustion engines and fuel cells convert biogas into both electricity and heat. A gas flare is used to dispose of gas when levels are too low to warrant a heat or electricity generation system.
Heat Boiler Heat boilers represent perhaps the simplest use of anaerobic digester gas. Biogas can be used in heat boilers to directly produce high quality hot water or steam. The hot water or steam may be used to heat the digester and/or be used in secondary systems such as absorption chillers or space heaters. The gas could also be used directly in any natural gas fired appliance. When burning the gas in this way, it is recommended that levels of hydrogen sulfide not exceed 1000 ppm. When the concentration is higher, the sulfuric acid formed in the condensate can cause heavy corrosion (Wellinger and Lindberg, 2001). Many modern boilers have tin-laminated brass heat exchangers which can corrode more easily. Use of a cast iron heat exchanger can slow this corrosion. Ensuring the temperature of the exhaust gas is higher than 150°C keeps the hydrogen sulfide above its dew point. The acid will not condense and therefore will contribute less to corrosion. Water vapour can cause problems in gas nozzles and may need to be removed. Removal of water will also remove a portion of the H2S (Wellinger and Lindberg, 2001). The gas pressure requirements of a heat boiler are 0.80 to 2.50 kPa (0.12 to 0.36 psi). Digester-produced pressures are large enough for this demand. Heat boilers are 80 to 90 % thermally efficient (Bitir et al, 2002). For example, consider a storage which contains 100 m3 of biogas with a methane content of 65%. Since pure methane has a theoretical heat value of approximately 10 kWh/ m3,(approx 1000 BTU/ft3) the heat value of 100 m3 of biogas is 650 kWh. If the boiler is 80% efficient, approximately 520 kWh are available for use.
Flare There are two basic types of flares available: open and enclosed. Open flares usually consist of a burner with a small windshield. The rich gas mixture, lack of insulation, and poor mixing often lead to an incomplete burn as well as considerable radiant heat loss. Open flares are usually constructed several metres off the ground in order to protect both workers and supply pipes from the radiated heat. Due to the lack of process and emission control, open flares are mostly suited for temporary or test uses. Enclosed flares are usually ground-based permanent structures. The burner is kept in an enclosed cylinder lined with refractory material. The insulation and control of air mixture contribute to a more uniform burn as well as lower emissions. Enclosed flares can be further classified into diffusion aeration and pre-aerated flares. As the

12
name might suggest, air is mixed with the gas prior to reaching the burner in a pre-aerated flare, whereas air is mixed at the burner in a diffusion flare (Wheeler, 2000). Since on-farm agricultural anaerobic digesters are in their infancy in Ontario, there are currently no regulations requiring an emergency flare. The methane released is considered to be analogous to methane emissions from a typical manure storage. The matter, however, is currently under review (Hilborn, 2005).
Internal Combustion Engines The use of internal combustion (IC) engines with biogas is long established and reliable (Wellinger and Lindberg, 2001). IC engines are sub-divided into two categories: compression engines, and spark ignition engines. Both types of engine may be converted to run on the biogas produced by anaerobic digesters. Biogas operation of compression engines is known as “dual fuel” operation because a small amount of diesel fuel is combined with the gas for ignition purposes. Spark ignition engines are operated on a mixture of biogas and air, as ignition is caused by a spark p lug. Dual Fuel Engines – Simply stated, in a dual fuel engine, a mixture of biogas and air (mixed in an external device) is sucked into the engine chamber and ignited with a small amount of diesel fuel. The amount of this pilot fuel needed for ignition is approximately 10 to 20% of the amount needed for operation on diesel fuel alone (von Mitzlaff, 1988). This extra fuel represents an extra cost in running the engine. However, the dual fuel engine can operate on anywhere from zero to 85% biogas, which can be advantageous during digester start-up as well as during periods of low biogas production. A limitation to the dual fuel engine is that the fuel injectors can overheat when the flow of diesel fuel is reduced to 10 to 15% of normal (von Mitzlaff, 1988). Furthermore, Bari (1996) found that dual fuel engines “ran harshly” with biogas containing more than 40% CO2. Spark Ignition Engines - The carburetor of a typical spark ignition engine must be replaced with a biogas-air mixer. Converted SI engines show a 15 to 20% decrease in power due to the decrease in volumetric efficiency and the flame speed of gas-air compared to gasoline-air mixtures (Henham and Makkar, 1998). An increase of compression ratio and an advancement in spark timing can decrease this power loss a certain amount. However, the loss can never be fully regained and the changes to compression ratio are permanent. Therefore the engine cannot be run on gasoline in periods of little or no biogas production. Biogas consisting of 60% methane is considered a medium weak gas and causes engine power reductions of approximately 20%, compared to 10% for natural gas and 5% for LPG (von Mitzlaff, 1988). IC engines are at risk of corrosion from the presence of H2S (similar to the heat boiler). It is for this reason that levels of H2S less than 1000 ppm are recommended (Wellinger and Lindberg, 2001). In surveying digester experience in the United States prior to 1998, Lusk (1998) found that H2S corrosion of engines was quite common in cases of no pre-treatment. Nevertheless, the United States Environmental Protection Agency states that gas treatment is not necessary given a regular maintenance schedule (AgSTAR, 2004). Indeed, on one Colorado hog farm, gas is used directly out

13
of the digester and lubrication oil is changed as often as every ten days (Anon. 2004c). Converted diesel engines are thought to be more capable of handling H2S levels than spark ignition engines (Wellinger and Lindberg, 2001). Pressurization - Biogas does not require pressurization befo re use in an IC engine. Digester-produced pressures are usually adequate (Anon, 2004a). Efficiency - Electrical efficiencies of IC engines (coupled with generators) vary. Some studies report efficiencies as high as 29% for spark ignition engines and 31% for dual fuel engines (Wellinger and Lindberg, 2001). The US EPA assumes a range of 18 to 25%, depending on engine design and load factor (AgSTAR, 2004). In independent testing of one IC engine/generator pair, the Greenhouse Gas Technology Center found an efficiency of only 19.7% (AgSTAR, 2004). With so many available engines and generators, it is not surprising to find a wide range of electrical efficiencies. Thermal energy may be recovered by means of a heat recovery system, thereby increasing the efficiency of the system. For example, by passing exhaust gas through heat exchanger units, low pressure steam can be produced. A thermal jacket surrounding the engine can collect thermal energy in the form of hot water. This thermal jacket water can reach temperatures of 125°C (Willingham and Pipattanasomporn, 2003). Total thermal efficiency can reach 65%. Recall the example of 100 m3 of biogas with a theoretical heat value of 650 kWh/ m3. Consider an engine/generator set that is 20% efficient at producing electricity and 40% thermally efficient. In this case, the total system efficiency is 60% - approximately 130 kWh of electricity and 260 kWh of heat are produced. IC Engine Emissions - IC engine emissions from biogas are similar to those of natural gas. However, the higher level of CO2 in biogas decreases cylinder temperatures. This helps to decrease NOx emissions (Huang and Crookes, 1998). Typical values, compared to other electricity generators, can be found in the Emissions section of this report.
Gas Turbines Gas turbines are essentially internal combustion engines that operate with rotary instead of reciprocating action. There are three main components to a gas turbine: the compressor, the combustor, and the power turbine. Ambient air is compressed and added to the fuel in the combustor. The mixture is ignited and the resulting hot gases are directed towards the power turbine. The power turbine section allows the gases to expand over the turbine fins, thereby rotating the shaft. A portion of the power created by the shaft is commonly used to drive the gas turbine’s internal compressor. The balance is used to drive an external load (e.g. a generator). Unfortunately, gas turbines are only competitive at creating electricity at scales greater than 800 kW (Wellinger and Lindberg, 2001). Most farm-based anaerobic digesters would not produce enough biogas to power a generator of this magnitude, making turbines impractical for the majority of farms.

14
Microturbines Microturbines are based on the principles of large gas turbines. They include an improvement that contributes to an improved electrical efficiency - a heat exchanger attached to the exhaust. The recovered thermal energy pre-heats the inlet air, which is mixed with biogas. The air/gas mixture is burned and allowed to expand through a turbine section to perform work. A gearbox and other moving parts are replaced by inverter-based electronics allowing the turbine to be operated at high speeds. The shaft can rotate as fast as 96,000 rpm. The exhaust gas is directed to the heat exchanger and then can be piped to a second heat recovery unit for further heat recovery. Biogas must be compressed to approximately 585 kPa (85 psi) before use in a microturbine (Wiltsee and Emerson, 2004). The compressor may be included as a component of the microturbine system or may be run independently. Hydrogen sulfide does not need to be removed from the biogas. There are models of microturbines that are able to handle H2S levels as high as 7%, much higher than any gas produced by an agricultural anaerobic digester (Capstone, 2005). Other models are equipped with a fuel conditioner ‘on-board’ (Ingersoll-Rand, 2003). Water vapour can contain compounds that may harm the fuel injectors, fuel control valves or the compressor. Thus, the vapour must be removed from the biogas. This represents the biggest concern. It is important to note that microturbines may be easily switched to run on natural gas in periods of low biogas production. Compared to internal combustion engines, microturbines have a much lighter maintenance schedule. A continuously running microturbine requires as little as 24 hours of maintenance for every 8000 hours of operation (Wiltsee and Emerson, 2004). Due to the smaller number of moving parts, a microturbine produces relatively low levels of noise and vibration. Therefore, a heavy foundation is not required (Brandon, 2002). Microturbines are capable of achieving electrical efficiencies of 25 to 30 %. Increasing ambient air temperature and increasing altitude have a detrimental effect on the efficiency of microturbines, by decreasing the density of the air (NRC, 2002). Also, a large portion of the electrical efficiency comes from the inlet air/exhaust heat exchanger. This means the microturbine will need a warm-up period in order to maximize its potential efficiencies. The exhaust gas from the first heat exchange unit can be 230 to 315°C, depending on the model, ambient environment, and altitude (Wiltsee and Emerson, 2004). These secondary heat exchange units have been reported to reach thermal efficiencies of 45% (Willingham and Pipattanasomporn, 2003). It is important to note that all thermal energy available for recovery is in the form of the microturbine exhaust. This exhaust gas stream is concentrated and is hot enough to be used directly (e.g. in greenhouses or drying applications) (Anon, 2005b). Emission levels of NOx from a microturbine can be less than 9 ppm (NRC, 2002).

15
Fuel Cells Fuel cells convert chemical energy to electricity without combustion. This conversion is similar to that of a battery. There are three sections to a fuel cell:
• Fuel pre-treatment and processing section – Here, the gas is purged of H2S and other harmful contaminants. The processing section includes a fuel reformer that converts methane to a hydrogen-rich gas used by the fuel cell stack.
• Fuel cell stack - The electricity-producing chemical reaction takes place here. • DC to AC power electrical conditioning and controller section - This section
converts the DC electricity produced by the fuel cell to grid-standard AC electricity.
There are several different types of fuel cells. Each is named for the type of electrolyte used.
• Alkaline Fuel Cell – These are the oldest fuel cell types. They were originally used in space shuttles. These fuel cells are easily contaminated by carbon, therefore their application on earth is limited (Anon, 2005e).
• Phosphoric Acid Fuel Cell – This type was the first commercially available fuel cell, in 1992. They operate at a temperature between 150 and 220°C (Anon, 2005a). They are reliable sources of energy, with an electrical efficiency of between 36 and 40%. These efficiencies, however, lag behind other fuel cells. Furthermore, the price has not decreased as expected and at least one fuel cell manufacturer is phasing out of this type of fuel cell in favour of the proton exchange membrane (NSTAR, 2005).
• Proton Exchange Membrane (PEM) Fuel Cell – These are the leading candidates for use in an automobile as they are capable of starting quickly and match a changing load. This ability to start quickly stems from a relatively low operating temperature of 90°C (Anon, 2005a). Most stationary PEM fuel cells will have a capacity under 10 kW (NSTAR, 2005). A PEM fuel cell has become the first fuel cell to generate electricity from agricultural biogas. The 5 kW unit is being run intermittently by researchers from the University of Minnesota on a dairy farm (Anon, 2005c).
• Solid Oxide Fuel Cell (SOFC) and Molten Carbonate Fuel Cell (MCFC) – Both of these fuel cells operate at very high temperatures. MCFC operate between 600 and 700°C, while SOFC function between 650 and1000°C. This high operating temperature translates into high quality exhaust heat, but also a slower start-up time. MCFC range in size from 250 kW to 3 MW units. SOFC are being developed in the 5 kW to multi-megawatt range. The “Fuel to Electricity” efficiencies of both MCFC and SOFC approach 60% (Anon, 2005a).
Biogas intended for use in a fuel cell must first be purified. The catalysts of fuel cells cannot tolerate hydrogen sulfide (Minott et al., 2004). Levels higher than 0.5 to 1.0 ppm are unacceptable for a high temperature fuel cell generator. Water vapour and carbon dioxide are considered fuel diluents (Anon, 2005a). The purified biogas would not need to be further compressed. Methane can be used in the range of 1 to 3.5 kPa (0.14 to 0.5 psi) for a phosphoric acid fuel cell (Anon, 2005e).

16
Since fuel cells are an emerging technology, their maintenance is likely to be time-consuming and expensive. Fuel cells require specialized engineering, plumbing, catalyst, and thermal and electrical power generation expertise that is probably only available from the manufacturer (Minott et al., 2004). Noise is generally not an issue since there is no combustion and any forms of sound are produced by water pumps and air blowers. One brand of phosphoric acid fuel cells claims their product emits only 60 db at 9 metres (Anon, 2005g). The fuel cell stack itself is not a source of emissions as heat and water are the only products. The fuel reformer, however, produces trace amounts of NOx and SOx. Independent testing of a phosphoric acid fuel cell demonstrated NOx levels less than 1.5 ppm (Anon, 2004c).
Comparison of Generators In order to evaluate the engines and generators properly, a number of factors must be considered. Common criteria for electricity generators have been summarized in Tables 4, 5, 6 and 7 for easier comparison. Table 4 – Comparison of main generator options IC Engine Microturbine Fuel Cell Size Range1 (kW) 1 to 5000+ 30 to 250 Several W to 3000+ Electrical Efficiency1 (%) 25 to 45 25 to 30 33 to 50 Typical Exhaust Heat Temperature2 (°C)
600 230 to 315 Low:120; High: 600 to 850
Thermal Efficiency2 (Maximum)
65 % 45 % 58 %
Biogas Pre-Treatment Water Vapour Removal Recommended Yes Yes H2S Removal Recommended No Yes Air Compression No Yes No 1 - Source: NSTAR, 2005 2 - Source: Anon. 2004c; Willingham and Pipattanasomporn, 2003. The current equipment cost ranges shown in Table 5 include the costs associated with a heat recovery system as well as the generating system. It does not include labour and maintenance costs. Table 5 – Typical costs of installing a generation system using biogas Generator Type Current Equipment Cost (US$/kW) IC Engine 500 to 1400 Microturbine 1000 to 2000 Fuel Cell 3500 to 10,000 Source: NSTAR, 2005; Willingham and Pipattanasomporn, 2003.

17
Table 6 – Air emissions for typical generator systems using biogas Generator Type
Power (kW)
Emissions (lbs/kWh)
NOx SOx CO CO2 VOC Diesel Engine 500 0.017 0.005 0.010 1.70 0.002 SI Engine 500 0.0026 0.00001 0.008 0.97 0.0015 Microturbine 45 0.00115 0.00003 0.00265 1.188 0.00004 MCFC 250 0.0000041 0.0000006 0.00025 0.94 0.00015 Source: Minott and Scott, 2001. Table 7 – Typical noise levels for generator systems using biogas Generator Type
Power (kW)
Noise Level (qualitative/db)
Diesel Engine 500 Moderate to High (requires building enclosure)/~110 db SI Engine 500 Moderate to High (requires building enclosure)/~110 db Microturbine 45 Moderate (enclosure supplied with it)/70 db at 3m MCFC 250 Low (no enclosure required)/60 db at 30m Source: Minott and Scott, 2001.
Case Study: Colorado Pork, LLC Colorado Pork is a sow farrow-to-wean farm located in Lamar, Colorado. The operation began in 1999 and houses up to 5000 sows. The farm uses a complete mix digester to reduce odour and meet water quality regulations. The digester has a capacity of 1.89 million litres (500 000 US gal) with 57 000 litres (15 000 US gal) of manure being cycled every day. The system has a retention time of 40 days. Approximately 560 cubic metres of biogas is produced every day. The gas is composed of approximately 67% methane and 32% CO2. The hydrogen sulfide concentration averages 6000 ppm. The biogas is collected under a high density polyethylene cover at a pressure of 3.5 to 5 kPa. A pressure relief valve diverts the gas to a flare if this pressure range is exceeded (Anon. 2004c). Colorado Pork is an interesting case study because its biogas is used to run an engine/generator and a microturbine. This situation provides an excellent opportunity to study the two generators under similar conditions.
Technology Description The engine used is a Caterpillar Model 3306 ST with a nominal rated power output of 100 kW (15°C, sea level). The engine is a 6-cylinder, 4-stroke, naturally aspirated unit with a 10.5:1 compression ratio and a speed range of 1000 to 1800 rpm. The engine is used to drive an induction generator manufactured by Marathon Electric (Model No. MCTG-80-3) (Anon, 2004c). The microturbine system used is a Capstone Model 330. The microturbine is a single shaft, high speed, recuperated, air-cooled generator with a nominal rated power output of 30 kW net (15°C, sea level). The system requires a gas booster compressor which imposes a parasitic load of 4 kW on the overall generating system. The Capstone Corporation further de-rates the power output by 4 kW due to the high altitude.

18
Independent performance testing was conducted by the Greenhouse Gas Technology Center in early 2004. Results of the testing are summarized in Table 8. Table 8 – Performance and air emissions under various loading conditions for two generator systems at Colorado Pork (Anon, 2004c) IC Engine Microturbine
Power Command (kW) 45 30 30 20
Power Delivered (kW) 44.7 29.6 19.9 15
Net Efficiency (%) 19.7 13.8 20.4 18.6
Heat Recovery (kW) 73.3 64.2 32.5 31.7 Heat Recovery (103
Btu/hr) 250 219 111 108
Thermal Efficiency (%) 32.4 30.0 33.3 39.2
Hea
t & P
ower
Pro
duct
ion
Total CHP System Eff. (%) 52.1 43.8 53.7 57.7
NOx 0.012 0.002 8.21E-5 1.95E-3
CO 0.058 ABOVE RANGE
0.009 0.010
THC N/A N/A 0.0027 0.0035
CH4 0.112 0.150 0.0022 0.0028
CO2 1.97 2.21 3.45 3.79
Em
issi
ons
(lb/k
Wh)
SO2 0.023 0.030 0.037 0.040
Export of Electricity
Net Metering Net metering is one option for export of electricity generated by an anaerobic digester. The amount of electricity exported to the grid is subtracted from the electricity imported from the grid, resulting in a “net” total from which a utility bill is calculated. This type of metering is a method of reducing electricity bills. In Ontario, generators are not paid for any excess electricity flowing onto the electrical grid. Net metering is currently available in Ontario for projects producing up to 50 kW at the discretion of electricity distribution companies. The program offered by Hydro One has two methods of metering and billing:
• If a generator is less than or equal to 10 kW, two meters are installed to read generated and delivered electricity separately. There is no change in meter reading or frequency.

19
• If a generator is above 10 kW but less than or equal to 50 kW, an interval meter is installed and read remotely on a monthly basis.
The Ontario government intends to put in place regulations requiring companies to allow net metering up to 500 kW. The proposal is part of the current government’s plan to promote renewable technologies. Additional provisions of the official proposal include:
• Credits received by the customer must be calculated on the same basis as the charges by the distributor for electricity delivered to the customer.
• The proposed regulation allows credits to be carried over from one bill to the next for the period of one year. This provision is meant to accommodate seasonal differences in consumption and generation. This provision is common in many other net metering regulations.
• Net metering customers are exempt from the generator regulations as long as they are generating for their own use and they only receive credit and are not paid for their electricity (Anon. 2005d).
Retail Generation Currently in Ontario, to be paid for electricity exported onto the grid or for operations larger than 50 kW, approvals and licenses must first be obtained. A generator license must be obtained from the Ontario Energy Board. Generators must also apply to the Independent E lectricity System Operator (IESO) to become a registered market participant. An agreement with an electricity distribution company must be made and the necessary equipment must be purchased and installed. This may include a distribution transformer and a four-quadrant interval meter. A System Impact Assessment applies to generators operating at 10 MVA or greater. The Ontario Environmental Assessment Act regulations apply to biogas operations generating in excess of 25 MW but these levels of power are much higher than the capacity of farm-based anaerobic generators. Finally, the Electrical Safety Authority must inspect generating facilities and provide connection authorization (Anon, 2004b). Generators must follow the Distribution System Code mandated by the Ontario Energy Board and any Institute of Electrical and Electronics Engineers (IEEE) standards.
Future Directions
Stirling Engines A Stirling engine is known as an external combustion engine. A working fluid, commonly hydrogen or helium, and a piston are contained in an airtight enclosure. The fluid is heated on one end and cooled on the other. The expansion and cooling of the gas drives the piston. The heat is provided by the external combustion (Anon, 2005b). The Stirling engine was patented in 1816 and commonly used before World War I. As steam and Otto engines increased in efficiency, however, the external combustion
20
engine lost favour. Stirling engines of today are capable of producing from several watts to 55 kW. Electrical efficiencies range from 12 to 30% (Anon, 2002a). Low noise and vibration as well as relatively few moving parts make the Stirling engine an attractive technology. The engine is also able to make use of many different fuels. However, the Stirling engine is still early in its product life cycle and current high costs as well as limited independent testing are drawbacks (Anon, 2002a).
Microturbine/High Temperature Fuel Cell Microturbine/Fuel Cell hybrids are being developed by many organizations, including the National Fuel Research Center, the National Energy Technology Laboratory and private industry groups. Hybrid systems contain a heat engine, such as a microturbine, and a non-heat engine, such as a fuel cell. The system has the ability to achieve electrical and thermal efficiencies greater than either system alone (Samuelson, 2004). The microturbine hybrids are being designed for power ratings from 15kW to 50MW. Early estimates of electrical efficiencies are 60% or higher with long-term predictions reaching 80% when running on natural gas (Samuelson, 2004). Also advantageous is the extremely low resulting emissions. There are still issues to resolve before microturbine/fuel cell hybrid use becomes widespread. Nevertheless, a 220 kW prototype run by Southern California Edison involving a 75 kW microturbine and a SOFC fuel cell has achieved “world record … fuel-to-electricity efficiencies”.
Conclusions Anaerobic digestion of livestock manure is a widespread practice in many livestock-producing countries of the world. Ontario farmers have been interested in the technology for a number of years but very few have installed a system on their farms. Current concerns about energy costs and the desirability of renewable energy have helped raise awareness of the possibilities for biogas production from livestock manure. Following are a few of the main findings of a review of literature on the subject:
• Several system designs are available for anaerobic digestion on livestock farms. These take into account factors such as cost of installation and operation and characteristics of the raw materials. All of the design considerations can have an impact on the yield of methane gas.
• The potential methane yield for livestock manure is in the order of 500 L CH4 / kg VS (where VS = Volatile Solids).
• Fresh manure yields more methane than aged manure. • Biogas typically contains 60 to 65% methane, 35 to 40% carbon dioxide and
trace amounts of H2S, NH3 and H2. • Burning biogas in a heat boiler can typically recover 80 to 90% of the energy as
heat (i.e. thermal efficiency). • Internal combustion (IC) engines (both spark ignition and compression ignition)
can be coupled with a generator to produce electricity. Most studies report

21
electrical efficiencies in the range 18 to 30%, but higher values are possible. Heat can also be recovered, both from the exhaust gas and from the engine cooling system.
• Microturbines have become a popular alternative to IC engines, due to their lighter maintenance schedule, lower noise levels and lower air emission levels. The initial cost is higher, however.
• Fuel cells may be an option in the future, but costs need to come down before they become a practical alternative for farm use.
• Farmers generating electricity using biogas may choose a net metering arrangement. This allows for export to the electrical grid at times when production exceeds demand on the farm. This credit is applied to those times when on-farm demand is greater than what the generator supplies, so the farmer pays for the net power consumed. For those producing more than they can use, a generator license can be obtained.
References Ahring, B.K. 1994. Status on Science and Application of Thermophilic Anaerobic
Digestion. Water Science Technology, Vol. 30, No. 12: 241-249. AgSTAR. 2004. AgSTAR Handbook: A Manual for Developing Biogas Systems at
Commercial Farms in the United States. Second Edition. U.S. Environmental Protection Agency and Environmental Restoration Group Inc.
Anon. 2002a. California Distributed Energy Resource Guide: Stirling Engine. California
Energy Commission. Available on-line at: http://www.energy.ca.gov/distgen/equipment/stirling_engines/stirling_engines.html. Date accessed: August 18, 2005.
Anon. 2003. First poop powered farm saves $1200 per month. Eastern Ontario:
Farmers Forum. July 2003. Anon. 2004a. Electric Power and Heat Generation Using UTC Fuel Cells’ PC25C Power
Plant and Anaerobic Digester Gas. Environmental Technology Verification Report, Greenhouse Gas Technology Center Southern Research Institute.
Anon. 2004b. Electricity Updates: Generation Connections. Hydro One Networks Inc.
Available on-line at: http://www.hydroonenetworks.com/en/electricity_updates/generation/pre_bid.asp#ex. Date accessed: August 18, 2005.
Anon. 2004c. Swine Waste Electric Power and Heat Production – Capstone 30 kW
Microturbine System. Environmental Technology Verification Report, Greenhouse Gas Technology Center Southern Research Institute.

22
Anon. 2004d. Swine Waste Electric Power and Heat Production – Martin Machinery
Internal Combustion Engine. Environmental Technology Verification Report, Greenhouse Gas Technology Center Southern Research Institute.
Anon. 2005a. Fuels for Fuel Cells. National Fuel Cell Research Center. Available on-
line at: http://www.nfcrc.uci.edu/fcresources/FCexplained/Fuels.htm. Date accessed: August 12, 2005.
Anon. 2005b. How a Stirling Engine Works. Infinia Corporation. Available on-line at:
http://www.infiniacorp.com/technology/how_stirling_works.htm. Date accessed: August 15, 2005.
Anon. 2005c. Hydrogen Fuel Cell Project Taps Farm’s Anaerobic Digester. Renewable
Energy Access. Available on-line at: http://www.renewableenergyaccess.com/rea/news/story?id=28814. Date accessed: August 15, 2005.
Anon. 2005d. Net Metering. Ministry of Energy Science and Technology. Ontario
Regulation Proposal, EBR Registration No. RO04E0001. Anon. 2005e. Products. UTC Power, A United Technologies Company. Available on-line
at: http://www.utcfuelcells.com/utcpower/products/index.shtm. Date accessed: August 12, 2005.
Bari, S. 1996. Effect of Carbon Dioxide on the Performance of Biogas/Diesel Dual-Fuel
Engine. WREC 1996: 1007-1010. Barker, J.C. 2001. Methane Fuel Gas from Livestock Wastes: A Summary. Publication
No. EBAE 071-80, North Carolina Cooperative Extension Service. Beaulieu, M. 2004. Manure Management in Canada. Statistics Canada, Agricultural
Division. Catalogue No. 21-021-MIE -- No. 002. Bitir, I., Tazerout, M. and Le Corre, O. 2002. Optimal Use of the Generated Biogas from
Manure. Paper No. 387-395 in Proceedings of the World Congress of Computers in Agriculture and Natural Resources (13-15 March 2002). ASAE Publication No. 701P0301.
Bothi, K.L. and Aldrich, B.S. 2005. Centralized Anaerobic Digestion Options for Groups
of Dairy Farms. Manure Management Program, Cornell University. Ithaca, NY. Brandon, R. 2002. The Power of New Technology: Microturbines. Natural Resources
Canada. CANMET Energy Technology Centre, Nepean, ON. Capstone. 2005. Capstone C30 Product Datasheet. Capstone Turbine Corporation,

23
Chatsworth, CA. Earth Tech. 2002. Waste-Based Energy Feasibility Study. Report submitted to
Municipality of Chatham-Kent. Project No. 55484, Earth Tech Canada Inc. Markham, ON.
El-Mashad, H.M., Zeeman, G., van Loon, W.K.P., Bot, G.P. and Lettinga, G. 2004.
Effect of temperature and temperature fluctuation on thermophilic anaerobic digestion of cattle manure. Bioresource Technology, Iss. 95: 191 – 201.
Fischer, T. 2002. Operating Biogas Plants for Solid Waste Digestion in Germany.
Biocycle, Dec. 2002, Vol. 43, Iss. 12: 34-36. Fulhage, C., Sievers, D., and Fischer, J. 1993. Generating Methane Gas from Manure.
Department of Agricultural Engineering, University of Missouri Extension. Henham, A. and Makkar, M.K. 1998. Combustion of Simulated Biogas in a Dual-Fuel
Diesel Engine. Energy Conversion Management, Vol. 39, No. 16-18: 2001-2009. Hilborn, D. 2005. Personal communication. Don Hilborn, P.Eng., By-Products,
Engineering and Technology, Ontario Ministry of Agriculture, Food and Rural Affairs.
Hill, D.T. 1984. Methane productivity of the major animal waste types. Transactions of
the ASAE, Vol. 24, Iss. 2: 530 – 534. Holm-Nielson, J.B., and Al Seadi, T. 2003. AD of Organic Residues and Energy Crops.
Presented at Biogas International 2003, June 27 2003. Huang, J. and Crookes, R.J. 1998. Spark-ignition engine performance with simulated
biogas - a comparison with gasoline and natural gas. Journal of the Institute of Energy, Dec. 1998, 71: 197-203.
Ingersoll-Rand. 2003. Biogas-to-Energy Systems for Anaerobic Digesters. Ingersoll-
Rand Company, Davidson, NC. Köttner, M. 2002. Biogas in Agriculture and Industry Potentials, Present Use and
Perspectives. Waste Management World, Vol. 1, Iss. 1. James and James (Science Publishers) Ltd, London, England.
Kramer, J. 2002. Agricultural Biogas Casebook. Submitted to Great Lakes Regional
Biomass Energy Program. Resource Strategies, Inc. Madison, WI. Lusk, P. 1998. Methane Recovery from Animal Manures: The Current Opportunities
Casebook. Paper No. 580-25145, National Renewable Energy Laboratory.

24
Golden, CO. Lusk, P. 1999. Latest Progress in Anaerobic Digestion. Biocycle, Jul. 1999, Vol. 40, Iss.
7: 52 – 55. Mangino, J., Bartram, D., and Brazy, A. 2002. Development of a Methane Conversion
Factor to Estimate Emissions from Animal Waste Lagoons. U.S. Environmental Protection Agency, Methane Sequestration Branch. Washington, D.C.
Mattocks, R., and Wilson, R. 2005. Latest Trends in Anaerobic Digestion in North
America. Biocycle, Feb. 2005, Vol. 46, Iss. 2: 60 – 63. McClinton, L. 2003. Hog Farm Converts Manure to Electricity. National Hog Farmer.
2003 Primedia Business Magazines & Media Inc. McNeil Technologies. 2000. Assessment of Biogas-to-Energy Generation Opportunities
at Commercial Swine Operations in Colorodo. Submitted to Western Regional Biomass Energy Program. Contract No. 55024. McNeil Technologies, Golden, CO.
Minott, S, and Scott, N. 2001. Feasibility of Fuel Cells for Energy Conversion on Dairy
Farms. Presented at the 2001 Annual International Meeting, July 30 - August 1, Paper No. 01-7015. St. Joseph, MI: ASAE.
Minott, S, Scott, N. and Aldrich, B. 2004. Feasibility Study of Fuel Cells for Biogas
Energy Conversion on Large Dairy Farms. NSERDA. Technical Note FC-1. Moller, H.B., Sommer, S.G., and Ahring, B.K. 2004. Methane productivity of manure,
straw and solid fractions of manure. Biomass and Bioenergy, Iss. 26: 485 – 495. Moller, H.B., Sommer, S.G. and Ahring, B.K. 2004b. Biological Degradation and
Greenhouse Gas Emissions during Pre-Storage of Liquid Animal Manure. Journal of Environmental Quality, Vol. 33, January-February 2004.
NRC. 2002. The Power of New Technology – Microturbines. Natural Resources Canada
– CANMET Energy Technology Centre NSTAR. 2005. Distributed Generation: Reciprocating Engines, Microturbines, Fuel
Cells, Stirling Engines and Photovoltaics. NSTAR. Platts, McGraw-Hill Companies, Inc.
Persson, S.P.E., Bartlett, H.D., Branding, A.E., and Regan, R.W. 1979. Agricultural
Anaerobic Digesters: Design and Operation. Bulletin 827, The Pennsylvania State University, College of Agriculture, Agriculture Experiment Station. University Park, PA.

25
Pos, J., teBoekhorst, R., Eaton, D., Walczak, B. and Pavlicik, V. 1981. Biogas Production From Animal Manure and Crop Residues & Processes, Procedure, and Design. Technical Report 126-59, 1981. School of Engineering, Ontario Agricultural College, University of Guelph.
Poulsen, T.G. 2003. Anaerobic Digestion. Solid Waste Management, Ch. 5. Aalborg
University, Aalborg, Denmark. Price, E.C. and Cheremisinoff, P.N. 1981. Biogas: Production & Utilization. Ann Arbor
Science Publishers, Inc. Ann Arbor, MI. Samuelson, S. 2004. Fuel Cell/Gas Turbine Hybrid Systems. ASME International Gas
Turbine Institute. Atlanta, GA. Timbers, G.E. and Marshall, D. 1981. Biogas as a Farm Energy Source. Contribution
No. I-297. Engineering and Statistical Research Institute, Research Branch, Agriculture Canada.
Valdez-Vazquez, I., Rios-Leal, E., Esparza-Garcia, F., Cecchi, F., Garcia-Mena, J. and
Poggi-Varaldo, H. M. 2004. A review on hydrogen production with anaerobic consortia. Anaerobic Digestion 2004: Proceedings of the 10th World Congress. Montreal, QC.
von Mitzlaff, K. 1988. Engines for Biogas. German Appropriate Technology Exchange
(GATE), Deutsche Gesellschaft für Technische Zusammenarbeit (GTZ). Wellinger, A. and Lindberg, A. 2001. Biogas Upgrading and Utilisation. IEA Bioenergy.
Task 24: Energy from biological conversion of organic waste. Wheeler, P. 2000. Biogas Flares: State of the Art and Market Review. AEA Technology
Environment, Oxfordshire, United Kingdom. Willingham, M. and Pipattanasomporn, M. 2003. The Role of Combined Heat and
Power (CHP) in Virginia’s Energy Future. Alexandria Research Institute. Alexandria, VA.
Wiltsee, G. and Emerson, H. 2004. Clean Power From Microturbines Using Biogas.
Biocycle, Feb. 2004, Vol. 45, Iss. 2: 53-55.