Embed Size (px)
Citation preview
SAFETY REPORTELECTRICAL
ONTARIO
13TH EDITION
2013

Introduction from the Chief Public Safety Officer ..................................................1
Executive Summary .......................................2
1.0 Purpose of this Report ............................6
1.1 Role of the Electrical Safety Authority .....7
1.2 Key Findings of the 12th Edition OESR...7
1.3 Case Studies ...........................................8
2.0 Electrical-Related Injuries and Fatalities ...9
2.1 Electrocutions and Electrical Burn Fatalities .........................................9 2.1 Summary of Statistics .....................12
2.2 Occupational Electrical-Related Fatalities and Injuries ...........................................13 2.2 Summary of Statistics .....................21
2.3 Non-Occupational Electrical-Related Fatalities and Injuries ............................22 2.3 Summary of Statistics .....................24
2.4 Electrical Injury and Emergency Department Visits in Ontario, 2003–2012 ............................................25 2.4 Summary of Statistics .....................28
2.5 Case Study: Electrical Worker ...............29
3.0 Utility-Related Equipment .....................31 3.0 Summary of Statistics .....................34
3.1 Case Study: Powerline Contact ............35
4.0 Overview of Fires in Ontario .................37 4.0 Summary of Statistics.....................40
4.1 Fires Resulting in Fatalities ...................41 4.1 Summary of Statistics .....................44
4.2 Fire Incidents with Electricity as the Fuel of the Ignition Source of the Fire ..........45 4.2 Summary of Statistics .....................47
4.3 Cooking Fires with Electricity as the Fuel of the Ignition Source of the Fire ..48 4.3 Summary of Statistics .....................51
4.4 Electrical Distribution Equipment with Electricity as the Fuel of the Ignition Source of the Fire .................................52 4.4 Summary of Statistics .....................56
4.5.1 Case Study: Fire Example # 1 ...............57
4.5.2 Case Study: Fire Example # 2 ...............59
5.0 Product Safety ......................................61 5.0 Summary of Statistics .....................63
5.1 Case Study: Lighting Fixture Fires ........64
Acknowledgements ....................................... 65
Methodology ................................................65
Fire Source Data ...........................................67
Bibliography ..................................................69
Glossary ........................................................71
Contents
ii 2013 Ontario Electrical Safety Report
Introduction from The Electrical Safety Authority’s Chief Public Safety OfficerThe only document of its kind in Canada and one of the few in the world, the Ontario Electrical Safety Report (OESR) consolidates multiple sources of data to provide an unbiased record of the state of electrical safety in a particular jurisdiction. The goal of the OESR is to present evidence that allows the safety community to make choices on where to direct resources that will prevent electrical-related fatalities, critical injuries and damage. Providing this annual statistical snapshot helps us direct our efforts where they are needed most.
Reporting data alone will not save lives, but it is a starting point for action and a yardstick to measure success. At ESA, we use the OESR in conjunction with our inspections, awareness campaigns, training initiatives and regulatory oversight to bring us closer to eliminating all electrical-related fatalities and critical injuries in Ontario. I am pleased to report that we are getting closer to realizing this vision. Over the past ten years there continues to be a decline in the rates of electrical-related fatalities and electrical injuries in Ontario.
While this overall downward trend is encouraging, unfortunately 2013 was a tragic year for 18 individuals and their family. There were nine electrical-related fatalities in 2013, which is a significant increase from two electrical-related fatalities in 2012. There were also nine fire fatalities due to electricity in 2013 compared to five in 2012. This reinforces to all of us in the safety system that there is still more work to be done.
Occupational electrical-related fatalities continue to outpace non-occupational deaths by a ratio of close to 3 to 1, up from 2 to 1 documented in last year’s OESR. Electrical distribution fires in houses and other buildings account for roughly 700 fires and result in two fatalities annually. Statistics like these are not just numbers—they are incidents that affect the lives of Ontarians. So while our focus is on these data, the work that ESA and our safety partners do each day has a real impact on the lives of Ontarians.
This report is only possible with the contributions and insight of many organizations. Specifically, I wish to thank the Ontario Ministry of Labour (MOL), the Workplace Safety and Insurance Board (WSIB), the Canadian Institute for Health Information (CIHI), the Office of the Fire Marshal and Emergency Management (OFMEM), and The Office of the Chief Coroner for Ontario.
I would also like to recognize the real people behind the statistics and on the front lines of electrical safety—electricians, utility line crews, firefighters and other emergency responders, and electrical inspectors to name a few. Their dedication and effort every day is improving the safety system for all of us.
Scott Saint Chief Public Safety Officer
2013 Ontario Electrical Safety Report 1

Overall Five-year Rolling Average Fatalities in Ontario
Fata
litie
s pe
r
Mill
ion
Pop
ulat
ion
2000 – 2004
2001 – 2005
2002 – 2006
2003 – 2007
2004 – 2008
2005 – 2009
2006 – 2010
2007 – 2011
2008 – 2012
2009 – 2013
Electrocutions and Burns 0.85 0.77 0.74 0.73 0.63 0.61 0.56 0.43 0.38 0.42**
Electrical Fire 1.05 0.98 0.84 0.92 0.93 0.84 0.80 0.69 0.64 0.60**
Total Electrical 1.90 1.75 1.58 1.65 1.56 1.45 1.36 1.12 1.02 1.02**
Conclusion: The five-year average fatality rate has decreased 35% over the last five years.
Source: ESA and Coroner’s records. ** Preliminary data subject to change.
Executive SummaryFor more than twelve years the Ontario Electrical Safety Report (OESR) has been produced by the Electrical Safety Authority (ESA) to provide a comprehensive assessment of electrical fatalities and incidents in Ontario. The report is used by ESA to better understand the dynamics of electrical safety. From these insights come strategies to improve electrical safety in the province.
The OESR provides a comprehensive assessment of electrical fatalities and incidents that occur in Ontario. Data presented in this report have been compiled from multiple sources, investigations, and root cause analyses. This report is broadly used by safety stakeholders and business operators to gain a better understanding of potential electrical risks, high risk areas, and to encourage the development of initiatives to improve the state of electrical safety in Ontario.
Over the past ten years, 2004 to 2013, there has been a decline in the rates of electrical-related fatalities, fire fatalities (where the ignition source was identified as electrical) and electrical injuries in Ontario. While progress is being made to reduce the number of incidents, the causes and contexts of the serious ones remain the same. Concerted efforts are needed for rates to continue to decrease.
Comparison of Electrical-related Fatalities to Fire Fatalities, per Million Population 2004 to 2013
0
0.5
1.0
1.5
2.0
2.5
2 2013 Ontario Electrical Safety Report
Electrical Fatalities
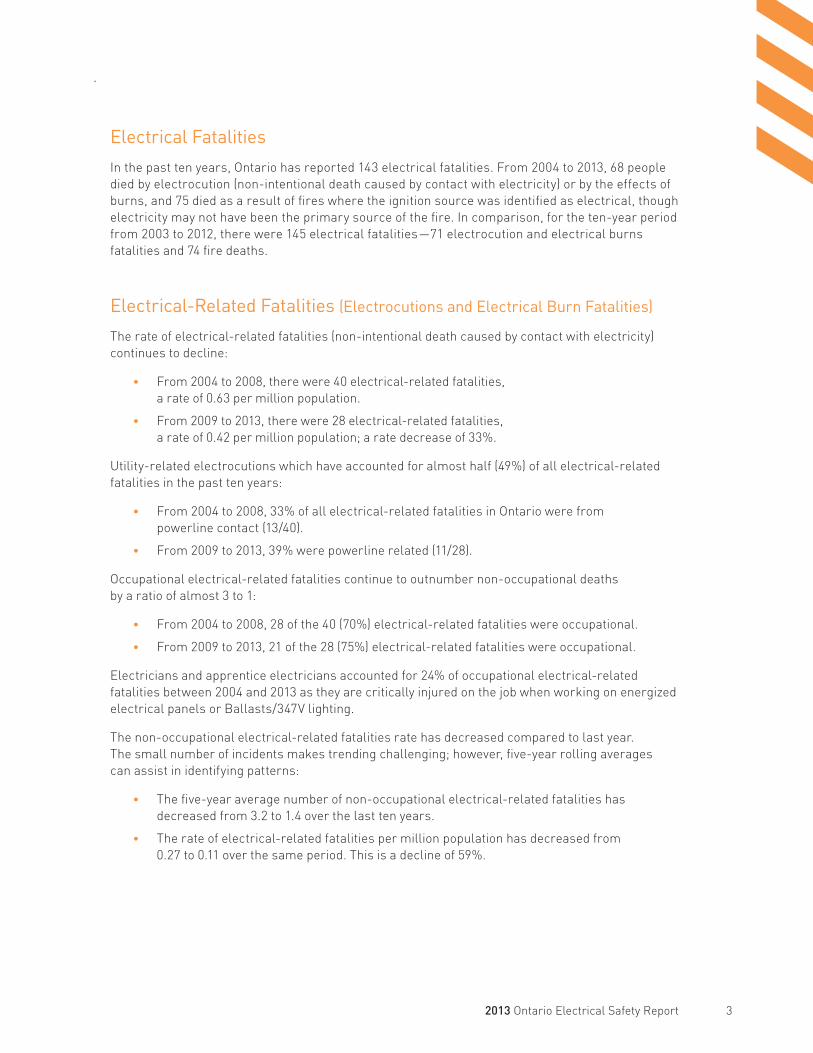
In the past ten years, Ontario has reported 143 electrical fatalities. From 2004 to 2013, 68 people died by electrocution (non-intentional death caused by contact with electricity) or by the effects of burns, and 75 died as a result of fires where the ignition source was identified as electrical, though electricity may not have been the primary source of the fire. In comparison, for the ten-year period from 2003 to 2012, there were 145 electrical fatalities—71 electrocution and electrical burns fatalities and 74 fire deaths.
Electrical-Related Fatalities (Electrocutions and Electrical Burn Fatalities)
The rate of electrical-related fatalities (non-intentional death caused by contact with electricity) continues to decline:
• From 2004 to 2008, there were 40 electrical-related fatalities, a rate of 0.63 per million population.
• From 2009 to 2013, there were 28 electrical-related fatalities, a rate of 0.42 per million population; a rate decrease of 33%.
Utility-related electrocutions which have accounted for almost half (49%) of all electrical-related fatalities in the past ten years:
• From 2004 to 2008, 33% of all electrical-related fatalities in Ontario were from powerline contact (13/40).
• From 2009 to 2013, 39% were powerline related (11/28).
Occupational electrical-related fatalities continue to outnumber non-occupational deaths by a ratio of almost 3 to 1:
• From 2004 to 2008, 28 of the 40 (70%) electrical-related fatalities were occupational.
• From 2009 to 2013, 21 of the 28 (75%) electrical-related fatalities were occupational.
Electricians and apprentice electricians accounted for 24% of occupational electrical-related fatalities between 2004 and 2013 as they are critically injured on the job when working on energized electrical panels or Ballasts/347V lighting.
The non-occupational electrical-related fatalities rate has decreased compared to last year. The small number of incidents makes trending challenging; however, five-year rolling averages can assist in identifying patterns:
• The five-year average number of non-occupational electrical-related fatalities has decreased from 3.2 to 1.4 over the last ten years.
• The rate of electrical-related fatalities per million population has decreased from 0.27 to 0.11 over the same period. This is a decline of 59%.
2013 Ontario Electrical Safety Report 3
Fire Fatalities and EventsThe number of electrical fires declined 38% between the years 2008-2012.
Cooking related fires continue to be the most common type of fire where electricity is the fuel of the ignition source; although the rates are declining:
• In 2003, there were 1,239 cooking fires.
• In 2012, there were 727 cooking fires. This is a 41% reduction.
Electrical distribution fires, as defined by the Office of the Fire Marshal and Emergency Management (OFMEM)1, are also declining:
• In 2003, there were 985 electrical distribution fires.
• In 2012, there were 443 electrical distribution fires. This is a 55% reduction.
Priority Issues
ESA uses the incident data in the OESR to identify those areas that present the greatest risk to Ontarians, to track changes in incident data, and to identify emerging trends.
Based on data collected over the past ten years, ESA has identified that over 70% of all electrical injuries and fatalities occur in four specific areas. These areas have been identified as priorities for reducing electrical fatalities, serious injuries, damage and loss in Ontario.
• Powerline contact accounted for 35% of all electrical-related fatalities in the past ten years.
• Electrical trade workers accounted for 31% of all occupational electrical-related fatalities between 2004 and 2013. There are at least four critical injuries to electricians on average each year. Safety incidents tend to be associated with unsafe work practices.
• Misuse of electrical products and unapproved or counterfeit products account for a significant number of safety incidents; more than 900 fires and an average of five fatalities each year. These fires are mainly caused by the misuse of stove-top equipment where unattended cooking has resulted in fire fatalities.
• Electrical infrastructure fires in buildings such as detached residential structures accounted for roughly 700 fires, and resulted in two fatalities, annually.
1 The OFMEM definition of “distribution equipment” is electrical wiring, devices or equipment, the primary function of which is to carry current from one location to another. Thus, wiring, extension cords, termination, electrical panels, cords on appliances, etc., are considered distribution equipment. This is different than Distribution Equipment as defined by Local Distribution Companies.
4 2013 Ontario Electrical Safety Report

ESA Initiatives Based on insights from the OESR, ESA introduced a Harm Reduction Strategy in 2010 to focus on addressing those harms that represent the majority of incidents. ESA is working towards a goal of a 30% reduction in electrical fatalities between 2010 and 2015. More detail on ESA efforts can be found at www.esasafe.com.
ESA cannot reach its goal without the significant work and support of many partners and stakeholders within the electrical safety system. They range from those who generate and distribute electricity—such as electrical equipment manufacturers, standards organizations, safety organizations, installers of electrical equipment, educators, facility owners, injury response and treatment providers, government, researchers and injury prevention specialists, safety regulators and worker safety advocates—to those who are the end users of electricity.
Working together, we seek to reduce the number of electrical fatalities, injuries and fires with the ultimate vision of ‘Getting to Zero.’
2013 Ontario Electrical Safety Report 5

OUR GOALAvoid preventable injuries of an electrical nature to reduce disability, deaths, lost time from work, and health care utilization.
WHO’S AT RISK?All 13.7 million Ontarians.
Purpose of this R
eport
1.0
1.1
1.2
1.3
1.0 Purpose of this Report
1.0 Purpose of this ReportThis is the thirteenth report on the state of electrical safety in the Province of Ontario. It is a compilation of statistics on electrical incidents: electrical-related fatalities; injuries of an electrical nature; and death, injuries, and damage caused by fire incidents identified by the Office of the Fire Marshal and Emergency Management of Ontario and local fire departments as having “electricity identified as the fuel source”.
The purpose of this report is to provide stakeholders within the broad electrical safety system with an update on the state of electrical safety in Ontario. Those stakeholders include:
• electrical utilities and those organizations that generate, transmit and distribute electricity;
• organizations that design, manufacture, distribute and supply electrical products;
• electrical contractors who install, repair and maintain electrical wiring installations and products in our homes, workplaces and public spaces;
• regulators and various levels of government that write policies and regulations to protect public safety;
• Canadian and international organizations which develop standards for electrical installation and products;
• academic and commercial organizations that focus on safety research and development;
• various organizations such as insurance companies that create policies that drive organization and consumer behaviour to reduce risk;
• health care providers, workplace and community-based safety organizations, education and training organizations that provide public communication, increase hazard-mitigation skills and awareness;
• consumers who purchase electrical products, and use and rely on electricity everyday in their home, workplaces, and public spaces;
• and more.
All of these organizations have a role in improving electrical safety in Ontario.
It is hoped that this report helps educate and inform members of the electrical safety system by identifying key electrical safety risks. This information can be used to develop and improve standards, identify areas for continued safety research, shape the development of workplace and community-based safety programs, and lead to improved training, education, and communications programs.
6 2013 Ontario Electrical Safety Report

Role of The Electrical Safety Authority
1.0 Role of The Electrical Safety Authority
1.1 Role of The Electrical Safety AuthorityESA is an Administrative Authority acting on behalf of the Government of Ontario with specific responsibilities under Part VIII of the Electricity Act, 1998 and the Safety and Consumer Statutes Administration Act,1996. As part of its mandate, ESA is responsible for administering regulation in four key areas:
• Ontario Electrical Safety Code (Regulation 164/99); • Licensing of Electrical Contractors and Master Electricians (Regulation 570/05); • Distribution Safety (Regulation 22/04); and • Product Safety (Regulation 438/07).
ESA operates as a private, not-for-profit corporation. Funding derives from fees for safety oversight, safety services, and licensing of electrical contractors and master electricians. Activities include:
• ensuring compliance with regulations;• investigating fatalities, injuries and fire losses associated with electricity;• identifying and targeting leading causes of electrical risk;• promoting awareness, education and training on electrical safety;• engaging with stakeholders to improve safety.
1.2 Key Findings of the 12th Edition of the OESRThe following are key findings of the previous edition of this report (to access the full report, visit www.esasafe.com):
Between 2003 and 2012:
• There were 145 electrical-related fatalities consisting of £ 71 electrical-related fatalities; and£ 74 fatalities from fires with electricity identified as the ignition source.
• Work-related electrical deaths accounted for 48 (68%) of the 71 electrical-related fatalities.
• With the decline of workplace electrical-related fatalities to non-electrical trade workers, and some change in the yearly deaths of electricians in the ten-year period, the prevalence of electricians electrocuted on the job decreased from 13% between 2003 and 2007 to 8.0% between 2008 to 2012, as a percentage of all electrical-related fatalities.
• Fires, with electricity identified as the fuel of ignition, decreased by 42% between 2002 and 2011. Both cooking-equipment fires and electrical distribution equipment fires have declined.
In the five-year period 2008 to 2012:
• The rate of electrical-related fatalities per million population was 0.38. • The rate of death by fire where electricity was identified as one of the sources
of ignition was 0.64.• There was a decrease in powerline-related deaths. They accounted for 39% of all
electrical-related fatalities, compared to 41% in the previous five-year period.
1.0
1.1
1.2
1.3
2013 Ontario Electrical Safety Report 7
1.3 Case Studies
1.3 Case Studies
This report features several case studies of ESA root-cause investigations.
ESA conducts these investigations of select, serious incidents (fatalities, critical injuries and serious fires), in order to determine the underlying root causes. The learnings from these investigations help to prevent future incidents and fatalities.
ESA’s investigations go beyond compliance with any code, regulations or standard and are not limited to electrical safety dimensions, but examine occupational health and safety and the role of the integrated safety infrastructure.
Root-cause investigations assess both the events leading up to the incident and the surrounding conditions, and the events or conditions that went wrong and contributed to the incidents.
The case studies presented have been modified to protect the privacy of the individuals involved.
Case studies for fire-related incidents are generously provided by the Office of the Fire Marshal.
Case Studies
1.0
1.1
1.2
1.3
8 2013 Ontario Electrical Safety Report

1 Five-year Rolling Average Electrical-Related Fatality Rate in Ontario, 2004-2013
Fata
litie
s P
er M
illio
n P
opul
atio
n
2000 – 2004
2001 – 2005
2002 – 2006
2003 – 2007
2004 – 2008
2005 – 2009
2006 – 2010
2007 – 2011
2008 – 2012
2009 – 2013
Rate 0.85 0.77 0.74 0.73 0.63 0.61 0.56 0.43 0.38 0.42
Conclusion: 33% decrease in the five-year rolling average electrocution and electrical burn fatalities rate over the last five years.
Source: ESA and Coroner’s records
2.0 Electrical-Related Fatalities and Injuries
2.0 Electrical-Related Fatalities and Injuries
2.1 Electrocutions and Electrical Burn FatalitiesElectrocution happens when someone is exposed to a lethal amount of electrical energy.
To figure out how contact with an electrical source happens, characteristics of that source before the electrocution (pre-event) must be evaluated.
For death to occur, the human body must become part of an active electrical circuit with a current that’s capable of over stimulating the nervous system or causing damage to internal organs. The extent of injuries depends on the current’s magnitude (measured in Amps), the path the current takes through the body, and how long it flows through the body (event). The resulting damage to the human body and the emergency medical treatment ultimately determine the outcome of the energy exchange (post-event). (National Institute for Occupational Safety and Health, 1991)
OUR GOALAvoid preventable injuries of an electrical nature to reduce disability, deaths, lost time from work, and health care utilization.
WHO’S AT RISK?All 13.7 million Ontarians.
Electrical-Related Fatalities and Injuries
2.0
2.1
2.2
2.3
2.4
2.5
0
0.1
0.2
0.3
0.4
0.5
0.6
0.7
0.8
0.9
1.0
2013 Ontario Electrical Safety Report 9
3Five-year Rolling Average Powerline Electrocution Rate in Ontario, 2004-2013
Elec
troc
utio
ns
per
Mill
ion
Pop
ulat
ion
2000 – 2004
2001 – 2005
2002 – 2006
2003 – 2007
2004 – 2008
2005 – 2009
2006 – 2010
2007 – 2011
2008 – 2012
2009 – 2013
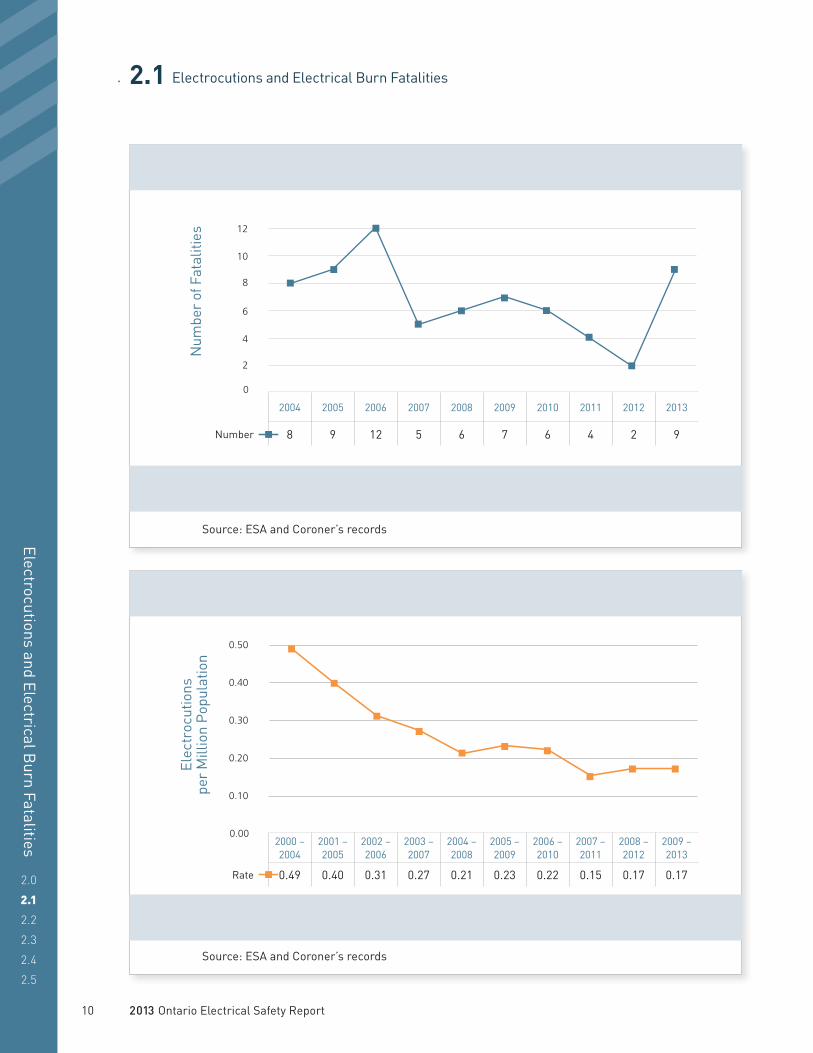
Rate 0.49 0.40 0.31 0.27 0.21 0.23 0.22 0.15 0.17 0.17
Conclusion: 19% decrease in the five-year rolling average rate; 2004-2008 to 2009-2013.
Source: ESA and Coroner’s records
2 Number of Electrical-Related Fatalities in Ontario, 2004-2013
Num
ber
of F
atal
ities
2004 2005 2006 2007 2008 2009 2010 2011 2012 2013
Number 8 9 12 5 6 7 6 4 2 9
Conclusion: 25% reduction in the number of electrical-related fatalities since 2006.
Source: ESA and Coroner’s records
Electrocutions and Electrical Burn Fatalities
2.0
2.1
2.2
2.3
2.4
2.5
2.1 Electrocutions and Electrical Burn Fatalities
0
2
4
6
8
10
12
0.00
0.10
0.20
0.30
0.40
0.50
10 2013 Ontario Electrical Safety Report

5 Five-year Rolling Average Occupational and Non Occupational Electrical-Related Fatality Rate in Ontario, 2004-2013
Fata
litie
s pe
r M
illio
n P
opul
atio
n
2000 – 2004
2001 – 2005
2002 – 2006
2003 – 2007
2004 – 2008
2005 – 2009
2006 – 2010
2007 – 2011
2008 – 2012
2009 – 2013
Non-Occupational 0.27 0.21 0.24 0.21 0.19 0.22 0.20 0.15 0.15 0.11
Occupational 1.10 1.04 0.91 0.96 0.81 0.71 0.65 0.50 0.41 0.36
Conclusion: 27% reduction in the five-year rolling average rate for occupational electrical-related fatalities; 2004-2008 to 2009-2013. 42% reduction in the in the five-year rolling average rate for non-occupational electrical-related fatalities; 2004-2008 to 2009-2013.
Source: ESA and Coroner’s records
4 Percentage of Electrocution and Electrical Burn Fatalities by Facility Type in Ontario, 2004-2008 and 2009-2013
Cam
p-gr
ound
Com
mer
-ci
al
Farm
Indu
stri
al
Inst
itutio
n
Min
ing
Pub
lic
plac
e
Res
iden
-tia
l
Util
ity
2004 – 2008 0% 15% 5.0% 22% 8.0% 0% 15% 30% 5.0%
2009 – 2013 0% 21% 7.1% 14% 3.8% 0% 18% 29% 7.1%
Conclusion: Increase in percentage for utility, farms, public places, and commercial facilities.
Source: ESA and Coroner’s records
Electrocutions and Electrical Burn Fatalities
2.0
2.1
2.2
2.3
2.4
2.5
2.1 Electrocutions and Electrical Burn Fatalities
0% 5% 10% 15% 20% 30%25%
Utility
Residential
Public Place
Mining
Institution
Industrial
Farm
Commercial
Campground
Fata
litie
s pe
r M
illio
n La
bour
For
ce
0.00
0.20
0.40
0.60
0.80
1.00
1.20
2013 Ontario Electrical Safety Report 11
2.1 Electrocutions and Electrical Burn Fatalities
Electrocutions and Electrical Burn Fatalities
2.0
2.1
2.2
2.3
2.4
2.5
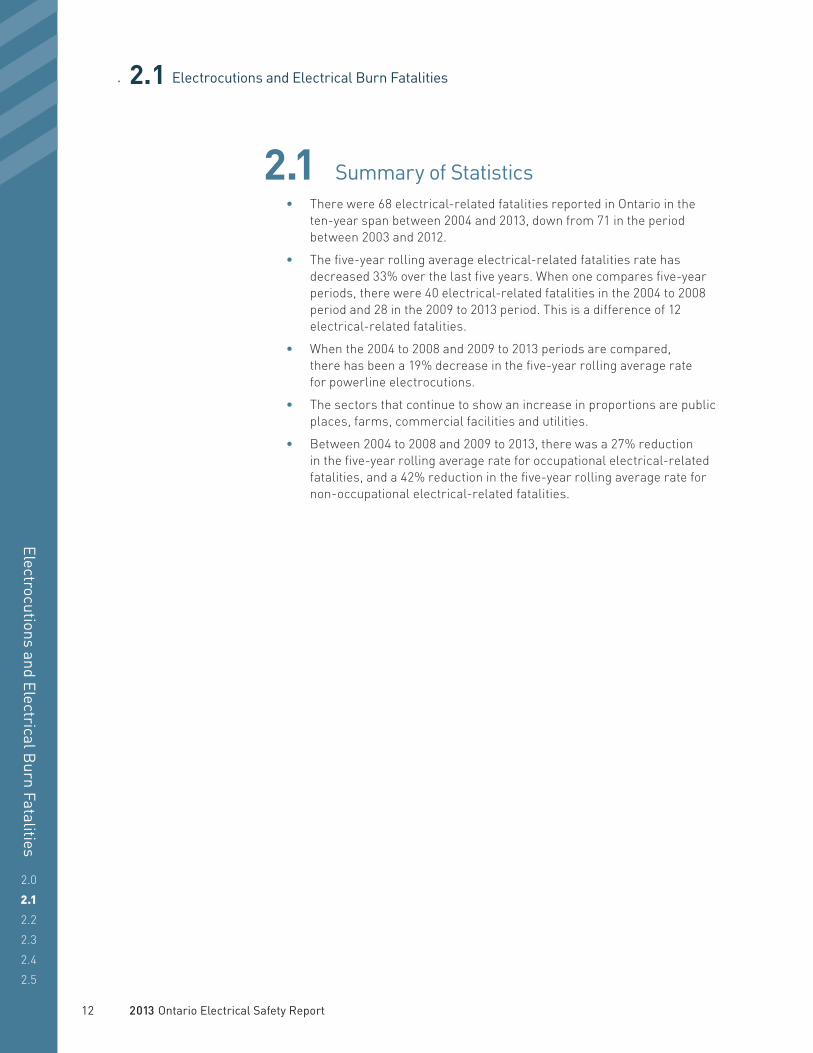
2.1 Summary of Statistics• There were 68 electrical-related fatalities reported in Ontario in the
ten-year span between 2004 and 2013, down from 71 in the period between 2003 and 2012.
• The five-year rolling average electrical-related fatalities rate has decreased 33% over the last five years. When one compares five-year periods, there were 40 electrical-related fatalities in the 2004 to 2008 period and 28 in the 2009 to 2013 period. This is a difference of 12 electrical-related fatalities.
• When the 2004 to 2008 and 2009 to 2013 periods are compared, there has been a 19% decrease in the five-year rolling average rate for powerline electrocutions.
• The sectors that continue to show an increase in proportions are public places, farms, commercial facilities and utilities.
• Between 2004 to 2008 and 2009 to 2013, there was a 27% reduction in the five-year rolling average rate for occupational electrical-related fatalities, and a 42% reduction in the five-year rolling average rate for non-occupational electrical-related fatalities.
12 2013 Ontario Electrical Safety Report

2.2 Occupational Electrical-Related Fatalities and Electrical Injuries
Occupational Electrical-R
elated Fatalities and Electrical Injuries
2.0
2.1
2.2
2.3
2.4
2.5
2.2 Occupational Electrical-Related Fatalities and Electrical Injuries Occupational electrical-related fatalities are a significant and ongoing problem and a particular hazard to those who routinely work near electrical sources. Studies have shown that the highest proportion of electrocution deaths is among electricians and apprentices, power linepersons and those working in construction and manufacturing industries. As well, electrical-related fatalities are more common among workers who are younger than the average age of occupational deaths overall. Contact with overhead powerlines is reportedly by far the most frequent cause of fatal occupational electrocution injury (Taylor, 2002).
For those who survive electrical injury, the immediate consequences are usually obvious and often require extensive medical intervention. However, the long-term after effects might be more subtle, pervasive, and less well-defined, and are particularly difficult to diagnose, as the link between the injury and the symptoms can often go unrecognized by patients and their physicians. (Wesner and Hickie, 2013, Theman et. al, 2008).
Research has also examined the challenges of returning to work after electrical injury. Three distinct categories of challenges have been identified: 1) physical, cognitive, and psychosocial impairments and their effects on their work performance; 2) feelings of guilt, blame, and responsibility for the injury; and 3) having to return to the workplace or worksite where the injury took place. were identified. The most beneficial supports identified by the injured workers included: 1) support from family, friends, and coworkers; and 2) the receipt of rehabilitation services that specialize in electrical injury. The most common advice to others after electrical injuries included: 1) avoiding electrical injury; 2) feeling ready to return to work; 3) filing a Workplace Safety and Insurance Board injury/claims report; 4) proactively being a self-advocate; and 5) garnering the assistance of individuals who understand electrical injuries to advocate on their behalf. (Stergiou-Kita et. al, 2014).
Section 2.5 provides a case study that is representative of the risk factors associated with electrical-related fatality or electrical injury for electricians.
OUR GOALAvoid preventable injuries of an electrical nature to reduce disability, deaths, lost time from work, and health care utilization.
WHO’S AT RISK?All 7.4 million members of Ontario’s labour force.
2013 Ontario Electrical Safety Report 13

2.2 Occupational Electrical-Related Fatalities and Electrical Injuries
Occupational Electrical-R
elated Fatalities and Electrical Injuries
2.0
2.1
2.2
2.3
2.4
2.5
2 Occupational Safety Five-Year Average in Ontario
Five
-yea
r Av
erag
e N
umbe
r of
Ele
ctri
cal-
Rel
ated
Fa
talit
ies
and
Se
riou
s In
jury
2000 – 2004
2001 – 2005
2002 – 2006
2003 – 2007
2004 – 2008
2005 – 2009
2006 – 2010
2007 – 2011
2008 – 2012
2009 – 2013
Occupational Safety Overall 35 32 28 28 25 22 21 17 14 13
Electrical Trade 2.4 4.6 5 6.6 6.6 6.6 6 5.6 5.8 5.8
Conclusion: 48% decrease in the five-year rolling average; 2004-2008 to 2009 2013.
Source: ESA and Coroner’s records
0
5
10
15
20
25
30
35
1 Number of Occupational Electrical-Related Fatalities in Ontario, 2004-2013
Num
ber
of F
atal
ities
2004 2005 2006 2007 2008 2009 2010 2011 2012 2013
Occupational 7 7 7 5 2 4 5 2 2 8
Conclusion: Highest number of occupational electrical-related fatalities since ten in 2001.
Source: ESA and Coroner’s records
14 2013 Ontario Electrical Safety Report

2.2 Occupational Electrical-Related Fatalities and Electrical Injuries
Occupational Electrical-R
elated Fatalities and Electrical Injuries
2.0
2.1
2.2
2.3
2.4
2.5
4 Percentage of Occupational Electrical-Related Fatalities by Facility Type in Ontario, 2004-2008 and 2009-2013
Cam
p-gr
ound
Com
-m
erci
al
Farm
Indu
s-tr
ial
Inst
itu-
tion
Min
ing
Pub
lic
plac
e
Res
i-
dent
ial
Util
ity
2009 – 2013 0% 24% 10% 19% 4.5% 0% 19% 19% 4.5%
2004 – 2008 0% 21% 7.4% 32% 11% 0% 11% 14% 3.6%
Conclusion: Increase in percentage for utility farm, residential, public place, and commercial facilities.
Source: ESA and Coroner’s records
0% 5% 10% 15% 20% 25% 30% 35%
Campground
Commercial
Farm
Industrial
Institution
Mining
Public place
Residential
Utility
3Five-year Rolling Average Occupational Electrical-Related Fatality Rate in Ontario, 2004-2013
Fata
litie
s pe
r M
illio
n W
orkf
orce
2000 – 2004
2001 – 2005
2002 – 2006
2003 – 2007
2004 – 2008
2005 – 2009
2006 – 2010
2007 – 2011
2008 – 2012
2009 – 2013
Occupational Electrocutions 1.10 1.04 0.91 0.96 0.81 0.71 0.65 0.50 0.41 0.36
Conclusion: The five-year rolling average occupational electrocution rate has decreased 67% over the last ten years.
Source: ESA and Coroner’s records
0.00
0.20
0.40
0.60
0.80
1.00
1.20
2013 Ontario Electrical Safety Report 15
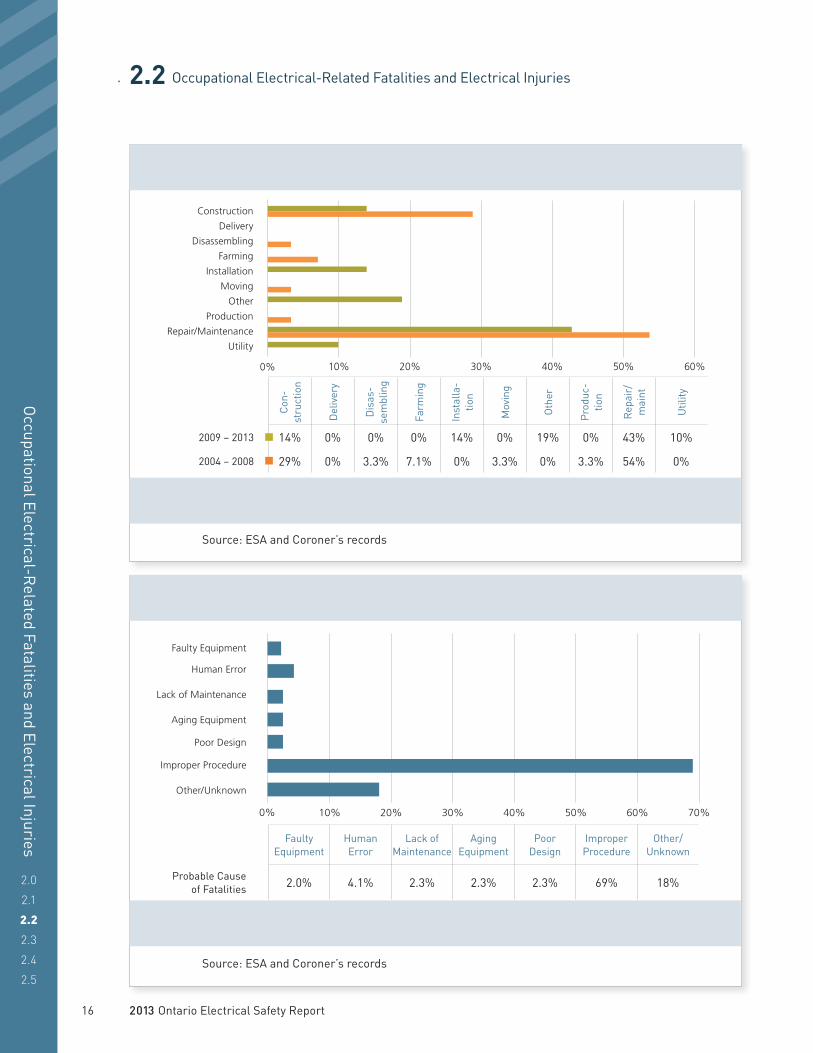
6Probable Cause of Occupational Electrical-Related Fatalities in Ontario, 2004-2013
Faulty Equipment
Human Error
Lack of Maintenance
Aging Equipment
Poor Design
Improper Procedure
Other/Unknown
Probable Cause of Fatalities 2.0% 4.1% 2.3% 2.3% 2.3% 69% 18%
Conclusion: Close to 70% are possibly due to improper procedures.
Source: ESA and Coroner’s records
5Percentage of Occupational Electrical-Related Fatalities by Type of Work in Ontario, 2004-2008 and 2009-2013
Con
-st
ruct
ion
Del
iver
y
Dis
as-
sem
blin
g
Farm
ing
Inst
alla
-tio
n
Mov
ing
Oth
er
Pro
duc-
tion
Rep
air/
m
aint
Util
ity
2009 – 2013 14% 0% 0% 0% 14% 0% 19% 0% 43% 10%
2004 – 2008 29% 0% 3.3% 7.1% 0% 3.3% 0% 3.3% 54% 0%
Conclusion: Increase in percentage for utility, other, installation, and delivery.
Source: ESA and Coroner’s records
2.2 Occupational Electrical-Related Fatalities and Electrical Injuries
Occupational Electrical-R
elated Fatalities and Electrical Injuries
2.0
2.1
2.2
2.3
2.4
2.5
Construction
Delivery
Disassembling
Farming
Installation
Moving
Other
Production
Repair/Maintenance
Utility
0% 10% 20% 30% 40% 50% 60%
Faulty Equipment
Human Error
Lack of Maintenance
Aging Equipment
Poor Design
Improper Procedure
Other/Unknown
0% 10% 20% 30% 40% 50% 60% 70%
16 2013 Ontario Electrical Safety Report
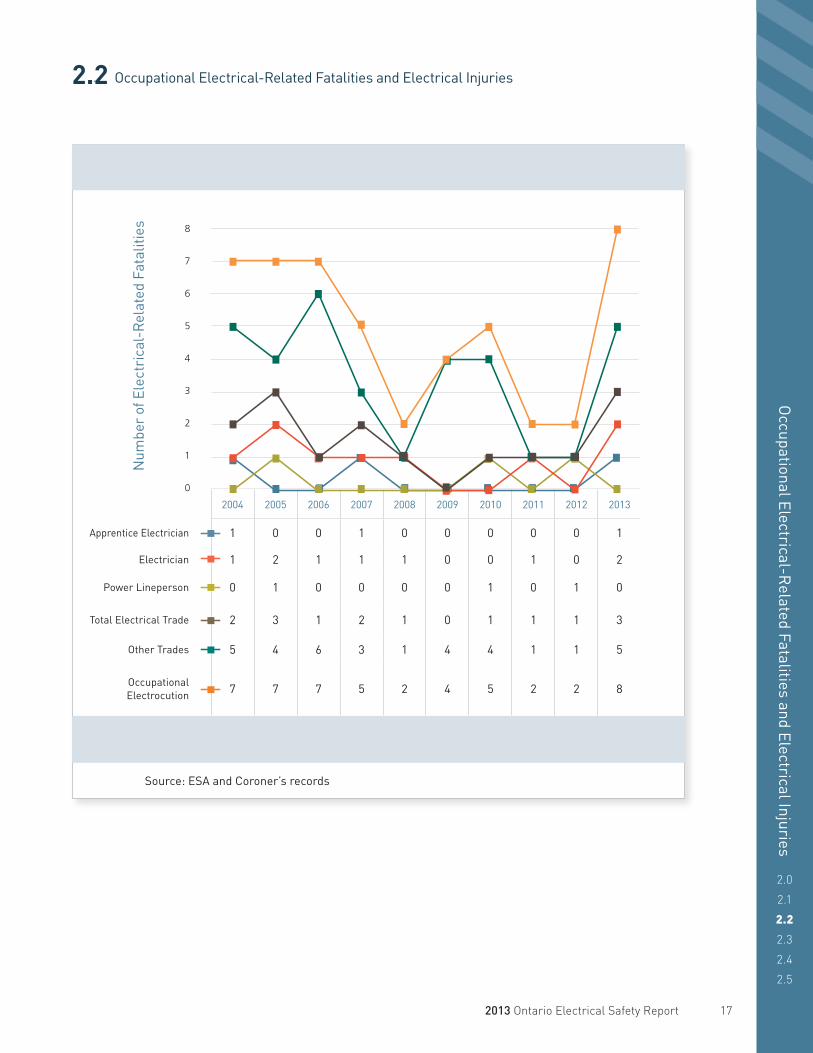
7Number of Occupational Electrical-Related Fatalities by Occupation in Ontario, 2004-2013
Num
ber
of E
lect
rica
l-R
elat
ed F
atal
ities
2004 2005 2006 2007 2008 2009 2010 2011 2012 2013
Apprentice Electrician 1 0 0 1 0 0 0 0 0 1
Electrician 1 2 1 1 1 0 0 1 0 2
Power Lineperson 0 1 0 0 0 0 1 0 1 0
Total Electrical Trade 2 3 1 2 1 0 1 1 1 3
Other Trades 5 4 6 3 1 4 4 1 1 5
Occupational Electrocution 7 7 7 5 2 4 5 2 2 8
Conclusion: In the last ten years, 31% of occupational electrical-related fatalities were by electrical trades people.
Source: ESA and Coroner’s records
2.2 Occupational Electrical-Related Fatalities and Electrical Injuries
Occupational Electrical-R
elated Fatalities and Electrical Injuries
2.0
2.1
2.2
2.3
2.4
2.5
0
1
2
3
4
5
6
7
8
2013 Ontario Electrical Safety Report 17
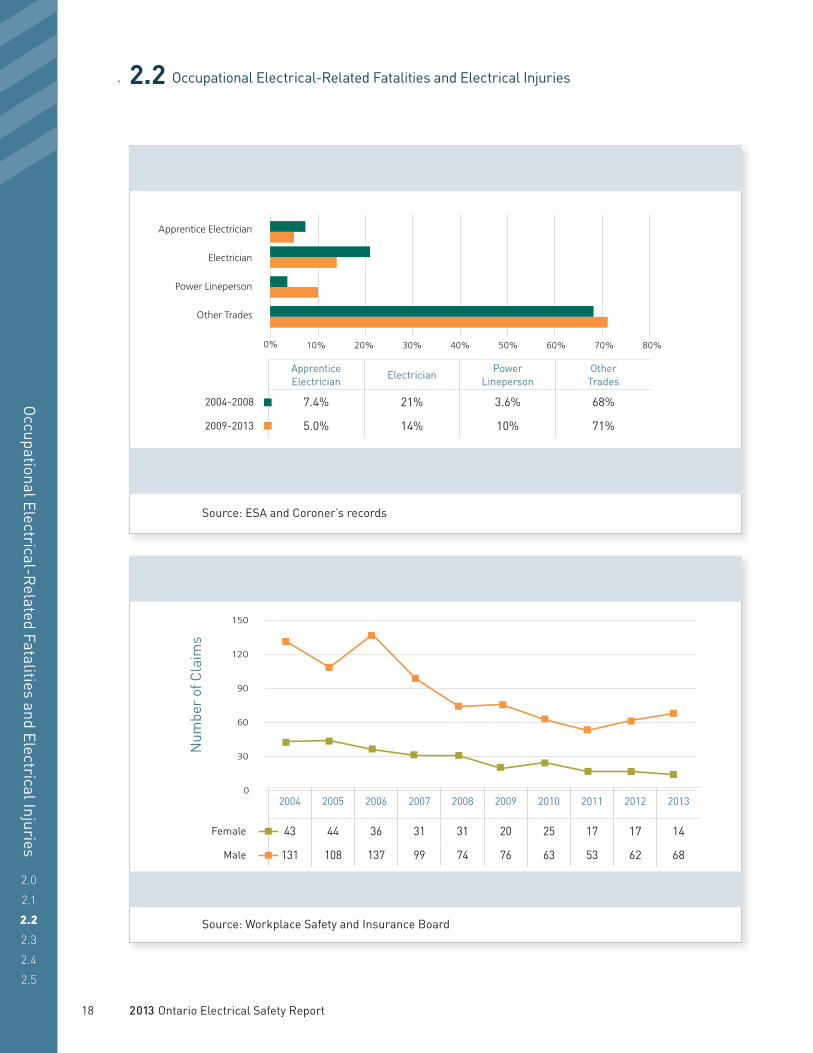
9 Number of Allowed WSIB Lost Time Electrical Injury Claims in Ontario by Sex, 2004-2013
Num
ber
of C
laim
s
2004 2005 2006 2007 2008 2009 2010 2011 2012 2013
Female 43 44 36 31 31 20 25 17 17 14
Male 131 108 137 99 74 76 63 53 62 68
Conclusion: 76% of claims are made by males.
Source: Workplace Safety and Insurance Board
8 Percentage of Occupational Electrical-Related Fatalities by Occupation in Ontario, 2004-2008 and 2009-2013
Apprentice Electrician
ElectricianPower
LinepersonOther Trades
2004-2008 7.4% 21% 3.6% 68%
2009-2013 5.0% 14% 10% 71%
Conclusion: No change in electrocution percentage for all electrical trades people.
Source: ESA and Coroner’s records
2.2 Occupational Electrical-Related Fatalities and Electrical Injuries
Occupational Electrical-R
elated Fatalities and Electrical Injuries
2.0
2.1
2.2
2.3
2.4
2.5
0% 10% 20% 30% 40% 50% 60% 70% 80%
Apprentice Electrician
Electrician
Power Lineperson
Other Trades
0
30
60
90
120
150
18 2013 Ontario Electrical Safety Report
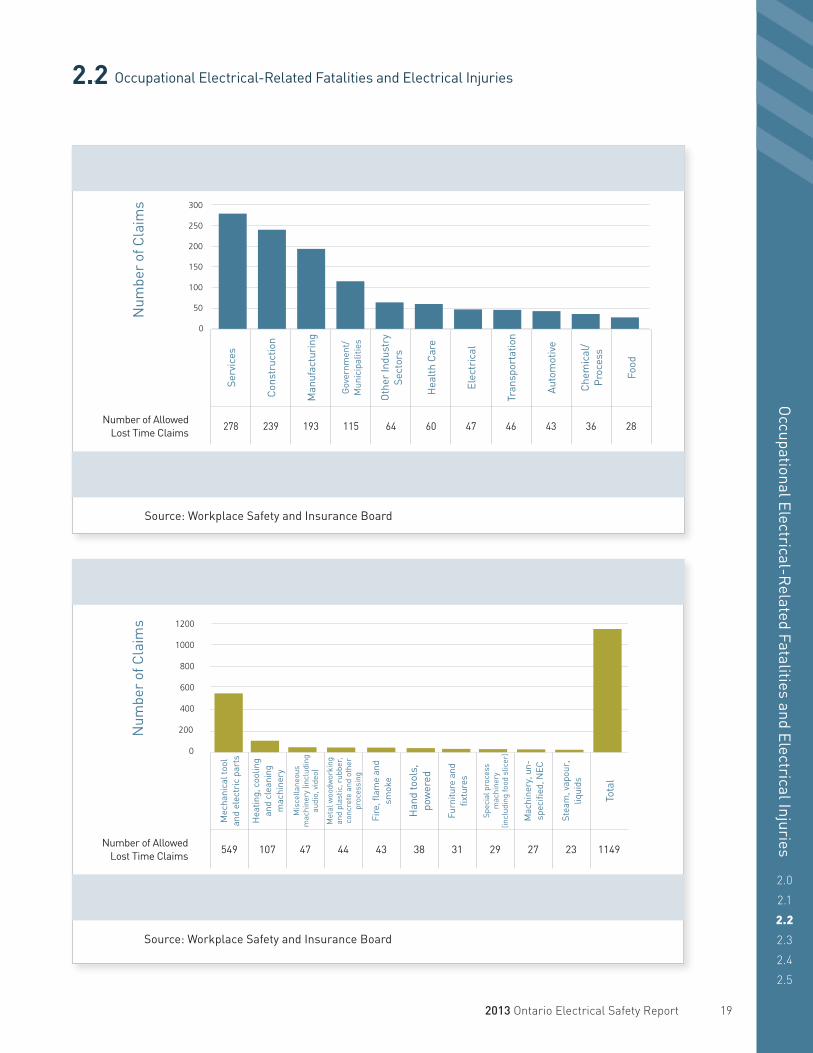
11 Number of Allowed WSIB Lost Time Electrical Injury Claims in Ontario by Top Ten Sources, 2004-2013
Num
ber
of C
laim
s
Mec
hani
cal t
ool
and
elec
tric
par
ts
Hea
ting,
coo
ling
and
clea
ning
m
achi
nery
Mis
cella
neou
s m
achi
nery
(inc
ludi
ng
audi
o, v
ideo
)
Met
al w
oodw
orki
ng
and
plas
tic, r
ubbe
r,
conc
rete
and
oth
er
proc
essi
ng
Fire
, flam
e an
d sm
oke
Han
d to
ols,
po
wer
ed
Furn
iture
and
fix
ture
s
Spec
ial p
roce
ss
mac
hine
ry
(incl
udin
g fo
od s
licer
)
Mac
hine
ry, u
n-sp
ecifi
ed, N
EC
Stea
m, v
apou
r,
liqui
ds
Tota
l
Number of Allowed Lost Time Claims
549 107 47 44 43 38 31 29 27 23 1149
Conclusion: 48% of claims are sourced to machine tool and electrical parts.
Source: Workplace Safety and Insurance Board
2.2 Occupational Electrical-Related Fatalities and Electrical Injuries
Occupational Electrical-R
elated Fatalities and Electrical Injuries
2.0
2.1
2.2
2.3
2.4
2.5
0
200
400
600
800
1000
1200
0
50
100
150
200
250
300
10 Number of Allowed WSIB Lost Time Electrical Injury Claims in Ontario by Sector, 2004-2013
Num
ber
of C
laim
s
Serv
ices
Con
stru
ctio
n
Man
ufac
turi
ng
Gov
ernm
ent/
Mun
icip
aliti
es
Oth
er In
dust
ry
Sect
ors
Hea
lth
Car
e
Elec
tric
al
Tran
spor
tatio
n
Auto
mot
ive
Che
mic
al/
Pro
cess
Food
Number of Allowed Lost Time Claims
278 239 193 115 64 60 47 46 43 36 28
Conclusion: 24%, 21%, and 17% of claims occur in the services, construction, and manufacturing sector, respectively.
Source: Workplace Safety and Insurance Board
0
50
100
150
200
250
300
2013 Ontario Electrical Safety Report 19
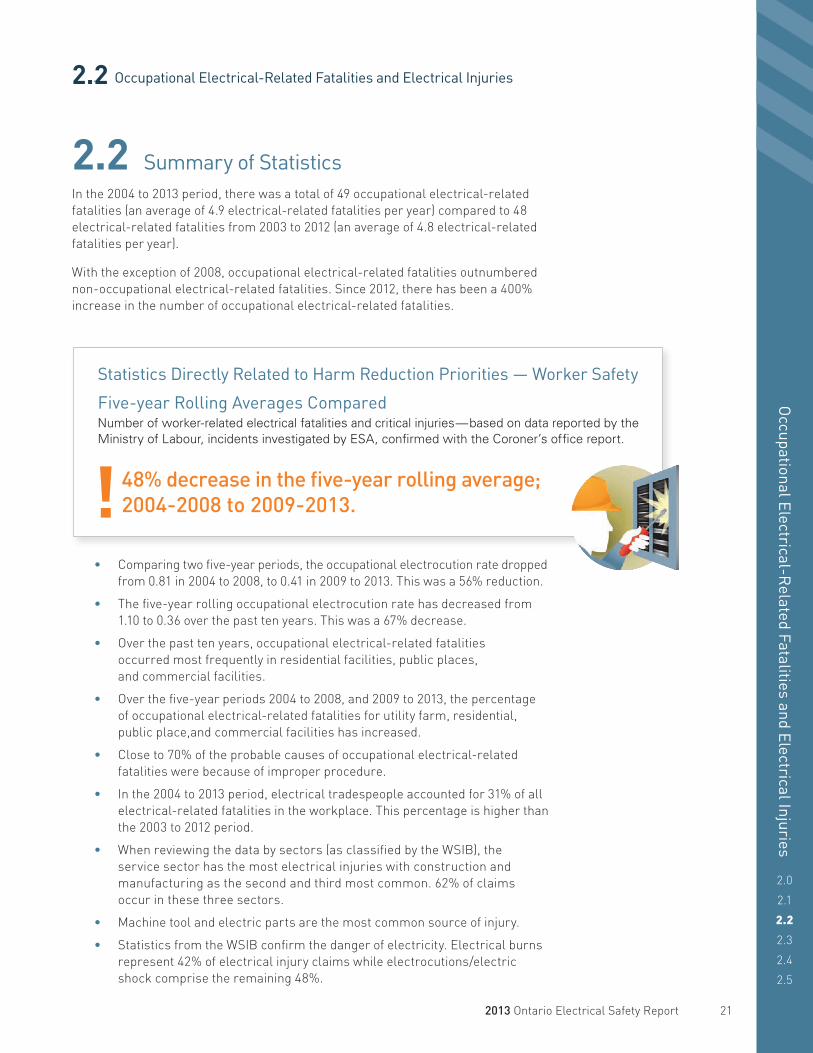
12 Number and Percent of Allowed WSIB Lost Time Electrical Injury Claims in Ontario by Nature of Injury, 2004-2013
Per
cent
Cla
ims
2004 – 2008 2009 – 2013 2004 – 2013
Burns (electrical) 313 165 478
Electrocutions, electric shocks
421 250 671
Conclusion: Claims for electric shock represented 58% of claims over the last ten years.
Source: Workplace Safety and Insurance Board
2.2 Occupational Electrical-Related Fatalities and Electrical Injuries
Occupational Electrical-R
elated Fatalities and Electrical Injuries
2.0
2.1
2.2
2.3
2.4
2.5
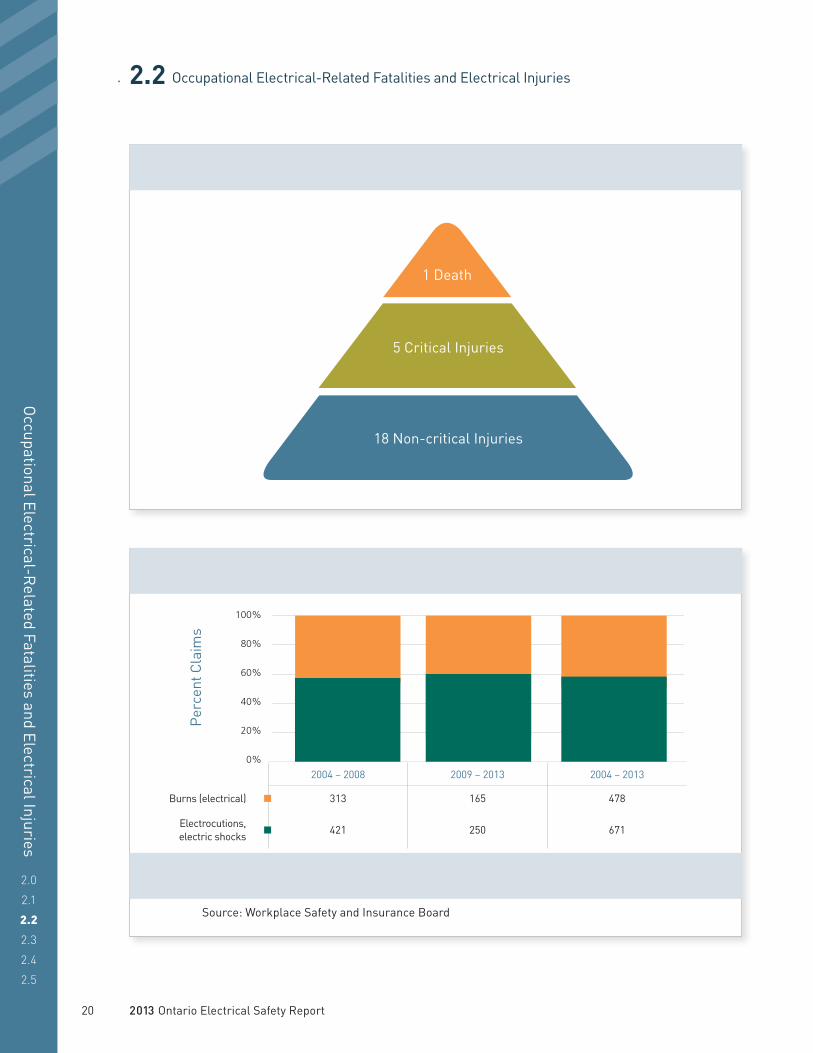
Bird Triangle of Electrical Injury, Critical Injury and Fatality 2004 to 2013
5 Critical Injuries
1 Death
18 Non-critical Injuries
0%
20%
40%
60%
80%
100%
20 2013 Ontario Electrical Safety Report
2.2 Occupational Electrical-Related Fatalities and Electrical Injuries
Occupational Electrical-R
elated Fatalities and Electrical Injuries
2.0
2.1
2.2
2.3
2.4
2.5
• Comparing two five-year periods, the occupational electrocution rate dropped from 0.81 in 2004 to 2008, to 0.41 in 2009 to 2013. This was a 56% reduction.
• The five-year rolling occupational electrocution rate has decreased from 1.10 to 0.36 over the past ten years. This was a 67% decrease.
• Over the past ten years, occupational electrical-related fatalities occurred most frequently in residential facilities, public places, and commercial facilities.
• Over the five-year periods 2004 to 2008, and 2009 to 2013, the percentage of occupational electrical-related fatalities for utility farm, residential, public place,and commercial facilities has increased.
• Close to 70% of the probable causes of occupational electrical-related fatalities were because of improper procedure.
• In the 2004 to 2013 period, electrical tradespeople accounted for 31% of all electrical-related fatalities in the workplace. This percentage is higher than the 2003 to 2012 period.
• When reviewing the data by sectors (as classified by the WSIB), the service sector has the most electrical injuries with construction and manufacturing as the second and third most common. 62% of claims occur in these three sectors.
• Machine tool and electric parts are the most common source of injury.
• Statistics from the WSIB confirm the danger of electricity. Electrical burns represent 42% of electrical injury claims while electrocutions/electric shock comprise the remaining 48%.
2.2 Summary of StatisticsIn the 2004 to 2013 period, there was a total of 49 occupational electrical-related fatalities (an average of 4.9 electrical-related fatalities per year) compared to 48 electrical-related fatalities from 2003 to 2012 (an average of 4.8 electrical-related fatalities per year).
With the exception of 2008, occupational electrical-related fatalities outnumbered non-occupational electrical-related fatalities. Since 2012, there has been a 400% increase in the number of occupational electrical-related fatalities.
Statistics Directly Related to Harm Reduction Priorities — Worker Safety
Five-year Rolling Averages ComparedNumber of worker-related electrical fatalities and critical injuries—based on data reported by the Ministry of Labour, incidents investigated by ESA, confirmed with the Coroner’s office report.
48% decrease in the five-year rolling average; 2004-2008 to 2009-2013.
2013 Ontario Electrical Safety Report 21
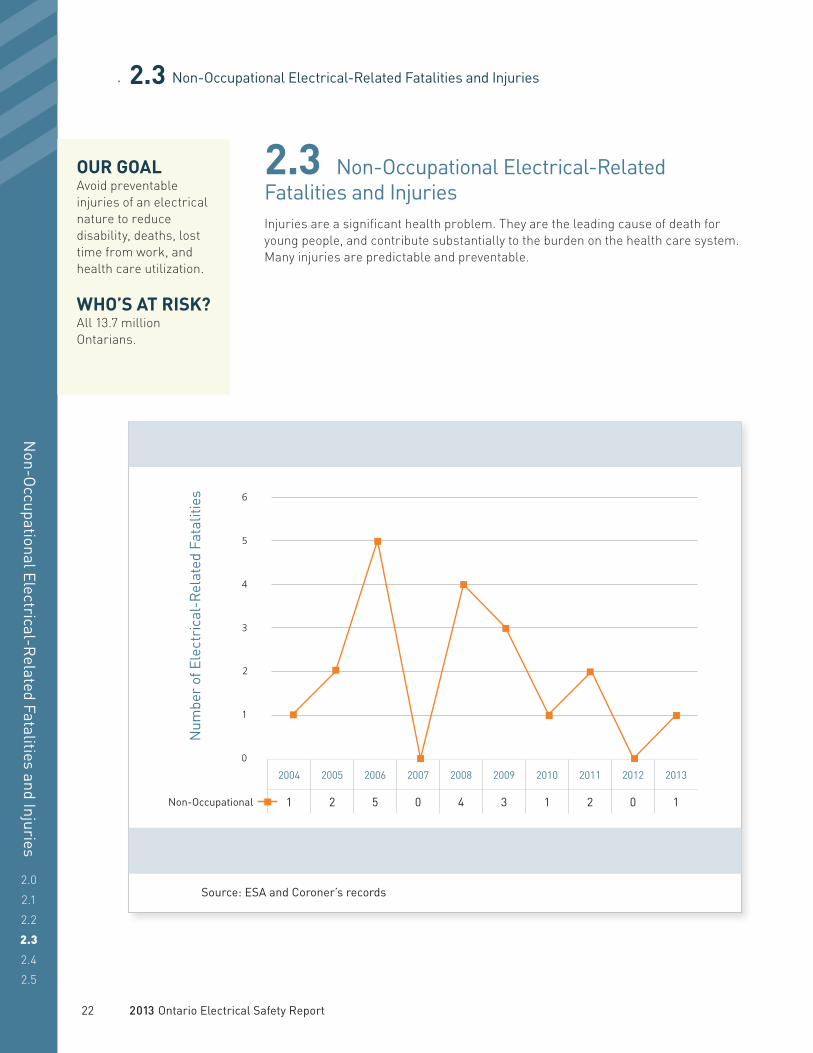
1Number of Non-Occupational Electrical-Related Fatalities in Ontario, 2004 to 2013
Num
ber
of E
lect
rica
l-R
elat
ed F
atal
ities
2004 2005 2006 2007 2008 2009 2010 2011 2012 2013
Non-Occupational 1 2 5 0 4 3 1 2 0 1
Conclusion: 80% reduction in non-occupational electrical-related fatalities since 2006
Source: ESA and Coroner’s records
2.3 Non-Occupational Electrical-Related Fatalities and Injuries
Non-O
ccupational Electrical-Related Fatalities and Injuries
2.0
2.1
2.2
2.3
2.4
2.5
OUR GOALAvoid preventable injuries of an electrical nature to reduce disability, deaths, lost time from work, and health care utilization.
WHO’S AT RISK?All 13.7 million Ontarians.
2.3 Non-Occupational Electrical-Related Fatalities and InjuriesInjuries are a significant health problem. They are the leading cause of death for young people, and contribute substantially to the burden on the health care system. Many injuries are predictable and preventable.
0
1
2
3
4
5
6
22 2013 Ontario Electrical Safety Report

3 Percentage of Non-Occupational Electrical-Related Fatalities by Facility Type in Ontario, 2004-2013
Per
cent
age
Campground Farm Public Place Residential Utility
Facility 0.0% 0.0% 22% 56% 22%
Conclusion: 56% of non-occupational electrical-related fatalities occur at residential-type facilities.
Source: ESA and Coroner’s records
2.3 Non-Occupational Electrical-Related Fatalities and Injuries
Non-O
ccupational Electrical-Related Fatalities and Injuries
2.0
2.1
2.2
2.3
2.4
2.5
2Five-year Rolling Average Non-Occupational Electrical-Related Fatality Rate in Ontario, 2004-2013
Elec
tric
al-R
elat
ed F
atal
ities
pe
r M
illio
n P
opul
atio
n
2000 – 2004
2001 – 2005
2002 – 2006
2003 – 2007
2004 – 2008
2005 – 2009
2006 – 2010
2007 – 2011
2008 – 2012
2009 – 2013
Non-Occupational 0.27 0.21 0.24 0.21 0.19 0.22 0.20 0.15 0.15 0.11
Conclusion: 59% reduction in non-occupational electrocution five-year rolling average rate over last ten years.
Source: ESA and Coroner’s records
0.00
0.05
0.10
0.15
0.20
0.25
0.30
0%
10%
20%
30%
40%
50%
60%
2013 Ontario Electrical Safety Report 23
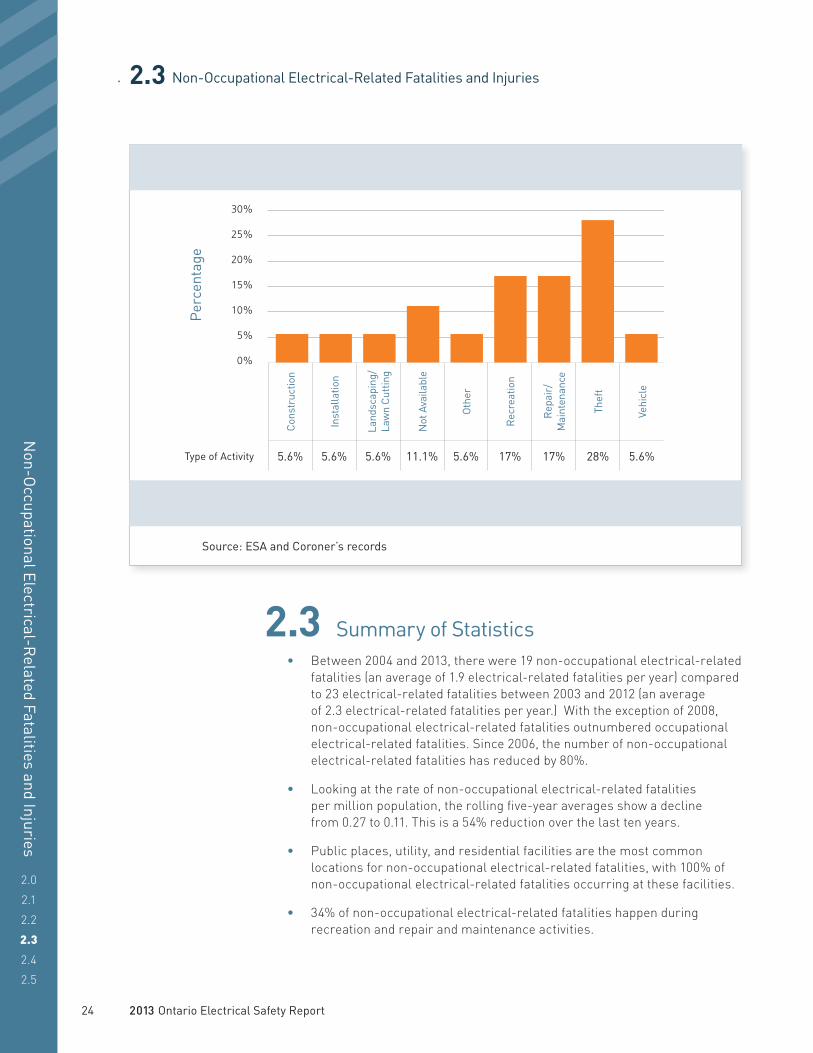
4Percentage of Non-Occupational Electrical-Related Fatalities by Type of Activity in Ontario, 2004-2013
Per
cent
age
Con
stru
ctio
n
Inst
alla
tion
Land
scap
ing/
La
wn
Cut
ting
Not
Ava
ilabl
e
Oth
er
Rec
reat
ion
Rep
air/
M
aint
enan
ce
Thef
t
Vehi
cle
Type of Activity 5.6% 5.6% 5.6% 11.1% 5.6% 17% 17% 28% 5.6%
Conclusion: 62% of non-occupational electrical-related fatalities occur during recreation, theft, or repair/maintenance activities.
Source: ESA and Coroner’s records
2.3 Non-Occupational Electrical-Related Fatalities and Injuries
Non-O
ccupational Electrical-Related Fatalities and Injuries
2.0
2.1
2.2
2.3
2.4
2.5
2.3 Summary of Statistics• Between 2004 and 2013, there were 19 non-occupational electrical-related
fatalities (an average of 1.9 electrical-related fatalities per year) compared to 23 electrical-related fatalities between 2003 and 2012 (an average of 2.3 electrical-related fatalities per year.) With the exception of 2008, non-occupational electrical-related fatalities outnumbered occupational electrical-related fatalities. Since 2006, the number of non-occupational electrical-related fatalities has reduced by 80%.
• Looking at the rate of non-occupational electrical-related fatalities per million population, the rolling five-year averages show a decline from 0.27 to 0.11. This is a 54% reduction over the last ten years.
• Public places, utility, and residential facilities are the most common locations for non-occupational electrical-related fatalities, with 100% of non-occupational electrical-related fatalities occurring at these facilities.
• 34% of non-occupational electrical-related fatalities happen during recreation and repair and maintenance activities.
0%
10%
5%
20%
15%
30%
25%
24 2013 Ontario Electrical Safety Report

Number of Emergency Department Visits for Electrical Injury by Sex in Ontario, 2003-2012
Num
ber
of V
isits
2003 2004 2005 2006 2007 2008 2009 2010 2011 2012
Female 498 597 619 580 538 597 532 582 314 364
Male 1196 1260 1546 1483 1254 1188 1142 1164 665 751
Total 1694 1857 2165 2063 1792 1785 1674 1746 979 1115
Conclusion: The number of emergency department visits for electrical injuries has increased compared to 2011.
Source: Ambulatory All Visit Main Table (NACRS, CIHI), Intellihealth, MOHLTC
1
0
500
1000
1500
2000
2500
2.4 Electrical Injury and Emergency Department Visits in Ontario
Electrical Injury and Emergency D
epartment Visits in O
ntario
2.0
2.1
2.2
2.3
2.4
2.5
2.4 Electrical Injury and Emergency Department Visits in Ontario, 2003-2012How electricity causes injury varies depending on the magnitude of the current, how it’s transmitted (direct or indirect), where it enters and leaves the body, the path the current takes through the body and the surrounding environmental conditions (e.g. wet or dry environment) (Duff & McCaffrey 2001).
Exposure to electricity can result in a range of injuries. For example, it can lead to cardiovascular system injuries (e.g. rhythm disturbances), cutaneous injuries and burns, nervous system disruption, and respiratory arrest, as well as head injuries, and fractures and dislocations (caused by being ‘thrown’ or ‘knocked down’ from the severe muscle contractions induced by the current) (Duff & McCaffrey 2001; Koumbourlis 2002).
OUR GOALAvoid preventable injuries of an electrical nature to reduce disability, deaths, lost time from work, and health care utilization.
WHO’S AT RISK?All 13.7 million Ontarians.
2013 Ontario Electrical Safety Report 25

3 Location of Burns Associated with Electrical Injury in Ontario, 2003–2012
Num
ber
of V
isits
Bur
n of
Hea
d an
d N
eck
Bur
n of
Tru
nk
Bur
n of
Sh
ould
er a
nd
Upp
er L
imb,
Ex
cept
Wri
st
and
Han
d
Bur
n of
Wri
st
and
Han
d
Bur
n of
Hip
an
d Lo
wer
Li
mb,
Exc
ept
Ankl
e an
d Fo
ot
Bur
n of
Ank
le
and
Foot
Bur
n of
Eye
an
d Ad
nexa
Bur
n of
Oth
er
Inte
rnal
O
rgan
s
Total 133 47 156 1410 40 37 60 122
Conclusion: Of the cases where the principal diagnosis was a burn, the majority (1,410 or 64%) were of the wrist and hand.
Source: Ambulatory All Visit Main Table (NACRS, CIHI), Intellihealth, MOHLTC
Electrical Injury and Emergency D
epartment Visits in O
ntario
2.0
2.1
2.2
2.3
2.4
2.5
2.4 Electrical Injury and Emergency Department Visits in Ontario
0
300
600
900
1500
1200
2 Number of Emergency Department Visits for Electrical Injury in Ontario by Age and Sex in Ontario, 2003–2012
00 – 04
05 – 09
10 – 14
15 – 19
20 – 24
25 – 29
30 – 34
35 – 39
40 – 44
45 – 49
50 – 54
55 – 59
60 – 64
65 – 69
70 – 74
75 – 79
80 – 84
85+
Female 343 207 231 537 856 708 630 426 388 337 242 134 73 27 38 17 17 13Male 435 220 276 749 592 1595 1463 1306 1333 1025 721 503 224 75 62 37 21 10Total 778 427 507 1286 1448 2303 2093 1732 1721 1362 963 637 297 102 100 54 38 23
Conclusion: 24% of all visits (3,751) were reported for people between the ages of 20 and 29. 19% of all visits (2,998) were reported for people under the age of 20.
Source: Ambulatory All Visit Main Table (NACRS, CIHI), Intellihealth, MOHLTC
0
500
1000
1500
2000
2500
Num
ber
of V
isits
26 2013 Ontario Electrical Safety Report

5Emergency Department Visits Ontario for Electrical Injury 2003-2012 by Canadian Triage and Acuity Scale (CTAS) levels
Num
ber
of V
isits
2003 2004 2005 2006 2007 2008 2009 2010 2011 2012Resuscitation/
Life Threatening 29 30 28 35 42 26 35 27 18 24Emergent/Potentially
Life-Threatening 422 556 688 676 562 617 596 641 393 368Urgent/
Potentially Serious 794 844 981 938 800 790 682 726 404 506Less-Urgent/ Semi-Urgent 375 368 430 370 340 327 338 321 149 197
Non-Urgent 74 59 38 44 48 25 23 19 10 17Total 1694 1857 2165 2063 1792 1785 1674 1734 974 1112
Conclusion: 79% of all visits (13,278) were classified on the Canadian Triage and Acuity Scale (CTAS) at levels 1-3 (Resuscitation, Emergent, or Urgent).
Source: Ambulatory All Visit Main Table (NACRS, CIHI), Intellihealth, MOHLTC
4Primary Diagnosis of Emergency Department Visits for Electrical Injury in Ontario, 2003–2012
Num
ber
of V
isits
Effects of Electric Current (T75.4)
Effects of lightning (T75.0)
Burns (T20-T31)
Other diagnoses
Total 12718 708 2171 1223
Conclusion: 76% of all cases had a principal diagnosis of effects of electric current, and an additional 13% of cases had a principal diagnosis of burns.
Source: Ambulatory All Visit Main Table (NACRS, CIHI), Intellihealth, MOHLTC
2.4 Electrical Injury and Emergency Department Visits in Ontario
Electrical Injury and Emergency D
epartment Visits in O
ntario
2.0
2.1
2.2
2.3
2.4
2.5
0
4000
2000
6000
8000
10000
12000
14000
0
500
1000
1500
2000
2500
2013 Ontario Electrical Safety Report 27

6 Place Where Electrical Injury Occurred in Ontario, 2003-2012N
umbe
r of
Ev
ents
Farm
Hom
e
Indu
stri
al a
nd
Con
stru
ctio
n Ar
ea
Res
iden
tial
Inst
itutio
n
Scho
ol, O
ther
In
stitu
tion
and
P
ublic
Are
a
Spor
ts a
nd
Athl
etic
s Ar
ea
Stre
et a
nd
Hig
hway
Trad
e an
d
Serv
ice
area
Oth
er
Spec
ified
Pla
ce
of O
ccur
renc
e
Uns
peci
fied
Pla
ce
of O
ccur
renc
e
Total 69 1878 1485 40 357 43 63 1230 835 4008
Conclusion: Electrical injuries were found to occur at the home (1,878 or 19%), at industrial and construction areas (1,485 or 15%), and trade and service areas (1,230 or 12%).
Source: Ambulatory All Visit Main Table (NACRS, CIHI), Intellihealth, MOHLTC
Electrical Injury and Emergency D
epartment Visits in O
ntario
2.0
2.1
2.2
2.3
2.4
2.5
2.4 Electrical Injury and Emergency Department Visits in Ontario
2.4 Summary of Statistics• From 2003 to 2012, approximately 16,850 visits to Ontario hospitals’
Emergency Departments were because of an electrical injury. The number slightly increased between 2008 and 2012.
• Men visited Emergency Departments more than twice as often as women (11,649 or 72% vs. 5,221 or 28%).
• 24% of all visits (3,751) were by people between the ages of 20 and 29. And, 19% of all visits (2,998) were by people under 20 years old. This pattern is observed for both males and females.
• 79% of all Emergency Departments visits (13,278) were classified as Canadian Triage and Acuity Scale (CTAS) levels 1-3 (Resuscitation, Emergent, and Urgent).
• In 72% of all cases, the principal diagnosis was the effects of electric current and in 4% of cases the principal diagnosis was effects of lightning. Burns were the principal diagnosis in an additional 13% of cases.
• In cases where a place of occurrence code was provided, the most common was in the home (19%), followed by industrial and construction locations (15%), and trade and service areas (12%).
0
1000
2000
3000
4000
5000
28 2013 Ontario Electrical Safety Report
Case Study
2.0
2.1
2.2
2.3
2.4
2.5
2.5 Case Study
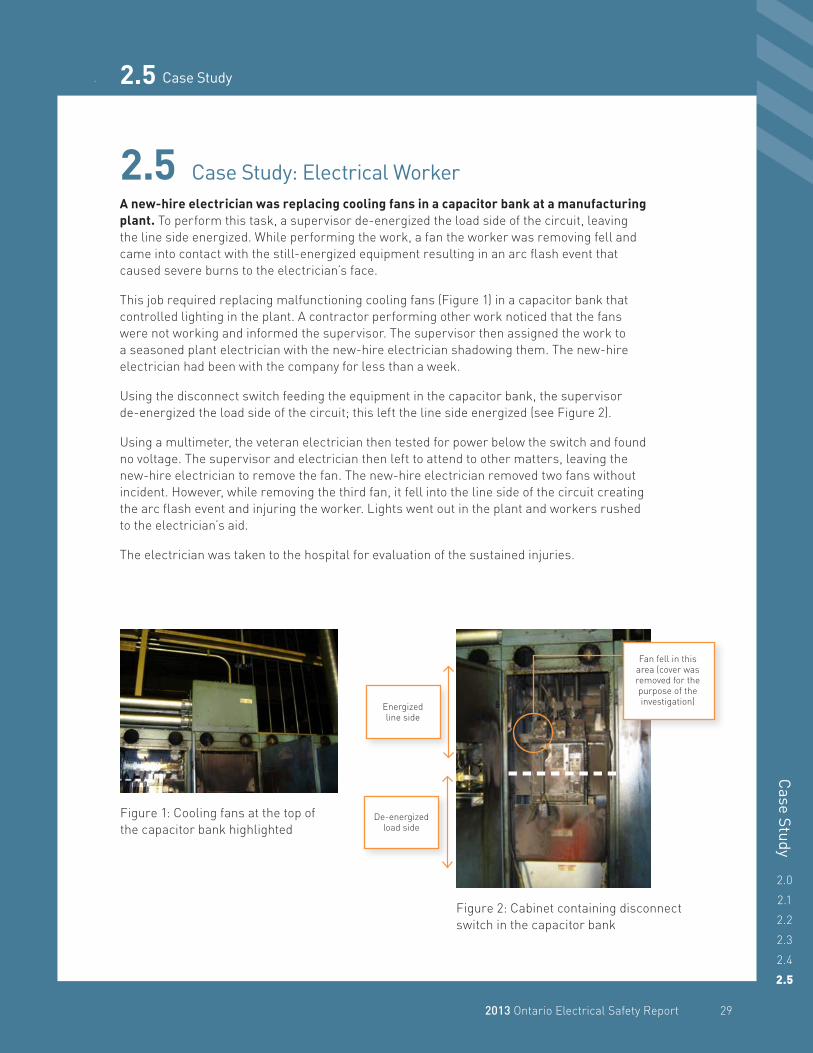
2.5 Case Study: Electrical WorkerA new-hire electrician was replacing cooling fans in a capacitor bank at a manufacturing plant. To perform this task, a supervisor de-energized the load side of the circuit, leaving the line side energized. While performing the work, a fan the worker was removing fell and came into contact with the still-energized equipment resulting in an arc flash event that caused severe burns to the electrician’s face.
This job required replacing malfunctioning cooling fans (Figure 1) in a capacitor bank that controlled lighting in the plant. A contractor performing other work noticed that the fans were not working and informed the supervisor. The supervisor then assigned the work to a seasoned plant electrician with the new-hire electrician shadowing them. The new-hire electrician had been with the company for less than a week.
Using the disconnect switch feeding the equipment in the capacitor bank, the supervisor de-energized the load side of the circuit; this left the line side energized (see Figure 2).
Using a multimeter, the veteran electrician then tested for power below the switch and found no voltage. The supervisor and electrician then left to attend to other matters, leaving the new-hire electrician to remove the fan. The new-hire electrician removed two fans without incident. However, while removing the third fan, it fell into the line side of the circuit creating the arc flash event and injuring the worker. Lights went out in the plant and workers rushed to the electrician’s aid.
The electrician was taken to the hospital for evaluation of the sustained injuries.
Figure 1: Cooling fans at the top of the capacitor bank highlighted
Figure 2: Cabinet containing disconnect switch in the capacitor bank
Energizedline side
Fan fell in this area (cover was removed for the purpose of the investigation)
De-energizedload side
2013 Ontario Electrical Safety Report 29

2.5 Case Study
Case Study
2.0
2.1
2.2
2.3
2.4
2.5
2.5 Case Study: Electrical Worker (continued)Further investigation revealed the following:
• Miscommunication between the supervisor and workers — Investigation interviews revealed communication problems between the supervisor and the crew, Despite the potential of misunderstanding and miscommunication, this concern did not result in any additional action by the supervisor to ensure that the crew fully understood the work prior to starting. Through their statements, it was evident that the two electricians had some difficulty understanding some of the interview questions as well as questions involving electrical terminology. This included naming equipment in the capacitor bank and the purpose of individual components within the capacitor bank.
• The new-hire electrician was unauthorized to perform electrical work — The new-hire began performing work on locked out electrical equipment on the third day of work. According to the supervisor, the new-hire’s task was restricted to shadowing the veteran electrician. According to the two electricians, the new-hire was allowed to perform work on equipment locked out by his colleague. This is in contradiction to the company policy as the new-hire had not received the necessary lockout/tag out (LOTO) training, arc-rated clothes or personalized locks and tags that would allow him to work on electrical equipment.
• Hazard assessment failed to identify possible hazard caused by material falling into energized parts — The hazard assessment performed for this job included testing the load side of the disconnect switch. Although there was a cover limiting access to the energized line side equipment from the front of the equipment, there was no cover preventing tools or material from falling into the energized part from above.
• LOTO policy was not followed — The line side of the capacitor bank disconnect switch remained energized after the switch was locked out. Plant LOTO policy ‘Lockout Processes’ referenced company corporate policy ‘Hazardous Energy Control Program,’ which indicated that work was never to be performed on energized equipment. As a result, work occurred in contradiction to the company policy. According to the LOTO policy, every worker performing work on locked out equipment must have his/her personalized lock on the equipment. Since the new-hire had no lock yet, he was in violation of the LOTO policy by performing work on this electrical equipment.
Victim suffered severe burns
Hazard assessment failed to identify
possible hazard of material falling into
energized parts
LOTO policy was not followed
Victim was unauthorized
to perform electrical work
Miscommunication between the Supervisor
and workers
30 2013 Ontario Electrical Safety Report

3.0 Utility-Related Equipment
Utility-R
elated Equipment
3.0
3.1
3.0 Utility-Related Equipment2
High voltage and distribution lines carry a lot of energy or power and, if not treated with respect, can be fatal. Electrical substations and transformers are fenced and covered to keep the public away from potential electrical shock hazards.
OUR GOALAvoid preventable injuries of an electrical nature to reduce disability, deaths, lost time from work, and health care utilization.
WHO’S AT RISK?All 13.7 million Ontarians.
1 Number of Utility-Related Equipment Electrocutions in Ontario, 2004-2013
Num
ber
of E
lect
rocu
tions
2004 2005 2006 2007 2008 2009 2010 2011 2012 2013
Total Electrical-Relat-ed Fatalities in Ontario 8 9 12 5 6 7 6 4 2 9
All Utility Equipment-Related Electrocutions 2 4 5 2 3 5 4 2 2 4
Powerline Electrocutions 2 3 5 1 2 4 2 1 2 2
Conclusion: Over the past ten years, utility-related equipment accounted for 49% of all electrical-related fatalities.
Source: ESA and Coroner’s records
0
2
4
6
8
10
12
2 Utility-related equipment means electrical equipment and devices used by Local Utility Company (or privately owned company) to distribute electricity to facilities or buildings. Examples of such equipment are; overhead or underground powerline (including equipment on utility poles), substation, electrical vaults, high voltage switchgear or transformer.
2013 Ontario Electrical Safety Report 31
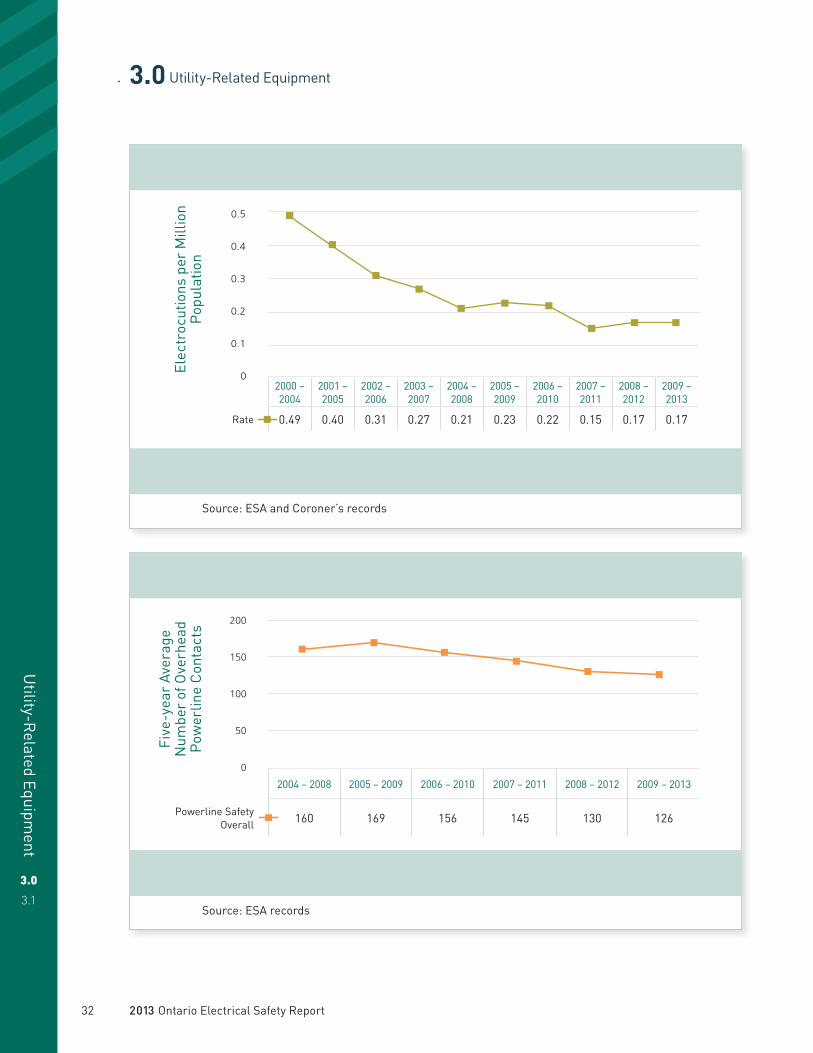
3 Powerline Safety Five-Year Average
Five
-yea
r Av
erag
e N
umbe
r of
Ove
rhea
d P
ower
line
Con
tact
s
2004 – 2008 2005 – 2009 2006 – 2010 2007 – 2011 2008 – 2012 2009 – 2013
Powerline Safety Overall 160 169 156 145 130 126
Conclusion: Powerline Safety Five-Year Average has decreased 21% between 2004 to 2008 and 2009 to 2013.
Source: ESA records
2 Five-year Rolling Average Powerline Electrocution Rate in Ontario, 2004-2013
Elec
troc
utio
ns p
er M
illio
n P
opul
atio
n
2000 – 2004
2001 – 2005
2002 – 2006
2003 – 2007
2004 – 2008
2005 – 2009
2006 – 2010
2007 – 2011
2008 – 2012
2009 – 2013
Rate 0.49 0.40 0.31 0.27 0.21 0.23 0.22 0.15 0.17 0.17
Conclusion: Over the past ten years, the five-year rolling average for powerline electrocution rate has decreased by 65%.
Source: ESA and Coroner’s records
0
0.1
0.2
0.3
0.4
0.5
Utility-R
elated Equipment
3.0
3.1
3.0 Utility-Related Equipment
0
50
100
150
200
32 2013 Ontario Electrical Safety Report
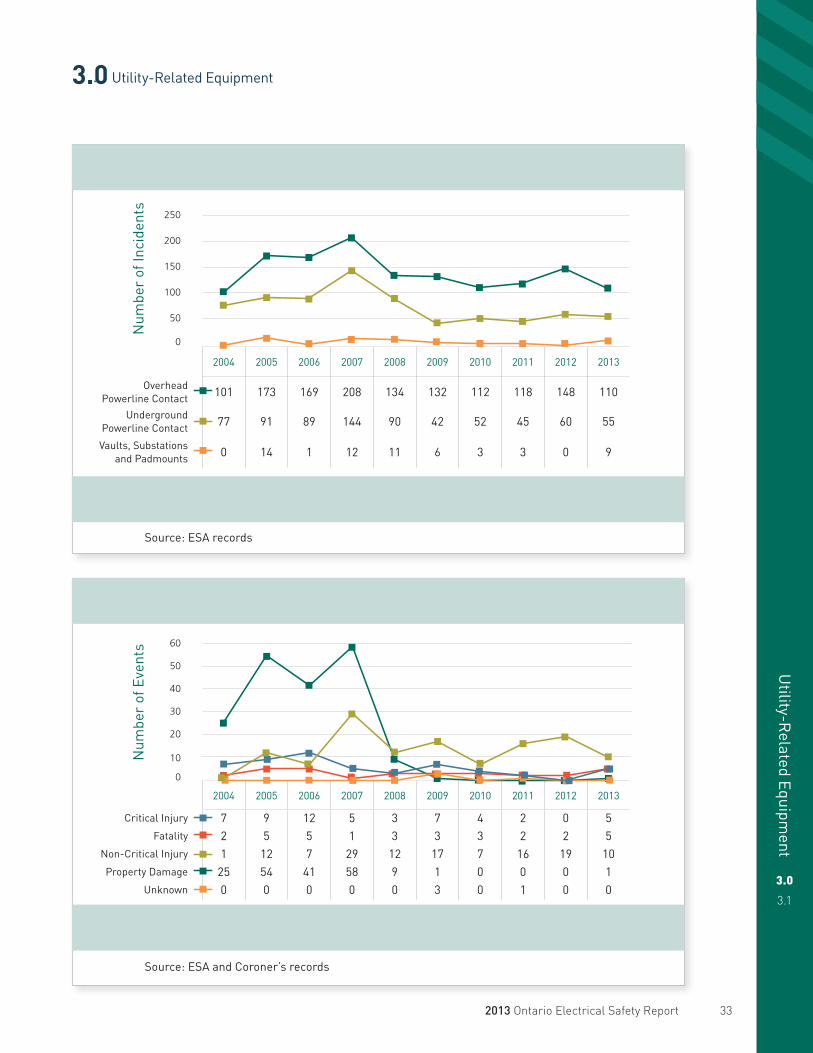
Number of Electrical Incidents by Event in Ontario, 2004-2013
Num
ber
of In
cide
nts
2004 2005 2006 2007 2008 2009 2010 2011 2012 2013
Overhead Powerline Contact 101 173 169 208 134 132 112 118 148 110
Underground Powerline Contact 77 91 89 144 90 42 52 45 60 55
Vaults, Substations and Padmounts 0 14 1 12 11 6 3 3 0 9
Conclusion: From the highest levels in 2007, overhead powerline contacts are down 47% and underground powerline contacts are down 62%.
Source: ESA records
4
Number of Utility-Related Electrical Incidents by Outcome in Ontario, 2004-2013
Num
ber
of E
vent
s
2004 2005 2006 2007 2008 2009 2010 2011 2012 2013
Critical Injury 7 9 12 5 3 7 4 2 0 5Fatality 2 5 5 1 3 3 3 2 2 5
Non-Critical Injury 1 12 7 29 12 17 7 16 19 10Property Damage 25 54 41 58 9 1 0 0 0 1
Unknown 0 0 0 0 0 3 0 1 0 0
Conclusion: Most types of injuries have decreased over the last ten years.
Source: ESA and Coroner’s records
5
Utility-R
elated Equipment
3.0
3.1
3.0 Utility-Related Equipment
0
50
100
150
200
250
0
10
20
30
40
50
60
2013 Ontario Electrical Safety Report 33

Utility-R
elated Equipment
3.0
3.1
3.0 Utility-Related Equipment: Summary
3.0 Summary of Statistics• From 2004 to 2013, there were 33 electrical-related fatalities associated
with utility-related equipment, which is 49% of the total electrical fatalities in Ontario in that period. This number has decreased by two deaths when compared to the previous ten-year period (2003 to 2012).
• Contact specifically with powerlines accounted for 24 of the electrical-related fatalities in the latest ten-year period which is the majority (72%) of utility-related equipment deaths.
• Over the past ten years, the five-year rolling average for powerline electrocution rate has decreased by 65%.
Statistics Directly Related to Harm Strategy Priority—Powerline Contact
Five-year Rolling Averages ComparedThe statistics below represent the number of worker and non-worker powerline related contact
incidents: Worker data reported by the MOL; Non-worker incidents based on data reported to ESA.
The Powerline Safety Five-Year Average has decreased by 21% between 2004 to 2008 and 2009 to 2013.
• Although still the number one and number two sources of electrical incidents by events, overhead powerline contacts have decreased by 47%, and underground powerline contacts have decreased by 62% since the highest numbers in 2007.
• Most types of injuries as a result of powerline and utility-related equipment have decreased over the last ten years.
34 2013 Ontario Electrical Safety Report

Case Study
3.0
3.1
3.1 Case Study
3.1 Case Study: Powerline Contact
A landscaper was electrocuted after a metal pole used to string holiday lights contacted an overhead powerline
This incident involved the installation of holiday lights with a metal pole.
The landscaper was part of a two-person partnership hired to string decorative lights for residential properties during the holiday season. The workers had limited experienced with stringing lights on trees.
The incident involved hanging strings of lights on a nine-metre evergreen tree, which was located on the corner of the property of a detached home. When the crew assessed the job, they were concerned about making contact with a 120V insulated service conductor which passed along the north side of the tree. They also did not have a pole long enough to reach the top of the tree. As a result, the crew strung the lights in a vertical up and down sequence around the lower part of the tree below the service conductor to avoid making contact with the conductor.
The homeowner, however, was not satisfied with the way the tree was decorated—namely how the lights were laid out. In addition, there were blown bulbs on the tree. The homeowner requested the work be redone.
The crew returned to the site a few days later to redo the job. They brought a longer metal pole with an attachment that would allow for a higher reach. The crew started the work around 4 p.m. Landscaper #1 proceeded working on the east side of the tree using a ladder while Landscaper #2, the decedent, used the metal pole on the west side.
At some point during the job, Landscaper #1 heard the pole falling. When he checked on Landscaper #2, he found Landscaper #2 on his back with the pole lying on top of him. He was still conscious and told Landscaper #1 to get the pole off of him. Landscaper #1 did so and found Landscaper #2 to no longer be breathing. 911 was called while CPR was performed by Landscaper #1 and the homeowner. Unfortunately, Landscaper #2 succumbed to his injury. It was found later that the metallic hook on top of the metal pole had come into contact with the energized overhead powerline. Landscaper #2 provided the current path to ground, which resulted in his electrocution.
The investigation found that:
• The workers had experience stringing lights on houses, but limited experience on trees; no procedure was in place to perform this type of work; and they had no training on electrical safety.
• The powerline was estimated to be 8.8 metres above grade and 3.4 metres away from the tree.
2013 Ontario Electrical Safety Report 35

Case Study
3.0
3.1
3.1 Case Study
3.1 Case Study: Powerline Contact (continued)
Causal Factors
• Causal Factor 1 – Limited electrical safety awareness There was a general lack of awareness of hazards and no proper hazard assessment was conducted prior to starting the job. Neither worker had electrical safety or powerline awareness training.
• Causal Factor 2 – Inexperience led workers to redo the work The crew had limited experience when it came to decorating a tree with lighting. Their inexperience led to an unsatisfied customer who wanted the work redone.
• Causal Factor 3 – No hazard assessment was conducted on the second visit Using a longer metal pole introduced a new hazard—namely the crew could now reach the powerline with the pole extended. The crew did not properly assess the hazard prior to starting to restring the lights. In addition, visibility against the sky at dusk in the fall may have played a factor.
• Causal Factor 4 – Conductive tool was used within proximity of the powerline The distance between the centre of the tree and the powerline was approximately 3.4 metres. When working with the conductive pole on the south side, the tool was within close proximity of the energized powerline and exposed the casualty to the hazard.
Contact point between overhead powerline
and the pole
Landscaper #1
Decedent
Landscaper #2 was
electrocuted
No hazard assessment was
performed on the second visit
Conductive tool was used within proximity of the
powerline
Inexperience led workers to redo the work
Limited electrical safety awareness
String pattern on first job
Tree
Plan View of the incident scene
36 2013 Ontario Electrical Safety Report
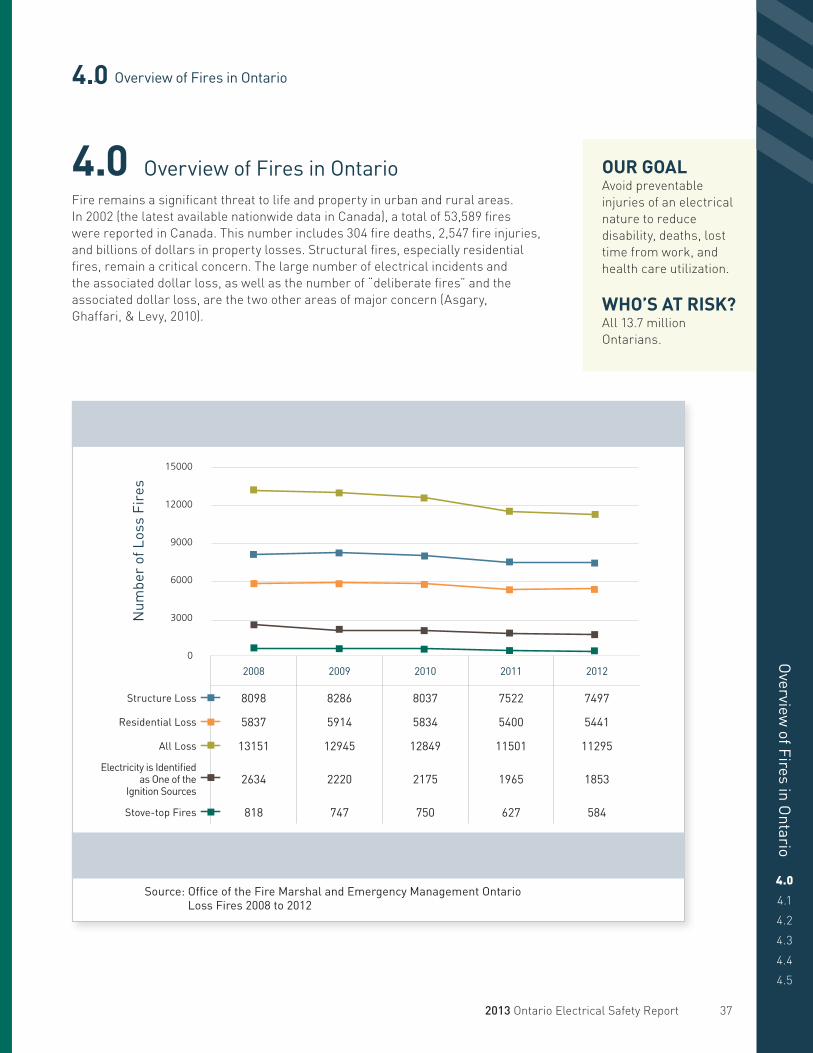
1 Loss Fires in Ontario, 2008-2012
Num
ber
of L
oss
Fire
s
2008 2009 2010 2011 2012
Structure Loss 8098 8286 8037 7522 7497
Residential Loss 5837 5914 5834 5400 5441
All Loss 13151 12945 12849 11501 11295
Electricity is Identified as One of the
Ignition Sources2634 2220 2175 1965 1853
Stove-top Fires 818 747 750 627 584
Conclusion: 14% decrease in all loss fires. 7% decrease in structural-loss fires. 7% decrease in residential loss fires.
Source: Office of the Fire Marshal and Emergency Management Ontario Loss Fires 2008 to 2012
0
3000
6000
9000
12000
15000
4.0 Overview of Fires in Ontario
Overview
of Fires in Ontario
4.0 Overview of Fires in OntarioFire remains a significant threat to life and property in urban and rural areas. In 2002 (the latest available nationwide data in Canada), a total of 53,589 fires were reported in Canada. This number includes 304 fire deaths, 2,547 fire injuries, and billions of dollars in property losses. Structural fires, especially residential fires, remain a critical concern. The large number of electrical incidents and the associated dollar loss, as well as the number of “deliberate fires” and the associated dollar loss, are the two other areas of major concern (Asgary, Ghaffari, & Levy, 2010).
OUR GOALAvoid preventable injuries of an electrical nature to reduce disability, deaths, lost time from work, and health care utilization.
WHO’S AT RISK?All 13.7 million Ontarians.
4.0
4.1
4.2
4.3
4.4
4.5
2013 Ontario Electrical Safety Report 37
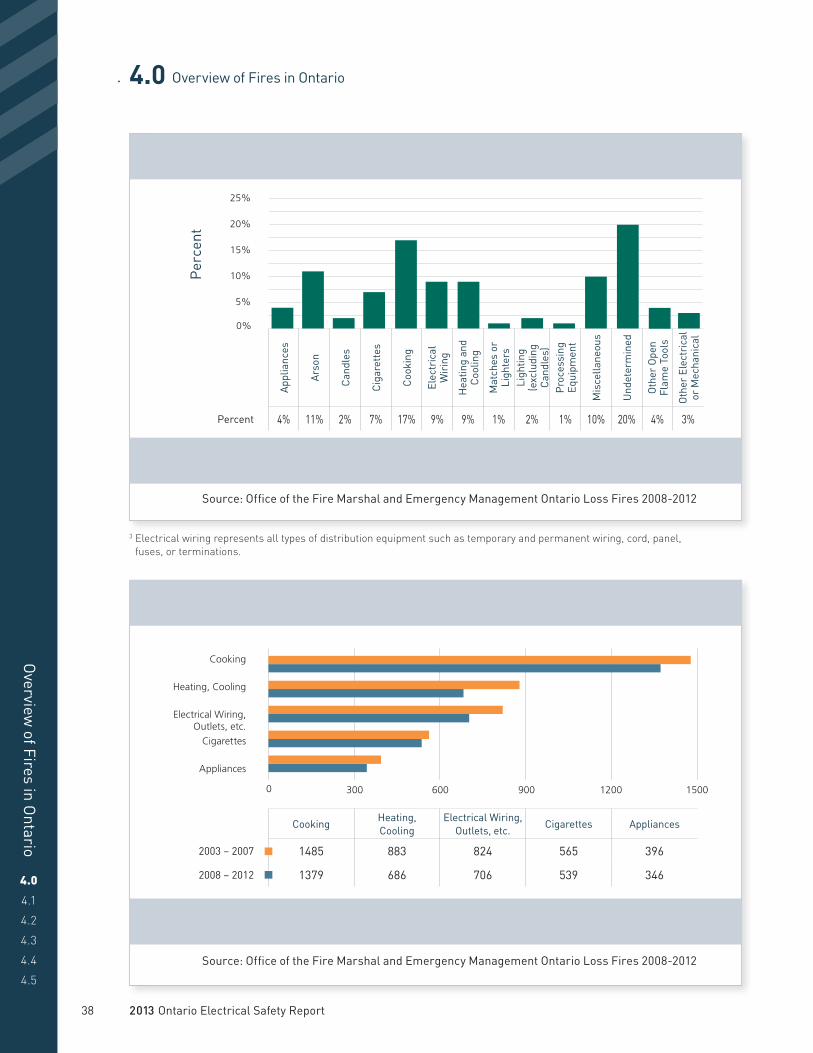
2 Ignition Source for Structure Loss Fires in Ontario, 2008-2012
Per
cent
Appl
ianc
es
Arso
n
Can
dles
Cig
aret
tes
Coo
king
Elec
tric
al
Wir
ing
Hea
ting
and
Coo
ling
Mat
ches
or
Ligh
ters
Ligh
ting
(e
xclu
ding
C
andl
es)
Pro
cess
ing
Equi
pmen
t
Mis
cella
neou
s
Und
eter
min
ed
Oth
er O
pen
Fl
ame
Tool
s
Oth
er E
lect
rica
l or
Mec
hani
cal
Percent 4% 11% 2% 7% 17% 9% 9% 1% 2% 1% 10% 20% 4% 3%
Conclusion: Most common ignition sources: Cooking 17%, Arson 11%, Electrical wiring3 9%, Heating and cooling 9%, Cigarettes 7%, Appliances 4%.
Source: Office of the Fire Marshal and Emergency Management Ontario Loss Fires 2008-2012
4.0
4.1
4.2
4.3
4.4
4.5
Overview
of Fires in Ontario
4.0 Overview of Fires in Ontario
0%
5%
10%
15%
20%
25%
3 Five-year Average Number of Structure Loss Fires by Ignition Source in Ontario, 2003-2007 and 2008-2012
CookingHeating, Cooling
Electrical Wiring, Outlets, etc.
Cigarettes Appliances
2003 – 2007 1485 883 824 565 396
2008 – 2012 1379 686 706 539 346
Conclusion: 7% decrease for cooking. 22% decrease for heating, cooling. 14% decrease for electrical wiring. 13% decrease for appliances.
Source: Office of the Fire Marshal and Emergency Management Ontario Loss Fires 2008-2012
Cooking
Heating, Cooling
Electrical Wiring, Outlets, etc.
Cigarettes
Appliances
0 300 600 900 1200 1500
3 Electrical wiring represents all types of distribution equipment such as temporary and permanent wiring, cord, panel, fuses, or terminations.
38 2013 Ontario Electrical Safety Report

4 Percentage of Structure Loss Fires Fuelled in Part by an Electrical Ignition Source in Ontario, 2008-2012
Per
cent
Appl
ianc
es
Coo
king
Eq
uipm
ent
Elec
tric
al
Dis
trib
utio
n Eq
uipm
ent
Expo
sure
Hea
ting
Eq
uipm
ent,
Chi
mne
y, e
tc.
Ligh
ting
Eq
uipm
ent
Mis
cella
neou
s
Ope
n Fl
ame
Tool
s, S
mok
ers’
Ar
ticle
s
Oth
er E
lect
rica
l, M
echa
nica
l
Pro
cess
ing
Equi
pmen
t
Und
eter
min
ed,
Unk
now
n, N
ot
Rep
orte
d
Percent 11% 42% 27% 0.1% 4.2% 5.5% 1.6% 0.8% 5.8% 1.0% 1.0%
Conclusion: Most common ignition sources: Cooking equipment 42%, Electrical distribution equipment 27%, Appliances 11%.
Source: Office of the Fire Marshal and Emergency Management Ontario Loss Fires 2008-2012
Overview
of Fires in Ontario
4.0
4.1
4.2
4.3
4.4
4.5
4.0 Overview of Fires in Ontario
0%
10%
20%
40%
30%
50%
5 Electrical Product Fires Five-Year Average
Five
-yea
r A
vera
ge
Num
ber
of E
lect
rica
l-R
elat
ed P
rodu
ct F
ires
1999 – 2003
2000 – 2004
2001 – 2005
2002 – 2006
2003 – 2007
2004 – 2008
2005 – 2009
2006 – 2010
2007 – 2011
2008 – 2012
Appliances 389 361 340 332 329 321 311 293 264 233
Cooking Equipment 1410 1298 1209 1200 1167 1145 1126 1089 996 910
Lighting Equipment 218 214 217 219 221 215 199 167 145 118
Other Electrical, Mechanical
170 169 181 185 193 189 179 162 143 124
Processing Equipment 53 47 45 42 43 40 37 30 25 19
Product Safety Overall 2203 2090 1992 1979 1952 1910 1853 1739 1574 1404
Conclusion: 28% decrease in the five-year rolling average; 2002-2006 to 2007-2011.
Source: Office of the Fire Marshal and Emergency Management Ontario Loss Fires 2000-2012
0
500
1000
1500
2000
2500
2013 Ontario Electrical Safety Report 39

4.0 Summary of Statistics• Ontario reported 39,440 structural-loss fires (fires resulting in an injury,
fatality, or dollars lost) in the span between 2008 and 2012. This number is down from 40,854 in the period between 2007 to 2011.
• Residential loss fires account for 72% of the structural-loss fires in Ontario from 2008 to 2012. Stove-top fires account for about 9% of structural-loss fires.
• Since 2008 there has been a 14% decrease in all loss fires, a 7% decrease in structural-loss fires, and a 7% decrease in residential loss fires.
• For the period between 2008 and 2012, the Office of the Fire Marshal identified the following as the most common ignition sources for all structural-loss fires:
• Cooking 17%• Arson 11%• Electrical wiring 9%• Heating and cooling 9%• Cigarettes 7%• Appliances 4%
• Comparing the two periods (2003 to 2007 and 2008 to 2012) for the average number of structure loss fires per year by ignition source, there was a 7% decrease for cooking, 22% decrease for heating/cooling, 14% decrease for electrical wiring, and a 13% decrease for appliances.
• When structural-loss fires were restricted to those with electricity as the identified fuel source, but not necessarily the primary fuel energy source, the most common electrical-related products involved were:
• Cooking equipment 42%• Electrical distribution equipment 27%• Appliances 11%
Statistics Directly Related to Harm Reduction Priorities—Product SafetyIn electrical-related product fires—involving appliances, cooking equipment, lighting equipment,
other electrical and mechanical equipment and processing equipment—there was a 28% decrease
in the five-year rolling average (2003 to 2007 vs. 2008 to 2012) based on data reported to the Office
of the Fire Marshal and Emergency Management (where fuel energy was identified as electricity.)
4.0 Overview of Fires in Ontario: Summary
4.0
4.1
4.2
4.3
4.4
4.5
Overview
of Fires in Ontario
40 2013 Ontario Electrical Safety Report
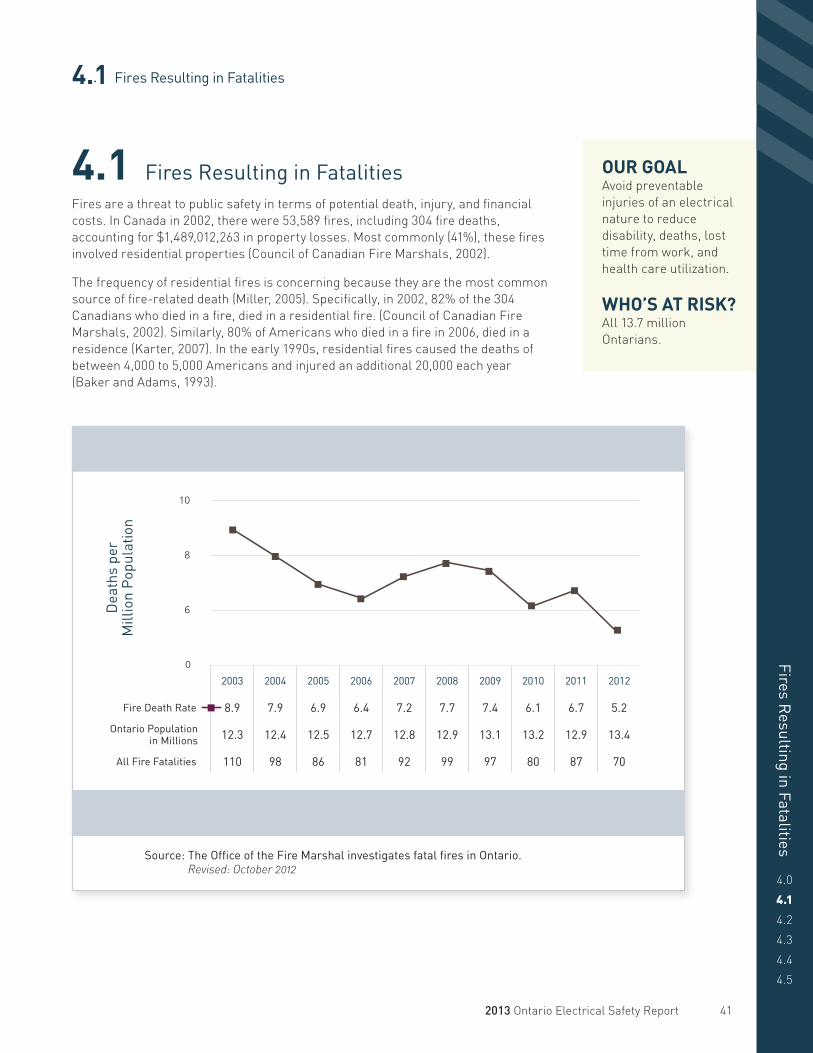
1 Fire Death Rate in Ontario: All Fatalities, 2003–2012
Dea
ths
per
M
illio
n P
opul
atio
n
2003 2004 2005 2006 2007 2008 2009 2010 2011 2012
Fire Death Rate 8.9 7.9 6.9 6.4 7.2 7.7 7.4 6.1 6.7 5.2
Ontario Population in Millions 12.3 12.4 12.5 12.7 12.8 12.9 13.1 13.2 12.9 13.4
All Fire Fatalities 110 98 86 81 92 99 97 80 87 70
Conclusion: 42% decrease in death rate in all fatalities.
Source: The Office of the Fire Marshal investigates fatal fires in Ontario. Revised: October 2012
4.1 Fires Resulting in Fatalities
Fires Resulting in Fatalities
4.0
4.1
4.2
4.3
4.4
4.5
4.1 Fires Resulting in FatalitiesFires are a threat to public safety in terms of potential death, injury, and financial costs. In Canada in 2002, there were 53,589 fires, including 304 fire deaths, accounting for $1,489,012,263 in property losses. Most commonly (41%), these fires involved residential properties (Council of Canadian Fire Marshals, 2002).
The frequency of residential fires is concerning because they are the most common source of fire-related death (Miller, 2005). Specifically, in 2002, 82% of the 304 Canadians who died in a fire, died in a residential fire. (Council of Canadian Fire Marshals, 2002). Similarly, 80% of Americans who died in a fire in 2006, died in a residence (Karter, 2007). In the early 1990s, residential fires caused the deaths of between 4,000 to 5,000 Americans and injured an additional 20,000 each year (Baker and Adams, 1993).
OUR GOALAvoid preventable injuries of an electrical nature to reduce disability, deaths, lost time from work, and health care utilization.
WHO’S AT RISK?All 13.7 million Ontarians.
0
6
8
10
2013 Ontario Electrical Safety Report 41

3 Fire Death Rate in Ontario: Electricity as Ignition Source Fires, 2003-2012
Dea
ths
per
Mill
ion
Pop
ulat
ion
2003 2004 2005 2006 2007 2008 2009 2010 2011 2012
Fire Death Rate Electricity as Fuel
Fires0.57 0.08 0.80 0.47 0.70 0.78 0.61 0.76 0.39 0.52
Ontario Population in Millions 12.3 12.4 12.5 12.7 12.8 12.9 13.1 13.2 12.9 13.4
Fatalities in Electricity as Fuel Fires 7 1 10 6 9 10 8 10 5 7
Conclusion: 9% increase in death rate with electricity as ignition source.
Source: Office of the Fire Marshal and Emergency Management Ontario 2003-2012 Data
2 Fire Death Rate in Ontario: Structure Fires, 2003-2012D
eath
s pe
r M
illio
n P
opul
atio
n
2003 2004 2005 2006 2007 2008 2009 2010 2011 2012
Fire Death Rate Structure Fires 8.1 6.9 6.2 6.1 6.6 6.8 6.3 5.4 6.4 4.7
Ontario Population in Millions 12.3 12.4 12.5 12.7 12.8 12.9 13.1 13.2 12.9 13.4
Fatalities in Structure Fires 100 86 78 75 84 88 83 71 82 63
Conclusion: 42% decrease in death rate structure fires.
Source: The Office of the Fire Marshal investigates fatal fires in Ontario. Revised: October 2012
4.0
4.1
4.2
4.3
4.4
4.5
Fires Resulting in Fatalities
4.1 Fires Resulting in Fatalities
0
2
4
6
8
10
0.0
0.2
0.4
0.6
0.8
1.0
42 2013 Ontario Electrical Safety Report

Fires Resulting in Fatalities
4.0
4.1
4.2
4.3
4.4
4.5
4.1 Fires Resulting in Fatalities
4 Cause Classification for All Fire Fatalities and Fatalities Where Electricity is Fuel of Fire, 2003-2012
Undetermined Under Investigation IntentionalUnintentional/
PreventableFatalities in Electricity
as Fuel Fires 1.0% 0.0% 0.0% 99.0%
All Fire Fatalities 30.0% 1.0% 17.0% 52.0%
Conclusion: 99% of fires identified with electricity as fuel are considered unintentional or preventable.
Source: Office of the Fire Marshal and Emergency Management Ontario 2003-2012 Data
Undetermined
Under Investigation
Intentional
Unintentional/ Preventable
0% 10% 20% 30% 40% 50% 60% 70% 80% 90% 100%
0% 10% 20% 30% 40% 50% 60% 70% 80% 90% 100%
5 Percentage of Fatalities for Fires Fuelled at Least by Electricity by Ignition Source, 2003-2012
Per
cent
age
Cir
cuit
Wir
ing
—
Alu
min
um
Cir
cuit
Wir
ing
—
Cop
per
Clo
thes
Dry
er
Cor
d, C
able
for
App
lianc
es
Dee
p Fa
t Fry
er
Elec
tric
Bla
nket
, H
eatin
g P
ad
Exte
nsio
n C
ord,
Te
mpo
rary
Wir
e
Inca
ndes
cent
La
mp
— L
ight
Bul
b
Met
er
Oth
er C
ooki
ng It
ems
(e.g
. toa
ster
)
Oth
er E
lect
rica
l
Oth
er E
lect
rica
l D
istr
ibut
ion
Item
s
Oth
er H
eatin
g Eq
uipm
ent
Oth
er L
ight
ing
Equi
pmen
t
Spac
e H
eate
r —
P
orta
ble
Stov
e, R
ange
-top
B
urne
r
Tele
visi
on, R
adio
, St
ereo
, Tap
eTe
rmin
atio
ns (i
ncl.
rece
ptac
les,
switc
hes,
lig
hts)
— C
oppe
r
Wat
er H
eate
r
Ignition Source %
8.1% 14% 2.5% 5.3% 1.4% 0.0% 5.3% 2.5% 1.4% 5.4% 6.7% 5.4% 2.6% 1.4% 2.6% 30% 0.0% 1.4% 4.1%
Conclusion: Stove or range-top burners account for 30% of fire fatalities fuelled at least by electricity.
Source: Office of the Fire Marshal and Emergency Management Ontario 2003-2012 Data
0%
5%
10%
15%
20%
25%
30%
2013 Ontario Electrical Safety Report 43

4.0
4.1
4.2
4.3
4.4
4.5
Fires Resulting in Fatalities
4.1 Fires Resulting in Fatalities: Summary
4.1 Summary of Statistics• Ontario reported 897 total deaths due to fires4 between 2003 and 2012.
This number is down from 915 total deaths in the period between 2002 to 2011. In 2003 when there were 110 fire deaths, the population was 12.3 million, which results in a fire death rate of 8.9 per million population. In 2012 there were 70 fire deaths and the population was 13.4 million, which results in a fire death rate of 5.2 per million population. This is a 42% decrease in the death rate when comparing these two time periods.
• Ontario also reported 810 total deaths in structural-loss fires (fires resulting in an injury, fatality, or financial loss) between 2003 and 2012. This number is down from 826 total deaths in the period between 2002 to 2011. In 2003 there were 100 fire deaths in structures and the population was 12.3 million, which results in a fire death rate of 8.1 per million population. In 2012 there were 63 fire deaths in structures and the population was 13.4 million, which results in a fire death rate of 4.7 per million population. This represents a 42% decrease in death rate when comparing these two time periods.
• The Office of the Fire Marshal and Emergency Management data identifies 73 deaths in fires for which electricity was the fuel of ignition source between 2003 and 2012. Since 2003, the death rate in this type of fire has decreased from 0.57 deaths per million population to 0.52. This represents a decrease of 8.8% over this ten-year period.
• For fires where electricity as fuel was identified as the ignition source, 99% of the fires were considered unintentional or preventable. These types of fires have a greater percentage classified as preventable/unintentional fires than fires where electricity is not identified as the fuel of the ignition source.
• The number of fires and fatalities may change for the years 2011 and 2012 depending upon the conclusion of active investigations.
• Stove or range-top burners account for 30% of fire fatalities fuelled at least by electricity.
• Cigarettes were the source of 21% of fatal residential fires.
6 Residential Fatal Fires: Ignition Source, 2003-2012
Per
cent
age
Appl
ianc
es
Arso
n
Can
dle
Coo
king
Elec
tric
al
Wir
ing
Hea
ting
Ligh
ting
(e
xc. c
andl
es)
Mat
ches
or
Ligh
ters
Mis
cella
neou
s
Oth
er O
pen
Flam
e To
ols
Oth
er
Elec
tric
al /
Mec
hani
cal
Cig
aret
tes
Und
eter
min
ed
Ignition Source % 0% 13% 3% 10% 3% 2% 1% 5% 1% 2% 2% 21% 37%
Conclusion: Cigarettes are the source of 21% of fatal residential fires.
Source: Office of the Fire Marshal and Emergency Management Ontario 2003-2012 Data
4 Fire deaths do not include fire deaths in vehicle collisions.44 2013 Ontario Electrical Safety Report
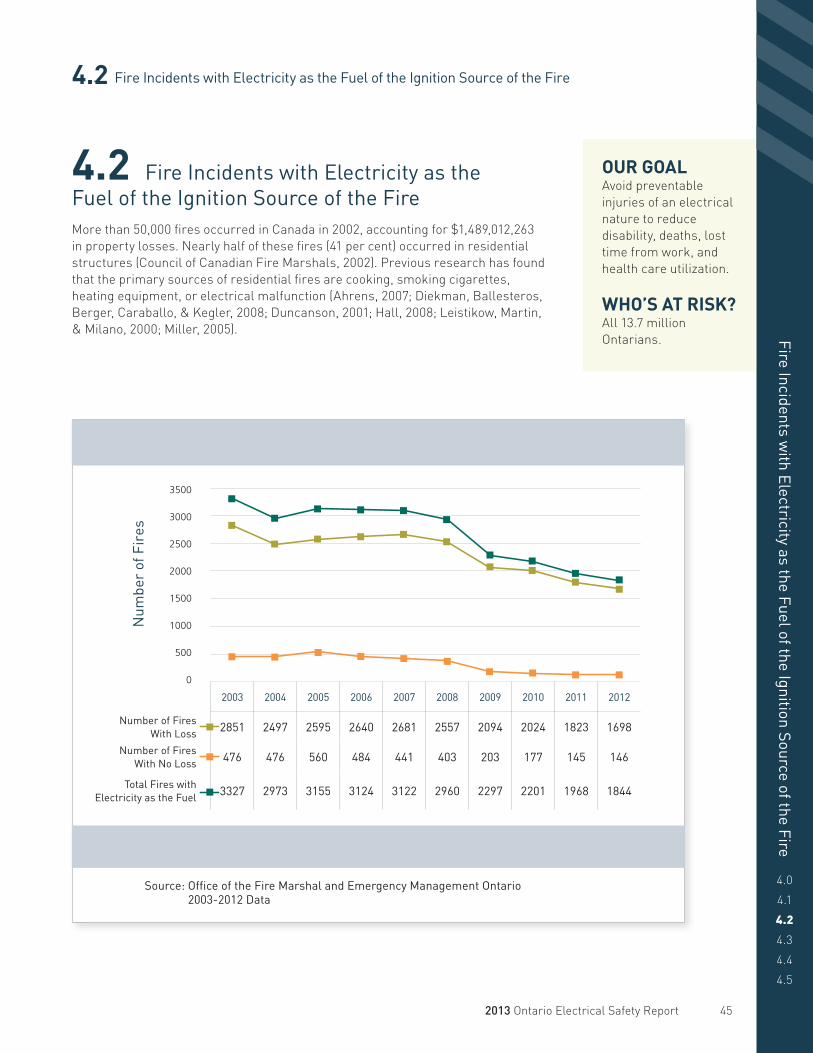
1 Summary of Fires with Electricity as the Fuel of the Ignition Source in Ontario, 2003-2012
Num
ber
of F
ires
2003 2004 2005 2006 2007 2008 2009 2010 2011 2012
Number of Fires With Loss 2851 2497 2595 2640 2681 2557 2094 2024 1823 1698
Number of Fires With No Loss 476 476 560 484 441 403 203 177 145 146
Total Fires with Electricity as the Fuel 3327 2973 3155 3124 3122 2960 2297 2201 1968 1844
Conclusion: Over the past ten years: 40% decrease in loss fires. 45% decrease in total fires.
Source: Office of the Fire Marshal and Emergency Management Ontario 2003-2012 Data
Fire Incidents with Electricity as the Fuel of the Ignition Source of the Fire
4.0
4.1
4.2
4.3
4.4
4.5
4.2 Fire Incidents with Electricity as the Fuel of the Ignition Source of the Fire
4.2 Fire Incidents with Electricity as the Fuel of the Ignition Source of the FireMore than 50,000 fires occurred in Canada in 2002, accounting for $1,489,012,263 in property losses. Nearly half of these fires (41 per cent) occurred in residential structures (Council of Canadian Fire Marshals, 2002). Previous research has found that the primary sources of residential fires are cooking, smoking cigarettes, heating equipment, or electrical malfunction (Ahrens, 2007; Diekman, Ballesteros, Berger, Caraballo, & Kegler, 2008; Duncanson, 2001; Hall, 2008; Leistikow, Martin, & Milano, 2000; Miller, 2005).
OUR GOALAvoid preventable injuries of an electrical nature to reduce disability, deaths, lost time from work, and health care utilization.
WHO’S AT RISK?All 13.7 million Ontarians.
0
500
1000
1500
2000
2500
3000
3500
2013 Ontario Electrical Safety Report 45
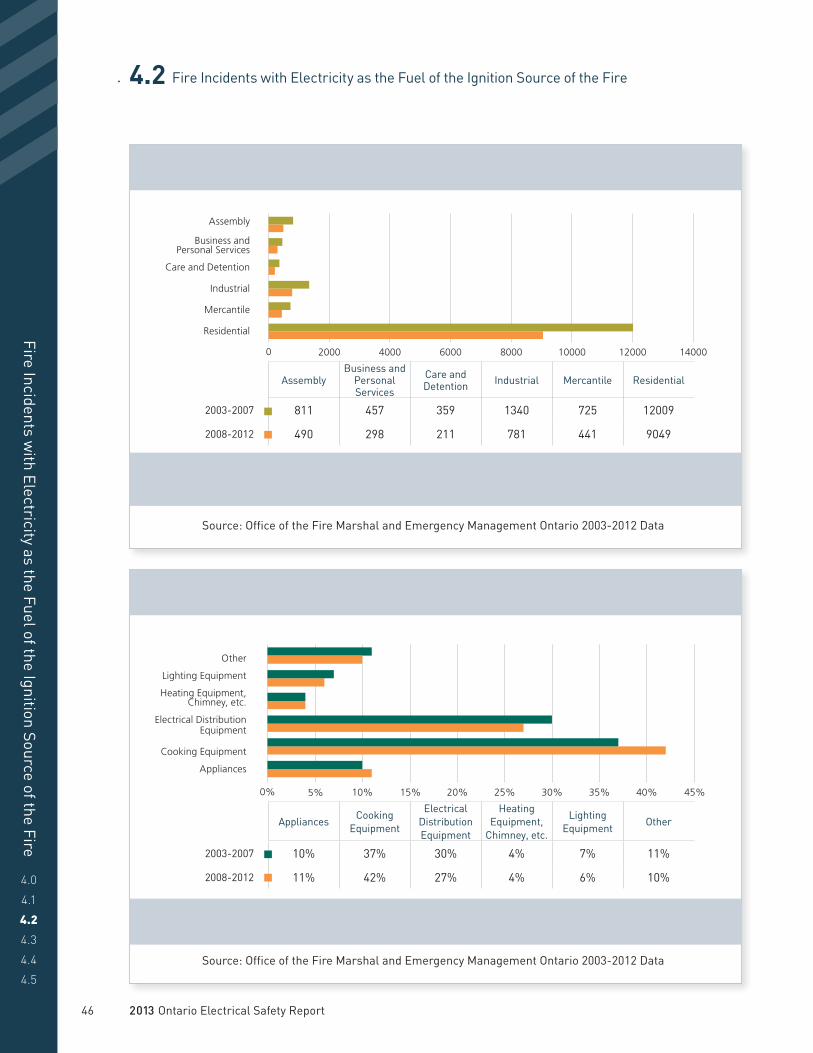
3 Source of Fires with Electricity as the Fuel of the Ignition Source in Ontario, 2003-2007, 2008-2012
AppliancesCooking
Equipment
Electrical Distribution Equipment
Heating Equipment,
Chimney, etc.
Lighting Equipment
Other
2003-2007 10% 37% 30% 4% 7% 11%
2008-2012 11% 42% 27% 4% 6% 10%
Conclusion: The distribution by source of fire has remained fairly constant over the 2003-2007 to 2008-2012 periods.
Source: Office of the Fire Marshal and Emergency Management Ontario 2003-2012 Data
2 Fires with Electricity as the Fuel of the Ignition Source by Classification of Building or Structure, 2003-2012
AssemblyBusiness and
Personal Services
Care and Detention Industrial Mercantile Residential
2003-2007 811 457 359 1340 725 12009
2008-2012 490 298 211 781 441 9049
Conclusion: From 2003-2007 to 2008-2012: 41% decrease in fires for care and detention buildings. 42% decrease in fires in industrial buildings. 25% decrease in fires in residential buildings.
Source: Office of the Fire Marshal and Emergency Management Ontario 2003-2012 Data
4.0
4.1
4.2
4.3
4.4
4.5
Fire Incidents with Electricity as the Fuel of the Ignition Source of the Fire
4.2 Fire Incidents with Electricity as the Fuel of the Ignition Source of the Fire
0 2000 4000 6000 8000 10000 12000 14000
Assembly
Business and Personal Services
Care and Detention
Industrial
Mercantile
Residential
Other
Lighting Equipment
Heating Equipment, Chimney, etc.
Electrical Distribution Equipment
Cooking Equipment
Appliances
0% 5% 10% 15% 20% 25% 30% 35% 45%40%
46 2013 Ontario Electrical Safety Report
Fire Incidents with Electricity as the Fuel of the Ignition Source of the Fire
4.0
4.1
4.2
4.3
4.4
4.5
4.2 Fire Incidents with Electricity as the Fuel of the Ignition Source of the Fire: Summary
4.2 Summary of Statistics• Ontario reported 23,460 loss fires and 3,511 no loss fires for a total
of 26,971 fires in which electricity was the fuel of the ignition source of the fire from 2003 to 2012. Over this same time frame, there was a 40% decrease in loss fires, and a 45% decrease in total fires.
• Examining the total fires by classification of building or structure between 2003 to 2007 and 2008 to 2012 finds:
• 41% decrease in fires for care and detention building• 42% decrease in fires in industrial buildings• 25% decrease in fires in residential buildings
• The distribution by source of fire has remained fairly constant over the 2003-2007 to 2008-2012 time frames. Cooking equipment, electrical distribution equipment, and appliances remain the top three sources.
2013 Ontario Electrical Safety Report 47

1 Cooking Equipment Fires vs. Distribution Equipment Fires, 2003-2012
Num
ber
of F
ires
2003 2004 2005 2006 2007 2008 2009 2010 2011 2012
Cooking Equipment 1239 1097 1108 1233 1158 1130 1002 920 772 727
Electrical Distribution Equipment 985 897 993 865 908 859 604 507 500 443
Total Cooking Equip and Electrical Distri-
bution Equip Fires2224 1994 2101 2098 2066 1989 1606 1427 1272 1170
Total Fires with Electricity as the Fuel 3327 2973 3155 3124 3122 2960 2297 2201 1827 1844
Conclusion: Since 2003, there has been a 41% decrease in cooking equipment fires and a 55% decrease in electrical distribution equipment fires.
Source: Office of the Fire Marshal and Emergency Management Ontario 2003-2012 Data
4.0
4.1
4.2
4.3
4.4
4.5
Cooking Fires w
ith Electricity as the Fuel of the Ignition Source of the Fire
4.3 Cooking Fires with Electricity as the Fuel of the Ignition Source of the Fire
OUR GOALAvoid preventable injuries of an electrical nature to reduce disability, deaths, lost time from work, and health care utilization.
WHO’S AT RISK?All 13.7 million Ontarians.
4.3 Cooking Fires with Electricity as the Fuel of the Ignition Source of the FireThe OFMEM fire loss reporting system identified cooking equipment as the leading ignition source associated with preventable home injuries. It accounted for an annual average of 184 injuries and six fatalities between 2003 and 2007. Cooking equipment was the second leading ignition source associated with preventable residential fire fatalities during this five-year period. These fires resulted in an average loss of $23.1 million annually (Reducing Residential Stovetop Fires In Ontario, OFM 2009).
Section 4.5.1 provides a case study that is representative of the risk factors associated with cooking fires.
0
500
1000
1500
2000
2500
3000
3500
48 2013 Ontario Electrical Safety Report

3 Stove-top Fires vs. Cooking Fires by Possible Cause, 2003-2012
Children Playing
Design/ Construction/ Maintenance
Deficiency
IntentionalMechanical/
Electrical Failure
Misuse of Ignition Source/ Material First
Ignited
Other Undetermined
Stove-top Fires 25 80 39 134 6177 526 163Cooking Fires 43 265 57 550 7277 736 303
Conclusion: For stove-top and all cooking fires, the number one possible cause is misuse of ignition source/material.
Source: Office of the Fire Marshal and Emergency Management Ontario 2003-2012 Data
2 Cooking Equipment Fires with Electricity as the Fuel by Ignition Source, 2003-2012
Num
ber
of F
ires
2003 2004 2005 2006 2007 2008 2009 2010 2011 2012
Deep Fat Fryer 20 26 21 31 22 21 30 17 14 17Microwave 43 29 29 44 27 38 19 14 14 15
Open Fired Barbecue - Fixed or Portable 1 1 2 1 0 1 2 0 0 0
Other Cooking Items (e.g. toaster, kettle,
elec frying pan)134 114 123 110 128 113 47 60 48 41
Oven 149 110 135 143 145 127 104 71 64 65Range Hood 13 8 14 17 24 12 7 8 5 5
Stove, Range-top Burner 879 809 784 887 812 818 793 750 627 584
Total 1239 1097 1108 1233 1158 1130 1002 920 772 727
Conclusion: Stove range-top burners remain the most common ignition source for cooking fires of an electrical nature, but the number has decreased 34% over the past ten years.
Source: Office of the Fire Marshal and Emergency Management Ontario 2003-2012 Data
Cooking Fires w
ith Electricity as the Fuel of the Ignition Source of the Fire
4.0
4.1
4.2
4.3
4.4
4.5
4.3 Cooking Fires with Electricity as the Fuel of the Ignition Source of the Fire
0200
400
600
800
1000
1200
1400
0 1000 2000 3000 4000 5000 6000 7000 8000
Children PlayingDesign/Construction/
Maintenance DeficiencyIntentional
Mechanical/ Electrical Failure
Misuse of Ignition Source/ Material First Ignited
Other Undetermined
2013 Ontario Electrical Safety Report 49

5 Electrical Product Fires Five-Year Average
Five
-yea
r Av
erag
e
Num
ber
of E
lect
rica
l-
Rel
ated
Pro
duct
Fir
es
1999 – 2003
2000 – 2004
2001 – 2005
2002 – 2006
2003 – 2007
2004 – 2008
2005 – 2009
2006 – 2010
2007 – 2011
2008 – 2012
Appliances 389 361 340 332 329 321 311 293 264 233
Cooking Equipment 1410 1298 1209 1200 1167 1145 1126 1089 996 910
Lighting Equipment 218 214 217 219 221 215 199 167 145 118Other Electrical,
Mechanical 170 169 181 185 193 189 179 162 143 124
Processing Equipment 53 47 45 42 43 40 37 30 25 19
Product Safety Overall 2203 2090 1992 1979 1952 1910 1853 1739 1574 1404
Conclusion: 28% decrease in the five-year rolling average; 2003-2007 to 2008-2012.
Source: Office of the Fire Marshal and Emergency Management Ontario 2003-2012 Data
4 Stove-Top Fires: 2003-2007 and 2008-2012
Num
ber
of F
ires
2003 – 2007 2008 – 2012
Stove-top Fires 4171 3572
Conclusion: The number of stove-top fires has decreased 14% from 2003-2007 to 2008-2012.
Source: Office of the Fire Marshal and Emergency Management Ontario 2003-2012 Data
4.0
4.1
4.2
4.3
4.4
4.5
Cooking Fires w
ith Electricity as the Fuel of the Ignition Source of the Fire
4.3 Cooking Fires with Electricity as the Fuel of the Ignition Source of the Fire
0
1000
2000
3000
4000
5000
0
500
1000
1500
2000
2500
50 2013 Ontario Electrical Safety Report

4.3 Summary of Statistics• In the ten-year period from 2003 to 2012, there were 10,386 fires identified
as cooking equipment fires. Since 2003 there has been a 41% decrease in this type of fire.
• Although the frequency of incidents has decreased 34% over the past ten years, stove and range-top burners remain the most common (75%) ignition source for cooking fires of an electrical nature.
• Between the two five-year periods there is a drop of 14% in total stove or range-top fires.
Cooking Fires w
ith Electricity as the Fuel of the Ignition Source of the Fire
4.0
4.1
4.2
4.3
4.4
4.5
4.3 Cooking Fires with Electricity as the Fuel of the Ignition Source of the Fire: Summary
Product Safety Five-Year AverageNumber of electrical-related product fires. A product fire is defined as one involving appliances or
cooking equipment or lighting equipment or other electrical, mechanical or processing equipment
as the ignition class source as classified by the Office of the Fire Marshal (OFMEM) data set.
28% decrease in the five-year rolling average; 2003-2007 to 2008-2012.
2013 Ontario Electrical Safety Report 51

4.0
4.1
4.2
4.3
4.4
4.5
4.4 Electrical Distribution Equipment with Electricity as the Fuel of the Ignition Source of the Fire
OUR GOALAvoid preventable injuries of an electrical nature to reduce disability, deaths, lost time from work, and health care utilization.
WHO’S AT RISK?All 13.7 million Ontarians.
4.4 Electrical Distribution Equipment with Electricity as the Fuel of the Ignition Source of the FireIn 2007, an estimated 25,200 reported non-confined home structure fires in the United States involving electrical distribution or lighting equipment resulted in 270 deaths, 1,050 injuries, and $663 million in direct property damage.
Electrical distribution or lighting equipment accounted for 6% of home structure fires between 2003 and 2007, ranking fourth among major causes behind cooking equipment, heating equipment, and intentional. Electrical distribution or lighting equipment also accounted for 12% of associated deaths (ranking behind smoking materials, heating equipment, and cooking equipment) (Hall, 2010).
Section 4.5.2 provides a case study that is representative of the risk factors associated with electrical distribution fires.
Electrical Distribution Equipm
ent with Electricity as the Fuel of the Ignition Source of the Fire
1 Electrical Distribution Equipment Fires in Ontario, 2003-2012
Num
ber
of F
ires
2003 2004 2005 2006 2007 2008 2009 2010 2011 2012
Electrical Distribution Equipment 985 897 993 865 908 859 604 507 500 443
Total Cooking Equipment & Electrical Distribution
Equipment Fires2224 1994 2101 2098 2066 1989 1606 1427 1272 1170
Total Fires with Electricity as the Fuel 3327 2973 3155 3124 3122 2960 2297 2201 1968 1844
Conclusion: 55% decrease in number of distribution equipment fires over the past ten years.
Source: Office of the Fire Marshal and Emergency Management Ontario 2003-2012 Data
0
500
1000
1500
2000
2500
3000
3500
52 2013 Ontario Electrical Safety Report

2Distribution Equipment Fires by Ignition Source in Ontario, 2003-2012
Num
ber
of F
ires
2003 2004 2005 2006 2007 2008 2009 2010 2011 2012
Circuit Wiring— Aluminum (Includes
Conductors)16 20 15 28 14 24 6 6 9 16
Circuit Wiring—Copper (Includes Conductors) 192 206 226 206 211 192 145 121 127 106
Cord, Cable for Appli-ance, Electrical Articles 139 115 114 114 121 126 93 79 70 74
Distribution Equipment (Includes Panel Boards,
Fuses, Circuits)167 150 155 142 127 112 101 85 85 73
Extension Cord, Temporary Wiring 96 78 102 78 87 83 52 58 47 39
Meter 14 11 13 11 12 16 7 9 1 6
Other Electrical Distribution Item 125 117 104 113 105 118 78 50 58 47
Service/ Utility Lines (Includes Power/ Hydro
Transmission Lines)80 63 100 71 66 69 46 35 38 31
Terminations—Aluminum (Including Receptacles,
Switches and Lights)26 16 16 11 23 12 8 3 3 5
Terminations—Copper (Including Receptacles,
Switches, Lights86 85 95 61 102 69 45 41 45 34
Transformer 44 36 53 30 40 38 23 20 17 12
Total 985 897 993 865 908 859 604 507 500 443
Conclusion: Circuit wiring - copper (including conductors) remains the top ignition source, but the numbers have decreased 45% over the last ten years.
Source: Office of the Fire Marshal and Emergency Management Ontario 2003-2012 Data
4.0
4.1
4.2
4.3
4.4
4.5
4.4 Electrical Distribution Equipment with Electricity as the Fuel of the Ignition Source of the Fire
0
200
400
600
800
1000
Electrical Distribution Equipm
ent with Electricity as the Fuel of the Ignition Source of the Fire
2013 Ontario Electrical Safety Report 53
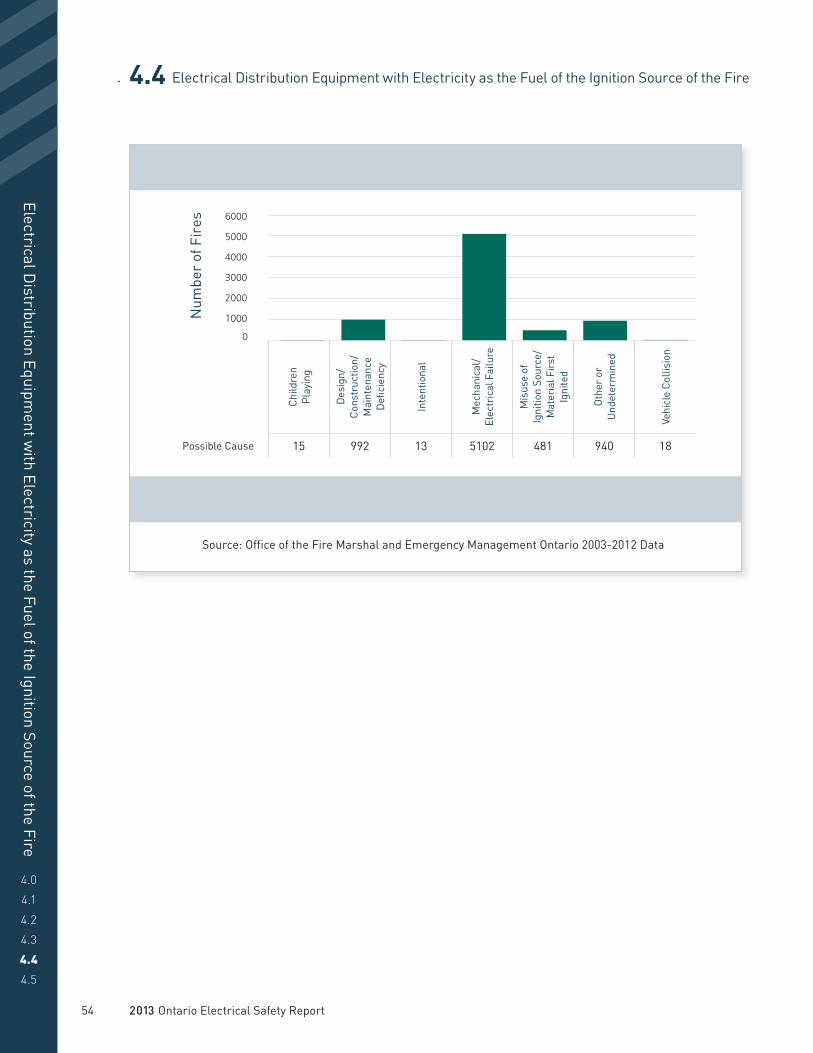
3 Electrical Distribution Equipment Fire Possible Cause in Ontario, 2003-2012
Num
ber
of F
ires
Chi
ldre
n
Pla
ying
Des
ign/
C
onst
ruct
ion/
M
aint
enan
ce
Defi
cien
cy
Inte
ntio
nal
Mec
hani
cal/
El
ectr
ical
Fai
lure
Mis
use
of
Igni
tion
Sour
ce/
Mat
eria
l Fir
st
Igni
ted
Oth
er o
r
Und
eter
min
ed
Vehi
cle
Col
lisio
n
Possible Cause 15 992 13 5102 481 940 18
Conclusion: 60% of distribution equipment fires are possibly due to mechanical/electrical failure.
Source: Office of the Fire Marshal and Emergency Management Ontario 2003-2012 Data
4.0
4.1
4.2
4.3
4.4
4.5
4.4 Electrical Distribution Equipment with Electricity as the Fuel of the Ignition Source of the Fire
0
1000
2000
3000
4000
5000
6000
Electrical Distribution Equipm
ent with Electricity as the Fuel of the Ignition Source of the Fire
54 2013 Ontario Electrical Safety Report
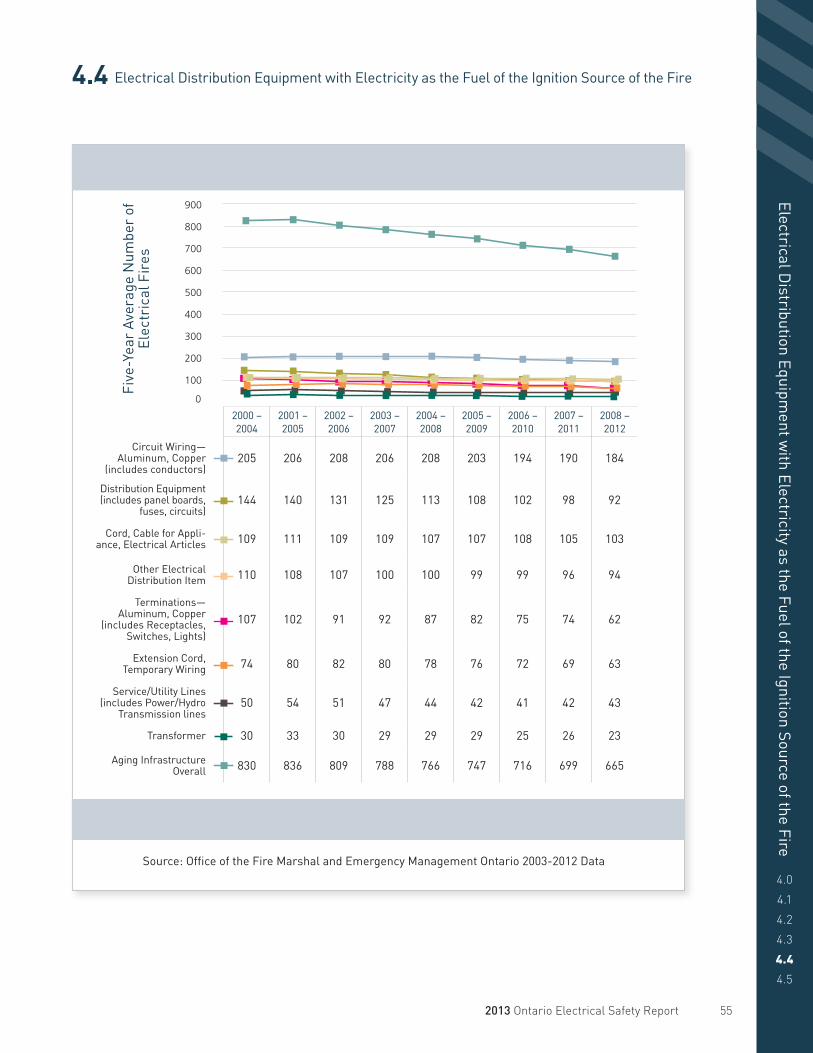
4.0
4.1
4.2
4.3
4.4
4.5
4.4 Electrical Distribution Equipment with Electricity as the Fuel of the Ignition Source of the Fire
4 Distribution Equipment Fires Five-Year Average
Five
-Yea
r Av
erag
e N
umbe
r of
El
ectr
ical
Fir
es
2000 – 2004
2001 – 2005
2002 – 2006
2003 – 2007
2004 – 2008
2005 – 2009
2006 – 2010
2007 – 2011
2008 – 2012
Circuit Wiring— Aluminum, Copper
(includes conductors)205 206 208 206 208 203 194 190 184
Distribution Equipment (includes panel boards,
fuses, circuits)144 140 131 125 113 108 102 98 92
Cord, Cable for Appli-ance, Electrical Articles 109 111 109 109 107 107 108 105 103
Other Electrical Distribution Item 110 108 107 100 100 99 99 96 94
Terminations— Aluminum, Copper
(includes Receptacles, Switches, Lights)
107 102 91 92 87 82 75 74 62
Extension Cord, Temporary Wiring 74 80 82 80 78 76 72 69 63
Service/Utility Lines (includes Power/Hydro
Transmission lines50 54 51 47 44 42 41 42 43
Transformer 30 33 30 29 29 29 25 26 23
Aging Infrastructure Overall 830 836 809 788 766 747 716 699 665
Conclusion: There has been a 16% decrease in the five-year rolling average; 2003-2007 to 2008-2012.
Source: Office of the Fire Marshal and Emergency Management Ontario 2003-2012 Data
0
100
200
300
400
500
600
700
800
900
Electrical Distribution Equipm
ent with Electricity as the Fuel of the Ignition Source of the Fire
2013 Ontario Electrical Safety Report 55
4.0
4.1
4.2
4.3
4.4
4.5
4.4 Electrical Distribution Equipment with Electricity as the Fuel of the Ignition Source of the Fire: Summary
4.4 Summary of Statistics• In the ten-year period from 2003 to 2012, there were 7,561 fires identified
as distribution equipment fires. There has been a 55% decrease in electrical distribution equipment fires over that period. The OFMEM defines distribution equipment as electrical wiring devices or equipment where the primary function is to carry current from one location to another. Thus, wiring, extension cords, termination, electrical panels, cords on appliances, etc., are considered distribution equipment.
• Circuit wiring—copper (including conductors) remains the main ignition source, but the numbers have decreased 45% over the last ten years.
• Mechanical/electrical failure accounts for 60% of the possible cause of fire. Only 6% is contributed to misuse. About 12% is contributed to an installation or maintenance deficiency.
Statistics Directly Related to Harm Reduction Priorities—Aging Infrastructure—Distribution Equipment FiresNumber of electrical wiring related fires such as copper and aluminum wiring, extension cord,
appliance cord, termination and electrical panel— electrical devices categorized by the Office
of the Fire Marshal as Distribution Equipment—based on data reported to the Office of the
Fire Marshal with fuel energy identified as electricity.
16% decrease in the five-year rolling average; 2003-2007 to 2008-2012.
Electrical Distribution Equipm
ent with Electricity as the Fuel of the Ignition Source of the Fire
56 2013 Ontario Electrical Safety Report

Case Study
4.0
4.1
4.2
4.3
4.4
4.5
4.5 Case Study
4.5.1 Case Study: Fire Example #1
A stove-top fire causing a double fatality and damage to the property.
A fire in the kitchen of a semi-detached two-level dwelling resulted in two fatalities and extensive damage to the residence. The fire was investigated by the local fire department, the police, and the Office of the Fire Marshal. It was determined that the fire was caused by a cooking pot being left on an energized burner of a stove in the kitchen, and the fatalities were associated with a lack of smoke alarms to warn the occupants of the fire.
A neighbour reported the fire and tried to alert the two occupants of the home. Firefighters found one of the occupants on the floor, inside the front door and the other near the top of the stairs on the main floor of the house. Emergency personnel were able to resuscitate the first occupant, but they later succumbed to their injuries. The second occupant was pronounced dead at the scene.
The living room, bathroom and kitchen were located on the main level. The kitchen was in the eastern portion of this level with a table, a fridge, a stove and cupboards. The basement contained a bedroom and closet area.
Some of the resulting damages in the house were:
• The drywall or plaster on the ceiling of the kitchen had collapsed from the heat or was consumed in the fire.
• The metal part of the fridge was warped from the heat and plastic or rubber liners were melted.
• At the entrance to the kitchen there was evidence of clean hot burning of the drywall on the ceiling, which became more apparent towards the patio door.
• The glass on the patio door was shattered and the aluminum frame was melted.• Base cupboard units near the stove were charred and blistered on the exterior,
but remained intact. • Upper cupboards above the stove were damaged enough to collapse downward
and/or consumed in the fire. Contents of these cupboards spilled out, melted or were consumed in the fire.
• Shallow V-patterns were formed with the lower point moving upwards and outwards from the stove.
• Surface charring was on the countertops adjacent to the stove, the nearest portions to the stove were completely consumed on both sides of the stove but more evident near the left front burner.
• The range hood showed signs of sustained high heat with clean burn where it was subjected to hotter and more sustained heat towards the left side.
• The door of the oven had collapsed outward. The oven was empty.• The top of the stove contained remnants of the cupboards, broken dishes that
were presumably stored in the cupboards above, and a portion of the filter from the range hood.
2013 Ontario Electrical Safety Report 57

4.5.1 Case Study: Fire Example #1 (continued)• A large cooking pot was recovered on the floor in front of the stove. The handle
was burned off. The bottom of the pot had begun to delaminate due to extreme high heat, and it showed ring marks matching the size and configuration of the left front burner on the stove.
• The living room sustained heavy soot staining but no fire damage.• The basement level sustained no fire damage, only light soot staining
and water damage.
Investigation findings:
• The point of origin of the fire was determined to be the front left burner of the stove.• No sources of energy could be established except for the energized burner in the
area of origin of the fire.• The pot, which was found on the floor with markings on the bottom of it, indicated
that it had been on the energized burner at the time of the fire. Contents of the pot could not be determined, but due to the excessive demarcation burn marks inside the pot, it was determined those contents were the fuel to the fire.
Apartment fire and fatality
Pot left unattended
on energized burner
No smoke alarms
The investigation found that there is a need to be attentive when cooking, and to never leave the stove unattended. Furthermore, there should always be working smoke alarms in a residence.
4.0
4.1
4.2
4.3
4.4
4.5
Case Study
58 2013 Ontario Electrical Safety Report

4.5.2 Case Study: Fire Example #2
Improper wiring to knob and tube circuit causes smoldering attic fire and damage to the property.
An incident is seldom the result of one single contributing factor. In most cases, some contributing factors have existed for months or years prior to the incident actually occurring. ESA also found that should any of these contributing factors be eliminated the incident would not have occurred. The case below is no exception.
The local fire department and the Electrical Safety Authority investigated a smoldering fire in the attic of a detached dwelling. The only viable ignition source was electrical; an improper connection between newer wiring to older knob and tube wiring. The fire began at this point of origin when a portable electric heater was plugged into a three-prong receptacle fed by this circuit.
Some of the resulting damages in the house were as follows:
• Fire patterns were limited to the attic area and bedroom ceiling immediately below the attic. The remainder of the house (interior and exterior) was void of fire patterns.
• The underside of the ceiling was generally void of fire patterns with the exception of minor smoke damage.
• The roof in the attic showed signs of smoke damage.• The walls of the attic showed soot deposits, which were significantly heavier closer
to the area of origin.• The wall immediately surrounding the openings where one white and one black
knob and tube wire ran showed severe charring. • The knob and tube wires were covered in debris/dust/soot.• Insulation on the black knob and tube wire was consumed at the point of origin;
midway through the wire in the attic with the insulation retracted on both sides of the conductor at that point. The conductor was still intact.
• The end of a white (neutral) Non-Metallic Dry (NMD) conductor was connected to the knob and tube white wire by means of wrapping the NMD wire to the knob and tube wire. The NMD wire was covered with debris/dust/soot.
Investigation findings:
• No junction boxes were used to house the wiring connections.• No connectors (marrettes) were used to provide a solid connection between
the wires. • The NMD neutral wire was improperly connected to the knob and tube neutral wire.
It was assumed that a black NMD wire had been wrapped around the black knob and tube wire in similar fashion but the black NMD wire may have been displaced during fire suppression as it could not be found. The point of origin of the fire was determined to be improper connection between the knob and tube black wire
Case Study
4.0
4.1
4.2
4.3
4.4
4.5
2013 Ontario Electrical Safety Report 59

4.5.2 Case Study: Fire Example #2 (continued)
Always ensure proper installation methods are followed when modifying or installing additional wiring. Improper wiring methods, such as improper termination and not protecting the wiring termination points from arcing, sparking and high resistive heating have been known to cause fires.
Attic fire resulting in
damage
Large load plugged into the circuit (heater)
Resistive heatingNo junction box used
Improper wiring method; wire
wrapping and no wire connectors
4.0
4.1
4.2
4.3
4.4
4.5
Case Study
and NMD black wire resulting in excessive heating and a high resistance fault. The resulting excessive heating burned some of the wire insulation and started a smoldering fire in the attic using the ceiling and surrounding wooden joists as fuel.
• No other viable or credible ignition sources were found. • The occupants of the home were present when someone smelled burning and,
upon realizing it was from the attic, turned off the circuit.
60 2013 Ontario Electrical Safety Report

5.0 Product Safety
5.0 Product SafetyIn July 2007, Ontario Regulation 438/07 was passed. It strengthened ESA’s ability to manage electrical product safety in Ontario. The intent of the regulation was to develop a robust system for the management of identified electrical product safety concerns given the increasing prevalence of product incidents reported to ESA.
Since the coming into force of the provincial regulation, several changes occurred; most notably the coming into force of similar federal legislation, the Canada Consumer Product Safety Act (CCPSA) in 2011 which created concurrent product safety systems for consumer electrical products in Ontario, including mandatory reporting obligations. In anticipation of the federal legislation coming into effect; ESA and Health Canada entered into a formal information sharing Memorandum of Understanding (MOU).
OUR GOALAvoid preventable injuries of an electrical nature to reduce disability, deaths, lost time from work, and health care utilization.
WHO’S AT RISK?All 13.7 million Ontarians.
Product Safety
5.0
5.1
Number of Electrical Product Incidents Reported to ESA, Ontario, 2005-2013
Num
ber
of R
epor
ts
2005 2006 2007 2008 2009 2010 2011 2012 2013
Number of Reports Submitted 170 234 274 475 679 817 1601 1220 564
Conclusion: 19% increase in number of reports since 2008.
Source: ESA Product Safety Reporting System
0
500
1000
1500
2000
1
2013 Ontario Electrical Safety Report 61

Number of Electrical Safety Product Issues by Priority Level, Ontario 2013
Num
ber
of Is
sues
Priority 1 Priority 2 Priority 3 Priority 4Triaged by
Health Canada
Priority Level 33 261 98 48 124
Conclusion: 59% of safety issues triaged by ESA are priority level 2.
Source: ESA Product Safety Reporting System
3
Electrical Product Incidents Reported to ESA by Report Category, Ontario 2013
Num
ber
of R
epor
ts
Voluntary Mandatory
Report Category 392 172
Conclusion: 70% of electrical product incident reports are voluntary.
Source: ESA Product Safety Reporting System
2
5.0
5.1
Product Safety
5.0 Product Safety
0
50
100
150
200
250
300
350
400
0
50
100
150
200
250
300
62 2013 Ontario Electrical Safety Report

Percentage of Electrical Product Safety Investigation Types, Ontario 2013
Per
cent
age
of In
vest
igat
ions
CertifiedWith Suspected
Counterfeit LabelUnapproved
Investigation Type 57% 38% 5%
Conclusion: 57% of product safety investigations involved certified products.
Source: ESA Product Safety Reporting System
4
5.0 Product Safety: Summary
0%
10%
20%
30%
40%
50%
60%
5.0 Summary of Statistics• Since 2008, there has been a 19% increase in the number of number of
electrical product incidents reported to ESA. As Health Canada continues to implement their system, the number of reports submitted to ESA began to drop in 2012. This systemic change can account for much of the drop in reported incidents rather than inferring that the number of actual incidents dropped.
• 30% of the product safety investigations initiated by ESA in 2012 were as a result of the mandatory reporting requirements of Regulation 438/07.
• ESA assigns an investigation type and priority category to all ESA reported incidents in order to determine the proper response strategy. 59% of safety issues were classified as priority level 2 meaning based upon the results of the investigation, ESA may direct a range of corrective action plans to assure that no further serious electrical incidents or accidents occur.
• Product safety investigations are classified into three major categories: Unapproved (a product that does not meet labelling criteria but may not necessarily be unsafe), Certified (a product that was properly certified but reported to have a safety problem or perceived safety problem), and products with a suspected counterfeit label. In 2013, 57% of product safety investigations involved certified products.
Product Safety
5.0
5.1
2013 Ontario Electrical Safety Report 63

5.0
5.1
Case Study
5.1 Case Study
5.1 Case Study: Tray DehydratorESA’s Product Safety group received a report from a consumer about an alleged fire with a dehydrator after about 14 minutes of use with a newly purchased unit. Very little information regarding the product was available to ESA as the consumer had returned the damaged unit to the supplier for a replacement.
Additional information was requested by ESA and it was determined from the information received that the dehydrator was approved by a certification body (CB), was manufactured abroad and imported by a Canadian distributor. The ESA database was used to confirm if there were similar incidents involving this dehydrator; none were found. Based on the severity of the incident, the investigation was assigned a risk assessment of priority 2.
The product was also being investigated by the United States Consumer Product Safety Commission (CPSC) as there had been some reported incidents of fire. ESA advised the distributor that if the CPSC decided to publish a public notice for the dehydrator, the ESA would follow suit. The distributor informed ESA that CPSC would be publishing a public recall notice. A joint release between CPSC, Health Canada and ESA was arranged and the recall notice was posted on all websites simultaneously on May 2, 2013.
ESA continued to monitor the recall process for a year after the notice was published by requesting monthly monitoring reports to be submitted.
ESA closed its file for this investigation on May 29, 2014 after advising the distributor to continue honouring the recall notice for the foreseeable future.
64 2013 Ontario Electrical Safety Report

AcknowledgementsThis report would not be possible without the assistance of the many industry partners who share data. ESA acknowledges and thanks the Ontario Ministry of Labour (MOL) for providing information, notifying ESA of occupational electrical injuries and cooperating with ESA in the investigation of these incidents.
ESA thanks the Office of the Fire Marshal and Emergency Management (OFMEM) for its continuing support in providing information on fire-related electrical incidents, partnering with ESA on stove-top fire initiatives, and notifying ESA of electrical fire incidents.
ESA also thanks the following organizations for their support:
• The Coroner’s Office of Ontario for sharing coroner’s information on electrical-related fatalities and other deaths in Ontario;
• The Workers Safety Insurance Board of Ontario (WSIB) and the Association of Workers’ Compensation Boards of Canada (AWCBC) for providing occupational injury information; and
• The Canadian Institute for Health Information (CIHI) for providing information on emergency department visits for electrical injury;
Development of this report was led by a team from ESA including Joel Moody, Francis Hardy, Said Ismail and Jenifer Robertson, with assistance from staff of ESA’s Utility Regulations, Product Safety and Communications departments.
MethodologyESA receives data from various resources to compile this report. These include the Coroner, Ministry of Labour (MOL), the Association of Workers’ Compensation Boards of Canada (AWCBC), the Office of the Fire Marshal (OFMEM), and the Workers Safety Insurance Board of Ontario (WSIB). ESA cross-references these data with the Coroner reports, the OFMEM’s report and ESA’s root-cause investigation data to ensure accuracy and understanding of the incidents. Data on non-serious incidents are taken as provided.
ESA also uses population data from Statistics Canada to determine electrocution and death by fire as rate per population and rate per labour population to determine occupational injury rates.
The 2004 to 2013 electrocution statistics are based on Ontario Coroner’s reports, ESA records, and the Ministry of Labour’s (MOL) reports. At the time of writing, the Coroner’s reports for 2012 and 2013 are only partially completed due to pending investigations and confirmations.
Data provided by the Office of the Chief Coroner takes precedence over other data in the event of discrepancies.
The electrocution and electrical burn fatality cases in the report are unintentional in nature. Suicides, deliberate attempt to injure, are all excluded; as well as death by lightning strike. Electrocution as a result of criminal activities such as theft of power, vandalism, pranks or as a result of a vehicle hitting a utility pole are counted as part of the statistics but are not included as part of the preventable
2013 Ontario Electrical Safety Report 65

deaths. Death resulting from a fall but initiated by an electrical contact to a worker would not be recorded as an electrical-related fatality and therefore not counted as part of electrical injury data.
The report separates occupational from non-occupational (the general public) incidents for reason of stakeholder interest and to aid in identifying strategies to reduce the harm.
Case definition
Lost Time Injuries
Lost time injury data were provided by the Workplace Safety and Insurance Board Enterprise Information Warehouse, data as at March 31, 2014 for all injury years. Lost Time Injuries (LTIs) refers to all allowed claims by workers who have lost wages as a result of a temporary or permanent impairment. Lost Time Injury counts include fatalities.
Allowed Lost Time Injuries for Electrical Burns and Electrical-related fatalities are based on the following CSA Z795-96 Nature of Injury Codes:
• 05200 ELECTRICAL BURNS
• 05201 FIRST-DEGREE ELECTRICAL BURNS
• 05202 SECOND-DEGREE ELECTRICAL BURNS
• 05203 THIRD-DEGREE ELECTRICAL BURNS
• 05290 ELECTRICAL BURNS, N.E.C.
• 09300 ELECTROCUTIONS, ELECTRIC SHOCKS
Please note that since the data is as of March 31, 2014 for all injury years (2004-2013), the earlier years are more mature than the more recent years.
Emergency Department Visits
Separations data from the National Ambulatory Care Reporting System were provided by the Canadian Institute for Health Information (CIHI). Emergency Department separation data used in this report are classified according to the Canadian Modification of the 10th revision of the International Classification of Diseases (ICD-10-CA).
The inclusion criterion for the report was the presence of T75.4, T75.0, W85, W86, W87, or X33 codes indicating an electrical injury including being a victim of lightning, among any of the diagnosis or external cause codes assigned to a record.
Reliability of Data
The numbers and figures in this report are based on current information provided to ESA as of July 31, 2014.
Parts of this material are based on data and information provided by the Canadian Institute for Health Information. However, the analyses, conclusions, opinions and statements expressed herein are those of the author, and not necessarily those of the Canadian Institute for Health Information.
These numbers may change in subsequent reports due to additional information received after the publication of the report. These changes and explanations will be noted in future reports.
66 2013 Ontario Electrical Safety Report

Fire Source DataThe OFMEM reports its data by calendar year. Data collection and verification for the year has a one year lag in reporting in the OESR. The OFMEM does not publish Ontario statistics until all fire departments have reported. The larger departments — Toronto and Hamilton generally do not finish their filing until September of the following year. At the time of writing, some OFMEM data for 2013 is not available and data for 2012 is presented instead.
ESA reports fire incidents based on data provided by the OFMEM to ESA on:
• all fires where the fuel of the ignition source was reported as electricity
• fire incidents investigated by OFMEM
In addition, ESA conducts its own investigation of fires when called by the local fire department to assist or when jointly investigating fire incidents with the OFMEM. ESA presents data that are consistent with the reporting convention of the OFMEM. Fires are reported by ignition source where the fuel of the ignition source was reported as electricity. It is worth noting that with the exception of fires with distribution equipment and fires identified as electricity as the ignition source by the fire departments or OFMEM, electricity was not the primary fuel associated with the fire. These situations are illustrated below.
In the OESR, these fires will be categorized into two types of fires. These are:
1. Fires caused by the ignition of combustibles (liquid and solids) around an electrical device, equipment, appliance or installation, but were not the direct result of a failure of electrical equipment or devices or electrical current or arc flash coming into contact with the object. When the primary fuel associated with the fire is not electricity (such as leaving a stove unattended with the oil catching fire), the OFMEM label these fires as cooking fires rather than electrical fires. In addition, the OFMEM does not recommend using numbers of fire deaths to identify trend and key issues.
Typically, these types of fire were the direct result of misuse of the equipment, device or appliance. Some examples of these types of fires are:
• grease fires on an electrical stove top as a result of cooking left unattended;
• clothing catching fire while cooking;
• clothes dryer catching fire caused by the appliance overheating due to improper cleaning of the lint cache; and
• combustible catching fire around heaters or electronics when they are placed too close to the heat source.
2013 Ontario Electrical Safety Report 67

2. Fires caused by the ignition of combustibles around an electrical device, equipment, appliance or installation and were the direct result of the failure of the device, equipment or installation. In these cases, typical fires are caused by insulation surrounding electrical wiring failing and igniting a combustible in close proximity, or equipment or devices failing, causing them to overheat and later, start a fire. Insulation failure could be caused by natural aging, premature aging resulting from overloading, or by mechanical breakdown of the insulation. Fires related to wiring and wiring devices are classified by the OFMEM as distribution equipment. Please note that the definition of distribution equipment in the fire section is quite different than the distribution equipment in the powerline section of the report. Examples of these fires are:
• Carpet igniting caused by heat build-up of an extension cord placed under a carpet. Over time the insulation of the extension cord fails due to foot traffic on the cord which leads to mechanical breakdown of the insulation.
• Electrical wires poorly terminated and an installation performed without using any protective enclosure. Arcing occurs over time resulting in a fire of combustibles around the wires.
• Fire caused by a failure of a seized motor powered by electricity.
In the fire section of the OESR, ESA uses OFMEM’s method of categorizing types of ignition source class. By OFMEM’s definition, distribution equipment are electrical wiring, devices or equipment whose primary function is to carry electrical current from one location to another. Thus, wiring, extension cord, termination, electrical panel, cord on appliances are considered distribution equipment. Please note that distribution equipment defined by the OFMEM is not the same as Distribution Equipment defined by the Local Distribution Companies.
68 2013 Ontario Electrical Safety Report
Bibliography Ahrens, M. (2007). Home Structure Fires. Report produced for the Fire Analysis and Research Division, National Fire Protection Association, Quincy: MA.
Asgary, A., Ghaffari, A., & Levy, J. (2010). Spatial and temporal analyses of structural fire incidents and their causes: A case of Toronto, Canada. Fire Safety Journal, 45(1), 44-57.
Baker, D.E. & Adams, P. (1993). Residential Fire Detection. University Extension, University of Missouri-Columbia: Columbia.
Berry JG Harrison JE 2006. Hospital separations due to injury and poisoning, Australia 2001–02. Injury Research and Statistics Series Number 26. (AIHW cat. no. INJCAT 78) Adelaide: AIHW.
Byard RW, Hanson KA, Gilbert JD, James RA, Nadeau J, Blackbourne B, & Krous HF 2003. Death due to electrocution in childhood and early adolescence. Journal of Paediatric Child Health 39: 46–48.
Celik A, Ergun O & Ozok G 2004. Pediatric electrical injuries: A review of 38 consecutive patients. Journal of Pediatric Surgery 39 (8):1233–7.
Council of Canadian Fire Marshals. (2002). Annual Report: Fire Losses in Canada. Council of Canadian Fire Marshals and Fire Commissioners: Ottawa.
Diekman, S.T., Ballesteros, M.F., Berger, L.R., Caraballo, R.S., & Kegler, S.R. (2008). Ecological level analysis of the relationship between smoking and residential-fire mortality. Injury Prevention, 14: 228-231.
Driscoll TR, Mitchell RJ, Hendrie AL, Healey SH, Mandryk JA, and Hull BP 2003. Unintentional fatal injuries arising from unpaid work at home. Injury Prevention 9:15–19.
Duff K & McCaffrey RJ 2001. Electrical injury and lightning injury: A review of their mechanisms and psychiatric, and neurological sequelae. Neuropsychology Review 11 (2):101–116.
Duncanson, M. (2001). Cooking, Alcohol and Unintentional Fatal Fires in New Zealand Homes 1991-1997. Produced for the New Zealand Fire Service Commission Research Report Number 16.
Fatality Assessment and Control Evaluation (FACE) Project Protocol [1991]. Morgantown, WV: Division of Safety Research, National Institute for Occupational Safety and Health.
George E N, Schur K, Muller M, Mills S & Brown T L H 2005. Management of high voltage electrical injury in children. Burns 31 (4):439–44.
Hall, J.R. (2008). Home Fires Involving Cooking Equipment: Executive Summary. National Fire Protection Association, Fire Analysis and Research Division: Quincy, M.A.
Karter, M.J. (2007). Fire Loss in the United States during 2006. National Fire Protection Association, Fire Analysis and Research Division: Quincy, M.A.
Koumbourlis AC 2002. Electrical Injuries. Critical Care Medicine 30 (11 (Suppl.)):S424–30.
2013 Ontario Electrical Safety Report 69

Leistikow, B.N., Martin, D.C., & Milano, C.E. (2000). Fire injuries, disasters, and costs from cigarettes and cigarette lights: A global overview. Preventive Medicine, 31: 91-99.
Miller, I. (2005). Human Behaviour Contributing to Unintentional Residential Fire Deaths 1997-2003. New Zealand Fire Service Commission Research Report Number 47.
Nguyen BH, MacKay M, Bailey B, & Klassen TP 2004. Epidemiology of electrical and lightning related deaths and injuries among Canadian children and youth. Injury Prevention 10: 122–124.
Ontario Fire Marshal. (2009). Reducing Residential Stovetop Fires In Ontario:Toronto.
Stergiou-Kita, M, Mansfield E, Bayley M, Cassidy JD, et al (2014). Returning to Work Following Electrical Injuries: Workers’ Perspectives and Advice to Others. J Burn Care Res 2014 Aug 5. doi: 10.1097/BCR.0000000000000041. [Epub ahead of print].
Taylor AJ, McGwin G Jr, Valent F, Rue LW 3rd 2002. Fatal occupational electrocutions in the United States. Injury Prevention 8 (4):306-12.
Theman K, Singerman J, Gomez M, Fish JS (2008). Return to work after low voltage electrical injury. J Burn Care Res;29(6):959-64.
Wesner, M. L., & Hickie, J. (2013). Long-term sequelae of electrical injury. Canadian family physician, 59(9), 935-939.
70 2013 Ontario Electrical Safety Report

GlossaryCIHI – Canadian Institute of Health Information, a subsidiary of Health Canada, a not-for-profit organization responsible for collecting all health information across Canada.
Cost of Injury – Cost of injury as calculated by the WSIB in compensation, medical aid and pension.
CTAS – The Canadian Triage & Acuity Scale—a tool that enables Emergency Departments (ED) to triage patients and perform rapid patient assessment. The CTAS levels are designed such that level 1 represents the sickest patient and level 5 represents the least ill patient.
Distribution equipment (fire section) – Electrical equipment or device carrying electricity from one point to another, or electrical equipment or devices that connect or disconnect one conductor to another.
Electrical Apprentice – A worker who has yet to satisfy academic and field experience to become an electrician journeyperson.
Electrician – A worker whose occupation is identified as working primarily with low voltage electricity. Electricians in this report can be someone designated by the employer to perform low-voltage electrical work.
Electrical-Related Fatality – All deaths resulting from electrocutions and electrical burns.
Electrocution – An accidental death, caused by contact with electricity.
Fatality – An injury resulting in a death.
High Resistance Fault – Long-lived events in which the fault current is not high enough to trip the circuit overcurrent protection.
High Voltage – An electrical system with the load (voltage) equal or greater than 750V.
Human error – An inappropriate or undesired human decision or behaviour that reduces or has the potential to reduce the safety or system performance.
IHSA – Infrastructure Health & Safety Association —the developer and provider of prevention solutions for work environments involving high-risk activities such as working at heights or working with high
voltage electricity. IHSA was formed in January 2010 by amalgamating the Construction Safety Association of Ontario (CSAO), the Electrical & Utilities Safety Association of Ontario (E&USA), and Transportation Health and Safety Association of Ontario (THSAO).
Lineperson – A worker whose occupation is identified as someone working with high voltage electricity.
Low Voltage – An electrical system with the load (voltage) of less than 750V.
LTI – Lost Time Injury, a term defined by the WSIB for an occupational injury that resulted in a worker missing more than one shift of work.
MOL – Ministry of Labour of Ontario
NACRS – The National Ambulatory Care Reporting System contains data for hospital-based and community-based emergency and ambulatory care (for example, day surgery and outpatient clinics).
Non-occupational injuries – Injuries occurring in a location other than in the workplace.
NWISP – National Work Injuries and Statistics Program, an organization that serves as a repository of all occupational injuries in Canada.
Occupational Injury – An injury occurring in a workplace.
OFMEM – The Office of the Fire Marshal, a provincial organization responsible for the prevention of fires in Ontario.
Powerline – Outside/outdoor electrical cable or wire, used to distribute electrical energy.
Traumatic Injury – Injury as a result of a sudden or violent act.
Utility-related Equipment – Refers to electrical equipment and devices used by Local Distribution Companies or privately-owned companies to distribute electricity to the general public or to buildings owned by the private companies.
WSIB – Workplace Safety and Insurance Board, an organization responsible for compensation of workplace injuries.
2013 Ontario Electrical Safety Report 71

This document was prepared by the Regulatory Division of the Electrical Safety Authority.
For queries and additional information, please contact Joel Moody at [email protected]