Embed Size (px)
Citation preview

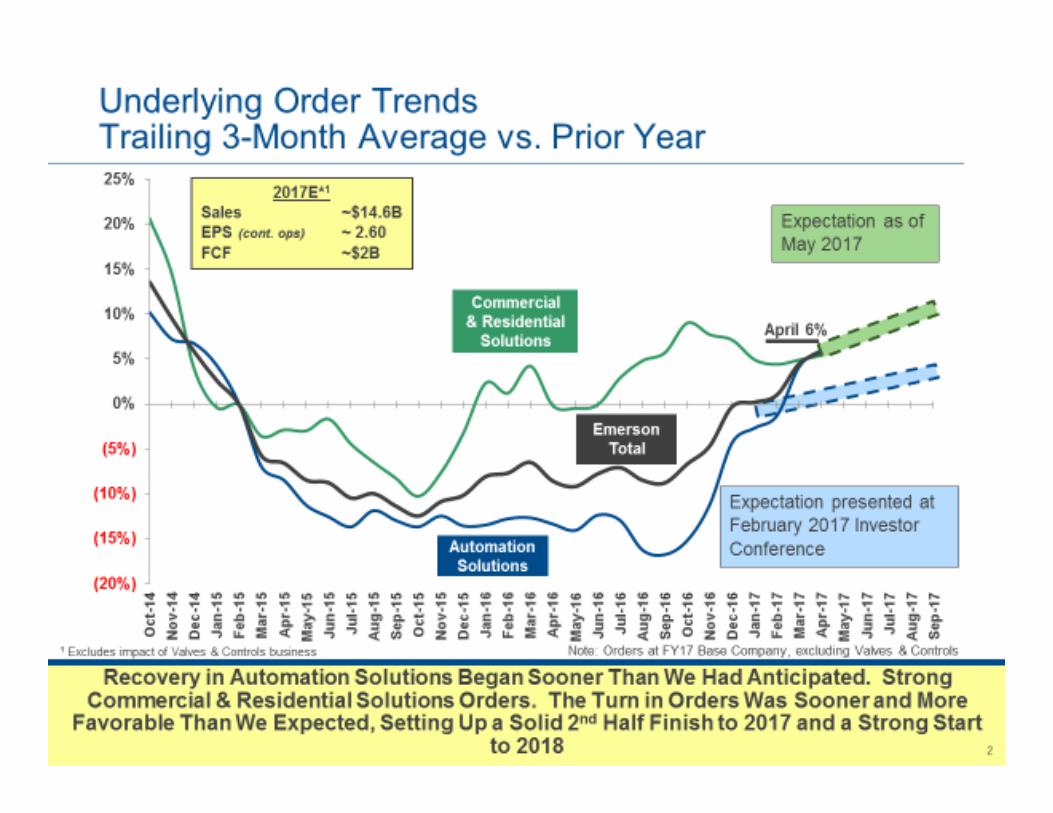
1
Electrical Products Group ConferenceMay 24, 2017
Safe Harbor Statement
Our commentary and responses to your questions may contain forward-looking statements, including our outlook for the remainder of the year, and Emerson undertakes no obligation to update any such statements to reflect later developments. Factors that could cause actual results to vary materially from those discussed today are provided in our most recent Annual Report on Form 10-K and subsequent reports as filed with the SEC.
Non-GAAP Measures
In this call we will discuss some non-GAAP measures (denoted with *) in talking about our company’s performance, and the reconciliation of those measures to the most comparable GAAP measures is contained within this presentation or available at our website www.Emerson.com under Investors.
2Insert footer or confidential information here if needed.
3
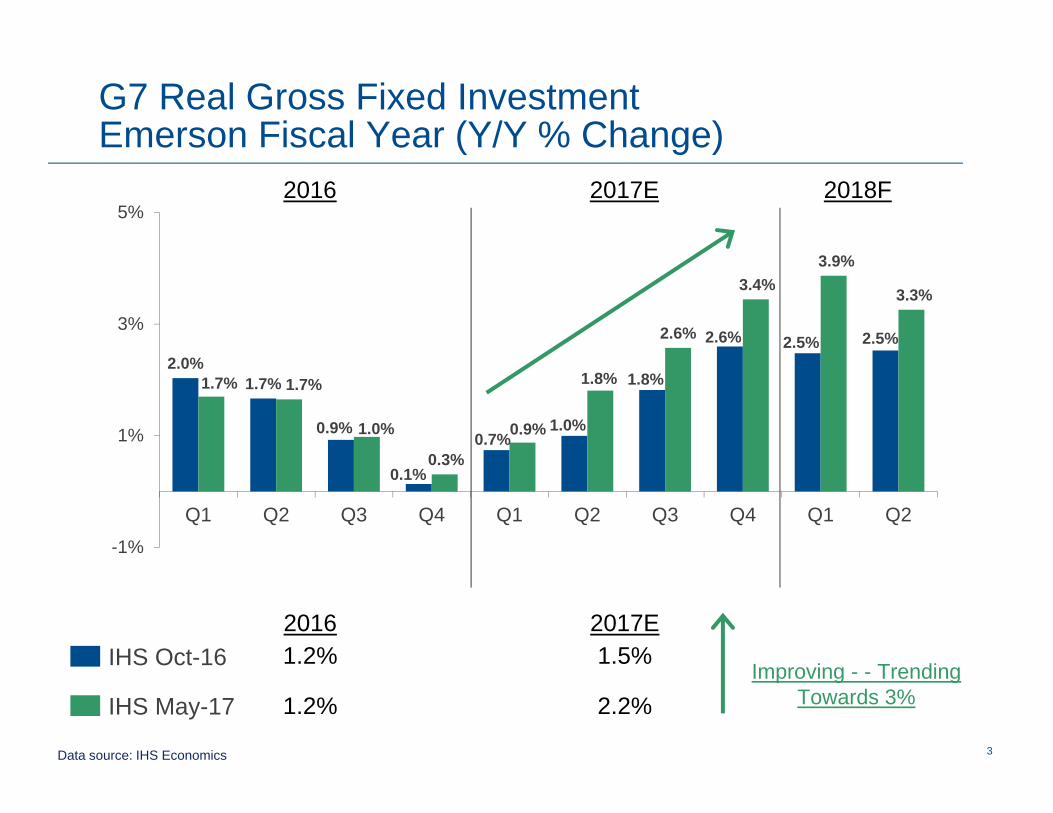
2.0%1.7%
0.9%
0.1%
0.7%1.0%
1.8%
2.6% 2.5% 2.5%
1.7% 1.7%
1.0%
0.3%
0.9%
1.8%
2.6%
3.4%3.9%
3.3%
-1%
1%
3%
5%
Q1 Q2 Q3 Q4 Q1 Q2 Q3 Q4 Q1 Q2
IHS Oct-16
G7 Real Gross Fixed InvestmentEmerson Fiscal Year (Y/Y % Change)
2016 2017E
Data source: IHS Economics
2016 2017E1.5%1.2%
2018F
IHS May-17 2.2%1.2%Improving - - Trending
Towards 3%
4
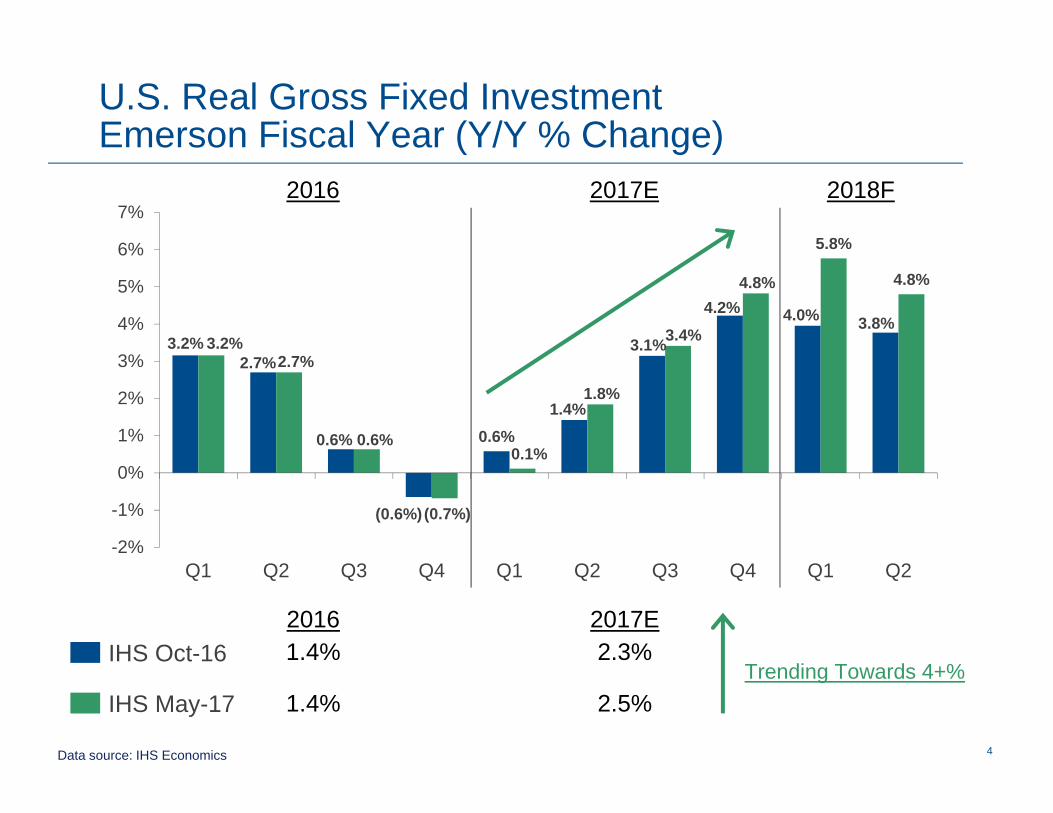
3.2%2.7%
0.6%
(0.6%)
0.6%1.4%
3.1%
4.2% 4.0% 3.8%3.2%
2.7%
0.6%
(0.7%)
0.1%
1.8%
3.4%
4.8%
5.8%
4.8%
-2%
-1%
0%
1%
2%
3%
4%
5%
6%
7%
Q1 Q2 Q3 Q4 Q1 Q2 Q3 Q4 Q1 Q2
U.S. Real Gross Fixed Investment Emerson Fiscal Year (Y/Y % Change)
2016 2017E
Data source: IHS Economics
2016 2017E2.3%1.4%
2018F
2.5%1.4%
IHS Oct-16
IHS May-17Trending Towards 4+%
5
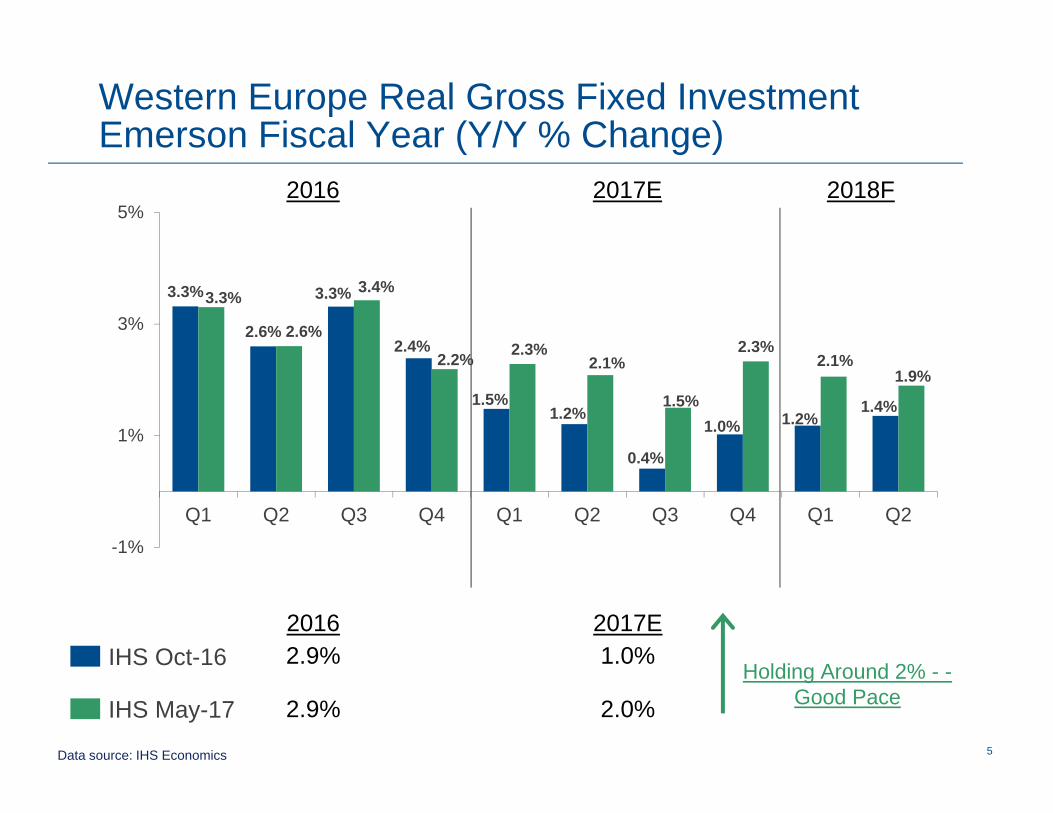
3.3%
2.6%
3.3%
2.4%
1.5%1.2%
0.4%
1.0% 1.2%1.4%
3.3%
2.6%
3.4%
2.2% 2.3%2.1%
1.5%
2.3%2.1%
1.9%
-1%
1%
3%
5%
Q1 Q2 Q3 Q4 Q1 Q2 Q3 Q4 Q1 Q2
Western Europe Real Gross Fixed Investment Emerson Fiscal Year (Y/Y % Change)
2016 2017E
Data source: IHS Economics
2016 2017E1.0%2.9%
2018F
2.0%2.9%
IHS Oct-16
IHS May-17Holding Around 2% - -
Good Pace
66
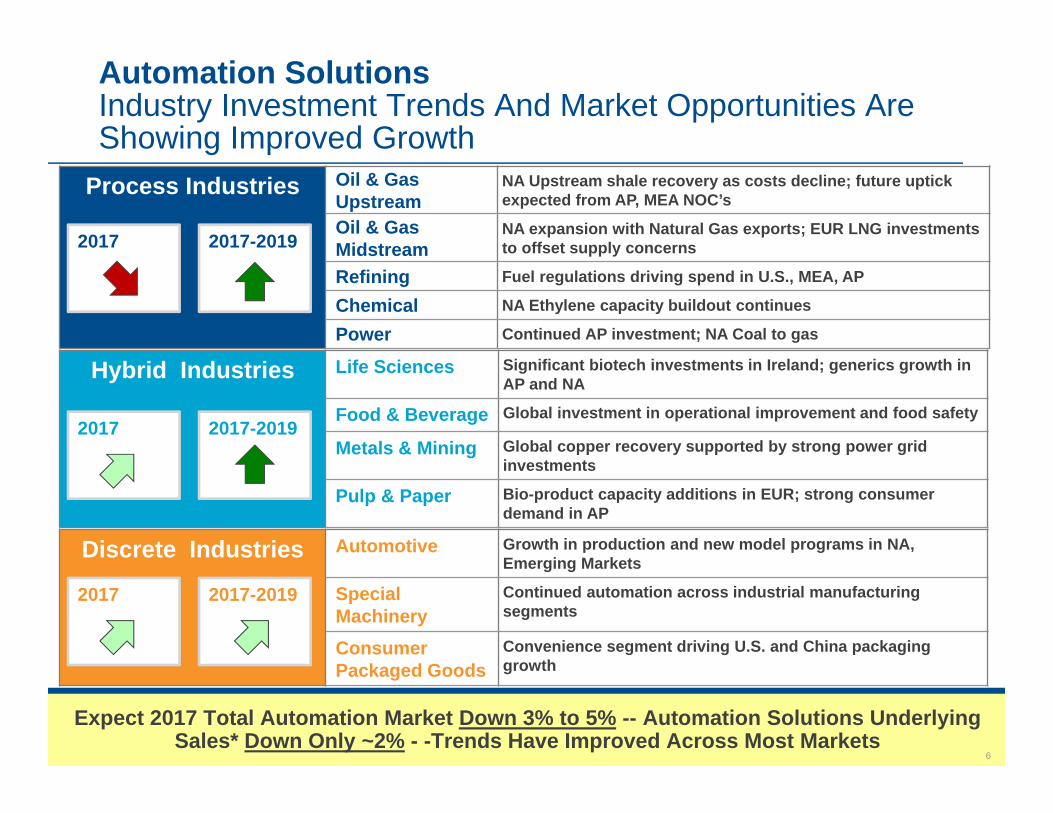
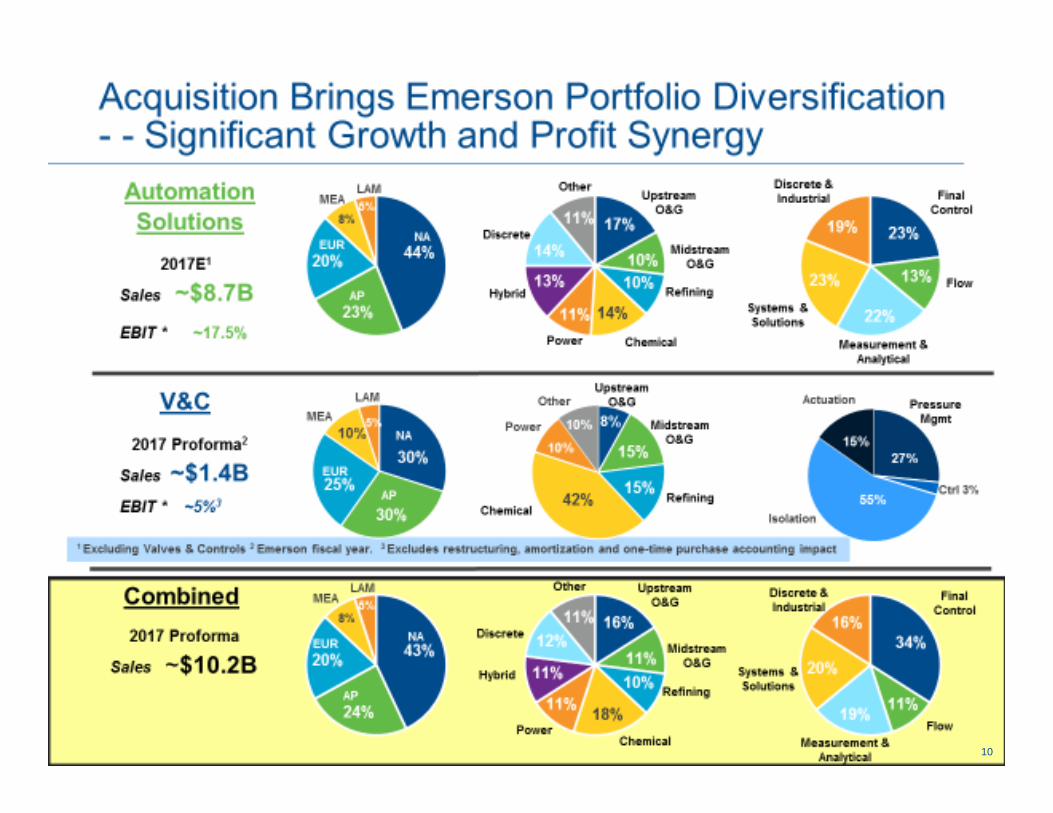
Automation SolutionsIndustry Investment Trends And Market Opportunities Are Showing Improved Growth
Process Industries Oil & Gas Upstream
NA Upstream shale recovery as costs decline; future uptick expected from AP, MEA NOC’s
Oil & Gas Midstream
NA expansion with Natural Gas exports; EUR LNG investments to offset supply concerns
Refining Fuel regulations driving spend in U.S., MEA, AP
Chemical NA Ethylene capacity buildout continues
Power Continued AP investment; NA Coal to gas
2017 2017-2019
Expect 2017 Total Automation Market Down 3% to 5% -- Automation Solutions Underlying Sales* Down Only ~2% - -Trends Have Improved Across Most Markets
Hybrid Industries Life Sciences Significant biotech investments in Ireland; generics growth in AP and NA
Food & Beverage Global investment in operational improvement and food safety
Metals & Mining Global copper recovery supported by strong power grid investments
Pulp & Paper Bio-product capacity additions in EUR; strong consumer demand in AP
2017 2017-2019
Discrete Industries Automotive Growth in production and new model programs in NA, Emerging Markets
Special Machinery
Continued automation across industrial manufacturing segments
Consumer Packaged Goods
Convenience segment driving U.S. and China packaging growth
2017 2017-2019
77
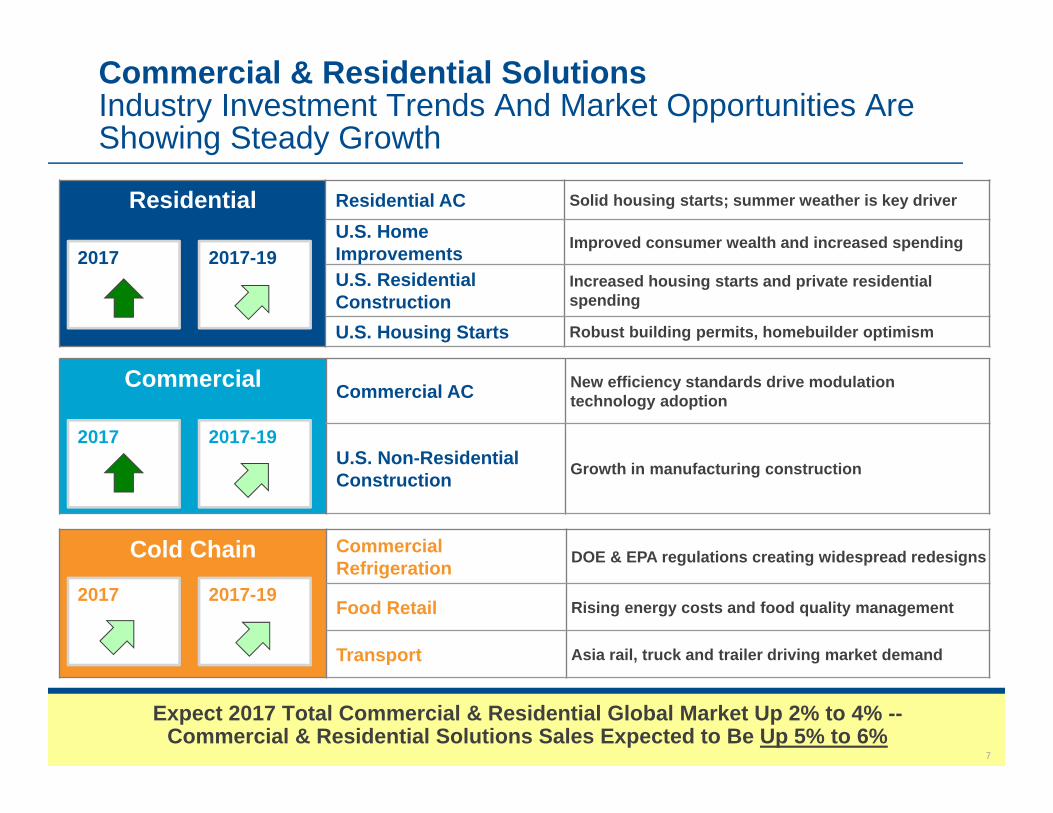
Commercial & Residential SolutionsIndustry Investment Trends And Market Opportunities Are Showing Steady Growth
Residential Residential AC Solid housing starts; summer weather is key driver
U.S. Home Improvements Improved consumer wealth and increased spending
U.S. Residential Construction
Increased housing starts and private residential spending
U.S. Housing Starts Robust building permits, homebuilder optimism
2017 2017-19
Expect 2017 Total Commercial & Residential Global Market Up 2% to 4% --Commercial & Residential Solutions Sales Expected to Be Up 5% to 6%
Commercial Commercial AC New efficiency standards drive modulation technology adoption
U.S. Non-Residential Construction Growth in manufacturing construction
2017 2017-19
Cold Chain Commercial Refrigeration DOE & EPA regulations creating widespread redesigns
Food Retail Rising energy costs and food quality management
Transport Asia rail, truck and trailer driving market demand
2017 2017-19
88
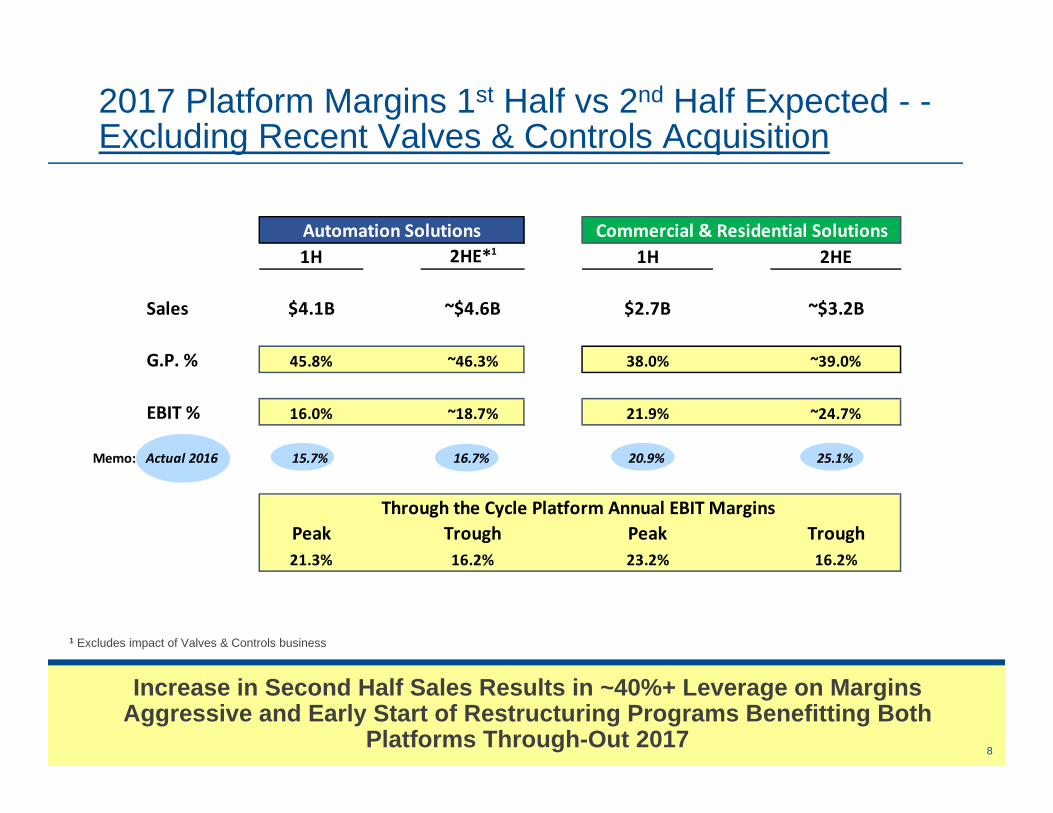
2017 Platform Margins 1st Half vs 2nd Half Expected - -Excluding Recent Valves & Controls Acquisition
Increase in Second Half Sales Results in ~40%+ Leverage on Margins Aggressive and Early Start of Restructuring Programs Benefitting Both
Platforms Through-Out 2017
1 Excludes impact of Valves & Controls business
1H 2HE*1 1H 2HE
Sales $4.1B ~$4.6B $2.7B ~$3.2B
G.P. % 45.8% ~46.3% 38.0% ~39.0%
EBIT % 16.0% ~18.7% 21.9% ~24.7%
Memo: Actual 2016 15.7% 16.7% 20.9% 25.1%
Peak Trough Peak Trough21.3% 16.2% 23.2% 16.2%
Automation Solutions Commercial & Residential Solutions
Through the Cycle Platform Annual EBIT Margins
99
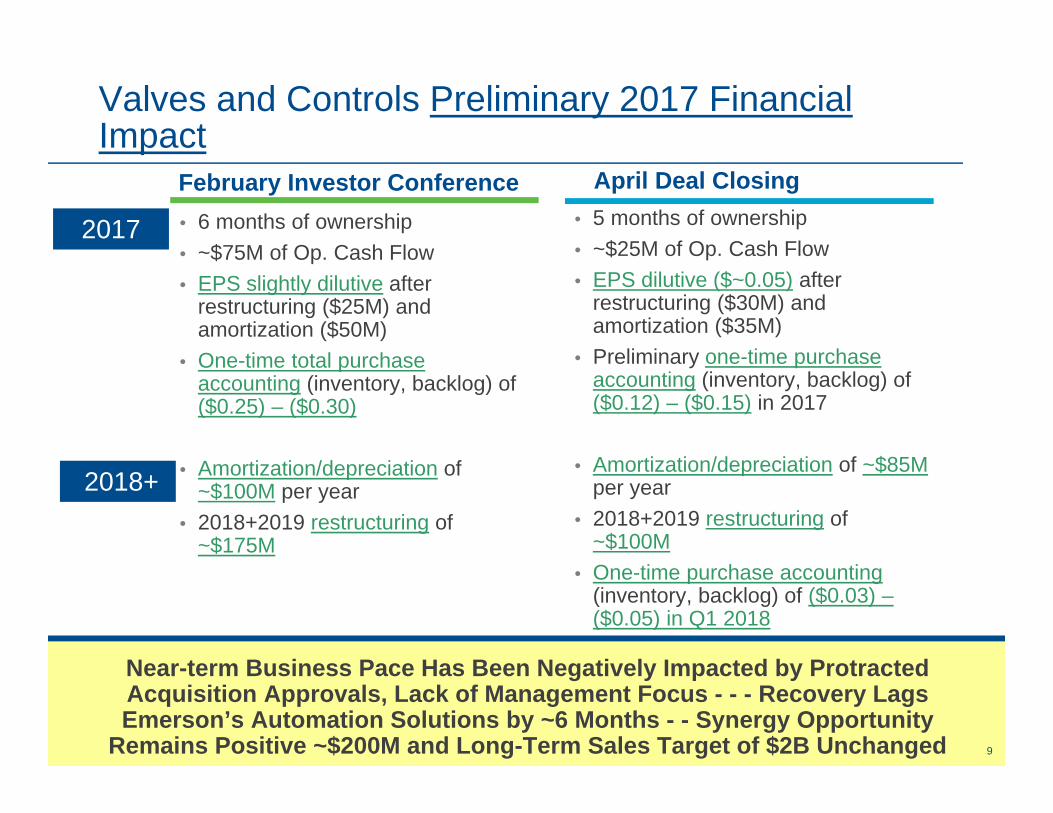
Valves and Controls Preliminary 2017 Financial Impact
February Investor Conference• 5 months of ownership• ~$25M of Op. Cash Flow• EPS dilutive ($~0.05) after
restructuring ($30M) and amortization ($35M)
• Preliminary one-time purchase accounting (inventory, backlog) of ($0.12) – ($0.15) in 2017
• Amortization/depreciation of ~$85Mper year
• 2018+2019 restructuring of ~$100M
• One-time purchase accounting(inventory, backlog) of ($0.03) –($0.05) in Q1 2018
April Deal Closing• 6 months of ownership• ~$75M of Op. Cash Flow• EPS slightly dilutive after
restructuring ($25M) and amortization ($50M)
• One-time total purchase accounting (inventory, backlog) of ($0.25) – ($0.30)
• Amortization/depreciation of ~$100M per year
• 2018+2019 restructuring of ~$175M
Near-term Business Pace Has Been Negatively Impacted by Protracted Acquisition Approvals, Lack of Management Focus - - - Recovery Lags Emerson’s Automation Solutions by ~6 Months - - Synergy Opportunity
Remains Positive ~$200M and Long-Term Sales Target of $2B Unchanged
2017
2018+
1010
11
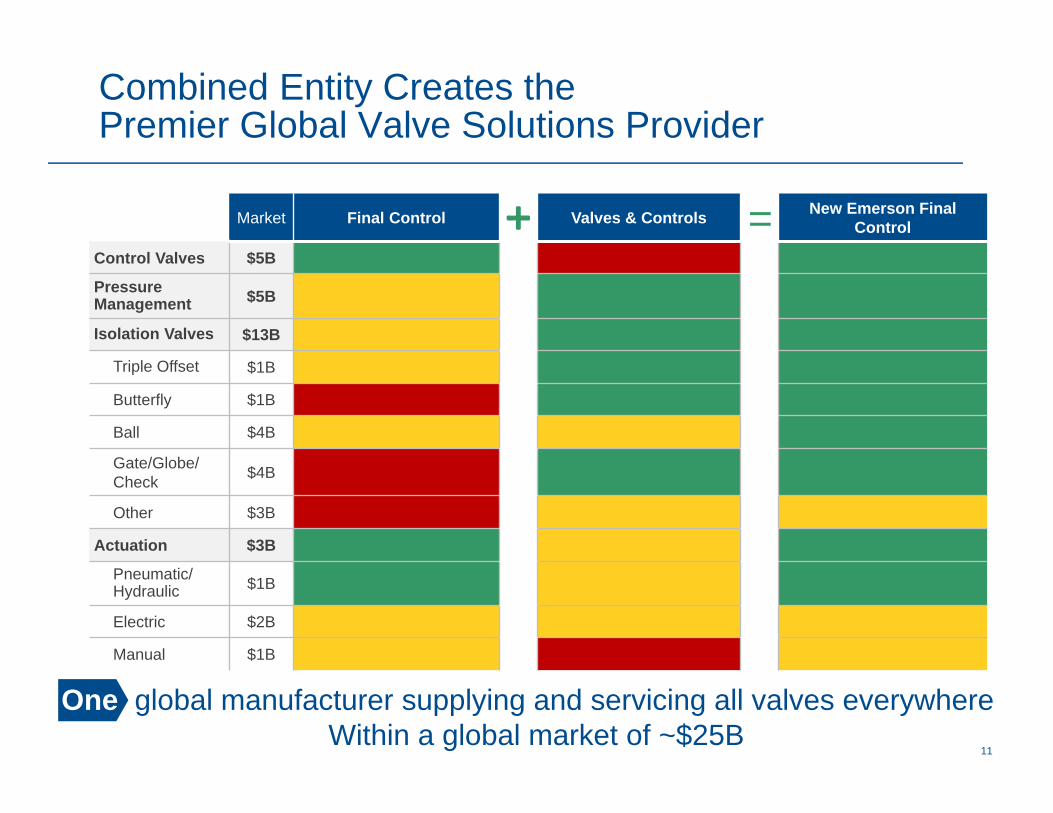
Market Final Control Valves & Controls New Emerson Final Control
Control Valves $5B
Pressure Management $5B
Isolation Valves $13B
Triple Offset $1B
Butterfly $1B
Ball $4B
Gate/Globe/ Check $4B
Other $3B
Actuation $3B
Pneumatic/ Hydraulic $1B
Electric $2B
Manual $1B
Combined Entity Creates the Premier Global Valve Solutions Provider
One global manufacturer supplying and servicing all valves everywhereWithin a global market of ~$25B
=
12
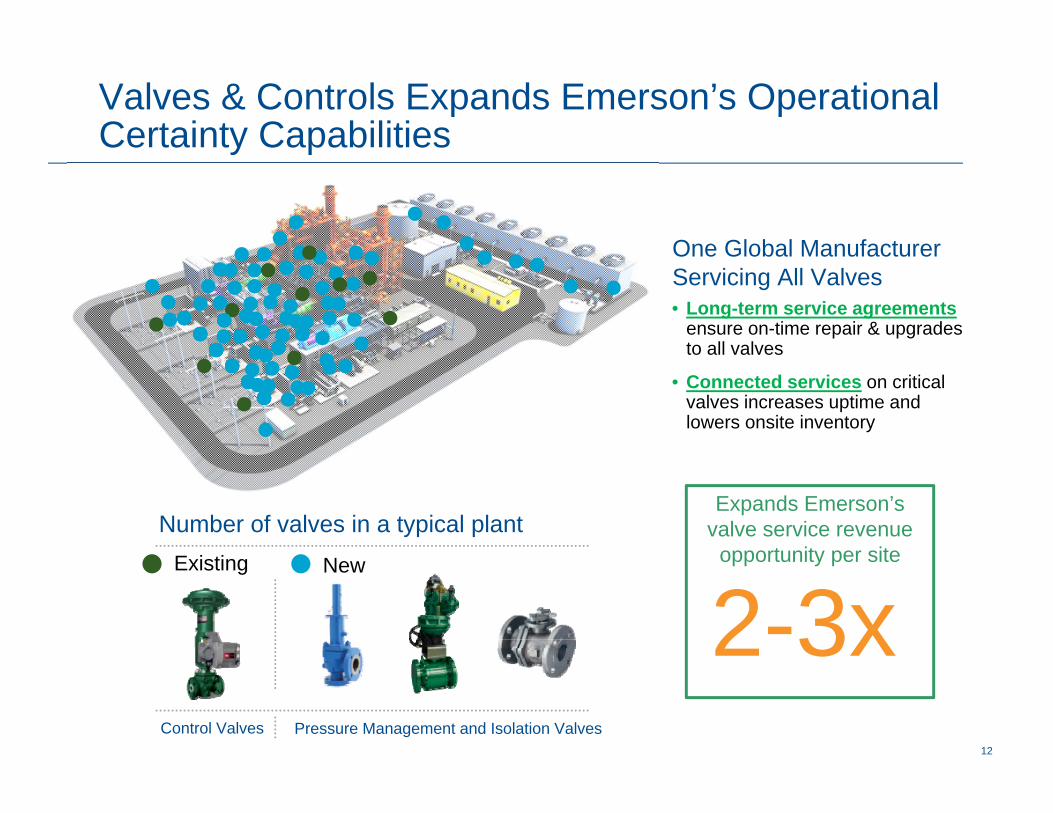
Valves & Controls Expands Emerson’s Operational Certainty Capabilities
• Long-term service agreementsensure on-time repair & upgrades to all valves
• Connected services on critical valves increases uptime and lowers onsite inventory
One Global Manufacturer Servicing All Valves
Control Valves Pressure Management and Isolation Valves
Number of valves in a typical plant Expands Emerson’s
valve service revenue opportunity per site
2-3xNewExisting
1313
Emerson Is Now Strongly Positioned to Return to Premium Value and “Rise To The New Challenge”• We have endured an immensely challenging global market over the past 3
years; growth recovering in 2017 -- solid start with first half performance - - expect 2nd half growth in sales and earnings
• We have executed very difficult multi-year restructuring actions --now strongly positioned to expand margins and rebuild our premium valuation
• We have finalized necessary strategic repositioning actions to position Emerson for premium growth and sustainability in the future – solid execution has resulted in outperformance in both business platforms
• We have successfully executed the repositioning plan -- completed the sale of Network Power, Leroy-Somer, and Control Techniques and acquired Pentair Valves and Controls
We Expect a Solid 2nd Half Finish to 2017, Increased Sales and Earnings - - Well Positioned for Growth in 2018
1414
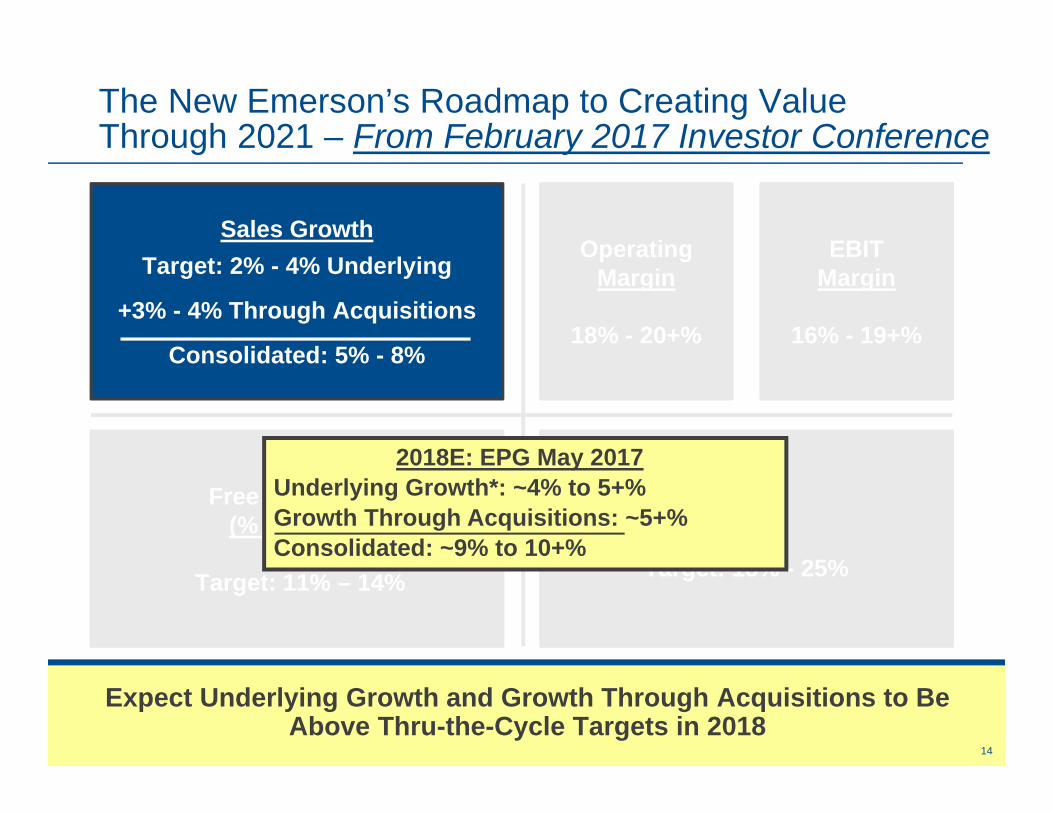
ROTC
Target: 18% - 25%
The New Emerson’s Roadmap to Creating Value Through 2021 – From February 2017 Investor Conference
Expect Underlying Growth and Growth Through Acquisitions to Be Above Thru-the-Cycle Targets in 2018
Sales GrowthTarget: 2% - 4% Underlying
+3% - 4% Through Acquisitions
Consolidated: 5% - 8%
Free Cash Flow(% of Sales)
Target: 11% – 14%
Operating Margin
18% - 20+%
EBIT Margin
16% - 19+%
2018E: EPG May 2017Underlying Growth*: ~4% to 5+%Growth Through Acquisitions: ~5+%Consolidated: ~9% to 10+%

15

16
17
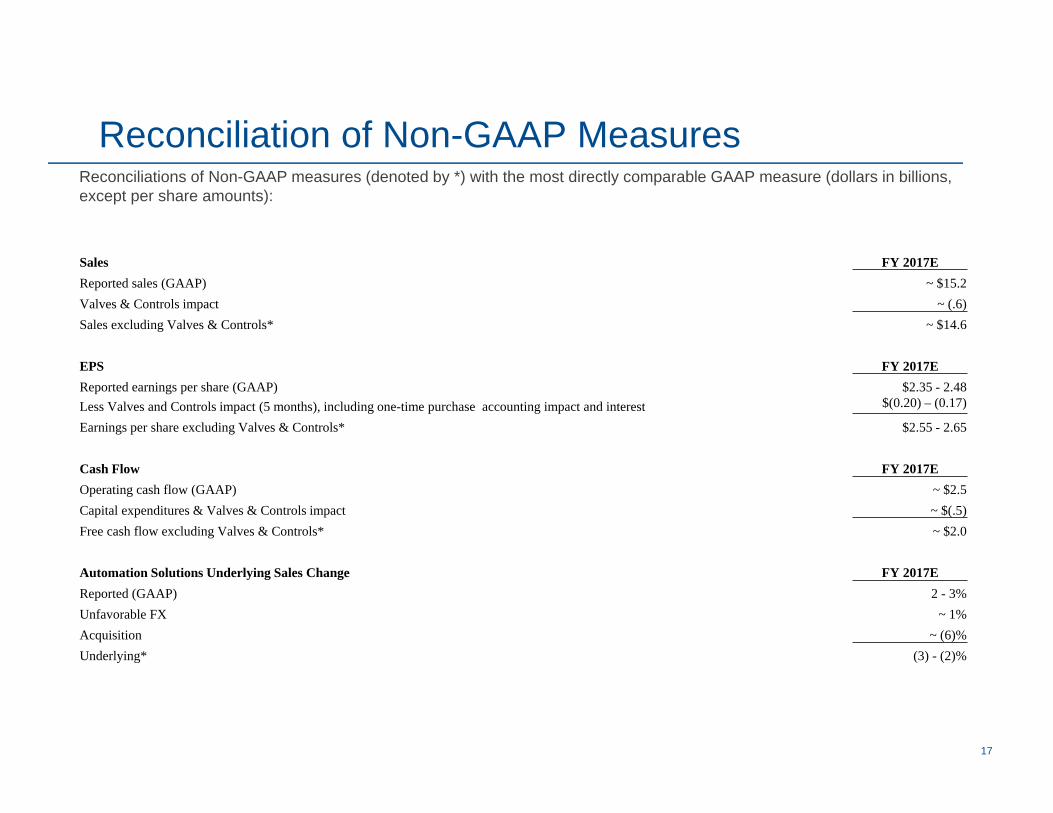
Reconciliation of Non-GAAP MeasuresReconciliations of Non-GAAP measures (denoted by *) with the most directly comparable GAAP measure (dollars in billions, except per share amounts):
Sales FY 2017EReported sales (GAAP) ~ $15.2 Valves & Controls impact ~ (.6) Sales excluding Valves & Controls* ~ $14.6
EPS FY 2017EReported earnings per share (GAAP) $2.35 - 2.48 Less Valves and Controls impact (5 months), including one-time purchase accounting impact and interest $(0.20) – (0.17)
Earnings per share excluding Valves & Controls* $2.55 - 2.65
Cash Flow FY 2017EOperating cash flow (GAAP) ~ $2.5 Capital expenditures & Valves & Controls impact ~ $(.5) Free cash flow excluding Valves & Controls* ~ $2.0
Automation Solutions Underlying Sales Change FY 2017EReported (GAAP) 2 - 3%Unfavorable FX ~ 1%Acquisition ~ (6)%Underlying* (3) - (2)%
18
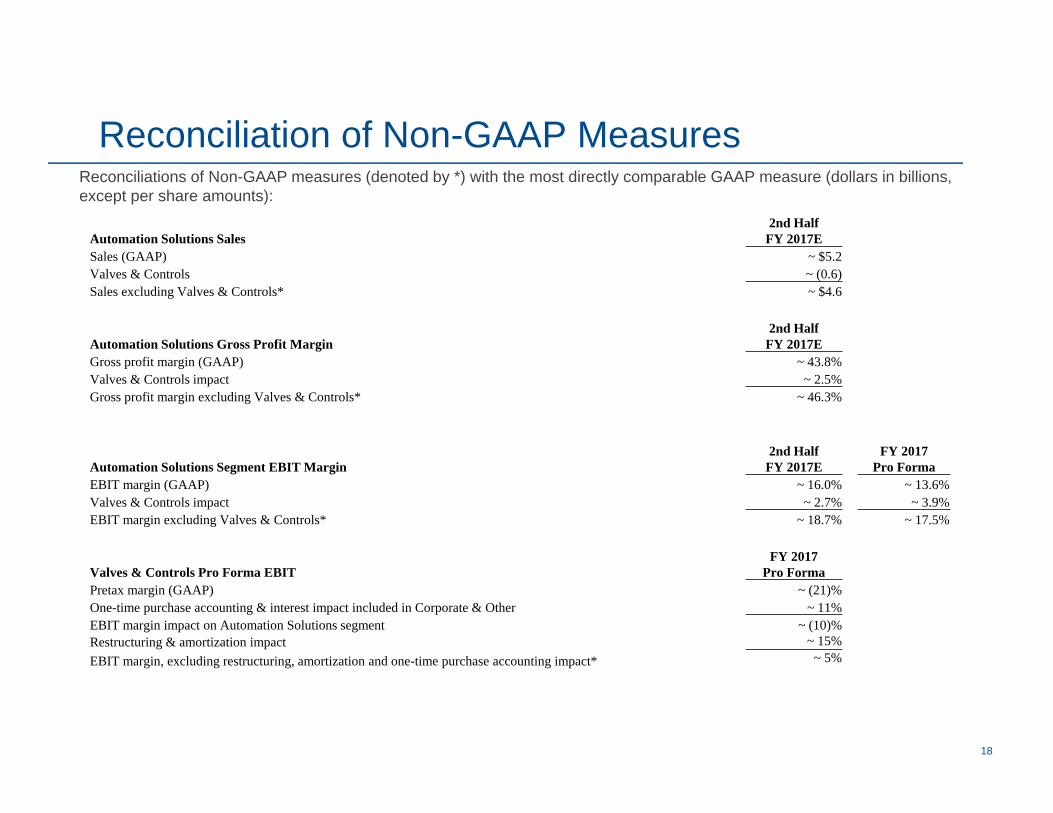
Reconciliation of Non-GAAP MeasuresReconciliations of Non-GAAP measures (denoted by *) with the most directly comparable GAAP measure (dollars in billions, except per share amounts):
Automation Solutions Sales2nd Half
FY 2017ESales (GAAP) ~ $5.2Valves & Controls ~ (0.6)Sales excluding Valves & Controls* ~ $4.6
Automation Solutions Gross Profit Margin2nd Half
FY 2017EGross profit margin (GAAP) ~ 43.8%Valves & Controls impact ~ 2.5%Gross profit margin excluding Valves & Controls* ~ 46.3%
Automation Solutions Segment EBIT Margin2nd Half
FY 2017EFY 2017
Pro FormaEBIT margin (GAAP) ~ 16.0% ~ 13.6%Valves & Controls impact ~ 2.7% ~ 3.9%EBIT margin excluding Valves & Controls* ~ 18.7% ~ 17.5%
Valves & Controls Pro Forma EBIT FY 2017
Pro FormaPretax margin (GAAP) ~ (21)%One-time purchase accounting & interest impact included in Corporate & Other ~ 11% EBIT margin impact on Automation Solutions segment ~ (10)%Restructuring & amortization impact ~ 15%EBIT margin, excluding restructuring, amortization and one-time purchase accounting impact* ~ 5%