Embed Size (px)
Citation preview

Electrical Power and Energy Systems 84 (2017) 202–213
Contents lists available at ScienceDirect
Electrical Power and Energy Systems
journal homepage: www.elsevier .com/locate / i jepes
Overcurrent protection for distribution feeders with renewablegeneration
http://dx.doi.org/10.1016/j.ijepes.2016.05.0030142-0615/� 2016 Elsevier Ltd. All rights reserved.
Li-Hsiung ChenDepartment of Electrical Engineering, Southern Taiwan University of Science and Technology, Tainan, Taiwan, ROC
a r t i c l e i n f o a b s t r a c t
Article history:Received 31 January 2016Received in revised form 20 March 2016Accepted 9 May 2016
Keywords:Distribution systemsOvercurrent relaysRenewable generation (RG)
Distribution systems in Taiwan are typically radial type or normally open loop type. Distribution feedershave a simple protection system that usually employs overcurrent relays. When renewable generation(RG) is connected to the distribution feeder, the feeder changes from a single-source system to a complexmulti-source system, which causes loss of the original coordination among feeder protection devices. Theoperation of RG units can cause protection failure. Fault current produced by RG units may reducethe current measured by the feeder relay. Therefore, this paper proposes connecting RGs to the feedervia four-way circuit switches with overcurrent relays, and dividing the feeder into several protectionzones. Each protection zone is capable of isolating fault itself.The algorithm process and design procedure of overcurrent protection are also proposed for
distribution feeders with RG. Results of this research provide a valuable reference for overcurrentprotection that improved protection coordination and system reliability.
� 2016 Elsevier Ltd. All rights reserved.
Introduction
In the current era of high oil prices and global efforts to reducegreenhouse gas emissions, renewable generation (RG) is a criticalenergy management strategy [1,2]. Generally, RG technologiesinclude photovoltaic, wind turbines, fuel cells, micro turbines andso on [3–7]. The subtropical location of Taiwan provides excellentpotential for solar energy development. With its abundant windresources on the west coast and on offshore islands, Taiwan alsohas superior advantages in geographic location to develop windenergy. Therefore, the Taiwan government is now emphasizingphotovoltaic systems and wind power. Wind power is oftenconnected to sub-transmission or transmission systems ratherthan to distribution systems [8]. Photovoltaic systems produce dcpower and needs an inverter to convert its output dc power intoac power, and are connected directly to the distribution network[1,9,10]. In southern Taiwan, a 1 MW Photovoltaic system has beeninstalled in the Kaohsiung World Games Stadium. Additionally, a4.5 MW photovoltaic system has been also installed on Yung Ansaltern.
The three-phase four-wire multi-grounded service is widelyadopted in modern power distribution systems due to havinglower installation costs and higher sensitivity of fault protectionthan three-phase three-wire service. Conventional distributionsystems are radial type and are supplied through a main source.
These networks have a very simple protection system which isusually implemented using fuses, reclosers, and overcurrent relays.Overcurrent relays at the beginning of feeder are used to protectthe feeder when fault occurs on the relevant one. When RG unitsare connected to feeders, the network will turn to be a multi-source one, and this means losing the existing coordination amongnetwork protection devices [4,5,10–15]. The extent in which a RGaffects protection coordination depends on RGs’ capacity, typeand installation location of them. Due to generation capacity andinstallation location of RG, there are ranges in which protectioncoordination is maintained and in some cases no protection coor-dination can be achieved.
In general, the distribution systems are radial type or normallyopen loop type in Taiwan. When RG units are connected to the dis-tribution feeder, bi-directional power flow from the feeder cancause them to lose existing protection coordination [4,5,10–15].Problems associated with RGs connected to a feeder include falsetripping of feeders, protection blinding, increasing or decreasingshort circuit current. Because the fault current produced by a RGmay reduce the current measured at the feeder relay, designingthe best protection scheme is difficult. Therefore, this paper pro-poses connecting RGs to the feeder via four-way circuit switcheswith overcurrent relays and dividing the feeder into several protec-tion zones. This method also avoids false tripping of feeders andimproves system reliability.

L.-H. Chen / Electrical Power and Energy Systems 84 (2017) 202–213 203
Analysis of theory
Overcurrent relay setting for radial type and normally open loop typedistribution systems
Figs. 1 and 2 show the radial type and normally open loop typedistribution systems, respectively. The radial type distribution
Substation
OC Relay Load1 Load2 Load3
CB ~
Load4 Load5
Fig. 1. The radial type distribution system.
Substation A
OC Relay LoadA1 LoadA2 LoadA3
CB ~
LoadA4 LoadA5
Substation B
OC Relay LoadB1 LoadB2 LoadB3
CB ~
LoadB4 LoadB5
Fig. 2. The normally open loop type distribution system.
Single-phasetransformer
Fig. 3. The typical diagram of a three-p
system is mainly used in rural areas of the country. However, thenormally open loop type distribution system is used in urban areasemploys a dual source, normally open primary circuit, which sup-plies backup power during almost all maintenance and emergencyoutages. The three-phase four-wire multi-grounded connectionmethod is used in radial type and normally open loop type distri-bution systems. Fig. 3 shows a typical diagram of three-phasefour-wire multi-grounded distribution system, where the CO isan overcurrent protective relay to against short-circuit faults inthe system and the LCO is a low-energy overcurrent protectiverelay to against the ground fault [16]. The three-phase four-wiremulti-grounded systems have three-phase conductors plus amulti-grounded neutral. The neutral acts as a return conductorand provides a safety ground for equipment. One phase and theneutral supply single-phase loads. More than half of most distribu-tion systems consist of single-phase circuits, and most customersare single phase. On a multi-grounded neutral system, the earthserves as a return conductor for part of the unbalanced currentduring normal and fault conditions.
Once the fault occurs at the end of the feeder with the faultimpedance (Zf) in Fig. 3. Figs. 4 and 5 show the impedance dia-grams and neglected loads for three-phase fault condition and sin-gle phase-to-ground fault condition, respectively. The three-phasefault current (If) and single phase-to-ground fault current (Igf) canbe determined by Eqs. (1) and (2), respectively [17,18].
If ¼ Vl�n
ZS1 þ ZD1 þ Zfð1Þ
Igf ¼ 3Vl�n
ZS1 þ ZD1 þ ZS2 þ ZD2 þ ZS0 þ ZD0 þ 3Zfð2Þ
whereVl�n is the line-to-ground voltage at the substation low-voltagebus (kV).
Multi-grounded neutral
three-phasetransformers
hase four-wire distribution system.

Vl-n
Zf If
~
ZS1
ZD1
Fig. 4. The impedance diagram for three-phase fault.
Vl-n ~
ZS1
ZD1
ZS2
ZD2
ZS0
ZD0
3Zf
Fig. 5. The impedance diagram for a single phase-to-ground fault.
Substation
OC Relay Load1 Load2
CB ~
Load3 Load4
RG
Fig. 6. The RG connected to the feeder.
Vl-n
If
~
Ir
Zf IRGZS1
ZDA1 ZDB1
Fig. 7. The impedance diagram for three-phase fault occurring upstream of the RG.
Vl-n ~
3Zf
IRGZS1
ZDA1 ZDB1Irg1
ZS2ZDA2 ZDB2Irg2
Igfa
204 L.-H. Chen / Electrical Power and Energy Systems 84 (2017) 202–213
ZS1 is the sum of the positive-sequence impedances of all sys-tem components from the distribution substation low-voltagebus up to and including the generator (X).ZD1 is the sum of the distribution lines positive-sequence impe-dance (X).ZS2 is the sum of the negative-sequence impedances of all sys-tem components from the distribution substation low-voltagebus up to and including the generator (X).ZD2 is the sum of the distribution lines negative-sequence impe-dance (X).ZS0 is the sum of the zero-sequence impedances of all systemcomponents from the distribution substation low-voltage busup to and including the generator (X).ZD0 is the sum of the distribution lines zero-sequence impe-dance (X).Zf is the fault impedance (X).
In practice, an established value for Zf is added at the end of theprotected area. Values typically range from 0X to 40X [17].
The phase overcurrent relay pickup current is set according tothe following relationship
ZS0ZDA0 ZDB0Irg0
Fig. 8. The impedance diagram for single phase-to-ground fault occurring upstreamof the RG.
1:5Imax-load < Ipickup < 0:6If3ph at the end of the feeder ð3ÞThe pickup current of the phase overcurrent relay must be at
least 1.5 times the maximum expected feeder load current andlower than 0.6 times the three-phase maximum fault current atthe end of the feeder. The ground overcurrent relay is set with apickup range from 25% to 50% of the phase relay pickup [17].
The impact of RGs connected to the feeder
Photovoltaic systems produce dc power and require an inverterto convert output dc power to ac power. They connect directly tothe distribution network. Fig. 6 illustrates how the RG is connectedto distribution feeder.
Figs. 7 and 8 show the impedance diagrams for three-phasefault and single phase-to-ground fault occurring upstream of theRG with fault impedance (Zf). The total fault contribution for a PVinverter is assumed to be less than double the rated output currentof the inverter [8,19]. According to the superposition principle, theamplitude of current (Ir) at the beginning of the feeder and thethree-phase fault current (If) can be expressed as
Ir ¼ Vl�n � Zf IRGZS1 þ ZDA1 þ Zf
ð4Þ

Vl-n
If
~
Ir
ZfIRGZS1
ZD11 ZD21
Fig. 9. The impedance diagram for three-phase fault occurring downstream of theRG.
Vl-n
Igfa
~
3Zf
IRGZS1
ZD11 ZD21Ir1
ZS2ZD12 ZD22Ir2
ZS0ZD10 ZD20Ir0
Fig. 10. The impedance diagram for single phase-to-ground fault occurringdownstream of the RG.
Vl-n
If
~
Ir
Zf IRG1ZS1
ZDA1 ZDB1
IRG2
ZDC1
Fig. 11. The impedance diagram for three-phase fault occurring upstream of theRG1.
L.-H. Chen / Electrical Power and Energy Systems 84 (2017) 202–213 205
If ¼ Vl�n þ ðZS þ ZDAÞIRGZS1 þ ZDA1 þ Zf
ð5Þ
For the single phase-to-ground fault, the amplitude of current(Irg) at the beginning of the feeder and the single-phase fault cur-rent (Igf) can be expressed as
Irg ¼ Irg1þ Irg2þ Irg0 ¼Vl�n� IRG
ðZS2þZDA2ÞZDB2ðZS2þZDA2þZDB2Þþ
ðZS0þZDA0ÞZDB0ðZS0þZDA0ÞþZDB0
þ3Zf
h i
ZS1þZDA1þ ðZS2þZDA2ÞZDB2ðZS2þZDA2ÞþZDB2
þ ðZS0þZDA0ÞZDB0ðZS0þZDA0ÞþZDB0
þ3Zf
h i
þ ZDB2½Vl�nþ IRGðZS1þZDA1Þ�ZS1þZDA1þ ðZS2þZDA2ÞZDB2
ðZS2þZDA2ÞþZDB2þ ðZS0þZDA0ÞZDB0
ðZS0þZDA0ÞþZDB0þ3Zf
h i½ðZS2þZDA2ÞþZDB2�
þ ZDB0½Vl�nþ IRGðZS1þZDA1Þ�ZS1þZDA1þ ðZS2þZDA2ÞZDB2
ðZS2þZDA2ÞþZDB2þ ðZS0þZDA0ÞZDB0
ðZS0þZDA0ÞþZDB0þ3Zf
h i½ðZS0þZDA0ÞþZDB0�
ð6Þ
Igf ¼ 3Igfa ¼ 3½Vl�n þ IRGðZS1 þ ZDA1Þ�ZS1 þ ZDA1 þ ðZS2þZDA2ÞZDB2
ðZS2þZDA2ÞþZDB2þ ðZS0þZDA0ÞZDB0
ðZS0þZDA0ÞþZDB0þ 3Zf
ð7Þ
whereZDA1 (ZDA2, ZDA0) are the sum of the distribution lines positive-sequence impedance (negative-sequence impedance, zero-sequence impedance) from the beginning of feeder to faultpoint (X).ZDB1 (ZDB2, ZDB0) are the sum of the distribution lines positive-sequence impedance (negative-sequence impedance, zero-sequence impedance) from the fault point to connected pointof RG (X).
Figs. 9 and 10 show the impedance diagrams for three-phasefault and single phase-to-ground fault occurring downstream ofthe RG with fault impedance (Zf). The Ir, If, Irg and Igf in Figs. 9and 10 can be obtained as follows:
Ir ¼ Vl�n � ðZD21 þ Zf ÞIRGZS1 þ ZD11 þ ZD21 þ Zf
ð8Þ
If ¼ Vl�n þ ðZS1 þ ZD11ÞIRGZS1 þ ZD11 þ ZD21 þ Zf
ð9Þ
Irg¼ Irg1þ Irg2þ Irg0
¼3Vl�n� IRGðZD21þZS2þZD12þZD22þZS0þZD10þZD20þ3Zf �2ZS1�2ZD11ÞZS1þZD11þZD21þZS2þZD12þZD22þZS0þZD10þZD20þ3Zf
ð10Þ
Igf ¼ 3Igfa
¼ 3½Vl�n þ IRGðZS1 þ ZD11Þ�ZS1 þ ZD11 þ ZD21 þ ZS2 þ ZD12 þ ZD22 þ ZS0 þ ZD10 þ ZD20 þ 3Zf
ð11Þwhere
ZD11 (ZD12, ZD10) are the sum of the distribution lines positive-sequence impedance (negative-sequence impedance, zero-sequence impedance) from the beginning of feeder to connectedpoint of RG (X).ZD21 (ZD22, ZD20) are the sum of the distribution lines positive-sequence impedance (negative-sequence impedance, zero-sequence impedance) from connected point of RG to the faultpoint (X).
According to the equations given in (8) and (10), the more ZD21or IRG increase, the more Ir and Irg reduces. Fault current producedby RG reduces the current measured at the feeder relay. Therefore,the operation of RG can cause failure to operate of protection.
The ‘‘reach” of a relay, which is the maximum distance from thefeeder at which the relay can provide protection, is determined byits minimum pickup current. Because a RG reduces the reach of theovercurrent relay, faults at the end of the feeder may be unde-tected [9].
The two RGs are connected to a distribution feeder. Figs. 11 and12 show the impedance diagram for three-phase fault and singlephase-to-ground fault occurring upstream of the RG1 with faultimpedance (Zf). In this condition, Ir, If, Irg and Igf can be written as
Ir ¼ Vl�n � Zf ðIRG1 þ IRG2ÞZS1 þ ZDA1 þ Zf
ð12Þ
If ¼ Vl�n þ ðZS1 þ ZDA1ÞðIRG1 þ IRG2ÞZS1 þ ZDA1 þ Zf
ð13Þ

Irg ¼ Irg1 þ Irg2 þ Irg0 ¼Vl�n � ðIRG1 þ IRG2Þ ðZS2þZDA2ÞðZDB2þZDC2Þ
ðZS2þZDA2ÞþðZDB2þZDC2Þ þðZS0þZDA0ÞðZDB0þZDC0ÞðZS0þZDA0ÞþðZDB0þZDC0Þ þ 3Zf
� �
ZS1 þ ZDA1 þ ðZS2þZDA2ÞðZDB2þZDC2ÞðZS2þZDA2ÞþðZDB2þZDC2Þ þ
ðZS0þZDA0ÞðZDB0þZDC0ÞðZS0þZDA0ÞþðZDB0þZDC0Þ þ 3Zf
þ Vl�nðZDB2 þ ZDC2Þ þ ðIRG1 þ IRG2ÞðZS1 þ ZDA1ÞðZDB2 þ ZDC2Þ½ZS1 þ ZDA1 þ ðZS2þZDA2ÞðZDB2þZDC2Þ
ðZS2þZDA2ÞþðZDB2þZDC2Þ þðZS0þZDA0ÞðZDB0þZDC0ÞðZS0þZDA0ÞþðZDB0þZDC0Þ þ 3Zf �½ðZS2 þ ZDA2Þ þ ðZDB2 þ ZDC2Þ�
þ Vl�nðZDB0 þ ZDC0Þ þ ðIRG1 þ IRG2ÞðZS1 þ ZDA1ÞðZDB0 þ ZDC0ÞZS1 þ ZDA1 þ ðZS2þZDA2ÞðZDB2þZDC2Þ
ðZS2þZDA2ÞþðZDB2þZDC2Þ þðZS0þZDA0ÞðZDB0þZDC0ÞðZS0þZDA0ÞþðZDB0þZDC0Þ þ 3Zf
h i½ðZS0 þ ZDA0Þ þ ZDB0 þ ZDC0�
ð14Þ
206 L.-H. Chen / Electrical Power and Energy Systems 84 (2017) 202–213
Igf ¼ 3Igfa
¼ 3½Vl�n þ ðIRG1 þ IRG2ÞðZS1 þ ZDA1Þ�ZS1 þ ZDA1 þ ðZS2þZDA2ÞðZDB2þZDC2Þ
ðZS2þZDA2ÞþðZDB2þZDC2Þ þðZS0þZDA0ÞðZDB0þZDC0ÞðZS0þZDA0ÞþðZDB0þZDC0Þ þ 3Zf
ð15Þ
whereZDA1 (ZDA2, ZDA0) are the sum of the distribution lines positive-sequence impedance (negative-sequence impedance, zero-sequence impedance) from the beginning of feeder to faultpoint (X)In Figs. 11 and 12, ZDB1 (ZDB2, ZDB0) is the sum of the distribu-
tion lines positive-sequence impedance (negative-sequence impe-dance, zero-sequence impedance) from fault point to connected
Vl-n
Igfa
~
3Zf
IRG1ZS1
ZDA1 ZDB1Ir1
ZS2ZDA2 ZDB2Ir2
ZS0ZDA0 ZDB0Ir0
IRG2
ZDC1
ZDC2
ZDC0
Fig. 12. The impedance diagram for single phase-to-ground fault occurringupstream of the RG1.
Vl-n
If
~
Ir
ZfIRG1ZS1
ZD11 ZD21
IRG2
ZD31
Fig. 13. The impedance diagram for three-phase fault occurring between RG1 andRG2.
point of RG1 (X), and ZDC1 (ZDC2, ZDC0) is the sum of the distributionlines positive-sequence impedance (negative-sequence impe-dance, zero-sequence impedance) between RG1 and RG2.
Figs. 13 and 14 show the impedance diagrams for three-phasefault and single phase-to-ground fault occurring between RG1and RG2 with fault impedance (Zf). The Ir, If, Irg and Igf can be calcu-lated as follows
Ir ¼ Vl�n � ðZD21 þ Zf ÞIRG1 � Zf IRG2ZS1 þ ZD11 þ ZD21 þ Zf
ð16Þ
If ¼ Vl�n þ ðZS1 þ ZD11ÞIRG1 þ ðZS1 þ ZD11 þ ZD21ÞIRG2ZS1 þ ZD11 þ ZD21 þ Zf
ð17Þ
Vl-n
Igfa
~
3Zf
IRG1ZS1
ZD11 ZD21Ir1
ZS2ZD12 ZD22Ir2
ZS0ZD10 ZD20Ir0
IRG2
ZD31
ZD32
ZD30
Fig. 14. The impedance diagram for single phase-to-ground fault occurringbetween RG1 and RG2.
Vl-n
If
~
Ir
ZfIRG1ZS1
ZDD1 ZDE1
IRG2
ZDF1
Fig. 15. The impedance diagram for three-phase fault occurring downstream of theRG2.

Irg ¼ Irg1 þ Irg2 þ Irg0
¼Vl�n � IRG1ZD21 � ðIRG1 þ IRG2Þ ZD32ðZS2þZD12þZD22Þ
ZS2þZD12þZD22þZD32þ ZD30ðZS0þZD10þZD20Þ
ZS0þZD10þZD20þZD30þ 3Zf
h i
ZS1 þ ZD11 þ ZD21 þ ZD32ðZS2þZD12ZD22ÞZS2þZD12þZD22þZD32
þ ZD30ðZS0þZD10þZD20ÞZS0þZD10þZD20þZD30
þ 3Zf
þ ½Vl�n þ ðIRG1 þ IRG2ÞðZS1 þ ZD11Þ þ IRG2ZD21�ZD32
ZS1 þ ZD11 þ ZD21 þ ZD32ðZS2þZD12þZD22ÞZS2þZD12þZD22þZD32
þ ¼ ZD30ðZS0þZD10þZD20ÞZS0þZD10þZD20þZD30
þ 3Zf
h iðZS2 þ ZD12 þ ZD22 þ ZD32Þ
þ ½Vl�n þ ðIRG1 þ IRG2ÞðZS1 þ ZD11Þ þ IRG2ZD21�ZD30
ZS1 þ ZD11 þ ZD21 þ ZD32ðZS2þZD12þZD22ÞZS2þZD12þZD22þZD32
þ ZD30ðZS0þZD10þZD20ÞZS0þZD10þZD20þZD30
þ 3Zf
h iðZS0 þ ZD10 þ ZD20 þ ZD30Þ
ð18Þ
L.-H. Chen / Electrical Power and Energy Systems 84 (2017) 202–213 207
Igf ¼ 3Igfa
¼ 3½Vl�n þ IRG1ðZS1 þ ZD11Þ þ IRG2ðZS1 þ ZD11 þ ZD21Þ�ZS1 þ ZD11 þ ZD21 þ ZD32ðZS2þZD12þZD22Þ
ZS2þZD12þZD22þZD32þ ZD30ðZS0þZD10þZD20Þ
ZS0þZD10þZD20þZD30þ 3Zf
h i
ð19Þ
whereZD11 (ZD12, ZD10) are the sum of the distribution lines positive-sequence impedance (negative-sequence impedance, zero-sequence impedance) from the beginning of feeder to connectedpoint of RG1 (X)ZD21 (ZD22, ZD20) are the sum of the distribution lines positive-sequence impedance (negative-sequence impedance, zero-sequence impedance) from connected point of RG1 to faultpoint (X)
In Figs. 13 and 14, ZD31 (ZD32, ZD30) are the sum of the distribu-tion lines positive-sequence impedance (negative-sequence impe-dance, zero-sequence impedance) from fault point to connectedpoint of RG2 (X).
Figs. 15 and 16 show the impedance diagram for three-phasefault and single phase-to-ground fault occurring downstream ofthe RG2 with fault impedance (Zf). In this condition, Ir, If, Irg andIgf c an be written as
Ir ¼Vl�n�ðZDE1þZDF1þZf ÞIRG1�ðZDF1þZf ÞIRG2ZS1 þ ZDD1 þ ZDE1 þ ZDF1 þ Zf
ð20Þ
If ¼ Vl�n þ ðZS1 þ ZDD1ÞIRG1 þ ðZS1 þ ZDD1 þ ZDE1ÞIRG2ZS1 þ ZDD1 þ ZDE1 þ ZDF1 þ Zf
ð21Þ
Irg ¼ Irg1 þ Irg2 þ Irg0
¼ Vl�n � IRG1ZDE1 � ðIRG1 þ IRG2ÞðZDF1 þ ZS2 þ ZDD2 þ ZDE2 þ ZDF2 þ ZS0 þZS1 þ ZDD1 þ ZDE1 þ ZDF1 þ ZS2 þ ZDD2 þ ZDE2 þ ZDF2 þ ZS0 þ ZDD
þ 2½Vl�n þ IRG1ðZS1 þ ZDD1Þ þ IRG2ðZS1 þ ZDD1 þ ZDE1
ZS1 þ ZDD1 þ ZDE1 þ ZDF1 þ ZS2 þ ZDD2 þ ZDE2 þ ZDF2 þ ZS0 þ ZDD0 þ
Igf ¼ 3Igfa ¼ 3½Vl�n þ IRG1ðZS1 þ ZDD1Þ þ IRG2ðZS1 þ ZDD1 þZS1 þ ZDD1 þ ZDE1 þ ZDF1 þ ZS2 þ ZDD2 þ ZDE2 þ ZDF2 þ ZS0 þ Z
whereZDD1 (ZDD2, ZDD0) are the sum of the distribution lines positive-sequence impedance (negative-sequence impedance, zero-sequence impedance) from the beginning of feeder to connectedpoint of RG1 (X)ZDE1 (ZDE2, ZDE0) are the sum of the distribution lines positive-sequence impedance (negative-sequence impedance, zero-sequence impedance) between RG1 and RG2 (X)ZDF1 (ZDF2, ZDF0) are the sum of the distribution lines positive-sequence impedance (negative-sequence impedance, zero-sequence impedance) from connected point of RG2 to faultpoint (X)
The RGs are connected to the feeder via four-way circuit switches withovercurrent relays
As Fig. 17 shows, the four-way circuit switches contain two600 A three-phase load break ring switches, a 600 A three phasecircuit breaker, and a 200 A three-phase circuit breaker [20]. Thereare two LBS-type main feeder switches and two CB-type switchesconnected loads in the four-way circuit switches. The CT and over-current relay are installed in 600 A CB and 200 A CB [20]. The ratinginterrupting capability is 12 kA for 600 A CB and 200 A CB [20]. Therated current of distribution feeder is 600 A, and the maximumfault current should not exceed 10 kA. Therefore, the four-way cir-cuit switches can be applied to the distribution feeder.
In this paper, the one LBS-type switches and the 600 A CB-typeswitches are connected to feeder, the other LBS-type switches andthe 200 A CB-type switches are connected to the RG. Fig. 18 showsthe connection of the RG to the feeder via four-way circuitswitches. The small capacity RG is connected to CB 200 A by wayof four-way circuit switches. Nevertheless, the high capacity RGis connected to LBS 600 A. Because the four-way circuit switches
ZDD0 þ ZDE0 þ ZDF0 þ 3Zf Þ0 þ ZDE0 þ ZDF0 þ 3Zf
Þ�ZDE0 þ ZDF0 þ 3Zf
ð22Þ
ZDE1Þ�DD0 þ ZDE0 þ ZDF0 þ 3Zf
ð23Þ

Vl-n
Igfa
~
3Zf
IRG1ZS1
ZDD1 ZDE1Ir1
ZS2ZDD2 ZDE2Ir2
ZS0ZDD0 ZDE0Ir0
IRG2
ZDF1
ZDF2
ZDF0
Fig. 16. The impedance diagram for single phase-to-ground fault occurringdownstream of the RG2.
LBS600A
CB600AOC
Relay
LBS600A
CB200A
OCRelay
Fig. 17. The single line diagram of four-way circuit switches.
208 L.-H. Chen / Electrical Power and Energy Systems 84 (2017) 202–213
are connected to the feeder, the feeder is divided into two protec-tion zones. The phase overcurrent relay R1 and R2 pickup currentsare set according to Eq. (3). The ground overcurrent relay R1 andR2 are set with a pickup range from 25% to 50% of the phase relaypickup.
Fig. 19 shows that the two RGs are connected to the feeder viafour-way circuit switches, and the feeder is divided into three
Substation
OC RelayLoad1
CB~
Load2
R1
69kVBUS
11.4kVBUS
TR
Fig. 18. The connection of the RG to the
Substation
OC Relay Load1
CB~
RG1
LBS600A
CB600A
LBS600A
CB200A
R1 R2
69kVBUS
11.4kVBUS
TR
D1 D2 D31 2 3
Fig. 19. The two RGs connected to the f
protection zones. The phase overcurrent relays pickup currentare set according to Eq. (3) and the ground overcurrent relays areset with a pickup range from 25% to 50% of the phase relay pickup.
Simulation results
The two approximations must be considered for system model,the first approximation is to neglect the transients in the RGresponse. The other approximation is considering the fault currentat the relay to be constant and equal to the steady state fault cur-rent value [9]. The maximum fault contribution for a PV inverter isassumed to be double the rated output current of the inverter[8,19]. With above approximations the systemmodel can be repre-sented as seen in Fig. 19. The parameters of simulated system asfollow:
The three-phase short capacity of 69 kV bus: 2000 MVA X/R: 16Transformer: 25 MVA, 69/11.4 kV, ZTR: 9.32%Feeder: 11.4 kVRG1 size: 7.5 MW photovoltaic systems and PF is 1, the maxi-mum fault contribution for the RG1 inverter is 760 A.RG2 size: 1 MW photovoltaic systems and PF is 1, the maximumfault contribution for the RG2 inverter is 101 A.ZD1 and ZD2 for the positive-sequence impedance: 0.0655+ j0.182 (X)ZD1 and ZD2 for the zero-sequence impedance: 0.1555 + j0.5165(X)ZD3 for the positive-sequence impedance: 0.393 + j1.092 (X)ZD3 for the zero-sequence impedance: 0.933 + j3.099 (X)ZD4 for the positive-sequence impedance: 0.524 + j1.456 (X)ZD4 for the zero-sequence impedance: 1.244 + j4.132 (X)ZD5 for the positive-sequence impedance: 0.655 + j1.82 (X)ZD5 for the zero-sequence impedance: 1.555 + j5.165 (X)
The maximum expected whole feeder load current is 400 A, andthe expected feeder load currents are 200 A and 100 A from con-nected point of RG1 and RG2 to the end of the feeder, respectively.
Load3
LBS600A
CB600A
600A
CB200A
R2
RG
Load4
feeder via four-way circuit switches.
Load2 Load3
LBS600A
CB600A
LBS600A
CB200A
R3
RG2
D4 D54 5 6
eeder via four-way circuit switches.

Table 1The three-phase fault current and single phase-to-ground fault current for simulatedsystem without RG.
Fault point(Bus No.)
The three-phase faultcurrent (A)
The single phase-to-ground faultcurrent (A)
1 11,981 12,4722 8959 79583 7129 58174 3174 22115 1819 12096 1186 772
L.-H. Chen / Electrical Power and Energy Systems 84 (2017) 202–213 209
Case 1: without RG
Table 1 shows the three-phase fault current and single phase-to-ground fault current for simulated system without RG. The
Fig. 20. The protection curves of phase overcu
three-phase fault maximum current is 1186 A at the end of the fee-der. The pickup current of the phase overcurrent relay must be atleast 1.5 times the maximum expected feeder load current andlower than 0.6 times the three-phase maximum fault current atthe end of the feeder. Therefore, the pickup current of the phaseovercurrent relay setting is 650 A.
The ground overcurrent relay is set with a pickup rangefrom 25% to 50% of the phase relay pickup [17]. Hence, thepickup current of the ground overcurrent relay (R1) setting is300 A.
For circuit breaker, they are normally equipped with inverse-time overcurrent trip devices. The general characteristics of suchdevices can be shown as the following equation [15,21].
tðIÞ ¼ A
MP � 1þ B ð24Þ
rrent and ground overcurrent of relay R1.

Table 2The three-phase fault current and single phase-to-ground fault current for simulatedsystem with RG1.
Fault point(Bus No.)
The three-phase fault The single phase-to-groundfault
Fault pointcurrent (A)
Relay R1current (A)
Fault pointcurrent (A)
Relay R1current (A)
3 7875 7129 6426 56774 3506 2749 2443 16855 2010 1250 1336 5776 1310 550 853 96
210 L.-H. Chen / Electrical Power and Energy Systems 84 (2017) 202–213
wheret is operating time of inverse-time overcurrent deviceI is fault current measured at the feeder relayM is ratio of I/Ipickup (Ipickup is relay current set point)A, B, p is constants for selected curve characteristics.
Fig. 21. The protection curves of phase overcurren
At the beginning of the feeder, the three-phase and singlephase-to-ground maximum fault currents are 11,981 A and12,472 A, respectively. The phase overcurrent relay and groundovercurrent relay must be tripped under 20 cycles when thethree-phase maximum fault current or single phase-to-groundmaximum fault current occurring. The phase overcurrent andground overcurrent at relay (R1) are adopted Extremely Inversetrip characteristic (A = 28.2, B = 0.1217, P = 2) and used Eq. (24).Fig. 20 illustrates the protection curves of phase overcurrent relayand ground overcurrent of relay R1.
Case 2: The RG1 is connected to the feeder
The RG1 is connected to bus 3 of the feeder via four-way circuitswitches, as shown in Fig. 19. Table 2 shows the three-phase faultcurrent and single phase-to-ground fault current from bus 3 to bus
t and ground overcurrent of relays R1 and R2.
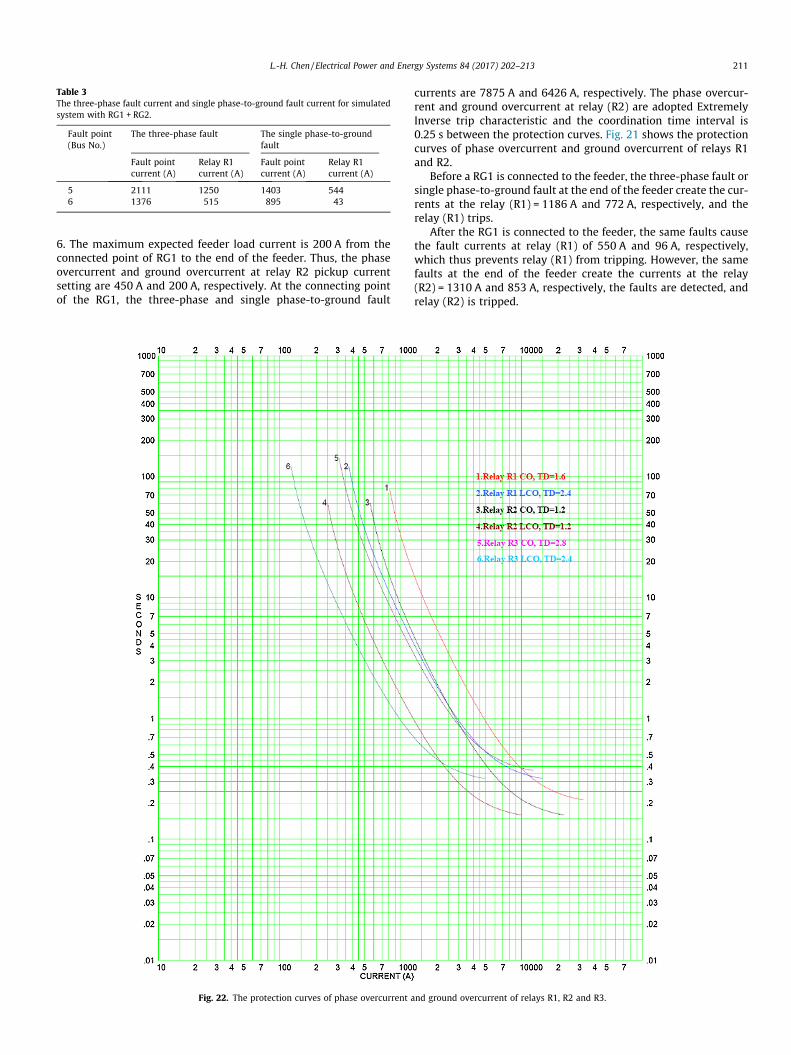
Table 3The three-phase fault current and single phase-to-ground fault current for simulatedsystem with RG1 + RG2.
Fault point(Bus No.)
The three-phase fault The single phase-to-groundfault
Fault pointcurrent (A)
Relay R1current (A)
Fault pointcurrent (A)
Relay R1current (A)
5 2111 1250 1403 5446 1376 515 895 43
L.-H. Chen / Electrical Power and Energy Systems 84 (2017) 202–213 211
6. The maximum expected feeder load current is 200 A from theconnected point of RG1 to the end of the feeder. Thus, the phaseovercurrent and ground overcurrent at relay R2 pickup currentsetting are 450 A and 200 A, respectively. At the connecting pointof the RG1, the three-phase and single phase-to-ground fault
Fig. 22. The protection curves of phase overcurrent a
currents are 7875 A and 6426 A, respectively. The phase overcur-rent and ground overcurrent at relay (R2) are adopted ExtremelyInverse trip characteristic and the coordination time interval is0.25 s between the protection curves. Fig. 21 shows the protectioncurves of phase overcurrent and ground overcurrent of relays R1and R2.
Before a RG1 is connected to the feeder, the three-phase fault orsingle phase-to-ground fault at the end of the feeder create the cur-rents at the relay (R1) = 1186 A and 772 A, respectively, and therelay (R1) trips.
After the RG1 is connected to the feeder, the same faults causethe fault currents at relay (R1) of 550 A and 96 A, respectively,which thus prevents relay (R1) from tripping. However, the samefaults at the end of the feeder create the currents at the relay(R2) = 1310 A and 853 A, respectively, the faults are detected, andrelay (R2) is tripped.
nd ground overcurrent of relays R1, R2 and R3.

212 L.-H. Chen / Electrical Power and Energy Systems 84 (2017) 202–213
Case 3: The RG1 and RG2 are connected to the feeder
The RG2 is connected to bus 5 of the feeder via four-waycircuit switches in Fig. 19. Table 3 shows the three-phase faultcurrent and single phase-to-ground fault current for bus 5 andbus 6. The maximum expected feeder load current is 100 A fromconnected point of RG2 to the end of the feeder. Thus, the phaseovercurrent and ground overcurrent at relay R3 pickup currentsetting are 250 A and 100 A, respectively. At the connecting pointof the RG2, the three-phase and single phase-to-ground faultcurrents are 2111 A and 1403 A, respectively. The phaseovercurrent and ground overcurrent at relay (R3) are adoptedExtremely Inverse trip characteristic and the coordination timeinterval is 0.25 s between the protection curves. Fig. 22 showsthe protection curves of phase overcurrent and ground overcur-rent of relays R1, R2 and R3. Therefore, the feeder is divided intothree protection zones and each protection zone is capable ofisolating fault itself.
Before the RG1 and RG2 are connected to the feeder, the relay(R1) trips when the three-phase fault or single phase-to-groundfault occur at the end of the feeder.
After the RG1 and RG2 are connected to the feeder, the samefaults cannot be detected by relay (R1). However, the same faultsat the end of the feeder can be detected by relay (R3), and the relay(R3) is tripped.
Design of overcurrent protection for distribution feeders withrenewable generation
The following describes each step of the procedure to design theovercurrent protection for distribution feeders with renewablegeneration:
Step 1: The phase overcurrent relay pickup current is set byEq. (3).Step 2: The ground overcurrent relay is set with a pickup rangefrom 25% to 50% of the phase relay pickup.Step 3: The three-phase fault current (If) and single phase-to-ground fault current (Igf) are calculated by Eqs. (1) and (2),respectively.Step 4: To select the phase overcurrent and ground overcurrentrelay trip characteristic curve. Then, the protection curves ofphase overcurrent and ground overcurrent relay can be plotted.Step 5: Estimates of three-phase fault current (Irg) and singlephase-to-ground fault current (Igf) at the beginning of the feederwhen the feeder occurring fault at the end with RGs.Step 6: If the computed Irg and Igf are greater then the phaseovercurrent and the ground overcurrent relay pickup current,respectively. The design can be complete. If not, the preliminarydesign should be revised (see Step 7).Step 7: The RGs connected to the feeder via four-way circuitswitches. Estimates of the phase overcurrent and the groundovercurrent relay pickup current for four-way circuit switches,respectively.Step 8: Estimates of the three-phase fault current and singlephase-to-ground fault current for four-way circuit switches.Step 9: To select the phase overcurrent and ground overcurrentrelay trip characteristic curve and plot protection curves.Step 10: Estimates of three-phase fault current (Irg) and singlephase-to-ground fault current (Igf) at the four-way circuitswitches when the feeder occurring fault at the end.Step 11: If the computed Irg and Igf are greater then the phaseovercurrent and the ground overcurrent relay pickup current,respectively. The design can be complete. If not, the designmust be repeat the step 7 to the step 11.
Conclusion
When RG is connected to the distribution feeder, the feederchanges from a single-source system to a complex multi-sourcesystem, which causes loss of the original coordination among fee-der protection devices. The operation of RG units can cause protec-tion failure. In this paper, the algorithm process and designprocedure for protection of distribution feeder in presence of RGwas proposed. The RGs are connected to the feeder via four-waycircuit switches with overcurrent relays, and dividing the feederinto several protection zones, each of which can isolate a fault.The simulation results verify that the research can effectivelyimprove protection coordination for distribution feeder with RGs.The proposed method also avoids false tripping of feeders andimproves system reliability.
Additionally, in high-impedance faults, the fault impedance willlimit the fault current to values that are not detectable or that arecomparable to load current values. Therefore, It is difficult to detecthigh-impedance faults current for protective device. The sensitivityof overcurrent relay can be improved for high-impedance faultsafter dividing the feeder into several protection zones.
References
[1] Ahmed Khaled H, Massoud Ahmed M, Finney Stephen J, Williams Barry W.Sensorless current control of three-phase inverter-based distributedgeneration. IEEE Trans Power Delivery 2009;24(2):919–29.
[2] Gao Fang, Reza Iravani M. A control strategy for a distributed generation unit ingrid-connected and autonomous modes of operation. IEEE Trans PowerDelivery 2008;23(2):850–9.
[3] Senjyu T, Miyazato Y, Yona A, Urasaki N, Funabashi T. Optimal distributionvoltage control and coordination with distributed generation. IEEE TransPower Delivery 2008;23(2):1236–42.
[4] Ochoa LF, Padilha-Feltrin A, Harrison GP. Evaluating distributed generationimpacts with a multiobjective index. IEEE Trans Power Delivery 2006;21(3):1452–8.
[5] Wu Xinjia, Lu Yuping, Du Jiao. Wide-area current protection for distributionfeeders with distributed generators. In: Electric utility deregulation andrestructuring and power technologies. Third international conference on 6–9April 2008. p. 2558–63.
[6] Brown Richard E. Modeling the reliability impact of distributed generation.Power engineering society summer meeting, 25–25 July 2002, vol. 1. p. 442–6.
[7] Kroposki B, DeBlasio R. Technologies for the new millennium: photovoltaics asa distributed resource. Power engineering society summer meeting, 16–20 July2000, vol. 3. p. 1798–801.
[8] Baghzouz Y. Voltage regulation and overcurrent protection issues indistribution feeders with distributed generation – a case study. In:Proceedings of the 38th Hawaii international conference on system sciences,3–6 January 2005. p. 1–7.
[9] Baran M, El-Markabi I. Adaptive over current protection for distributionfeeders with distributed generators. Power systems conference and exposition,10–13 October 2004, vol. 2. p. 715–9.
[10] Barker PP, De Mello RW. Determining the impact of distributed generation onpower systems: part 1-radial distribution systems. IEEE power engineeringsociety, 16–20 July 2000, vol. 3. p. 1645–56.
[11] Brahma S, Girgis A. Development of adaptive protection scheme fordistribution systems with high penetration of distributed generation. IEEETrans Power Delivery 2004;19(1):56–63.
[12] Dugan RC, McDermott TE. Operating conflicts for distributed generationinterconnected with utility distribution systems. IEEE Ind Appl Mag2002;8:19–25.
[13] Javadian SAM, Haghifam MR, Barazandeh P. An adaptive over-currentprotection scheme for MV distribution networks including DG. In: Industrialelectronics. IEEE international symposium on June 30–July 2. p. 2520–5.
[14] Viawan Ferry A, Karlsson Daniel, Sannino Ambra, Daalder Jaap. Protectionscheme for meshed distribution systems with high penetration of distributedgeneration. In: Power systems conference: advanced metering, protection,control, communication, and distributed resources, 14–17 March 2006. p.99–104.
[15] Chaitusaney S, Yokoyama A. Impact of protection coordination on sizes ofseveral distributed generation sources. Power engineering conference,November 29–December 2 2005, vol. 2. p. 669–74.
[16] Chang GW, Chiu MJ, Lee KS, Hsu YF. Analysis of high neutral current in three-phase four-wire multi-grounded distribution feeders. In: Proceedings of the2003 IEEE PES T&D conference, Dallas, USA, September 2003. p. 531–5.
[17] IEEE guide for protective relay applications to distribution lines. IEEE StdC37.230-2007.

L.-H. Chen / Electrical Power and Energy Systems 84 (2017) 202–213 213
[18] IEEE recommended practice for protection and coordination of industrial andcommercial power systems. IEEE Std 242-2001.
[19] Ball GJ, Blackburn Jr DC, Gish W, Gulachenski E, Guro EA, Kalkstein EW, et al.Summary of Static power converters of 500 kW or less serving as the relayinterface package for non-conventional generators. IEEE Trans Power Delivery1994;9(3):1325–31.
[20] Feeder Automation Equipment. Department of Business of Taiwan PowerCompany; 2009.
[21] IEEE standard inverse-time characteristic equations for overcurrent relays.IEEE Standard C37.112-1996; September 1996.