Embed Size (px)
Citation preview
PHYSICAL REVIEW E 88, 032134 (2013)
Electrical percolation in quasi-two-dimensional metalnanowire networks for transparent conductors
Rose M. Mutiso and Karen I. Winey*
Department of Materials Science and Engineering, University of Pennsylvania, Philadelphia, Pennsylvania 19104, USA(Received 27 June 2013; published 24 September 2013)
We simulate the conductivity of quasi-two-dimensional mono- and polydisperse rod networks having rodsof various aspect ratios (L/D = 25–800) and rod densities up to 100 times the critical density and assumingcontact-resistance dominated transport. We report the rod-size dependence of the percolation threshold and thedensity dependence of the conductivity exponent over the entire L/D range studied. Our findings clarify the rangeof applicability for the popular widthless-stick description for physical networks of rodlike objects with modestaspect ratios and confirm predictions for the high-density dependence of the conductivity exponent obtainedfrom modest-density systems. We also propose a heuristic extension to the finite-width excluded area percolationmodel to account for arbitrary distributions in rod length and validate this solution with numerical results fromour simulations. These results are relevant to nanowire films that are among the most promising candidates forhigh performance flexible transparent electrodes.
DOI: 10.1103/PhysRevE.88.032134 PACS number(s): 64.60.ah, 72.80.Tm
I. INTRODUCTION
Thin films of high-aspect-ratio conductive particles, suchas carbon nanotubes, metal nanowires, and graphene flakes areof increasing interest for high performance solution processedflexible transparent conductors [1–3]. Random networks ofmetal nanowires are the highest performing materials amongthese emergent transparent conductor technologies, demon-strating optoelectronic properties on par with the ubiquitousindium tin oxide as well as compatibility with low-temperaturesolution processing and large-area deposition [2,3]. Com-putational and analytical studies of electrical percolation intwo-dimensional (2D) random rod networks are of increasinginterest in this field as they provide an important frameworkfor understanding and predicting the dependence of electricalproperties of nanotube and nanowire films on the nanoparticlesizes and network structure.
Percolation theory predicts that the electrical conductivityof a network of conducting particles scales with the particleloading by the power-law dependence shown below
σ ∼(
N − Nc
Nc
)t
, (1)
where N is number density of the objects (or equivalently,their volume or area fraction), Nc is the critical number densityof objects at the percolation threshold, and t is conductivityexponent. The power law in Eq. (1) is expected to hold at fillerloadings above, but close to, the percolation threshold with auniversal conductivity exponent t0 ≈ 1.3 in two dimensions [4].To date, most theoretical studies of continuum percolation intwo dimensions have focused on the random widthless-sticksystem [5–11] with particular emphasis on investigating thekey critical phenomena, such as the percolation threshold andcritical exponents as well as finite-size scaling behavior. Thecritical number of density of sticks at percolation Nc for therandom widthless-stick system was obtained numerically viaMonte Carlo simulations first by Pike and Seager [5] and
recently by Li and Zhang [8] who reported a high precisionvalue of the critical density NcL
2stick = 5.637 26, where Lstick
is the stick length. Balberg et al. [12] and Balberg [13] relatedNc to the particle geometry using excluded area argumentsand numerical approximations to predict the dependency ofthe percolation threshold on the aspect ratio and orientationfor both widthless and finite-width sticks. However, thecomplimentary simulations in their papers were limited tosystems composed of small numbers of sticks (<103) andlow-aspect ratios (L/D < 15) [6,13].
Recently, there has also been debate in the literaturesurrounding the nonuniversality of the conductivity exponent tin Eq. (1) observed first in experiments of nanotube-based films[14,15] and confirmed numerically by several studies [9,10,16]reporting a strong dependence of t on both stick density andthe ratio of the contact and stick resistances (Rc/Rstick). On theother hand, the conductivity exponent extracted from the sizedependence of the conductivity at the percolation threshold, asopposed to its density dependence in Eq. (1), yields the uni-versal value of t0 ≈ 1.3 independent of the resistance ratio [9].
In this paper, we simulate the conductivity of quasi-2D ran-dom networks composed of soft-core rods that are confined toa plane. We perform the simulations over a very wide range ofaspect ratios (L/D = 25–800) and rod densities up to 100Nc andassume contact-resistance dominated transport (Rc � Rrod).These simulated conductivities are then used to determinethe percolation threshold and the density dependence of theconductivity exponent over the entire range of aspect ratios androd densities studied. The objective of this paper is to evaluate:(1) the rod-size dependence of the percolation threshold as wellas (2) the density dependence of the conductivity exponent.Previous numerical studies of these phenomena were basedon the widthless-stick description [5,6,8] and modest-densitysystems (N < 10Nc) [7,9,10,16], respectively. The formerobjective is particularly relevant since the implicit assumptionL/D → ∞ for widthless sticks might not hold for manyexperimentally important modest-aspect-ratio systems. Wealso (3) study the effect of rod-size dispersity on the percolationthreshold, proposing a heuristic extension to the finite-widthexcluded area percolation model to account for arbitrary
032134-11539-3755/2013/88(3)/032134(8) ©2013 American Physical Society
ROSE M. MUTISO AND KAREN I. WINEY PHYSICAL REVIEW E 88, 032134 (2013)
distributions in rod length and validating this solution withsimulation results using the example of a network with abi-disperse distribution of rod lengths. This paper builds uponour previous studies of percolation in isotropic and alignednetworks of mono- and polydisperse three-dimensional (3D)networks [17–19] as well as a concurrent study [20] in whichwe integrated our simulation approach with experiments ofwell-defined metal nanowire films to produce quantitativepredictions of the dependence of the sheet resistance on thenanowire size, areal density, and size dispersity.
II. SIMULATION METHOD
Our simulation method calculates the conductivity of quasi-2D rod networks as a function of the rod aspect ratio andnanowire density using a two-step approach. First, randomassemblies of rods are generated using a Monte Carlo process,and a clustering analysis is performed to identify the percolatedor spanning rod cluster. Second, the current across the sampleis calculated using a random resistor network approach [21] todiscretize the rod network, and Kirchoff’s current law (KCL)equations are solved at each node. We have previously used thissimulation approach in three-dimensional networks to explorethe effects of rod orientation, aspect ratio, and size dispersity onthe electrical conductivity and percolation threshold [17–19].These simulations are relevant to polymer nanocompositescontaining cylindrical nanofillers, such as carbon nanotubesand metal nanowires. In the current paper, we adapt our 3Dsimulation approach to model the sheet resistance of quasi-2Dnanowire films by confining the rods to a thin film.
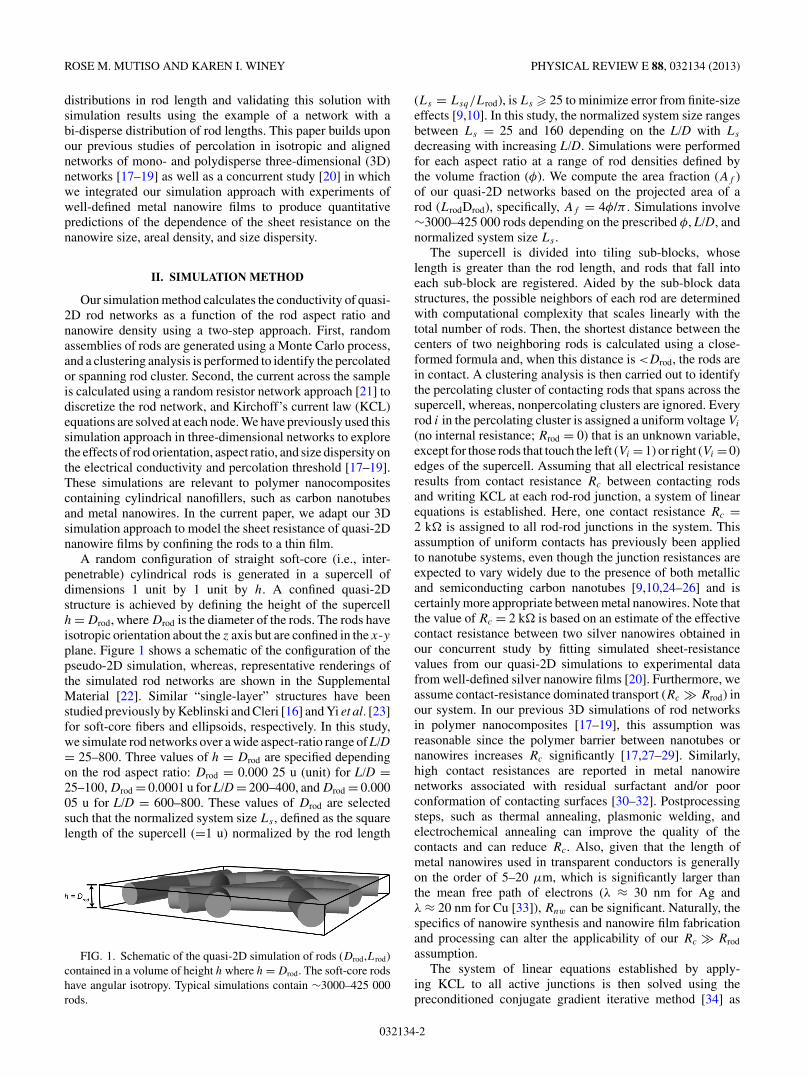
A random configuration of straight soft-core (i.e., inter-penetrable) cylindrical rods is generated in a supercell ofdimensions 1 unit by 1 unit by h. A confined quasi-2Dstructure is achieved by defining the height of the supercellh = Drod, where Drod is the diameter of the rods. The rods haveisotropic orientation about the z axis but are confined in the x-yplane. Figure 1 shows a schematic of the configuration of thepseudo-2D simulation, whereas, representative renderings ofthe simulated rod networks are shown in the SupplementalMaterial [22]. Similar “single-layer” structures have beenstudied previously by Keblinski and Cleri [16] and Yi et al. [23]for soft-core fibers and ellipsoids, respectively. In this study,we simulate rod networks over a wide aspect-ratio range of L/D= 25–800. Three values of h = Drod are specified dependingon the rod aspect ratio: Drod = 0.000 25 u (unit) for L/D =25–100, Drod = 0.0001 u for L/D = 200–400, and Drod = 0.00005 u for L/D = 600–800. These values of Drod are selectedsuch that the normalized system size Ls , defined as the squarelength of the supercell (=1 u) normalized by the rod length
FIG. 1. Schematic of the quasi-2D simulation of rods (Drod,Lrod)contained in a volume of height h where h = Drod. The soft-core rodshave angular isotropy. Typical simulations contain ∼3000–425 000rods.
(Ls = Lsq/Lrod), is Ls � 25 to minimize error from finite-sizeeffects [9,10]. In this study, the normalized system size rangesbetween Ls = 25 and 160 depending on the L/D with Ls
decreasing with increasing L/D. Simulations were performedfor each aspect ratio at a range of rod densities defined bythe volume fraction (φ). We compute the area fraction (Af )of our quasi-2D networks based on the projected area of arod (LrodDrod), specifically, Af = 4φ/π . Simulations involve∼3000–425 000 rods depending on the prescribed φ, L/D, andnormalized system size Ls .
The supercell is divided into tiling sub-blocks, whoselength is greater than the rod length, and rods that fall intoeach sub-block are registered. Aided by the sub-block datastructures, the possible neighbors of each rod are determinedwith computational complexity that scales linearly with thetotal number of rods. Then, the shortest distance between thecenters of two neighboring rods is calculated using a close-formed formula and, when this distance is <Drod, the rods arein contact. A clustering analysis is then carried out to identifythe percolating cluster of contacting rods that spans across thesupercell, whereas, nonpercolating clusters are ignored. Everyrod i in the percolating cluster is assigned a uniform voltage Vi
(no internal resistance; Rrod = 0) that is an unknown variable,except for those rods that touch the left (Vi = 1) or right (Vi = 0)edges of the supercell. Assuming that all electrical resistanceresults from contact resistance Rc between contacting rodsand writing KCL at each rod-rod junction, a system of linearequations is established. Here, one contact resistance Rc =2 k� is assigned to all rod-rod junctions in the system. Thisassumption of uniform contacts has previously been appliedto nanotube systems, even though the junction resistances areexpected to vary widely due to the presence of both metallicand semiconducting carbon nanotubes [9,10,24–26] and iscertainly more appropriate between metal nanowires. Note thatthe value of Rc = 2 k� is based on an estimate of the effectivecontact resistance between two silver nanowires obtained inour concurrent study by fitting simulated sheet-resistancevalues from our quasi-2D simulations to experimental datafrom well-defined silver nanowire films [20]. Furthermore, weassume contact-resistance dominated transport (Rc � Rrod) inour system. In our previous 3D simulations of rod networksin polymer nanocomposites [17–19], this assumption wasreasonable since the polymer barrier between nanotubes ornanowires increases Rc significantly [17,27–29]. Similarly,high contact resistances are reported in metal nanowirenetworks associated with residual surfactant and/or poorconformation of contacting surfaces [30–32]. Postprocessingsteps, such as thermal annealing, plasmonic welding, andelectrochemical annealing can improve the quality of thecontacts and can reduce Rc. Also, given that the length ofmetal nanowires used in transparent conductors is generallyon the order of 5–20 μm, which is significantly larger thanthe mean free path of electrons (λ ≈ 30 nm for Ag andλ ≈ 20 nm for Cu [33]), Rnw can be significant. Naturally, thespecifics of nanowire synthesis and nanowire film fabricationand processing can alter the applicability of our Rc � Rrod
assumption.The system of linear equations established by apply-
ing KCL to all active junctions is then solved using thepreconditioned conjugate gradient iterative method [34] as
032134-2
ELECTRICAL PERCOLATION IN QUASI-TWO- . . . PHYSICAL REVIEW E 88, 032134 (2013)
implemented in the Portable, Extensible Toolkit for ScientificComputation package where the incomplete LU factorizationpreconditioner is used to obtain the cluster conductance. Thisentire procedure is repeated to obtain an ensemble-averagedconductance, achieving a standard deviation of less than 10%of the mean value in all cases. The conductivity of the rodnetwork is calculated by normalizing the conductance bythe dimensions of the supercell. For correspondence betweensimulation and physical units, we set Drod = 50 nm in allcases, an experimentally typical value of the diameter of metalnanowires used for transparent conductors.
III. RESULTS AND DISCUSSION
A. Percolation thresholds from quasi-2D simulations
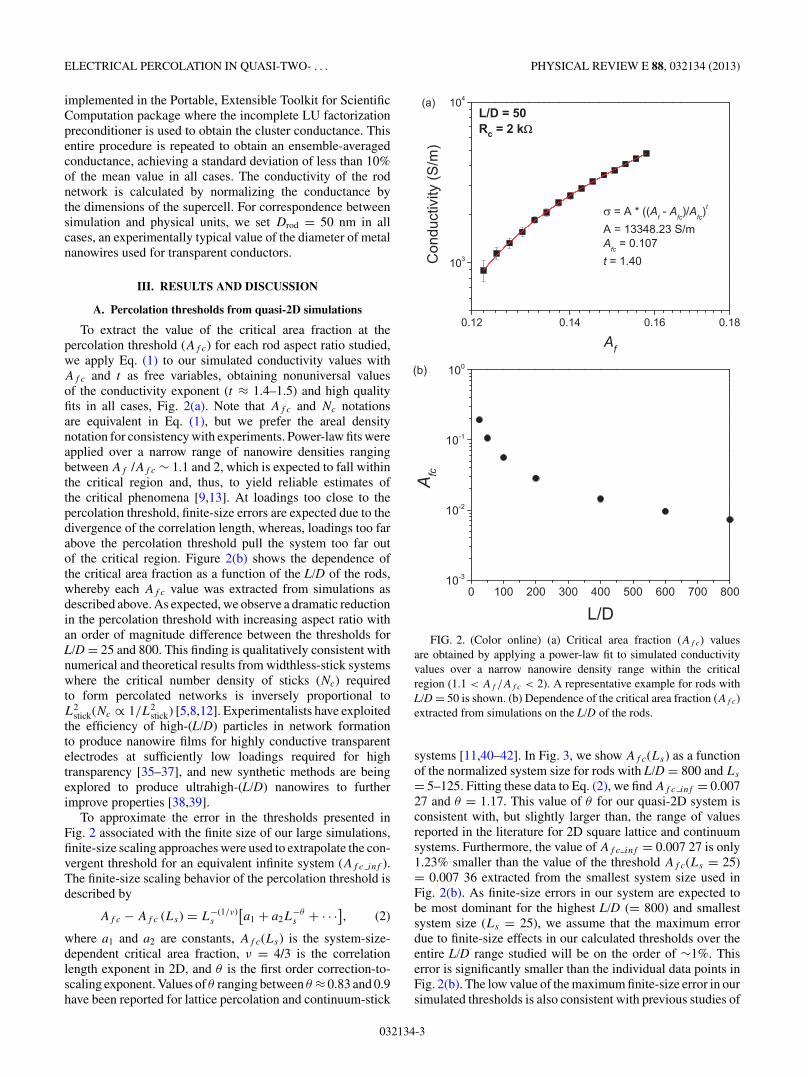
To extract the value of the critical area fraction at thepercolation threshold (Af c) for each rod aspect ratio studied,we apply Eq. (1) to our simulated conductivity values withAf c and t as free variables, obtaining nonuniversal valuesof the conductivity exponent (t ≈ 1.4–1.5) and high qualityfits in all cases, Fig. 2(a). Note that Af c and Nc notationsare equivalent in Eq. (1), but we prefer the areal densitynotation for consistency with experiments. Power-law fits wereapplied over a narrow range of nanowire densities rangingbetween Af /Af c ∼ 1.1 and 2, which is expected to fall withinthe critical region and, thus, to yield reliable estimates ofthe critical phenomena [9,13]. At loadings too close to thepercolation threshold, finite-size errors are expected due to thedivergence of the correlation length, whereas, loadings too farabove the percolation threshold pull the system too far outof the critical region. Figure 2(b) shows the dependence ofthe critical area fraction as a function of the L/D of the rods,whereby each Af c value was extracted from simulations asdescribed above. As expected, we observe a dramatic reductionin the percolation threshold with increasing aspect ratio withan order of magnitude difference between the thresholds forL/D = 25 and 800. This finding is qualitatively consistent withnumerical and theoretical results from widthless-stick systemswhere the critical number density of sticks (Nc) requiredto form percolated networks is inversely proportional toL2
stick(Nc ∝ 1/L2stick) [5,8,12]. Experimentalists have exploited
the efficiency of high-(L/D) particles in network formationto produce nanowire films for highly conductive transparentelectrodes at sufficiently low loadings required for hightransparency [35–37], and new synthetic methods are beingexplored to produce ultrahigh-(L/D) nanowires to furtherimprove properties [38,39].
To approximate the error in the thresholds presented inFig. 2 associated with the finite size of our large simulations,finite-size scaling approaches were used to extrapolate the con-vergent threshold for an equivalent infinite system (Af c inf ).The finite-size scaling behavior of the percolation threshold isdescribed by
Af c − Af c (Ls) = L−(1/ν)s
[a1 + a2L
−θs + · · ·], (2)
where a1 and a2 are constants, Af c(Ls) is the system-size-dependent critical area fraction, ν = 4/3 is the correlationlength exponent in 2D, and θ is the first order correction-to-scaling exponent. Values of θ ranging between θ ≈ 0.83 and 0.9have been reported for lattice percolation and continuum-stick
FIG. 2. (Color online) (a) Critical area fraction (Af c) valuesare obtained by applying a power-law fit to simulated conductivityvalues over a narrow nanowire density range within the criticalregion (1.1 < Af /Af c < 2). A representative example for rods withL/D = 50 is shown. (b) Dependence of the critical area fraction (Af c)extracted from simulations on the L/D of the rods.
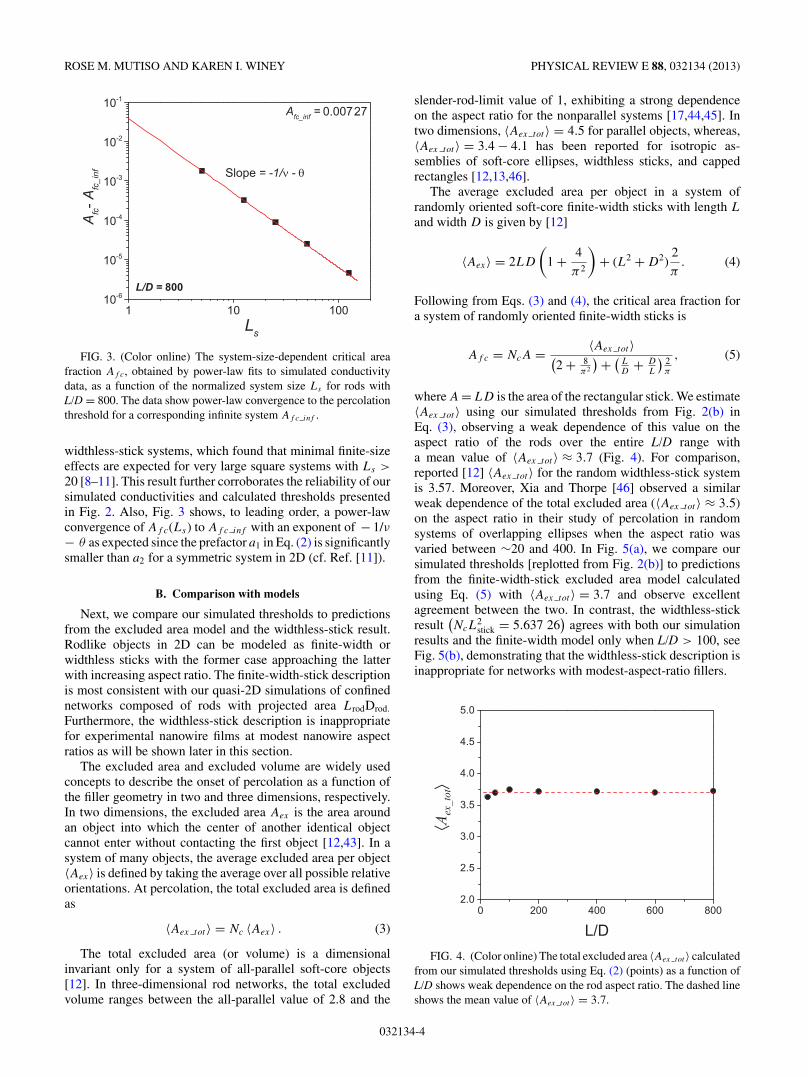
systems [11,40–42]. In Fig. 3, we show Af c(Ls) as a functionof the normalized system size for rods with L/D = 800 and Ls
= 5–125. Fitting these data to Eq. (2), we find Af c inf = 0.00727 and θ = 1.17. This value of θ for our quasi-2D system isconsistent with, but slightly larger than, the range of valuesreported in the literature for 2D square lattice and continuumsystems. Furthermore, the value of Af c inf = 0.007 27 is only1.23% smaller than the value of the threshold Af c(Ls = 25)= 0.007 36 extracted from the smallest system size used inFig. 2(b). As finite-size errors in our system are expected tobe most dominant for the highest L/D (= 800) and smallestsystem size (Ls = 25), we assume that the maximum errordue to finite-size effects in our calculated thresholds over theentire L/D range studied will be on the order of ∼1%. Thiserror is significantly smaller than the individual data points inFig. 2(b). The low value of the maximum finite-size error in oursimulated thresholds is also consistent with previous studies of
032134-3
ROSE M. MUTISO AND KAREN I. WINEY PHYSICAL REVIEW E 88, 032134 (2013)
0.00727
Slope
FIG. 3. (Color online) The system-size-dependent critical areafraction Af c, obtained by power-law fits to simulated conductivitydata, as a function of the normalized system size Ls for rods withL/D = 800. The data show power-law convergence to the percolationthreshold for a corresponding infinite system Af c inf .
widthless-stick systems, which found that minimal finite-sizeeffects are expected for very large square systems with Ls >
20 [8–11]. This result further corroborates the reliability of oursimulated conductivities and calculated thresholds presentedin Fig. 2. Also, Fig. 3 shows, to leading order, a power-lawconvergence of Af c(Ls) to Af c inf with an exponent of − 1/ν− θ as expected since the prefactor a1 in Eq. (2) is significantlysmaller than a2 for a symmetric system in 2D (cf. Ref. [11]).
B. Comparison with models
Next, we compare our simulated thresholds to predictionsfrom the excluded area model and the widthless-stick result.Rodlike objects in 2D can be modeled as finite-width orwidthless sticks with the former case approaching the latterwith increasing aspect ratio. The finite-width-stick descriptionis most consistent with our quasi-2D simulations of confinednetworks composed of rods with projected area LrodDrod.
Furthermore, the widthless-stick description is inappropriatefor experimental nanowire films at modest nanowire aspectratios as will be shown later in this section.
The excluded area and excluded volume are widely usedconcepts to describe the onset of percolation as a function ofthe filler geometry in two and three dimensions, respectively.In two dimensions, the excluded area Aex is the area aroundan object into which the center of another identical objectcannot enter without contacting the first object [12,43]. In asystem of many objects, the average excluded area per object〈Aex〉 is defined by taking the average over all possible relativeorientations. At percolation, the total excluded area is definedas
〈Aex tot 〉 = Nc 〈Aex〉 . (3)
The total excluded area (or volume) is a dimensionalinvariant only for a system of all-parallel soft-core objects[12]. In three-dimensional rod networks, the total excludedvolume ranges between the all-parallel value of 2.8 and the
slender-rod-limit value of 1, exhibiting a strong dependenceon the aspect ratio for the nonparallel systems [17,44,45]. Intwo dimensions, 〈Aex tot 〉 = 4.5 for parallel objects, whereas,〈Aex tot 〉 = 3.4 − 4.1 has been reported for isotropic as-semblies of soft-core ellipses, widthless sticks, and cappedrectangles [12,13,46].
The average excluded area per object in a system ofrandomly oriented soft-core finite-width sticks with length L
and width D is given by [12]
〈Aex〉 = 2LD
(1 + 4
π2
)+ (L2 + D2)
2
π. (4)
Following from Eqs. (3) and (4), the critical area fraction fora system of randomly oriented finite-width sticks is
Af c = NcA = 〈Aex tot 〉(2 + 8
π2
) + (LD
+ DL
)2π
, (5)
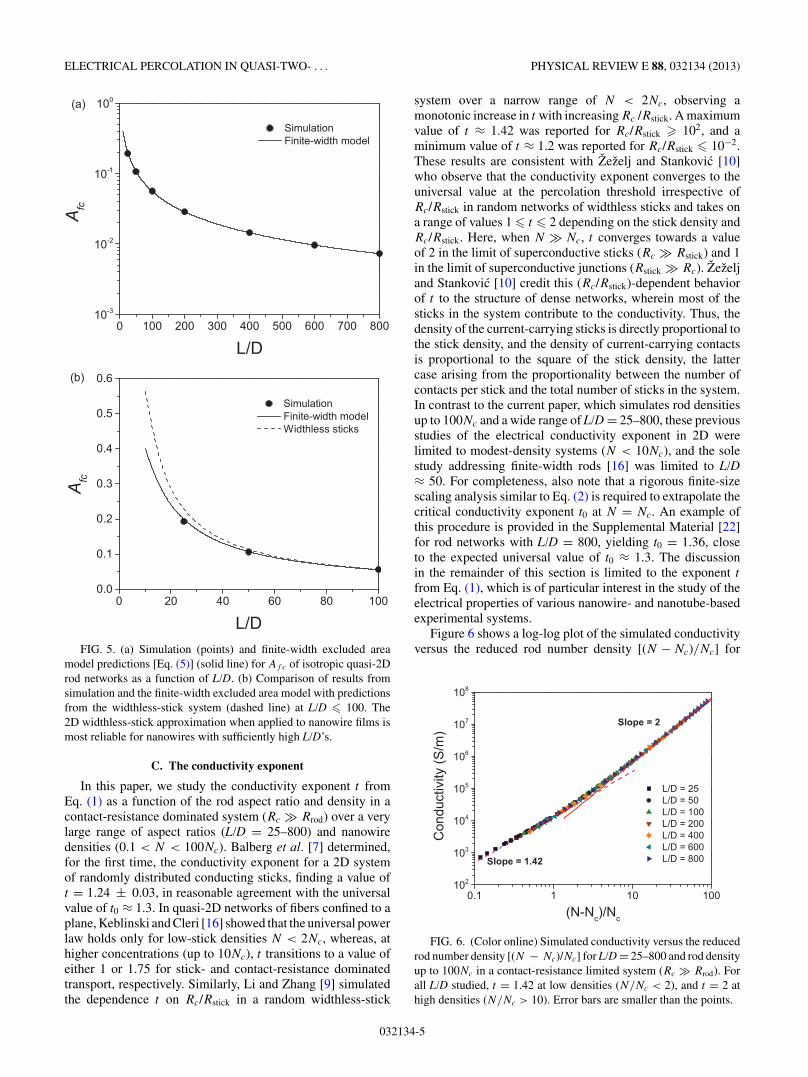
where A = LD is the area of the rectangular stick. We estimate〈Aex tot 〉 using our simulated thresholds from Fig. 2(b) inEq. (3), observing a weak dependence of this value on theaspect ratio of the rods over the entire L/D range witha mean value of 〈Aex tot 〉 ≈ 3.7 (Fig. 4). For comparison,reported [12] 〈Aex tot 〉 for the random widthless-stick systemis 3.57. Moreover, Xia and Thorpe [46] observed a similarweak dependence of the total excluded area (〈Aex tot 〉 ≈ 3.5)on the aspect ratio in their study of percolation in randomsystems of overlapping ellipses when the aspect ratio wasvaried between ∼20 and 400. In Fig. 5(a), we compare oursimulated thresholds [replotted from Fig. 2(b)] to predictionsfrom the finite-width-stick excluded area model calculatedusing Eq. (5) with 〈Aex tot 〉 = 3.7 and observe excellentagreement between the two. In contrast, the widthless-stickresult
(NcL
2stick = 5.637 26
)agrees with both our simulation
results and the finite-width model only when L/D > 100, seeFig. 5(b), demonstrating that the widthless-stick description isinappropriate for networks with modest-aspect-ratio fillers.
⟨Aex_tot
⟩
FIG. 4. (Color online) The total excluded area 〈Aex tot 〉 calculatedfrom our simulated thresholds using Eq. (2) (points) as a function ofL/D shows weak dependence on the rod aspect ratio. The dashed lineshows the mean value of 〈Aex tot 〉 = 3.7.
032134-4
ELECTRICAL PERCOLATION IN QUASI-TWO- . . . PHYSICAL REVIEW E 88, 032134 (2013)
FIG. 5. (a) Simulation (points) and finite-width excluded areamodel predictions [Eq. (5)] (solid line) for Af c of isotropic quasi-2Drod networks as a function of L/D. (b) Comparison of results fromsimulation and the finite-width excluded area model with predictionsfrom the widthless-stick system (dashed line) at L/D � 100. The2D widthless-stick approximation when applied to nanowire films ismost reliable for nanowires with sufficiently high L/D’s.
C. The conductivity exponent
In this paper, we study the conductivity exponent t fromEq. (1) as a function of the rod aspect ratio and density in acontact-resistance dominated system (Rc � Rrod) over a verylarge range of aspect ratios (L/D = 25–800) and nanowiredensities (0.1 < N < 100Nc). Balberg et al. [7] determined,for the first time, the conductivity exponent for a 2D systemof randomly distributed conducting sticks, finding a value oft = 1.24 ± 0.03, in reasonable agreement with the universalvalue of t0 ≈ 1.3. In quasi-2D networks of fibers confined to aplane, Keblinski and Cleri [16] showed that the universal powerlaw holds only for low-stick densities N < 2Nc, whereas, athigher concentrations (up to 10Nc), t transitions to a value ofeither 1 or 1.75 for stick- and contact-resistance dominatedtransport, respectively. Similarly, Li and Zhang [9] simulatedthe dependence t on Rc/Rstick in a random widthless-stick
system over a narrow range of N < 2Nc, observing amonotonic increase in t with increasing Rc /Rstick. A maximumvalue of t ≈ 1.42 was reported for Rc/Rstick � 102, and aminimum value of t ≈ 1.2 was reported for Rc/Rstick � 10−2.These results are consistent with Zezelj and Stankovic [10]who observe that the conductivity exponent converges to theuniversal value at the percolation threshold irrespective ofRc/Rstick in random networks of widthless sticks and takes ona range of values 1 � t � 2 depending on the stick density andRc/Rstick. Here, when N � Nc, t converges towards a valueof 2 in the limit of superconductive sticks (Rc � Rstick) and 1in the limit of superconductive junctions (Rstick � Rc). Zezeljand Stankovic [10] credit this (Rc/Rstick)-dependent behaviorof t to the structure of dense networks, wherein most of thesticks in the system contribute to the conductivity. Thus, thedensity of the current-carrying sticks is directly proportional tothe stick density, and the density of current-carrying contactsis proportional to the square of the stick density, the lattercase arising from the proportionality between the number ofcontacts per stick and the total number of sticks in the system.In contrast to the current paper, which simulates rod densitiesup to 100Nc and a wide range of L/D = 25–800, these previousstudies of the electrical conductivity exponent in 2D werelimited to modest-density systems (N < 10Nc), and the solestudy addressing finite-width rods [16] was limited to L/D≈ 50. For completeness, also note that a rigorous finite-sizescaling analysis similar to Eq. (2) is required to extrapolate thecritical conductivity exponent t0 at N = Nc. An example ofthis procedure is provided in the Supplemental Material [22]for rod networks with L/D = 800, yielding t0 = 1.36, closeto the expected universal value of t0 ≈ 1.3. The discussionin the remainder of this section is limited to the exponent t
from Eq. (1), which is of particular interest in the study of theelectrical properties of various nanowire- and nanotube-basedexperimental systems.
Figure 6 shows a log-log plot of the simulated conductivityversus the reduced rod number density [(N − Nc)/Nc] for
S
S
FIG. 6. (Color online) Simulated conductivity versus the reducedrod number density [(N − Nc)/Nc] for L/D = 25–800 and rod densityup to 100Nc in a contact-resistance limited system (Rc � Rrod). Forall L/D studied, t = 1.42 at low densities (N/Nc < 2), and t = 2 athigh densities (N/Nc > 10). Error bars are smaller than the points.
032134-5
ROSE M. MUTISO AND KAREN I. WINEY PHYSICAL REVIEW E 88, 032134 (2013)
L/D = 25–800 where the value of the percolation thresholdfor each aspect ratio is given in Fig. 2(b) and is convertedto number density notation. The slope gives the conductivityexponent t . Across the entire L/D range, the data showpower-law behavior with an exponent of t = 1.42 at lowdensities (N/Nc < 2) and t = 2 at high densities (N/Nc > 10)with a crossover region at intermediate densities 2 < N/Nc
< 10. The low-density behavior is consistent with the findingof Li and Zhang [9] that t ≈ 1.42 for a contact-resistancedominated network with N < 2Nc as well as with Zezeljand Stankovic [10] who report a value of the local density-dependent conductivity exponent of t(N ) ∼ 1.4–1.5 at N ∼2Nc when Rc > Rstick. In addition, the high-density behaviorin Fig. 5 is consistent with predicted convergence to t = 2 forRc � Rrod and N � Ncreported by Zezelj and Stankovic [10]and Keblinski and Cleri [16], although neither of these studiesinvestigated sufficiently high rod densities to observe a valueof t = 2.
The results presented in Fig. 6 are significant by verifyingthe high-density (N � Nc) behavior of the conductivityexponent as predicted from modest-density systems [10,16]and showing the invariance of t with rod size in quasi-2D rodnetworks.
D. Size dispersity
We previously demonstrated the capability of our simu-lation method to simulate the conductivity of random three-dimensional soft-core rod networks with arbitrary distributionsin rod size [17]. We also determined a percolation thresholdfrom our simulations of polydisperse rods with experimentallytypical Gaussian distributions in length and diameter as well asengineered bi-disperse mixtures of low- and high-aspect-ratiorods [17]. Furthermore, using empirical approximations fromour simulation data, we generalized the widely used slender-rod-limit excluded volume percolation model to account forboth finite L/D and arbitrary size dispersity. Here, we extendthis approach to study the effect of rod-size dispersity on thepercolation threshold in 2D using the example of a rod networkwith a bi-disperse distribution of rod lengths. These networksexploit the dominant contribution of high-(L/D) fillers innetwork formation (Figs. 2 and 5), whereas, capitalizing onthe availability and processability of modest-(L/D) particles.This is particularly relevant in nanowire films for transparentconductor applications whereby very high L/D (>400) isrequired to meet performance criteria for many criticalapplications [20]. To simulate a bi-disperse network, we definereference rods with L/D = 50 (LRef = 0.0125 u and DRef =0.000 25 u) and longer high-(L/D) rods with L/D = 400 (LLong
= 0.1 u and DLong = DRef) where the rod-length ratio is rL =LLong/LRef = 8. The proportion of longer rods in the network isexpressed as a relative area fraction FLong = Af Long/(Af Ref
+ Af Long) and is varied between FLong = 0 (monodisperse;L/D = 50) and FLong = 1 (monodisperse; L/D = 400). Similarto the monodisperse case, Rc = 2 k� for all rod junctionsin the network and Rrod = 0, and percolation thresholds areextracted from the simulated conductivities by applying thepower-law fit in Eq. (1). We plot the percolation threshold ofour simulated bi-disperse rod networks as a function of FLong
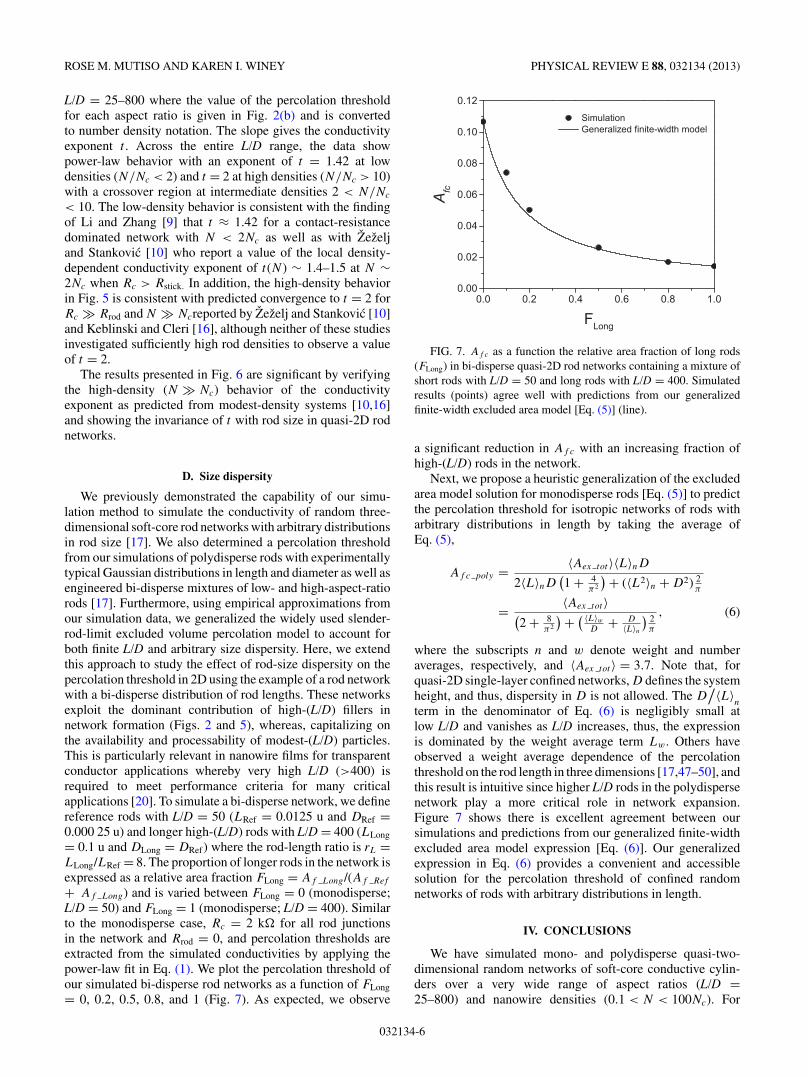
= 0, 0.2, 0.5, 0.8, and 1 (Fig. 7). As expected, we observe
FIG. 7. Af c as a function the relative area fraction of long rods(FLong) in bi-disperse quasi-2D rod networks containing a mixture ofshort rods with L/D = 50 and long rods with L/D = 400. Simulatedresults (points) agree well with predictions from our generalizedfinite-width excluded area model [Eq. (5)] (line).
a significant reduction in Af c with an increasing fraction ofhigh-(L/D) rods in the network.
Next, we propose a heuristic generalization of the excludedarea model solution for monodisperse rods [Eq. (5)] to predictthe percolation threshold for isotropic networks of rods witharbitrary distributions in length by taking the average ofEq. (5),
Af c poly = 〈Aex tot 〉〈L〉nD2〈L〉nD
(1 + 4
π2
) + (〈L2〉n + D2) 2π
= 〈Aex tot 〉(2 + 8
π2
) + ( 〈L〉wD
+ D〈L〉n
)2π
, (6)
where the subscripts n and w denote weight and numberaverages, respectively, and 〈Aex tot 〉 = 3.7. Note that, forquasi-2D single-layer confined networks, D defines the systemheight, and thus, dispersity in D is not allowed. The D
/〈L〉n
term in the denominator of Eq. (6) is negligibly small atlow L/D and vanishes as L/D increases, thus, the expressionis dominated by the weight average term Lw. Others haveobserved a weight average dependence of the percolationthreshold on the rod length in three dimensions [17,47–50], andthis result is intuitive since higher L/D rods in the polydispersenetwork play a more critical role in network expansion.Figure 7 shows there is excellent agreement between oursimulations and predictions from our generalized finite-widthexcluded area model expression [Eq. (6)]. Our generalizedexpression in Eq. (6) provides a convenient and accessiblesolution for the percolation threshold of confined randomnetworks of rods with arbitrary distributions in length.
IV. CONCLUSIONS
We have simulated mono- and polydisperse quasi-two-dimensional random networks of soft-core conductive cylin-ders over a very wide range of aspect ratios (L/D =25–800) and nanowire densities (0.1 < N < 100Nc). For
032134-6
ELECTRICAL PERCOLATION IN QUASI-TWO- . . . PHYSICAL REVIEW E 88, 032134 (2013)
monodisperse networks, we observe a significant reduction inthe percolation threshold with increasing aspect ratio. Thesepercolation thresholds are in quantitative agreement with thewidthless-stick result at L/D > 100 and are in excellentagreement with the finite-width excluded area model acrossall L/D’s studied. We also report the conductivity exponentt as a function of the rod density in a contact-resistancedominated system (Rc � Rrod) for the highest rod densitiesstudied to date. We find t = 1.42 at low densities (N/Nc
< 2) and t = 2 at high densities (N/Nc > 10) with acrossover region at intermediate densities 2 < N/Nc < 10.These results are consistent with recent numerical findingson the nonuniversality of the conductivity exponent in 2Dwidthless-stick systems [9,10,16]. In addition, we report t as afunction of the aspect ratio, observing the same nonuniversalityacross the entire aspect-ratio range of L/D = 25–800. Finally,we generalize the finite-width excluded area model to accountfor arbitrary dispersity in rod lengths, finding a weight averagedependence of the percolation threshold on the rod length.Moreover, we compare predictions from this generalized
model to results from our simulations of rod networks witha bi-disperse distribution of rod lengths, obtaining goodagreement between the two and further validating our model.
To summarize, the percolation threshold predictions fromour simulations of quasi-2D rod networks and the generalizedfinite-width excluded area model presented in this paperprovide experimentalists with valuable guidance to design andto optimize the properties of transparent conductors based onthin films of nanowires and nanotubes.
ACKNOWLEDGMENTS
This work was supported primarily by the MRSEC programof the National Science Foundation (Grant No. DMR-11-20901) and by the University Research Foundation of theUniversity of Pennsylvania. The authors acknowledge M. C.Sherrott for her contributions during the initial stages of thiswork and Professor J. Li of the Department of Nuclear Scienceand Engineering at M.I.T. for the generous use of his group’scomputer cluster.
[1] D. S. Hecht, L. B. Hu, and G. Irvin, Adv. Mater. 23, 1482 (2011).[2] S. De and J. N. Coleman, MRS Bull. 36, 774 (2011).[3] A. Kumar and C. Zhou, ACS Nano 4, 11 (2010).[4] D. Stauffer and A. Aharony, Introduction to Percolation Theory,
2nd revised ed. (Taylor & Francis, London, 2003).[5] G. E. Pike and C. H. Seager, Phys. Rev. B 10, 1421 (1974).[6] I. Balberg and N. Binenbaum, Phys. Rev. B 28, 3799 (1983).[7] I. Balberg and I. Balberg, N. Binenbaum, and C. H. Anderson,
Phys. Rev. Lett. 51, 1605 (1983).[8] J. T. Li and S. L. Zhang, Phys. Rev. E 80, 040104 (2009).[9] J. Li and S.-L. Zhang, Phys. Rev. E 81, 021120 (2010).
[10] M. Zezelj and I. Stankovic, Phys. Rev. B 86, 134202 (2012).[11] M. Zezelj, I. Stankovic, and A. Belic, Phys. Rev. E 85, 021101
(2012).[12] I. Balberg, C. H. Anderson, S. Alexander, and N. Wagner, Phys.
Rev. B 30, 3933 (1984).[13] I. Balberg, Phys. Rev. B 31, 4053 (1985).[14] L. Hu, D. S. Hecht, and G. Gruner, Nano Lett. 4, 2513 (2004).[15] H. E. Unalan, G. Fanchini, A. Kanwal, A. Du Pasquier, and
M. Chhowalla, Nano Lett. 6, 677 (2006).[16] P. Keblinski and F. Cleri, Phys. Rev. B 69, 184201 (2004).[17] R. M. Mutiso, M. C. Sherrott, J. Li, and K. I. Winey, Phys. Rev.
B 86, 214306 (2012).[18] S. I. White, B. A. DiDonna, M. F. Mu, T. C. Lubensky, and K. I.
Winey, Phys. Rev. B 79, 024301 (2009).[19] S. I. White, R. M. Mutiso, P. M. Vora, D. Jahnke, S. Hsu, J. M.
Kikkawa, J. Li, J. E. Fischer, and K. I. Winey, Adv. Funct. Mater.20, 2709 (2010).
[20] R. M. Mutiso, M. C. Sherrott, A. R. Rathmell, B. J. Wiley, andK. I. Winey, ACS Nano (2013), doi: 10.1021/nn403324t.
[21] S. Kirkpatrick, Rev. Mod. Phys. 45, 574 (1973).[22] See Supplemental Material at http://link.aps.org/supplemental/
10.1103/PhysRevE.88.032134 for representative renderings ofsimulated rod networks and additional discussion of the conduc-tivity exponent.
[23] Y.-B. Yi, C.-W. Wang, and A. M. Sastry, J. Electrochem. Soc.151, A1292 (2004).
[24] M. S. Fuhrer, J. Nygard, L. Shih, M. Foreror, Y.-G. Yoon, M. S.C. Mazzoni, H. J. Choi, J. Ihm, S. G. Louie, A. Zettl, and P. L.McEuen, Science 288, 494 (2000).
[25] A. Behnam, J. Guo, and A. Ural, J. Appl. Phys. 102, 044313(2007).
[26] S. Kumar, J. Y. Murthy, and M. A. Alam, Phys. Rev. Lett. 95,066802 (2005).
[27] I. Balberg, Phys. Rev. Lett. 59, 1305 (1987).[28] N. Johner, C. Grimaldi, I. Balberg, and P. Ryser, Phys. Rev. B
77, 174204 (2008).[29] G. Ambrosetti, N. Johner, C. Grimaldi, T. Maeder, P. Ryser, and
A. Danani, J. Appl. Phys. 106, 016103 (2009).[30] E. C. Garnett, W. Cai, J. J. Cha, F. Mahmood, S. T. Connor, M. G.
Christoforo, Y. Cui, M. D. McGehee, and M. L. Brongersma,Nat. Mater. 11, 241 (2012).
[31] L. B. Hu, H. S. Kim, J. Y. Lee, P. Peumans, and Y. Cui, ACSNano 4, 2955 (2010).
[32] J. Y. Lee, S. T. Connor, Y. Cui, and P. Peumans, Nano Lett. 8,689 (2008).
[33] A. Bid, A. Bora, and A. K. Raychaudhuri, Phys. Rev. B 74,035426 (2006).
[34] M. R. Hestenes and E. Stiefel, J. Res. Natl. Bur. Stand. 49, 409(1952).
[35] S. M. Bergin, Y. H. Chen, A. R. Rathmell, P. Charbonneau, Z. Y.Li, and B. J. Wiley, Nanoscale 4, 1996 (2012).
[36] J. Lee, P. Lee, H. Lee, D. Lee, S. S. Lee, and S. H. Ko, Nanoscale4, 6408 (2012).
[37] H. Wu, L. B. Hu, M. W. Rowell, D. S. Kong, J. J. Cha, J. R.McDonough, J. Zhu, Y. A. Yang, M. D. McGehee, and Y. Cui,Nano Lett. 10, 4242 (2010).
[38] P. Lee, J. Lee, H. Lee, J. Yeo, S. Hong, K. H. Nam,D. Lee, S. S. Lee, and S. H. Ko, Adv. Mater. 24, 3326(2012).
032134-7
ROSE M. MUTISO AND KAREN I. WINEY PHYSICAL REVIEW E 88, 032134 (2013)
[39] D. Zhang, R. Wang, M. Wen, D. Weng, X. Cui, J. Sun, H. Li,and Y. Lu, J. Am. Chem. Soc. 134, 14283 (2012).
[40] A. Aharony and J. P. Hovi, Phys. Rev. Lett. 72, 1941 (1994).[41] J. P. Hovi and A. Aharony, Phys. Rev. E 53, 235 (1996).[42] R. M. Ziff and M. E. J. Newman, Phys. Rev. E 66, 016129
(2002).[43] L. Onsager, Ann. N.Y. Acad. Sci. 51, 627 (1949).[44] Z. Neda, R. Florian, and Y. Brechet, Phys. Rev. E 59, 3717
(1999).
[45] L. Berhan and A. M. Sastry, Phys. Rev. E 75, 041120 (2007).[46] W. Xia and M. F. Thorpe, Phys. Rev. A 38, 2650 (1988).[47] A. V. Kyrylyuk and P. van der Schoot, Proc. Natl. Acad. Sci.
USA 105, 8221 (2008).[48] R. H. J. Otten and P. van der Schoot, Phys. Rev. Lett. 103, 225704
(2009).[49] B. Nigro, C. Grimaldi, P. Ryser, A. P. Chatterjee, and P. van der
Schoot, Phys. Rev. Lett. 110, 015701 (2013).[50] A. P. Chatterjee, J. Chem. Phys. 132, 224905 (2010).
032134-8