Embed Size (px)
Citation preview

Electric Vehicles:
Performance, Cost,
Penetration
John German
October 27, 2014
CCAP MAIN-Latin American Regional Dialogue
Washington, DC

ICCT is working with governments
in the top vehicle markets worldwide
Number of light-duty vehicles on the road in 2010
2
Driving Electrification – A “kick-off” report
3
http://www.theicct.org/driving-electrification-global-
comparison-fiscal-policy-electric-vehicles
4
The starting point How many EVs are
sold, and where?
5
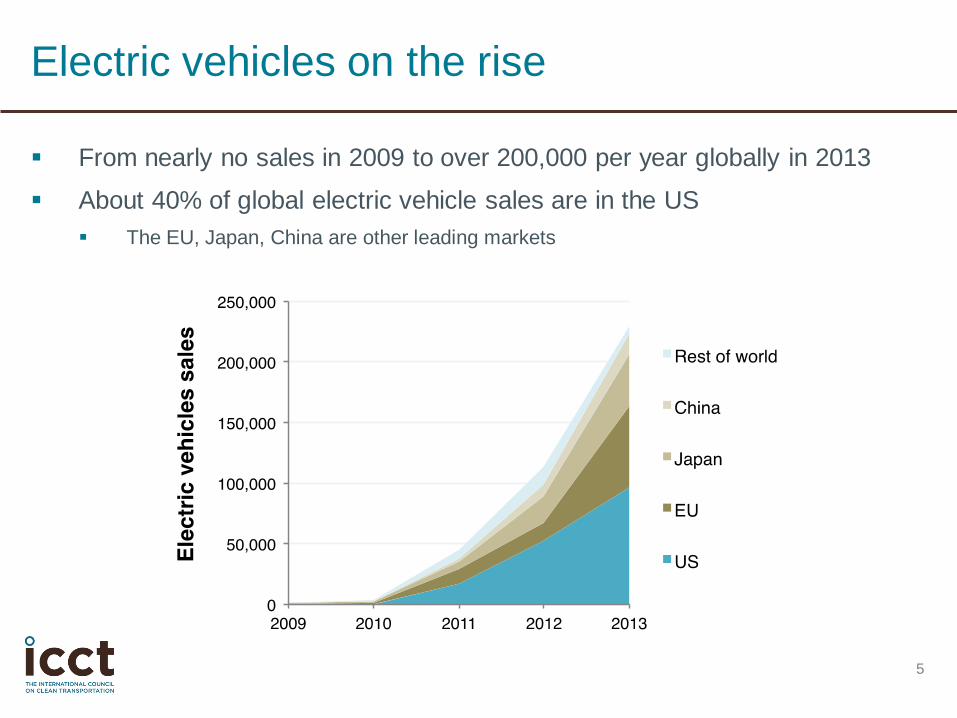
From nearly no sales in 2009 to over 200,000 per year globally in 2013
About 40% of global electric vehicle sales are in the US
The EU, Japan, China are other leading markets
Electric vehicles on the rise
6
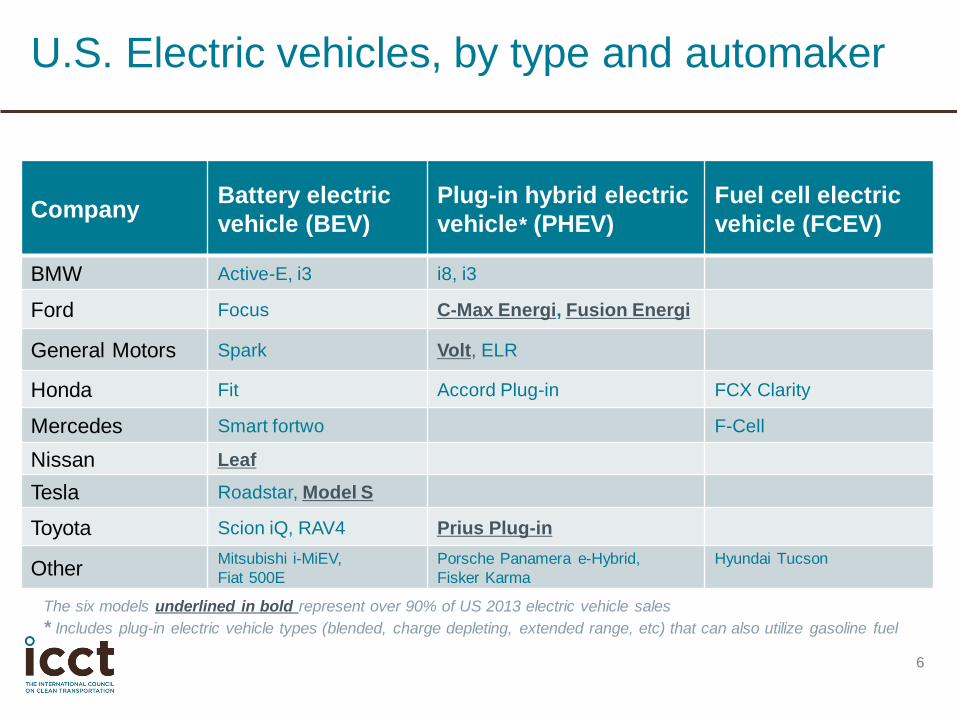
Company Battery electric
vehicle (BEV)
Plug-in hybrid electric
vehicle* (PHEV)
Fuel cell electric
vehicle (FCEV)
BMW Active-E, i3 i8, i3
Ford Focus C-Max Energi, Fusion Energi
General Motors Spark Volt, ELR
Honda Fit Accord Plug-in FCX Clarity
Mercedes Smart fortwo F-Cell
Nissan Leaf
Tesla Roadstar, Model S
Toyota Scion iQ, RAV4 Prius Plug-in
Other Mitsubishi i-MiEV,
Fiat 500E
Porsche Panamera e-Hybrid,
Fisker Karma
Hyundai Tucson
U.S. Electric vehicles, by type and automaker
The six models underlined in bold represent over 90% of US 2013 electric vehicle sales
* Includes plug-in electric vehicle types (blended, charge depleting, extended range, etc) that can also utilize gasoline fuel

Li-ion Batteries – Early stages of Development
7
Current
PHEV Cells
Current BEV Cells
xEV Battery Technology and Market, Menahem Anderman,Advanced Automotive Batteries, February 2014
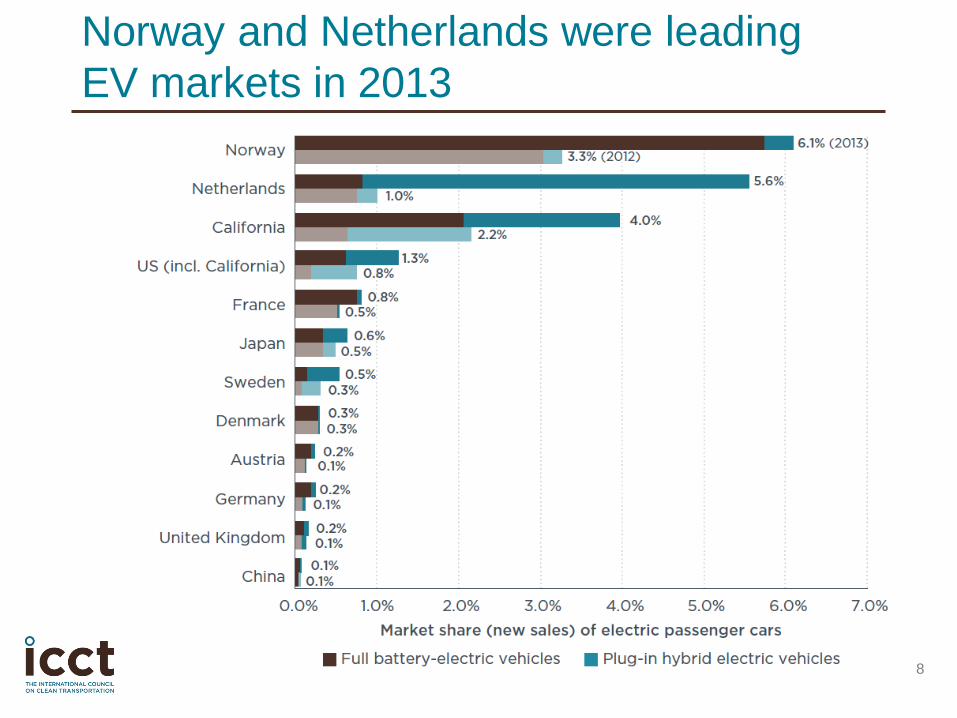
Norway and Netherlands were leading
EV markets in 2013
8
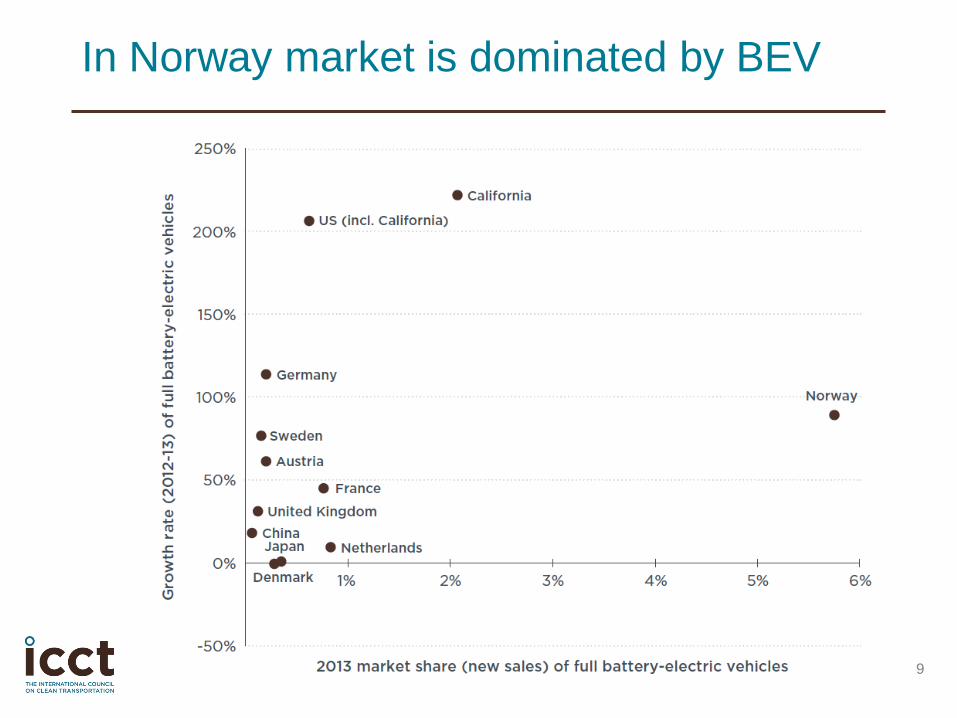
In Norway market is dominated by BEV
9
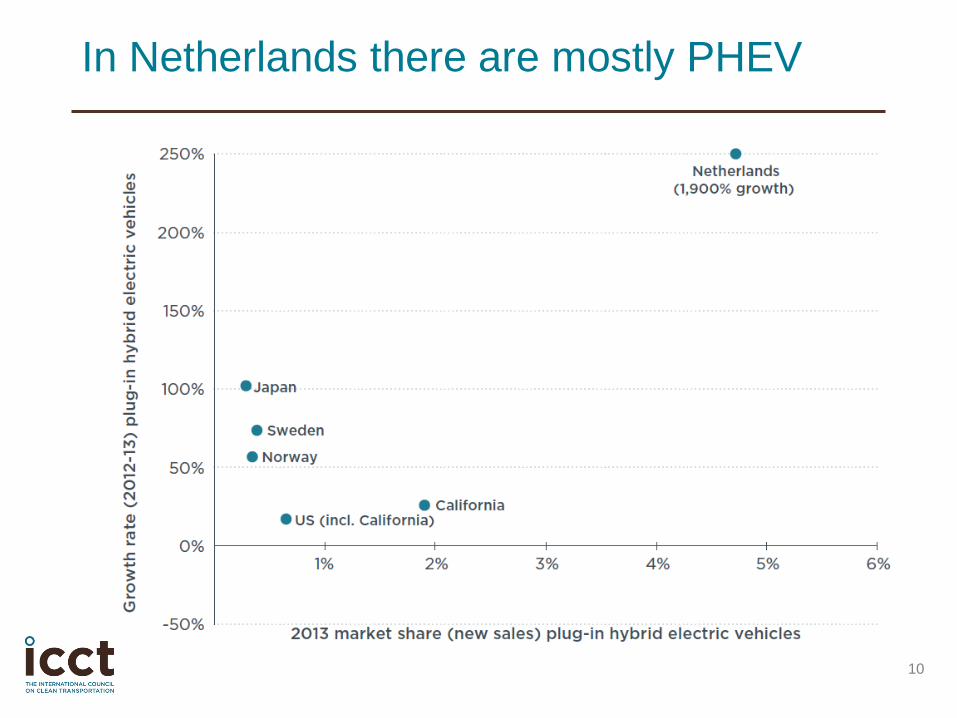
In Netherlands there are mostly PHEV
10
11
Incentives and
Policy
Why are EVs
successful in some
markets but not in
others?
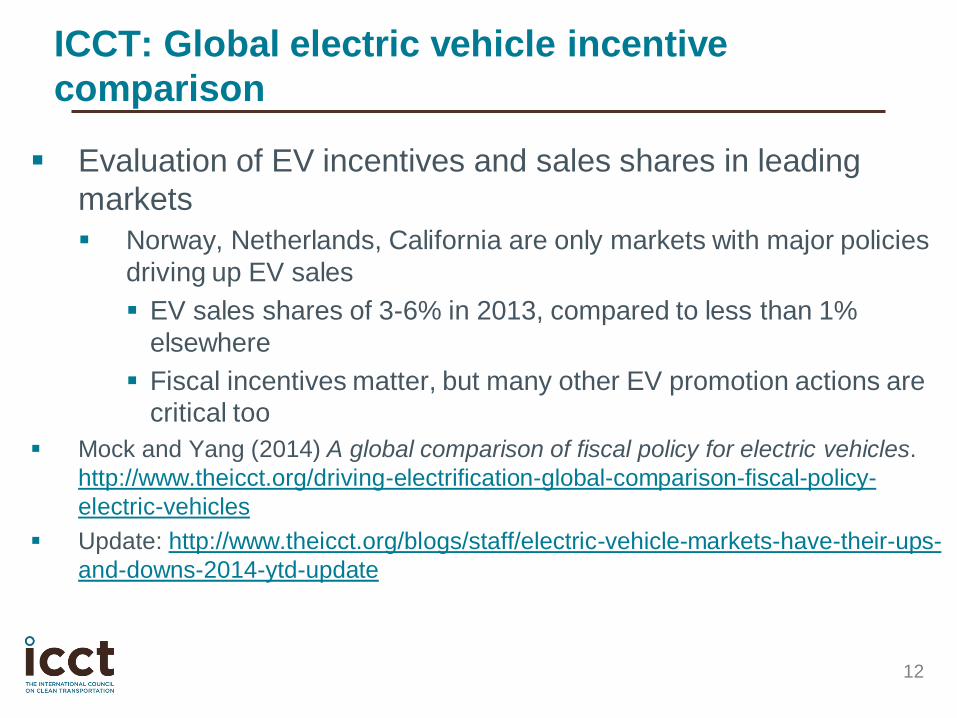
ICCT: Global electric vehicle incentive
comparison
Evaluation of EV incentives and sales shares in leading
markets
Norway, Netherlands, California are only markets with major policies
driving up EV sales
EV sales shares of 3-6% in 2013, compared to less than 1%
elsewhere
Fiscal incentives matter, but many other EV promotion actions are
critical too
Mock and Yang (2014) A global comparison of fiscal policy for electric vehicles.
http://www.theicct.org/driving-electrification-global-comparison-fiscal-policy-
electric-vehicles
Update: http://www.theicct.org/blogs/staff/electric-vehicle-markets-have-their-ups-
and-downs-2014-ytd-update
12
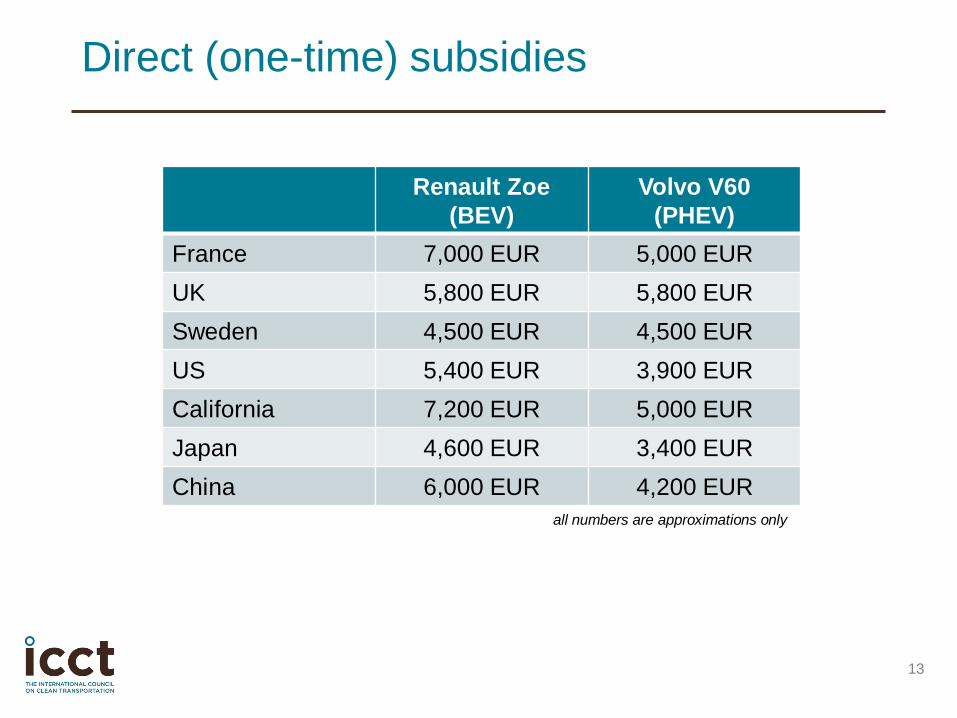
Direct (one-time) subsidies
13
Renault Zoe
(BEV)
Volvo V60
(PHEV)
France 7,000 EUR 5,000 EUR
UK 5,800 EUR 5,800 EUR
Sweden 4,500 EUR 4,500 EUR
US 5,400 EUR 3,900 EUR
California 7,200 EUR 5,000 EUR
Japan 4,600 EUR 3,400 EUR
China 6,000 EUR 4,200 EUR
all numbers are approximations only

Other fiscal incentives
14
• Value added tax (VAT) savings
e.g. Norway: 4,500 EUR (BEV), 0 EUR (PHEV)
• One-time purchase / registration tax savings
e.g. Denmark: 14,000 EUR (BEV), 17,000 EUR (PHEV)
• Annual circulation tax savings
e.g. Netherlands: 380 EUR (BEV), 1,900 EUR (PHEV)
• Company car tax savings
e.g. Netherlands: 1,100 EUR (BEV), 4,300 EUR (PHEV)
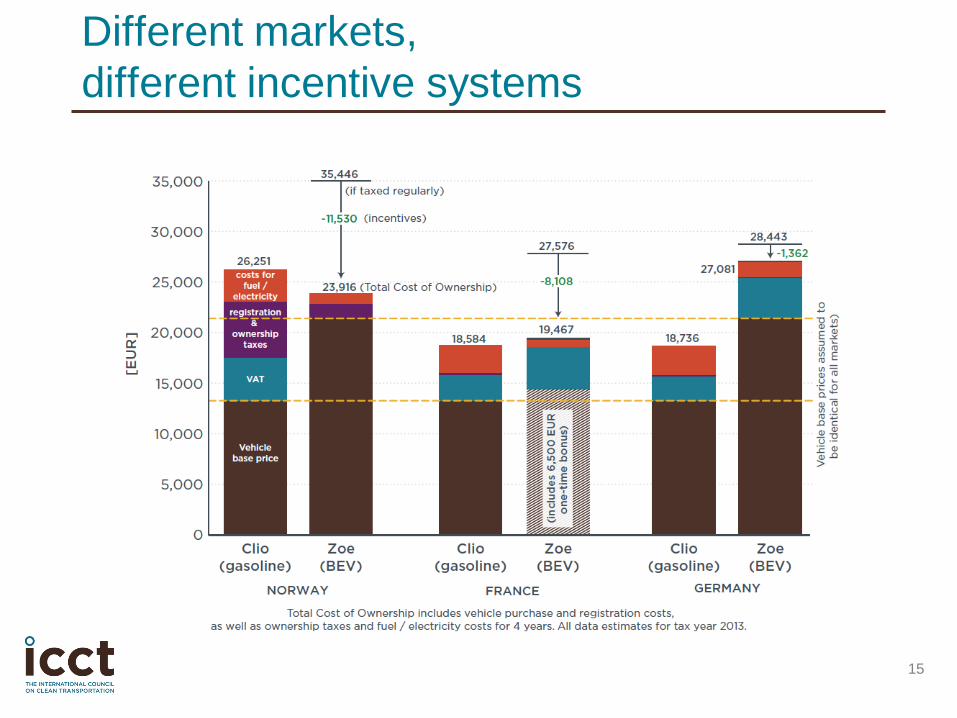
Different markets,
different incentive systems
15
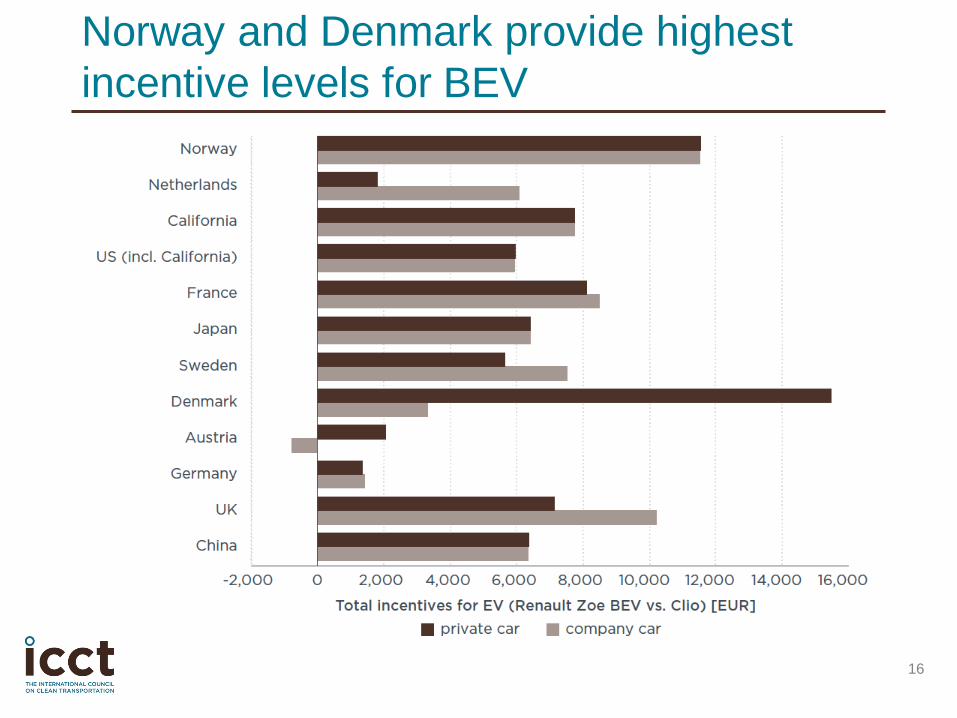
Norway and Denmark provide highest
incentive levels for BEV
16

Netherlands and UK provide highest
incentive levels for PHEV
17

High incentive level leads to high sales
– but not always!
18
19
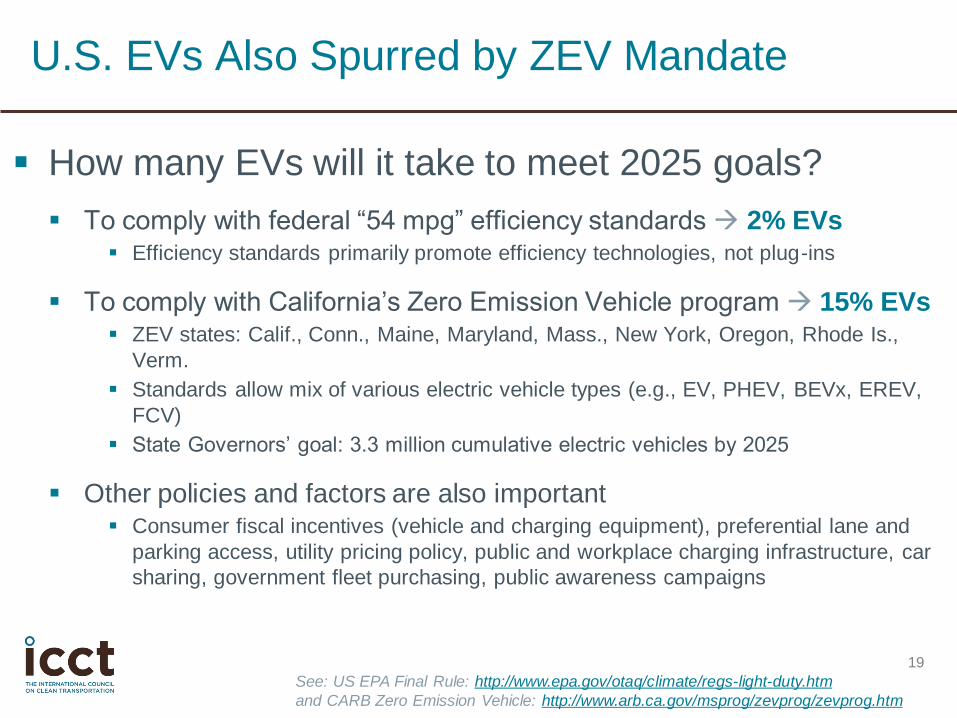
How many EVs will it take to meet 2025 goals?
To comply with federal “54 mpg” efficiency standards 2% EVs Efficiency standards primarily promote efficiency technologies, not plug-ins
To comply with California’s Zero Emission Vehicle program 15% EVs ZEV states: Calif., Conn., Maine, Maryland, Mass., New York, Oregon, Rhode Is.,
Verm.
Standards allow mix of various electric vehicle types (e.g., EV, PHEV, BEVx, EREV,
FCV)
State Governors’ goal: 3.3 million cumulative electric vehicles by 2025
Other policies and factors are also important Consumer fiscal incentives (vehicle and charging equipment), preferential lane and
parking access, utility pricing policy, public and workplace charging infrastructure, car
sharing, government fleet purchasing, public awareness campaigns
U.S. EVs Also Spurred by ZEV Mandate
See: US EPA Final Rule: http://www.epa.gov/otaq/climate/regs-light-duty.htm
and CARB Zero Emission Vehicle: http://www.arb.ca.gov/msprog/zevprog/zevprog.htm
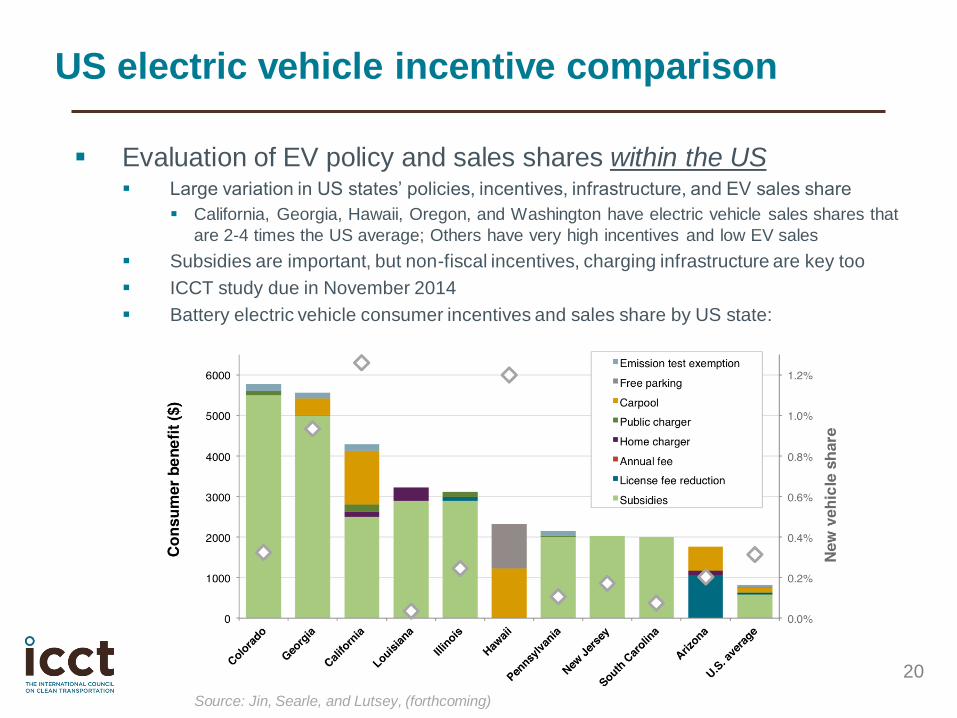
US electric vehicle incentive comparison
Evaluation of EV policy and sales shares within the US Large variation in US states’ policies, incentives, infrastructure, and EV sales share
California, Georgia, Hawaii, Oregon, and Washington have electric vehicle sales shares that
are 2-4 times the US average; Others have very high incentives and low EV sales
Subsidies are important, but non-fiscal incentives, charging infrastructure are key too
ICCT study due in November 2014
Battery electric vehicle consumer incentives and sales share by US state:
20
Source: Jin, Searle, and Lutsey, (forthcoming)
21
Efficiency and Cost
National Research Council (2013) Transitions
to Alternative Vehicles and Fuels.
http://www.nap.edu/catalog.php?record_id=18
264 (contributor)
Greene et al (2014) Transitioning to Electric
Drive Vehicles.
http://www.theicct.org/transitioning-electric-
drive-vehicles
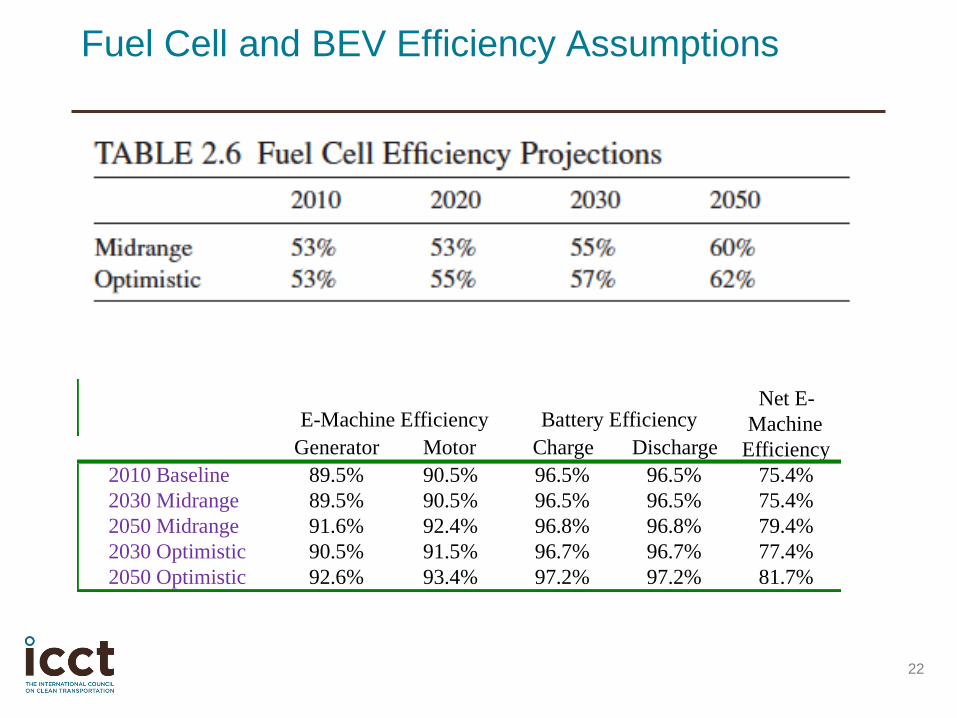
Fuel Cell and BEV Efficiency Assumptions
22
Generator Motor Charge Discharge
2010 Baseline 89.5% 90.5% 96.5% 96.5% 75.4%
2030 Midrange 89.5% 90.5% 96.5% 96.5% 75.4%
2050 Midrange 91.6% 92.4% 96.8% 96.8% 79.4%
2030 Optimistic 90.5% 91.5% 96.7% 96.7% 77.4%
2050 Optimistic 92.6% 93.4% 97.2% 97.2% 81.7%
Net E-
Machine
Efficiency
Battery EfficiencyE-Machine Efficiency

Load Reduction
23
Weight reduction
20-25% by 2030 and 30-40% by 2050
Body-on-frame trucks improved 20% less
Tire rolling resistance
Decreased 2%/year 1980-2010
Assumed 16-25% by 2030 and 30-38% by 2050
Aerodynamic drag
15-20% Cd reduction by 2030 and 25-30% by 2050
Assumed 5% reduction in frontal area (2030 optimistic and 2050 midrange)

Cost Assumptions
High volume production
ICE costs based upon 2007 MIT
estimates
Differential costs (ICE to hybrid, hybrid to
PHEV, BEV, and FCV) carefully assessed
Hybrid system components costs based on FEV
teardown studies
Powertrains downsized to maintain constant
performance with load reduction
Large cost reductions in battery and fuel cell
24
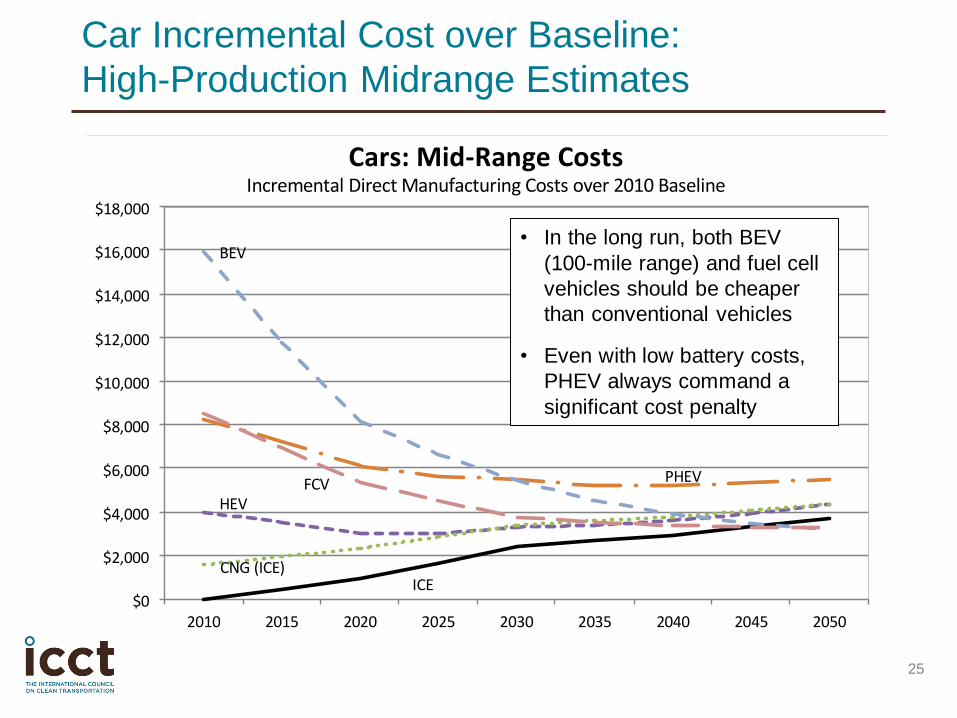
Car Incremental Cost over Baseline:
High-Production Midrange Estimates
ICE
HEV
CNG (ICE)
PHEV
BEV
FCV
$0
$2,000
$4,000
$6,000
$8,000
$10,000
$12,000
$14,000
$16,000
$18,000
2010 2015 2020 2025 2030 2035 2040 2045 2050
Cars: Mid-Range CostsIncremental Direct Manufacturing Costs over 2010 Baseline
25
• In the long run, both BEV
(100-mile range) and fuel cell
vehicles should be cheaper
than conventional vehicles
• Even with low battery costs,
PHEV always command a
significant cost penalty
26
Outlook What are the future
considerations for
EVs?
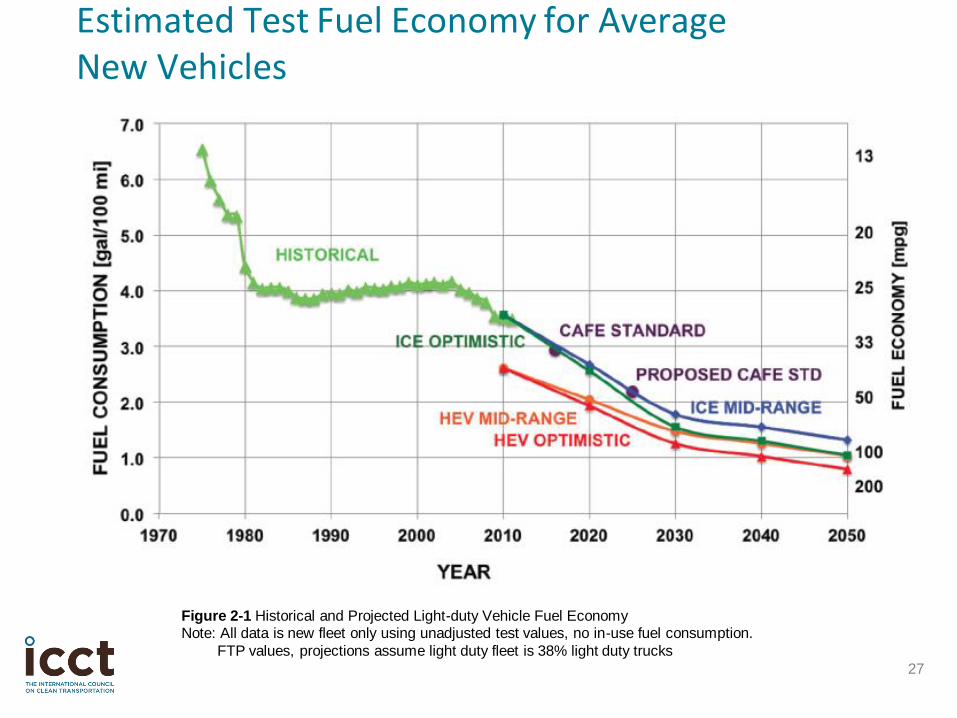
Estimated Test Fuel Economy for Average New Vehicles
27
Figure 2-1 Historical and Projected Light-duty Vehicle Fuel Economy Note: All data is new fleet only using unadjusted test values, no in-use fuel consumption.
FTP values, projections assume light duty fleet is 38% light duty trucks

Fuels: Electricity versus Hydrogen
Both are energy carriers – can be dirty or clean, depending on
how created
Infrastructure Vehicle
Electricity
• Existing electricity
generation
• Although need to add safe
public charging stations and
clean up grid
• More efficient than fuel cell
• Recharge time with Li-ion
is inadequate (30+ min)
• Without energy storage
breakthrough, limited to 2nd
or 3rd vehicle in multivehicle
households
Hydrogen
• Must create hydrogen
competitively and build new
infrastructure for dispensing
• Remote generation (wind,
geothermal, solar) potential
advantage
Better than ICE in all ways:
Fast refill, good range,
more efficient, cheaper,
quieter, faster torque
response, more torque,
more room, safer
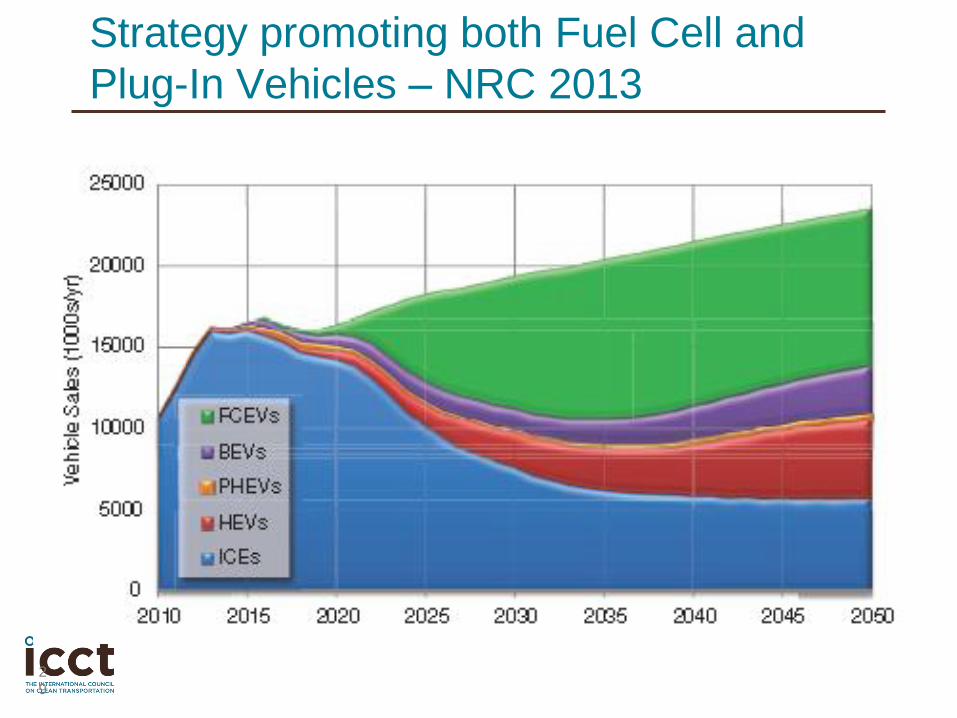
Strategy promoting both Fuel Cell and
Plug-In Vehicles – NRC 2013
29
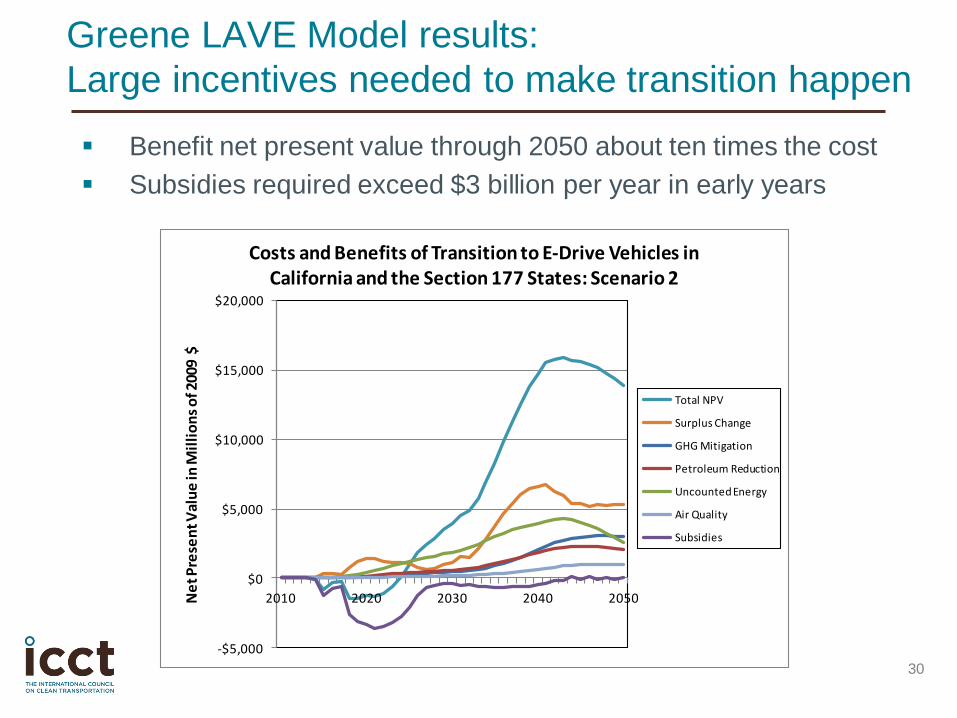
Greene LAVE Model results:
Large incentives needed to make transition happen
Benefit net present value through 2050 about ten times the cost
Subsidies required exceed $3 billion per year in early years
30
-$5,000
$0
$5,000
$10,000
$15,000
$20,000
2010 2020 2030 2040 2050Ne
t Pre
sen
t Val
ue
in M
illi
on
s o
f 200
9 $
Costs and Benefits of Transition to E-Drive Vehicles in California and the Section 177 States: Scenario 2
Total NPV
Surplus Change
GHG Mitigation
Petroleum Reduction
Uncounted Energy
Air Quality
Subsidies
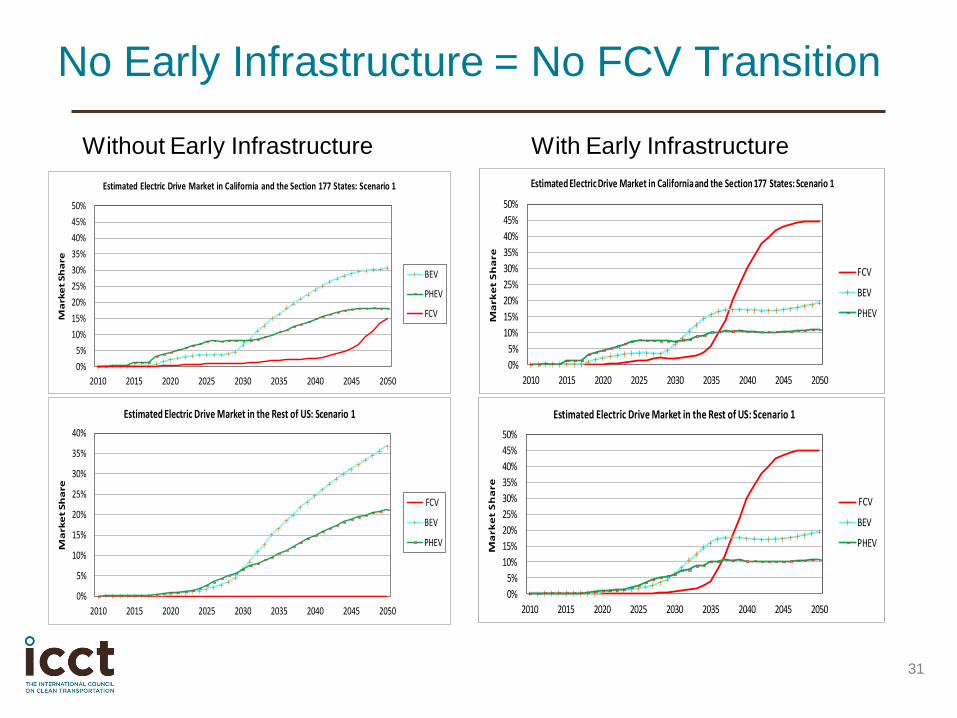
No Early Infrastructure = No FCV Transition
31
0%
5%
10%
15%
20%
25%
30%
35%
40%
2010 2015 2020 2025 2030 2035 2040 2045 2050
Ma
rke
t Sh
are
Estimated Electric Drive Market in the Rest of US: Scenario 1
FCV
BEV
PHEV
0%
5%
10%
15%
20%
25%
30%
35%
40%
45%
50%
2010 2015 2020 2025 2030 2035 2040 2045 2050
Ma
rke
t S
ha
re
Estimated Electric Drive Market in the Rest of US: Scenario 1
FCV
BEV
PHEV
0%
5%
10%
15%
20%
25%
30%
35%
40%
45%
50%
2010 2015 2020 2025 2030 2035 2040 2045 2050
Ma
rke
t Sh
are
Estimated Electric Drive Market in California and the Section 177 States: Scenario 1
BEV
PHEV
FCV
0%
5%
10%
15%
20%
25%
30%
35%
40%
45%
50%
2010 2015 2020 2025 2030 2035 2040 2045 2050
Ma
rke
t S
ha
re
Estimated Electric Drive Market in California and the Section 177 States: Scenario 1
FCV
BEV
PHEV
Without Early Infrastructure With Early Infrastructure
Key Messages
More running room for conventional technologies & hybrids
2050 Midrange: 95 mpg (cars 112 mpg)
Battery electrics and fuel cells cost competitive long-term
Li-ion battery costs drop by 80%
Electric drive and fuel cell stack costs scale with reduced
power demand associated with lightweight materials and
other load reductions
PHEVs will always command a significant cost premium, while
incremental fuel savings will diminish
BEVs will penetrate market quicker than fuel cells, but fuel cells
more likely to be accepted by the mass market in the long run
Incentives are essential to overcome early barriers to market
transformation
32


![[Elearnica.ir]-Customer Cost of Electric Service Interruptions](https://img.pdfslide.us/doc/110x75/563dbbbc550346aa9aafd26e/elearnicair-customer-cost-of-electric-service-interruptions.jpg)