Embed Size (px)
Citation preview
Engineers and Architects of Hawaii
Honolulu HI, Feb. 26, 2016
by
Katherine McKenzie
Hawaii Natural Energy Institute
School of Ocean and Earth Science and Technology
University of Hawaii at Manoa
Electric Vehicle Transportation and
Power Grid Integration
hawaiiindependent.net
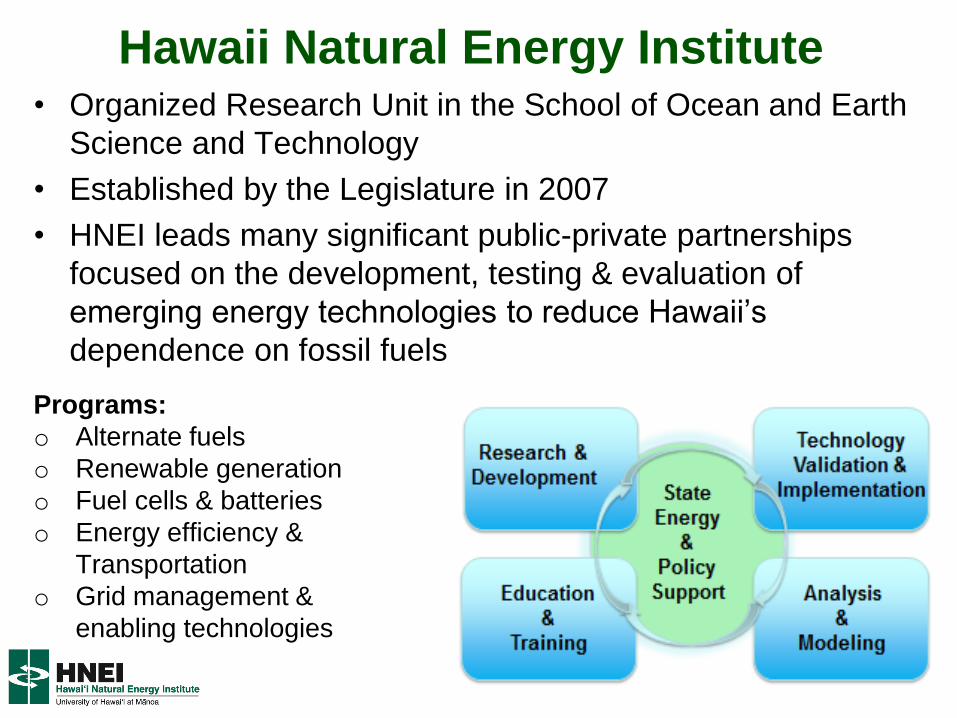
Hawaii Natural Energy Institute • Organized Research Unit in the School of Ocean and Earth
Science and Technology
• Established by the Legislature in 2007
• HNEI leads many significant public-private partnerships
focused on the development, testing & evaluation of
emerging energy technologies to reduce Hawaii’s
dependence on fossil fuels
Programs:
o Alternate fuels
o Renewable generation
o Fuel cells & batteries
o Energy efficiency &
Transportation
o Grid management &
enabling technologies
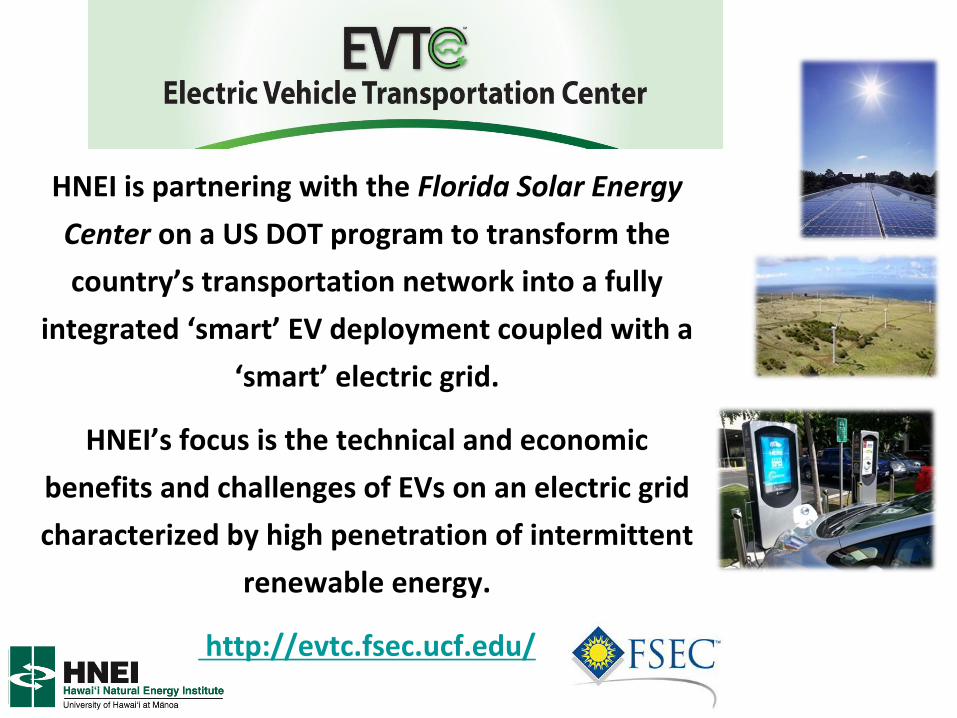
HNEI is partnering with the Florida Solar Energy
Center on a US DOT program to transform the
country’s transportation network into a fully
integrated ‘smart’ EV deployment coupled with a
‘smart’ electric grid.
HNEI’s focus is the technical and economic
benefits and challenges of EVs on an electric grid
characterized by high penetration of intermittent
renewable energy.
http://evtc.fsec.ucf.edu/
4
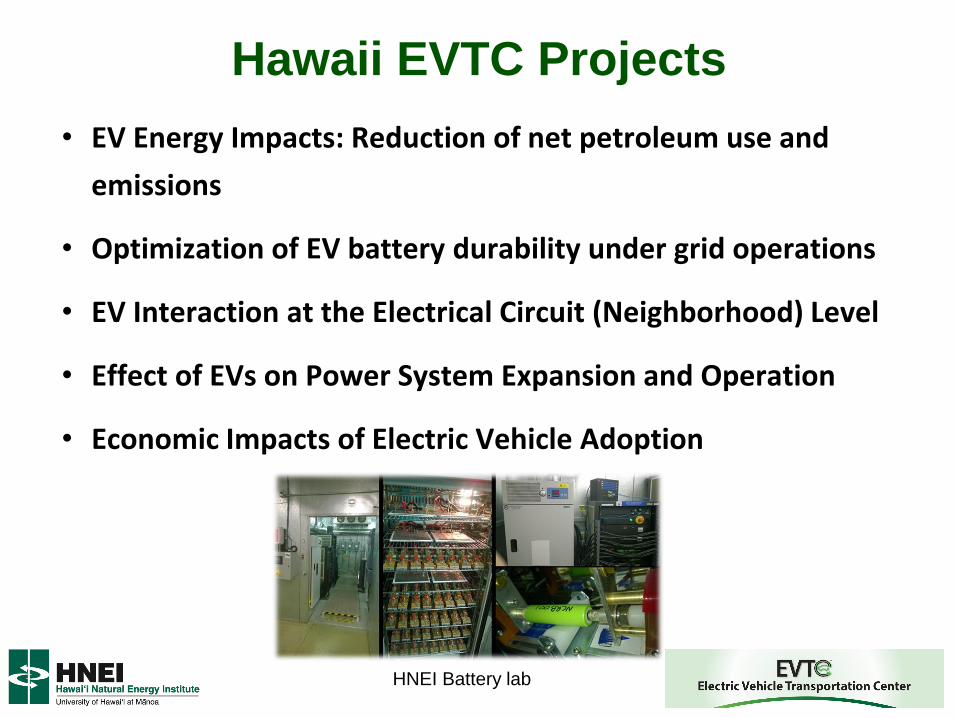
• EV Energy Impacts: Reduction of net petroleum use and
emissions
• Optimization of EV battery durability under grid operations
• EV Interaction at the Electrical Circuit (Neighborhood) Level
• Effect of EVs on Power System Expansion and Operation
• Economic Impacts of Electric Vehicle Adoption
HNEI Battery lab
Hawaii EVTC Projects
5
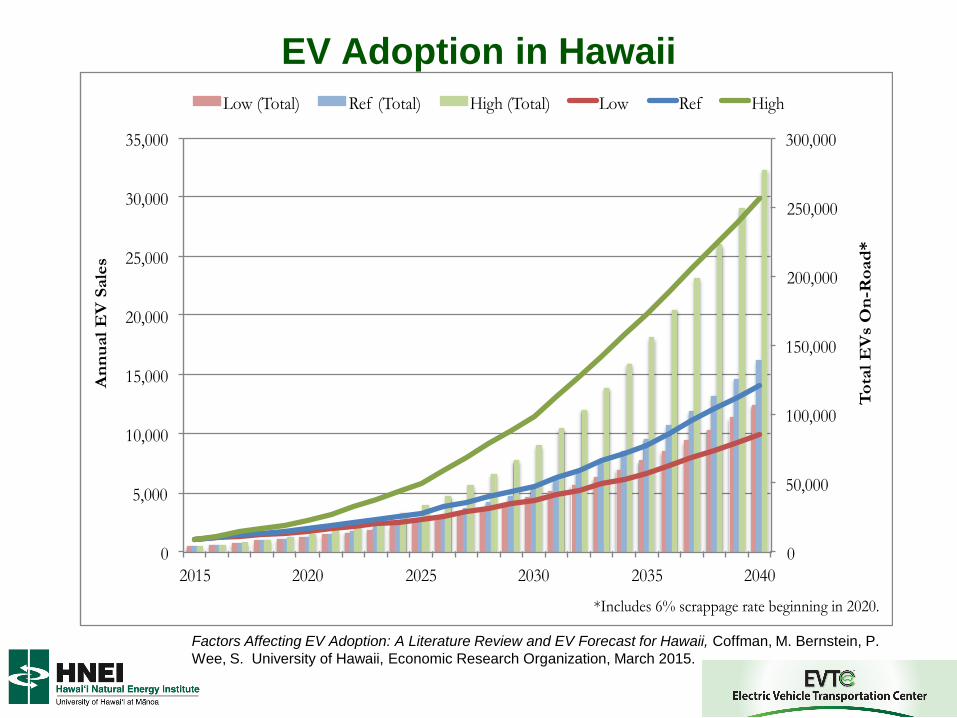
EV Adoption in Hawaii
0
50,000
100,000
150,000
200,000
250,000
300,000
0
5,000
10,000
15,000
20,000
25,000
30,000
35,000
2015 2020 2025 2030 2035 2040
To
tal
EV
s O
n-R
oad
*
An
nu
al
EV
Sale
s Low (Total) Ref (Total) High (Total) Low Ref High
*Includes 6% scrappage rate beginning in 2020.
Factors Affecting EV Adoption: A Literature Review and EV Forecast for Hawaii, Coffman, M. Bernstein, P.
Wee, S. University of Hawaii, Economic Research Organization, March 2015.
6
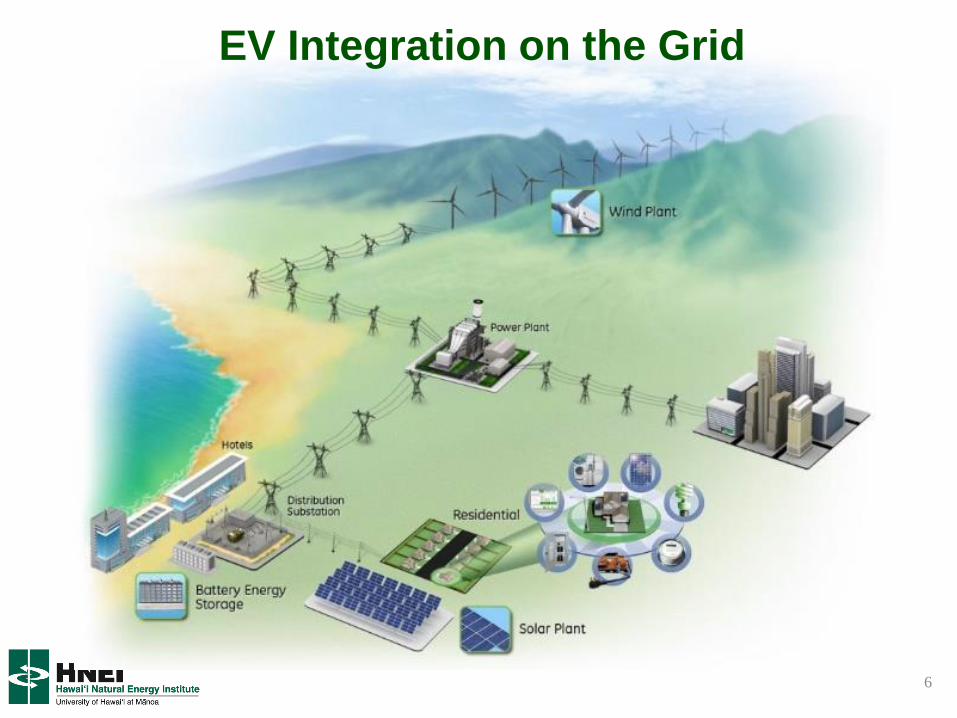
EV Integration on the Grid
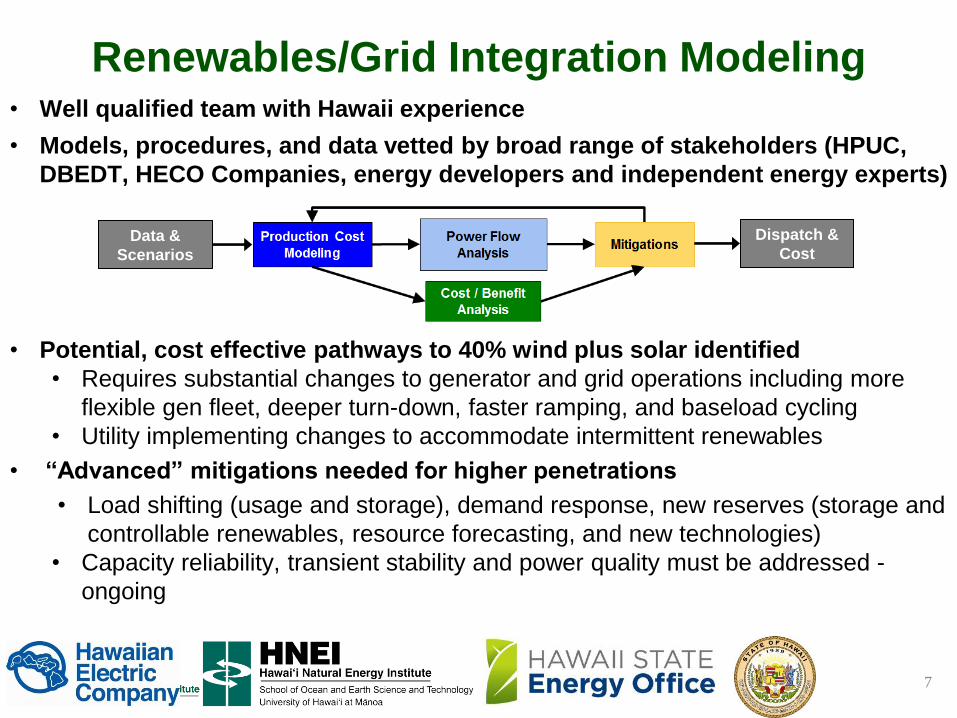
• Well qualified team with Hawaii experience
• Models, procedures, and data vetted by broad range of stakeholders (HPUC,
DBEDT, HECO Companies, energy developers and independent energy experts)
• Potential, cost effective pathways to 40% wind plus solar identified
• Requires substantial changes to generator and grid operations including more
flexible gen fleet, deeper turn-down, faster ramping, and baseload cycling
• Utility implementing changes to accommodate intermittent renewables
• “Advanced” mitigations needed for higher penetrations
• Load shifting (usage and storage), demand response, new reserves (storage and
controllable renewables, resource forecasting, and new technologies)
• Capacity reliability, transient stability and power quality must be addressed -
ongoing
7
Renewables/Grid Integration Modeling
Data &
Scenarios
Dispatch &
Cost
8
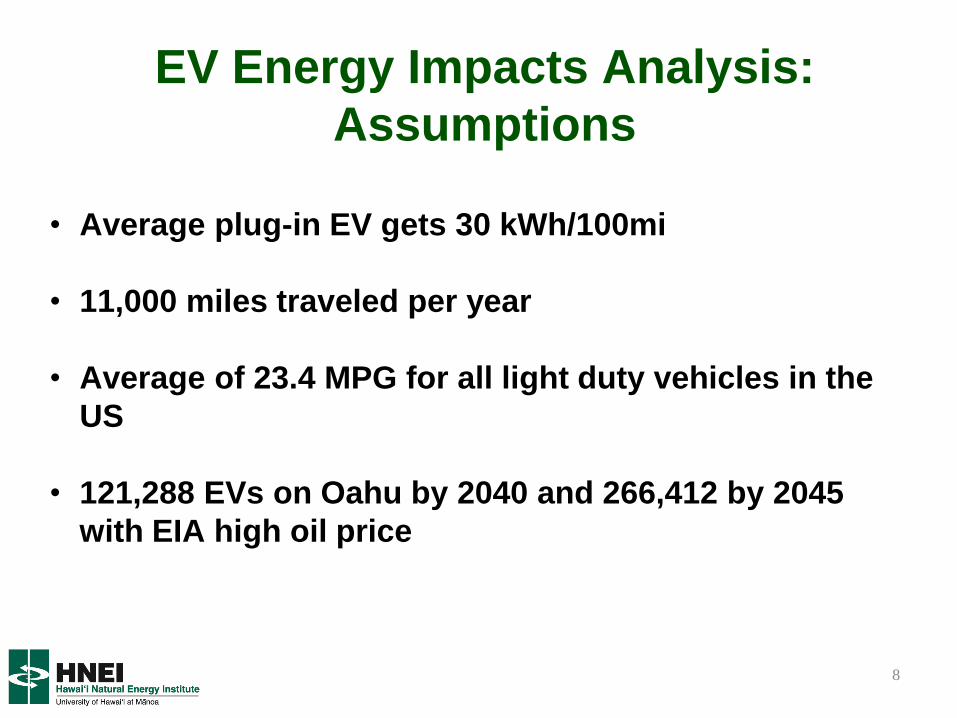
• Average plug-in EV gets 30 kWh/100mi
• 11,000 miles traveled per year
• Average of 23.4 MPG for all light duty vehicles in the
US
• 121,288 EVs on Oahu by 2040 and 266,412 by 2045
with EIA high oil price
EV Energy Impacts Analysis:
Assumptions
9
38.0
39.0
40.0
41.0
42.0
43.0
44.0
45.0
46.0
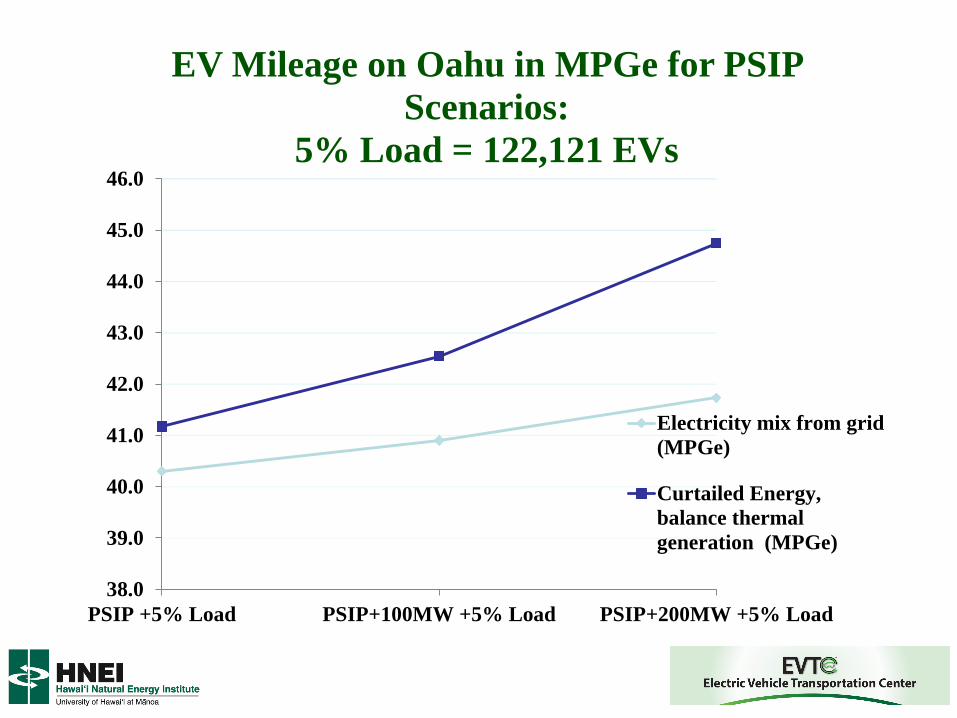
PSIP +5% Load PSIP+100MW +5% Load PSIP+200MW +5% Load
EV Mileage on Oahu in MPGe for PSIP
Scenarios:
5% Load = 122,121 EVs
Electricity mix from grid
(MPGe)
Curtailed Energy,
balance thermal
generation (MPGe)
10
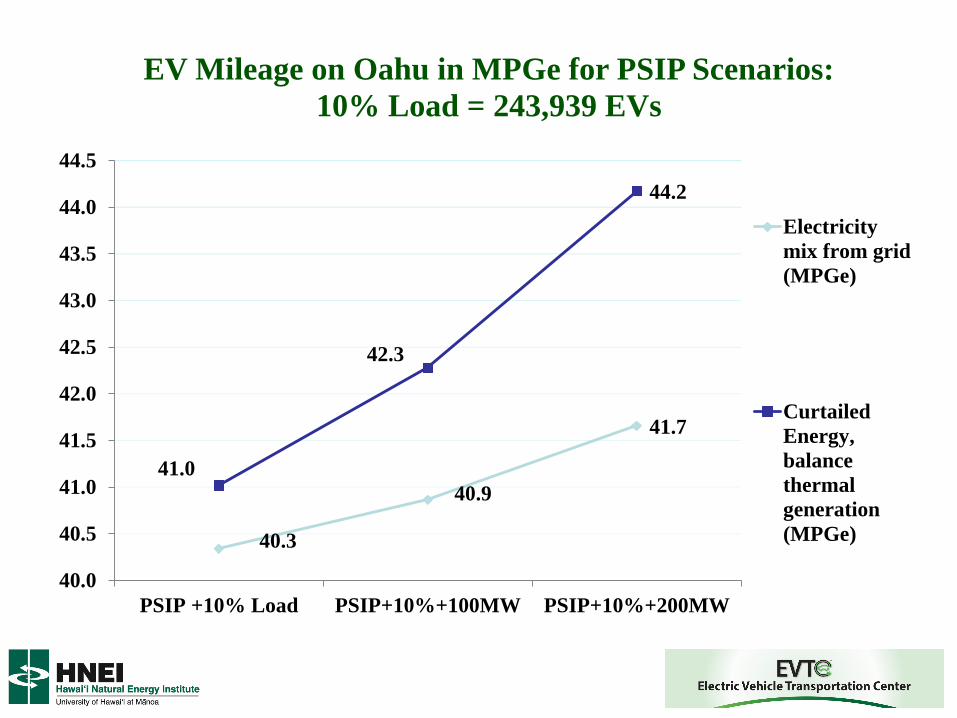
40.3
40.9
41.7
41.0
42.3
44.2
40.0
40.5
41.0
41.5
42.0
42.5
43.0
43.5
44.0
44.5
PSIP +10% Load PSIP+10%+100MW PSIP+10%+200MW
EV Mileage on Oahu in MPGe for PSIP Scenarios:
10% Load = 243,939 EVs
Electricity
mix from grid
(MPGe)
Curtailed
Energy,
balance
thermal
generation
(MPGe)
11
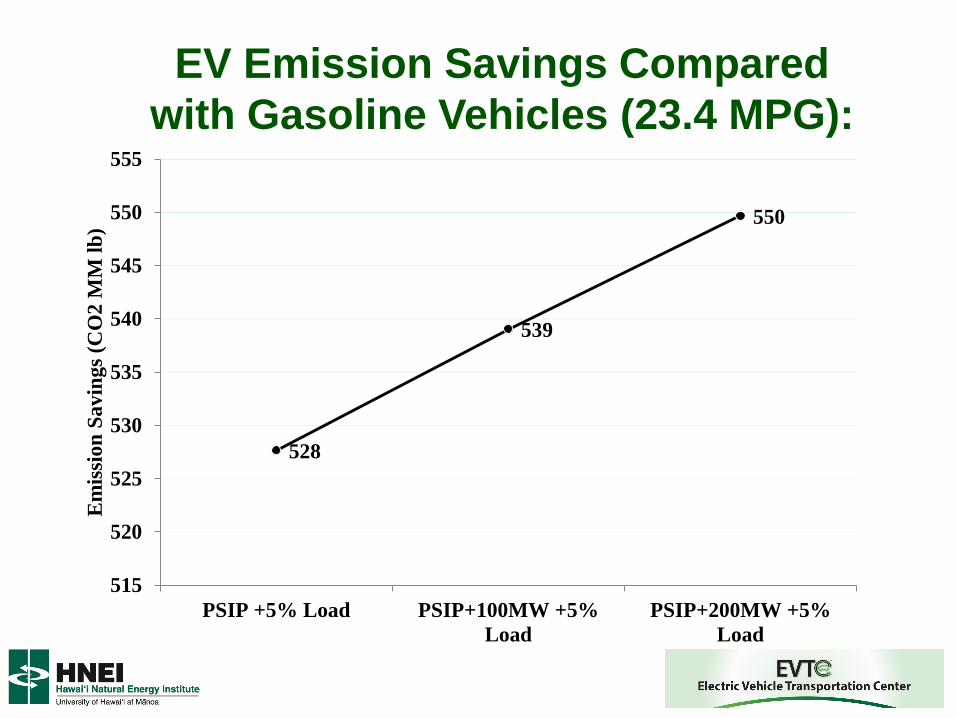
528
539
550
515
520
525
530
535
540
545
550
555
PSIP +5% Load PSIP+100MW +5%
Load
PSIP+200MW +5%
Load
Em
issi
on
Sa
vin
gs
(CO
2 M
M l
b)
EV Emission Savings Compared
with Gasoline Vehicles (23.4 MPG):
• 2 to 5 MPG – what it would take for similar fuel savings
by reducing Oahu’s entire passenger vehicle fleet’s fuel
economy
• 39% and 62% reduction in curtailed wind and solar
energy when 5% load and 10% loads are added to the
PSIP grid, but curtailed energy only 2.4% and 4.2%
• Beyond ~40% renewables on Oahu, EVs can be
especially helpful to reduce daytime curtailment of PV,
but significant infrastructure development is needed for
workplace charging
12
EV Analysis – Further Results

MAHALO
For more information, contact:
Katherine McKenzie
Hawaii Natural Energy Institute
Tel: (808) 956-5337
E-mail: [email protected]
Website: www.hnei.hawaii.edu