Embed Size (px)
Citation preview
1
Electric Vehicle Adoption Among Uber and Lyft Drivers
The Ohio State University
College of Food, Agriculture, and Environmental Sciences
EEDS Capstone Course
Prepared for:
April 16, 2019
Prepared By:
Jake Humphrey, Matt Baugher, Dominique Provencher, Nick Gasior, and Jake Watroba
2
Table of Contents
I. Executive Summary……………………………………………………………………...3
II. Introduction………………………………………………………………………………4
III. Initial Survey Results.……………………………………………………………………5
Limitations…...…………………………………………………………………………...9
IV. Literature Review………………………………………………………………...…….10
V. Survey Design……....…………………………………………………………………...12
Choice experiment…………………………………………………....………………...14
VI. Recommendations………………………………………………………………………16
VII. Conclusion………………………………………………………………………………18
VIII. Appendices.……………………………………………………………………………...19
IX. Works Cited……………………………………………………………………………..33
3
I. Executive Summary
In partnership with Smart Columbus and The Ohio State University, the purpose of our
research is to perform a statistical analysis of data regarding the possibility of ride-hailing platform
drivers purchasing electric vehicles. This data was gathered by the City of Columbus and Clean
Fuels Ohio through a ten question survey. Our analysis and research revealed that the key barrier
to electric vehicle adoption among ride-hailing platform drivers in Columbus is cost. Specifically,
based on the initial survey data collected from Smart Columbus, we found that 57.91% of
respondents identified the cost of an electric vehicle as the largest barrier to adoption and 75.54%
of respondents identified financial incentives for vehicle purchase as a possible incentive to
consider the purchase of an electric vehicle. Having completed the data analysis requested by the
City, our team determined that a new survey needed to examine the individual-level barriers to
adoption and to guide policy to address these barriers. Through collaboration with Ohio State
faculty and staff, our team developed a new survey that follows standardized practices in order to
ensure reliable results.
Based on our analysis and survey development, four key recommendations for Smart
Columbus and the City emerged:
1. Disseminate the new survey electronically via mobile phone or computer to create an
even larger response rate than the initial survey for further analysis
2. Perform a statistical analysis of the choice experiment findings and other data in possible
continued collaboration with the EEDS capstone course at The Ohio State University
3. Target Uber and Lyft drivers in future incentive programs if a substantial sub-market of
drivers is identified
4
4. Disseminate a revised survey to the general public to possibly identify a broader target
market to promote the adoption of electric vehicles if there is no significant sub-market of ride-
hailing platform drivers identified
II. Introduction
In 2016, The City of Columbus entered the Smart Cities Challenge alongside 77 other
United States cities. Columbus was selected to receive the prize grant of $40 million from the
United States Department of Transportation, as well as an additional $10 million from Vulcan
Incorporated. According to the Smart Columbus website, the City of Columbus has set several
goals, which include: improving people’s quality of life, driving economic growth, providing
better access to jobs and ladders of opportunity, becoming a world-class logistics leader, and
fostering sustainability. Smart Columbus aims to create benefits and equitable opportunities
through a series of different grants and initiatives to improve societal, environmental, and
economic factors throughout the city. Our team’s role in this initiative was determining if Uber,
Lyft, and similar ride-hailing platform drivers represent a promising market for electric vehicle
adoption.
We were specifically tasked with performing a statistical analysis of the original data
gathered by the City to provide a thorough review and offer recommendations based on the results
of our findings. Currently, the City of Columbus is offering a $3,000 rebate for applicants that
drive for these transportation platforms. The rebate program successfully received three individual
ride-hailing driver applications; however, the City offered 60 of these electric vehicle adoption
rebates. Our research goal is to assess the potential barriers to adoption among this population and
5
to use the insights gleaned from this analysis to design a comprehensive survey that can be used to
gauge the interest of electric vehicle adoption in Columbus.
III. Initial Survey
Results
In partnership with Smart Columbus, our team was tasked with analyzing existing data
retrieved from a survey created and distributed by Clean Fuels Ohio. This survey was distributed
to Columbus Uber and Lyft drivers via online channels through the platforms themselves, and
contained questions designed to gauge interest in electric vehicle adoption among respondents. The
sample size was fairly robust (n = 278) which increased the statistical validity of the results.
Around three quarters of respondents reported moderate to extreme interest in purchasing an
electric vehicle, with roughly the same amount selecting financial incentives as the thing that
would most likely spur their adoption of an electric vehicle. These findings initially seemed to
support Columbus’ decision to implement a purchase rebate for ride-hailing drivers; however a
more detailed look at the results leads to different conclusions, and more questions. Each survey
question and its results are discussed below:
Q1. As a driver, what is your interest in purchasing Electric Vehicles for your ride-hailing service?
Respondents were asked to rate their interest on a 1-5 scale. According to the results,
36.3% of drivers indicated that they were “Very Interested” in purchasing an electric vehicle for
their occupation, while nearly a quarter (24.1%) indicated “Not at all Interested”. A weighted
average of all responses yielded a 3.26; suggesting that ride-sharing drivers have a moderate
willingness to adopt electric vehicles.
6
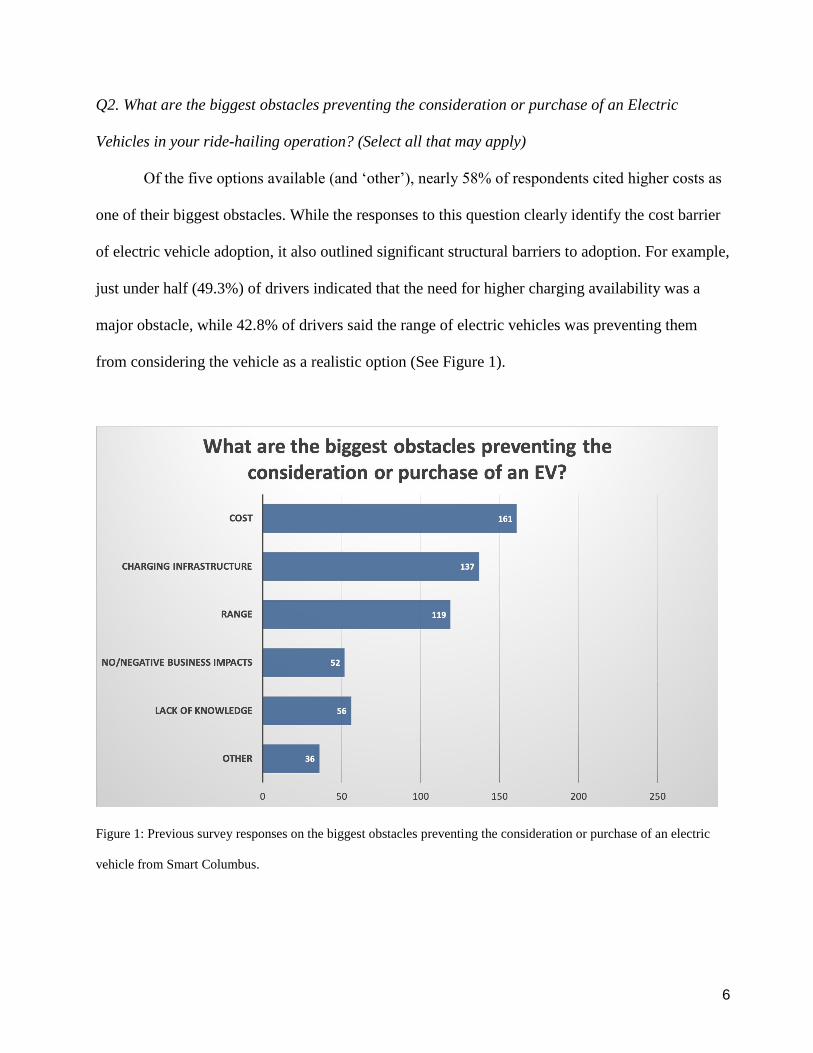
Q2. What are the biggest obstacles preventing the consideration or purchase of an Electric
Vehicles in your ride-hailing operation? (Select all that may apply)
Of the five options available (and ‘other’), nearly 58% of respondents cited higher costs as
one of their biggest obstacles. While the responses to this question clearly identify the cost barrier
of electric vehicle adoption, it also outlined significant structural barriers to adoption. For example,
just under half (49.3%) of drivers indicated that the need for higher charging availability was a
major obstacle, while 42.8% of drivers said the range of electric vehicles was preventing them
from considering the vehicle as a realistic option (See Figure 1).
Figure 1: Previous survey responses on the biggest obstacles preventing the consideration or purchase of an electric
vehicle from Smart Columbus.
7
Q3. How concerned are you about the range of the electric vehicle? (1 is extremely concerned, 3
moderately concerned, 5 not at all concerned)
When asked to rate their concern about the range of electric vehicles, 80% of respondents
reported they were at least moderately concerned with vehicle range. Of that 80%, half stated that
they were ‘extremely concerned’ with vehicle range. Given the higher than average number of
miles that most ride-sharing drivers put on their vehicles, range anxiety is an understandable
concern for this target market.
Q4. What would spur consideration or adoption of Electric Vehicle for Uber/Lyft service?
Over 75% of drivers stated that a financial incentive would spur their interest in purchasing
an electric vehicle. This is not surprising when considering the majority of drivers that see cost as a
major barrier. Important to note, however, is the focus on charging that many drivers had. Over
43% indicated that a financial incentive specifically for purchasing a charger would be helpful,
over half said that better charger availability would spur consideration, and nearly a third of
respondents stated that reduced charging costs would encourage their adoption of an electric
vehicle. This breakdown indicates effective charging as a critical aspect in encouraging the
adoption of electric vehicles.
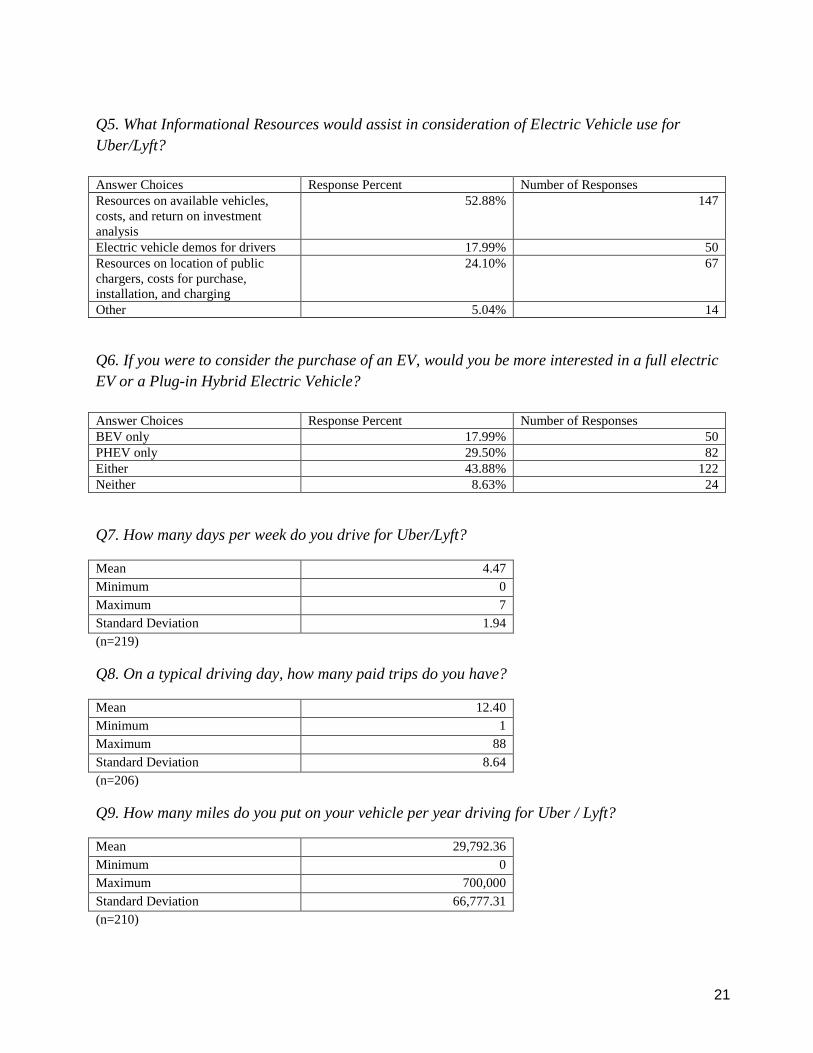
Q5. What Informational Resources would assist in consideration of Electric Vehicle use for
Uber/Lyft?
Cost was the major concern for drivers for this question, with 52.9% saying resources on
available vehicles, cost, and return on investment analysis would help in their consideration of an
electric vehicle. Whether or not a lack of information accessible to drivers is unique to electric
8
vehicles requires further research, but the responses here indicate that effectively disseminating
knowledge on electric vehicles is a requisite for increasing overall adoption.
Q6. If you were to consider the purchase of an EV, would you be more interested in a full electric
EV or a Plug-in Hybrid Electric Vehicle?
Only an 18% of drivers indicated an interest solely in battery electric vehicles. A
significant majority (73.3%) stated that they would either prefer a Plug-in Hybrid Electric Vehicle
or either choice. These preferences indicate that a larger share of drivers could potentially be
interested in making a purchase through the City’s incentives if hybrid electric vehicles were
included in the program.
Q7. How many days per week do you drive for Uber/Lyft?
Q8. On a typical driving day, how many paid trips do you have?
Q9. How many miles do you put on your vehicle per year driving for Uber / Lyft?
Q10. Would you be will to share your vehicle data (amount driven, fuel economy, driving patterns,
etc.) with researchers interested in energy efficiency?
These last four questions in the original survey did not yield analyzable results. This ended
up being a recurring issue in our analysis and is discussed further in the limitations section of this
report. Questions seven through nine received highly variable responses which did not lead to any
additional insights into electric vehicle adoption. This is most likely due to the open-ended nature
of the questions. If the survey had utilized something like a payment card format, where a set range
of quantifiable choices is established for respondents, variability would have likely decreased and
there may be more to glean from the resulting data.
9
Limitations
After meeting with Dr. Linda Lobao and Hugh Walpole, faculty of The Ohio State
University, our team determined specific shortcomings of the original survey that we planned to
rectify through the creation of a second more comprehensive survey. One key limitation was the
question design itself. As discussed in the previous section, many of the questions allowed for
highly variable responses which reduced the reliability of the results. For example, the lower and
upper bounds for the number of miles per year driven for Uber/Lyft (Question 9) was 0 and
200,000 respectively. This demonstrated incredible variability between drivers. Questions seven
and eight yielded similar results. Asking these questions using a predefined range would have
allowed for a set of results that was much easier to quantify and analyze.
A second key limitation was the lack of any demographic data, which makes it impossible
to generalize the survey results. Demographic information is a critical aspect of effective survey
design because it informs researchers on key characteristics of their respondents. For instance,
understanding the relationship between cost as a stated barrier and respondent’s annual income or
education can provide useful insights into whether or not a specific submarket should be targeted.
Without specific data on the individual, including income, age, education, and other key variables,
it is difficult to interpret results and not possible to draw any clear policy recommendations. For
instance, if ‘Respondent 38’ states a low willingness to adopt electric vehicles but reports a high
income and low average weekly miles driven, then the question of what would spur adoption is
immediately relevant. Suppose the same respondent later indicates that more information on
electric vehicles would be most likely to increase their willingness to purchase a vehicle. Now
consider if the survey showed the same set of responses among 50 other drivers, and they all
happened to fall in the 55+ age range. This would be a valuable insight for policymakers because
10
linking these results shows that focusing on improving communication channels for electric
vehicle information is likely to increase adoption for this population.
While the previous example is only hypothetical, it illustrates how a lack of generalizability
lowers the reliability of the resulting survey data and by extension any recommendations made
from the same set of data. Our team did gain insights from the first survey, but without
demographic and respondent-specific data they were not verifiable or generalizable.
After consulting with Smart Columbus representatives regarding these limitations, our team
decided to extend the research on electric vehicle adoption by ride-hailing platform drivers through
the development of a rigorous survey instrument that could be used by the City of Columbus in the
future to gather the data needed to guide policy. Doing so required further research into Uber/Lyft
drivers, electric vehicles, their adoption, and potential incentives. Thus, a review of the relevant
literature was completed to inform our final survey design.
IV. Literature Review
Our team performed a review of existing literature regarding electric vehicle adoption in
order to inform our survey design. Our main areas of focus were barriers to adoption, successful
policy interventions, average electric vehicle driver demographics, and average Uber driver
demographics. Data from the US Environmental Protection Agency and US Department of Energy
outlined several key barriers to the adoption of electric vehicles. They included costs associated
with electric vehicles, poor recharging infrastructure, long charging times, and range anxiety (Zhou
2016). The main cost barrier is the price (and upfront cost) of the electric vehicle itself, with
battery and gasoline costs also influencing consumer preferences. According to a study by Kodjak
(2010), which collected data from 13,000 individuals internationally, most consumers were not
11
willing to pay more than $30,000 USD for an electric vehicle. This showed that despite the
tendency for high gas prices and cheap charging to increase favorability of electric vehicles due to
a lower relative cost of ownership, up-front cost to the consumer is still very important to potential
adopters.
A perceived lack of public charging infrastructure is another major barrier to electric
vehicle adoption. For example, the study by Kodjak (2010) showed that with over half of
consumers reporting they wouldn’t consider purchasing an electric vehicle until charging stations
were as readily available and accessible as existing gas stations. Charging infrastructure is a
critical prerequisite to effective policy interventions aimed at increasing electric vehicle adoption.
Even with substantial financial incentives, the positive impacts on plug-in electric vehicle (PEV)
adoption are limited without a robust public charging infrastructure (Zhou 2016). The same study
also found that even if the existing infrastructure is adequate, it may be just as important to ensure
drivers have adequate access to real time information on both the location and access to existing
chargers.
The time to charge (TTC) and vehicle range were two of the most salient barriers to drivers
in the data initially provided by The City of Columbus. In the United States, 60% of consumers
expect to be able to charge their vehicles in two hours or less (Krupa 2014). Given the current PEV
models available to consumers, most electric vehicle drivers can expect to wait more than 3 hours
for a full charge using a level two charger. Even when using a “supercharger”, the best case
scenario for a full charge is around 30 minutes. Most mainstream consumers still find this TTC
‘unacceptable’ and desire a TTC closer to the time it takes to fill up a tank of gas: around five
minutes (Kodjak 2012). There is potential for hybrid batteries to meet the goal of a five minute
charge, although currently they are triple the cost and twice the size and weight (per kWh). Vehicle
12
range is closely tied to charging times because as battery size (and thus range) of PEVs increases,
so does the TTC. In general, consumers expect vehicle ranges that exceed that of many electric
vehicle models currently on the market. Despite roughly 85% of drivers reporting daily driving
distances of under 100 miles, consumers still expect vehicle ranges upwards of 300 miles (Mishel
2018).
Our research on the average demographics of electric vehicle and Uber drivers was very
helpful in establishing a better understanding of the type of consumer most willing to purchase
PEVs and how well this group overlapped with Uber drivers. Most PEV owners are younger, have
incomes north of $100,000, are highly educated, and live in areas with good weather and charging
access (Kodjak 2010, Krupa 2014). Compared with the average Uber driver where half of all
drivers are over 40 years old, a majority lack a college degree, and most drivers work less than 20
hours a week at a net wage of $11.77/hr; there are clear differences between the two populations
(Hall 2015). These ‘driver profiles’ and accompanying information on adoption barriers were
extremely helpful when designing survey questions as they allowed our team to focus on assessing
the prevalence of characteristics among ride-hailing drivers that would indicate a higher than
average willingness to adopt electric vehicles.
V. Survey Design
The new survey, found in Appendix C, was designed to specifically target the gaps
identified above in the previous survey. The survey was designed into five separate categories of
questions, each based around a specific goal. This was done in order to keep the survey as concise
as possible, while still allowing for the widest expanse of information to be collected. We designed
the survey with five categories of questions, each of which support a specific goal:
13
1. Uber Specific Questions: These questions are specific to Uber and Lyft Drivers. The goal is
to categorize Uber and Lyft drivers in order to help Smart Columbus better target these
specific groups for any future rounds of incentives. For example, if the data shows that the
Uber drivers who drive 40 hours a week are more likely to consider purchasing electric
vehicles than Uber drivers who drive 20 hours a week, we would suggest an electric
vehicle marketing campaign directed specifically to full-time ride-hailing drivers.
2. Costs, Benefits, and Barriers: The goal of this category is to determine the specific
perceived costs and barriers of electric vehicle adoption to consumers. Additionally, we
targeted benefits in order to see what the respondents identified as benefits to adopting
electric vehicles, and if they actually value these perceived benefits. If respondents do not
value the benefits of electric vehicle adoption, it is unlikely that getting over the barriers
will even be possible should there be no significant motivation behind it.
3. General Vehicle Considerations: The goal of this category is to identify the portion of the
survey population who are currently in the market for a new vehicle, discover how they
value various vehicle characteristics, and observe the effect of income and occupation on
vehicle purchases. This portion of the survey will not only illuminate which vehicles would
be best to market, but also if marketing by occupation is worthwhile in the effort to
increase overall electric vehicle adoption.
4. Demographics: These questions are important because they allow for a more granular
analysis of the data. These questions allow us to better visualize the survey respondents.
For example, what income bracket is more likely to be interested in electric vehicles? This
level of detail is critical for informing policy and was a key set of information that was
missing from the initial survey data.
14
5. Choice Experiment: The goal of this category is to identify the gap between direct stated
preferences in the initial survey and rebate success rates, as well as to deliver results of
which barriers and amenities respondents value the most when deciding to purchase an
electric vehicle. The choice experiment is the most statistically complicated and different
group of questions in the survey, and is explained in further detail below.
Choice Experiment
The choice experiment is a contingent valuation survey instrument that seeks to identify
survey respondent’s willingness to pay for various amenities associated with electric vehicles.
Choice experiments can be classified as stated preference valuation methods and are an
increasingly popular instrument method of environmental economic research (Adamowicz et al.
1998b). As previously mentioned, there was an observed gap between the direct stated preferences
of respondents in the previous survey and the success of the City of Columbus’ rebate program.
The results of the previous survey conducted by Smart Columbus showed that 57.91% of
respondents identified the cost of an electric vehicle as the largest barrier to adoption and 75.54%
of respondents identified financial incentives for vehicle purchase as a possible incentive to
consider the purchase of an electric vehicle. Even though a financial incentive was identified by
survey respondents, only three individuals applied for the possible 60 incentives offered through
Smart Columbus. The choice experiment is designed to identify this gap as respondents may
indicate different preferences for electric vehicle amenities when asked to make a choice rather
than identifying preferences when explicitly asked.
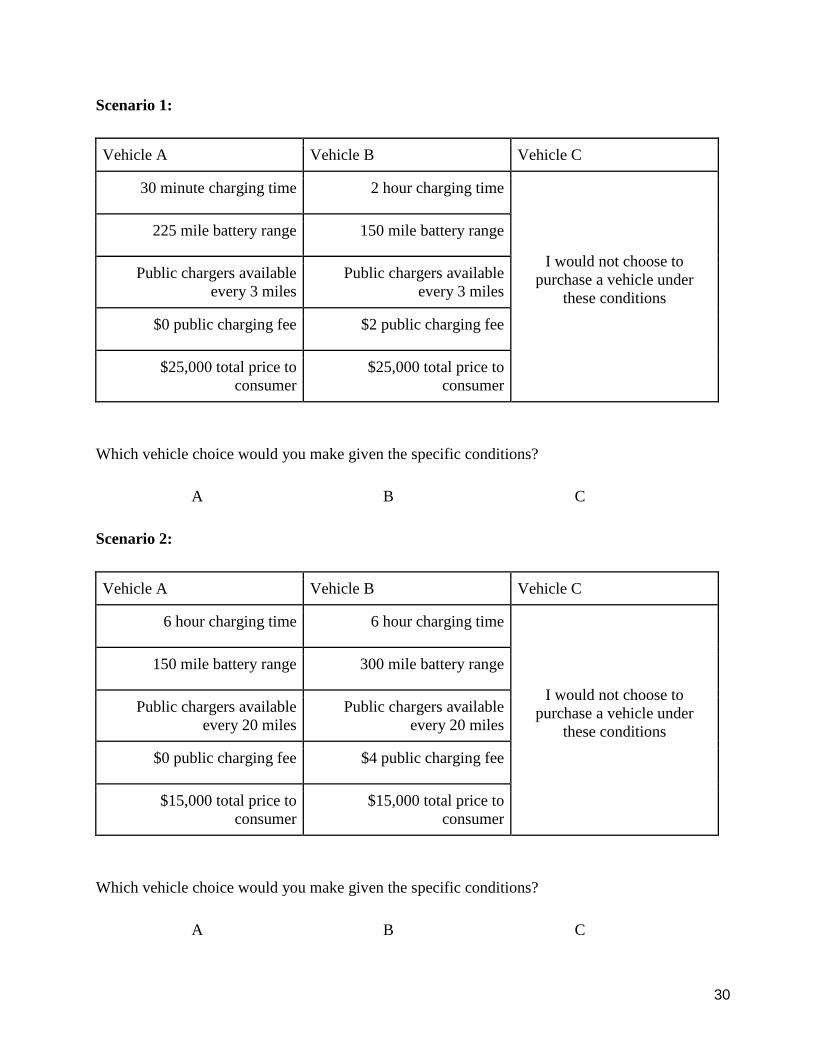
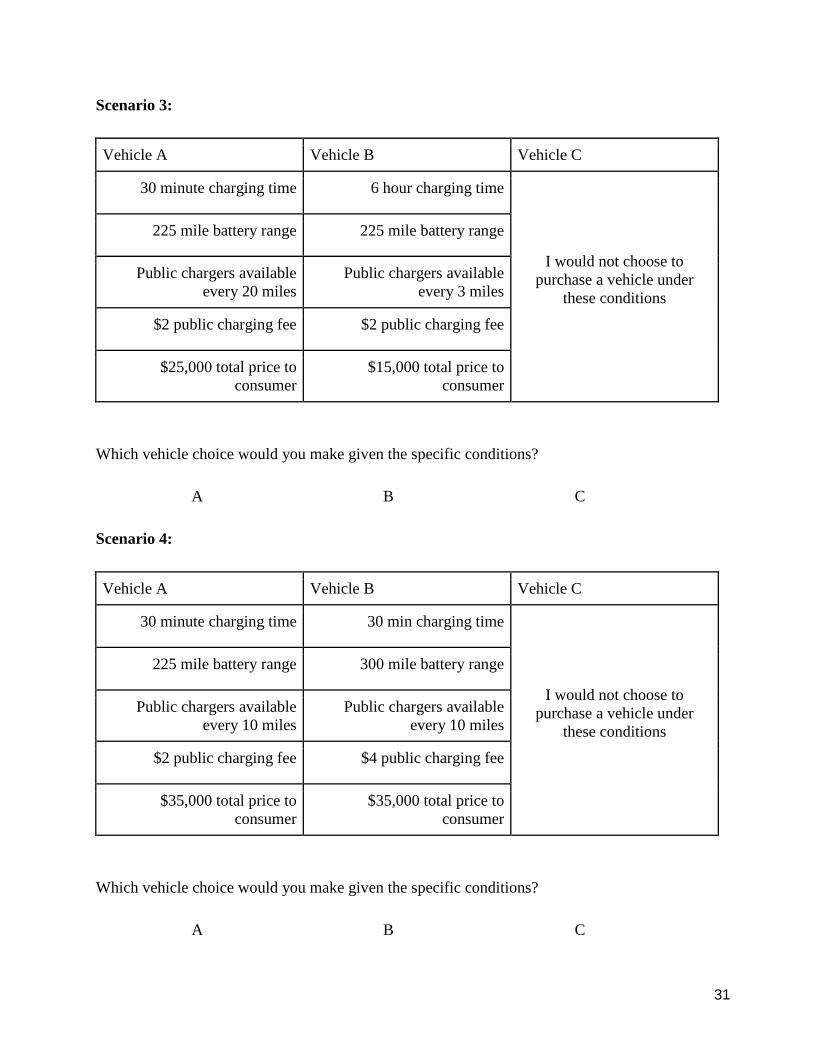
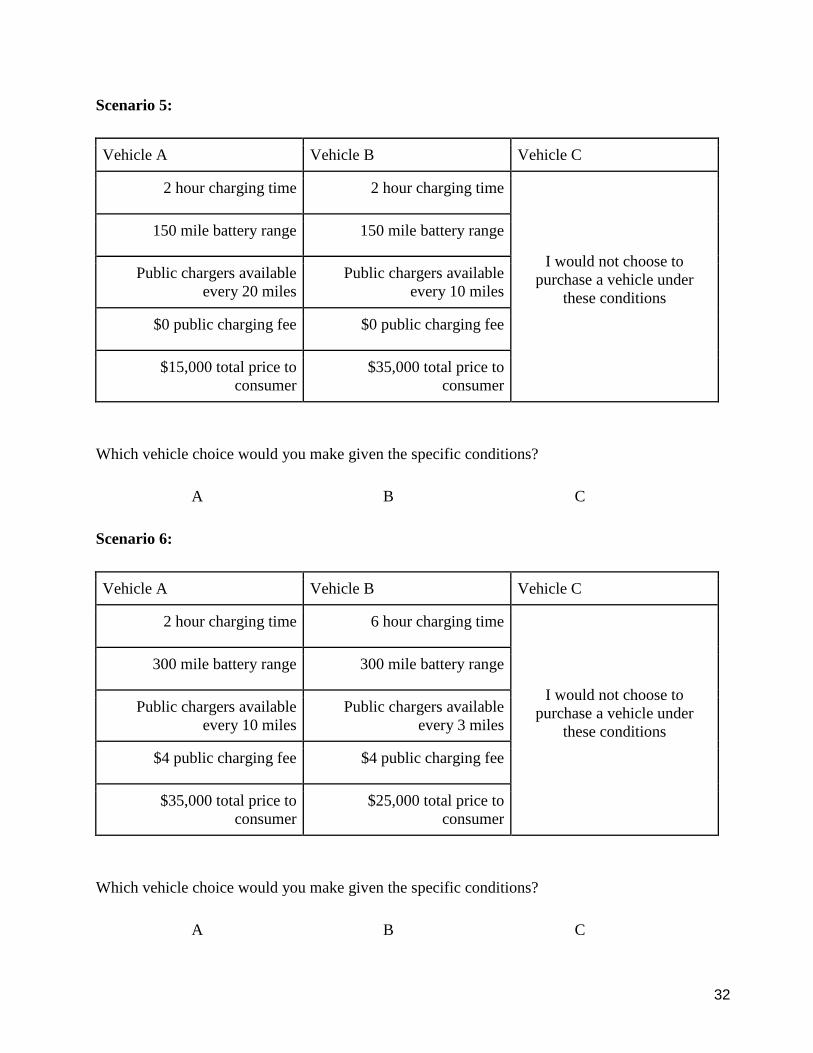
The choice experiment instrument is simple to implement, but difficult to analyze. The
survey respondents are asked to make a series of choices, each between two separate electric
vehicles that have varying amenities. Respondents are presented with six scenarios, each similar to
15
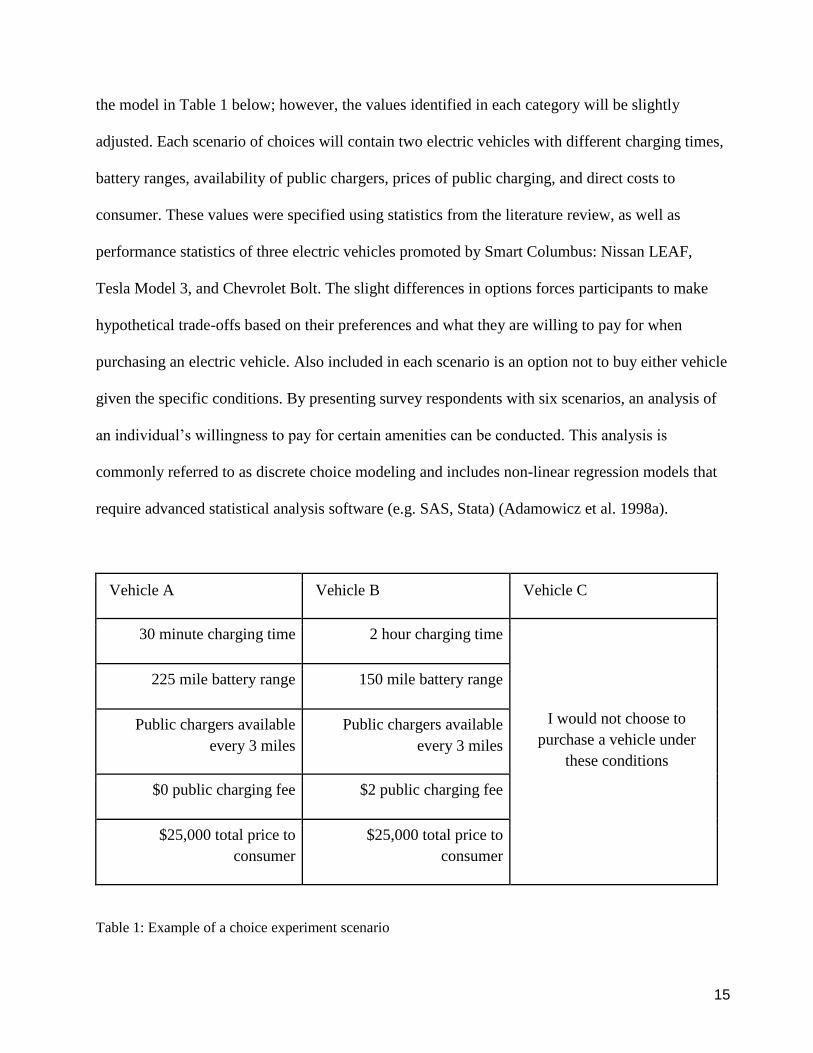
the model in Table 1 below; however, the values identified in each category will be slightly
adjusted. Each scenario of choices will contain two electric vehicles with different charging times,
battery ranges, availability of public chargers, prices of public charging, and direct costs to
consumer. These values were specified using statistics from the literature review, as well as
performance statistics of three electric vehicles promoted by Smart Columbus: Nissan LEAF,
Tesla Model 3, and Chevrolet Bolt. The slight differences in options forces participants to make
hypothetical trade-offs based on their preferences and what they are willing to pay for when
purchasing an electric vehicle. Also included in each scenario is an option not to buy either vehicle
given the specific conditions. By presenting survey respondents with six scenarios, an analysis of
an individual’s willingness to pay for certain amenities can be conducted. This analysis is
commonly referred to as discrete choice modeling and includes non-linear regression models that
require advanced statistical analysis software (e.g. SAS, Stata) (Adamowicz et al. 1998a).
Vehicle A Vehicle B Vehicle C
30 minute charging time 2 hour charging time
I would not choose to
purchase a vehicle under
these conditions
225 mile battery range 150 mile battery range
Public chargers available
every 3 miles
Public chargers available
every 3 miles
$0 public charging fee $2 public charging fee
$25,000 total price to
consumer
$25,000 total price to
consumer
Table 1: Example of a choice experiment scenario
16
Although the willingness to pay data can be difficult to interpret, a simpler analysis can be
conducted with the choice experiment data once collected. Each scenario has multiple categories
that contain the same values, so these categories are held constant when analyzing the data (e.g.
public charger availability and price to consumer in the scenario above). By holding other factors
constant, the effect of specific electric vehicle amenities on individual choices can be isolated. The
data collected from this choice experiment will indicate which barriers to adoption of electric
vehicles Smart Columbus can help mitigate for these drivers.
VI. Recommendations
The development of this research and survey has led to four recommendations (1-4) for the
City of Columbus’ consideration regarding the promotion of electric vehicles amongst ride-hailing
drivers:
1. The City of Columbus should first implement the newly designed survey before
implementing any additional programs or policies to incentivize electric vehicle adoption
among ride-hailing platform drivers. This survey will provide the City with a strong,
empirically-based rationale to guide their decision making, ensuring efficiency of time and
resources.
2. In regard to the dissemination of the survey, we believe the most effective way to garner
the largest response rate would be for the City to offer the survey online via mobile
smartphone or personal computer. With ride-hailing drivers already required to have this
technology as part of employment, there would be no technological barriers to overcome
with distribution of the survey. This also implies that any potential bias that could be
introduced through this method of dissemination should also be minimal.
17
3. This recommendation relates to how the City should analyze the results once an
appropriate amount of responses are received. This survey involves the choice experiment,
which requires a formal statistical analysis to be completed for accurate assessment of the
data received. We recommend that this analysis is done in collaboration with The Ohio
State University faculty, or even future EEDS capstone groups, to increase the
understanding of the challenges associated with Uber and Lyft drivers adopting electric
vehicles in Columbus.
4. The final recommendation is contingent upon the results of the response data from the
newly designed survey:
4a. If the data shows that ride-hailing platform drivers are a large enough target market to
effectively increase sustainable transportation options in the city, then Smart Columbus and
the City of Columbus should continue directing education and marketing towards this
market. Conditional on availability of funding, the City may want to continue the incentive
program offered for a longer period of time or change the program altogether.
4b. If the data shows that ride-hailing drivers are too small of a target market to effectively
increase sustainable transportation options in the city, then Smart Columbus should
consider offering a revised survey that could be available to the general public. The revised
survey would need to exclude the specific questions regarding Uber and Lyft drivers, along
with the inclusion of any new questions the City may deem necessary; otherwise, the
remainder of the questions in Appendix C can apply to the general public. This may not
only help the City increase their understanding of the perceptions of the biggest obstacles
to electric vehicle adoption, but also gain the scope of a potentially new target market to
incentivize sustainable transportation in and around the city.
18
VII. Conclusion
The City of Columbus implemented a rebate program for the purchase of an electric
vehicle among ride-hailing platform drivers, which did not garner as much success as anticipated
when designing the program. Analysis of data from an initial survey revealed that Columbus ride-
hailing platform drivers were potentially interested in purchasing electric vehicles; however there
are still barriers to adoption that prevent their purchase. Findings from an in-depth literature review
revealed that typical ride-hailing platform drivers are much different than typical early adopters of
electric vehicles. We used these results to guide the development of a survey to identify the
barriers to electric vehicle adoption among these drivers. To maximize the potential benefits from
this new survey, we recommend the following: the dissemination of the survey should be
conducted online, the City of Columbus continue to partner with The Ohio State University to
analyze the survey results, education and marketing towards ride-hailing platform drivers should
continue, and consideration of electric vehicle adoption barriers when making policy decisions.
In regards to future extensions of this project, we believe our survey has provided the
foundation for future analysis of electric vehicle adoption barriers in Columbus for ride-hailing
platform drivers. Should the City of Columbus disseminate the new survey online, future groups
continuing this project would have the appropriate information to complete an in-depth analysis of
barriers to electric vehicle adoption specific to Columbus community members. Subsequently, the
City of Columbus can use this information to adjust policy decisions that affect the adoption of
electric vehicles by individual community members.
19
IX. Appendices
A. Dataset #1: EV Adoption Survey-All Data.xlsx
Source: Clean Fuels Ohio/Smart Columbus
Description: The dataset includes results of a 10 question survey that was
distributed to Columbus area Uber and Lyft drivers in 2018.
B. Dataset #2: Lobao Interview.docx
Source: Linda Lobao, Professor and Researcher of Diffusion of Innovations at The
Ohio State University
Description: Group met with Professor Lobao to discuss the diffusion of
innovations with electric vehicles specifically in mind. Occurred on March 5, 2019
in person.
Contact Information: Email: [email protected] Phone: 614-292-6394
C. Initial Survey
Description: This survey was disseminated by Clean Fuels Ohio to gauge the
interest of ride-hailing platform drivers in adopting electric vehicles.
D. Newly Created Survey for Distribution
Description: This survey was developed by the team to be delivered to the City of
Columbus for distribution to Uber and Lyft drivers in city and surrounding areas. It
was created in collaboration with university faculty to ensure it yielded the most
useful results.
20
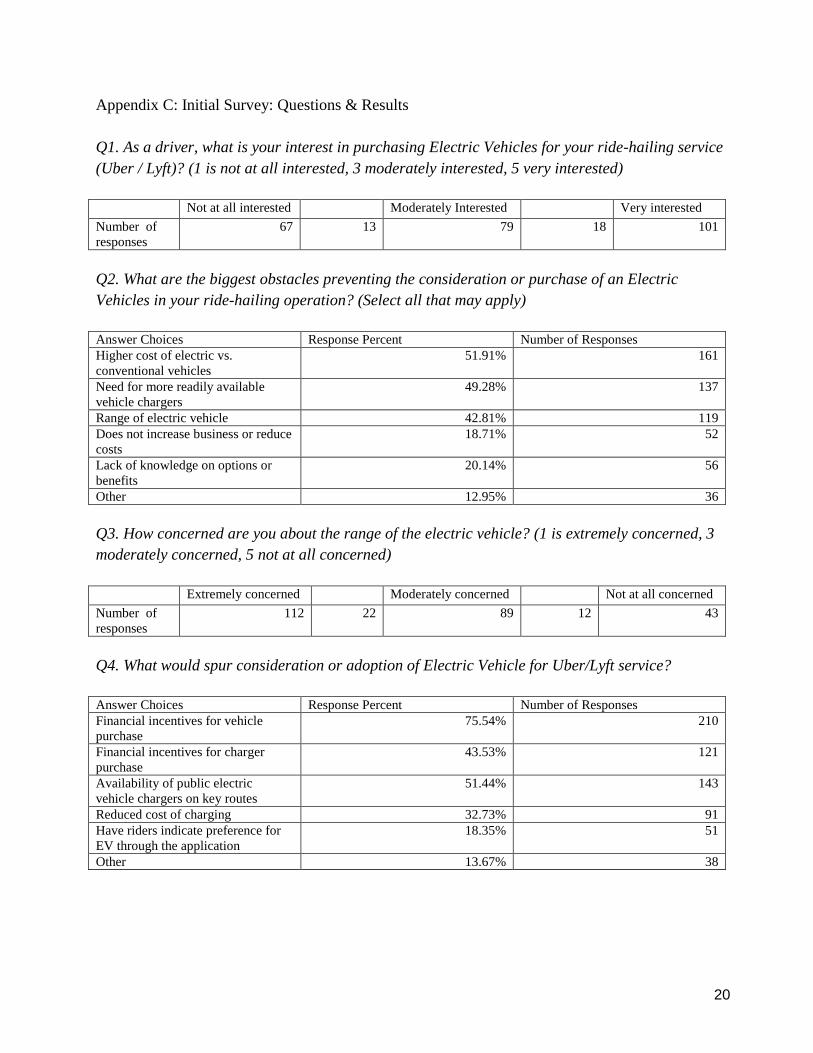
Appendix C: Initial Survey: Questions & Results
Q1. As a driver, what is your interest in purchasing Electric Vehicles for your ride-hailing service
(Uber / Lyft)? (1 is not at all interested, 3 moderately interested, 5 very interested)
Not at all interested Moderately Interested Very interested
Number of
responses
67 13 79 18 101
Q2. What are the biggest obstacles preventing the consideration or purchase of an Electric
Vehicles in your ride-hailing operation? (Select all that may apply)
Answer Choices Response Percent Number of Responses
Higher cost of electric vs.
conventional vehicles
51.91% 161
Need for more readily available
vehicle chargers
49.28% 137
Range of electric vehicle 42.81% 119
Does not increase business or reduce
costs
18.71% 52
Lack of knowledge on options or
benefits
20.14% 56
Other 12.95% 36
Q3. How concerned are you about the range of the electric vehicle? (1 is extremely concerned, 3
moderately concerned, 5 not at all concerned)
Extremely concerned Moderately concerned Not at all concerned
Number of
responses
112 22 89 12 43
Q4. What would spur consideration or adoption of Electric Vehicle for Uber/Lyft service?
Answer Choices Response Percent Number of Responses
Financial incentives for vehicle
purchase
75.54% 210
Financial incentives for charger
purchase
43.53% 121
Availability of public electric
vehicle chargers on key routes
51.44% 143
Reduced cost of charging 32.73% 91
Have riders indicate preference for
EV through the application
18.35% 51
Other 13.67% 38
21
Q5. What Informational Resources would assist in consideration of Electric Vehicle use for
Uber/Lyft?
Answer Choices Response Percent Number of Responses
Resources on available vehicles,
costs, and return on investment
analysis
52.88% 147
Electric vehicle demos for drivers 17.99% 50
Resources on location of public
chargers, costs for purchase,
installation, and charging
24.10% 67
Other 5.04% 14
Q6. If you were to consider the purchase of an EV, would you be more interested in a full electric
EV or a Plug-in Hybrid Electric Vehicle?
Answer Choices Response Percent Number of Responses
BEV only 17.99% 50
PHEV only 29.50% 82
Either 43.88% 122
Neither 8.63% 24
Q7. How many days per week do you drive for Uber/Lyft?
Mean 4.47
Minimum 0
Maximum 7
Standard Deviation 1.94
(n=219)
Q8. On a typical driving day, how many paid trips do you have?
Mean 12.40
Minimum 1
Maximum 88
Standard Deviation 8.64
(n=206)
Q9. How many miles do you put on your vehicle per year driving for Uber / Lyft?
Mean 29,792.36
Minimum 0
Maximum 700,000
Standard Deviation 66,777.31
(n=210)

22
Q10. Would you be will to share your vehicle data (amount driven, fuel economy, driving patterns,
etc.) with researchers interested in energy efficiency?
Answer Choices Response Percent Number of Responses
Yes 46.04% 128
No 43.88% 122
If yes, please provide contact info 10.07% 28
23
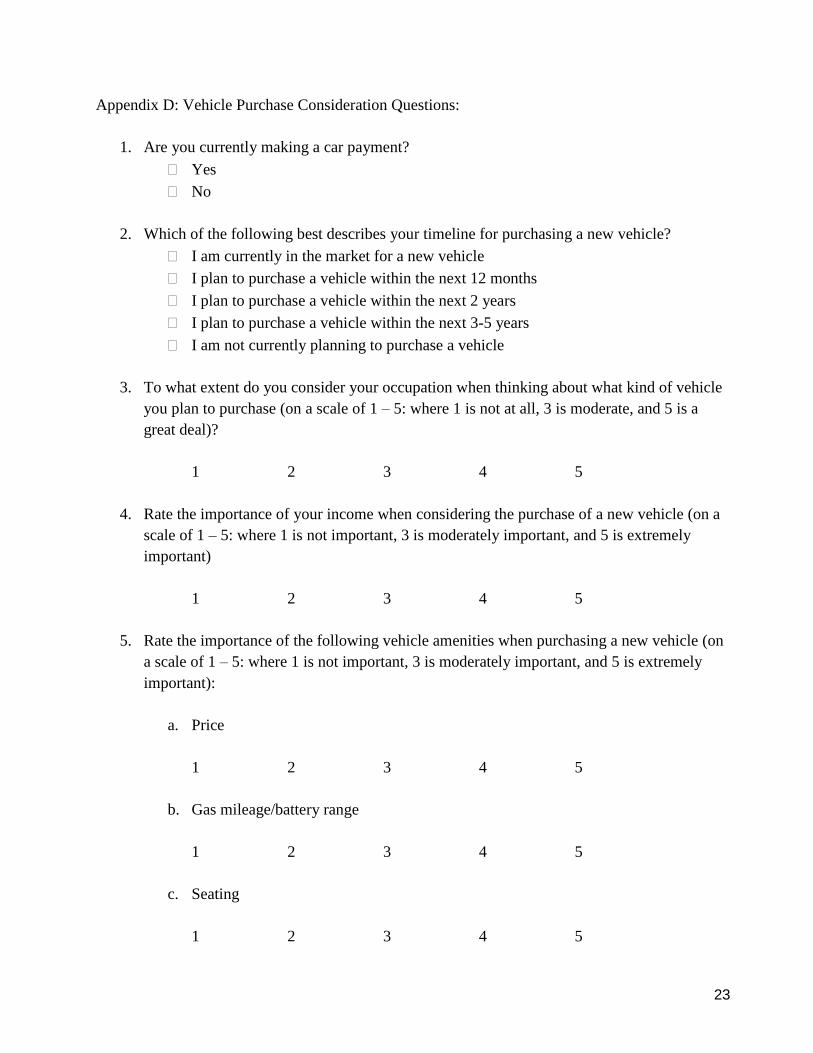
Appendix D: Vehicle Purchase Consideration Questions:
1. Are you currently making a car payment?
Yes
No
2. Which of the following best describes your timeline for purchasing a new vehicle?
I am currently in the market for a new vehicle
I plan to purchase a vehicle within the next 12 months
I plan to purchase a vehicle within the next 2 years
I plan to purchase a vehicle within the next 3-5 years
I am not currently planning to purchase a vehicle
3. To what extent do you consider your occupation when thinking about what kind of vehicle
you plan to purchase (on a scale of 1 – 5: where 1 is not at all, 3 is moderate, and 5 is a
great deal)?
1 2 3 4 5
4. Rate the importance of your income when considering the purchase of a new vehicle (on a
scale of 1 – 5: where 1 is not important, 3 is moderately important, and 5 is extremely
important)
1 2 3 4 5
5. Rate the importance of the following vehicle amenities when purchasing a new vehicle (on
a scale of 1 – 5: where 1 is not important, 3 is moderately important, and 5 is extremely
important):
a. Price
1 2 3 4 5
b. Gas mileage/battery range
1 2 3 4 5
c. Seating
1 2 3 4 5

24
d. Storage space
1 2 3 4 5
e. Visual aesthetic
1 2 3 4 5
f. Automotive brand
1 2 3 4 5
g. Performance (e.g. acceleration, speed, handling)
1 2 3 4 5
h. Environmental impact
1 2 3 4 5
6. How many vehicles are owned within your household? ________
7. How many vehicles are leased within your household? ________
8. Which parking amenities do you have access to where you live? (select all that apply)
On-site personal garage
On-site shared/public garage
On-site personal driveway
Off-site street parking
Other: _____________
EV Perception Questions:
1. Rate the accessibility of public electric vehicle chargers in Columbus (on a scale of 1 – 5:
where 1 is not accessible, 3 is moderately accessible, and 5 is extremely accessible)
1 2 3 4 5 I don’t know
25
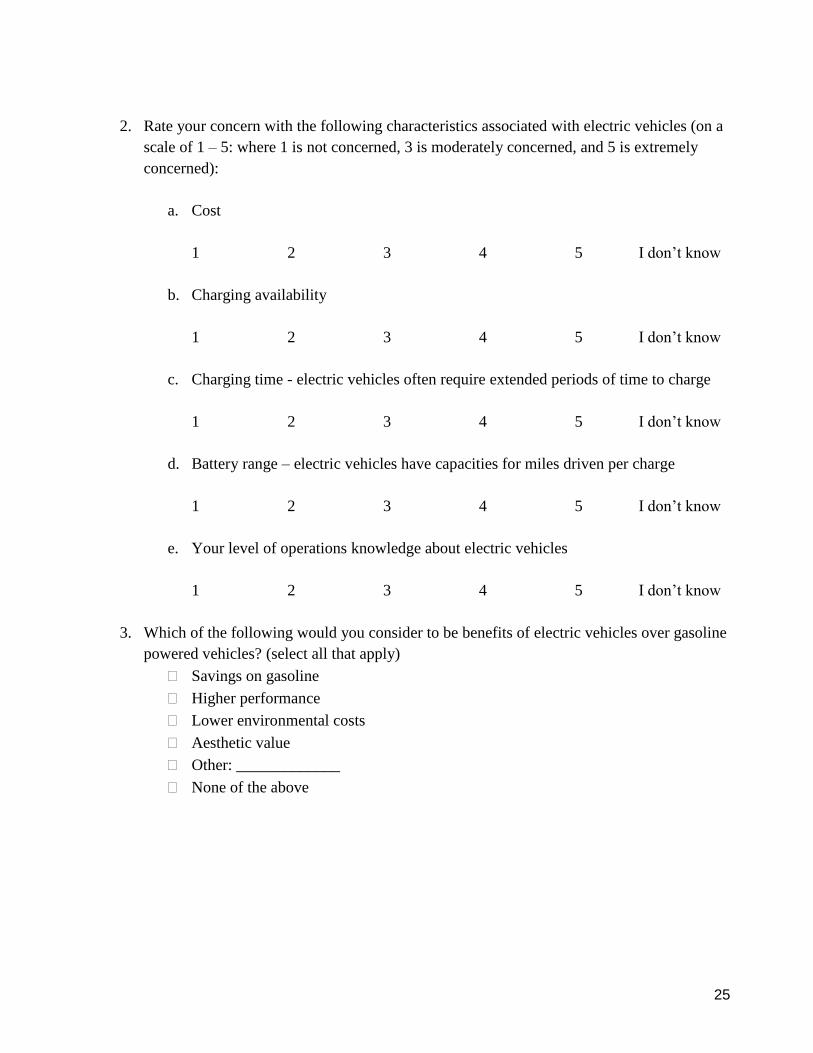
2. Rate your concern with the following characteristics associated with electric vehicles (on a
scale of 1 – 5: where 1 is not concerned, 3 is moderately concerned, and 5 is extremely
concerned):
a. Cost
1 2 3 4 5 I don’t know
b. Charging availability
1 2 3 4 5 I don’t know
c. Charging time - electric vehicles often require extended periods of time to charge
1 2 3 4 5 I don’t know
d. Battery range – electric vehicles have capacities for miles driven per charge
1 2 3 4 5 I don’t know
e. Your level of operations knowledge about electric vehicles
1 2 3 4 5 I don’t know
3. Which of the following would you consider to be benefits of electric vehicles over gasoline
powered vehicles? (select all that apply)
Savings on gasoline
Higher performance
Lower environmental costs
Aesthetic value
Other: _____________
None of the above

26
Demographic Questions:
1. What is your age? ________
2. What is your gender?
Male
Female
Not listed: __________
Prefer not to disclose
3. What is your race/ethnicity?
Asian/Pacific Islander
Black or African American
Hispanic or Latino
Native American or American Indian
White
Not listed: ___________
Prefer not to disclose
4. What is the highest degree or level of school you have completed?
Some high school
High school diploma or equivalent
Some college
Bachelor’s degree (e.g BA, BS)
Master’s Degree (e.g. MA, MS, MEd)
Doctorate (e.g. PhD, EdD)
Other: ___________
5. What is your annual household income?
Below 20k
$20k-$35k
$35k- $50k
$50k- $75k
$75k- $100k
Over $100k

27
Ride-Hailing Platform Driver Specific Questions:
1. Is driving for Uber/Lyft your primary source of income?
Yes
No
2. How long have you been driving for Uber/Lyft?
Less than 6 months
6 – 12 months
1 – 2 years
3 – 5 years
More than 5 years
3. How many hours do you drive in a typical week for Uber/Lyft?
Less than 15
15 – 25
25 – 35
35 – 45
More than 45
I don’t know
4. How many miles do you drive in a typical week for Uber/Lyft?
Less than 50
50 – 100
100 – 150
150 – 200
200 – 250
More than 250
I don’t know
5. How many days in a typical week do you drive for Uber/Lyft?
1
2
3
4
5
6
7
I don’t know

28
6. How many paid rides do you give in a typical day that you drive?
Less than 5
5 – 10
10 – 20
20 – 30
More than 30
I don’t know
7. Rate the importance of driving for Uber/Lyft when considering a new vehicle to purchase
(on a scale of 1 – 5: where 1 is not important, 3 is moderately important, and 5 is extremely
important):
1 2 3 4 5
29
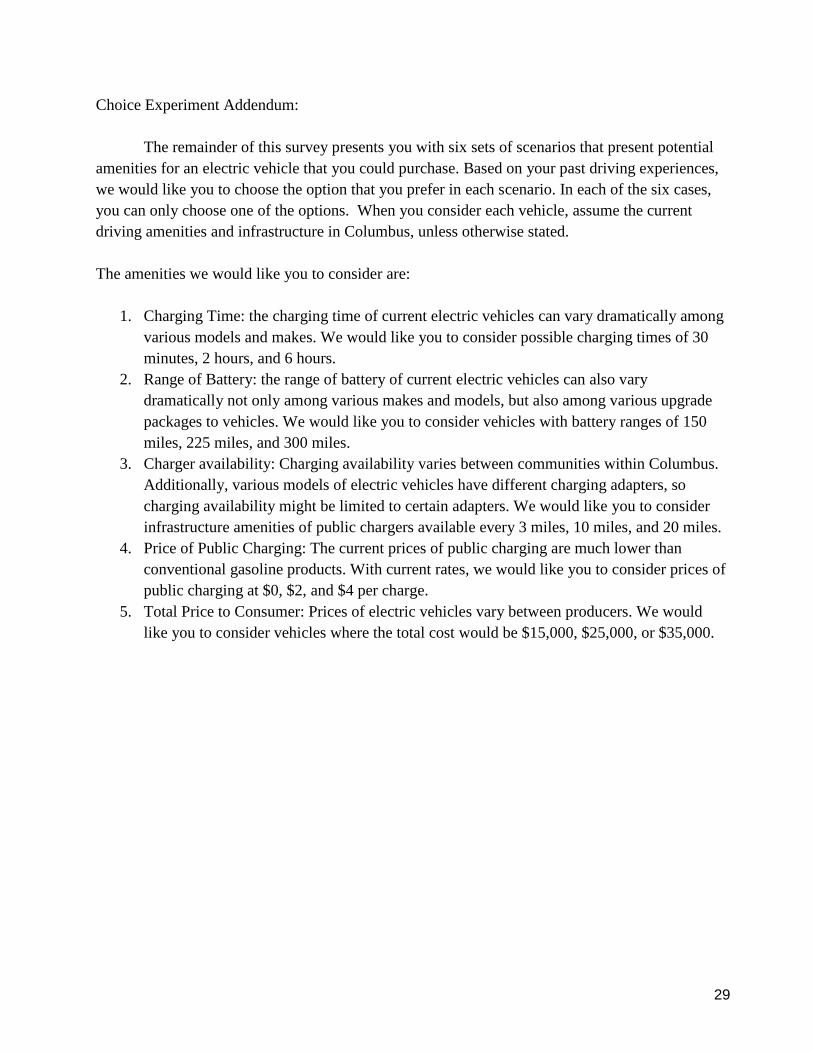
Choice Experiment Addendum:
The remainder of this survey presents you with six sets of scenarios that present potential
amenities for an electric vehicle that you could purchase. Based on your past driving experiences,
we would like you to choose the option that you prefer in each scenario. In each of the six cases,
you can only choose one of the options. When you consider each vehicle, assume the current
driving amenities and infrastructure in Columbus, unless otherwise stated.
The amenities we would like you to consider are:
1. Charging Time: the charging time of current electric vehicles can vary dramatically among
various models and makes. We would like you to consider possible charging times of 30
minutes, 2 hours, and 6 hours.
2. Range of Battery: the range of battery of current electric vehicles can also vary
dramatically not only among various makes and models, but also among various upgrade
packages to vehicles. We would like you to consider vehicles with battery ranges of 150
miles, 225 miles, and 300 miles.
3. Charger availability: Charging availability varies between communities within Columbus.
Additionally, various models of electric vehicles have different charging adapters, so
charging availability might be limited to certain adapters. We would like you to consider
infrastructure amenities of public chargers available every 3 miles, 10 miles, and 20 miles.
4. Price of Public Charging: The current prices of public charging are much lower than
conventional gasoline products. With current rates, we would like you to consider prices of
public charging at $0, $2, and $4 per charge.
5. Total Price to Consumer: Prices of electric vehicles vary between producers. We would
like you to consider vehicles where the total cost would be $15,000, $25,000, or $35,000.
30
Scenario 1:
Vehicle A Vehicle B Vehicle C
30 minute charging time 2 hour charging time
I would not choose to
purchase a vehicle under
these conditions
225 mile battery range 150 mile battery range
Public chargers available
every 3 miles
Public chargers available
every 3 miles
$0 public charging fee $2 public charging fee
$25,000 total price to
consumer
$25,000 total price to
consumer
Which vehicle choice would you make given the specific conditions?
A B C
Scenario 2:
Vehicle A Vehicle B Vehicle C
6 hour charging time 6 hour charging time
I would not choose to
purchase a vehicle under
these conditions
150 mile battery range 300 mile battery range
Public chargers available
every 20 miles
Public chargers available
every 20 miles
$0 public charging fee $4 public charging fee
$15,000 total price to
consumer
$15,000 total price to
consumer
Which vehicle choice would you make given the specific conditions?
A B C
31
Scenario 3:
Vehicle A Vehicle B Vehicle C
30 minute charging time 6 hour charging time
I would not choose to
purchase a vehicle under
these conditions
225 mile battery range 225 mile battery range
Public chargers available
every 20 miles
Public chargers available
every 3 miles
$2 public charging fee $2 public charging fee
$25,000 total price to
consumer
$15,000 total price to
consumer
Which vehicle choice would you make given the specific conditions?
A B C
Scenario 4:
Vehicle A Vehicle B Vehicle C
30 minute charging time 30 min charging time
I would not choose to
purchase a vehicle under
these conditions
225 mile battery range 300 mile battery range
Public chargers available
every 10 miles
Public chargers available
every 10 miles
$2 public charging fee $4 public charging fee
$35,000 total price to
consumer
$35,000 total price to
consumer
Which vehicle choice would you make given the specific conditions?
A B C
32
Scenario 5:
Vehicle A Vehicle B Vehicle C
2 hour charging time 2 hour charging time
I would not choose to
purchase a vehicle under
these conditions
150 mile battery range 150 mile battery range
Public chargers available
every 20 miles
Public chargers available
every 10 miles
$0 public charging fee $0 public charging fee
$15,000 total price to
consumer
$35,000 total price to
consumer
Which vehicle choice would you make given the specific conditions?
A B C
Scenario 6:
Vehicle A Vehicle B Vehicle C
2 hour charging time 6 hour charging time
I would not choose to
purchase a vehicle under
these conditions
300 mile battery range 300 mile battery range
Public chargers available
every 10 miles
Public chargers available
every 3 miles
$4 public charging fee $4 public charging fee
$35,000 total price to
consumer
$25,000 total price to
consumer
Which vehicle choice would you make given the specific conditions?
A B C
33
Works Cited
Adamowicz, W., Louviere, J., & Swait, J. (1998a, January). Introduction to attribute-based stated
choice methods. Report to NOAA, Resource Valuation Branch, Damage Assessment
Center.
Adamowicz, W., Boxall, P., Williams, M., and Louviere, J. (1998b). Stated preference approaches
for measuring passive use values: choice experiment and contingent valuation. American
Journal of Agricultural Economics 80, 64-75.
Hall, J., & Krueger, A. (2016). An Analysis of the Labor Market for Uber’s Driver-Partners in the
United States. doi:10.3386/w22843(6)
Garrett, J. (2019, February 13). Retrieved from https://carnewlist.net/nissan-leaf-4/nissan-leaf-4-
beautiful-nissan-leaf/
Kodjak, D. (2012, December). Consumer Acceptance of Electric Vehicles in the US. Retrieved
from https://www.epa.gov/sites/production/files/2014-09/documents/kodjak121312.pdf
Krupa, J. S., Rizzo, D. M., Eppstein, M. J., Lanute, D. B., Gaalema, D. E., Lakkaraju, K., &
Warrender, C. E. (2014). Analysis of a consumer survey on plug-in hybrid electric
vehicles. Transportation Research Part A: Policy and Practice,64, 14-31.
34
Mishel, L. (2018, May 15). Uber and the labor market: Uber drivers' compensation, wages, and the
scale of Uber and the gig economy. Retrieved from https://www.epi.org/publication/uber-
and-the-labor-market-uber-drivers-compensation-wages-and-the-scale-of-uber-and-the-gig-
economy/
Zhou, Y., Levin, T., & Plotkin, S. E. (2016). Plug-in Electric Vehicle Policy Effectiveness:
Literature Review. doi:10.2172/1255232