Embed Size (px)
Citation preview
OCTOBER 2021
WORKING PAPER 2021-36
Electric ride-hailing charging infrastructure: Needs assessment and equitable siting in HoustonAuthors: Chih-Wei Hsu, Peter Slowik
Keywords: Electric ride-hailing, charging infrastructure access, cities
Introduction and backgroundTransportation electrification is underway globally across all sectors. At the same time, the reach and use of ride-hailing services have greatly expanded in major urban areas in the United States and globally. In U.S. cities with high ride-hailing usage, there are tens of thousands of drivers, more than 20% of urban residents use the services weekly, and ride-hailing rivals local bus usage.1 As ride-hailing continues to grow to be an important pillar of the mobility ecosystem, such fleets raise questions related to their environmental and mobility impacts, and electrification offers an opportunity to eliminate the vehicles’ local emissions.
Cities are at the forefront of the transition to electric vehicles, and several have set ambitious goals to increase electric vehicle uptake. Houston is one such city and aims for electric vehicles to make up 30% of new vehicles sold in 2030.2 Electric vehicle market growth continues as a result. In Houston, annual electric vehicle sales approximately tripled from 2017 to 2019, and the number of cumulative electric vehicle sales is more than 12,000 through 2019.3 However the two trends of electric vehicles and ride-hailing have remained largely independent, and electric vehicle adoption by ride-hailing fleets lags that of the broader private vehicle market. Yet, there are indications that electric vehicles will become a core part of ride-hailing company business models; in 2020, major ride-hailing companies Uber and Lyft pledged to shift to 100% electric
1 Peter Slowik, Nikita Pavlenko, and Nic Lutsey, Emerging policy approaches to electrify ride-hailing in the United States, (Washington, DC: ICCT 2019), https://theicct.org/publications/policy-briefing-electrify-ridehailing
2 Evolve Houston, Electric vehicle roadmap, (2019), https://www.evolvehouston.org/ 3 Anh Bui, Peter Slowik, and Nic Lutsey, Update on electric vehicle adoption across U.S. cities, (Washington, DC:
ICCT, 2020), https://theicct.org/publications/ev-update-us-cities-aug2020
© 2021 INTERNATIONAL COUNCIL ON CLEAN TRANSPORTATION
www.theicct.org
twitter @theicct
Acknowledgements: The authors thank Mike Nicholas, Dave Mullaney, Adam Gromis, Michiko Namazu, and JJ Raynor for their inputs and critical review on an earlier version of the report. Their review does not imply an endorsement, and any errors are the authors’ own.
2 ICCT WORKING PAPER 2021-36 | ELECTRIC RIDE-HAILING CHARGING INFRASTRUCTURE
vehicles in the United States by 2030.4 New public-private partnerships are emerging to meet such goals, as evidenced by the latest alliance between BP, Uber, and the City of Houston to plan for and deploy charging infrastructure for electric ride-hailing drivers.
Forecasting how much charging infrastructure is needed to support future electric ride-hailing is a critical component of planning and policymaking necessary to encourage market growth. The high daily mileage of ride-hailing vehicles and the need to minimize downtime during shifts requires high-powered direct-current (DC) fast charging. Overnight home charging can largely offset the need for public fast charging, but access to home charging remains a major barrier for ride-hail drivers. Public fast charging deployment for ride-hailing can take several forms and include setups ranging from a handful of plugs located inside a parking facility to a vast plaza dedicated to fleet charging. For example, Shenzhen has a charging hub with over 600 DC fast chargers primarily supporting its electrified taxi fleet.5 In London, Uber and BP created a network of charging hubs that typically include one or two chargers and provide discounted charging to Uber drivers.6
Ride-hailing infrastructure announcements in Houston in 2021 indicate a focus on conveniently and equitably placed chargers that are available to the public, which includes deployment in underserved communities and proportional investments throughout the city.7 To provide context to this vision, we assess the distribution of public charging deployment in Houston through 2020 for three equity-focused metrics: household income, race and ethnicity, and environmental pollution burden. Public charging data are from PlugShare,8 household income data are from the Housing and Transportation Affordability Index,9 race and ethnicity data are from the American Community Survey,10 and environmental pollution burden data are from the U.S. Environmental Protection Agency.11
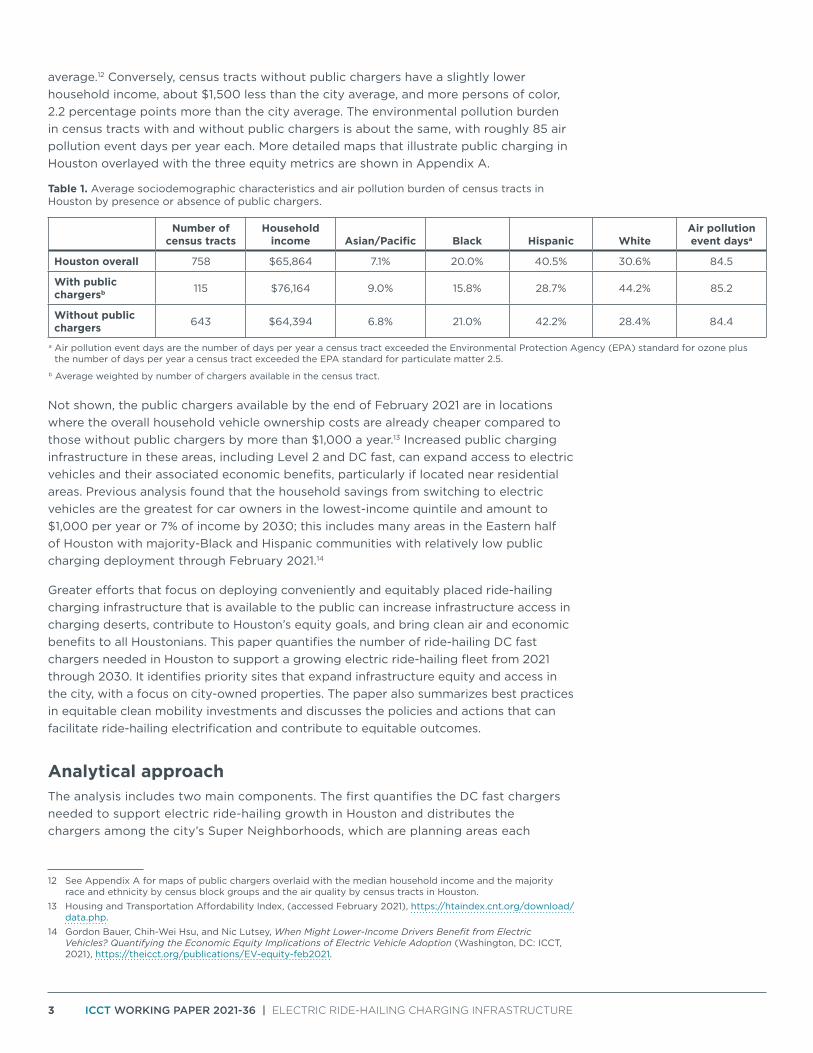
Table 1 summarizes public Level 2 and DC fast charging deployment in Houston through February 2021 citywide and broken down by census tracts with public charging and census tracts without public charging. About 70 DC fast and 366 public Level 2 chargers were in place as of February 2021. There are about 115 census tracts that have one or more public chargers, and about 643 census tracts with no public charging. As shown, census tracts with public chargers on average have a higher household income, 116% the city average, and fewer persons of color, 14 percentage points less than the city
4 “Millions of rides a day. Zero emissions,” Uber, (2020) https://www.uber.com/us/en/about/sustainability/ and Lyft, “Leading the transition to zero emissions: our commitment to 100% electric vehicles by 2030 [blog post],” Lyft blog, (June 17, 2020), https://www.lyft.com/blog/posts/leading-the-transition-to-zero-emissions
5 Bridie Schmidt, “World’s Largest Charging Station in Shenzhen Powers All-Electric Taxi Fleet,” The Driven, May 24, 2019, https://thedriven.io/2019/05/24/worlds-largest-charging-station-in-shenzhen-powers-all-electric-taxi-fleet/.
6 “Rapid Charging Hubs: New Charging Hubs for Uber Partner Drivers,” bp pulse, https://bpchargemaster.com/hubs/.
7 The City of Houston’s Office of Sustainability, “BP and Uber Announce EV Charging and Planning Program with the City of Houston”; Cailin Crowe, “Houston, Uber and BP Partner to Aid EV Transition for Drivers” Smart Cities Dive, February 2, 2021, https://www.smartcitiesdive.com/news/houston-uber-bp-electric-vehicle-charging-planning-partnership/594324/
8 PlugShare, Charging infrastructure data, (accessed January 2021), https://www.plugshare.com.9 Housing and Transportation Affordability Index, (accessed February 2021), https://htaindex.cnt.org/download/
data.php.10 American Community Survey 2017, (accessed February 2021), https://www2.census.gov/geo/tiger/TIGER_
DP/2017ACS/11 Derived Estimates of Air Quality for 2017, (accessed February 2021), https://www.epa.gov/hesc/rsig-related-
downloadable-data-files.
3 ICCT WORKING PAPER 2021-36 | ELECTRIC RIDE-HAILING CHARGING INFRASTRUCTURE
average.12 Conversely, census tracts without public chargers have a slightly lower household income, about $1,500 less than the city average, and more persons of color, 2.2 percentage points more than the city average. The environmental pollution burden in census tracts with and without public chargers is about the same, with roughly 85 air pollution event days per year each. More detailed maps that illustrate public charging in Houston overlayed with the three equity metrics are shown in Appendix A.
Table 1. Average sociodemographic characteristics and air pollution burden of census tracts in Houston by presence or absence of public chargers.
Number of census tracts
Household income Asian/Pacific Black Hispanic White
Air pollution event daysa
Houston overall 758 $65,864 7.1% 20.0% 40.5% 30.6% 84.5
With public chargersb 115 $76,164 9.0% 15.8% 28.7% 44.2% 85.2
Without public chargers 643 $64,394 6.8% 21.0% 42.2% 28.4% 84.4
a Air pollution event days are the number of days per year a census tract exceeded the Environmental Protection Agency (EPA) standard for ozone plus the number of days per year a census tract exceeded the EPA standard for particulate matter 2.5.
b Average weighted by number of chargers available in the census tract.
Not shown, the public chargers available by the end of February 2021 are in locations where the overall household vehicle ownership costs are already cheaper compared to those without public chargers by more than $1,000 a year.13 Increased public charging infrastructure in these areas, including Level 2 and DC fast, can expand access to electric vehicles and their associated economic benefits, particularly if located near residential areas. Previous analysis found that the household savings from switching to electric vehicles are the greatest for car owners in the lowest-income quintile and amount to $1,000 per year or 7% of income by 2030; this includes many areas in the Eastern half of Houston with majority-Black and Hispanic communities with relatively low public charging deployment through February 2021.14
Greater efforts that focus on deploying conveniently and equitably placed ride-hailing charging infrastructure that is available to the public can increase infrastructure access in charging deserts, contribute to Houston’s equity goals, and bring clean air and economic benefits to all Houstonians. This paper quantifies the number of ride-hailing DC fast chargers needed in Houston to support a growing electric ride-hailing fleet from 2021 through 2030. It identifies priority sites that expand infrastructure equity and access in the city, with a focus on city-owned properties. The paper also summarizes best practices in equitable clean mobility investments and discusses the policies and actions that can facilitate ride-hailing electrification and contribute to equitable outcomes.
Analytical approachThe analysis includes two main components. The first quantifies the DC fast chargers needed to support electric ride-hailing growth in Houston and distributes the chargers among the city’s Super Neighborhoods, which are planning areas each
12 See Appendix A for maps of public chargers overlaid with the median household income and the majority race and ethnicity by census block groups and the air quality by census tracts in Houston.
13 Housing and Transportation Affordability Index, (accessed February 2021), https://htaindex.cnt.org/download/data.php.
14 Gordon Bauer, Chih-Wei Hsu, and Nic Lutsey, When Might Lower-Income Drivers Benefit from Electric Vehicles? Quantifying the Economic Equity Implications of Electric Vehicle Adoption (Washington, DC: ICCT, 2021), https://theicct.org/publications/EV-equity-feb2021.
4 ICCT WORKING PAPER 2021-36 | ELECTRIC RIDE-HAILING CHARGING INFRASTRUCTURE
with a Council to identify and implement priority projects for the neighborhood. The second combines an array of inputs to identify priority areas in the city where charging deployment can support the charging needs of electric ride-hail drivers while simultaneously advancing equity and environmental justice. Based on the priority assessment, several example charging sites on city-owned properties located in or near the highest scoring areas are presented.
DC fast charging infrastructure needsBetween 2018 and 2020, approximately 1% of the annual vehicle miles traveled (VMT) nationwide was served by ride-hailing services.15 Across the United States, different regions experience different levels of ride-hailing market penetration. In San Francisco, an area with especially high ride-hailing usage, ride-hailing VMT accounts for 13% of the city’s total VMT in 2018 and 3% of VMT in the metropolitan area.16 Data on the share of ride-hailing VMT in Houston are not available; we assume that ride-hailing in Houston represents 1% of VMT, which is the estimated national average. About 72,000 ride-hailing vehicles serve Houston in 2021, estimated based on the city’s reported total daily VMT (140 million miles and 1.4 million ride-hailing miles) and average ride-hailing vehicle daily VMT (19 miles).17
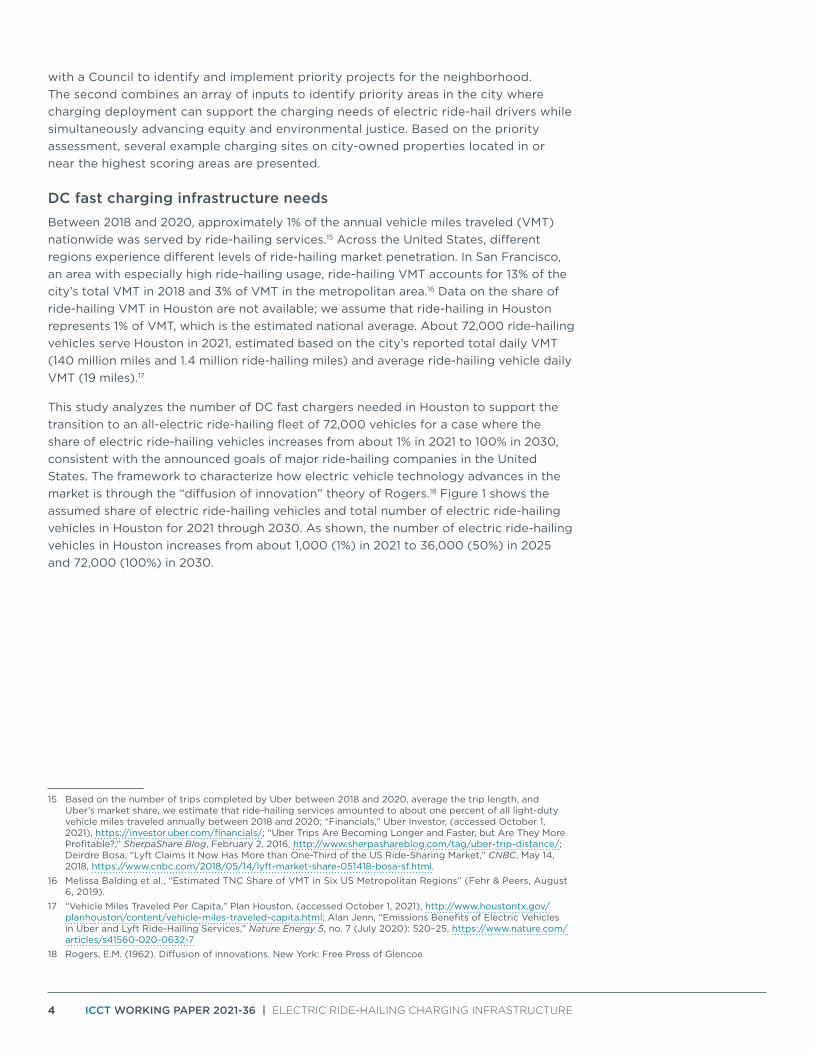
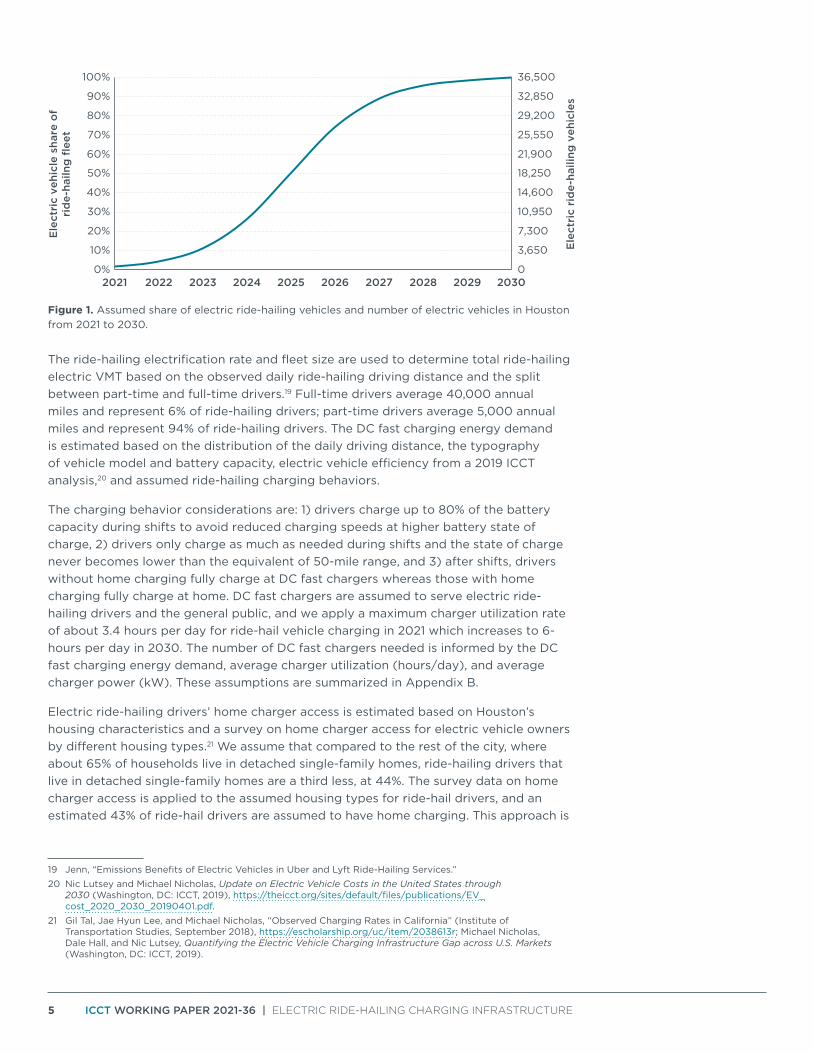
This study analyzes the number of DC fast chargers needed in Houston to support the transition to an all-electric ride-hailing fleet of 72,000 vehicles for a case where the share of electric ride-hailing vehicles increases from about 1% in 2021 to 100% in 2030, consistent with the announced goals of major ride-hailing companies in the United States. The framework to characterize how electric vehicle technology advances in the market is through the “diffusion of innovation” theory of Rogers.18 Figure 1 shows the assumed share of electric ride-hailing vehicles and total number of electric ride-hailing vehicles in Houston for 2021 through 2030. As shown, the number of electric ride-hailing vehicles in Houston increases from about 1,000 (1%) in 2021 to 36,000 (50%) in 2025 and 72,000 (100%) in 2030.
15 Based on the number of trips completed by Uber between 2018 and 2020, average the trip length, and Uber’s market share, we estimate that ride-hailing services amounted to about one percent of all light-duty vehicle miles traveled annually between 2018 and 2020; “Financials,” Uber Investor, (accessed October 1, 2021), https://investor.uber.com/financials/; “Uber Trips Are Becoming Longer and Faster, but Are They More Profitable?,” SherpaShare Blog, February 2, 2016, http://www.sherpashareblog.com/tag/uber-trip-distance/; Deirdre Bosa, “Lyft Claims It Now Has More than One-Third of the US Ride-Sharing Market,” CNBC, May 14, 2018, https://www.cnbc.com/2018/05/14/lyft-market-share-051418-bosa-sf.html.
16 Melissa Balding et al., “Estimated TNC Share of VMT in Six US Metropolitan Regions” (Fehr & Peers, August 6, 2019).
17 “Vehicle Miles Traveled Per Capita,” Plan Houston, (accessed October 1, 2021), http://www.houstontx.gov/planhouston/content/vehicle-miles-traveled-capita.html; Alan Jenn, “Emissions Benefits of Electric Vehicles in Uber and Lyft Ride-Hailing Services,” Nature Energy 5, no. 7 (July 2020): 520–25, https://www.nature.com/articles/s41560-020-0632-7
18 Rogers, E.M. (1962). Diffusion of innovations. New York: Free Press of Glencoe
5 ICCT WORKING PAPER 2021-36 | ELECTRIC RIDE-HAILING CHARGING INFRASTRUCTURE
Ele
ctri
c ri
de-
haili
ng v
ehic
les
Ele
ctri
c ve
hicl
e sh
are
of
rid
e-ha
ilng
flee
t
0
3,650
7,300
10,950
14,600
18,250
21,900
25,550
29,200
32,850
36,500
0%
10%
20%
30%
40%
50%
60%
70%
80%
90%
100%
2021 2022 2023 2024 2025 2026 2027 2028 2029 2030
Figure 1. Assumed share of electric ride-hailing vehicles and number of electric vehicles in Houston from 2021 to 2030.
The ride-hailing electrification rate and fleet size are used to determine total ride-hailing electric VMT based on the observed daily ride-hailing driving distance and the split between part-time and full-time drivers.19 Full-time drivers average 40,000 annual miles and represent 6% of ride-hailing drivers; part-time drivers average 5,000 annual miles and represent 94% of ride-hailing drivers. The DC fast charging energy demand is estimated based on the distribution of the daily driving distance, the typography of vehicle model and battery capacity, electric vehicle efficiency from a 2019 ICCT analysis,20 and assumed ride-hailing charging behaviors.
The charging behavior considerations are: 1) drivers charge up to 80% of the battery capacity during shifts to avoid reduced charging speeds at higher battery state of charge, 2) drivers only charge as much as needed during shifts and the state of charge never becomes lower than the equivalent of 50-mile range, and 3) after shifts, drivers without home charging fully charge at DC fast chargers whereas those with home charging fully charge at home. DC fast chargers are assumed to serve electric ride-hailing drivers and the general public, and we apply a maximum charger utilization rate of about 3.4 hours per day for ride-hail vehicle charging in 2021 which increases to 6-hours per day in 2030. The number of DC fast chargers needed is informed by the DC fast charging energy demand, average charger utilization (hours/day), and average charger power (kW). These assumptions are summarized in Appendix B.
Electric ride-hailing drivers’ home charger access is estimated based on Houston’s housing characteristics and a survey on home charger access for electric vehicle owners by different housing types.21 We assume that compared to the rest of the city, where about 65% of households live in detached single-family homes, ride-hailing drivers that live in detached single-family homes are a third less, at 44%. The survey data on home charger access is applied to the assumed housing types for ride-hail drivers, and an estimated 43% of ride-hail drivers are assumed to have home charging. This approach is
19 Jenn, “Emissions Benefits of Electric Vehicles in Uber and Lyft Ride-Hailing Services.”20 Nic Lutsey and Michael Nicholas, Update on Electric Vehicle Costs in the United States through
2030 (Washington, DC: ICCT, 2019), https://theicct.org/sites/default/files/publications/EV_cost_2020_2030_20190401.pdf.
21 Gil Tal, Jae Hyun Lee, and Michael Nicholas, “Observed Charging Rates in California” (Institute of Transportation Studies, September 2018), https://escholarship.org/uc/item/2038613r; Michael Nicholas, Dale Hall, and Nic Lutsey, Quantifying the Electric Vehicle Charging Infrastructure Gap across U.S. Markets (Washington, DC: ICCT, 2019).
6 ICCT WORKING PAPER 2021-36 | ELECTRIC RIDE-HAILING CHARGING INFRASTRUCTURE
adapted from a previous ICCT ride-hailing charging infrastructure needs analysis.22 For those without home charging, we assume for the drivers’ after-shift charging demand, they charge only at DC fast chargers at locations near their residences. About 58% of ride-hailing drivers who work in Houston are estimated to reside outside the city.23
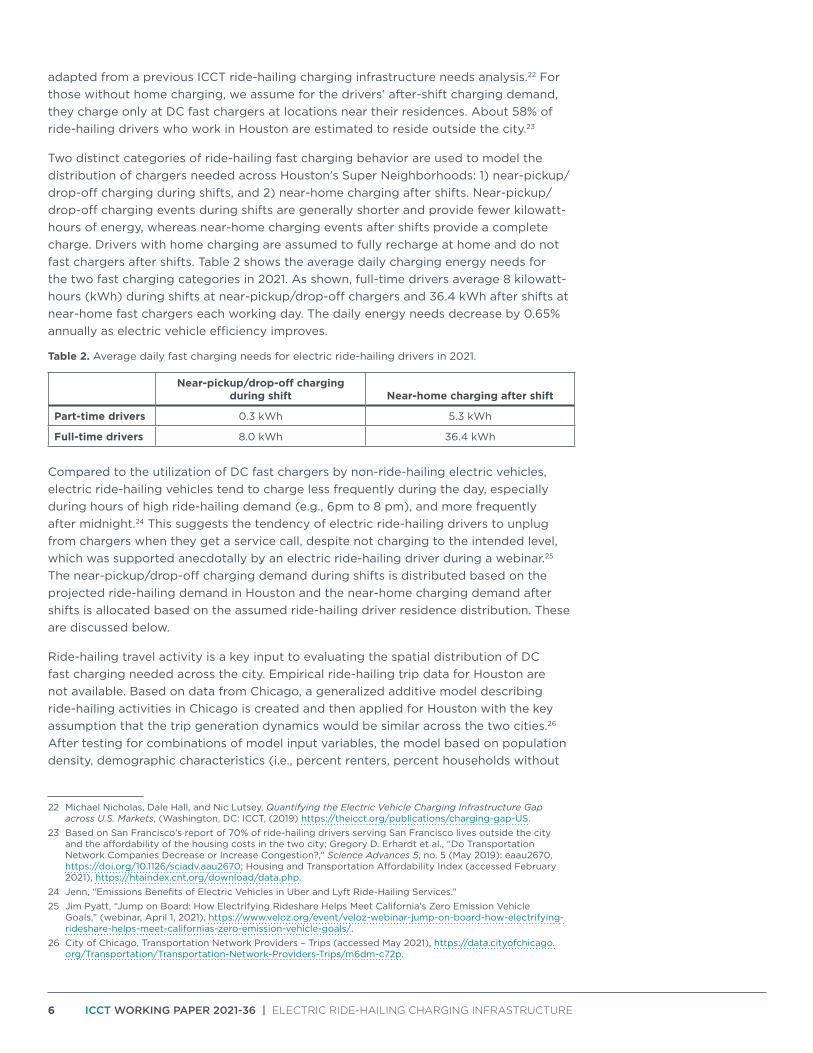
Two distinct categories of ride-hailing fast charging behavior are used to model the distribution of chargers needed across Houston’s Super Neighborhoods: 1) near-pickup/drop-off charging during shifts, and 2) near-home charging after shifts. Near-pickup/drop-off charging events during shifts are generally shorter and provide fewer kilowatt-hours of energy, whereas near-home charging events after shifts provide a complete charge. Drivers with home charging are assumed to fully recharge at home and do not fast chargers after shifts. Table 2 shows the average daily charging energy needs for the two fast charging categories in 2021. As shown, full-time drivers average 8 kilowatt-hours (kWh) during shifts at near-pickup/drop-off chargers and 36.4 kWh after shifts at near-home fast chargers each working day. The daily energy needs decrease by 0.65% annually as electric vehicle efficiency improves.
Table 2. Average daily fast charging needs for electric ride-hailing drivers in 2021.
Near-pickup/drop-off charging during shift Near-home charging after shift
Part-time drivers 0.3 kWh 5.3 kWh
Full-time drivers 8.0 kWh 36.4 kWh
Compared to the utilization of DC fast chargers by non-ride-hailing electric vehicles, electric ride-hailing vehicles tend to charge less frequently during the day, especially during hours of high ride-hailing demand (e.g., 6pm to 8 pm), and more frequently after midnight.24 This suggests the tendency of electric ride-hailing drivers to unplug from chargers when they get a service call, despite not charging to the intended level, which was supported anecdotally by an electric ride-hailing driver during a webinar.25 The near-pickup/drop-off charging demand during shifts is distributed based on the projected ride-hailing demand in Houston and the near-home charging demand after shifts is allocated based on the assumed ride-hailing driver residence distribution. These are discussed below.
Ride-hailing travel activity is a key input to evaluating the spatial distribution of DC fast charging needed across the city. Empirical ride-hailing trip data for Houston are not available. Based on data from Chicago, a generalized additive model describing ride-hailing activities in Chicago is created and then applied for Houston with the key assumption that the trip generation dynamics would be similar across the two cities.26 After testing for combinations of model input variables, the model based on population density, demographic characteristics (i.e., percent renters, percent households without
22 Michael Nicholas, Dale Hall, and Nic Lutsey, Quantifying the Electric Vehicle Charging Infrastructure Gap across U.S. Markets, (Washington, DC: ICCT, (2019) https://theicct.org/publications/charging-gap-US.
23 Based on San Francisco’s report of 70% of ride-hailing drivers serving San Francisco lives outside the city and the affordability of the housing costs in the two city; Gregory D. Erhardt et al., “Do Transportation Network Companies Decrease or Increase Congestion?,” Science Advances 5, no. 5 (May 2019): eaau2670, https://doi.org/10.1126/sciadv.aau2670; Housing and Transportation Affordability Index (accessed February 2021), https://htaindex.cnt.org/download/data.php.
24 Jenn, “Emissions Benefits of Electric Vehicles in Uber and Lyft Ride-Hailing Services.”25 Jim Pyatt, “Jump on Board: How Electrifying Rideshare Helps Meet California’s Zero Emission Vehicle
Goals,” (webinar, April 1, 2021), https://www.veloz.org/event/veloz-webinar-jump-on-board-how-electrifying-rideshare-helps-meet-californias-zero-emission-vehicle-goals/.
26 City of Chicago, Transportation Network Providers – Trips (accessed May 2021), https://data.cityofchicago.org/Transportation/Transportation-Network-Providers-Trips/m6dm-c72p.
7 ICCT WORKING PAPER 2021-36 | ELECTRIC RIDE-HAILING CHARGING INFRASTRUCTURE
cars),27 and the types of jobs at the census-tract level performed best in predicting the ride-hailing trip concentration.28 This model is used to project ride-hailing activity in each census block group in Houston. Additional data from Washington DC is used to estimate the share of ride-hailing trips that originate at or are destined to airports,29 and 12% of the Houston ride-hailing activity is redistributed to the two larger regional airports—9% to George Bush Intercontinental (IAH) and 3% to William P. Hobby Airport (HOU).30
The demand for near-home DC fast charging after shifts is estimated based on the distribution of the residences of ride-hailing drivers. Only the after shift charging demand for the approximately 42% of ride-hailing drivers that reside within the city is accounted for. Driver residences for full-time and part-time drivers are distributed identically across census tracts based on the share of households with income of less than $60,000, slightly higher than the regional median of $57,000 as suggested by the American Community Survey. Drivers with home charging do not use fast chargers after shifts. Although not quantified here, greater deployment of home and conveniently placed near-home public Level 2 charging options would offset DC fast charging demand, provide lower-cost electricity, and reduce drivers’ opportunity cost of charging.
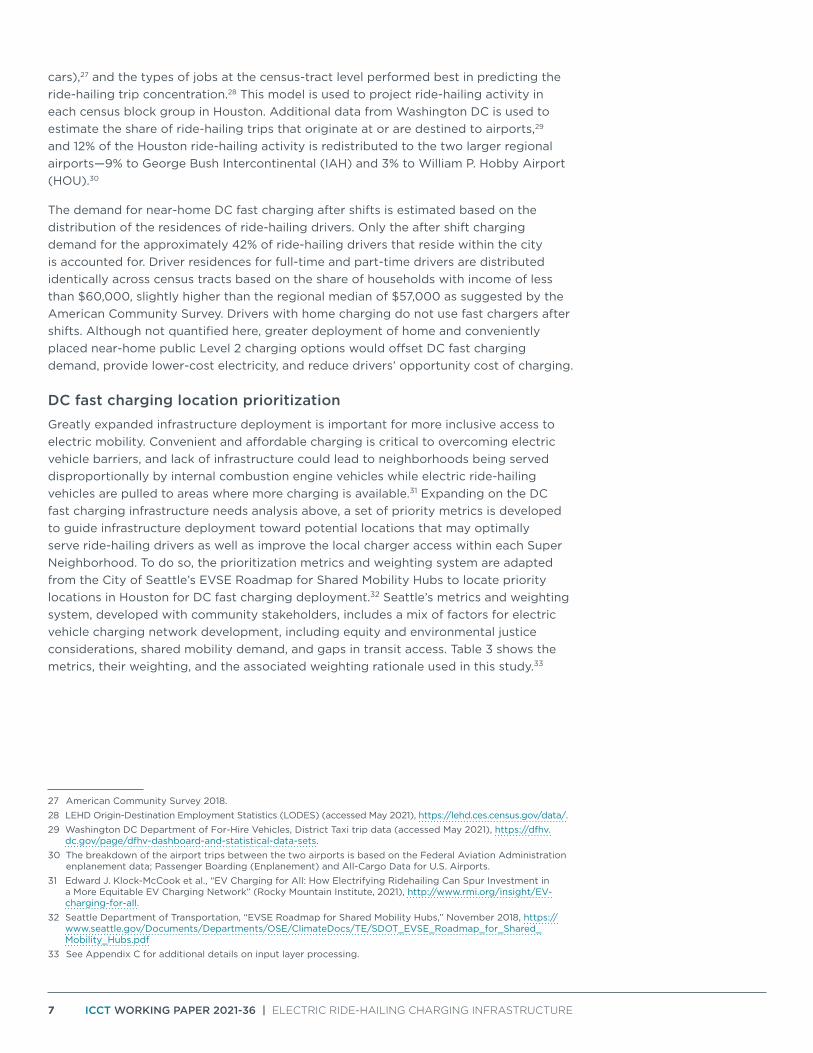
DC fast charging location prioritization Greatly expanded infrastructure deployment is important for more inclusive access to electric mobility. Convenient and affordable charging is critical to overcoming electric vehicle barriers, and lack of infrastructure could lead to neighborhoods being served disproportionally by internal combustion engine vehicles while electric ride-hailing vehicles are pulled to areas where more charging is available.31 Expanding on the DC fast charging infrastructure needs analysis above, a set of priority metrics is developed to guide infrastructure deployment toward potential locations that may optimally serve ride-hailing drivers as well as improve the local charger access within each Super Neighborhood. To do so, the prioritization metrics and weighting system are adapted from the City of Seattle’s EVSE Roadmap for Shared Mobility Hubs to locate priority locations in Houston for DC fast charging deployment.32 Seattle’s metrics and weighting system, developed with community stakeholders, includes a mix of factors for electric vehicle charging network development, including equity and environmental justice considerations, shared mobility demand, and gaps in transit access. Table 3 shows the metrics, their weighting, and the associated weighting rationale used in this study.33
27 American Community Survey 2018.28 LEHD Origin-Destination Employment Statistics (LODES) (accessed May 2021), https://lehd.ces.census.gov/data/.29 Washington DC Department of For-Hire Vehicles, District Taxi trip data (accessed May 2021), https://dfhv.
dc.gov/page/dfhv-dashboard-and-statistical-data-sets.30 The breakdown of the airport trips between the two airports is based on the Federal Aviation Administration
enplanement data; Passenger Boarding (Enplanement) and All-Cargo Data for U.S. Airports.31 Edward J. Klock-McCook et al., “EV Charging for All: How Electrifying Ridehailing Can Spur Investment in
a More Equitable EV Charging Network” (Rocky Mountain Institute, 2021), http://www.rmi.org/insight/EV-charging-for-all.
32 Seattle Department of Transportation, “EVSE Roadmap for Shared Mobility Hubs,” November 2018, https://www.seattle.gov/Documents/Departments/OSE/ClimateDocs/TE/SDOT_EVSE_Roadmap_for_Shared_Mobility_Hubs.pdf
33 See Appendix C for additional details on input layer processing.
8 ICCT WORKING PAPER 2021-36 | ELECTRIC RIDE-HAILING CHARGING INFRASTRUCTURE
Table 3. DC fast charging prioritization factors and weighting. Adapted from the Seattle Department of Transportation “EVSE Roadmap for Shared Mobility Hubs”
Prioritization category Metric
Metric weight Metric inclusion and weighting rationale
Combined weight
Electric vehicle network development
Proximity to public charging infrastructurea 30%
Indicates locations within the city lacking charger access, weighted heavily to emphasize charger access expansion; 24% for DC fast chargers and 6% for Level 2
40%Accessibility to major highwaysb 5% Easy-to-access charging locations for ride-hailing drivers
Retail amenitiesc 5% Amenities for convenience for ride-hailing drivers during wait time while they charge
Equity & environmental justice
Low-income householdsd 5% Proxy for communities that have historically experienced disinvestment
20%Communities of colord 7.5% Proxy for communities that have historically experienced disinvestment
Air quality pollutione 7.5% Communities experiencing higher environmental burdens
Shared mobility demand
Projected ride-hailing demandf 20% Indicates locations with potentially higher charging needs 20%
Gaps in transit access
Low-frequency transit accessg 15% Opportunity for electric ride-hailing to supplement low-frequency transit and facilitate first-last mile connections
20%
Zero vehicle householdsd 5% Proxy for potential benefit from transit access via ride-hailing services
a Charging infrastructure data (accessed January 2021), https://www.plugshare.com.b OpenStreetMap Overpass API (accessed February 2021), https://wiki.openstreetmap.org/wiki/Overpass_API.c Google Places API (accessed February 2021), https://developers.google.com/maps/documentation/places/web-service/overview.d American Community Survey 2018e Derived Estimates of Air Quality for 2017 (accessed February 2021), https://www.epa.gov/hesc/rsig-related-downloadable-data-files.f Input using projections based on model created using Chicago’s ride-hailing activity data.g Houston METRO Transit Data (accessed February 2021), https://api-portal.ridemetro.org/.
We divide the city into hexagons with 0.14 miles radius spaced 0.25 miles apart. Each hexagon and the area it represents are scored based on the eight prioritization metrics and their weighting. Specific sites within the highest-scoring hexagons that might be suitable for charging infrastructure deployment are then identified. The sites identified are limited to only locations and properties owned by the City of Houston according to the Harris County Appraisal District,34 reflecting the city’s interest in exploring opening up its properties for companies to install chargers.35 Based on an examination of Google map images, we survey the city-owned properties located in the high-scoring areas and evaluate them individually based on several criteria, including general the sense of safety, visibility from the road, ease of access for drivers, and potential conflicts with existing building and synergy with services on and near the site.
ResultsThe results of the ride-hailing charging infrastructure need analysis are first presented on a citywide level to convey the scale of greater charging needs. The citywide findings are followed by the findings at the Super Neighborhood level to provide further insight into the varying needs across Houston. The infrastructure needs results are followed by the
34 Harris County Appraisal District Property Data, (accessed February 2021), https://hcad.org/pdata/pdata-property-downloads.html.
35 Cailin Crowe, “Houston, Uber and BP Partner to Aid EV Transition for Drivers.”
9 ICCT WORKING PAPER 2021-36 | ELECTRIC RIDE-HAILING CHARGING INFRASTRUCTURE
findings from the charging location prioritization analysis, and several example charging sites located in or near the highest scoring areas are discussed.
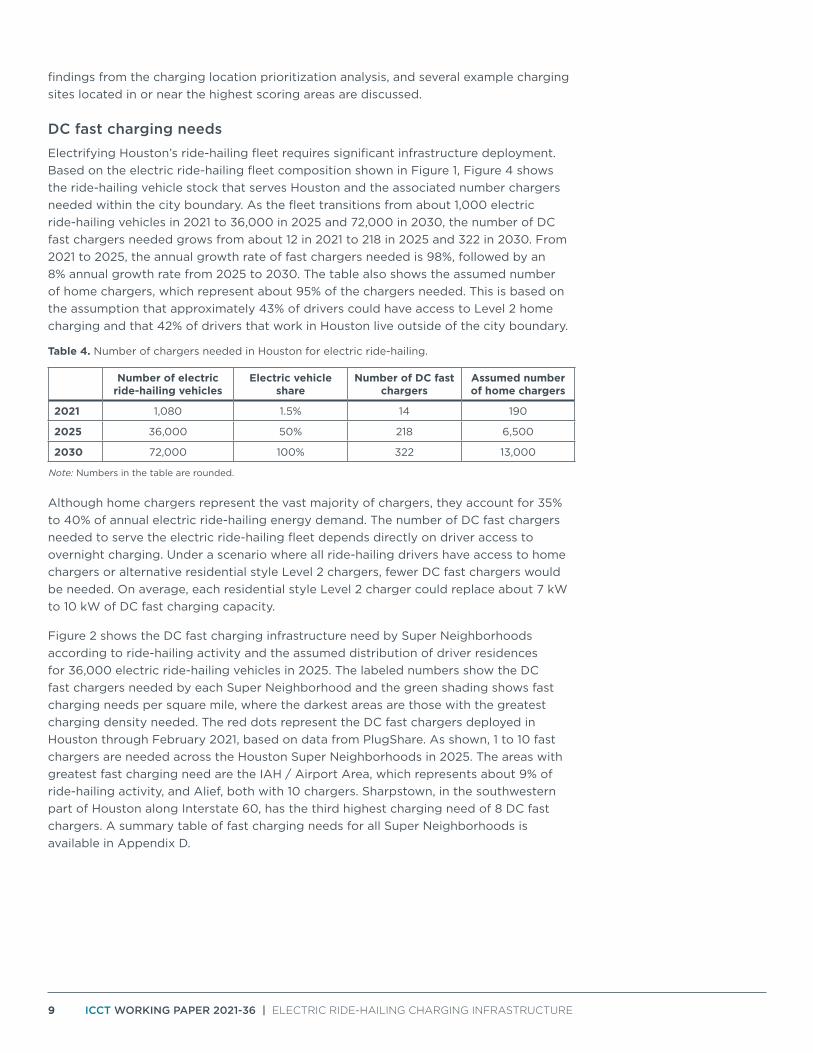
DC fast charging needsElectrifying Houston’s ride-hailing fleet requires significant infrastructure deployment. Based on the electric ride-hailing fleet composition shown in Figure 1, Figure 4 shows the ride-hailing vehicle stock that serves Houston and the associated number chargers needed within the city boundary. As the fleet transitions from about 1,000 electric ride-hailing vehicles in 2021 to 36,000 in 2025 and 72,000 in 2030, the number of DC fast chargers needed grows from about 12 in 2021 to 218 in 2025 and 322 in 2030. From 2021 to 2025, the annual growth rate of fast chargers needed is 98%, followed by an 8% annual growth rate from 2025 to 2030. The table also shows the assumed number of home chargers, which represent about 95% of the chargers needed. This is based on the assumption that approximately 43% of drivers could have access to Level 2 home charging and that 42% of drivers that work in Houston live outside of the city boundary.
Table 4. Number of chargers needed in Houston for electric ride-hailing.
Number of electric ride-hailing vehicles
Electric vehicle share
Number of DC fast chargers
Assumed number of home chargers
2021 1,080 1.5% 14 190
2025 36,000 50% 218 6,500
2030 72,000 100% 322 13,000
Note: Numbers in the table are rounded.
Although home chargers represent the vast majority of chargers, they account for 35% to 40% of annual electric ride-hailing energy demand. The number of DC fast chargers needed to serve the electric ride-hailing fleet depends directly on driver access to overnight charging. Under a scenario where all ride-hailing drivers have access to home chargers or alternative residential style Level 2 chargers, fewer DC fast chargers would be needed. On average, each residential style Level 2 charger could replace about 7 kW to 10 kW of DC fast charging capacity.
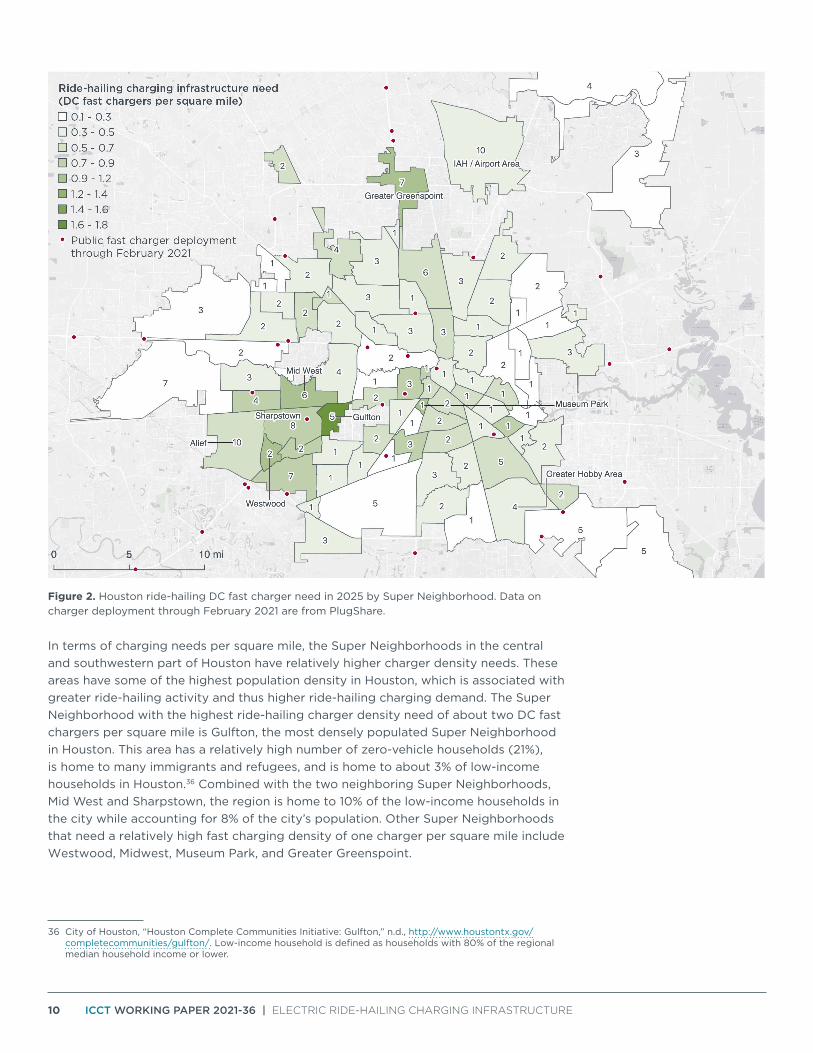
Figure 2 shows the DC fast charging infrastructure need by Super Neighborhoods according to ride-hailing activity and the assumed distribution of driver residences for 36,000 electric ride-hailing vehicles in 2025. The labeled numbers show the DC fast chargers needed by each Super Neighborhood and the green shading shows fast charging needs per square mile, where the darkest areas are those with the greatest charging density needed. The red dots represent the DC fast chargers deployed in Houston through February 2021, based on data from PlugShare. As shown, 1 to 10 fast chargers are needed across the Houston Super Neighborhoods in 2025. The areas with greatest fast charging need are the IAH / Airport Area, which represents about 9% of ride-hailing activity, and Alief, both with 10 chargers. Sharpstown, in the southwestern part of Houston along Interstate 60, has the third highest charging need of 8 DC fast chargers. A summary table of fast charging needs for all Super Neighborhoods is available in Appendix D.
10 ICCT WORKING PAPER 2021-36 | ELECTRIC RIDE-HAILING CHARGING INFRASTRUCTURE
Figure 2. Houston ride-hailing DC fast charger need in 2025 by Super Neighborhood. Data on charger deployment through February 2021 are from PlugShare.
In terms of charging needs per square mile, the Super Neighborhoods in the central and southwestern part of Houston have relatively higher charger density needs. These areas have some of the highest population density in Houston, which is associated with greater ride-hailing activity and thus higher ride-hailing charging demand. The Super Neighborhood with the highest ride-hailing charger density need of about two DC fast chargers per square mile is Gulfton, the most densely populated Super Neighborhood in Houston. This area has a relatively high number of zero-vehicle households (21%), is home to many immigrants and refugees, and is home to about 3% of low-income households in Houston.36 Combined with the two neighboring Super Neighborhoods, Mid West and Sharpstown, the region is home to 10% of the low-income households in the city while accounting for 8% of the city’s population. Other Super Neighborhoods that need a relatively high fast charging density of one charger per square mile include Westwood, Midwest, Museum Park, and Greater Greenspoint.
36 City of Houston, “Houston Complete Communities Initiative: Gulfton,” n.d., http://www.houstontx.gov/completecommunities/gulfton/. Low-income household is defined as households with 80% of the regional median household income or lower.
11 ICCT WORKING PAPER 2021-36 | ELECTRIC RIDE-HAILING CHARGING INFRASTRUCTURE
With respect to ride-hailing operation, charging infrastructure needs can be minimized through ride-hailing operator coordination and scheduling during idle time for ride-hailing vehicles. In our analysis we apply a maximum utilization rate of to six hours per day in 2030 for ride-hailing vehicle charging to account for the shared use of fast chargers by ride-hailing drivers and the general public. In practice, ride-hailing operators could use enhanced trip routing algorithms to better consider real-time factors such as vehicle state of charge and charger locations and availability to further increase utilization. Greater utilization than what is modeled here would result in fewer DC fast chargers needed and vice versa. Continued data collection and monitoring of infrastructure deployment and ride-hailing activity can help guide local charging infrastructure strategies and help reveal relative gaps and locations to prioritize.
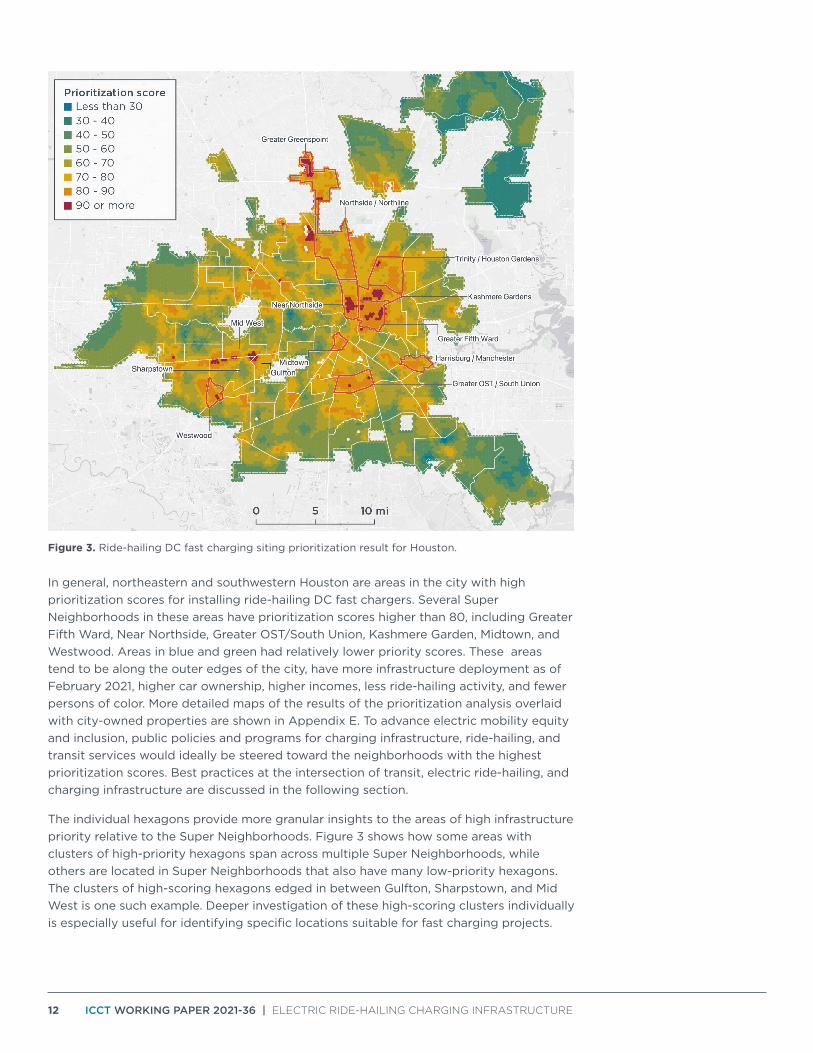
Ride-hailing DC fast charging location prioritizationThe infrastructure location prioritization metrics build on the ride-hailing fast charging needs assessment to identify priority locations within the city for deployment. The prioritization analysis is intended to guide near-term infrastructure deployment to facilitate electric ride-hailing and expand electric mobility access in local communities. Figure 3 shows the result of the prioritization analysis based on electric vehicle network development, equity and environmental justice considerations, shared mobility demand, and gaps in transit access. The redder an area, the higher the location scored based on the priority metrics and weightings introduced above. The ten highest-scoring Super Neighborhoods on average are outlined with the thick red lines and listed below starting with the highest scoring neighborhood:
» Greater Fifth Ward: 86.9
» Near Northside: 82.4
» Greater OST / South Union: 82.2
» Kashmere Garden: 82.0
» Midtown: 81.7
» Westwood: 80.2
» Greater Greenspoint: 79.9
» Trinity / Houston Gardens: 79.7
» Harrisburg/Manchester: 77.1
» Northside/Northline: 76.7
A more detailed summary of the scores for all Super Neighborhoods is shown in Appendix F.
12 ICCT WORKING PAPER 2021-36 | ELECTRIC RIDE-HAILING CHARGING INFRASTRUCTURE
Figure 3. Ride-hailing DC fast charging siting prioritization result for Houston.
In general, northeastern and southwestern Houston are areas in the city with high prioritization scores for installing ride-hailing DC fast chargers. Several Super Neighborhoods in these areas have prioritization scores higher than 80, including Greater Fifth Ward, Near Northside, Greater OST/South Union, Kashmere Garden, Midtown, and Westwood. Areas in blue and green had relatively lower priority scores. These areas tend to be along the outer edges of the city, have more infrastructure deployment as of February 2021, higher car ownership, higher incomes, less ride-hailing activity, and fewer persons of color. More detailed maps of the results of the prioritization analysis overlaid with city-owned properties are shown in Appendix E. To advance electric mobility equity and inclusion, public policies and programs for charging infrastructure, ride-hailing, and transit services would ideally be steered toward the neighborhoods with the highest prioritization scores. Best practices at the intersection of transit, electric ride-hailing, and charging infrastructure are discussed in the following section.
The individual hexagons provide more granular insights to the areas of high infrastructure priority relative to the Super Neighborhoods. Figure 3 shows how some areas with clusters of high-priority hexagons span across multiple Super Neighborhoods, while others are located in Super Neighborhoods that also have many low-priority hexagons. The clusters of high-scoring hexagons edged in between Gulfton, Sharpstown, and Mid West is one such example. Deeper investigation of these high-scoring clusters individually is especially useful for identifying specific locations suitable for fast charging projects.
13 ICCT WORKING PAPER 2021-36 | ELECTRIC RIDE-HAILING CHARGING INFRASTRUCTURE
Using the prioritization results, we identified three illustrative example sites on city-owned properties at or near clusters of high scoring hexagons. In additional to the factors already considered by the prioritization metrics, the three sites were chosen based on their visibility, general sense of safety, ease of access, potential conflicts and synergies with existing services and buildings, and structures on or nearby the property. The three sites introduced here are meant as illustrative examples to show how the results from the infrastructure prioritization analysis can support individual site selection. Diverse stakeholders have unique siting considerations, and the findings outlined here would ideally be applied alongside supplemental siting analyses by charging providers and other entities to assess factors like power availability, proximity to electrical service, parking area layout, and constructability.
The three sites identified are in Greater Greenspoint in northern Houston, Greater Fifth Ward in eastern Houston, and Mid West bordering Gulfton and Sharpstown in the southwestern part of Houston. The three identified here as high priority areas are consistent with findings from other equity-focused analyses in Houston: all three sites are located in the Transportation Equity Demand Index high-need area as identified by Link Houston, and are zones deemed in need of investment assistance under Houston ordinance.37
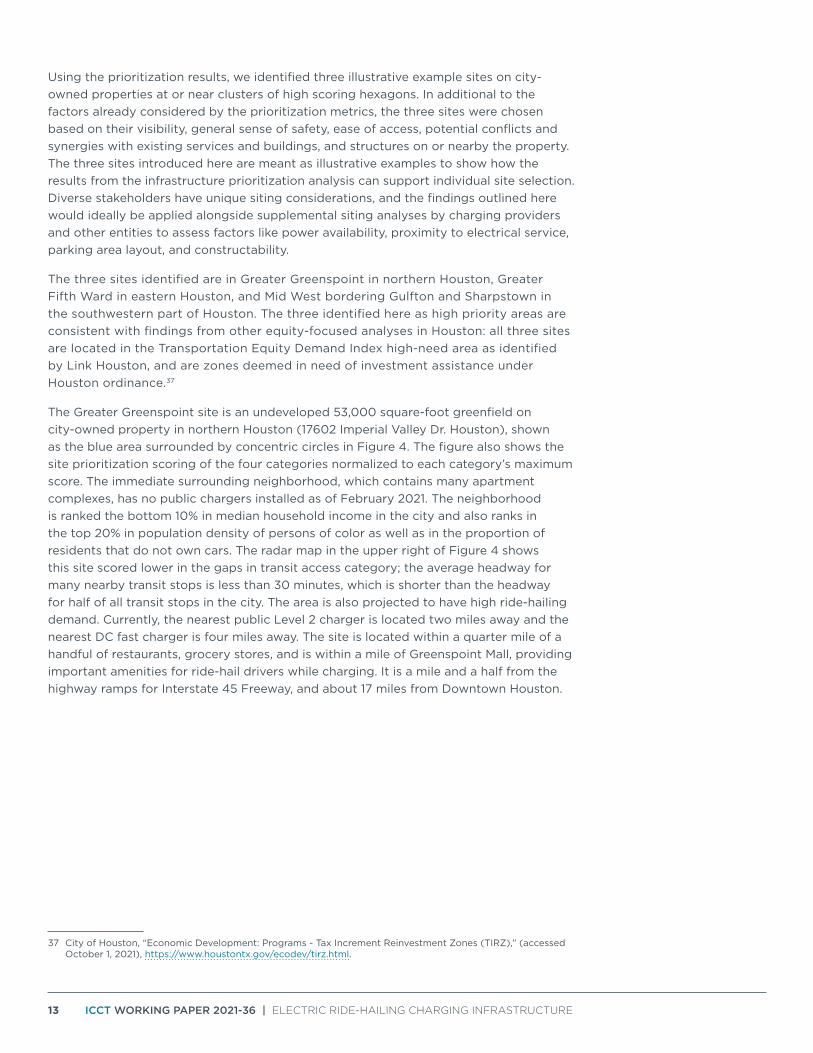
The Greater Greenspoint site is an undeveloped 53,000 square-foot greenfield on city-owned property in northern Houston (17602 Imperial Valley Dr. Houston), shown as the blue area surrounded by concentric circles in Figure 4. The figure also shows the site prioritization scoring of the four categories normalized to each category’s maximum score. The immediate surrounding neighborhood, which contains many apartment complexes, has no public chargers installed as of February 2021. The neighborhood is ranked the bottom 10% in median household income in the city and also ranks in the top 20% in population density of persons of color as well as in the proportion of residents that do not own cars. The radar map in the upper right of Figure 4 shows this site scored lower in the gaps in transit access category; the average headway for many nearby transit stops is less than 30 minutes, which is shorter than the headway for half of all transit stops in the city. The area is also projected to have high ride-hailing demand. Currently, the nearest public Level 2 charger is located two miles away and the nearest DC fast charger is four miles away. The site is located within a quarter mile of a handful of restaurants, grocery stores, and is within a mile of Greenspoint Mall, providing important amenities for ride-hail drivers while charging. It is a mile and a half from the highway ramps for Interstate 45 Freeway, and about 17 miles from Downtown Houston.
37 City of Houston, “Economic Development: Programs - Tax Increment Reinvestment Zones (TIRZ),” (accessed October 1, 2021), https://www.houstontx.gov/ecodev/tirz.html.
14 ICCT WORKING PAPER 2021-36 | ELECTRIC RIDE-HAILING CHARGING INFRASTRUCTURE
Figure 4. Example ride-hailing DC fast charging site in Greater Greenspoint.
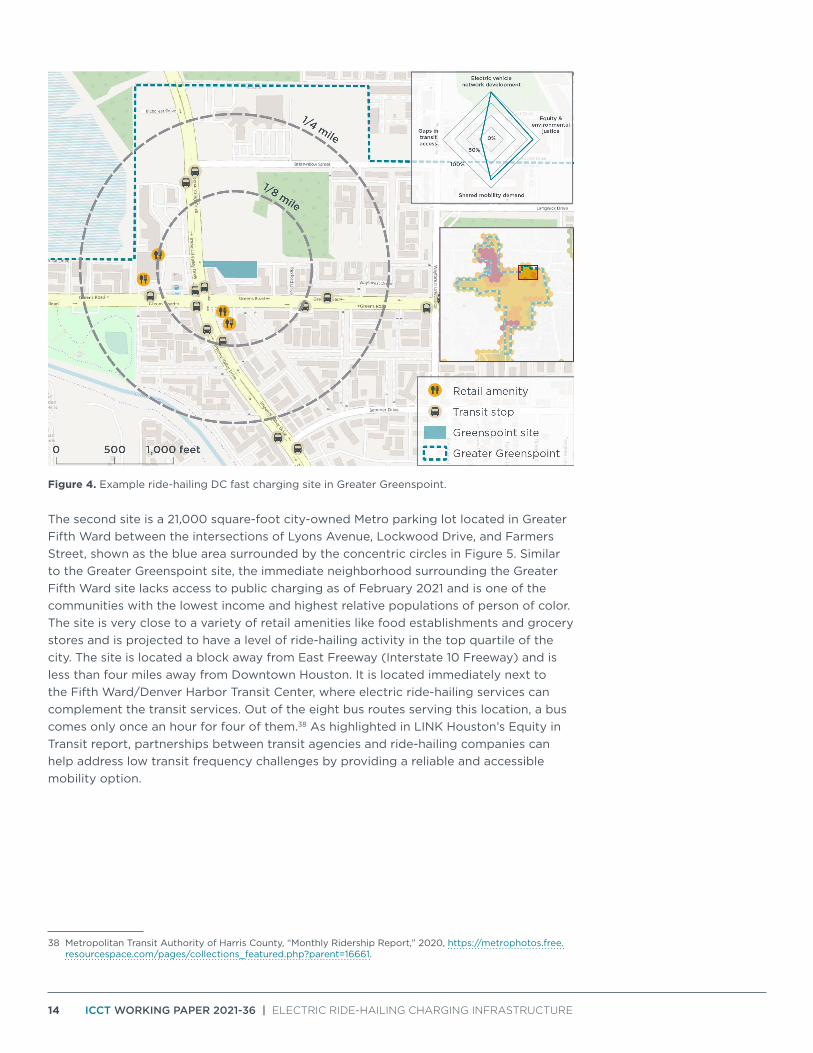
The second site is a 21,000 square-foot city-owned Metro parking lot located in Greater Fifth Ward between the intersections of Lyons Avenue, Lockwood Drive, and Farmers Street, shown as the blue area surrounded by the concentric circles in Figure 5. Similar to the Greater Greenspoint site, the immediate neighborhood surrounding the Greater Fifth Ward site lacks access to public charging as of February 2021 and is one of the communities with the lowest income and highest relative populations of person of color. The site is very close to a variety of retail amenities like food establishments and grocery stores and is projected to have a level of ride-hailing activity in the top quartile of the city. The site is located a block away from East Freeway (Interstate 10 Freeway) and is less than four miles away from Downtown Houston. It is located immediately next to the Fifth Ward/Denver Harbor Transit Center, where electric ride-hailing services can complement the transit services. Out of the eight bus routes serving this location, a bus comes only once an hour for four of them.38 As highlighted in LINK Houston’s Equity in Transit report, partnerships between transit agencies and ride-hailing companies can help address low transit frequency challenges by providing a reliable and accessible mobility option.
38 Metropolitan Transit Authority of Harris County, “Monthly Ridership Report,” 2020, https://metrophotos.free.resourcespace.com/pages/collections_featured.php?parent=16661.
15 ICCT WORKING PAPER 2021-36 | ELECTRIC RIDE-HAILING CHARGING INFRASTRUCTURE
Figure 5. Example ride-hailing DC fast charging site in Greater Fifth Ward.
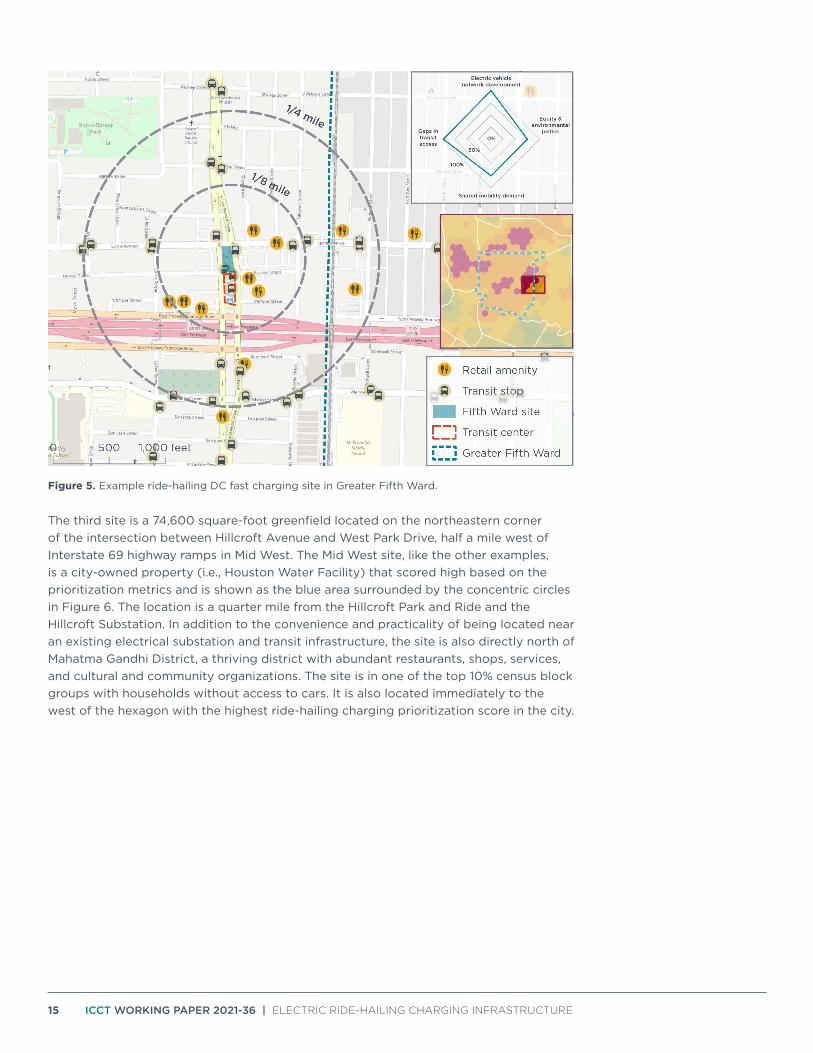
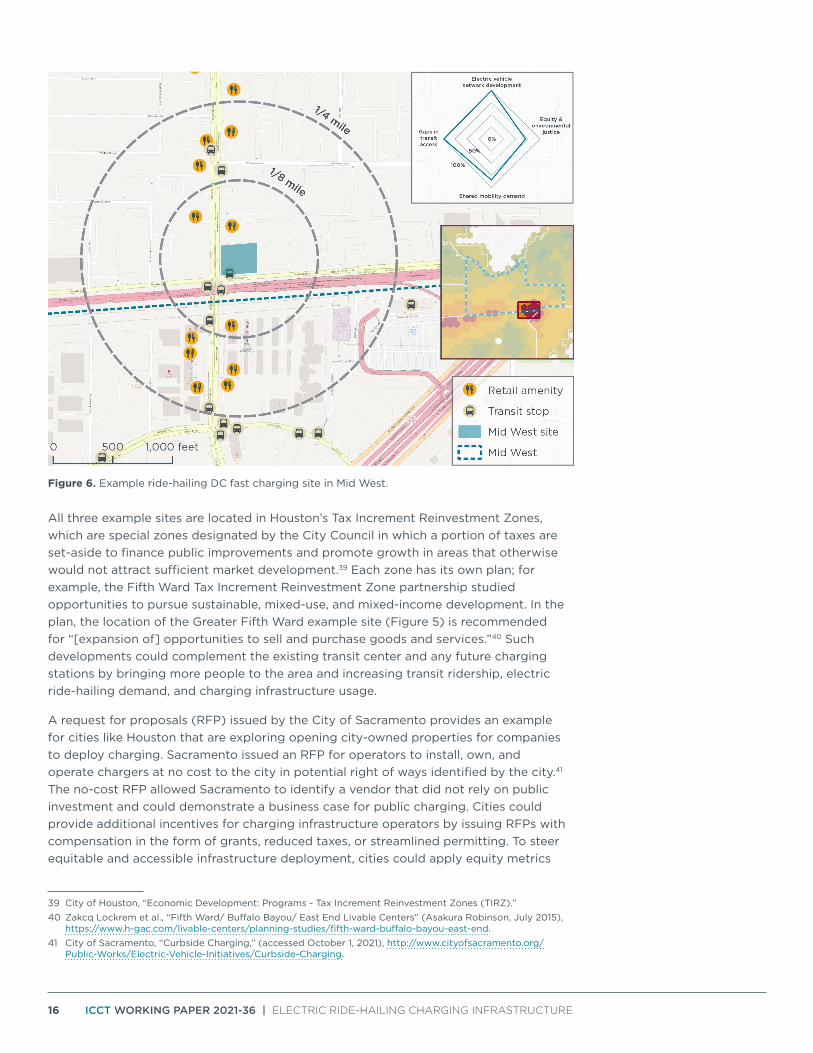
The third site is a 74,600 square-foot greenfield located on the northeastern corner of the intersection between Hillcroft Avenue and West Park Drive, half a mile west of Interstate 69 highway ramps in Mid West. The Mid West site, like the other examples, is a city-owned property (i.e., Houston Water Facility) that scored high based on the prioritization metrics and is shown as the blue area surrounded by the concentric circles in Figure 6. The location is a quarter mile from the Hillcroft Park and Ride and the Hillcroft Substation. In addition to the convenience and practicality of being located near an existing electrical substation and transit infrastructure, the site is also directly north of Mahatma Gandhi District, a thriving district with abundant restaurants, shops, services, and cultural and community organizations. The site is in one of the top 10% census block groups with households without access to cars. It is also located immediately to the west of the hexagon with the highest ride-hailing charging prioritization score in the city.
16 ICCT WORKING PAPER 2021-36 | ELECTRIC RIDE-HAILING CHARGING INFRASTRUCTURE
Figure 6. Example ride-hailing DC fast charging site in Mid West.
All three example sites are located in Houston’s Tax Increment Reinvestment Zones, which are special zones designated by the City Council in which a portion of taxes are set-aside to finance public improvements and promote growth in areas that otherwise would not attract sufficient market development.39 Each zone has its own plan; for example, the Fifth Ward Tax Increment Reinvestment Zone partnership studied opportunities to pursue sustainable, mixed-use, and mixed-income development. In the plan, the location of the Greater Fifth Ward example site (Figure 5) is recommended for “[expansion of] opportunities to sell and purchase goods and services.”40 Such developments could complement the existing transit center and any future charging stations by bringing more people to the area and increasing transit ridership, electric ride-hailing demand, and charging infrastructure usage.
A request for proposals (RFP) issued by the City of Sacramento provides an example for cities like Houston that are exploring opening city-owned properties for companies to deploy charging. Sacramento issued an RFP for operators to install, own, and operate chargers at no cost to the city in potential right of ways identified by the city.41 The no-cost RFP allowed Sacramento to identify a vendor that did not rely on public investment and could demonstrate a business case for public charging. Cities could provide additional incentives for charging infrastructure operators by issuing RFPs with compensation in the form of grants, reduced taxes, or streamlined permitting. To steer equitable and accessible infrastructure deployment, cities could apply equity metrics
39 City of Houston, “Economic Development: Programs - Tax Increment Reinvestment Zones (TIRZ).”40 Zakcq Lockrem et al., “Fifth Ward/ Buffalo Bayou/ East End Livable Centers” (Asakura Robinson, July 2015),
https://www.h-gac.com/livable-centers/planning-studies/fifth-ward-buffalo-bayou-east-end.41 City of Sacramento, “Curbside Charging,” (accessed October 1, 2021), http://www.cityofsacramento.org/
Public-Works/Electric-Vehicle-Initiatives/Curbside-Charging.
17 ICCT WORKING PAPER 2021-36 | ELECTRIC RIDE-HAILING CHARGING INFRASTRUCTURE
upon evaluating proposals, require a share of chargers be deployed in underserved areas, or limit the city-owned properties available to vendors to pre-selected sites. Non-profit organization Forth provides a template to support cities in developing RFPs for vendors to install, own, and operate electric vehicle charging on city properties.42 These frameworks, combined with the findings in this report and community consultation, can lead to increased charging infrastructure deployment and expanded electric mobility equity and access for ride-hail drivers and the general public alike.
Best practices of equitable mobility investmentsMobility projects can have major impacts on the daily lives of the residents in the local communities; special and careful attention is needed in the designing and planning of projects to deliver equitable outcomes. This section discusses the emerging best practices for electric ride-hailing and infrastructure programs to deliver equitable outcomes, inspired by the Greenlining Institute’s Clean Mobility Equity report for equitable mobility investments.43
It is critical that mobility programs are explicitly designed with the priority communities in mind. Community involvement in decision-making with veto power at every stage is key, and infrastructure deployment needs to align with each unique community’s vision and plan.44 To maximize effectiveness and engagement, infrastructure planning can build on previous collaborative community planning efforts like Houston’s Fifth Ward/Buffalo Bayou/East End Livable Centers plan,45 the Tax Increment Reinvestment Zone plans,46 and the Complete Communities Initiative.47
Intentional engagement and infrastructure deployment in lower-income neighborhoods and communities of color where infrastructure is lacking is needed to expand access. Equity-focused programs would ideally be as simplified and streamlined as possible, and it is critical that infrastructure deployment be accompanied by community outreach and awareness.48 Greater charging access in these areas aids electric vehicle adoption, increases the electric ride-hailing availability, and brings new investments to the area. Intentionally bridging the charger access gap minimizes the likelihood of the areas being disproportionately served by internal combustion engine ride-hailing vehicles as the ride-hailing fleet electrifies.
Multi-sector approaches can be leveraged to progress municipal goals of equity and access, reduced traffic congestion, and electric vehicles. Partnerships among cities, transit agencies, and ride-hailing companies can identify opportunities for shared electric ride-hailing to serve as first-last mile connectors and fill mobility gaps in transit deserts. For example, transit agencies could consider repurposing a small share of carpool parking spaces for ride-hailing DC fast charging and incentivize trips that serve
42 Erin Galiger, “EV Charging and Public/Private Partnerships: RFP Template” (Forth, January 2021), https://forthmobility.org/storage/app/media/Reports/RFP%20Template%20EVSE%20In%20Cities_FINAL_20210119.pdf.
43 The Greenlining Institute, “Clean Mobility Equity: A Playbook,” (2021), https://greenlining.org/wp-content/uploads/2021/03/Clean-Mobility-Equity-A-Playbook-Greenlining-Report-2021.pdf.
44 For an example shared mobility outreach and engagement effort in Oakland, California, see Brytanee Brown, “OakMob 101: A Case Study in Expanding Access to Shared Mobility” (TransForm, 2017), https://www.transformca.org/transform-report/oakmob-101-case-study-expanding-access-shared-mobility.
45 Zakcq Lockrem et al., “Fifth Ward/ Buffalo Bayou/ East End Livable Centers.”46 City of Houston, “Economic Development: Programs - Tax Increment Reinvestment Zones (TIRZ).”47 City of Houston, “Houston Complete Communities Initiative,” (accessed October 1, 2021), http://www.
houstontx.gov/completecommunities/.48 ZEV Alliance, “Expanding zero-emission mobility equity and access,” (2019), http://www.zevalliance.org/
expanding-zev-access/
18 ICCT WORKING PAPER 2021-36 | ELECTRIC RIDE-HAILING CHARGING INFRASTRUCTURE
as first-last mile transit connectors. Doing so can facilitate replacing private vehicle trips to and from the transit center with shared electric ride-hailing. Programs that incentivize first-last mile ride-hailing trips include the partnership between Via and Los Angeles Metro and the Pinellas Suncoast Transit Authority’s “Direct Connect.”49
To address the existing barriers faced by marginalized communities and deliver intentional benefits, cities can designate and ensure a portion of the economic benefits from issuing public land for DC fast charging are directly captured by underserved groups. Such benefits could be delivered in the form of free electricity at neighborhood chargers, discounted ride-hailing trips that serve as first-last mile transit connectors, or clean mobility vouchers. In addition to local fast charging, investing in alternative residential style Level 2 public chargers that are conveniently located for ride-hailing drivers can maximize electric vehicles’ economic benefits while simultaneously reducing overall fast charging demand. More broadly, requiring the development of community-driven anti-displacement strategies can help avoid unintended consequences of directly investing in underserved communities.50
ConclusionsThis working paper assesses the number of ride-hailing DC fast chargers needed in Houston to support a growing electric ride-hailing fleet from 2021 through 2030, identifying priority sites to expand infrastructure equity and access with a focus on city-owned properties. The analysis leads to the following conclusions.
Electrifying Houston’s ride-hailing fleet requires considerable DC fast charging deployment. This analysis finds that 322 DC fast chargers will be needed in Houston to support the transition of 72,000 ride-hailing vehicles to electric by 2030. To electrify half the ride-hailing fleet by 2025, 218 DC fast chargers are needed. These fast chargers serve a combination of demands in areas across the city with high ride-hailing activity as well as near ride-hailing driver residences. Areas with the greatest charging needs are the IAH / Airport Area, Alief, and Sharpstown. Areas with the greatest DC fast charger density needs include Gulfton, Midwest, Westwood, Museum Park, and Greater Greenspoint. The analysis assumes that 43% of ride-hail drivers have access to residential overnight charging; lesser or greater deployment of home and near-home Level 2 public chargers would require more or fewer DC fast public chargers, respectively.
Many of Houston’s city-owned properties are suitable locations for DC fast charging. Houston has around 5,400 city-owned properties and parcels across the city, and many of them are within the highest priority areas for DC fast charging identified in this report. Based on the infrastructure location prioritization analysis, the three city-owned sample sites in Greater Greenspoint near the Greenspoint Mall, in Greater Fifth Ward on the Metro parking lot near Fifth Ward / Denver Harbor transit center, and in Mid West near the Hillcroft Park and Ride appear to be exemplary locations for fast charging to serve ride-hail drivers and the general public. These locations have high visibility from the road, ease of access for drivers, and potential synergies with existing buildings or services on and near the sites. Overall, about 16% of Houston’s city-owned properties are in locations that scored in the top 10 percentile for infrastructure siting prioritization.
49 See for example, Los Angeles Metropolitan Transportation Authority, “Ride with Via,”(accessed October 1, 2021), https://www.metro.net/projects/mod/ and Pinellas Suncoast Transit Authority, “Catch a ride. Before you ride.” (accessed October 1, 2021), https://www.psta.net/riding-psta/direct-connect/
50 The Greenlining institute, “Clean Mobility Equity: A Playbook”
19 ICCT WORKING PAPER 2021-36 | ELECTRIC RIDE-HAILING CHARGING INFRASTRUCTURE
The city can build on the priority location findings outlined in this paper to conduct more thorough surveys of city-owned properties to identify additional sites suitable for DC fast charging deployment and issue no-cost request for proposals for companies to install, own, and operate public chargers on public land.
The distribution of DC fast charging is important to equitable and inclusive e-mobility access. The ride-hail charging infrastructure prioritization analysis reveals opportunities for more equitable and inclusive deployment of infrastructure by allocating half of the weighting to equity-focused inputs. The highest priority Super Neighborhoods are Greater Fifth Ward and Near Northside in Eastern Houston. More granular analysis reveals localized clusters of high priority areas within Super Neighborhoods, such as the area where Mid West, Sharpstown, and Gulfton intersect. The high-priority areas identified in this report correspond with the areas identified as ripe for greater investment in other city equity-focused transportation and planning analyses. Leveraging the best practices in equitable mobility investments can ensure that infrastructure planning efforts strike a balance between ride-hailing needs and equity goals, and can help cities identify preferential and preapproved charging locations in priority communities.
Analyses like these are important to guide ride-hailing infrastructure planning in Houston and other cities, and the findings outlined here are broadly applicable to many stakeholders. As electric vehicle and ride-hailing markets continue to evolve, infrastructure strategies can be reexamined and adjusted based on underlying trends. Electric vehicle and infrastructure planning would benefit from a holistic mobility view which considers broader transportation modes and behaviors, multi-stakeholder engagement for infrastructure siting, and new policy actions. While this analysis was primarily focused on infrastructure development at city-owned properties, cities have many tools to remove and reduce charging deployment barriers. To complement city solicitations through infrastructure request for proposals, initiatives such as electric vehicle-ready building codes, permitting, zoning, and priority access can spur and steer private investment. Continued monitoring and tracking of electric vehicle and infrastructure developments could help reveal key gaps for the public sector to help fill.
20 ICCT WORKING PAPER 2021-36 | ELECTRIC RIDE-HAILING CHARGING INFRASTRUCTURE
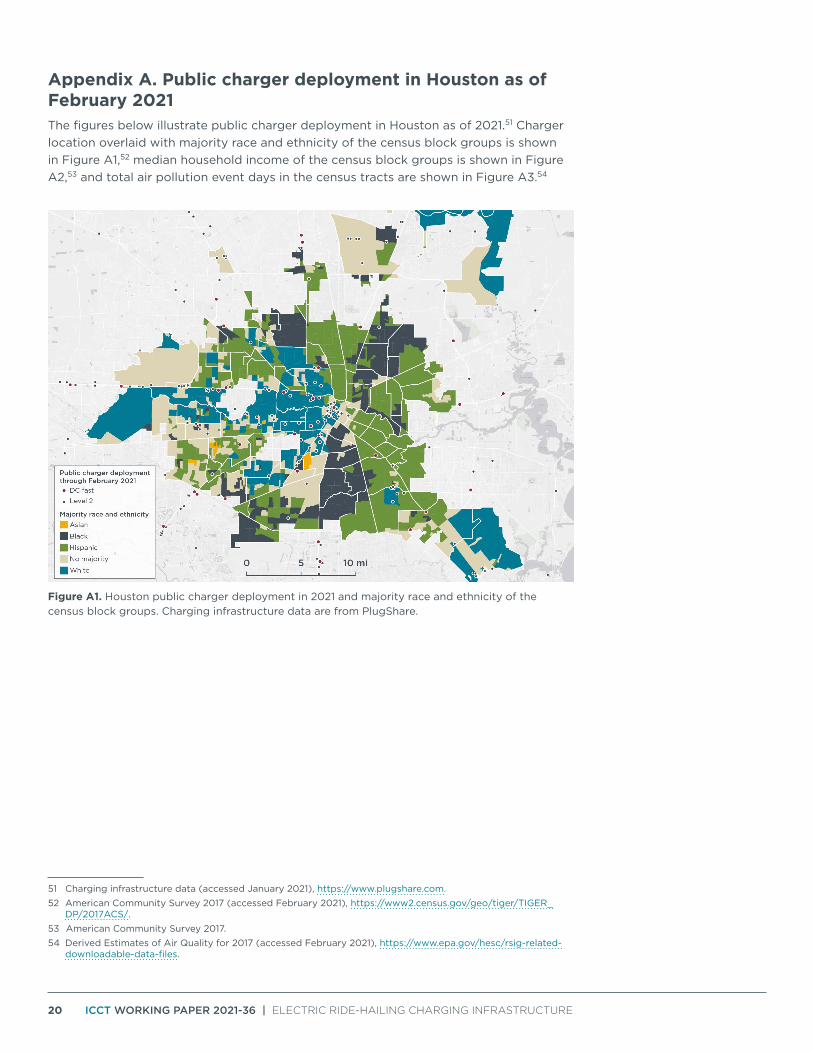
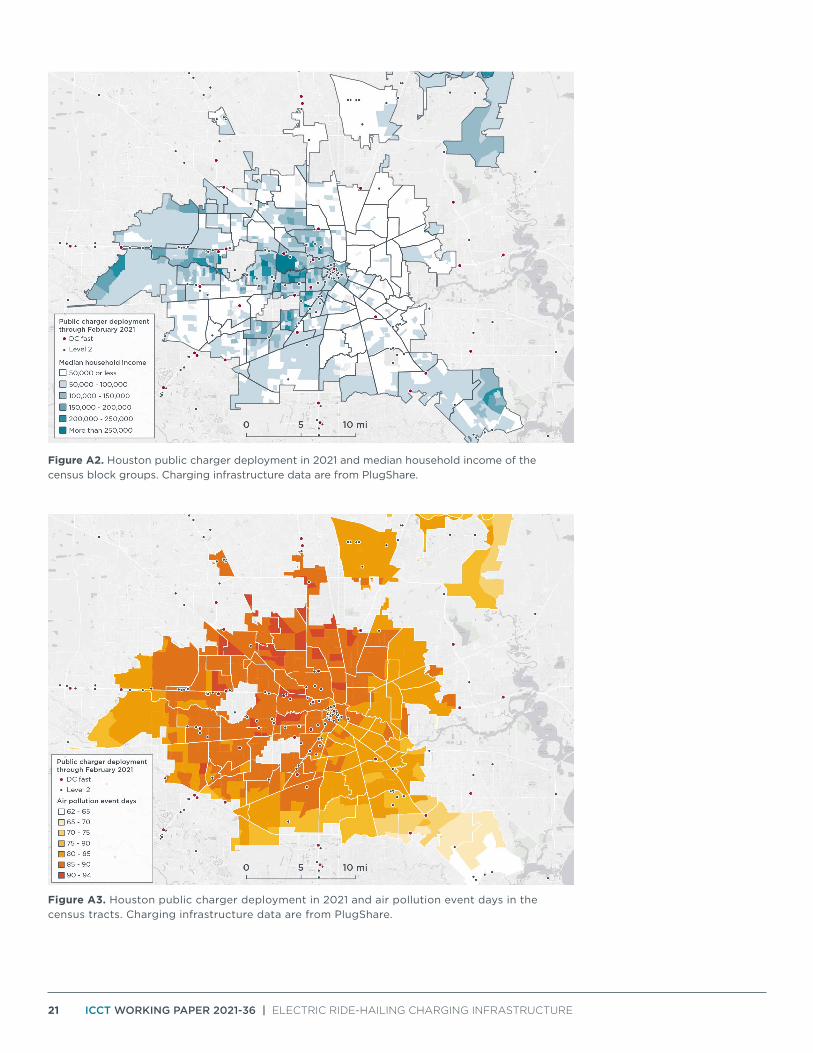
Appendix A. Public charger deployment in Houston as of February 2021The figures below illustrate public charger deployment in Houston as of 2021.51 Charger location overlaid with majority race and ethnicity of the census block groups is shown in Figure A1,52 median household income of the census block groups is shown in Figure A2,53 and total air pollution event days in the census tracts are shown in Figure A3.54
Figure A1. Houston public charger deployment in 2021 and majority race and ethnicity of the census block groups. Charging infrastructure data are from PlugShare.
51 Charging infrastructure data (accessed January 2021), https://www.plugshare.com.52 American Community Survey 2017 (accessed February 2021), https://www2.census.gov/geo/tiger/TIGER_
DP/2017ACS/.53 American Community Survey 2017.54 Derived Estimates of Air Quality for 2017 (accessed February 2021), https://www.epa.gov/hesc/rsig-related-
downloadable-data-files.
21 ICCT WORKING PAPER 2021-36 | ELECTRIC RIDE-HAILING CHARGING INFRASTRUCTURE
Figure A2. Houston public charger deployment in 2021 and median household income of the census block groups. Charging infrastructure data are from PlugShare.
Figure A3. Houston public charger deployment in 2021 and air pollution event days in the census tracts. Charging infrastructure data are from PlugShare.
22 ICCT WORKING PAPER 2021-36 | ELECTRIC RIDE-HAILING CHARGING INFRASTRUCTURE
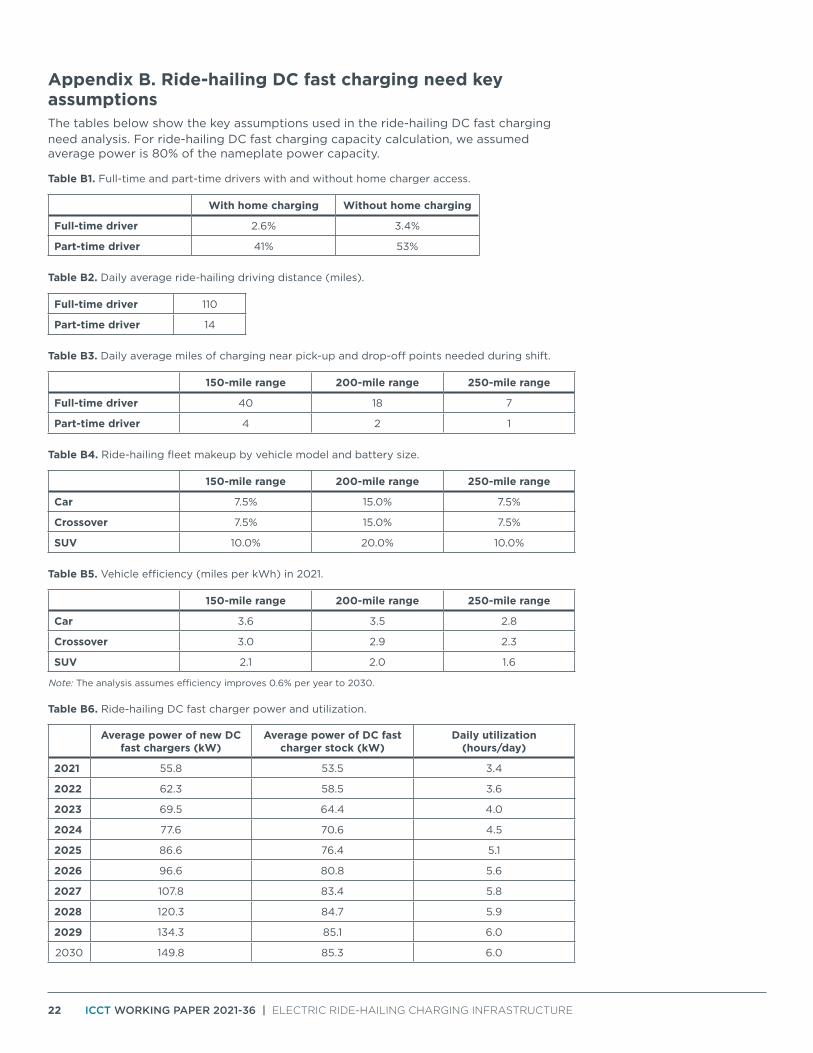
Appendix B. Ride-hailing DC fast charging need key assumptionsThe tables below show the key assumptions used in the ride-hailing DC fast charging need analysis. For ride-hailing DC fast charging capacity calculation, we assumed average power is 80% of the nameplate power capacity.
Table B1. Full-time and part-time drivers with and without home charger access.
With home charging Without home charging
Full-time driver 2.6% 3.4%
Part-time driver 41% 53%
Table B2. Daily average ride-hailing driving distance (miles).
Full-time driver 110
Part-time driver 14
Table B3. Daily average miles of charging near pick-up and drop-off points needed during shift.
150-mile range 200-mile range 250-mile range
Full-time driver 40 18 7
Part-time driver 4 2 1
Table B4. Ride-hailing fleet makeup by vehicle model and battery size.
150-mile range 200-mile range 250-mile range
Car 7.5% 15.0% 7.5%
Crossover 7.5% 15.0% 7.5%
SUV 10.0% 20.0% 10.0%
Table B5. Vehicle efficiency (miles per kWh) in 2021.
150-mile range 200-mile range 250-mile range
Car 3.6 3.5 2.8
Crossover 3.0 2.9 2.3
SUV 2.1 2.0 1.6
Note: The analysis assumes efficiency improves 0.6% per year to 2030.
Table B6. Ride-hailing DC fast charger power and utilization.
Average power of new DC fast chargers (kW)
Average power of DC fast charger stock (kW)
Daily utilization (hours/day)
2021 55.8 53.5 3.4
2022 62.3 58.5 3.6
2023 69.5 64.4 4.0
2024 77.6 70.6 4.5
2025 86.6 76.4 5.1
2026 96.6 80.8 5.6
2027 107.8 83.4 5.8
2028 120.3 84.7 5.9
2029 134.3 85.1 6.0
2030 149.8 85.3 6.0
23 ICCT WORKING PAPER 2021-36 | ELECTRIC RIDE-HAILING CHARGING INFRASTRUCTURE
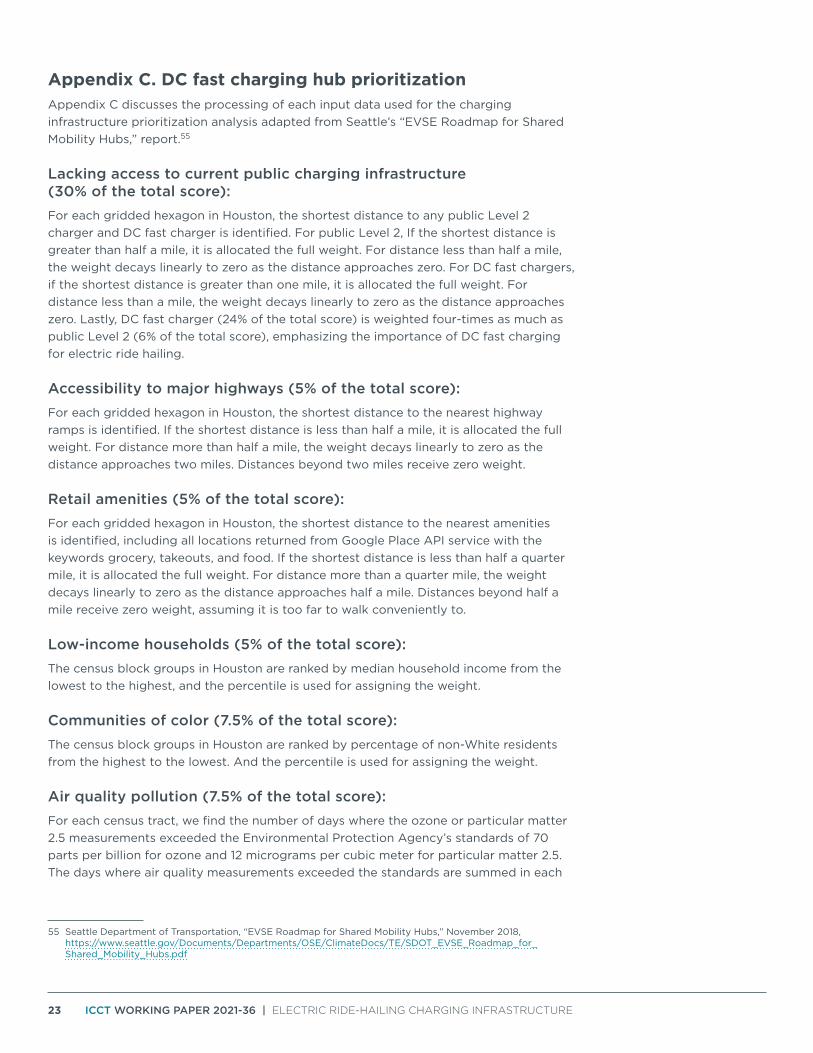
Appendix C. DC fast charging hub prioritizationAppendix C discusses the processing of each input data used for the charging infrastructure prioritization analysis adapted from Seattle’s “EVSE Roadmap for Shared Mobility Hubs,” report.55
Lacking access to current public charging infrastructure (30% of the total score): For each gridded hexagon in Houston, the shortest distance to any public Level 2 charger and DC fast charger is identified. For public Level 2, If the shortest distance is greater than half a mile, it is allocated the full weight. For distance less than half a mile, the weight decays linearly to zero as the distance approaches zero. For DC fast chargers, if the shortest distance is greater than one mile, it is allocated the full weight. For distance less than a mile, the weight decays linearly to zero as the distance approaches zero. Lastly, DC fast charger (24% of the total score) is weighted four-times as much as public Level 2 (6% of the total score), emphasizing the importance of DC fast charging for electric ride hailing.
Accessibility to major highways (5% of the total score):For each gridded hexagon in Houston, the shortest distance to the nearest highway ramps is identified. If the shortest distance is less than half a mile, it is allocated the full weight. For distance more than half a mile, the weight decays linearly to zero as the distance approaches two miles. Distances beyond two miles receive zero weight.
Retail amenities (5% of the total score):For each gridded hexagon in Houston, the shortest distance to the nearest amenities is identified, including all locations returned from Google Place API service with the keywords grocery, takeouts, and food. If the shortest distance is less than half a quarter mile, it is allocated the full weight. For distance more than a quarter mile, the weight decays linearly to zero as the distance approaches half a mile. Distances beyond half a mile receive zero weight, assuming it is too far to walk conveniently to.
Low-income households (5% of the total score):The census block groups in Houston are ranked by median household income from the lowest to the highest, and the percentile is used for assigning the weight.
Communities of color (7.5% of the total score):The census block groups in Houston are ranked by percentage of non-White residents from the highest to the lowest. And the percentile is used for assigning the weight.
Air quality pollution (7.5% of the total score):For each census tract, we find the number of days where the ozone or particular matter 2.5 measurements exceeded the Environmental Protection Agency’s standards of 70 parts per billion for ozone and 12 micrograms per cubic meter for particular matter 2.5. The days where air quality measurements exceeded the standards are summed in each
55 Seattle Department of Transportation, “EVSE Roadmap for Shared Mobility Hubs,” November 2018, https://www.seattle.gov/Documents/Departments/OSE/ClimateDocs/TE/SDOT_EVSE_Roadmap_for_Shared_Mobility_Hubs.pdf
24 ICCT WORKING PAPER 2021-36 | ELECTRIC RIDE-HAILING CHARGING INFRASTRUCTURE
census tract and ranked from the highest to the lowest, and the percentile is used for assigning the weight.
Projected ride-hailing demand (20% of the total score):The projected ride-hailing activity for each block group ranked from the highest to the lowest, and the percentile is used for assigning the weight.
Low-frequency transit access (15% of the total score):All transit stops with the average headway above third quantile are first identified. Then the shortest distance is found from each gridded hexagon in Houston to any of these longer headway stops. If the shortest distance is less than a quarter mile, it is allocated the full weight. For distance more than a quarter mile, the weight decays linearly to zero as the distance approaches 0.25 miles. Distances beyond 0.75 miles receive zero weight.
Zero-vehicle households (5% of the total score):The census block groups in Houston are ranked by percentage of households that do not own cars from the highest to the lowest. The percentile is used for assigning the weight.
25 ICCT WORKING PAPER 2021-36 | ELECTRIC RIDE-HAILING CHARGING INFRASTRUCTURE
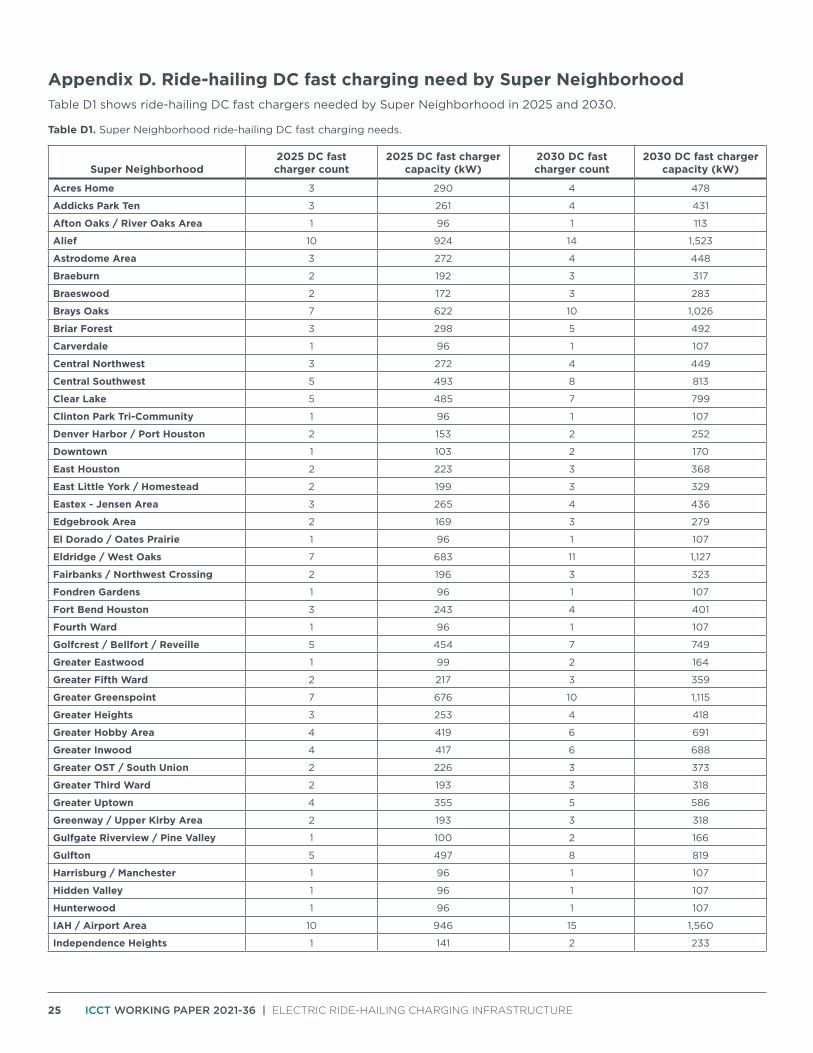
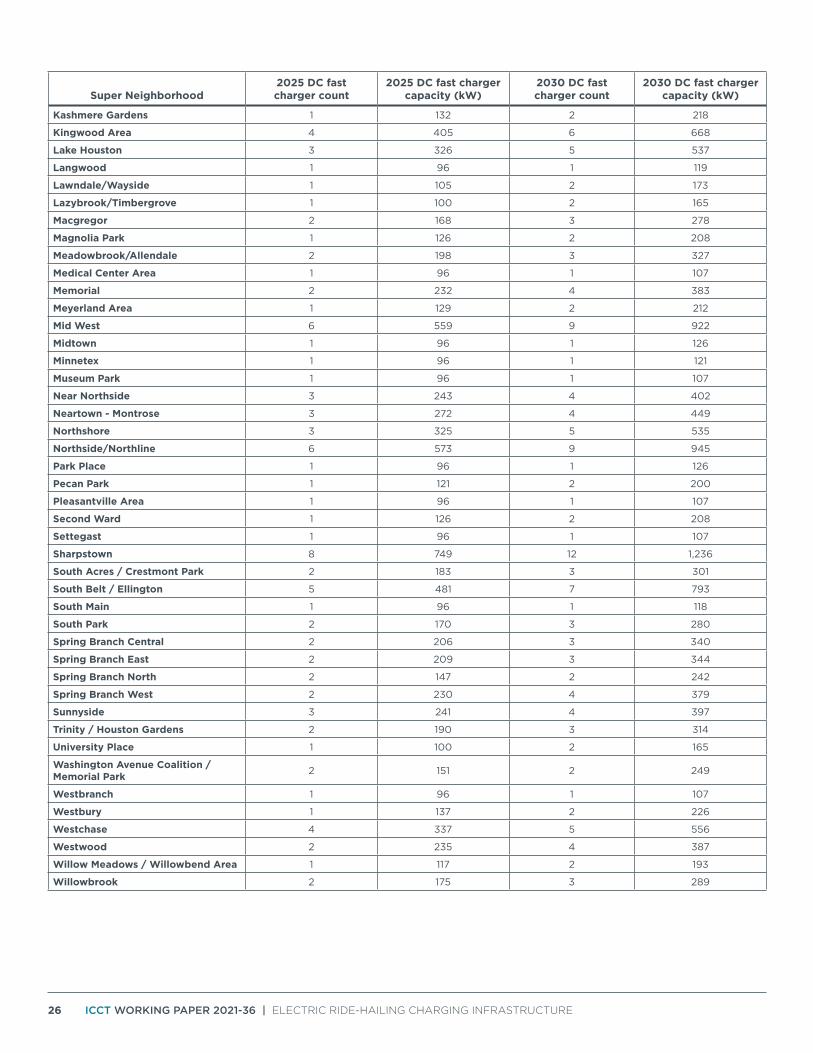
Appendix D. Ride-hailing DC fast charging need by Super NeighborhoodTable D1 shows ride-hailing DC fast chargers needed by Super Neighborhood in 2025 and 2030.
Table D1. Super Neighborhood ride-hailing DC fast charging needs.
Super Neighborhood2025 DC fast charger count
2025 DC fast charger capacity (kW)
2030 DC fast charger count
2030 DC fast charger capacity (kW)
Acres Home 3 290 4 478
Addicks Park Ten 3 261 4 431
Afton Oaks / River Oaks Area 1 96 1 113
Alief 10 924 14 1,523
Astrodome Area 3 272 4 448
Braeburn 2 192 3 317
Braeswood 2 172 3 283
Brays Oaks 7 622 10 1,026
Briar Forest 3 298 5 492
Carverdale 1 96 1 107
Central Northwest 3 272 4 449
Central Southwest 5 493 8 813
Clear Lake 5 485 7 799
Clinton Park Tri-Community 1 96 1 107
Denver Harbor / Port Houston 2 153 2 252
Downtown 1 103 2 170
East Houston 2 223 3 368
East Little York / Homestead 2 199 3 329
Eastex - Jensen Area 3 265 4 436
Edgebrook Area 2 169 3 279
El Dorado / Oates Prairie 1 96 1 107
Eldridge / West Oaks 7 683 11 1,127
Fairbanks / Northwest Crossing 2 196 3 323
Fondren Gardens 1 96 1 107
Fort Bend Houston 3 243 4 401
Fourth Ward 1 96 1 107
Golfcrest / Bellfort / Reveille 5 454 7 749
Greater Eastwood 1 99 2 164
Greater Fifth Ward 2 217 3 359
Greater Greenspoint 7 676 10 1,115
Greater Heights 3 253 4 418
Greater Hobby Area 4 419 6 691
Greater Inwood 4 417 6 688
Greater OST / South Union 2 226 3 373
Greater Third Ward 2 193 3 318
Greater Uptown 4 355 5 586
Greenway / Upper Kirby Area 2 193 3 318
Gulfgate Riverview / Pine Valley 1 100 2 166
Gulfton 5 497 8 819
Harrisburg / Manchester 1 96 1 107
Hidden Valley 1 96 1 107
Hunterwood 1 96 1 107
IAH / Airport Area 10 946 15 1,560
Independence Heights 1 141 2 233
26 ICCT WORKING PAPER 2021-36 | ELECTRIC RIDE-HAILING CHARGING INFRASTRUCTURE
Super Neighborhood2025 DC fast charger count
2025 DC fast charger capacity (kW)
2030 DC fast charger count
2030 DC fast charger capacity (kW)
Kashmere Gardens 1 132 2 218
Kingwood Area 4 405 6 668
Lake Houston 3 326 5 537
Langwood 1 96 1 119
Lawndale/Wayside 1 105 2 173
Lazybrook/Timbergrove 1 100 2 165
Macgregor 2 168 3 278
Magnolia Park 1 126 2 208
Meadowbrook/Allendale 2 198 3 327
Medical Center Area 1 96 1 107
Memorial 2 232 4 383
Meyerland Area 1 129 2 212
Mid West 6 559 9 922
Midtown 1 96 1 126
Minnetex 1 96 1 121
Museum Park 1 96 1 107
Near Northside 3 243 4 402
Neartown - Montrose 3 272 4 449
Northshore 3 325 5 535
Northside/Northline 6 573 9 945
Park Place 1 96 1 126
Pecan Park 1 121 2 200
Pleasantville Area 1 96 1 107
Second Ward 1 126 2 208
Settegast 1 96 1 107
Sharpstown 8 749 12 1,236
South Acres / Crestmont Park 2 183 3 301
South Belt / Ellington 5 481 7 793
South Main 1 96 1 118
South Park 2 170 3 280
Spring Branch Central 2 206 3 340
Spring Branch East 2 209 3 344
Spring Branch North 2 147 2 242
Spring Branch West 2 230 4 379
Sunnyside 3 241 4 397
Trinity / Houston Gardens 2 190 3 314
University Place 1 100 2 165
Washington Avenue Coalition / Memorial Park 2 151 2 249
Westbranch 1 96 1 107
Westbury 1 137 2 226
Westchase 4 337 5 556
Westwood 2 235 4 387
Willow Meadows / Willowbend Area 1 117 2 193
Willowbrook 2 175 3 289
27 ICCT WORKING PAPER 2021-36 | ELECTRIC RIDE-HAILING CHARGING INFRASTRUCTURE
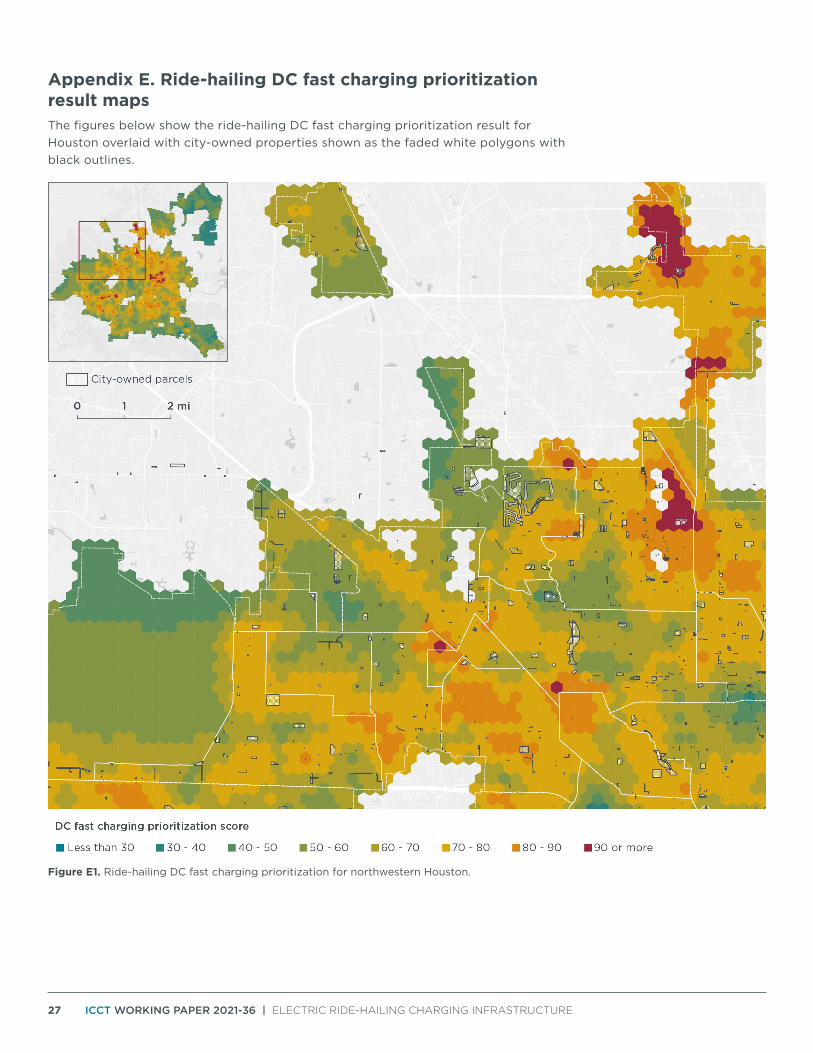
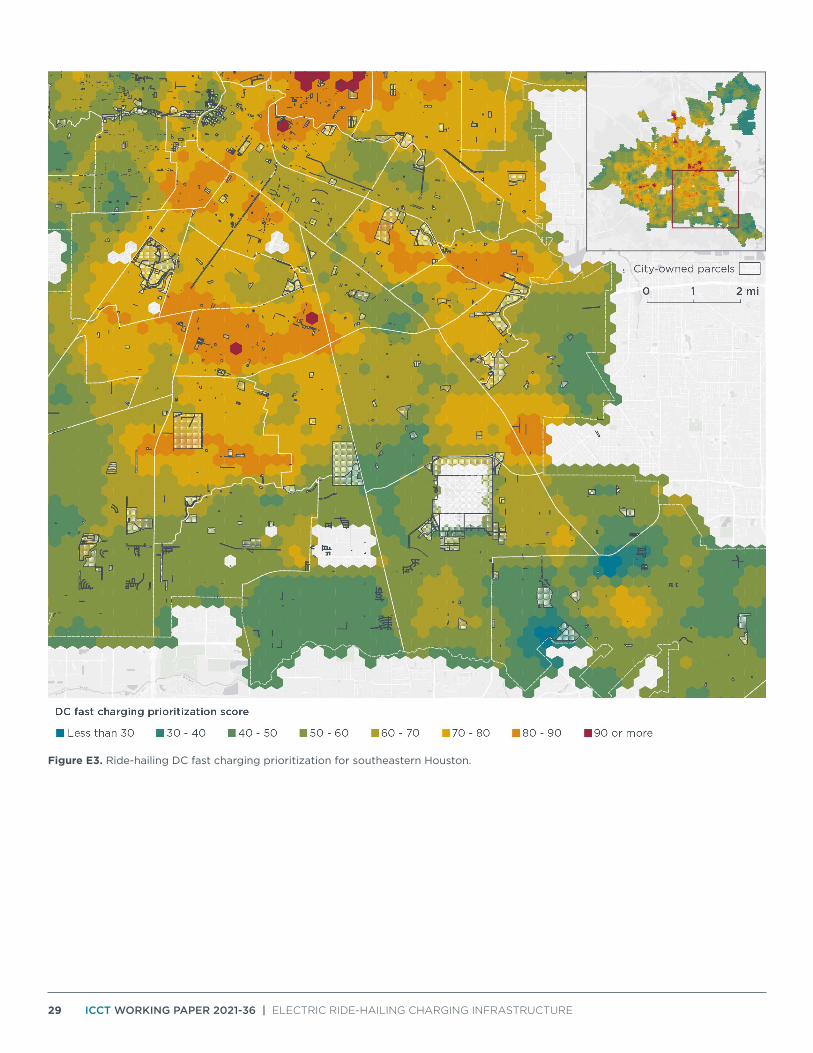
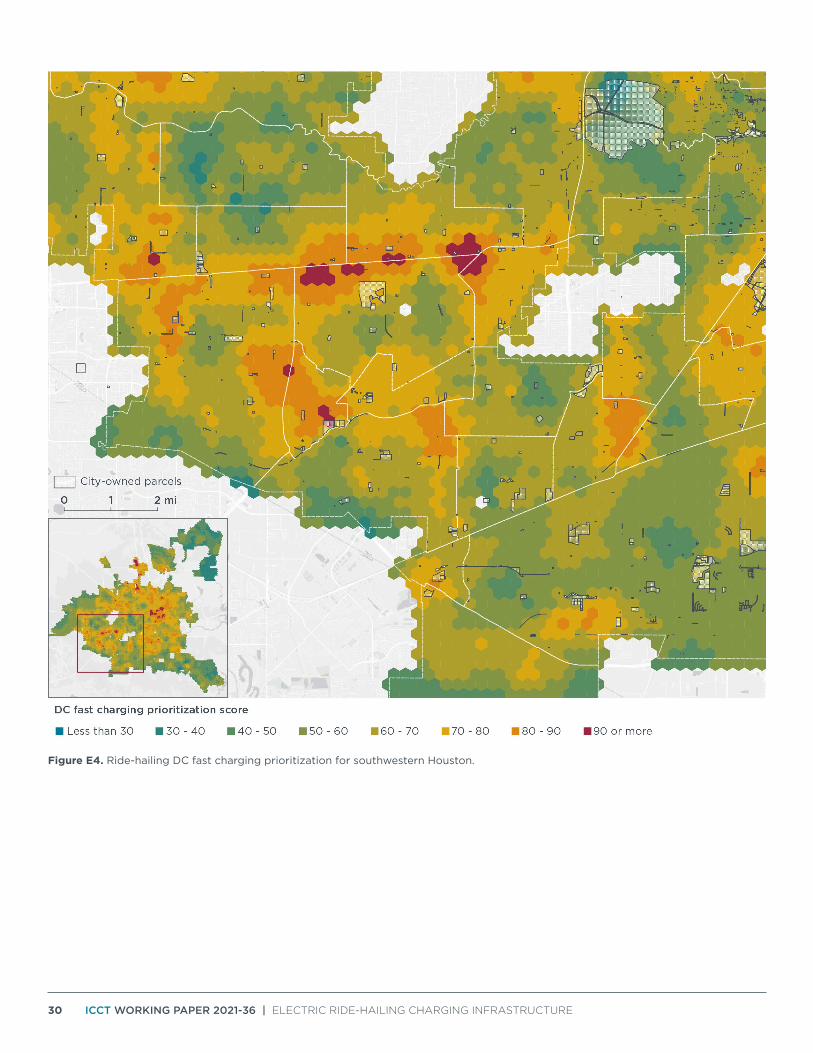
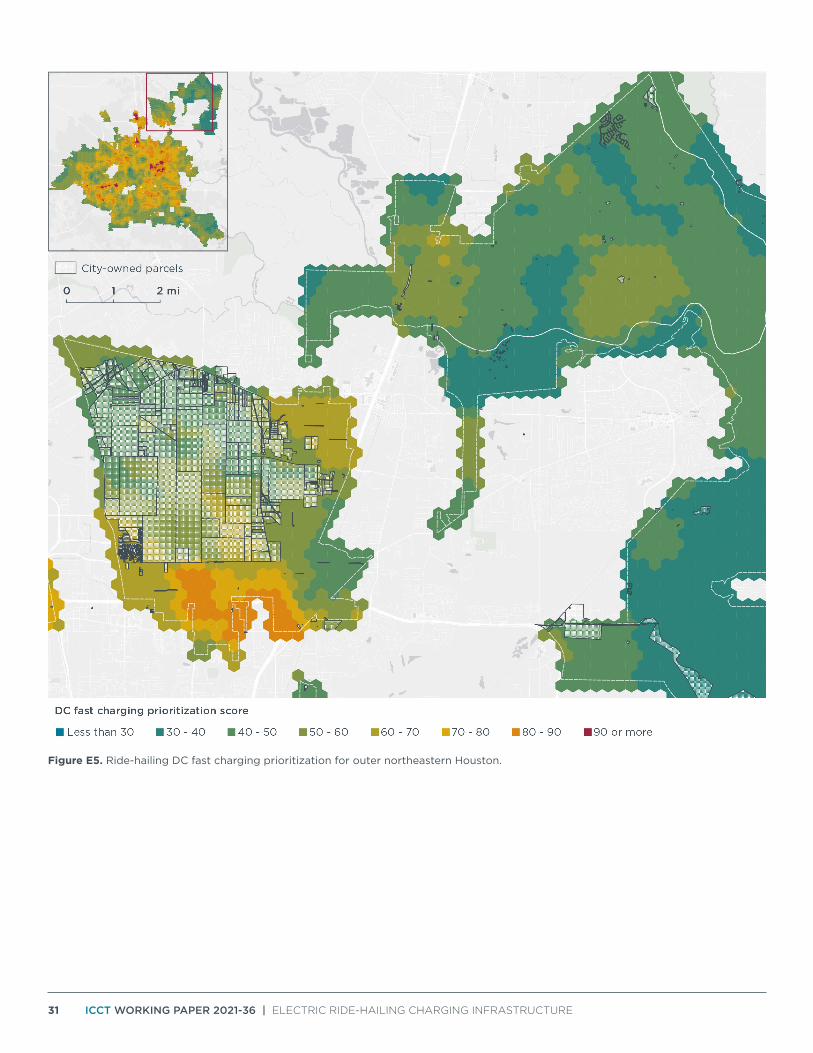
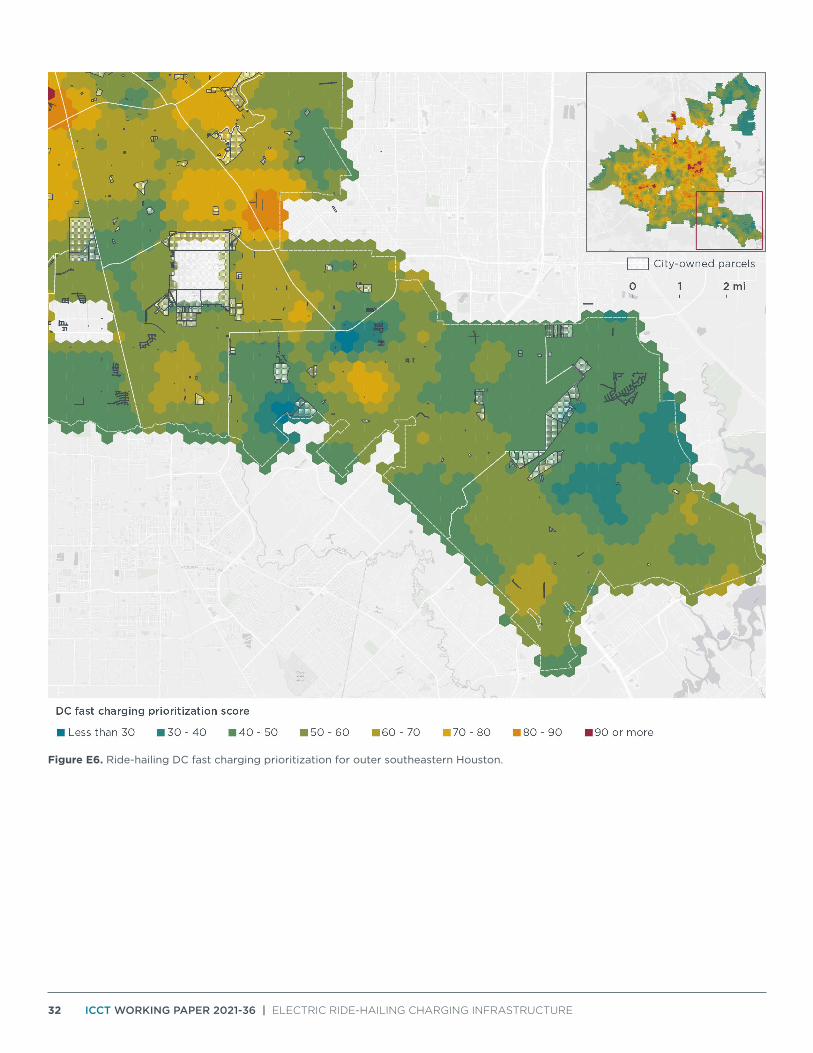
Appendix E. Ride-hailing DC fast charging prioritization result mapsThe figures below show the ride-hailing DC fast charging prioritization result for Houston overlaid with city-owned properties shown as the faded white polygons with black outlines.
Figure E1. Ride-hailing DC fast charging prioritization for northwestern Houston.
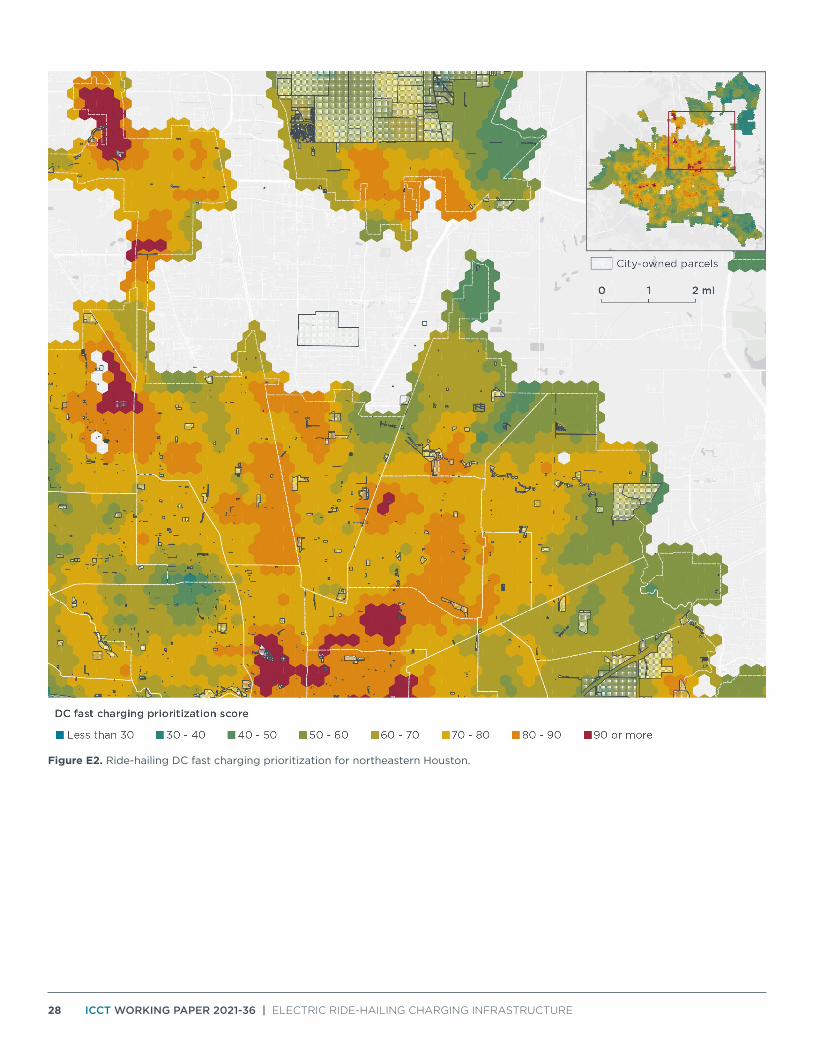
28 ICCT WORKING PAPER 2021-36 | ELECTRIC RIDE-HAILING CHARGING INFRASTRUCTURE
Figure E2. Ride-hailing DC fast charging prioritization for northeastern Houston.
29 ICCT WORKING PAPER 2021-36 | ELECTRIC RIDE-HAILING CHARGING INFRASTRUCTURE
Figure E3. Ride-hailing DC fast charging prioritization for southeastern Houston.
30 ICCT WORKING PAPER 2021-36 | ELECTRIC RIDE-HAILING CHARGING INFRASTRUCTURE
Figure E4. Ride-hailing DC fast charging prioritization for southwestern Houston.
31 ICCT WORKING PAPER 2021-36 | ELECTRIC RIDE-HAILING CHARGING INFRASTRUCTURE
Figure E5. Ride-hailing DC fast charging prioritization for outer northeastern Houston.
32 ICCT WORKING PAPER 2021-36 | ELECTRIC RIDE-HAILING CHARGING INFRASTRUCTURE
Figure E6. Ride-hailing DC fast charging prioritization for outer southeastern Houston.
33 ICCT WORKING PAPER 2021-36 | ELECTRIC RIDE-HAILING CHARGING INFRASTRUCTURE
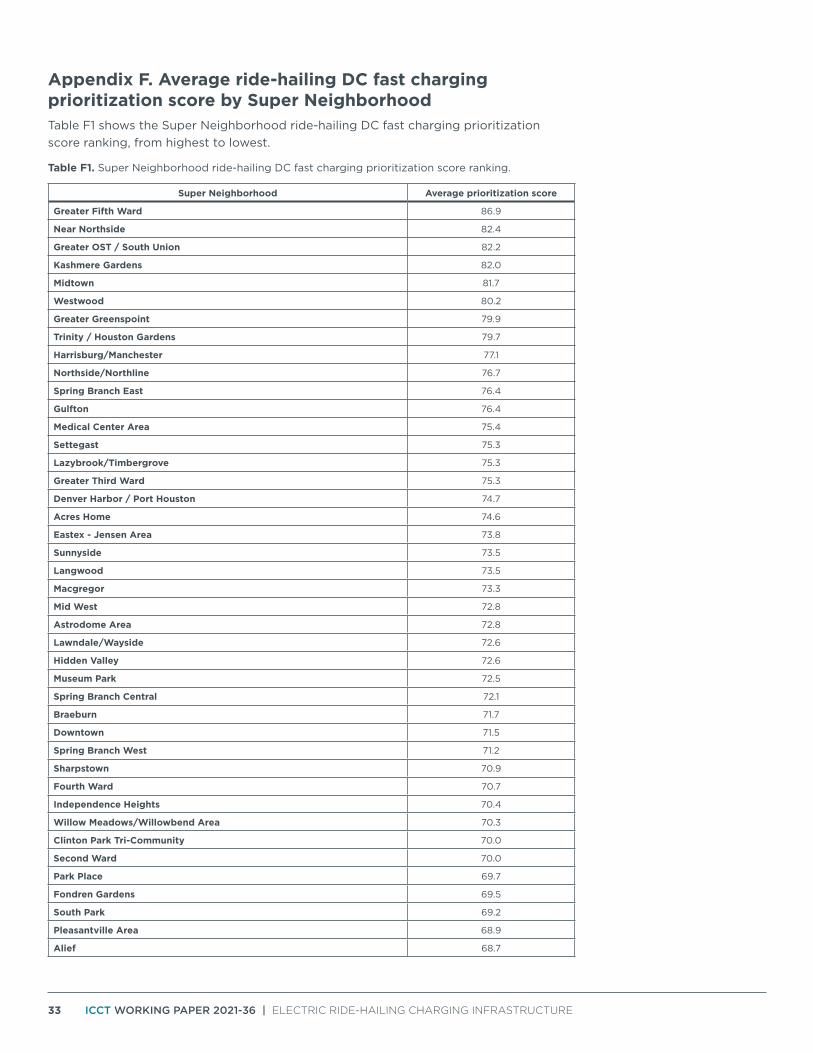
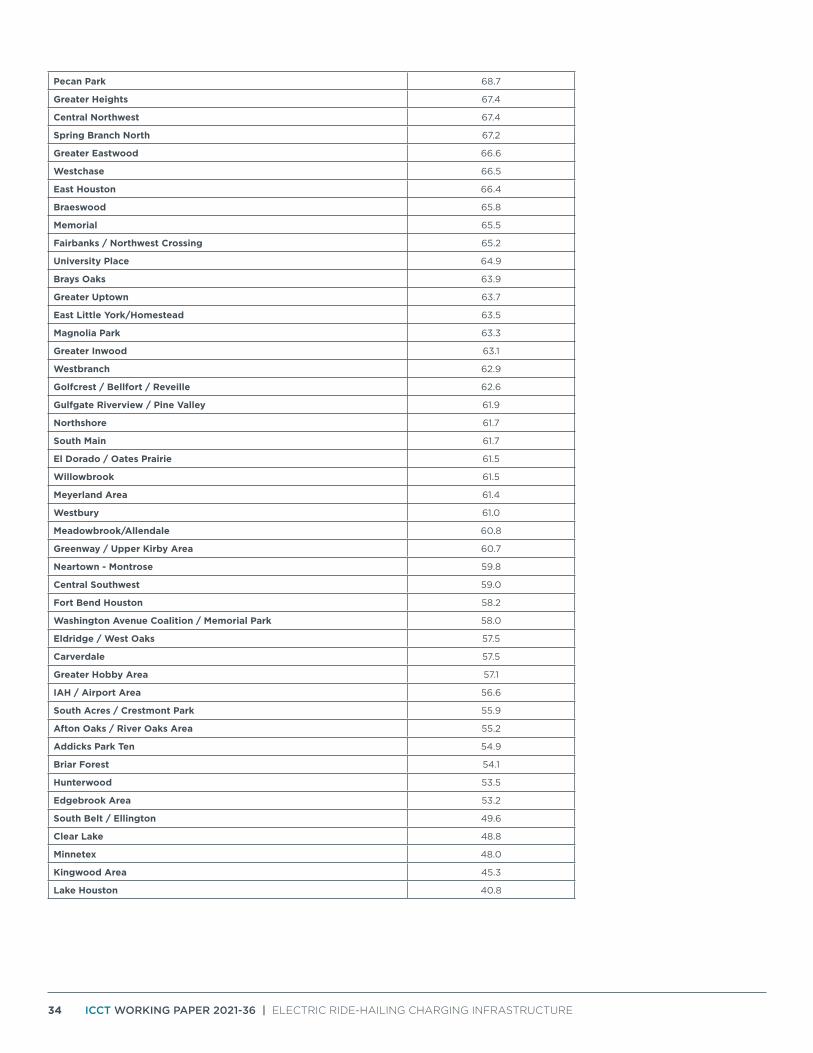
Appendix F. Average ride-hailing DC fast charging prioritization score by Super NeighborhoodTable F1 shows the Super Neighborhood ride-hailing DC fast charging prioritization score ranking, from highest to lowest.
Table F1. Super Neighborhood ride-hailing DC fast charging prioritization score ranking.
Super Neighborhood Average prioritization score
Greater Fifth Ward 86.9
Near Northside 82.4
Greater OST / South Union 82.2
Kashmere Gardens 82.0
Midtown 81.7
Westwood 80.2
Greater Greenspoint 79.9
Trinity / Houston Gardens 79.7
Harrisburg/Manchester 77.1
Northside/Northline 76.7
Spring Branch East 76.4
Gulfton 76.4
Medical Center Area 75.4
Settegast 75.3
Lazybrook/Timbergrove 75.3
Greater Third Ward 75.3
Denver Harbor / Port Houston 74.7
Acres Home 74.6
Eastex - Jensen Area 73.8
Sunnyside 73.5
Langwood 73.5
Macgregor 73.3
Mid West 72.8
Astrodome Area 72.8
Lawndale/Wayside 72.6
Hidden Valley 72.6
Museum Park 72.5
Spring Branch Central 72.1
Braeburn 71.7
Downtown 71.5
Spring Branch West 71.2
Sharpstown 70.9
Fourth Ward 70.7
Independence Heights 70.4
Willow Meadows/Willowbend Area 70.3
Clinton Park Tri-Community 70.0
Second Ward 70.0
Park Place 69.7
Fondren Gardens 69.5
South Park 69.2
Pleasantville Area 68.9
Alief 68.7
34 ICCT WORKING PAPER 2021-36 | ELECTRIC RIDE-HAILING CHARGING INFRASTRUCTURE
Pecan Park 68.7
Greater Heights 67.4
Central Northwest 67.4
Spring Branch North 67.2
Greater Eastwood 66.6
Westchase 66.5
East Houston 66.4
Braeswood 65.8
Memorial 65.5
Fairbanks / Northwest Crossing 65.2
University Place 64.9
Brays Oaks 63.9
Greater Uptown 63.7
East Little York/Homestead 63.5
Magnolia Park 63.3
Greater Inwood 63.1
Westbranch 62.9
Golfcrest / Bellfort / Reveille 62.6
Gulfgate Riverview / Pine Valley 61.9
Northshore 61.7
South Main 61.7
El Dorado / Oates Prairie 61.5
Willowbrook 61.5
Meyerland Area 61.4
Westbury 61.0
Meadowbrook/Allendale 60.8
Greenway / Upper Kirby Area 60.7
Neartown - Montrose 59.8
Central Southwest 59.0
Fort Bend Houston 58.2
Washington Avenue Coalition / Memorial Park 58.0
Eldridge / West Oaks 57.5
Carverdale 57.5
Greater Hobby Area 57.1
IAH / Airport Area 56.6
South Acres / Crestmont Park 55.9
Afton Oaks / River Oaks Area 55.2
Addicks Park Ten 54.9
Briar Forest 54.1
Hunterwood 53.5
Edgebrook Area 53.2
South Belt / Ellington 49.6
Clear Lake 48.8
Minnetex 48.0
Kingwood Area 45.3
Lake Houston 40.8