Embed Size (px)
Citation preview
Ei
Ba
b
a
ARRA
KLGLSLL
1
(avdTattict
iili
d(
h0
Electric Power Systems Research 119 (2015) 439–446
Contents lists available at ScienceDirect
Electric Power Systems Research
j o ur na l ho mepage: www.elsev ier .com/ locate /epsr
stimation of load capacitance and stray inductance in lightningmpulse voltage test circuits
ozidar Filipovic-Grcic a,∗, Dalibor Filipovic-Grcic b, Petar Gabric b
Faculty of Electrical Engineering and Computing, University of Zagreb, 10000 Zagreb, CroatiaKoncar Electrical Engineering Institute, 10000 Zagreb, Croatia
r t i c l e i n f o
rticle history:eceived 22 May 2014eceived in revised form 14 October 2014ccepted 1 November 2014
eywords:ightning impulse voltage testingenetic algorithms
a b s t r a c t
In order to obtain the lightning impulse voltage waveshape regarding front time, time to half and relativeovershoot magnitude within the limits prescribed by IEC 60060-1, it is useful to accurately estimate thetest circuit parameters, e.g. load capacitance and circuit inductance. A stray inductance consists of theinductance of impulse generator and the inductance of connecting leads. Load capacitance consists ofvoltage divider capacitance, test object and parasitic capacitances. In practice, the test object capacitanceis often unknown. Capacitance measurement takes time and makes testing procedure more complex.Also, it is very difficult to estimate parasitic capacitances although their influence can sometimes be
oad capacitancetray inductanceightning impulse generatoraplace transform
significant.This paper presents a new genetic algorithm (GA) based method for fast and accurate estimation of
load capacitance and circuit inductance during lightning impulse voltage testing of a capacitive load.Computational and experimental verification of the method is successfully performed for standard andnon-standard lightning impulse waveforms with various relative overshoot magnitudes.
© 2014 Elsevier B.V. All rights reserved.
. Introduction
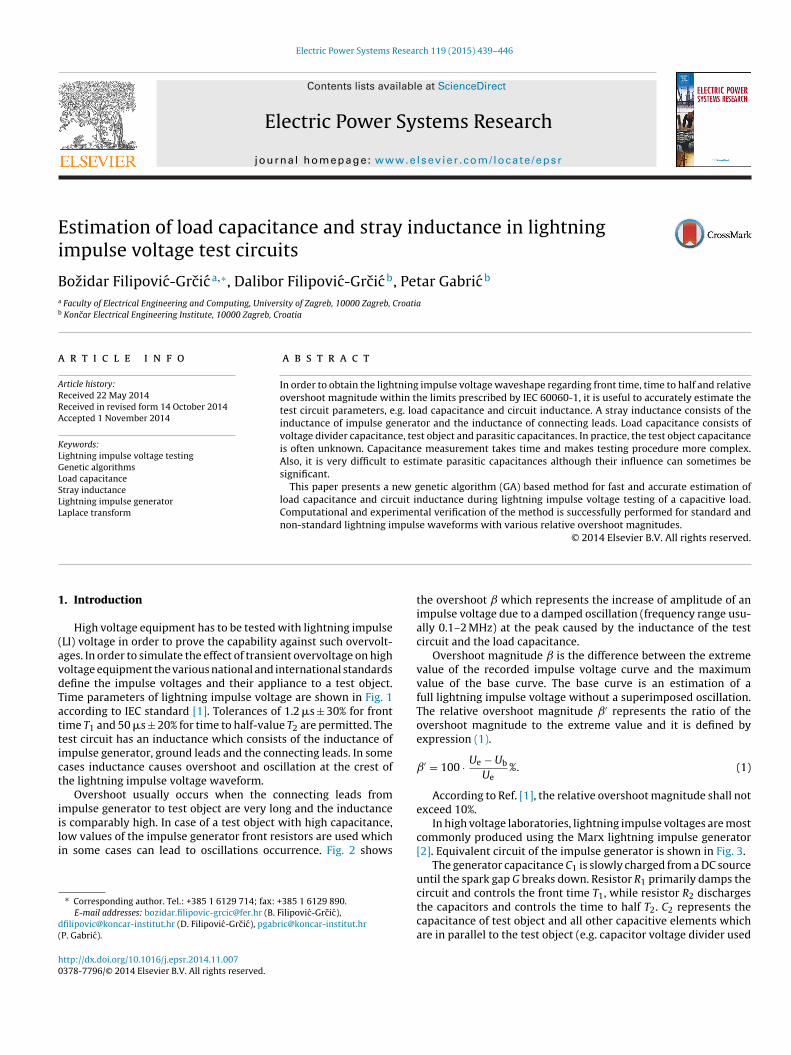
High voltage equipment has to be tested with lightning impulseLI) voltage in order to prove the capability against such overvolt-ges. In order to simulate the effect of transient overvoltage on higholtage equipment the various national and international standardsefine the impulse voltages and their appliance to a test object.ime parameters of lightning impulse voltage are shown in Fig. 1ccording to IEC standard [1]. Tolerances of 1.2 �s ± 30% for frontime T1 and 50 �s ± 20% for time to half-value T2 are permitted. Theest circuit has an inductance which consists of the inductance ofmpulse generator, ground leads and the connecting leads. In someases inductance causes overshoot and oscillation at the crest ofhe lightning impulse voltage waveform.
Overshoot usually occurs when the connecting leads frommpulse generator to test object are very long and the inductance
s comparably high. In case of a test object with high capacitance,ow values of the impulse generator front resistors are used whichn some cases can lead to oscillations occurrence. Fig. 2 shows∗ Corresponding author. Tel.: +385 1 6129 714; fax: +385 1 6129 890.E-mail addresses: [email protected] (B. Filipovic-Grcic),
[email protected] (D. Filipovic-Grcic), [email protected]. Gabric).
ttp://dx.doi.org/10.1016/j.epsr.2014.11.007378-7796/© 2014 Elsevier B.V. All rights reserved.
the overshoot which represents the increase of amplitude of animpulse voltage due to a damped oscillation (frequency range usu-ally 0.1–2 MHz) at the peak caused by the inductance of the testcircuit and the load capacitance.
Overshoot magnitude is the difference between the extremevalue of the recorded impulse voltage curve and the maximumvalue of the base curve. The base curve is an estimation of afull lightning impulse voltage without a superimposed oscillation.The relative overshoot magnitude ˇ′ represents the ratio of theovershoot magnitude to the extreme value and it is defined byexpression (1).
ˇ′ = 100 · Ue − Ub
Ue%. (1)
According to Ref. [1], the relative overshoot magnitude shall notexceed 10%.
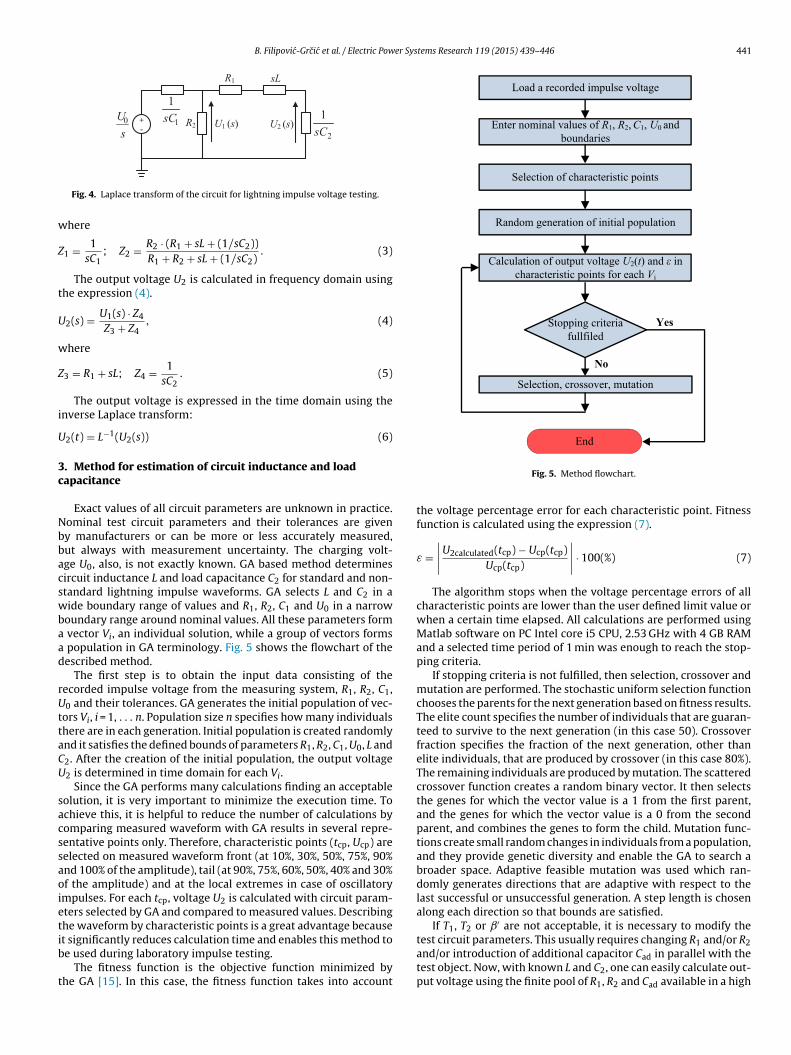
In high voltage laboratories, lightning impulse voltages are mostcommonly produced using the Marx lightning impulse generator[2]. Equivalent circuit of the impulse generator is shown in Fig. 3.
The generator capacitance C1 is slowly charged from a DC sourceuntil the spark gap G breaks down. Resistor R1 primarily damps the
circuit and controls the front time T1, while resistor R2 dischargesthe capacitors and controls the time to half T2. C2 represents thecapacitance of test object and all other capacitive elements whichare in parallel to the test object (e.g. capacitor voltage divider used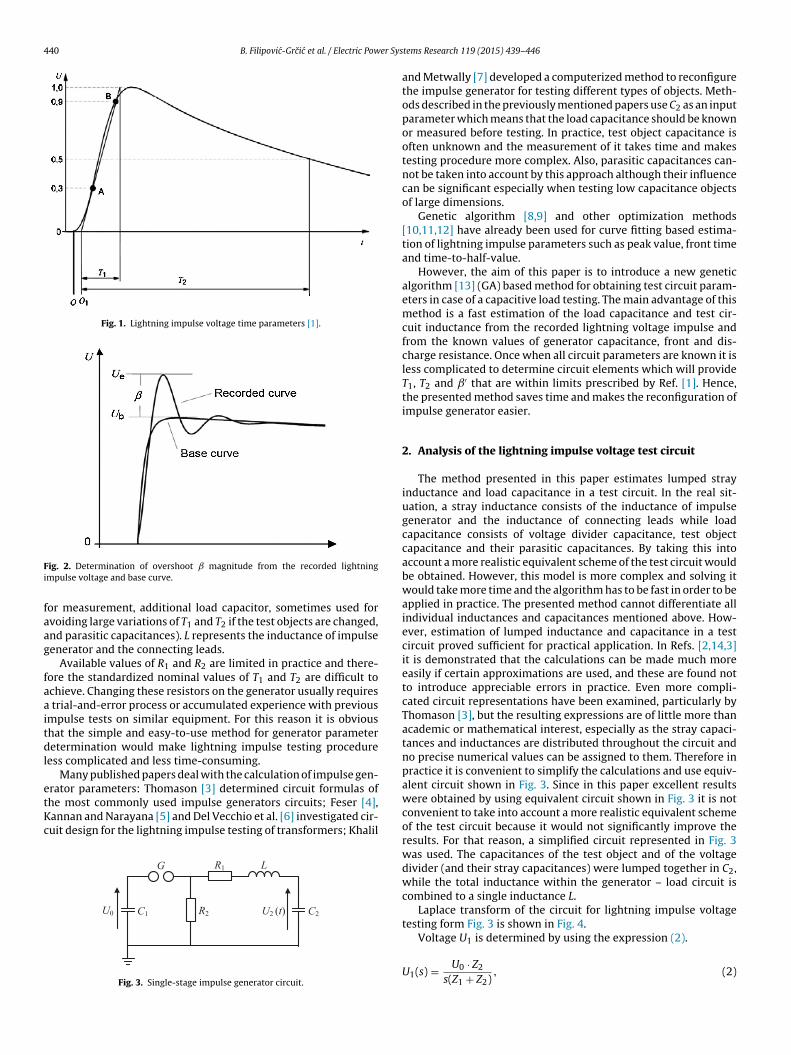
440 B. Filipovic-Grcic et al. / Electric Power Sys
Fig. 1. Lightning impulse voltage time parameters [1].
Fi
faag
faaitdl
etKc
ig. 2. Determination of overshoot magnitude from the recorded lightningmpulse voltage and base curve.
or measurement, additional load capacitor, sometimes used forvoiding large variations of T1 and T2 if the test objects are changed,nd parasitic capacitances). L represents the inductance of impulseenerator and the connecting leads.
Available values of R1 and R2 are limited in practice and there-ore the standardized nominal values of T1 and T2 are difficult tochieve. Changing these resistors on the generator usually requires
trial-and-error process or accumulated experience with previousmpulse tests on similar equipment. For this reason it is obvioushat the simple and easy-to-use method for generator parameteretermination would make lightning impulse testing procedure
ess complicated and less time-consuming.Many published papers deal with the calculation of impulse gen-
rator parameters: Thomason [3] determined circuit formulas ofhe most commonly used impulse generators circuits; Feser [4],annan and Narayana [5] and Del Vecchio et al. [6] investigated cir-uit design for the lightning impulse testing of transformers; Khalil
R1 L
R2
G
C1 C2U0 U2 (t)
Fig. 3. Single-stage impulse generator circuit.
tems Research 119 (2015) 439–446
and Metwally [7] developed a computerized method to reconfigurethe impulse generator for testing different types of objects. Meth-ods described in the previously mentioned papers use C2 as an inputparameter which means that the load capacitance should be knownor measured before testing. In practice, test object capacitance isoften unknown and the measurement of it takes time and makestesting procedure more complex. Also, parasitic capacitances can-not be taken into account by this approach although their influencecan be significant especially when testing low capacitance objectsof large dimensions.
Genetic algorithm [8,9] and other optimization methods[10,11,12] have already been used for curve fitting based estima-tion of lightning impulse parameters such as peak value, front timeand time-to-half-value.
However, the aim of this paper is to introduce a new geneticalgorithm [13] (GA) based method for obtaining test circuit param-eters in case of a capacitive load testing. The main advantage of thismethod is a fast estimation of the load capacitance and test cir-cuit inductance from the recorded lightning voltage impulse andfrom the known values of generator capacitance, front and dis-charge resistance. Once when all circuit parameters are known it isless complicated to determine circuit elements which will provideT1, T2 and ˇ′ that are within limits prescribed by Ref. [1]. Hence,the presented method saves time and makes the reconfiguration ofimpulse generator easier.
2. Analysis of the lightning impulse voltage test circuit
The method presented in this paper estimates lumped strayinductance and load capacitance in a test circuit. In the real sit-uation, a stray inductance consists of the inductance of impulsegenerator and the inductance of connecting leads while loadcapacitance consists of voltage divider capacitance, test objectcapacitance and their parasitic capacitances. By taking this intoaccount a more realistic equivalent scheme of the test circuit wouldbe obtained. However, this model is more complex and solving itwould take more time and the algorithm has to be fast in order to beapplied in practice. The presented method cannot differentiate allindividual inductances and capacitances mentioned above. How-ever, estimation of lumped inductance and capacitance in a testcircuit proved sufficient for practical application. In Refs. [2,14,3]it is demonstrated that the calculations can be made much moreeasily if certain approximations are used, and these are found notto introduce appreciable errors in practice. Even more compli-cated circuit representations have been examined, particularly byThomason [3], but the resulting expressions are of little more thanacademic or mathematical interest, especially as the stray capaci-tances and inductances are distributed throughout the circuit andno precise numerical values can be assigned to them. Therefore inpractice it is convenient to simplify the calculations and use equiv-alent circuit shown in Fig. 3. Since in this paper excellent resultswere obtained by using equivalent circuit shown in Fig. 3 it is notconvenient to take into account a more realistic equivalent schemeof the test circuit because it would not significantly improve theresults. For that reason, a simplified circuit represented in Fig. 3was used. The capacitances of the test object and of the voltagedivider (and their stray capacitances) were lumped together in C2,while the total inductance within the generator – load circuit iscombined to a single inductance L.
Laplace transform of the circuit for lightning impulse voltagetesting form Fig. 3 is shown in Fig. 4.
Voltage U1 is determined by using the expression (2).
U1(s) = U0 · Z2
s(Z1 + Z2), (2)
B. Filipovic-Grcic et al. / Electric Power Systems Research 119 (2015) 439–446 441
R1 sL
R2 U2 (s)+-s
U0 1
1
sC2
1
sCU1 (s)
w
Z
t
U
w
Z
i
U
3c
Nbbacswbaad
rUttaCU
sacssaoietib
t
Fig. 4. Laplace transform of the circuit for lightning impulse voltage testing.
here
1 = 1sC1
; Z2 = R2 · (R1 + sL + (1/sC2))R1 + R2 + sL + (1/sC2)
. (3)
The output voltage U2 is calculated in frequency domain usinghe expression (4).
2(s) = U1(s) · Z4
Z3 + Z4, (4)
here
3 = R1 + sL; Z4 = 1sC2
. (5)
The output voltage is expressed in the time domain using thenverse Laplace transform:
2(t) = L−1(U2(s)) (6)
. Method for estimation of circuit inductance and loadapacitance
Exact values of all circuit parameters are unknown in practice.ominal test circuit parameters and their tolerances are giveny manufacturers or can be more or less accurately measured,ut always with measurement uncertainty. The charging volt-ge U0, also, is not exactly known. GA based method determinesircuit inductance L and load capacitance C2 for standard and non-tandard lightning impulse waveforms. GA selects L and C2 in aide boundary range of values and R1, R2, C1 and U0 in a narrow
oundary range around nominal values. All these parameters form vector Vi, an individual solution, while a group of vectors forms population in GA terminology. Fig. 5 shows the flowchart of theescribed method.
The first step is to obtain the input data consisting of theecorded impulse voltage from the measuring system, R1, R2, C1,0 and their tolerances. GA generates the initial population of vec-
ors Vi, i = 1, . . . n. Population size n specifies how many individualshere are in each generation. Initial population is created randomlynd it satisfies the defined bounds of parameters R1, R2, C1, U0, L and2. After the creation of the initial population, the output voltage2 is determined in time domain for each Vi.
Since the GA performs many calculations finding an acceptableolution, it is very important to minimize the execution time. Tochieve this, it is helpful to reduce the number of calculations byomparing measured waveform with GA results in several repre-entative points only. Therefore, characteristic points (tcp, Ucp) areelected on measured waveform front (at 10%, 30%, 50%, 75%, 90%nd 100% of the amplitude), tail (at 90%, 75%, 60%, 50%, 40% and 30%f the amplitude) and at the local extremes in case of oscillatorympulses. For each tcp, voltage U2 is calculated with circuit param-ters selected by GA and compared to measured values. Describinghe waveform by characteristic points is a great advantage because
t significantly reduces calculation time and enables this method toe used during laboratory impulse testing.The fitness function is the objective function minimized byhe GA [15]. In this case, the fitness function takes into account
Fig. 5. Method flowchart.
the voltage percentage error for each characteristic point. Fitnessfunction is calculated using the expression (7).
ε =∣∣∣∣U2calculated(tcp) − Ucp(tcp)
Ucp(tcp)
∣∣∣∣ · 100(%) (7)
The algorithm stops when the voltage percentage errors of allcharacteristic points are lower than the user defined limit value orwhen a certain time elapsed. All calculations are performed usingMatlab software on PC Intel core i5 CPU, 2.53 GHz with 4 GB RAMand a selected time period of 1 min was enough to reach the stop-ping criteria.
If stopping criteria is not fulfilled, then selection, crossover andmutation are performed. The stochastic uniform selection functionchooses the parents for the next generation based on fitness results.The elite count specifies the number of individuals that are guaran-teed to survive to the next generation (in this case 50). Crossoverfraction specifies the fraction of the next generation, other thanelite individuals, that are produced by crossover (in this case 80%).The remaining individuals are produced by mutation. The scatteredcrossover function creates a random binary vector. It then selectsthe genes for which the vector value is a 1 from the first parent,and the genes for which the vector value is a 0 from the secondparent, and combines the genes to form the child. Mutation func-tions create small random changes in individuals from a population,and they provide genetic diversity and enable the GA to search abroader space. Adaptive feasible mutation was used which ran-domly generates directions that are adaptive with respect to thelast successful or unsuccessful generation. A step length is chosenalong each direction so that bounds are satisfied.
If T1, T2 or ˇ′ are not acceptable, it is necessary to modify the
test circuit parameters. This usually requires changing R1 and/or R2and/or introduction of additional capacitor Cad in parallel with thetest object. Now, with known L and C2, one can easily calculate out-put voltage using the finite pool of R1, R2 and Cad available in a high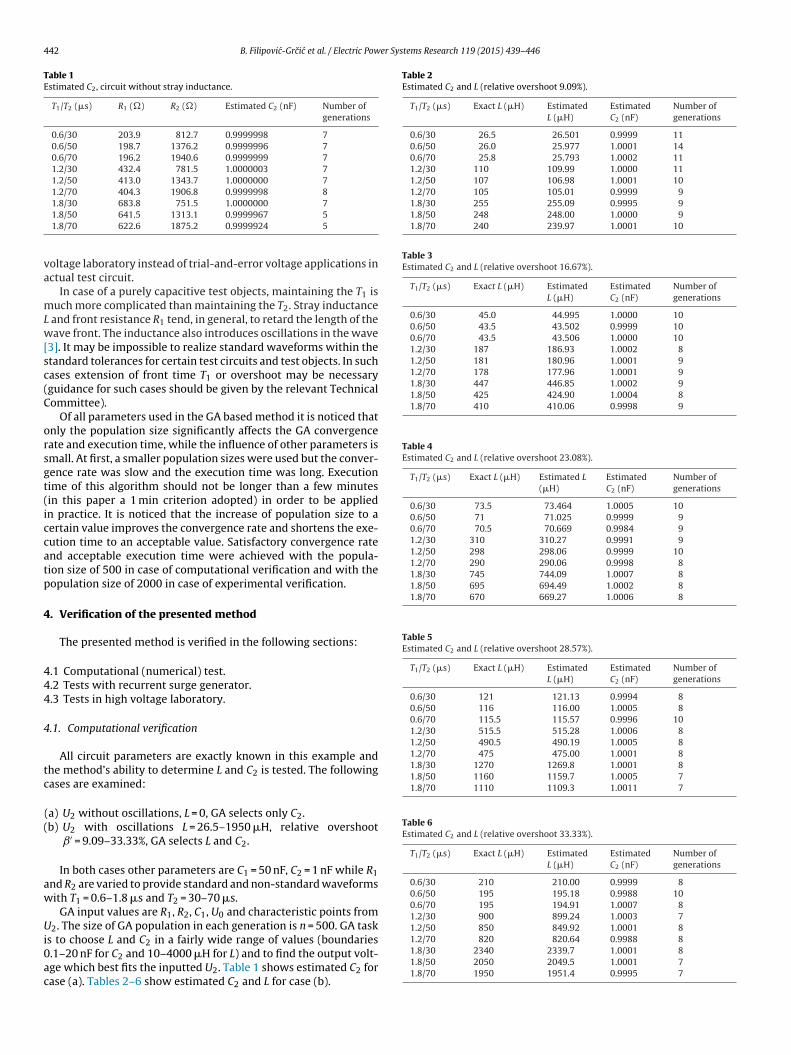
442 B. Filipovic-Grcic et al. / Electric Power Systems Research 119 (2015) 439–446
Table 1Estimated C2, circuit without stray inductance.
T1/T2 (�s) R1 (�) R2 (�) Estimated C2 (nF) Number ofgenerations
0.6/30 203.9 812.7 0.9999998 70.6/50 198.7 1376.2 0.9999996 70.6/70 196.2 1940.6 0.9999999 71.2/30 432.4 781.5 1.0000003 71.2/50 413.0 1343.7 1.0000000 71.2/70 404.3 1906.8 0.9999998 81.8/30 683.8 751.5 1.0000000 7
va
mLw[sc(C
orsgt(iccatp
4
444
4
tc
(
aw
Ui0ac
Table 2Estimated C2 and L (relative overshoot 9.09%).
T1/T2 (�s) Exact L (�H) EstimatedL (�H)
EstimatedC2 (nF)
Number ofgenerations
0.6/30 26.5 26.501 0.9999 110.6/50 26.0 25.977 1.0001 140.6/70 25.8 25.793 1.0002 111.2/30 110 109.99 1.0000 111.2/50 107 106.98 1.0001 101.2/70 105 105.01 0.9999 91.8/30 255 255.09 0.9995 91.8/50 248 248.00 1.0000 91.8/70 240 239.97 1.0001 10
Table 3Estimated C2 and L (relative overshoot 16.67%).
T1/T2 (�s) Exact L (�H) EstimatedL (�H)
EstimatedC2 (nF)
Number ofgenerations
0.6/30 45.0 44.995 1.0000 100.6/50 43.5 43.502 0.9999 100.6/70 43.5 43.506 1.0000 101.2/30 187 186.93 1.0002 81.2/50 181 180.96 1.0001 91.2/70 178 177.96 1.0001 91.8/30 447 446.85 1.0002 91.8/50 425 424.90 1.0004 81.8/70 410 410.06 0.9998 9
Table 4Estimated C2 and L (relative overshoot 23.08%).
T1/T2 (�s) Exact L (�H) Estimated L(�H)
EstimatedC2 (nF)
Number ofgenerations
0.6/30 73.5 73.464 1.0005 100.6/50 71 71.025 0.9999 90.6/70 70.5 70.669 0.9984 91.2/30 310 310.27 0.9991 91.2/50 298 298.06 0.9999 101.2/70 290 290.06 0.9998 81.8/30 745 744.09 1.0007 81.8/50 695 694.49 1.0002 81.8/70 670 669.27 1.0006 8
Table 5Estimated C2 and L (relative overshoot 28.57%).
T1/T2 (�s) Exact L (�H) EstimatedL (�H)
EstimatedC2 (nF)
Number ofgenerations
0.6/30 121 121.13 0.9994 80.6/50 116 116.00 1.0005 80.6/70 115.5 115.57 0.9996 101.2/30 515.5 515.28 1.0006 81.2/50 490.5 490.19 1.0005 81.2/70 475 475.00 1.0001 81.8/30 1270 1269.8 1.0001 81.8/50 1160 1159.7 1.0005 71.8/70 1110 1109.3 1.0011 7
Table 6Estimated C2 and L (relative overshoot 33.33%).
T1/T2 (�s) Exact L (�H) EstimatedL (�H)
EstimatedC2 (nF)
Number ofgenerations
0.6/30 210 210.00 0.9999 80.6/50 195 195.18 0.9988 100.6/70 195 194.91 1.0007 81.2/30 900 899.24 1.0003 71.2/50 850 849.92 1.0001 8
1.8/50 641.5 1313.1 0.9999967 51.8/70 622.6 1875.2 0.9999924 5
oltage laboratory instead of trial-and-error voltage applications inctual test circuit.
In case of a purely capacitive test objects, maintaining the T1 isuch more complicated than maintaining the T2. Stray inductance
and front resistance R1 tend, in general, to retard the length of theave front. The inductance also introduces oscillations in the wave
3]. It may be impossible to realize standard waveforms within thetandard tolerances for certain test circuits and test objects. In suchases extension of front time T1 or overshoot may be necessaryguidance for such cases should be given by the relevant Technicalommittee).
Of all parameters used in the GA based method it is noticed thatnly the population size significantly affects the GA convergenceate and execution time, while the influence of other parameters ismall. At first, a smaller population sizes were used but the conver-ence rate was slow and the execution time was long. Executionime of this algorithm should not be longer than a few minutesin this paper a 1 min criterion adopted) in order to be appliedn practice. It is noticed that the increase of population size to aertain value improves the convergence rate and shortens the exe-ution time to an acceptable value. Satisfactory convergence ratend acceptable execution time were achieved with the popula-ion size of 500 in case of computational verification and with theopulation size of 2000 in case of experimental verification.
. Verification of the presented method
The presented method is verified in the following sections:
.1 Computational (numerical) test.
.2 Tests with recurrent surge generator.
.3 Tests in high voltage laboratory.
.1. Computational verification
All circuit parameters are exactly known in this example andhe method’s ability to determine L and C2 is tested. The followingases are examined:
(a) U2 without oscillations, L = 0, GA selects only C2.b) U2 with oscillations L = 26.5–1950 �H, relative overshoot
ˇ′ = 9.09–33.33%, GA selects L and C2.
In both cases other parameters are C1 = 50 nF, C2 = 1 nF while R1nd R2 are varied to provide standard and non-standard waveformsith T1 = 0.6–1.8 �s and T2 = 30–70 �s.
GA input values are R1, R2, C1, U0 and characteristic points from2. The size of GA population in each generation is n = 500. GA task
s to choose L and C2 in a fairly wide range of values (boundaries.1–20 nF for C2 and 10–4000 �H for L) and to find the output volt-ge which best fits the inputted U2. Table 1 shows estimated C2 forase (a). Tables 2–6 show estimated C2 and L for case (b).
1.2/70 820 820.64 0.9988 81.8/30 2340 2339.7 1.0001 81.8/50 2050 2049.5 1.0001 71.8/70 1950 1951.4 0.9995 7
B. Filipovic-Grcic et al. / Electric Power Systems Research 119 (2015) 439–446 443
0 1 2 3 4 5 6 7 8 9 100
20
40
60
80
100
120
140
160
t (μs)
U2 (
kV
)
Estimation
β’=23.08 %
β’=33.33 %β’=28.57 %
β’=16.67 %β’=9.09 %
β’=0 %
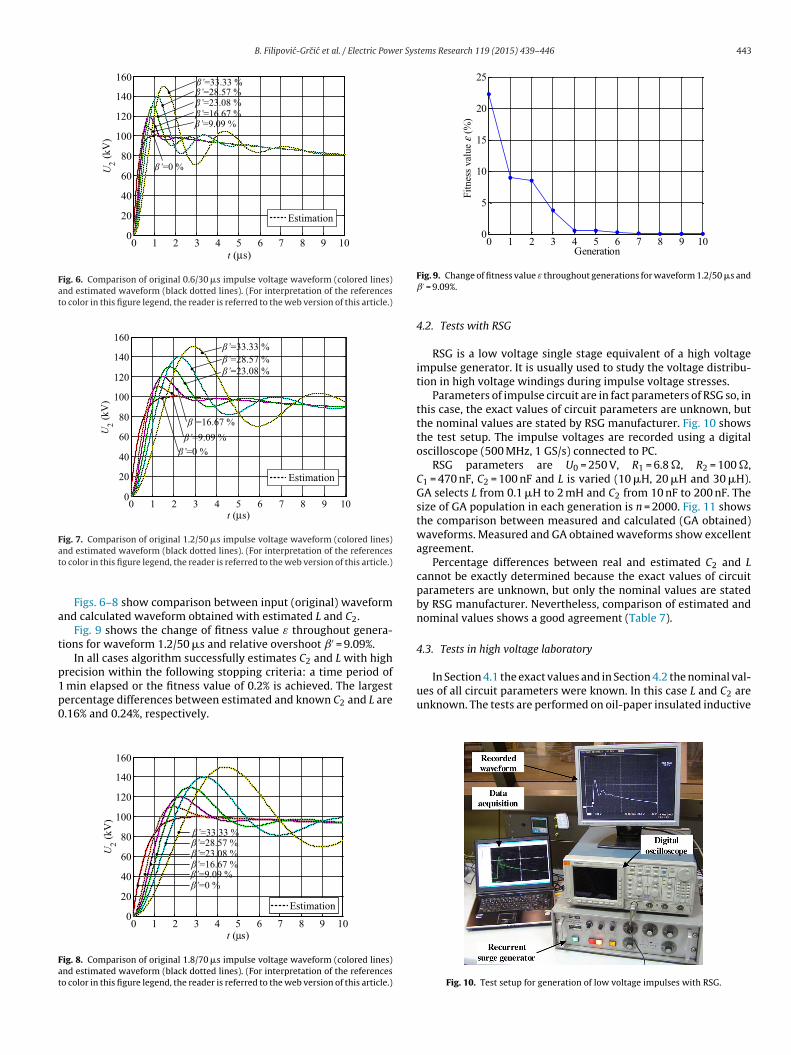
Fig. 6. Comparison of original 0.6/30 �s impulse voltage waveform (colored lines)and estimated waveform (black dotted lines). (For interpretation of the referencesto color in this figure legend, the reader is referred to the web version of this article.)
0 1 2 3 4 5 6 7 8 9 100
20
40
60
80
100
120
140
160
t (μs)
U2 (
kV
)
β’=9.09 %
β’=0 %
β’=23.08 %
β’=16.67 %
β’=33.33 %
β’=28.57 %
Estimation
Fig. 7. Comparison of original 1.2/50 �s impulse voltage waveform (colored lines)at
a
t
p1p0
Fat
0 1 2 3 4 5 6 7 8 9 100
5
10
15
20
25
Generation
)%(
eula
vsse
ntiF
Fit
nes
sv
alue
ε(%
)
In Section 4.1 the exact values and in Section 4.2 the nominal val-ues of all circuit parameters were known. In this case L and C are
nd estimated waveform (black dotted lines). (For interpretation of the referenceso color in this figure legend, the reader is referred to the web version of this article.)
Figs. 6–8 show comparison between input (original) waveformnd calculated waveform obtained with estimated L and C2.
Fig. 9 shows the change of fitness value ε throughout genera-ions for waveform 1.2/50 �s and relative overshoot ˇ′ = 9.09%.
In all cases algorithm successfully estimates C2 and L with highrecision within the following stopping criteria: a time period of
min elapsed or the fitness value of 0.2% is achieved. The largest
ercentage differences between estimated and known C2 and L are.16% and 0.24%, respectively.0 1 2 3 4 5 6 7 8 9 100
20
40
60
80
100
120
140
160
t (μs)
U2 (
kV
)
Estimation
β’=23.08 %
β’=33.33 %β’=28.57 %
β’=16.67 %β’=9.09 %β’=0 %
ig. 8. Comparison of original 1.8/70 �s impulse voltage waveform (colored lines)nd estimated waveform (black dotted lines). (For interpretation of the referenceso color in this figure legend, the reader is referred to the web version of this article.)
Fig. 9. Change of fitness value ε throughout generations for waveform 1.2/50 �s andˇ′ = 9.09%.
4.2. Tests with RSG
RSG is a low voltage single stage equivalent of a high voltageimpulse generator. It is usually used to study the voltage distribu-tion in high voltage windings during impulse voltage stresses.
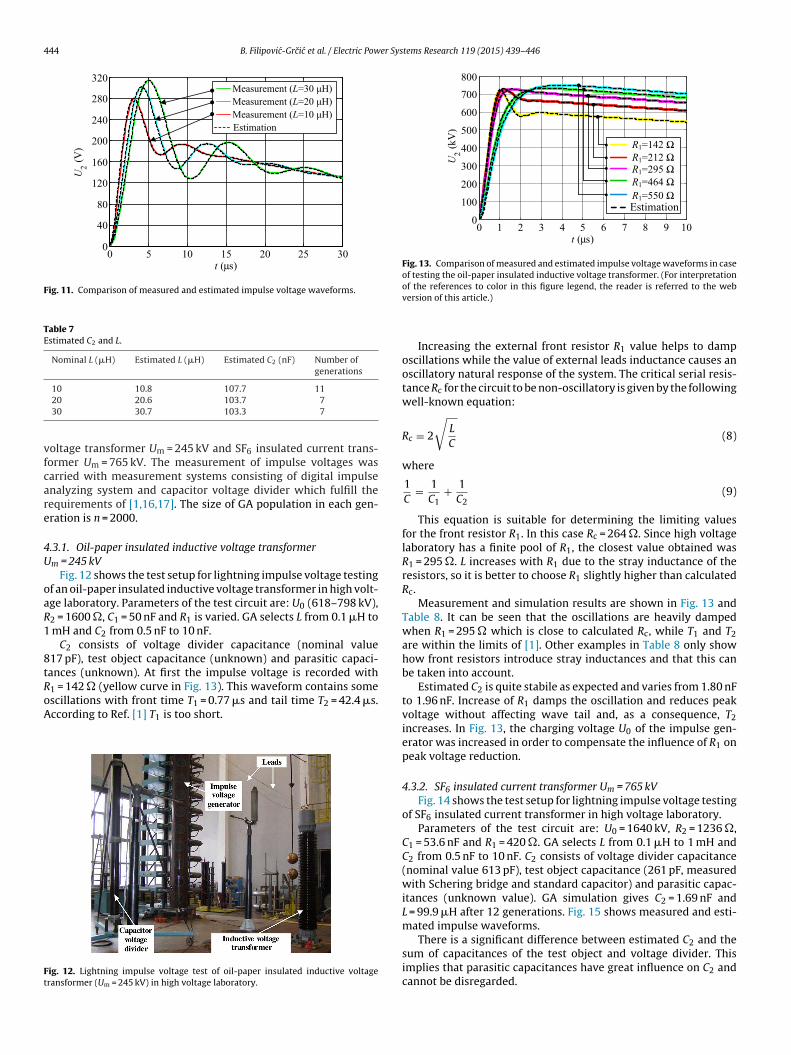
Parameters of impulse circuit are in fact parameters of RSG so, inthis case, the exact values of circuit parameters are unknown, butthe nominal values are stated by RSG manufacturer. Fig. 10 showsthe test setup. The impulse voltages are recorded using a digitaloscilloscope (500 MHz, 1 GS/s) connected to PC.
RSG parameters are U0 = 250 V, R1 = 6.8 �, R2 = 100 �,C1 = 470 nF, C2 = 100 nF and L is varied (10 �H, 20 �H and 30 �H).GA selects L from 0.1 �H to 2 mH and C2 from 10 nF to 200 nF. Thesize of GA population in each generation is n = 2000. Fig. 11 showsthe comparison between measured and calculated (GA obtained)waveforms. Measured and GA obtained waveforms show excellentagreement.
Percentage differences between real and estimated C2 and Lcannot be exactly determined because the exact values of circuitparameters are unknown, but only the nominal values are statedby RSG manufacturer. Nevertheless, comparison of estimated andnominal values shows a good agreement (Table 7).
4.3. Tests in high voltage laboratory
2unknown. The tests are performed on oil-paper insulated inductive
Fig. 10. Test setup for generation of low voltage impulses with RSG.
444 B. Filipovic-Grcic et al. / Electric Power Systems Research 119 (2015) 439–446
0 5 10 15 20 25 300
40
80
120
160
200
240
280
320
t (μs)
U2 (
V)
Measurement (L=10 μH)
Estimation
Measurement (L=20 μH)
Measurement (L=30 μH)
Fig. 11. Comparison of measured and estimated impulse voltage waveforms.
Table 7Estimated C2 and L.
Nominal L (�H) Estimated L (�H) Estimated C2 (nF) Number ofgenerations
10 10.8 107.7 11
vfcare
4U
oaR1
8tRoA
Ft
0 1 2 3 4 5 6 7 8 9 100
100
200
300
400
500
600
700
800
t (μs)
U2 (
kV
)
Estimation
R1=212 ΩR1=142 Ω
R1=464 Ω
R1=295 Ω
R1=550 Ω
Fig. 13. Comparison of measured and estimated impulse voltage waveforms in caseof testing the oil-paper insulated inductive voltage transformer. (For interpretationof the references to color in this figure legend, the reader is referred to the web
20 20.6 103.7 730 30.7 103.3 7
oltage transformer Um = 245 kV and SF6 insulated current trans-ormer Um = 765 kV. The measurement of impulse voltages wasarried with measurement systems consisting of digital impulsenalyzing system and capacitor voltage divider which fulfill theequirements of [1,16,17]. The size of GA population in each gen-ration is n = 2000.
.3.1. Oil-paper insulated inductive voltage transformerm = 245 kV
Fig. 12 shows the test setup for lightning impulse voltage testingf an oil-paper insulated inductive voltage transformer in high volt-ge laboratory. Parameters of the test circuit are: U0 (618–798 kV),2 = 1600 �, C1 = 50 nF and R1 is varied. GA selects L from 0.1 �H to
mH and C2 from 0.5 nF to 10 nF.C2 consists of voltage divider capacitance (nominal value
17 pF), test object capacitance (unknown) and parasitic capaci-
ances (unknown). At first the impulse voltage is recorded with1 = 142 � (yellow curve in Fig. 13). This waveform contains somescillations with front time T1 = 0.77 �s and tail time T2 = 42.4 �s.ccording to Ref. [1] T1 is too short.ig. 12. Lightning impulse voltage test of oil-paper insulated inductive voltageransformer (Um = 245 kV) in high voltage laboratory.
version of this article.)
Increasing the external front resistor R1 value helps to damposcillations while the value of external leads inductance causes anoscillatory natural response of the system. The critical serial resis-tance Rc for the circuit to be non-oscillatory is given by the followingwell-known equation:
Rc = 2
√L
C(8)
where
1C
= 1C1
+ 1C2
(9)
This equation is suitable for determining the limiting valuesfor the front resistor R1. In this case Rc = 264 �. Since high voltagelaboratory has a finite pool of R1, the closest value obtained wasR1 = 295 �. L increases with R1 due to the stray inductance of theresistors, so it is better to choose R1 slightly higher than calculatedRc.
Measurement and simulation results are shown in Fig. 13 andTable 8. It can be seen that the oscillations are heavily dampedwhen R1 = 295 � which is close to calculated Rc, while T1 and T2are within the limits of [1]. Other examples in Table 8 only showhow front resistors introduce stray inductances and that this canbe taken into account.
Estimated C2 is quite stabile as expected and varies from 1.80 nFto 1.96 nF. Increase of R1 damps the oscillation and reduces peakvoltage without affecting wave tail and, as a consequence, T2increases. In Fig. 13, the charging voltage U0 of the impulse gen-erator was increased in order to compensate the influence of R1 onpeak voltage reduction.
4.3.2. SF6 insulated current transformer Um = 765 kVFig. 14 shows the test setup for lightning impulse voltage testing
of SF6 insulated current transformer in high voltage laboratory.Parameters of the test circuit are: U0 = 1640 kV, R2 = 1236 �,
C1 = 53.6 nF and R1 = 420 �. GA selects L from 0.1 �H to 1 mH andC2 from 0.5 nF to 10 nF. C2 consists of voltage divider capacitance(nominal value 613 pF), test object capacitance (261 pF, measuredwith Schering bridge and standard capacitor) and parasitic capac-itances (unknown value). GA simulation gives C2 = 1.69 nF andL = 99.9 �H after 12 generations. Fig. 15 shows measured and esti-mated impulse waveforms.
There is a significant difference between estimated C2 and thesum of capacitances of the test object and voltage divider. Thisimplies that parasitic capacitances have great influence on C2 andcannot be disregarded.
B. Filipovic-Grcic et al. / Electric Power Systems Research 119 (2015) 439–446 445
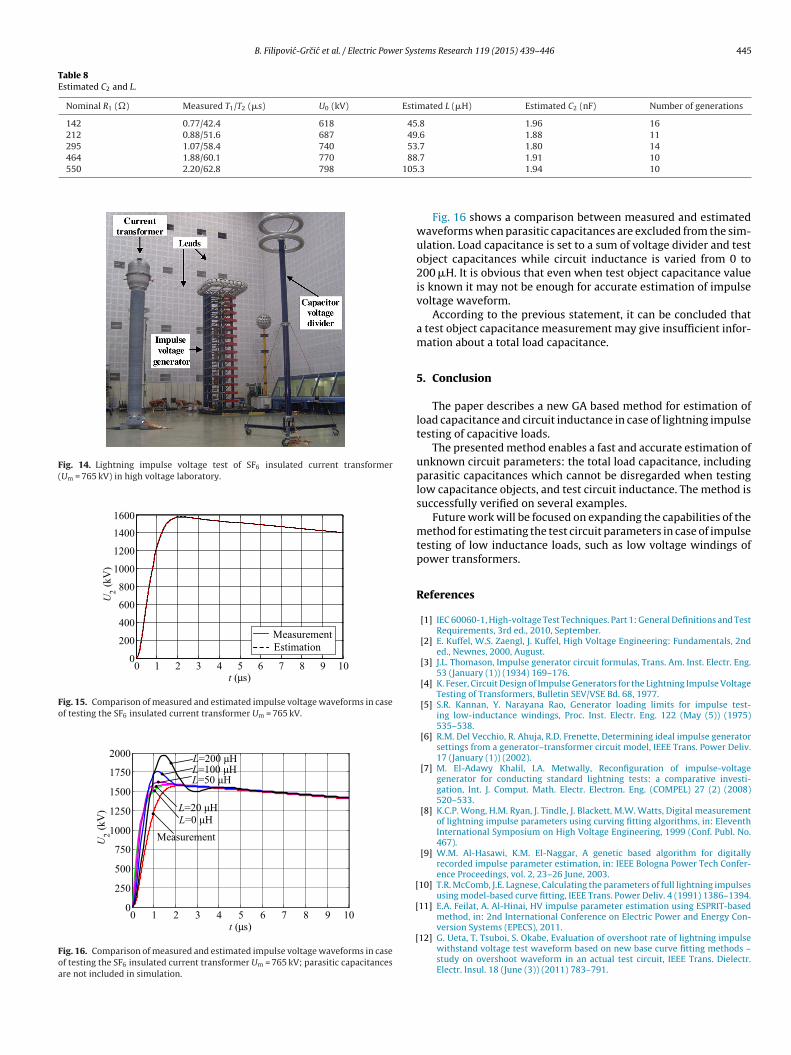
Table 8Estimated C2 and L.
Nominal R1 (�) Measured T1/T2 (�s) U0 (kV) Estimated L (�H) Estimated C2 (nF) Number of generations
142 0.77/42.4 618 45.8 1.96 16212 0.88/51.6 687 49.6 1.88 11295 1.07/58.4 740 53.7 1.80 14464 1.88/60.1 770 88.7 1.91 10550 2.20/62.8 798 105
Fig. 14. Lightning impulse voltage test of SF6 insulated current transformer(Um = 765 kV) in high voltage laboratory.
0 1 2 3 4 5 6 7 8 9 100
200
400
600
800
1000
1200
1400
1600
t (μs)
U2 (kV
)
Measurement
Estimation
Fig. 15. Comparison of measured and estimated impulse voltage waveforms in caseof testing the SF6 insulated current transformer Um = 765 kV.
0 1 2 3 4 5 6 7 8 9 100
250
500
750
1000
1250
1500
1750
2000
t (μs)
U2 (
kV
)
L=200 μHL=100 μH
Measurement
L=50 μH
L=0 μHL=20 μH
Fig. 16. Comparison of measured and estimated impulse voltage waveforms in caseof testing the SF6 insulated current transformer Um = 765 kV; parasitic capacitancesare not included in simulation.
[
[
[
.3 1.94 10
Fig. 16 shows a comparison between measured and estimatedwaveforms when parasitic capacitances are excluded from the sim-ulation. Load capacitance is set to a sum of voltage divider and testobject capacitances while circuit inductance is varied from 0 to200 �H. It is obvious that even when test object capacitance valueis known it may not be enough for accurate estimation of impulsevoltage waveform.
According to the previous statement, it can be concluded thata test object capacitance measurement may give insufficient infor-mation about a total load capacitance.
5. Conclusion
The paper describes a new GA based method for estimation ofload capacitance and circuit inductance in case of lightning impulsetesting of capacitive loads.
The presented method enables a fast and accurate estimation ofunknown circuit parameters: the total load capacitance, includingparasitic capacitances which cannot be disregarded when testinglow capacitance objects, and test circuit inductance. The method issuccessfully verified on several examples.
Future work will be focused on expanding the capabilities of themethod for estimating the test circuit parameters in case of impulsetesting of low inductance loads, such as low voltage windings ofpower transformers.
References
[1] IEC 60060-1, High-voltage Test Techniques. Part 1: General Definitions and TestRequirements, 3rd ed., 2010, September.
[2] E. Kuffel, W.S. Zaengl, J. Kuffel, High Voltage Engineering: Fundamentals, 2nded., Newnes, 2000, August.
[3] J.L. Thomason, Impulse generator circuit formulas, Trans. Am. Inst. Electr. Eng.53 (January (1)) (1934) 169–176.
[4] K. Feser, Circuit Design of Impulse Generators for the Lightning Impulse VoltageTesting of Transformers, Bulletin SEV/VSE Bd. 68, 1977.
[5] S.R. Kannan, Y. Narayana Rao, Generator loading limits for impulse test-ing low-inductance windings, Proc. Inst. Electr. Eng. 122 (May (5)) (1975)535–538.
[6] R.M. Del Vecchio, R. Ahuja, R.D. Frenette, Determining ideal impulse generatorsettings from a generator–transformer circuit model, IEEE Trans. Power Deliv.17 (January (1)) (2002).
[7] M. El-Adawy Khalil, I.A. Metwally, Reconfiguration of impulse-voltagegenerator for conducting standard lightning tests: a comparative investi-gation, Int. J. Comput. Math. Electr. Electron. Eng. (COMPEL) 27 (2) (2008)520–533.
[8] K.C.P. Wong, H.M. Ryan, J. Tindle, J. Blackett, M.W. Watts, Digital measurementof lightning impulse parameters using curving fitting algorithms, in: EleventhInternational Symposium on High Voltage Engineering, 1999 (Conf. Publ. No.467).
[9] W.M. Al-Hasawi, K.M. El-Naggar, A genetic based algorithm for digitallyrecorded impulse parameter estimation, in: IEEE Bologna Power Tech Confer-ence Proceedings, vol. 2, 23–26 June, 2003.
10] T.R. McComb, J.E. Lagnese, Calculating the parameters of full lightning impulsesusing model-based curve fitting, IEEE Trans. Power Deliv. 4 (1991) 1386–1394.
11] E.A. Feilat, A. Al-Hinai, HV impulse parameter estimation using ESPRIT-basedmethod, in: 2nd International Conference on Electric Power and Energy Con-
version Systems (EPECS), 2011.12] G. Ueta, T. Tsuboi, S. Okabe, Evaluation of overshoot rate of lightning impulsewithstand voltage test waveform based on new base curve fitting methods –study on overshoot waveform in an actual test circuit, IEEE Trans. Dielectr.Electr. Insul. 18 (June (3)) (2011) 783–791.

4 er Sys
[[
[
46 B. Filipovic-Grcic et al. / Electric Pow
13] R.L. Haupt, S.E. Haupt, Practical Genetic Algorithms, 2nd ed., Wiley & Sons, 2004.14] F.S. Edwards, A.S. Husbands, F.R. Perry, The development and design of high-
voltage impulse generators, Proc. IEE I: Gen. 98 (May (111)) (1951) 155–168.15] User’s Guide, Genetic Algorithm and Direct Search Toolbox 2, The MathWorks,
Matlab, 2009.
[
[
tems Research 119 (2015) 439–446
16] IEC 61083-1, Instruments and Software Used for Measurement in High-voltageImpulse Tests – Part 1: Requirements for Instruments, 2nd ed., 2001, June.
17] IEC 61083-2, Instruments and Software Used for Measurement in High-voltageand High-current Tests – Part 2: Requirements for Software for Tests withImpulse Voltages and Currents, 1st ed., 1996, July.