Embed Size (px)
Citation preview
Electric power requirement in California for large-scaleproduction of hydrogen fuel
Paul Kruger*
Civil Engineering Department, Stanford University, Stanford, CA 94305, USA
Abstract
Substitution of hydrogen for fossil fuels in motor vehicles will require a signi®cant growth of electric energyconsumption, especially in high growth rate states such as California. A major concern is the magnitude of theadditional electric power capacity necessary to build a large-scale hydrogen fuel industry in California to
accommodate the fuel demand of a 30-million vehicle ¯eet. Electrolysis of water may be the only practical means toproduce hydrogen in su�cient quantity without use of fossil fuels for so large a vehicle ¯eet. A dynamic model wasused to estimate the increasing annual electric energy requirement to sustain long-term growth of adequate
hydrogen fuel production in two time sequences. The ®rst extrapolates historic data on population, vehicle, andenergy statistics from California State agencies to the year 2010 when a fuel-cell engine vehicle industry could beginto expand rapidly. The second time sequence uses the 2010 values as the initial conditions to examine a range of
growth scenarios to the year 2050 when a signi®cant fraction of the total California vehicle ¯eet could be operatedwith hydrogen fuel. The results of the model calculations show that even with improved energy consumptione�ciency of electrolytic production facilities, the additional electric energy demand to sustain replacement growth ofhydrogen fuel in the ¯eet will require installation of additional generating capacity. # 2000 International
Association for Hydrogen Energy. Published by Elsevier Science Ltd. All rights reserved.
1. Introduction
The potential for public acceptance of hydrogen as amotor vehicle fuel has increased markedly as a result
of two major environmental desires: (1) a reduction in
global emission of carbon dioxide from combustion of
fossil fuels; and (2) a reduction in local emission ofnitrogen oxides in automobile exhaust gas. The ®rst
concern enhances the broad potential for hydrogen as
a non-carbon fuel to the extent that the reduction in
carbon-fuel combustion can be achieved with an accep-table level of economic cost. The second concern
resulted in a mandate by the State of California to
introduce zero-emission vehicles into the state's vehicle
¯eet. The mandate requires that 10% of all new ve-
hicles starting in the year 2003 be zero-emission ve-
hicles. Although, currently only electric-battery
powered vehicles qualify as zero-emission vehicles,
large-scale substitution of gasoline as the primary
transportation fuel in the future will likely involve
large numbers of essentially zero-emission fuel-cell
powered vehicles that use hydrogen as fuel. Large-scale
production of hydrogen by electrolysis of water as an
expanding industry could o�set the reduction in gaso-
line and diesel fuels for transportation. The replace-
ment of fossil fuels by hydrogen produced with non-
International Journal of Hydrogen Energy 25 (2000) 395±405
0360-3199/00/$20.00 # 2000 International Association for Hydrogen Energy. Published by Elsevier Science Ltd. All rights reserved.
PII: S0360-3199(99 )00056-7
* Tel.: +1-650-493-4284; fax: +1-650-493-5122.
fossil energy sources would alleviate both environmen-
tal concerns in the State of California.As the technology for fuel-cell engines develops
rapidly in the automobile industry, a concomitant
industry for large-scale production of hydrogen isneeded with technology advances in hydrogen pro-
duction methods, storage and delivery systems, safety,and economics. Improvements in these technologiesare reported periodically, for example, annually by the
National Hydrogen Association (e.g. [14]) and bi-annually by the International Association for Hydro-gen Energy (e.g. [13]). Although several chemical and
physical processes are under study for production ofhydrogen, other than reforming with natural gas, elec-
trolysis of water currently appears to be the only prac-tical means to produce hydrogen in large quantity as afuel. In California alone, where the vehicle ¯eet might
reach some 30 million vehicles by the year 2010,achieving a signi®cant reduction in gasoline and dieselfuels will require an intensive growth of an alternate
fuel industry.The use of hydrogen as a motor vehicle fuel has
been encouraged by environmental groups that antici-pate generation of the necessary electric power for fuelproduction by alternate energy resources (such as
solar, wind, biomass, and geothermal). However, amajor concern becomes the magnitude of the ad-ditional electric power necessary to build a large-scale
alternate fuel industry in California to accommodatethe growth of a 30-million vehicle ¯eet. The fraction of
the ¯eet that could run on hydrogen fuel depends notonly on the production rate of fuel-cell engine vehicles,but also on the widespread availability of su�cient
hydrogen fuel in a distribution infrastructure compar-able to that of gasoline today. The energy requirementto create and sustain a fuel demand for so large a ve-
hicle ¯eet could be much greater than any single pri-mary energy resource could provide. Thus, an estimate
of the potential magnitude of the total power require-ment is desirable to assist in the long-range planningneeded to ensure an adequate fuel supply into the
future.An estimate of the electric power capacity that
would be needed to sustain long-term growth of ade-quate hydrogen production as a motor-vehicle fuel wasmade with a dynamic model which incorporates fore-
cast growth of population and vehicle ¯eet in Califor-nia over the next ®fty years in two time sequences. The®rst uses historic data from State of California
agencies on population, vehicle ¯eet composition,mean annual travel, and fuel economy to derive the in-
itial conditions for the year 2010 when the growth ofhydrogen fuel-cell engine production is expected toaccelerate rapidly. The second time sequence examines
a range of possible fuel-cell vehicle growth rates overthe next 40 years, to 2050, to estimate the magnitude
of the hydrogen fuel demand for large-scale substi-tution of gasoline and the necessary electric power ca-
pacity to achieve it based on anticipated electric-energye�ciency of hydrogen production by water electrolysis.
2. The HZEV-¯eet electric energy demand model
The model to extrapolate existing conditions to 2010
and examine potential electric energy shortfall through2050 was prepared with the commercially availableStella II dynamic modeling software [10]. The model
speci®es the relationships between the dynamic com-ponents of the system and describes the processes thatdetermine future properties of the components from
the initial conditions. Equations in the system are ®nitedi�erence equations, solved by Euler's method or 2ndor 4th-order Runga±Kutta methods. A schematic dia-gram of the model for the ®rst time sequence (1990±
2010) is shown in Fig. 1.Inputs of population and per-capita vehicle owner-
ship data, in the ®rst column of the diagram, are used
to calculate the annual vehicle ¯eet size. The popu-lation component extrapolates existing census data.Extrapolation of vehicle registration data is more com-
plex due to (1) the fast-changing mean annual growthrate in vehicle registrations; and (2) the change in a�u-ence in California with a corresponding change in ve-
hicle ownership. The model calculates initial andfuture ¯eet size by the product of the steady growingpopulation and a small saturation growth rate attribu-ted to a�uence. For the model, the actual 1990 vehicle
¯eet for California was grouped into four applicationcategories based on the assumption that introductionof hydrogen fuel in large-scale quantities would be by
application type of vehicle, in order of easiest-to-im-plement by vehicle type. The applications consider therelative importance of such factors as range of travel
from central refueling locations, total mileage, fueleconomy, and emission factors of exhaust gases. Thefour vehicle types in the fuel-demand model consist of
the following.
. Autos Ð small vehicles that travel for convenienceof individuals (e.g. private cars, taxis, motorcycles).
. Vans Ð delivery vehicles that routinely carry sta�
and passengers (e.g. to airports, hospitals, sites forrepair services) or goods (e.g. small packages, mail,appliances).
. Buses Ð large vehicles (including trailers and mobilehomes) that transport people within de®ned areas(e.g. school district, city, state).
. Trucks Ð all other large vehicles that carry heavygoods and materials or perform work within thestate.
P. Kruger / International Journal of Hydrogen Energy 25 (2000) 395±405396
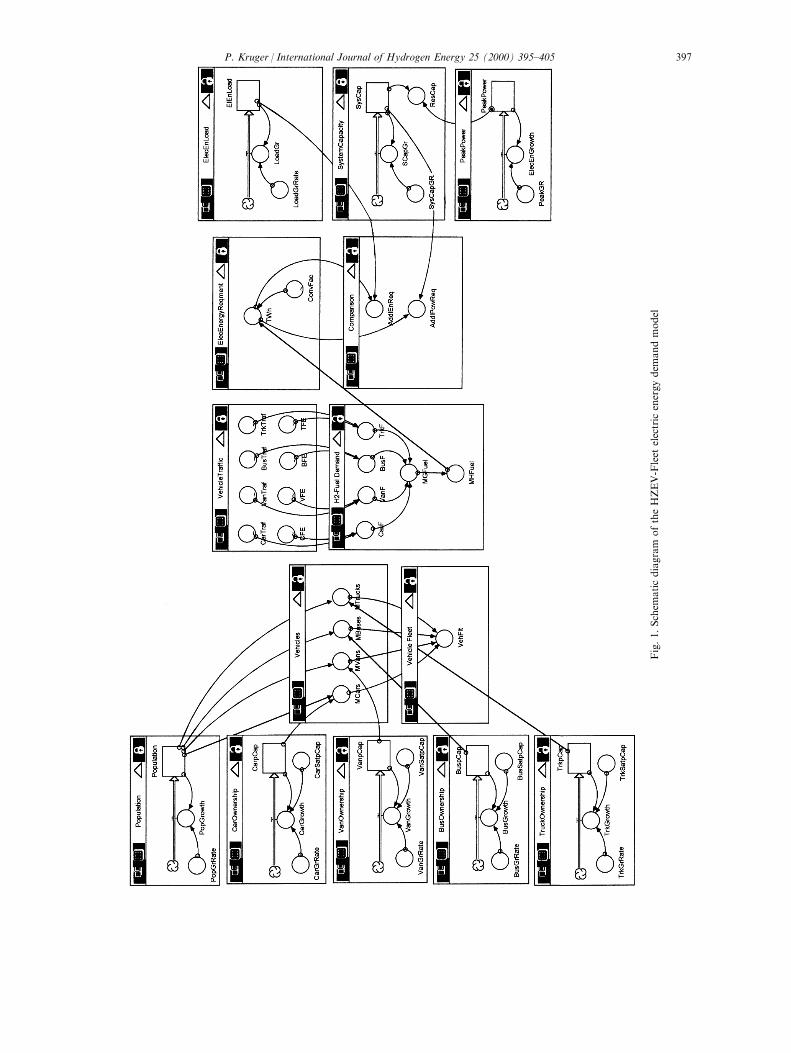
Fig.1.Schem
aticdiagram
oftheHZEV-Fleet
electric
energydem
andmodel
P. Kruger / International Journal of Hydrogen Energy 25 (2000) 395±405 397

The results of the estimates for the vehicle ¯eet are
combined with the input for vehicle tra�c and fuel
economy (for the four vehicle types) to calculate the
total fuel demand for the ¯eet. Data from the several
manufacturers of electrolyser systems were used to pre-
pare an input function for the electric power demand
component. Data for total electric energy demand,
peak power demand, and system capacity requirements
were extrapolated to estimate electric energy consump-
tion and anticipated additional power capacity, if any,
needed to meet the expected ¯eet fuel demand.
3. Input data for the State of California
The data for the model components were obtained
from the State of California agencies, except for the
electrolyser energy consumption data, which were pre-
pared from data provided by four electrolyser equip-
ment manufacturers. The speci®c data are discussed
for each component.
3.1. Population
Data for the population of California and its growth
are well documented. Historic census data since 1940(http://www.census.gov/population/censusdata, 1998)are shown in Table 1 in comparison to US population
data. California population shows a steady fractionalgrowth from 5.2% in 1940 to 12% in 1990. The popu-lation mean annual growth rate (m.a.g.r.), shown as a
regression line in Fig. 2, was 2.84%/a over the 50-yearperiod. A forecast of population from 1996 to 2020,used in Caltrans [2] to estimate future transportationdata, is shown in Fig. 3. The data were quoted from
the California Department of Finance who assumedthat the population annual growth rate would declinefrom 1.8% in 1997 to 1.4% in 2020. The resulting
m.a.g.r. was 1.6%/a, about 56% of the historicm.a.g.r. In setting initial conditions for 2010, it wasnoted that the population would be 52.5 million people
based on historic growth rate data compared to 40.9million people based on the CDOF-assumed growthrate data. The more conservative value of 40.9 millionpeople was selected for the model initial population in
2010.
3.2. Vehicle Fleet
Data for the vehicle ¯eet in California were obtained
from several state agency sources, each having speci®cinterest in accumulating the data. A primary sourcewas the California Department of Motor Vehicles
(CDMV), responsible for licensing the vehicles thattravel within the state. The major record is containedin the annual report on `Estimated Fee-Paid Vehicle
Registrations by County'. Data were provided byCDMV from 1980 to 1997 for vehicle categories ofautomobiles, trucks, trailers, and motorcycles. As a®nancial report, the annual data also list in addition to
Fig. 2. Historic population of California (from US census
data).
Fig. 3. Forecast population data from 1996 to 2020 (from
Caltrans [2]).
Table 1
California populationa
Year California (106) United States (106) Fraction (%)
1940 6.907 132.165 5.23
1950 10.586 151.326 6.70
1960 15.717 179.323 8.76
1970 19.971 203.302 9.82
1980 23.668 226.542 10.45
1990 29.760 248.710 11.97
a Source: http://www.census.gov/population/censusdata
(1998).
P. Kruger / International Journal of Hydrogen Energy 25 (2000) 395±405398
the data for all counties in the state, vehicles with feespaid as `out-of-state' registrations and vehicles based
in other states which pay fees to operate in California.A second source of data from CDMV was the `Statisti-cal Record on Motive Power, Body Type and Weight
Division, for Automobiles, Motorcycles, CommercialTrucks and Trailers'. The data summarized for ®le sta-tus of 28 February 1998 [3] characterizes the regis-
tration data by many body types identi®ed by codeletter and description. The report does not includeregistrations of mobile homes (body type CCHMP)
which are performed by the California Department ofHousing and Community Development.Another major source of vehicle ¯eet data was the
California Department of Transportation (Caltrans).
The report California Motor Vehicle Stock, Travel andFuel Forecast [2] provides forecasts from 1996 to 2020for California population and a�uence factors, as well
as vehicle data and mean annual travel and fuel econ-omy. The vehicle data were summarized by the fourapplication types for the model vehicle types. The
report also provided data for annual travel (in 109 ve-hicle miles travel), mean ¯eet vehicle fuel consumption(in gal/year), and mean ¯eet fuel economy (in mi/gal).
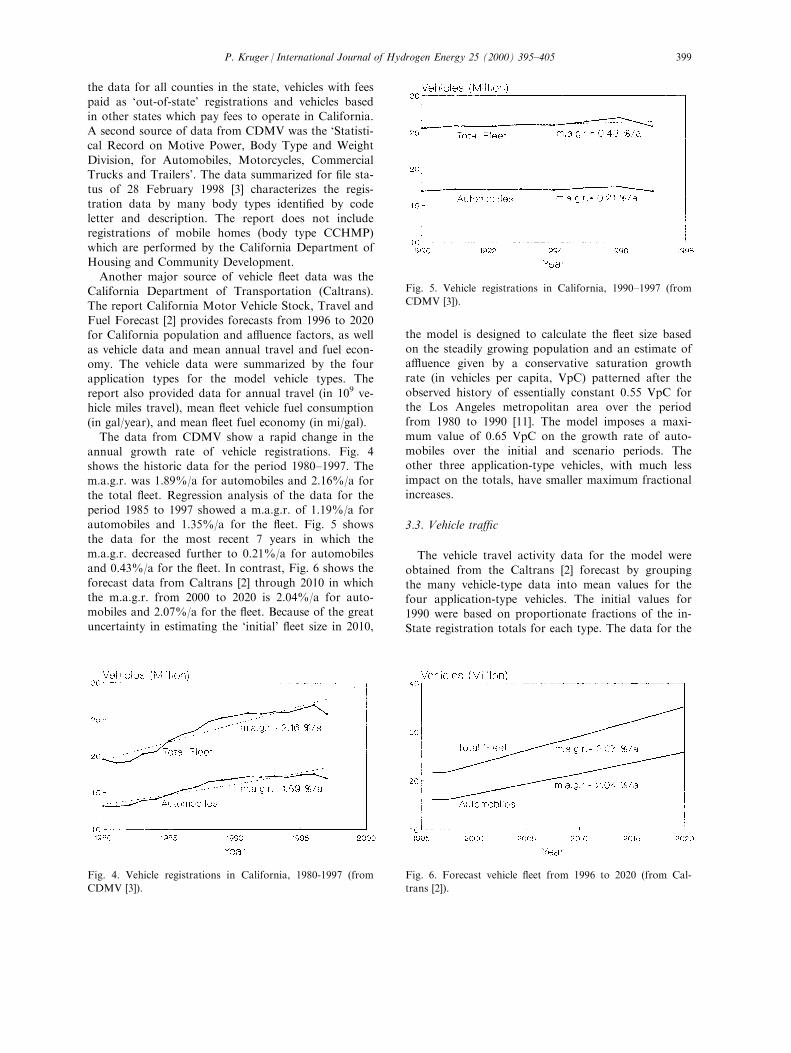
The data from CDMV show a rapid change in theannual growth rate of vehicle registrations. Fig. 4shows the historic data for the period 1980±1997. Them.a.g.r. was 1.89%/a for automobiles and 2.16%/a for
the total ¯eet. Regression analysis of the data for theperiod 1985 to 1997 showed a m.a.g.r. of 1.19%/a forautomobiles and 1.35%/a for the ¯eet. Fig. 5 shows
the data for the most recent 7 years in which them.a.g.r. decreased further to 0.21%/a for automobilesand 0.43%/a for the ¯eet. In contrast, Fig. 6 shows the
forecast data from Caltrans [2] through 2010 in whichthe m.a.g.r. from 2000 to 2020 is 2.04%/a for auto-mobiles and 2.07%/a for the ¯eet. Because of the greatuncertainty in estimating the `initial' ¯eet size in 2010,
the model is designed to calculate the ¯eet size basedon the steadily growing population and an estimate ofa�uence given by a conservative saturation growthrate (in vehicles per capita, VpC) patterned after the
observed history of essentially constant 0.55 VpC forthe Los Angeles metropolitan area over the periodfrom 1980 to 1990 [11]. The model imposes a maxi-
mum value of 0.65 VpC on the growth rate of auto-mobiles over the initial and scenario periods. Theother three application-type vehicles, with much less
impact on the totals, have smaller maximum fractionalincreases.
3.3. Vehicle tra�c
The vehicle travel activity data for the model were
obtained from the Caltrans [2] forecast by groupingthe many vehicle-type data into mean values for thefour application-type vehicles. The initial values for1990 were based on proportionate fractions of the in-
State registration totals for each type. The data for the
Fig. 5. Vehicle registrations in California, 1990±1997 (from
CDMV [3]).
Fig. 6. Forecast vehicle ¯eet from 1996 to 2020 (from Cal-
trans [2]).
Fig. 4. Vehicle registrations in California, 1980-1997 (from
CDMV [3]).
P. Kruger / International Journal of Hydrogen Energy 25 (2000) 395±405 399
total ¯eet were compiled from their forecast data ontotal statewide vehicle miles traveled, vehicle fuel con-
sumption, and vehicle fuel economy.
3.3.1. Vehicle miles traveledThe forecast data for vehicle miles traveled on Cali-
fornia roads were given annually by Caltrans [2] for1996±2020 based on estimated vehicle sales and on-road vehicle ¯eet fuel economy. The forecast annual
increments ranged from 3.6% in 1998 decreasing to1.9% by 2020. The annual VMT data were summar-ized for air quality conformity analysis purposes in 5-year increments from 1990 to 2020. These data, given
in Table 2, were used for graphic input to the modelthrough 2010 with the initial value for 1990.
3.3.2. Vehicle fuel consumption
Statewide fuel consumption represents total gasolineand diesel fuel used on all public roads. The value for1996 was 15.2 billion gallons and is expected toincrease for autos and all types of trucks, but with
slowly decreasing annual percentage changes. The totalfuel consumption for the four application type vehiclescan be estimated in the model, but the vehicle tra�c
component requires only the vehicle miles traveled andthe fuel economy data.
3.3.3. Vehicle fuel economyForecast fuel economy was made in Caltrans [2]
with explicit assumptions on the fuel economy of newvehicles entering the ¯eet each year using CDMV ve-hicle population pro®les and the EPA gas mileage
guides. Motorcycles were maintained at a constantvalue of 50 mpg. The data were compiled as harmonicaverage fuel economy by weighting the number of ve-
hicles by stratum and by the annual miles of traveland fuel economy of the stratum. The value for thetotal ¯eet for 1996 was 18.34 mpg and is expected toimprove steadily through the forecast period on the
assumption that new car ¯eet fuel economy will remainat 27.5 mpg while replacing older and lower fuel e�-ciency vehicles. These data were used in the model by
a graphic input curve based on linear regression of the
data through 2010 and extrapolated back annually to
1990 for the initial value.
3.4. Electrolyser energy consumption
The overall electric energy consumption in future
electrolysis plants for large-scale industrial production
of hydrogen becomes a major economic parameter for
its success as a replacement for gasoline. Energy con-
sumption, in turn, depends upon many design par-
ameters, such as cell size and voltage, current density,
and process temperature. Several processes are avail-
able for water electrolysis ranging from established al-
kaline (AWE) systems to developing advanced
methods, such as inorganic membrane (IME), solid
polymer (SPE), and high-temperature (HTE) electroly-
ser systems. A review of these processes is given by
Dutta [8].
For estimation of future electric energy demand, two
energy consumption values are needed: (1) an initial
value for the mean energy consumption in current-
technology electrolyser equipment designed for large-
scale installations; and (2) a basis for extrapolating the
value from technology improvements in the future.
Data for selecting these values in the model were com-
piled from several sources, including literature refer-
ences and direct communications with electrolyser
manufacturers. A summary of the data is given in
Table 3.
The Fluor Daniel Inc. [9] report to the Bonneville
Power Administration provided a range of current
values for alkaline and other electrolyser technologies.
In their design system for a 100 MW plant producing
21,788 Nm3/h, the energy consumption value was 4.4
kWh/Nm3. The Norsk Hydro data (A. Cloumann, pri-
vate communication, 1998) was based on the paper by
Cloumann et al. [7] for a 265 MW plant producing 396
million Nm3/yr. The value of 4.9 kWh/Nm3 was noted
to be for a high current density system which provides
a lower energy unit cost. The Teledyne Brown Engin-
eering data (C. Williams, private communication,
1998) was for their HP size hydrogen generating plant.
The data from Stuart Energy Systems Inc. (W. Cutler,
private communication, 1998) was based on their
report to the Ford Motor Company, `FCV Fuel
Supply Infrastructure: The Electrolysis Option', which
examined a central electrolysis plant producing 38 tons
of hydrogen per day. A value of 4.5 kWh/Nm 3 was
obtained from earlier data of Stuart and Fairlie [16]
based on a 100 MW-size plant producing 2 metric tons
of hydrogen per hour. For the model, input data was
provided as a graphic function in time with a linear
gradient of the model values listed in Table 3.
Table 2
Total statewide travel distancea
Year Travel distance (109 VMT)
1990 259.0
1995 277.0
2000 314.9
2005 358.5
2010 399.7
a Source: Caltrans [2].
P. Kruger / International Journal of Hydrogen Energy 25 (2000) 395±405400
3.5. Electricity supply
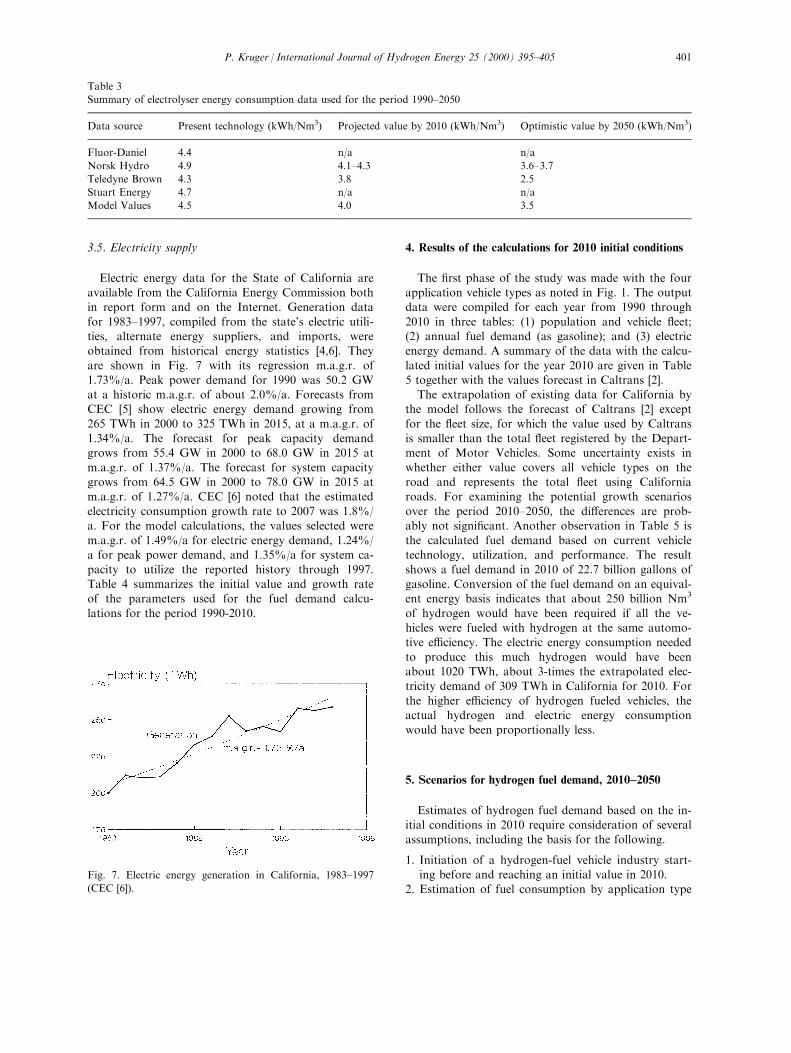
Electric energy data for the State of California areavailable from the California Energy Commission bothin report form and on the Internet. Generation data
for 1983±1997, compiled from the state's electric utili-ties, alternate energy suppliers, and imports, wereobtained from historical energy statistics [4,6]. They
are shown in Fig. 7 with its regression m.a.g.r. of1.73%/a. Peak power demand for 1990 was 50.2 GWat a historic m.a.g.r. of about 2.0%/a. Forecasts fromCEC [5] show electric energy demand growing from
265 TWh in 2000 to 325 TWh in 2015, at a m.a.g.r. of1.34%/a. The forecast for peak capacity demandgrows from 55.4 GW in 2000 to 68.0 GW in 2015 at
m.a.g.r. of 1.37%/a. The forecast for system capacitygrows from 64.5 GW in 2000 to 78.0 GW in 2015 atm.a.g.r. of 1.27%/a. CEC [6] noted that the estimated
electricity consumption growth rate to 2007 was 1.8%/a. For the model calculations, the values selected werem.a.g.r. of 1.49%/a for electric energy demand, 1.24%/a for peak power demand, and 1.35%/a for system ca-
pacity to utilize the reported history through 1997.Table 4 summarizes the initial value and growth rateof the parameters used for the fuel demand calcu-
lations for the period 1990-2010.
4. Results of the calculations for 2010 initial conditions
The ®rst phase of the study was made with the fourapplication vehicle types as noted in Fig. 1. The outputdata were compiled for each year from 1990 through
2010 in three tables: (1) population and vehicle ¯eet;(2) annual fuel demand (as gasoline); and (3) electricenergy demand. A summary of the data with the calcu-
lated initial values for the year 2010 are given in Table5 together with the values forecast in Caltrans [2].The extrapolation of existing data for California by
the model follows the forecast of Caltrans [2] except
for the ¯eet size, for which the value used by Caltransis smaller than the total ¯eet registered by the Depart-ment of Motor Vehicles. Some uncertainty exists in
whether either value covers all vehicle types on theroad and represents the total ¯eet using Californiaroads. For examining the potential growth scenarios
over the period 2010±2050, the di�erences are prob-ably not signi®cant. Another observation in Table 5 isthe calculated fuel demand based on current vehicletechnology, utilization, and performance. The result
shows a fuel demand in 2010 of 22.7 billion gallons ofgasoline. Conversion of the fuel demand on an equival-ent energy basis indicates that about 250 billion Nm3
of hydrogen would have been required if all the ve-hicles were fueled with hydrogen at the same automo-tive e�ciency. The electric energy consumption needed
to produce this much hydrogen would have beenabout 1020 TWh, about 3-times the extrapolated elec-tricity demand of 309 TWh in California for 2010. For
the higher e�ciency of hydrogen fueled vehicles, theactual hydrogen and electric energy consumptionwould have been proportionally less.
5. Scenarios for hydrogen fuel demand, 2010±2050
Estimates of hydrogen fuel demand based on the in-itial conditions in 2010 require consideration of severalassumptions, including the basis for the following.
1. Initiation of a hydrogen-fuel vehicle industry start-ing before and reaching an initial value in 2010.
2. Estimation of fuel consumption by application type
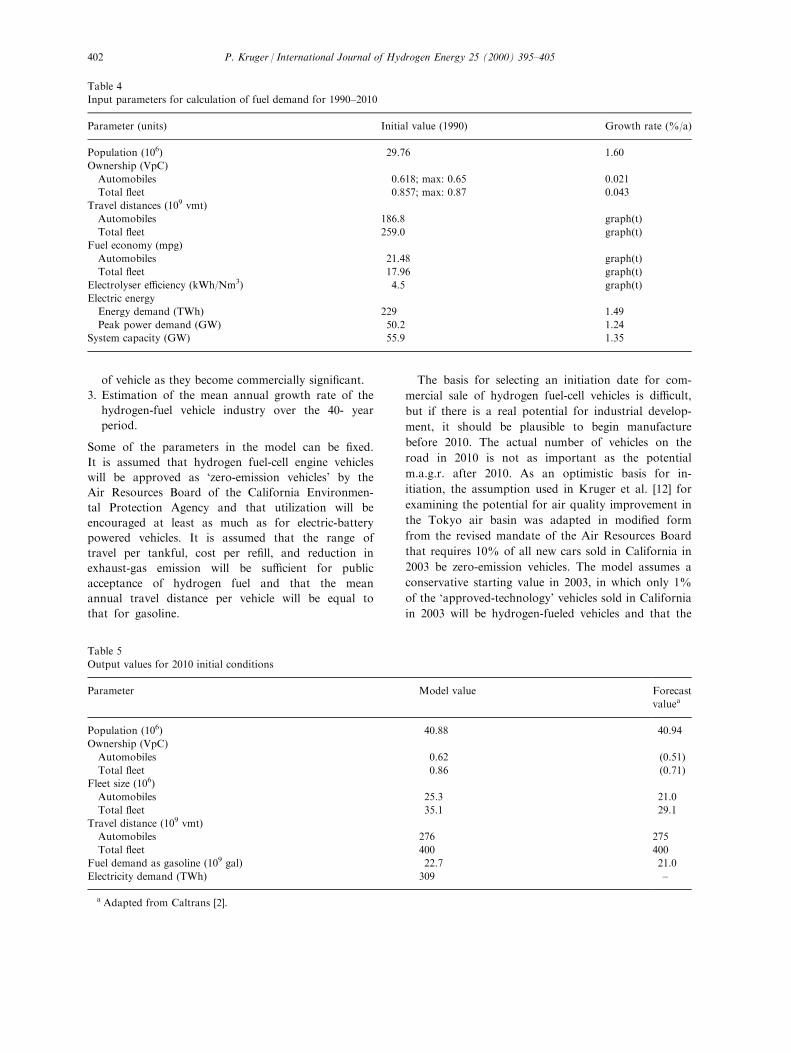
Table 3
Summary of electrolyser energy consumption data used for the period 1990±2050
Data source Present technology (kWh/Nm3) Projected value by 2010 (kWh/Nm3) Optimistic value by 2050 (kWh/Nm3)
Fluor-Daniel 4.4 n/a n/a
Norsk Hydro 4.9 4.1±4.3 3.6±3.7
Teledyne Brown 4.3 3.8 2.5
Stuart Energy 4.7 n/a n/a
Model Values 4.5 4.0 3.5
Fig. 7. Electric energy generation in California, 1983±1997
(CEC [6]).
P. Kruger / International Journal of Hydrogen Energy 25 (2000) 395±405 401
of vehicle as they become commercially signi®cant.
3. Estimation of the mean annual growth rate of the
hydrogen-fuel vehicle industry over the 40- year
period.
Some of the parameters in the model can be ®xed.
It is assumed that hydrogen fuel-cell engine vehicles
will be approved as `zero-emission vehicles' by the
Air Resources Board of the California Environmen-
tal Protection Agency and that utilization will be
encouraged at least as much as for electric-battery
powered vehicles. It is assumed that the range of
travel per tankful, cost per re®ll, and reduction in
exhaust-gas emission will be su�cient for public
acceptance of hydrogen fuel and that the mean
annual travel distance per vehicle will be equal to
that for gasoline.
The basis for selecting an initiation date for com-
mercial sale of hydrogen fuel-cell vehicles is di�cult,
but if there is a real potential for industrial develop-
ment, it should be plausible to begin manufacture
before 2010. The actual number of vehicles on the
road in 2010 is not as important as the potential
m.a.g.r. after 2010. As an optimistic basis for in-
itiation, the assumption used in Kruger et al. [12] for
examining the potential for air quality improvement in
the Tokyo air basin was adapted in modi®ed form
from the revised mandate of the Air Resources Board
that requires 10% of all new cars sold in California in
2003 be zero-emission vehicles. The model assumes a
conservative starting value in 2003, in which only 1%
of the `approved-technology' vehicles sold in California
in 2003 will be hydrogen-fueled vehicles and that the
Table 4
Input parameters for calculation of fuel demand for 1990±2010
Parameter (units) Initial value (1990) Growth rate (%/a)
Population (106) 29.76 1.60
Ownership (VpC)
Automobiles 0.618; max: 0.65 0.021
Total ¯eet 0.857; max: 0.87 0.043
Travel distances (109 vmt)
Automobiles 186.8 graph(t)
Total ¯eet 259.0 graph(t)
Fuel economy (mpg)
Automobiles 21.48 graph(t)
Total ¯eet 17.96 graph(t)
Electrolyser e�ciency (kWh/Nm3) 4.5 graph(t)
Electric energy
Energy demand (TWh) 229 1.49
Peak power demand (GW) 50.2 1.24
System capacity (GW) 55.9 1.35
Table 5
Output values for 2010 initial conditions
Parameter Model value Forecast
valuea
Population (106) 40.88 40.94
Ownership (VpC)
Automobiles 0.62 (0.51)
Total ¯eet 0.86 (0.71)
Fleet size (106)
Automobiles 25.3 21.0
Total ¯eet 35.1 29.1
Travel distance (109 vmt)
Automobiles 276 275
Total ¯eet 400 400
Fuel demand as gasoline (109 gal) 22.7 21.0
Electricity demand (TWh) 309 ±
a Adapted from Caltrans [2].
P. Kruger / International Journal of Hydrogen Energy 25 (2000) 395±405402
production growth rate will be a modest 10%/a
through 2010.
The second assumption, estimation of fuel economy,
was based on two considerations: (1) fuel economy is a
function of loaded weight; and (2) literature values of
expected fuel economy are adequate for scenario
analysis. To simplify the model calculations based on
sparse literature data for various application types of
vehicle, two application types were used in the second
phase of the model: automobiles and heavy-duty ve-
hicles. The fuel economy used for automobiles was 80
mpg, based on several studies, e.g. Ogden [15] (74
mpg), Berry [1] (95 mpg equivalent to GM EVI, and
re-estimated as 80 mpg for ®ve passenger loading). The
latter notes the announcement of Ford Motor Com-
pany (5 January 1996) of the Synergy 2010 concept
that the circa-2010 family car will triple the fuel e�-
ciency of a typical family car, which for the Caltrans
[2] assumption that new car ¯eet fuel economy will
remain at 27.5 mpg corresponds to a value of 82 mpg.
The fuel economy for the heavy-duty vehicles were
proportionally weighted for the 2010 calculated auto-
mobile and total ¯eet fuel economies as 40 mpg.
The third assumption is that the mean annual
growth rate for the period 2010±2050 cannot be
assumed for a technology yet commercially unproven.
Instead, the approach used in Kruger et al. [12] of
examining a range of potential growth rates was
adopted. A new industrial enterprise is considered suc-cessful if the m.a.g.r. exceeds a minimum of about10%/a and few enterprises have grown steadily at a
rate exceeding 40%/a. One notable exception was thehistory of the Ford Motor Company (private com-munication, 1996) in mass-producing automobiles at a
m.a.g.r. of 41%/a from startup in 1903 to the begin-ning of WW-I. The scenario analysis covers the rangeof m.a.g.r. from 10%/a to 40%/a, but adjusted to
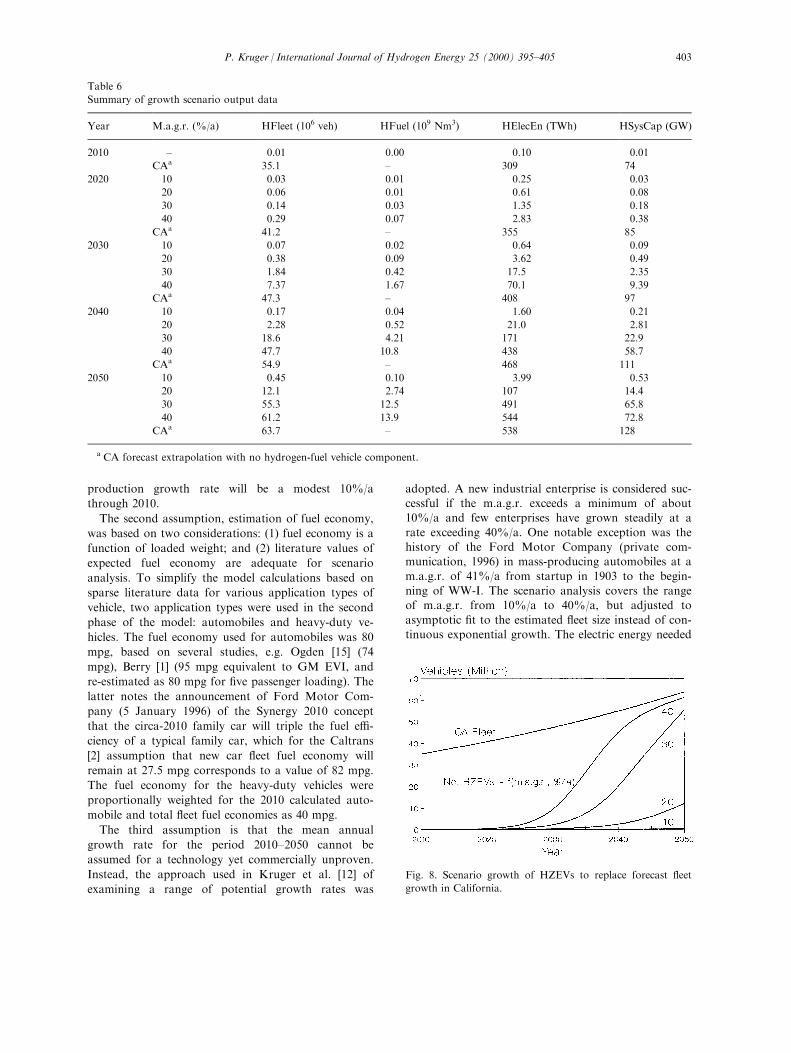
asymptotic ®t to the estimated ¯eet size instead of con-tinuous exponential growth. The electric energy needed
Fig. 8. Scenario growth of HZEVs to replace forecast ¯eet
growth in California.
Table 6
Summary of growth scenario output data
Year M.a.g.r. (%/a) HFleet (106 veh) HFuel (109 Nm3) HElecEn (TWh) HSysCap (GW)
2010 ± 0.01 0.00 0.10 0.01
CAa 35.1 ± 309 74
2020 10 0.03 0.01 0.25 0.03
20 0.06 0.01 0.61 0.08
30 0.14 0.03 1.35 0.18
40 0.29 0.07 2.83 0.38
CAa 41.2 ± 355 85
2030 10 0.07 0.02 0.64 0.09
20 0.38 0.09 3.62 0.49
30 1.84 0.42 17.5 2.35
40 7.37 1.67 70.1 9.39
CAa 47.3 ± 408 97
2040 10 0.17 0.04 1.60 0.21
20 2.28 0.52 21.0 2.81
30 18.6 4.21 171 22.9
40 47.7 10.8 438 58.7
CAa 54.9 ± 468 111
2050 10 0.45 0.10 3.99 0.53
20 12.1 2.74 107 14.4
30 55.3 12.5 491 65.8
40 61.2 13.9 544 72.8
CAa 63.7 ± 538 128
a CA forecast extrapolation with no hydrogen-fuel vehicle component.
P. Kruger / International Journal of Hydrogen Energy 25 (2000) 395±405 403
for producing the hydrogen at these growth rates wasadded to the extrapolated electric energy load. For the
scenario analysis, the 2010 initial number of `autos'(light vehicles) at 11,000 mi/yr and `trucks' (heavy ve-hicles) at 12,600 mi/yr were 5000 each (1% of new cars
in 2003). Although this initial number of vehicles for2010 is arbitrary, the output of the model can be line-arly scaled for any other given initial value of either
class of vehicle.
6. Results of the calculations for 2010±2050
The second phase of the study was made for thelight and heavy classes of vehicles with scenario vehicleproduction growth rates of 10±40%/a for the assumed
initial value of 5000 of each class from 2010 to 2050.The output data were compiled at each ®ve years intables of hydrogen vehicle ¯eet fuel consumption and
electric energy (and power) requirement in contrast tothe forecast growth in statewide electric energy (andsystem power capacity) expectations. A summary ofthe key values is given in Table 6. The comparison of
scenario growth of hydrogen fuel vehicles in relationto forecast growth of the California vehicle ¯eet isshown in Fig. 8. Even with one percent of the 10% in-
itiation of alternate fuel zero-emission vehicles in 2003,the relative contribution of hydrogen ZEVs will bequite small at any production growth rate until about
2025±2030 when the number of HZEVs become a sig-ni®cant portion of the total ¯eet. At a m.a.g.r. of20%/a, the number of HZEVs would represent about
23% of the total ¯eet in 2050. For m.a.g.r. above25%/a beyond 2030, the data show the diminishinggrowth rates needed to replace the entire forecast ¯eetsize with HZEVs. Table 6 shows the corresponding
rapid escalation of hydrogen production facilitiesneeded to provide the fuel for these HZEVs Even iflong-distance automobile travel is not yet feasible due
to limited distribution of hydrogen fuel, the growth ofhydrogen fuel production facilities would still beneeded for the centrally-fueled application HZEVs; in
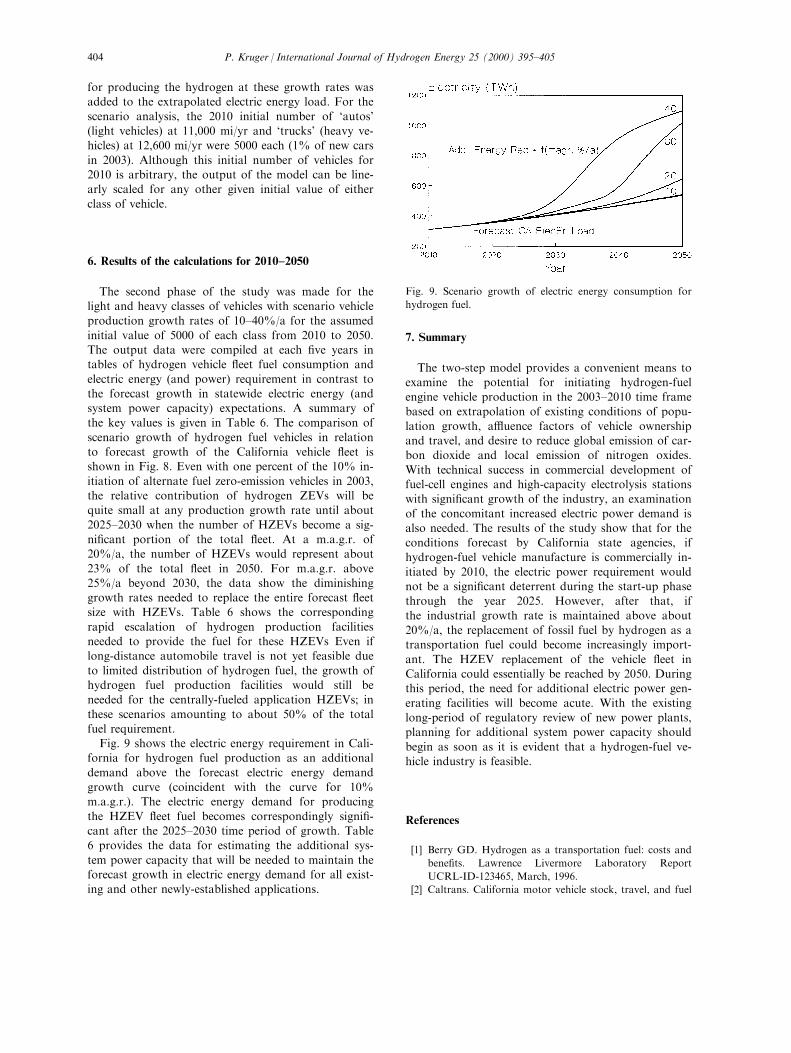
these scenarios amounting to about 50% of the totalfuel requirement.Fig. 9 shows the electric energy requirement in Cali-
fornia for hydrogen fuel production as an additional
demand above the forecast electric energy demandgrowth curve (coincident with the curve for 10%m.a.g.r.). The electric energy demand for producing
the HZEV ¯eet fuel becomes correspondingly signi®-cant after the 2025±2030 time period of growth. Table6 provides the data for estimating the additional sys-
tem power capacity that will be needed to maintain theforecast growth in electric energy demand for all exist-ing and other newly-established applications.
7. Summary
The two-step model provides a convenient means toexamine the potential for initiating hydrogen-fuelengine vehicle production in the 2003±2010 time frame
based on extrapolation of existing conditions of popu-lation growth, a�uence factors of vehicle ownershipand travel, and desire to reduce global emission of car-bon dioxide and local emission of nitrogen oxides.
With technical success in commercial development offuel-cell engines and high-capacity electrolysis stationswith signi®cant growth of the industry, an examination
of the concomitant increased electric power demand isalso needed. The results of the study show that for theconditions forecast by California state agencies, if
hydrogen-fuel vehicle manufacture is commercially in-itiated by 2010, the electric power requirement wouldnot be a signi®cant deterrent during the start-up phasethrough the year 2025. However, after that, if
the industrial growth rate is maintained above about20%/a, the replacement of fossil fuel by hydrogen as atransportation fuel could become increasingly import-
ant. The HZEV replacement of the vehicle ¯eet inCalifornia could essentially be reached by 2050. Duringthis period, the need for additional electric power gen-
erating facilities will become acute. With the existinglong-period of regulatory review of new power plants,planning for additional system power capacity should
begin as soon as it is evident that a hydrogen-fuel ve-hicle industry is feasible.
References
[1] Berry GD. Hydrogen as a transportation fuel: costs and
bene®ts. Lawrence Livermore Laboratory Report
UCRL-ID-123465, March, 1996.
[2] Caltrans. California motor vehicle stock, travel, and fuel
Fig. 9. Scenario growth of electric energy consumption for
hydrogen fuel.
P. Kruger / International Journal of Hydrogen Energy 25 (2000) 395±405404
forecast. California Department of Transportation,
November, 1997.
[3] CDMV. Statistical record on motive power, body type
and weight division for automobiles, motorcycles, com-
mercial trucks and trailers. California Department of
Motor Vehicles, February, 1998.
[4] CEC. California historical energy statistics, Report No.
P300-95-020. California Energy Commission,
Sacramento, CA, December, 1995.
[5] CEC. 1996 Electricity report, Report No. P300-97-001.
California Energy Commission, Sacramento, CA,
November, 1997.
[6] CEC. 1998 Baseline energy outlook, Report No. P300-
98-012. California Energy Commission, Sacramento, CA,
August, 1998.
[7] Cloumann A, d'Erasmo P, Nielson M, Halvorsen BG,
Stevens P. Analysis and optimisation of equipment cost
to minimise operation and investment for a 300 MW
electrolysis plant. In: Proceedings of the Eleventh World
Hydrogen Energy Conference, International Association
for Hydrogen Energy, Stuttgart, Germany, June, 1996. p.
143±52.
[8] Dutta S. Technology assessment of advanced electrolytic
hydrogen production. Intl J Hydrogen Energy
1990;15(6):379±86.
[9] Fluor Daniel Inc. Paci®c northwest hydrogen feasibility
study, Report to Bonneville Power Administration. US
Department of Energy, Portland, OR, March, 1991.
[10] Hannon B, Ruth M. Dynamic modeling. New York:
Springer-Verlag, 1994.
[11] Kruger P. Comparison of potential for air quality
improvement from hydrogen fuel in three metropolitan
air basins. In: Proceedings of the Eleventh World
Hydrogen Energy Conference, International Association
for Hydrogen Energy, Stuttgart, Germany, June, 1996. p.
361±6.
[12] Kruger P, Murdock M, Hirai T, Okano K. Potential for
air quality improvement in the Tokyo metropolitan area
from use of hydrogen fuel. In: Proceedings of the Twelth
World Hydrogen Energy Conference, International
Association for Hydrogen Energy, Buenos Aires,
Argentina, June, 1998. p. 33±43.
[13] IAHE. Hydrogen energy progress XI. In: Proceedings of
the Twelth World Hydrogen Energy Conference, Buenos
Aires, Argentina, June 1998, 1998.
[14] NHA. Implementing a global energy solution. In:
Proceedings of the Ninth Annual US Hydrogen Meeting,
Vienna, VA, March.
[15] Ogden JM. Renewable hydrogen energy system studies.
In: Proceedings of the Hydrogen Program Review
Meeting, Honolulu, HI, May, 1994.
[16] Stuart ATB, Fairlie MJ. Integrated electrolysis: a utility
springboard for sustainable development. In: Proceedings
of the Twentyninth Intersociety Energy Conversion
Engineering Conference, Monterey, CA, August, 1994.
P. Kruger / International Journal of Hydrogen Energy 25 (2000) 395±405 405