Embed Size (px)
Citation preview
ELECTRIC POWER BOARD OF THE METROPOLITAN GOVERNMENT OF NASHVILLE AND DAVIDSON COUNTY
FINANCIAL STATEMENTS FOR THE YEARS ENDED JUNE 30, 2012 AND 2011
ELECTRIC POWER BOARD OF THE METROPOLITAN GOVERNMENT OF NASHVILLE AND DAVIDSON COUNTY TABLE OF CONTENTS
Page
SCHEDULE OF EXECUTIVE MANAGEMENT AND BOARD MEMBERS 1
INDEPENDENT AUDITORS’ REPORTS 2 - 3
MANAGEMENT’S DISCUSSION AND ANALYSIS 4 - 13
FINANCIAL STATEMENTS FOR THE YEARS ENDED JUNE 30, 2012 AND 2011:
Statements of Net Assets 14 - 15
Statements of Revenues, Expenses and Changes in Net Assets 16
Statements of Cash Flows 17 - 18
Notes to Financial Statements 19 - 36
SUPPLEMENTARY INFORMATION FOR THE YEAR ENDED JUNE 30, 2012:
Schedule of Insurance Coverage 38 - 39
Schedule of Utility Rates in Force 40 - 47
Schedule of Number of Customers 48
Schedule of Investments 49
Schedule of Long-Term Debt, Principal and Interest Sinking Fund Requirements by
Fiscal Year 50 - 52
Schedule of Expenditures of Federal Awards 53 - 54
INDEPENDENT AUDITORS’ REPORT ON INTERNAL CONTROL OVER FINANCIAL REPORTING AND ON COMPLIANCE AND OTHER MATTERS BASED ON AN AUDIT OF FINANCIAL STATEMENTS PERFORMED IN ACCORDANCE WITH GOVERNMENT AUDITING STANDARDS 55 - 56 INDEPENDENT AUDITORS’ REPORT ON COMPLIANCE WITH
REQUIREMENTS THAT COULD HAVE A DIRECT AND MATERIAL EFFECT ON THE MAJOR PROGRAM AND ON INTERNAL CONTROL OVER COMPLIANCE IN ACCORDANCE WITH OMB CIRCULAR A-133 57 - 58
SCHEDULE OF FINDINGS AND QUESTIONED COSTS 59 - 61

INDEPENDENT AUDITORS’ REPORT Electric Power Board of the Metropolitan Government of Nashville and Davidson County Nashville, Tennessee We have audited the accompanying statements of net assets of the Electric Power Board of the Metropolitan Government of Nashville and Davidson County (the “Electric Power Board”), a component unit of the Metropolitan Government of Nashville and Davidson County, Tennessee, as of June 30, 2012 and 2011 and the related statements of revenues, expenses and changes in net assets and of cash flows for the years then ended. These financial statements are the responsibility of the Electric Power Board’s management. Our responsibility is to express an opinion on these financial statements based on our audits. We conducted our audits in accordance with auditing standards generally accepted in the United States of America and the standards applicable to financial audits contained in Government Auditing Standards, issued by the Comptroller General of the United States. Those standards require that we plan and perform the audit to obtain reasonable assurance about whether the financial statements are free of material misstatement. An audit includes consideration of internal control over financial reporting as a basis for designing audit procedures that are appropriate in the circumstances, but not for the purpose of expressing an opinion on the effectiveness of the Electric Power Board’s internal control over financial reporting. Accordingly, we express no such opinion. An audit includes examining, on a test basis, evidence supporting the amounts and disclosures in the financial statements. An audit also includes assessing the accounting principles used and the significant estimates made by management, as well as evaluating the overall financial statement presentation. We believe that our audits provide a reasonable basis for our opinion. In our opinion, the financial statements referred to previously present fairly, in all material respects, the financial position of the Electric Power Board as of June 30, 2012 and 2011, and the changes in its net assets and its cash flows thereof for the years then ended in conformity with accounting principles generally accepted in the United States of America. In accordance with Government Auditing Standards, we have also issued our report dated October 31, 2012 on our consideration of the Electric Power Board’s internal control over financial reporting and on our tests of its compliance with certain provisions of laws, regulations, contracts, and grant agreements and other matters. The purpose of that report is to describe the scope of our testing of internal control over financial reporting and compliance and the results of that testing, and not to provide an opinion on internal control over financial reporting or on compliance. That report is an integral part of an audit performed in accordance with Government Auditing Standards and should be considered in assessing the results of our audit.
Deloitte & Touche LLP424 Church Street Suite 2400 Nashville, TN 37219 USA
Tel: +1 615 259 1800 www.deloitte.com
Member of Deloitte Touche Tohmatsu Limited
Accounting principles generally accepted in the United States of America require that the management’s discussion and analysis on pages 3-11 be presented to supplement the basic financial statements. Such information, although not a part of the basic financial statements, is required by the Governmental Accounting Standards Board who considers it to be an essential part of financial reporting for placing the basic financial statements in an appropriate operational, economic, or historical context. We have applied certain limited procedures to the required supplementary information in accordance with auditing standards generally accepted in the United States of America, which consisted of inquiries of management about the methods of preparing the information and comparing the information for consistency with management’s responses to our inquiries, the basic financial statements, and other knowledge we obtained during our audit of the basic financial statements. We do not express an opinion or provide any assurance on the information because the limited procedures do not provide us with sufficient evidence to express an opinion or provide any assurance. Our audit was conducted for the purpose of forming opinions on the financial statements that collectively comprise the Electric Power Board’s financial statements. The accompanying schedule of expenditures of federal awards, as required by Office of Management and Budget Circular A-133, Audits of States, Local Governments, and Non-Profit Organizations is presented for purposes of additional analysis and is not a required part of the financial statements. Such information is the responsibility of management and was derived from and relates directly to the underlying accounting and other records used to prepare the financial statements. The information has been subjected to the auditing procedures applied in the audit of the financial statements and certain additional procedures, including comparing and reconciling such information directly to the underlying accounting and other records used to prepare the financial statements or to the financial statements themselves, and other additional procedures in accordance with auditing standards generally accepted in the United States of America. In our opinion, the schedule of expenditures of federal awards is fairly stated in all material respects in relation to the financial statements as a whole. Our audit was conducted for the purpose of forming an opinion on the financial statements that collectively comprise the Electric Power Board’s basic 2012 financial statements. The schedule of executive management and Board members as listed in the table of contents and the supplementary information on pages 38-52 is presented for the purposes of additional analysis and is not a required part of the basic 2012 financial statements. Such information has not been subjected to the auditing procedures applied in the audit of the basic 2012 financial statements, and accordingly, we do not express an opinion or provide any assurance on it.
October 31, 2012
4
MANAGEMENT’S DISCUSSION AND ANALYSIS As financial management of the Electric Power Board of the Metropolitan Government of Nashville and Davidson County (the “Board”), we offer readers of these financial statements this narrative overview and analysis of the financial activities of the Board for the fiscal years ended June 30, 2012 and 2011 as compared to fiscal years 2011 and 2010, respectively. In conducting the operations of the electrical distribution system, the Board does business as Nashville Electric Service (“NES”). NES is a component unit of the Metropolitan Government of Nashville and Davidson County, Tennessee. This discussion and analysis is designed to assist the reader in focusing on the significant financial issues and activities and to identify any significant changes in financial position. We encourage readers to consider the information presented here in conjunction with the financial statements taken as a whole. Overview of the Financial Statements This discussion and analysis is intended to serve as an introduction to NES’ financial statements, which are comprised of the basic financial statements and the notes to the financial statements. Since NES is comprised of a single enterprise fund, no fund-level financial statements are shown. Basic Financial Statements The basic financial statements are designed to provide readers with a broad overview of NES’ finances in a manner similar to that of a private-sector business. The statements of net assets present information on all of NES’ assets and liabilities, with the difference between the two reported as net assets. Over time, increases or decreases in net assets may serve as a useful indicator of whether the financial position of NES is improving or deteriorating. Net assets increase when revenues exceed expenses. Increases to assets without a corresponding increase to liabilities results in increased net assets, which indicates an improved financial position. The statements of revenues, expenses and changes in net assets present information showing how NES’ net assets changed during the fiscal year. All changes in net assets are reported as soon as the underlying event occurs, regardless of timing of related cash flows. Thus, revenues and expenses are reported for some items that will only result in cash flows in future fiscal periods (e.g., earned but unused vacation leave). The statements of cash flows present changes in cash and cash equivalents resulting from operating, financing, and investing activities. These statements present cash receipts and cash disbursements information, without consideration as to the timing for the earnings event, when an obligation arises, or depreciation of capital assets.
Summary of Changes in Net Assets Assets exceeded liabilities by $575.9 million at June 30, 2012, and $530.7 million at June 30, 2011. This represents an increase of $45.2 million in 2012 and $28.9 million in 2011. The largest portion of the Board’s net assets reflects its investment in capital assets less any related debt used to acquire those assets that is still outstanding. The Board uses these capital assets to
MANAGEMENT’S DISCUSSION AND ANALYSIS (continued)
5
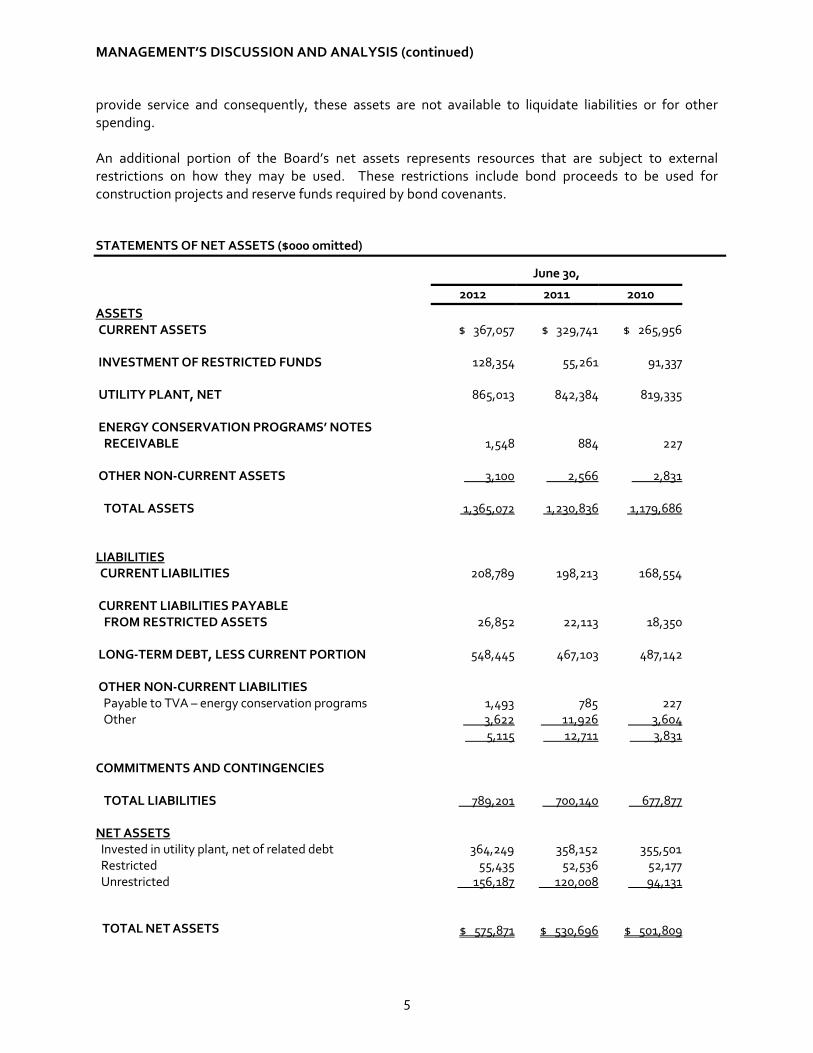
provide service and consequently, these assets are not available to liquidate liabilities or for other spending. An additional portion of the Board’s net assets represents resources that are subject to external restrictions on how they may be used. These restrictions include bond proceeds to be used for construction projects and reserve funds required by bond covenants.
STATEMENTS OF NET ASSETS ($000 omitted)
June 30,
2012 2011 2010ASSETS CURRENT ASSETS $ 367,057 $ 329,741 $ 265,956 INVESTMENT OF RESTRICTED FUNDS 128,354 55,261 91,337 UTILITY PLANT, NET 865,013 842,384 819,335 ENERGY CONSERVATION PROGRAMS’ NOTES RECEIVABLE 1,548 884 227 OTHER NON-CURRENT ASSETS 3,100 2,566 2,831
TOTAL ASSETS 1,365,072 1,230,836 1,179,686
LIABILITIES CURRENT LIABILITIES 208,789 198,213 168,554
CURRENT LIABILITIES PAYABLE FROM RESTRICTED ASSETS 26,852 22,113 18,350 LONG-TERM DEBT, LESS CURRENT PORTION 548,445 467,103 487,142 OTHER NON-CURRENT LIABILITIES Payable to TVA – energy conservation programs 1,493 785 227 Other 3,622 11,926 3,604
5,115 12,711 3,831
COMMITMENTS AND CONTINGENCIES
TOTAL LIABILITIES 789,201 700,140 677,877
NET ASSETS Invested in utility plant, net of related debt 364,249 358,152 355,501 Restricted 55,435 52,536 52,177 Unrestricted 156,187 120,008 94,131
TOTAL NET ASSETS $ 575,871 $ 530,696 $ 501,809
MANAGEMENT’S DISCUSSION AND ANALYSIS (continued)
6
Liquidity and Capital Resources
The Board has sufficient debt capacity and a strong financial position. Therefore, the tax-exempt bond market is expected to be a future source of liquidity to supplement the cash flow from operations. On November 4, 2011, the Board closed on the sale of the Metropolitan Government of Nashville and Davidson County, Tennessee, Electric System Revenue Bonds, 2011 Series A and B. The purpose of the 2011 Series A Bonds was to reimburse NES for a portion of the 2011 capital expenditures and to fund approximately 50 percent of NES’ projected $210.0 million Capital Budget for the fiscal years ending June 30, 2012, through June 30, 2014. The remainder will be funded with operating revenues. The par amount of the 2011 Series A Bonds, $100.9 million, plus original issue premium, less underwriter discount, cost of issuance, and a deposit to the debt service reserve fund netted proceeds in the amount of $110.6 million of which $105.0 million was deposited into the Special Construction Fund, $5.4 million in the Debt Service Reserve Fund and $246 thousand into the General Fund. During fiscal year 2012, NES drew down $35.0 million from these funds for capital expenditures. The remaining proceeds will be drawn down quarterly over the next two years. The 2011 Series B Bonds were being offered to refund $101.5 million aggregate principal amount of the 2001 Series A Bonds maturing on May 15, 2012 through 2026, and to refund $51.1 million aggregate principal amount of 2004 Series A Bonds maturing on May 15, 2018 through 2024. In addition to operating cash flow and proceeds from tax-exempt bonds, the Board has a $25 million line-of-credit, which is renewed each year. The credit facility is not a source of liquidity for ongoing operations. It is available as an additional funding source in the event of a natural catastrophe.
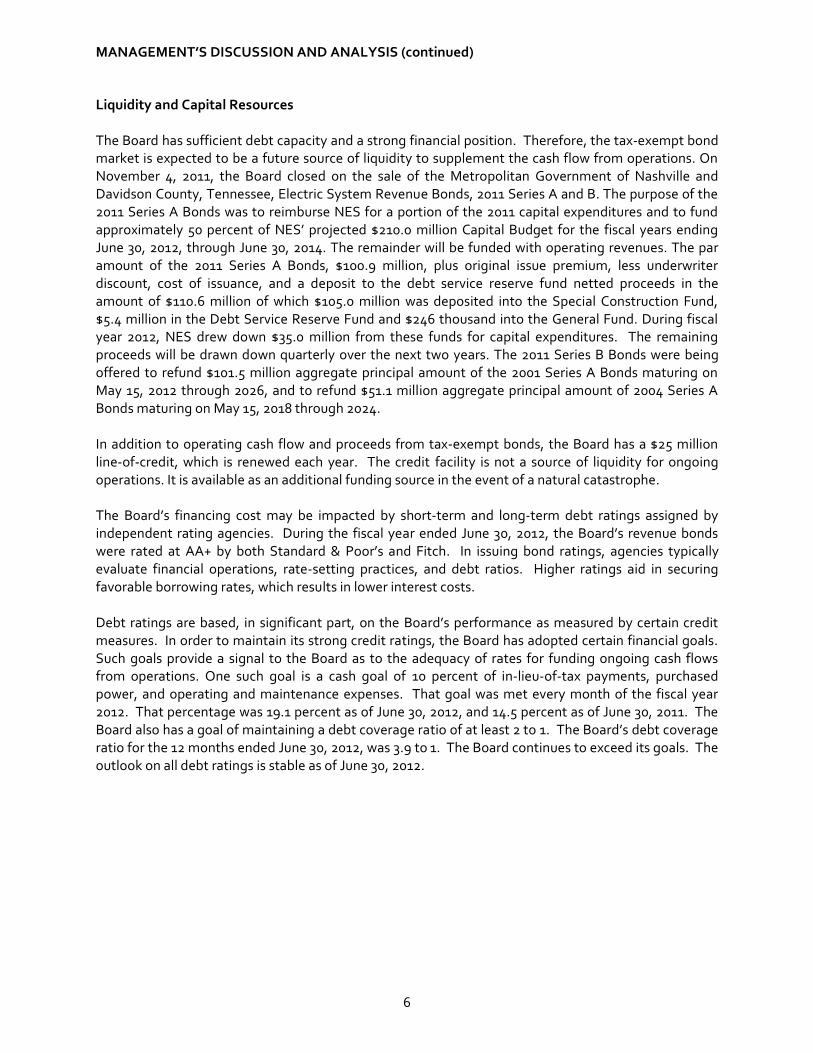
The Board’s financing cost may be impacted by short-term and long-term debt ratings assigned by independent rating agencies. During the fiscal year ended June 30, 2012, the Board’s revenue bonds were rated at AA+ by both Standard & Poor’s and Fitch. In issuing bond ratings, agencies typically evaluate financial operations, rate-setting practices, and debt ratios. Higher ratings aid in securing favorable borrowing rates, which results in lower interest costs. Debt ratings are based, in significant part, on the Board’s performance as measured by certain credit measures. In order to maintain its strong credit ratings, the Board has adopted certain financial goals. Such goals provide a signal to the Board as to the adequacy of rates for funding ongoing cash flows from operations. One such goal is a cash goal of 10 percent of in-lieu-of-tax payments, purchased power, and operating and maintenance expenses. That goal was met every month of the fiscal year 2012. That percentage was 19.1 percent as of June 30, 2012, and 14.5 percent as of June 30, 2011. The Board also has a goal of maintaining a debt coverage ratio of at least 2 to 1. The Board’s debt coverage ratio for the 12 months ended June 30, 2012, was 3.9 to 1. The Board continues to exceed its goals. The outlook on all debt ratings is stable as of June 30, 2012.
MANAGEMENT’S DISCUSSION AND ANALYSIS (continued)
7
Operations
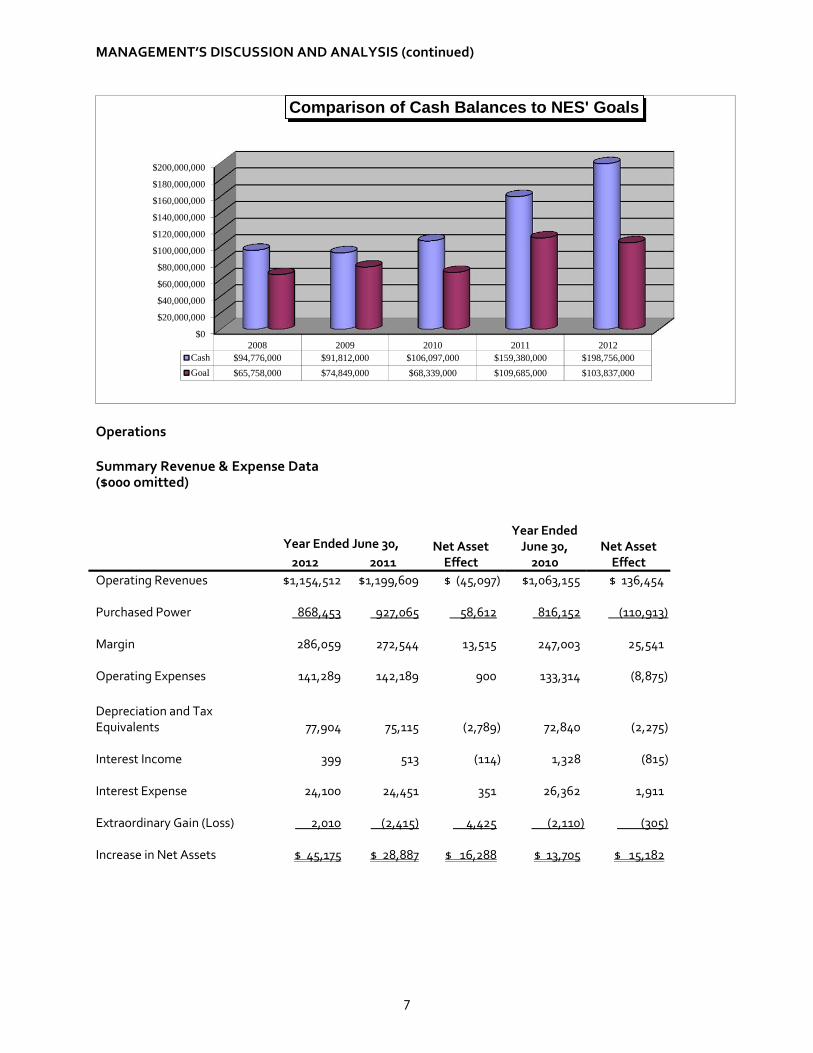
Summary Revenue & Expense Data ($000 omitted)
Year Ended June 30, Net AssetYear Ended
June 30, Net Asset 2012 2011 Effect 2010 Effect Operating Revenues $1,154,512 $1,199,609 $ (45,097) $1,063,155 $ 136,454
Purchased Power 868,453 927,065 58,612 816,152 (110,913)
Margin 286,059 272,544 13,515 247,003 25,541
Operating Expenses 141,289 142,189 900 133,314 (8,875)
Depreciation and Tax Equivalents 77,904 75,115 (2,789) 72,840 (2,275)
Interest Income 399 513 (114) 1,328 (815)
Interest Expense 24,100 24,451 351 26,362 1,911
Extraordinary Gain (Loss) 2,010 (2,415) 4,425 (2,110) (305)
Increase in Net Assets $ 45,175 $ 28,887 $ 16,288 $ 13,705 $ 15,182
$0
$20,000,000
$40,000,000
$60,000,000
$80,000,000
$100,000,000
$120,000,000
$140,000,000
$160,000,000
$180,000,000
$200,000,000
2008 2009 2010 2011 2012Cash $94,776,000 $91,812,000 $106,097,000 $159,380,000 $198,756,000Goal $65,758,000 $74,849,000 $68,339,000 $109,685,000 $103,837,000
Comparison of Cash Balances to NES' Goals
MANAGEMENT’S DISCUSSION AND ANALYSIS (continued)
8
2012 and 2011 Results of Operations
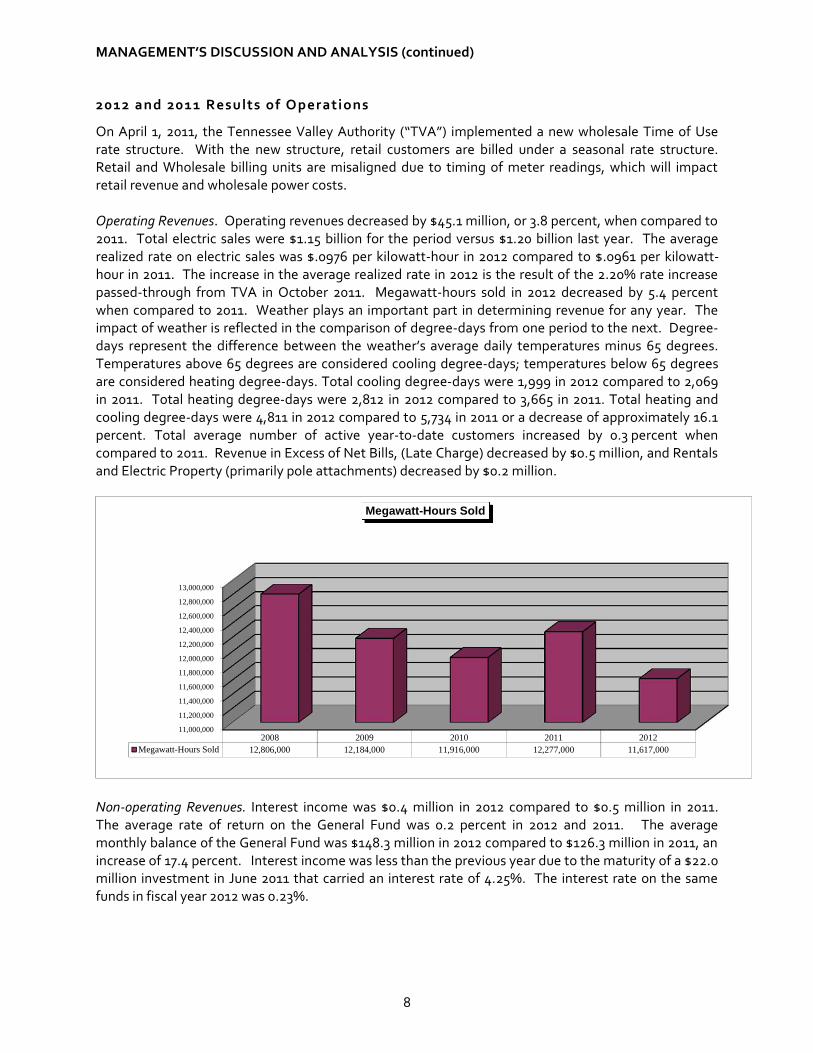
On April 1, 2011, the Tennessee Valley Authority (“TVA”) implemented a new wholesale Time of Use rate structure. With the new structure, retail customers are billed under a seasonal rate structure. Retail and Wholesale billing units are misaligned due to timing of meter readings, which will impact retail revenue and wholesale power costs. Operating Revenues. Operating revenues decreased by $45.1 million, or 3.8 percent, when compared to 2011. Total electric sales were $1.15 billion for the period versus $1.20 billion last year. The average realized rate on electric sales was $.0976 per kilowatt-hour in 2012 compared to $.0961 per kilowatt-hour in 2011. The increase in the average realized rate in 2012 is the result of the 2.20% rate increase passed-through from TVA in October 2011. Megawatt-hours sold in 2012 decreased by 5.4 percent when compared to 2011. Weather plays an important part in determining revenue for any year. The impact of weather is reflected in the comparison of degree-days from one period to the next. Degree-days represent the difference between the weather’s average daily temperatures minus 65 degrees. Temperatures above 65 degrees are considered cooling degree-days; temperatures below 65 degrees are considered heating degree-days. Total cooling degree-days were 1,999 in 2012 compared to 2,069 in 2011. Total heating degree-days were 2,812 in 2012 compared to 3,665 in 2011. Total heating and cooling degree-days were 4,811 in 2012 compared to 5,734 in 2011 or a decrease of approximately 16.1 percent. Total average number of active year-to-date customers increased by 0.3 percent when compared to 2011. Revenue in Excess of Net Bills, (Late Charge) decreased by $0.5 million, and Rentals and Electric Property (primarily pole attachments) decreased by $0.2 million.
Non-operating Revenues. Interest income was $0.4 million in 2012 compared to $0.5 million in 2011. The average rate of return on the General Fund was 0.2 percent in 2012 and 2011. The average monthly balance of the General Fund was $148.3 million in 2012 compared to $126.3 million in 2011, an increase of 17.4 percent. Interest income was less than the previous year due to the maturity of a $22.0 million investment in June 2011 that carried an interest rate of 4.25%. The interest rate on the same funds in fiscal year 2012 was 0.23%.
11,000,000
11,200,000
11,400,000
11,600,000
11,800,000
12,000,000
12,200,000
12,400,000
12,600,000
12,800,000
13,000,000
2008 2009 2010 2011 2012Megawatt-Hours Sold 12,806,000 12,184,000 11,916,000 12,277,000 11,617,000
Megawatt-Hours Sold
MANAGEMENT’S DISCUSSION AND ANALYSIS (continued)
9
Purchased Power and Operating Expenses. The Board purchases all of its power from TVA under an all-requirements contract that had an initial term of 20 years. Beginning on December 19, 1989, and on each subsequent anniversary thereafter, the contract is automatically extended for an additional one-year period. The contract is subject to earlier termination by either party on not less than 10 years’ prior written notice. Purchased power was $868.5 million for the period compared to $927.1 million in 2011. The average realized rate on purchased power was $.072 per kilowatt-hour in 2012 compared to $.070 per kilowatt-hour in 2011. This decrease is due to the pass-through of the Fuel Cost Adjustment (“FCA”) and the rate structure change in April 2011. In addition, TVA adjusted purchased power by $20.6 million in March 2012 due to an over-billing at the Old Hickory hydro substation. Megawatt-hours purchased were 12.1 million in 2012 compared to 13.2 million in 2011. Distribution expenses for the period were $49.2 million compared to $55.7 million last year. This is a decrease of $6.5 million or 11.7 percent. The change is primarily attributable to a decrease in storms, $7.6 million; operation and maintenance miscellaneous expense, $2.4 million; operation and maintenance of overhead lines, $1.9 million; and emergency service, $0.9 million, offset by increases in tree-trimming, $4.3 million; operation and maintenance supervision and engineering, $0.6 million; operation and maintenance of street light and signal system, $0.5 million; operation and maintenance of meters, $0.5 million; operation and maintenance of station equipment, $0.2 million; operation and maintenance mapping, $0.1 million; and private lights, $0.1 million.
Customer Accounts expense and Customer Service and Information expenses combined were $25.1 million for the period compared to $23.7 million last year or an increase of $1.4 million or 5.9 percent. This is primarily the result of an increase in customer orders and service expenses, $0.5 million; customer records and collection, $0.4 million; data processing, $0.2 million; customer assistance costs, $0.2 million; supervision, $0.1 million; and meter reading, $0.1 million.
Administrative and General (A&G) expenses were $67.0 million for the period compared to $62.8 million last year. This was an increase of $4.2 million or 6.7 percent. The increase is primarily the result of increases in employee and retirement benefits, $4.0 million; employees welfare, $0.7 million; maintenance of general plant, $0.4 million; data processing, $0.4 million; miscellaneous expense, $0.3 million; property insurance, $0.3 million, offset by decreases in injuries and damages, $1.2 million; office supplies and expenses, $0.4 million; and administrative and general salaries, $0.3 million. Depreciation and Tax Equivalents were $49.3 million and $28.6 million compared to $47.5 million and $27.6 million for 2012 and 2011, respectively. The increase in depreciation was the result of increased investment in the utility plant. Tax equivalents consist primarily of payments in–lieu-of taxes to the Metropolitan Government and the surrounding counties. Such payments are calculated based on a prescribed formula that takes into consideration utility plant value and the average of the Board’s last three years’ operating margin. The increase in payments in-lieu-of taxes was the result of increases in tax rates coupled with increased investment in the utility plant. Extraordinary Gain (Loss). In 2011, NES experienced an extraordinary loss due to extensive flooding that impacted the Nashville area in May of 2010. An event is deemed extraordinary if it is both unusual in nature and infrequent in occurrence. The extraordinary loss recognized in 2011 was $2.4 million. It was made up of $1.9 million in expenditures and a reduction to the prior year receivable of $0.5 million. NES received insurance recoveries in the current fiscal year in the amount of $2.0 million that resulted in an extraordinary gain from impairment loss on capital assets and other expenditures.
MANAGEMENT’S DISCUSSION AND ANALYSIS (continued)
10
2011 an d 2010 Result s of Operations
Operating Revenues. Operating revenues increased by $136.4 million, or 12.8 percent, when compared to 2010. Total electric sales were $1.2 billion in 2011 versus $1.0 billion in 2010. The average realized rate on electric sales was $.0961 per kilowatt-hour in 2011 compared to $.0877 per kilowatt-hour in 2010. The increase in average realized rates in 2011 is the impact of TVA rate adjustments for fuel costs and the rate structure change. Megawatt-hours sold in 2011 increased by 3.0 percent when compared to 2010. In October 2009, TVA increased wholesale rates by 9.0 percent, which increased retail rates by 7.2 percent. The wholesale rate increase and monthly FCA were implemented as a pass-through to our retail customers. Since the increase in wholesale rates and fluctuations in the wholesale FCA were matched by corresponding adjustments in retail rates, there was no significant impact on NES net income. In addition, NES increased retail rates in October 2009 by 3.0 percent which had a direct impact on NES net income. Weather plays an important part in determining revenue for any year. The impact of weather is reflected in the comparison of degree-days from one period to the next. Degree-days represent the difference between the weather’s average daily temperatures minus 65 degrees. Temperatures above 65 degrees are considered cooling degree-days; temperatures below 65 degrees are considered heating degree-days. Total cooling degree-days were 2,069 in 2011 compared to 1,730 in 2010. Total heating degree-days were 3,665 in 2011 compared to 3,942 in 2010. Total heating and cooling degree-days were 5,734 in 2011 compared to 5,672 in 2010 or an increase of approximately 1.1 percent. Total average number of active year-to-date customers increased by 0.2 percent when compared to 2010. Revenue in Excess of Net Bills, (Late Charge) increased by $1.0 million, and Rentals and Electric Property (primarily pole attachments) increased $0.7 million.
Non-operating Revenues. Interest income was $0.5 million in 2011 compared to $1.3 million in 2010. The average rate of return on the General Fund was 0.2 percent in 2011 compared to 0.2 percent in 2010. The average monthly balance of the General Fund was $126.3 million in 2011 compared to $102.8 million in 2010, an increase of 22.9 percent. Interest income was less in 2011 due to the additional draw down of funds from the Construction Fund that were provided by the June 2008 bond issuance. Purchased Power and Operating Expenses. The Board purchases all of its power from TVA under an all-requirements contract that had an initial term of 20 years. Beginning on December 19, 1989, and on each subsequent anniversary thereafter, the contract is automatically extended for an additional one-year period. The contract is subject to earlier termination by either party on not less than 10 years’ prior written notice. Purchased power was $927.1 million in 2011 compared to $816.2 million in 2010. The average realized rate on purchased power was $.070 per kilowatt-hour in 2011 compared to $.065 per kilowatt-hour in 2010. This increase is due to the pass-through of the FCA and the rate structure change in April 2011. Megawatt-hours purchased were 13.2 million in 2011 compared to 12.5 million in 2010. Distribution expenses for the period were $55.7 million compared to $43.6 million in 2010. This is an increase of $12.1 million or 27.8 percent. The change is primarily attributable to increases in miscellaneous expenses, $5.8 million; operation and maintenance of overhead lines, $2.4 million; storms, $2.1 million; supervision and engineering, $1.5 million; operation and maintenance of street lights, $0.9 million; and operation and maintenance of underground lines, $0.6 million, offset by a decrease in tree-trimming, $1.5 million.
Customer Accounts expense and Customer Service and Information expenses combined were $22.4 million in 2011 compared to $20.2 million in 2010 or an increase of $2.2 million or 10.9 percent. This was primarily the result of an increase in the uncollectible accounts accrual of $1.5 million; customer
MANAGEMENT’S DISCUSSION AND ANALYSIS (continued)
11
orders and service expenses of $0.7 million; data processing of $0.3 million, offset by a decrease in customer records and collection of $0.2 million.
Administrative and General (A&G) expenses were $62.8 million in 2011 compared to $68.3 million in 2010. This was a decrease of $5.5 million or 8.0 percent. The decrease is primarily the result of a decrease in employee health insurance, $4.2 million; employee pensions, $1.0 million; outside services employed, $0.6 million; and injuries and damages, $0.4 million, offset by an increase in data processing, $0.5 million; and administrative and general salaries, $0.1 million.
Depreciation and Tax Equivalents were $47.5 million and $27.6 million compared to $46.0 million and $26.8 million for 2011 and 2010, respectively. The increase in depreciation was the result of increased investment in the utility plant. Tax equivalents consist primarily of payments in–lieu-of taxes to the Metropolitan Government and the surrounding counties. Such payments are calculated based on a prescribed formula that takes into consideration utility plant value and the average of the Board’s last three years’ operating margin. The increase in payments in-lieu-of taxes was the result of increases in tax rates coupled with increased investment in the utility plant.
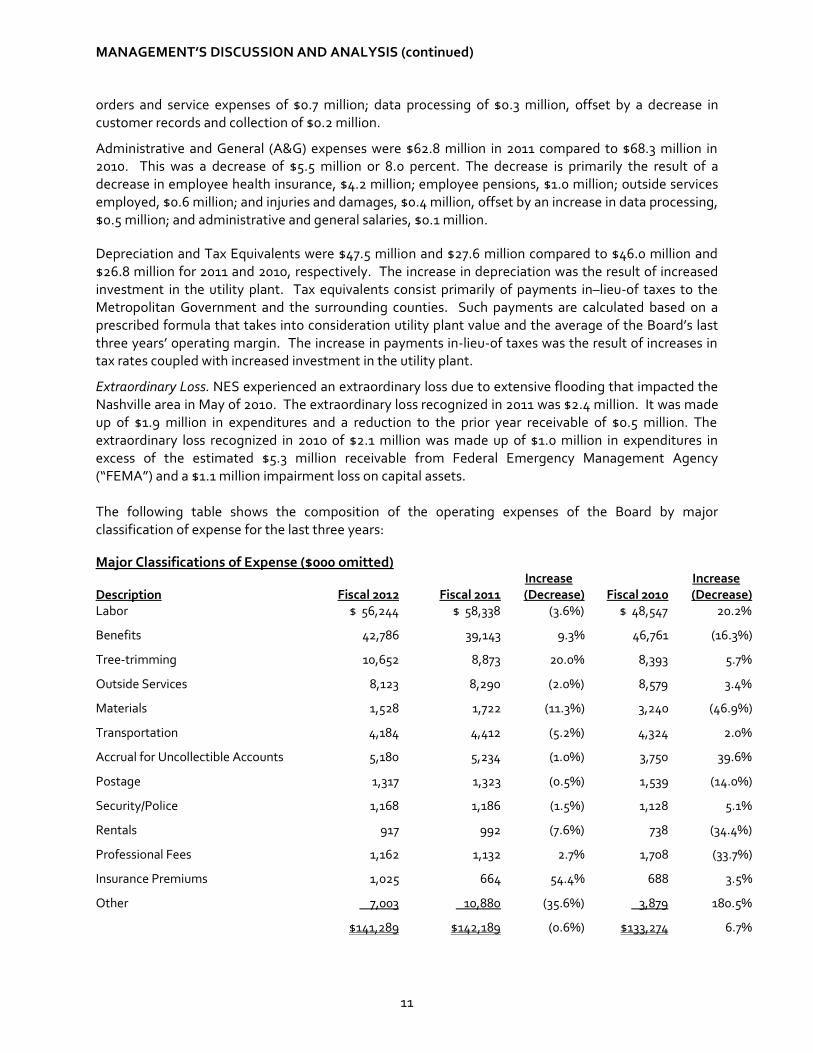
Extraordinary Loss. NES experienced an extraordinary loss due to extensive flooding that impacted the Nashville area in May of 2010. The extraordinary loss recognized in 2011 was $2.4 million. It was made up of $1.9 million in expenditures and a reduction to the prior year receivable of $0.5 million. The extraordinary loss recognized in 2010 of $2.1 million was made up of $1.0 million in expenditures in excess of the estimated $5.3 million receivable from Federal Emergency Management Agency (“FEMA”) and a $1.1 million impairment loss on capital assets. The following table shows the composition of the operating expenses of the Board by major classification of expense for the last three years: Major Classifications of Expense ($000 omitted)
Description Fiscal 2012 Fiscal 2011 Increase (Decrease) Fiscal 2010
Increase(Decrease)
Labor $ 56,244 $ 58,338 (3.6%) $ 48,547 20.2%
Benefits 42,786 39,143 9.3% 46,761 (16.3%)
Tree-trimming 10,652 8,873 20.0% 8,393 5.7%
Outside Services 8,123 8,290 (2.0%) 8,579 3.4%
Materials 1,528 1,722 (11.3%) 3,240 (46.9%)
Transportation 4,184 4,412 (5.2%) 4,324 2.0%
Accrual for Uncollectible Accounts 5,180 5,234 (1.0%) 3,750 39.6%
Postage 1,317 1,323 (0.5%) 1,539 (14.0%)
Security/Police 1,168 1,186 (1.5%) 1,128 5.1%
Rentals 917 992 (7.6%) 738 (34.4%)
Professional Fees 1,162 1,132 2.7% 1,708 (33.7%)
Insurance Premiums 1,025 664 54.4% 688 3.5%
Other 7,003 10,880 (35.6%) 3,879 180.5%
$141,289 $142,189 (0.6%) $133,274 6.7%
MANAGEMENT’S DISCUSSION AND ANALYSIS (continued)
12
The Board’s total operating expenses decreased 0.6 percent from June 30, 2011 to June 30, 2012. Labor for fiscal year 2012 totaled $56.2 million, which represents a decrease from fiscal year 2011 due to less overtime from fewer storms offset by increases due to cost of living and merit adjustments, step increases, and changes in allocation between O&M and Capital. Benefits increased due to increases in Other Post-Employment Benefits, $4.3 million; and Vision, $0.2 million; offset by a decrease in Medical, $0.5 million. Tree-trimming increased due to additional circuit miles trimmed. Outside services decreased due to cost savings on various services. Materials were less in 2012 due to a FEMA reimbursement for the April 2011 storm damage. Transportation costs are less than in 2012 due to decreased storm restoration. Insurance Premiums increased due to implementation of property insurance program and an increase in Director and Officers coverage. The Other category contains a wide array of smaller accounts. In fiscal year 2012, decreases occurred in work order transfers, $3.7 million; clearing accounts (payroll, transportation, overhead, etc.), $3.1 million; injuries and damages, $0.9 million; transportation, $0.2 million, offset by increases in contract meter readings, $0.6 million; and insurance premiums, $0.4 million. The Board’s total operating expenses increased 6.7 percent from June 30, 2010, to June 30, 2011. Labor for fiscal year 2011 totaled $58.3 million, which represents an increase from fiscal year 2010 due to cost-of-living adjustment, step increases and changes in allocation between O&M and Capital. This allocation change was a result of an assessment of labor in fiscal year 2010. The labor expense for fiscal 2010 was offset by $4.8 million of Federal Disaster assistance. Benefits decreased due to actuarial valuation results for Retirement and Survivors and Other Post-Employment Benefits. This was offset by an increase in Medical expenses. Tree-trimming increased because a full year of the four-year trim cycle was experienced. The Outside Services decreased due to additional contracts resulting from the May 2010 flood. Material costs were less than in 2010 due to salvageable material, related to the referenced flood, placed back into inventory. Transportation costs were more in 2011 due to increased storm restoration. The Accrual for Uncollectible Accounts increased due to escalated write-offs. Professional Fees decreased due to fewer litigation fees needed. The Other category contains a wide array of smaller accounts. Capital Assets and Debt Administration The Board’s transmission and distribution facilities serve more than 700 square miles and include the Metropolitan Government of Nashville and Davidson County, Tennessee. The Board also serves portions of the adjacent counties of Cheatham, Rutherford, Robertson, Sumner, Wilson, and Williamson. Such facilities require significant annual capital and maintenance expenditures. The Board’s target is to have the capital expenditures funded equally from cash flow from operations and proceeds from tax-exempt bonds. The Board’s investment in utility plant at June 30, 2012, was $865.0 million compared to $842.4 million at June 30, 2011. Major projects during fiscal year 2012 included the Smart Grid Project, $11.7 million; completion of the 6th Avenue transmission tunnel and initial cable installation, $8.0 million; substation and feeder breaker replacements at Hermitage substation, $0.6 million; substation and feeder breaker replacements at Finn Street substation, $0.5 million; substation and feeder breaker replacements at Edgehill substation, $0.5 million; transformer installation at Brick Church and 10th Avenue substation, $0.3 million; and transformer installations at East substation, $0.1 million.
MANAGEMENT’S DISCUSSION AND ANALYSIS (continued)
13
The Board has outstanding bonds payable of $569.8 million at June 30, 2012, compared to $482.1 million at June 30, 2011. This increase is due to the issuance of 2011 Series Revenue Bonds. More details about the Board’s capital assets and debt can be found in the notes to the financial statements. Respectfully submitted,
Teresa Broyles-Aplin Vice President and Chief Financial Officer
ELECTRIC POWER BOARD OF THE METROPOLITAN GOVERNMENT OF NASHVILLE AND DAVIDSON COUNTY
14
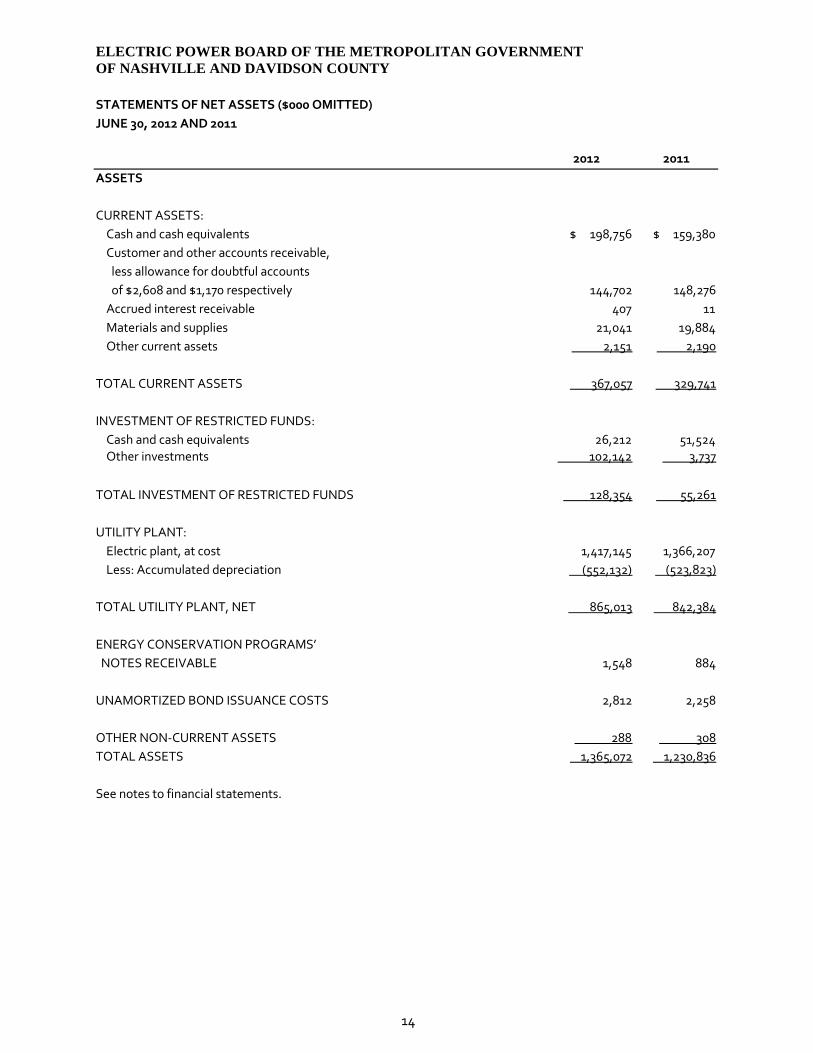
STATEMENTS OF NET ASSETS ($000 OMITTED) JUNE 30, 2012 AND 2011
2012 2011
ASSETS
CURRENT ASSETS: Cash and cash equivalents $ 198,756 $ 159,380 Customer and other accounts receivable, less allowance for doubtful accounts of $2,608 and $1,170 respectively 144,702 148,276 Accrued interest receivable 407 11 Materials and supplies 21,041 19,884 Other current assets 2,151 2,190
TOTAL CURRENT ASSETS 367,057 329,741
INVESTMENT OF RESTRICTED FUNDS: Cash and cash equivalents 26,212 51,524 Other investments 102,142 3,737
TOTAL INVESTMENT OF RESTRICTED FUNDS 128,354 55,261
UTILITY PLANT: Electric plant, at cost 1,417,145 1,366,207 Less: Accumulated depreciation (552,132) (523,823)
TOTAL UTILITY PLANT, NET 865,013 842,384
ENERGY CONSERVATION PROGRAMS’ NOTES RECEIVABLE 1,548 884 UNAMORTIZED BOND ISSUANCE COSTS 2,812 2,258 OTHER NON-CURRENT ASSETS 288 308TOTAL ASSETS 1,365,072 1,230,836
See notes to financial statements.
ELECTRIC POWER BOARD OF THE METROPOLITAN GOVERNMENT OF NASHVILLE AND DAVIDSON COUNTY
15
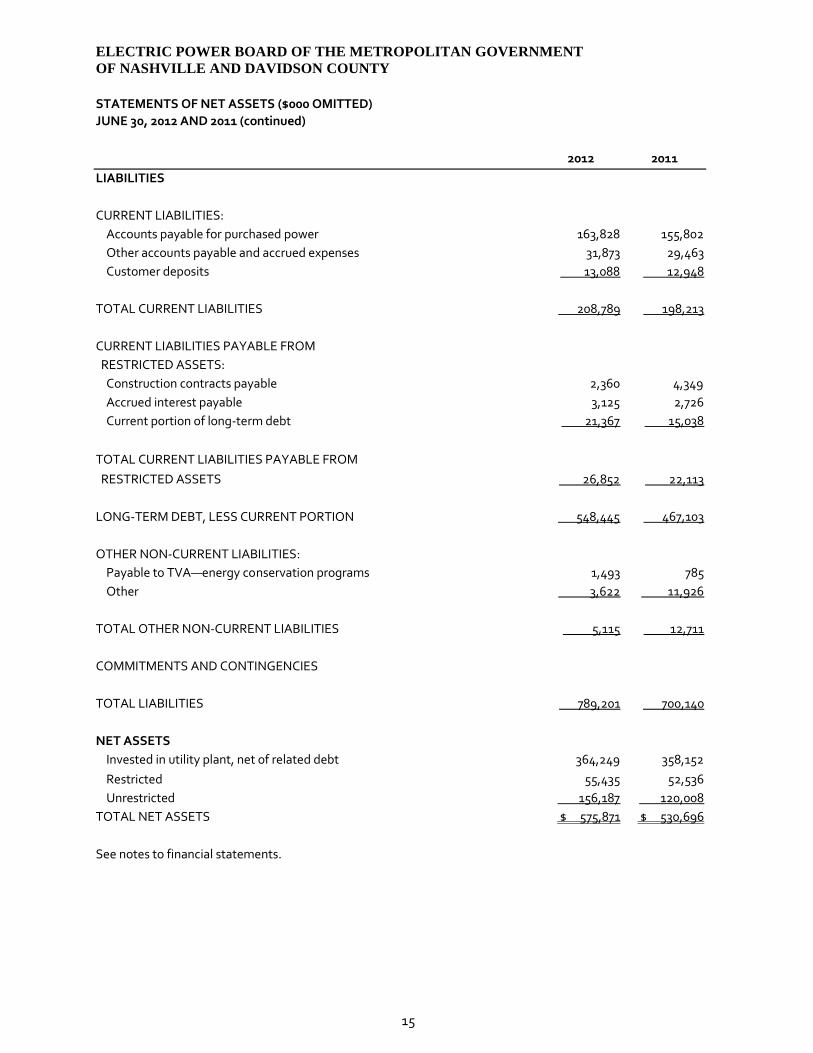
STATEMENTS OF NET ASSETS ($000 OMITTED) JUNE 30, 2012 AND 2011 (continued)
2012 2011
LIABILITIES
CURRENT LIABILITIES: Accounts payable for purchased power 163,828 155,802 Other accounts payable and accrued expenses 31,873 29,463 Customer deposits 13,088 12,948
TOTAL CURRENT LIABILITIES 208,789 198,213
CURRENT LIABILITIES PAYABLE FROM RESTRICTED ASSETS: Construction contracts payable 2,360 4,349 Accrued interest payable 3,125 2,726 Current portion of long-term debt 21,367 15,038
TOTAL CURRENT LIABILITIES PAYABLE FROM RESTRICTED ASSETS 26,852 22,113
LONG-TERM DEBT, LESS CURRENT PORTION 548,445 467,103
OTHER NON-CURRENT LIABILITIES: Payable to TVA—energy conservation programs 1,493 785 Other 3,622 11,926
TOTAL OTHER NON-CURRENT LIABILITIES 5,115 12,711
COMMITMENTS AND CONTINGENCIES
TOTAL LIABILITIES 789,201 700,140
NET ASSETS Invested in utility plant, net of related debt 364,249 358,152 Restricted 55,435 52,536 Unrestricted 156,187 120,008 TOTAL NET ASSETS $ 575,871 $ 530,696
See notes to financial statements.
ELECTRIC POWER BOARD OF THE METROPOLITAN GOVERNMENT OF NASHVILLE AND DAVIDSON COUNTY
16
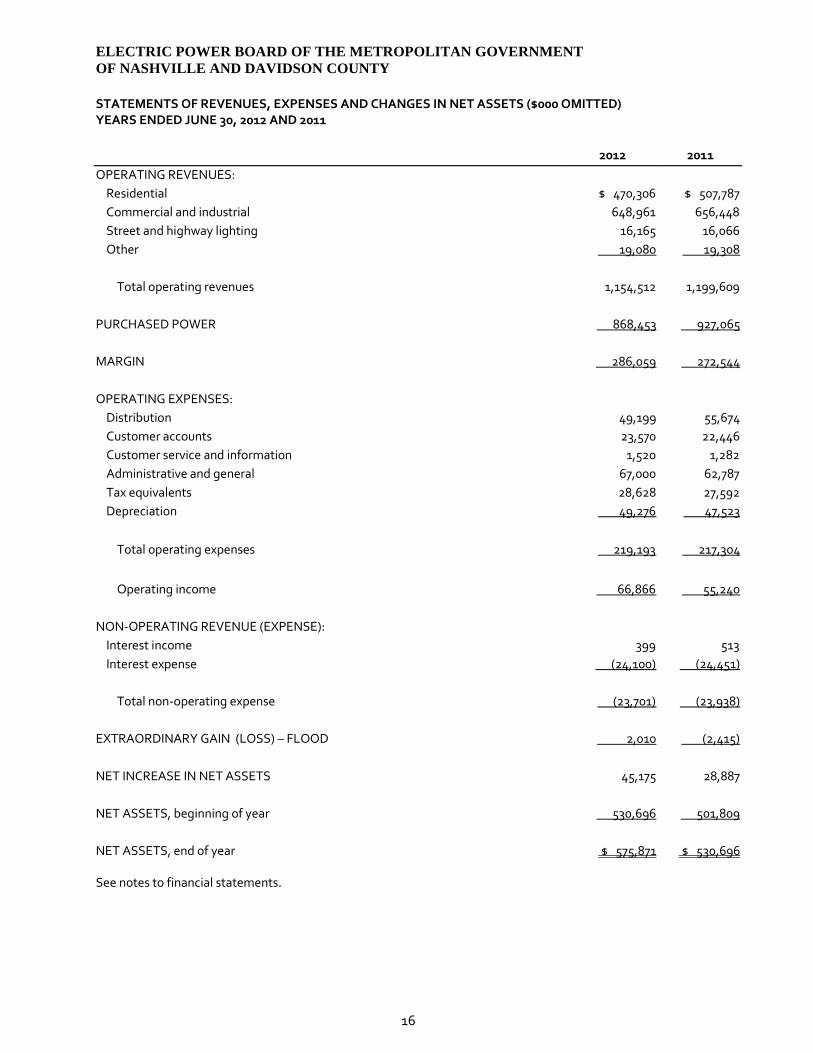
STATEMENTS OF REVENUES, EXPENSES AND CHANGES IN NET ASSETS ($000 OMITTED) YEARS ENDED JUNE 30, 2012 AND 2011
2012 2011OPERATING REVENUES: Residential $ 470,306 $ 507,787 Commercial and industrial 648,961 656,448 Street and highway lighting 16,165 16,066 Other 19,080 19,308
Total operating revenues 1,154,512 1,199,609
PURCHASED POWER 868,453 927,065
MARGIN 286,059 272,544
OPERATING EXPENSES: Distribution 49,199 55,674 Customer accounts 23,570 22,446 Customer service and information 1,520 1,282 Administrative and general 67,000 62,787 Tax equivalents 28,628 27,592 Depreciation 49,276 47,523
Total operating expenses 219,193 217,304
Operating income 66,866 55,240
NON-OPERATING REVENUE (EXPENSE): Interest income 399 513 Interest expense (24,100) (24,451)
Total non-operating expense (23,701) (23,938)
EXTRAORDINARY GAIN (LOSS) – FLOOD 2,010 (2,415)
NET INCREASE IN NET ASSETS 45,175 28,887
NET ASSETS, beginning of year 530,696 501,809
NET ASSETS, end of year $ 575,871 $ 530,696
See notes to financial statements.
ELECTRIC POWER BOARD OF THE METROPOLITAN GOVERNMENT OF NASHVILLE AND DAVIDSON COUNTY
17
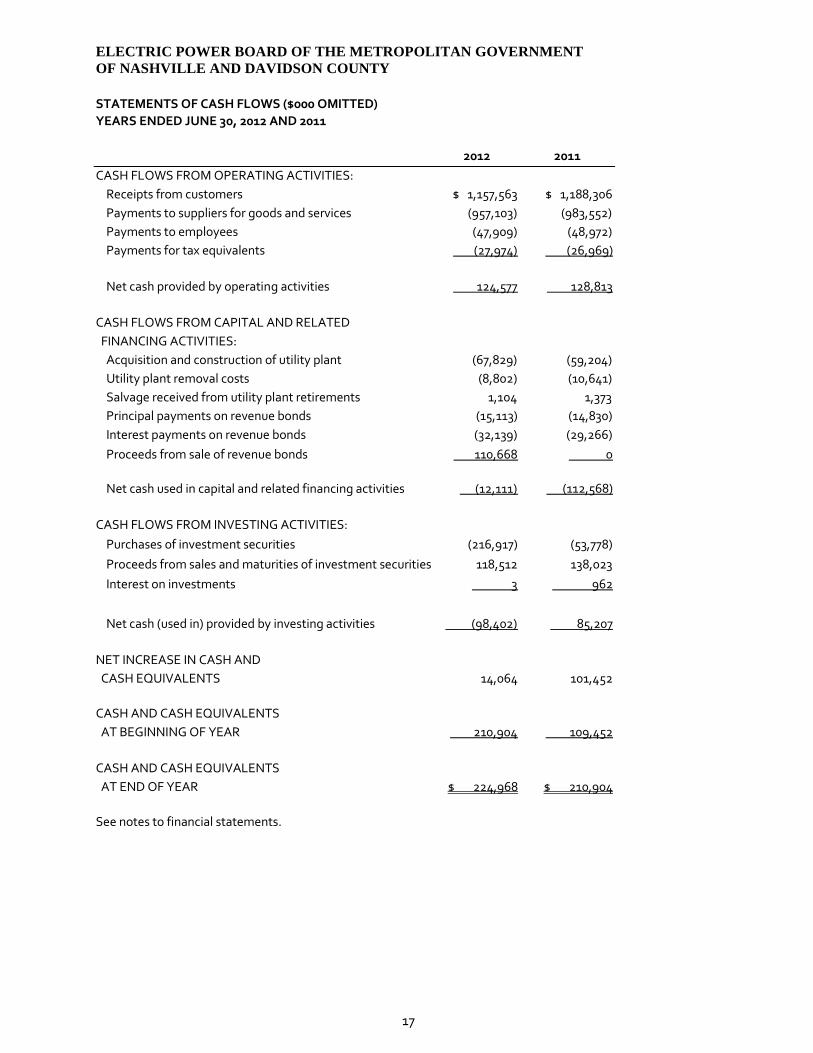
STATEMENTS OF CASH FLOWS ($000 OMITTED) YEARS ENDED JUNE 30, 2012 AND 2011
2012 2011
CASH FLOWS FROM OPERATING ACTIVITIES: Receipts from customers $ 1,157,563 $ 1,188,306 Payments to suppliers for goods and services (957,103) (983,552) Payments to employees (47,909) (48,972) Payments for tax equivalents (27,974) (26,969)
Net cash provided by operating activities 124,577 128,813
CASH FLOWS FROM CAPITAL AND RELATED FINANCING ACTIVITIES: Acquisition and construction of utility plant (67,829) (59,204) Utility plant removal costs (8,802) (10,641) Salvage received from utility plant retirements 1,104 1,373 Principal payments on revenue bonds (15,113) (14,830) Interest payments on revenue bonds (32,139) (29,266) Proceeds from sale of revenue bonds 110,668 0
Net cash used in capital and related financing activities (12,111) (112,568)
CASH FLOWS FROM INVESTING ACTIVITIES: Purchases of investment securities (216,917) (53,778) Proceeds from sales and maturities of investment securities 118,512 138,023 Interest on investments 3 962
Net cash (used in) provided by investing activities (98,402) 85,207
NET INCREASE IN CASH AND CASH EQUIVALENTS 14,064 101,452
CASH AND CASH EQUIVALENTS AT BEGINNING OF YEAR 210,904 109,452
CASH AND CASH EQUIVALENTS AT END OF YEAR $ 224,968 $ 210,904
See notes to financial statements.
ELECTRIC POWER BOARD OF THE METROPOLITAN GOVERNMENT OF NASHVILLE AND DAVIDSON COUNTY
18
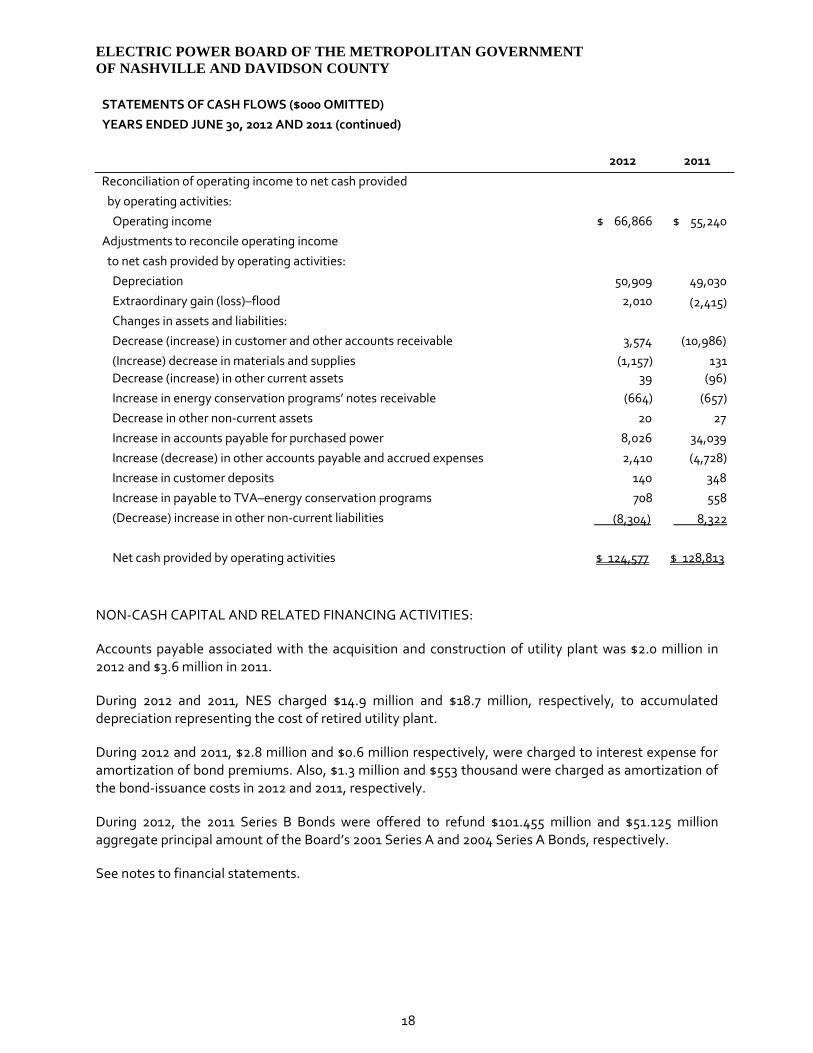
STATEMENTS OF CASH FLOWS ($000 OMITTED) YEARS ENDED JUNE 30, 2012 AND 2011 (continued) 2012 2011
Reconciliation of operating income to net cash provided by operating activities: Operating income $ 66,866 $ 55,240 Adjustments to reconcile operating income to net cash provided by operating activities: Depreciation 50,909 49,030 Extraordinary gain (loss)–flood 2,010 (2,415) Changes in assets and liabilities: Decrease (increase) in customer and other accounts receivable 3,574 (10,986) (Increase) decrease in materials and supplies (1,157) 131 Decrease (increase) in other current assets 39 (96) Increase in energy conservation programs’ notes receivable (664) (657) Decrease in other non-current assets 20 27 Increase in accounts payable for purchased power 8,026 34,039 Increase (decrease) in other accounts payable and accrued expenses 2,410 (4,728) Increase in customer deposits 140 348 Increase in payable to TVA–energy conservation programs 708 558 (Decrease) increase in other non-current liabilities (8,304) 8,322 Net cash provided by operating activities $ 124,577 $ 128,813
NON-CASH CAPITAL AND RELATED FINANCING ACTIVITIES:
Accounts payable associated with the acquisition and construction of utility plant was $2.0 million in 2012 and $3.6 million in 2011.
During 2012 and 2011, NES charged $14.9 million and $18.7 million, respectively, to accumulated depreciation representing the cost of retired utility plant.
During 2012 and 2011, $2.8 million and $0.6 million respectively, were charged to interest expense for amortization of bond premiums. Also, $1.3 million and $553 thousand were charged as amortization of the bond-issuance costs in 2012 and 2011, respectively.
During 2012, the 2011 Series B Bonds were offered to refund $101.455 million and $51.125 million aggregate principal amount of the Board’s 2001 Series A and 2004 Series A Bonds, respectively.
See notes to financial statements.
ELECTRIC POWER BOARD OF THE METROPOLITAN GOVERNMENT OF NASHVILLE AND DAVIDSON COUNTY NOTES TO FINANCIAL STATEMENTS YEARS ENDED JUNE 30, 2012 AND 2011
19
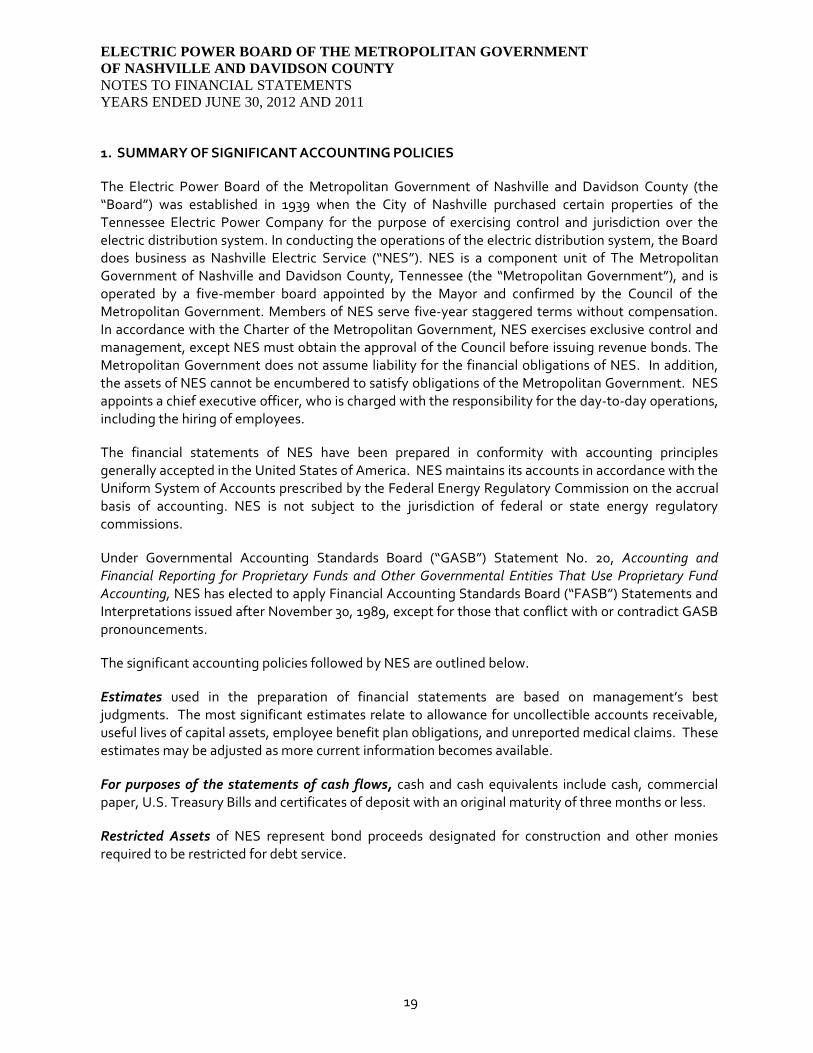
1. SUMMARY OF SIGNIFICANT ACCOUNTING POLICIES
The Electric Power Board of the Metropolitan Government of Nashville and Davidson County (the “Board”) was established in 1939 when the City of Nashville purchased certain properties of the Tennessee Electric Power Company for the purpose of exercising control and jurisdiction over the electric distribution system. In conducting the operations of the electric distribution system, the Board does business as Nashville Electric Service (“NES”). NES is a component unit of The Metropolitan Government of Nashville and Davidson County, Tennessee (the “Metropolitan Government”), and is operated by a five-member board appointed by the Mayor and confirmed by the Council of the Metropolitan Government. Members of NES serve five-year staggered terms without compensation. In accordance with the Charter of the Metropolitan Government, NES exercises exclusive control and management, except NES must obtain the approval of the Council before issuing revenue bonds. The Metropolitan Government does not assume liability for the financial obligations of NES. In addition, the assets of NES cannot be encumbered to satisfy obligations of the Metropolitan Government. NES appoints a chief executive officer, who is charged with the responsibility for the day-to-day operations, including the hiring of employees.
The financial statements of NES have been prepared in conformity with accounting principles generally accepted in the United States of America. NES maintains its accounts in accordance with the Uniform System of Accounts prescribed by the Federal Energy Regulatory Commission on the accrual basis of accounting. NES is not subject to the jurisdiction of federal or state energy regulatory commissions.
Under Governmental Accounting Standards Board (“GASB”) Statement No. 20, Accounting and Financial Reporting for Proprietary Funds and Other Governmental Entities That Use Proprietary Fund Accounting, NES has elected to apply Financial Accounting Standards Board (“FASB”) Statements and Interpretations issued after November 30, 1989, except for those that conflict with or contradict GASB pronouncements.
The significant accounting policies followed by NES are outlined below.
Estimates used in the preparation of financial statements are based on management’s best judgments. The most significant estimates relate to allowance for uncollectible accounts receivable, useful lives of capital assets, employee benefit plan obligations, and unreported medical claims. These estimates may be adjusted as more current information becomes available.
For purposes of the statements of cash flows, cash and cash equivalents include cash, commercial paper, U.S. Treasury Bills and certificates of deposit with an original maturity of three months or less.
Restricted Assets of NES represent bond proceeds designated for construction and other monies required to be restricted for debt service.
ELECTRIC POWER BOARD OF THE METROPOLITAN GOVERNMENT OF NASHVILLE AND DAVIDSON COUNTY NOTES TO FINANCIAL STATEMENTS YEARS ENDED JUNE 30, 2012 AND 2011
20
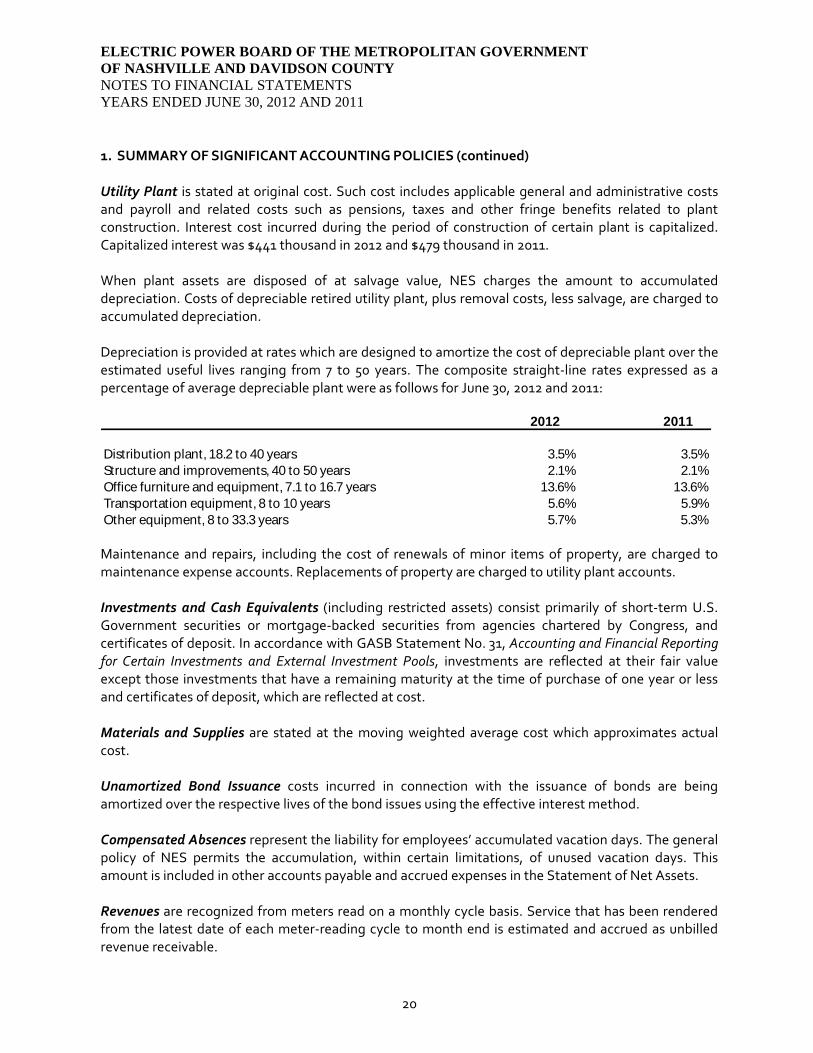
1. SUMMARY OF SIGNIFICANT ACCOUNTING POLICIES (continued) Utility Plant is stated at original cost. Such cost includes applicable general and administrative costs and payroll and related costs such as pensions, taxes and other fringe benefits related to plant construction. Interest cost incurred during the period of construction of certain plant is capitalized. Capitalized interest was $441 thousand in 2012 and $479 thousand in 2011. When plant assets are disposed of at salvage value, NES charges the amount to accumulated depreciation. Costs of depreciable retired utility plant, plus removal costs, less salvage, are charged to accumulated depreciation. Depreciation is provided at rates which are designed to amortize the cost of depreciable plant over the estimated useful lives ranging from 7 to 50 years. The composite straight-line rates expressed as a percentage of average depreciable plant were as follows for June 30, 2012 and 2011:
2012 2011
Distribution plant, 18.2 to 40 years 3.5% 3.5%Structure and improvements, 40 to 50 years 2.1% 2.1%Office furniture and equipment, 7.1 to 16.7 years 13.6% 13.6%Transportation equipment, 8 to 10 years 5.6% 5.9%Other equipment, 8 to 33.3 years 5.7% 5.3%
Maintenance and repairs, including the cost of renewals of minor items of property, are charged to maintenance expense accounts. Replacements of property are charged to utility plant accounts. Investments and Cash Equivalents (including restricted assets) consist primarily of short-term U.S. Government securities or mortgage-backed securities from agencies chartered by Congress, and certificates of deposit. In accordance with GASB Statement No. 31, Accounting and Financial Reporting for Certain Investments and External Investment Pools, investments are reflected at their fair value except those investments that have a remaining maturity at the time of purchase of one year or less and certificates of deposit, which are reflected at cost. Materials and Supplies are stated at the moving weighted average cost which approximates actual cost. Unamortized Bond Issuance costs incurred in connection with the issuance of bonds are being amortized over the respective lives of the bond issues using the effective interest method. Compensated Absences represent the liability for employees’ accumulated vacation days. The general policy of NES permits the accumulation, within certain limitations, of unused vacation days. This amount is included in other accounts payable and accrued expenses in the Statement of Net Assets. Revenues are recognized from meters read on a monthly cycle basis. Service that has been rendered from the latest date of each meter-reading cycle to month end is estimated and accrued as unbilled revenue receivable.
ELECTRIC POWER BOARD OF THE METROPOLITAN GOVERNMENT OF NASHVILLE AND DAVIDSON COUNTY NOTES TO FINANCIAL STATEMENTS YEARS ENDED JUNE 30, 2012 AND 2011
21
1. SUMMARY OF SIGNIFICANT ACCOUNTING POLICIES (continued)
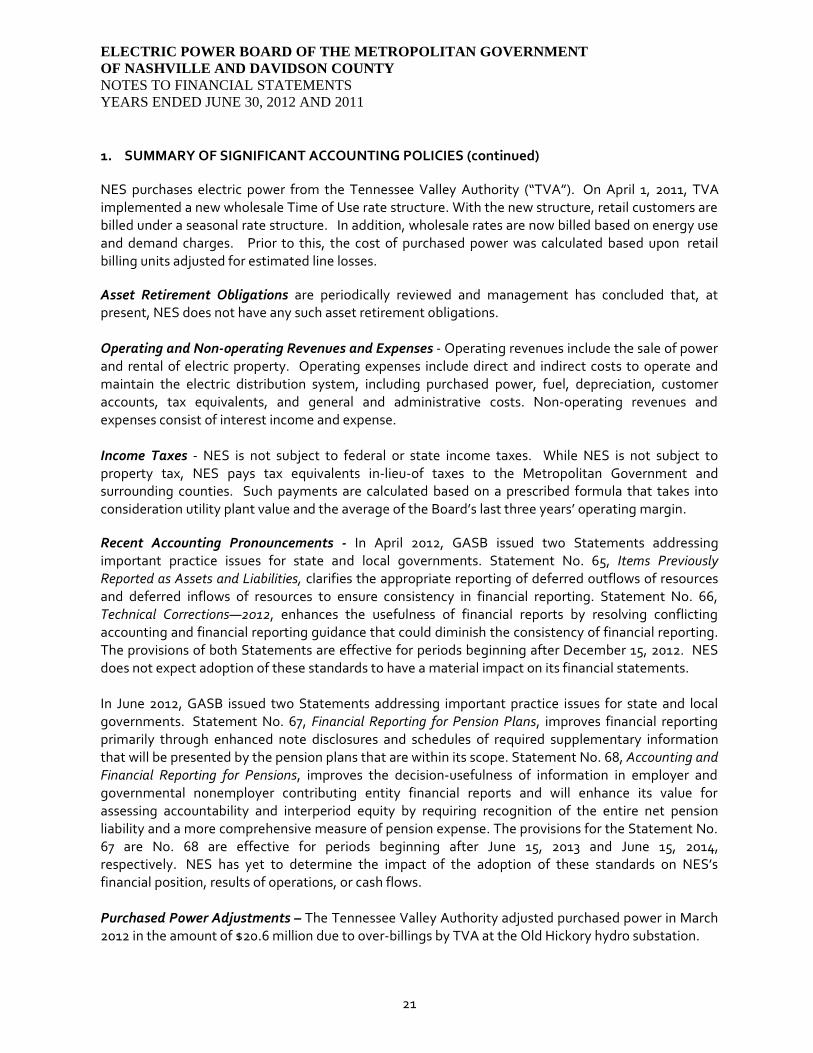
NES purchases electric power from the Tennessee Valley Authority (“TVA”). On April 1, 2011, TVA implemented a new wholesale Time of Use rate structure. With the new structure, retail customers are billed under a seasonal rate structure. In addition, wholesale rates are now billed based on energy use and demand charges. Prior to this, the cost of purchased power was calculated based upon retail billing units adjusted for estimated line losses.
Asset Retirement Obligations are periodically reviewed and management has concluded that, at present, NES does not have any such asset retirement obligations. Operating and Non-operating Revenues and Expenses - Operating revenues include the sale of power and rental of electric property. Operating expenses include direct and indirect costs to operate and maintain the electric distribution system, including purchased power, fuel, depreciation, customer accounts, tax equivalents, and general and administrative costs. Non-operating revenues and expenses consist of interest income and expense. Income Taxes - NES is not subject to federal or state income taxes. While NES is not subject to property tax, NES pays tax equivalents in-lieu-of taxes to the Metropolitan Government and surrounding counties. Such payments are calculated based on a prescribed formula that takes into consideration utility plant value and the average of the Board’s last three years’ operating margin.
Recent Accounting Pronouncements - In April 2012, GASB issued two Statements addressing important practice issues for state and local governments. Statement No. 65, Items Previously Reported as Assets and Liabilities, clarifies the appropriate reporting of deferred outflows of resources and deferred inflows of resources to ensure consistency in financial reporting. Statement No. 66, Technical Corrections—2012, enhances the usefulness of financial reports by resolving conflicting accounting and financial reporting guidance that could diminish the consistency of financial reporting. The provisions of both Statements are effective for periods beginning after December 15, 2012. NES does not expect adoption of these standards to have a material impact on its financial statements. In June 2012, GASB issued two Statements addressing important practice issues for state and local governments. Statement No. 67, Financial Reporting for Pension Plans, improves financial reporting primarily through enhanced note disclosures and schedules of required supplementary information that will be presented by the pension plans that are within its scope. Statement No. 68, Accounting and Financial Reporting for Pensions, improves the decision-usefulness of information in employer and governmental nonemployer contributing entity financial reports and will enhance its value for assessing accountability and interperiod equity by requiring recognition of the entire net pension liability and a more comprehensive measure of pension expense. The provisions for the Statement No. 67 are No. 68 are effective for periods beginning after June 15, 2013 and June 15, 2014, respectively. NES has yet to determine the impact of the adoption of these standards on NES’s financial position, results of operations, or cash flows. Purchased Power Adjustments –The Tennessee Valley Authority adjusted purchased power in March 2012 in the amount of $20.6 million due to over-billings by TVA at the Old Hickory hydro substation.
ELECTRIC POWER BOARD OF THE METROPOLITAN GOVERNMENT OF NASHVILLE AND DAVIDSON COUNTY NOTES TO FINANCIAL STATEMENTS YEARS ENDED JUNE 30, 2012 AND 2011
22
2. UTILITY PLANT AND ACCUMULATED DEPRECIATION
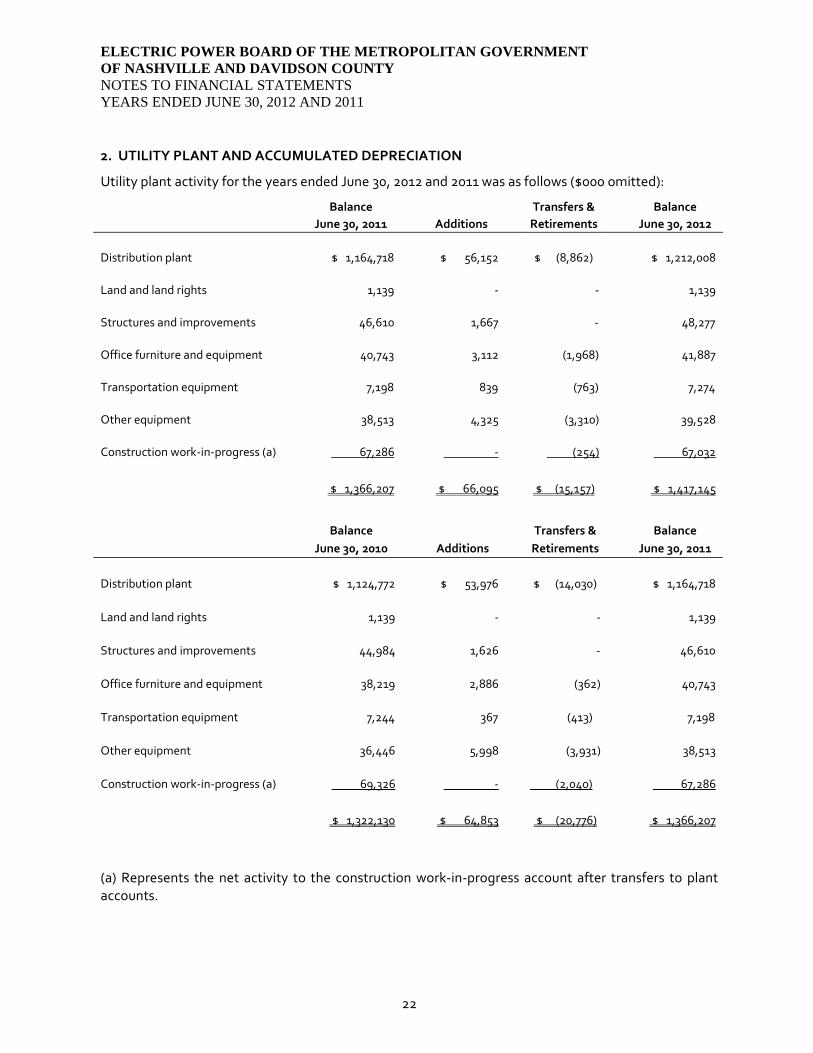
Utility plant activity for the years ended June 30, 2012 and 2011 was as follows ($000 omitted):
Balance Transfers & Balance June 30, 2011 Additions Retirements June 30, 2012 Distribution plant $ 1,164,718 $ 56,152 $ (8,862) $ 1,212,008 Land and land rights 1,139 - - 1,139 Structures and improvements 46,610 1,667 - 48,277 Office furniture and equipment 40,743 3,112 (1,968) 41,887 Transportation equipment 7,198 839 (763) 7,274 Other equipment 38,513 4,325 (3,310) 39,528 Construction work-in-progress (a) 67,286 - (254) 67,032
$ 1,366,207 $ 66,095 $ (15,157) $ 1,417,145
Balance Transfers & Balance
June 30, 2010 Additions Retirements June 30, 2011
Distribution plant $ 1,124,772 $ 53,976 $ (14,030) $ 1,164,718 Land and land rights 1,139 - - 1,139 Structures and improvements 44,984 1,626 - 46,610 Office furniture and equipment 38,219 2,886 (362) 40,743 Transportation equipment 7,244 367 (413) 7,198 Other equipment 36,446 5,998 (3,931) 38,513 Construction work-in-progress (a) 69,326 - (2,040) 67,286
$ 1,322,130 $ 64,853 $ (20,776) $ 1,366,207
(a) Represents the net activity to the construction work-in-progress account after transfers to plant accounts.
ELECTRIC POWER BOARD OF THE METROPOLITAN GOVERNMENT OF NASHVILLE AND DAVIDSON COUNTY NOTES TO FINANCIAL STATEMENTS YEARS ENDED JUNE 30, 2012 AND 2011
23
2. UTILITY PLANT AND ACCUMULATED DEPRECIATION (continued)
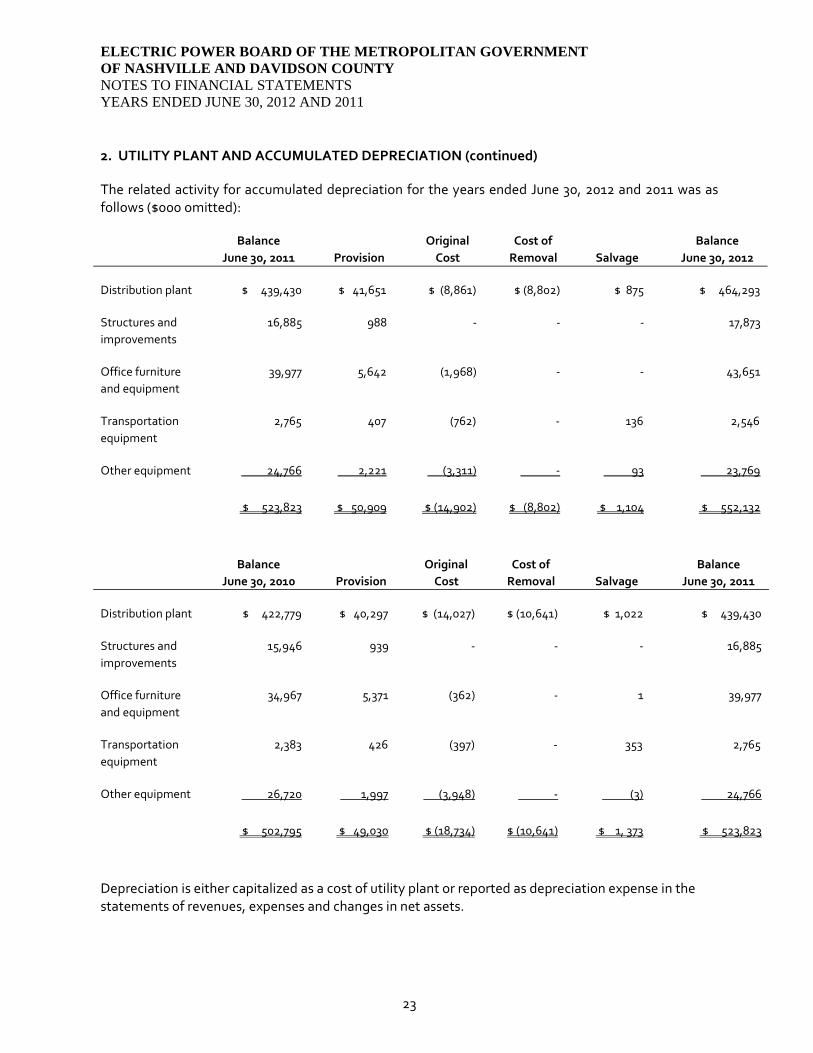
The related activity for accumulated depreciation for the years ended June 30, 2012 and 2011 was as follows ($000 omitted):
Balance Original Cost of Balance June 30, 2011 Provision Cost Removal Salvage June 30, 2012 Distribution plant $ 439,430 $ 41,651 $ (8,861) $ (8,802) $ 875 $ 464,293 Structures and 16,885 988 - - - 17,873 improvements Office furniture 39,977 5,642 (1,968) - - 43,651 and equipment Transportation 2,765 407 (762) - 136 2,546 equipment Other equipment 24,766 2,221 (3,311) - 93 23,769
$ 523,823 $ 50,909 $ (14,902) $ (8,802) $ 1,104 $ 552,132
Balance Original Cost of Balance June 30, 2010 Provision Cost Removal Salvage June 30, 2011 Distribution plant $ 422,779 $ 40,297 $ (14,027) $ (10,641) $ 1,022 $ 439,430 Structures and 15,946 939 - - - 16,885 improvements Office furniture 34,967 5,371 (362) - 1 39,977 and equipment Transportation 2,383 426 (397) - 353 2,765 equipment Other equipment 26,720 1,997 (3,948) - (3) 24,766
$ 502,795 $ 49,030 $ (18,734) $ (10,641) $ 1, 373 $ 523,823
Depreciation is either capitalized as a cost of utility plant or reported as depreciation expense in the statements of revenues, expenses and changes in net assets.
ELECTRIC POWER BOARD OF THE METROPOLITAN GOVERNMENT OF NASHVILLE AND DAVIDSON COUNTY NOTES TO FINANCIAL STATEMENTS YEARS ENDED JUNE 30, 2012 AND 2011
24
3. CASH AND INVESTMENTS
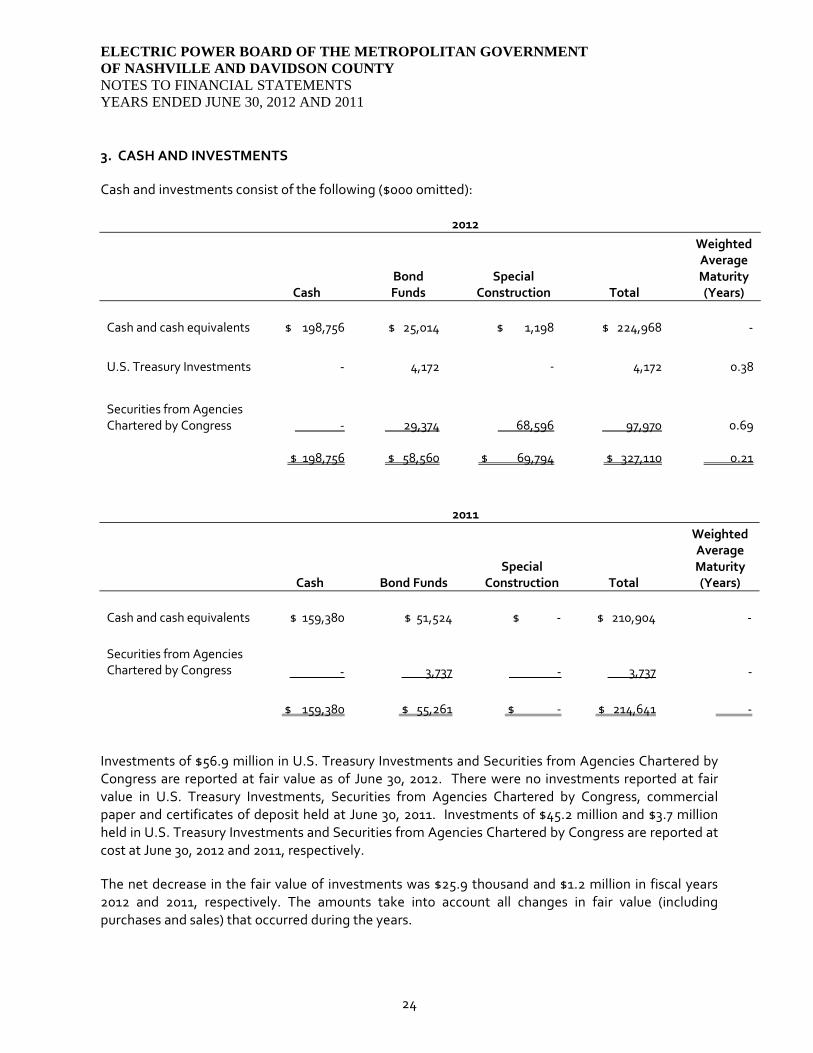
Cash and investments consist of the following ($000 omitted):
2012
Cash Bond Funds
Special Construction Total
Weighted Average Maturity (Years)
Cash and cash equivalents $ 198,756 $ 25,014 $ 1,198 $ 224,968 -
U.S. Treasury Investments - 4,172 - 4,172 0.38
Securities from Agencies Chartered by Congress - 29,374 68,596 97,970 0.69
$ 198,756 $ 58,560 $ 69,794 $ 327,110 0.21
2011
Cash Bond Funds Special
Construction Total
Weighted Average Maturity (Years)
Cash and cash equivalents $ 159,380 $ 51,524 $ - $ 210,904 - Securities from Agencies Chartered by Congress - 3,737 - 3,737
-
$ 159,380 $ 55,261 $ - $ 214,641 -
Investments of $56.9 million in U.S. Treasury Investments and Securities from Agencies Chartered by Congress are reported at fair value as of June 30, 2012. There were no investments reported at fair value in U.S. Treasury Investments, Securities from Agencies Chartered by Congress, commercial paper and certificates of deposit held at June 30, 2011. Investments of $45.2 million and $3.7 million held in U.S. Treasury Investments and Securities from Agencies Chartered by Congress are reported at cost at June 30, 2012 and 2011, respectively.
The net decrease in the fair value of investments was $25.9 thousand and $1.2 million in fiscal years 2012 and 2011, respectively. The amounts take into account all changes in fair value (including purchases and sales) that occurred during the years.
ELECTRIC POWER BOARD OF THE METROPOLITAN GOVERNMENT OF NASHVILLE AND DAVIDSON COUNTY NOTES TO FINANCIAL STATEMENTS YEARS ENDED JUNE 30, 2012 AND 2011
25
3. CASH AND INVESTMENTS (CONTINUED) Custodial Credit Risk – As of June 30, 2012 and 2011, NES’ cash and cash equivalents held by financial institutions was $224.9 million and $210.9 million, respectively. Bank balances for such accounts totaled $150.6 million and $109.9 million, respectively. Deposits in financial institutions are required by State of Tennessee (“State”) statute to be secured and collateralized by the institutions. The collateral must meet certain requirements and have a total minimum market value of 105 percent of the value of the deposits placed in the institutions less the amount protected by federal depository insurance. Collateral requirements are not applicable for financial institutions that participate in the State’s collateral pool. As of June 30, 2012 and 2011, all of NES’ deposits were held by financial institutions, which participate in the bank collateral pool administered by the State Treasurer. Participating banks determine the aggregated balance of their public-fund accounts for the Metropolitan Government. The amount of collateral required to secure these public deposits is a certain percentage set by the State, depending on the financial institution, and must be at least that percentage of the average daily balance of public deposits held. Collected securities required to be pledged by the participating banks to protect their public-fund accounts are pledged to the State Treasurer on behalf of the bank collateral pool. The securities pledged to protect these accounts are pledged in the aggregate rather than against each individual account. The members of the pool may be required by agreement to pay an assessment to cover any deficiency. Under this additional assessment agreement, public-fund accounts covered by the pool are considered to be insured for purposes of credit risk disclosure. Credit Risk – NES is authorized to invest in obligations of the U.S. Treasury and U.S. governmental agencies, securities from agencies chartered by Congress, certificates of deposit, commercial paper rated A1 or equivalent and bonds of the State of Tennessee. Each of these investments is registered or held by NES or its agent in NES’ name. Concentration of Credit Risk – NES has a policy prohibiting investment of greater than $5 million or 20 percent of the total investment portfolio in any one issue, except for the U.S. Government or any of its agencies. In 2012, 96.0 percent of NES’ investments are in Securities from Agencies Chartered by Congress. In 2011, 100 percent of NES’ investments are in Securities from Agencies Chartered by Congress.
Interest Rate Risk – NES restricts its investments to maturities less than two years from the date of settlement as a means of managing exposure to fair value losses arising from changes in interest rates.
ELECTRIC POWER BOARD OF THE METROPOLITAN GOVERNMENT OF NASHVILLE AND DAVIDSON COUNTY NOTES TO FINANCIAL STATEMENTS YEARS ENDED JUNE 30, 2012 AND 2011
26
4. LONG-TERM DEBT
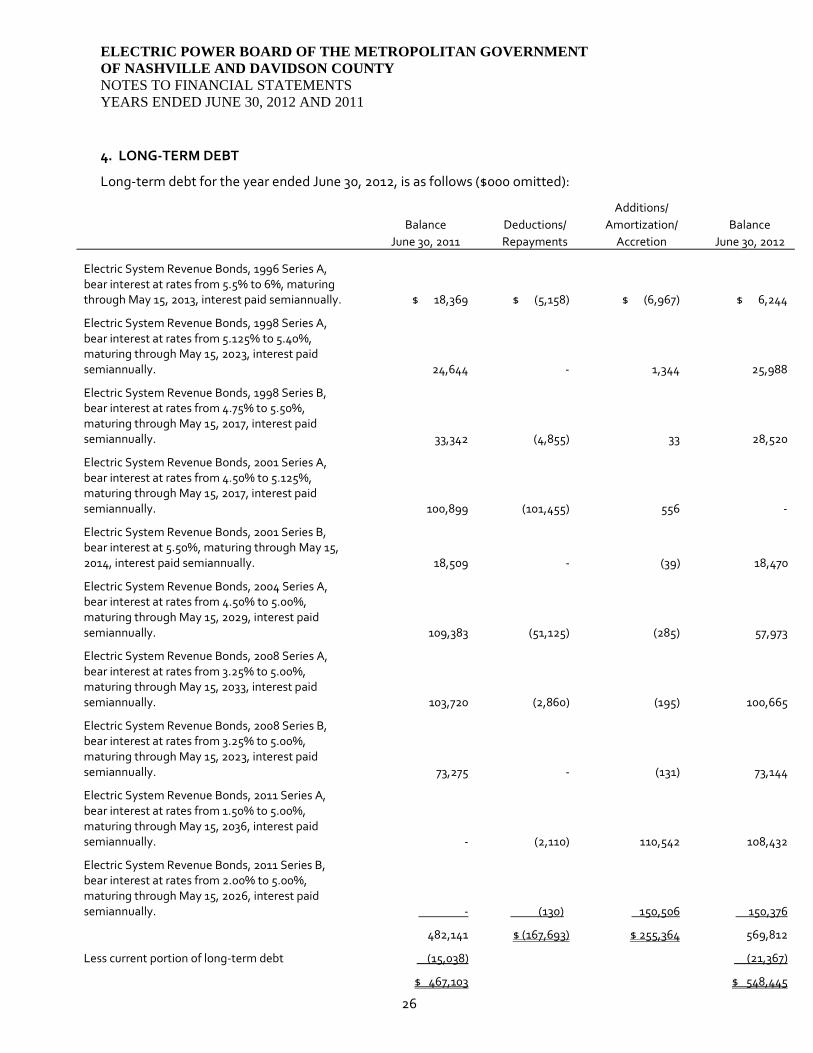
Long-term debt for the year ended June 30, 2012, is as follows ($000 omitted):
Additions/ Balance Deductions/ Amortization/ Balance June 30, 2011 Repayments Accretion June 30, 2012
Electric System Revenue Bonds, 1996 Series A, bear interest at rates from 5.5% to 6%, maturing through May 15, 2013, interest paid semiannually.
$ 18,369 $ (5,158) $ (6,967) $ 6,244
Electric System Revenue Bonds, 1998 Series A, bear interest at rates from 5.125% to 5.40%, maturing through May 15, 2023, interest paid semiannually.
24,644 - 1,344 25,988
Electric System Revenue Bonds, 1998 Series B, bear interest at rates from 4.75% to 5.50%, maturing through May 15, 2017, interest paid semiannually.
33,342
(4,855) 33 28,520
Electric System Revenue Bonds, 2001 Series A, bear interest at rates from 4.50% to 5.125%, maturing through May 15, 2017, interest paid semiannually.
100,899
(101,455) 556 -
Electric System Revenue Bonds, 2001 Series B, bear interest at 5.50%, maturing through May 15, 2014, interest paid semiannually.
18,509 - (39) 18,470
Electric System Revenue Bonds, 2004 Series A, bear interest at rates from 4.50% to 5.00%, maturing through May 15, 2029, interest paid semiannually. 109,383
(51,125) (285) 57,973
Electric System Revenue Bonds, 2008 Series A, bear interest at rates from 3.25% to 5.00%, maturing through May 15, 2033, interest paid semiannually. 103,720 (2,860) (195) 100,665
Electric System Revenue Bonds, 2008 Series B, bear interest at rates from 3.25% to 5.00%, maturing through May 15, 2023, interest paid semiannually. 73,275 - (131) 73,144
Electric System Revenue Bonds, 2011 Series A, bear interest at rates from 1.50% to 5.00%, maturing through May 15, 2036, interest paid semiannually. - (2,110) 110,542 108,432
Electric System Revenue Bonds, 2011 Series B, bear interest at rates from 2.00% to 5.00%, maturing through May 15, 2026, interest paid semiannually. - (130) 150,506 150,376
482,141 $ (167,693) $ 255,364 569,812
Less current portion of long-term debt (15,038) (21,367)
$ 467,103 $ 548,445
ELECTRIC POWER BOARD OF THE METROPOLITAN GOVERNMENT OF NASHVILLE AND DAVIDSON COUNTY NOTES TO FINANCIAL STATEMENTS YEARS ENDED JUNE 30, 2012 AND 2011
27
4. LONG-TERM DEBT (continued)
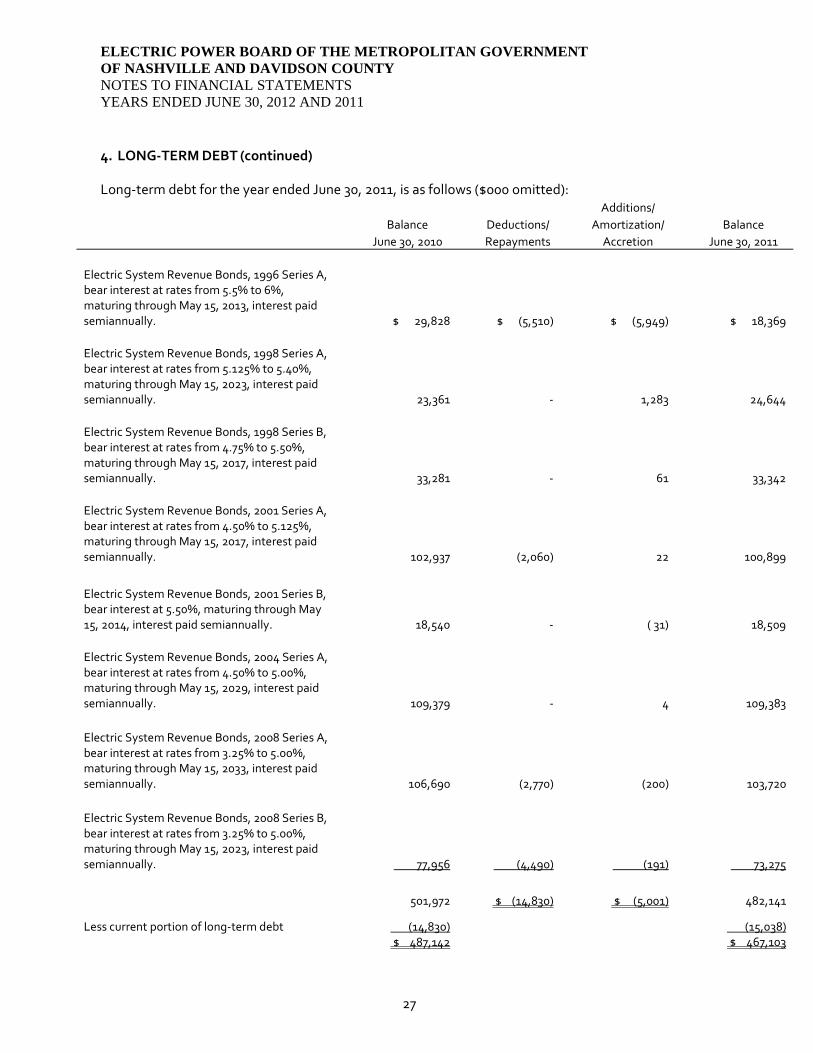
Long-term debt for the year ended June 30, 2011, is as follows ($000 omitted): Additions/ Balance Deductions/ Amortization/ Balance June 30, 2010 Repayments Accretion June 30, 2011 Electric System Revenue Bonds, 1996 Series A, bear interest at rates from 5.5% to 6%, maturing through May 15, 2013, interest paid semiannually.
$ 29,828 $ (5,510) $ (5,949) $ 18,369 Electric System Revenue Bonds, 1998 Series A, bear interest at rates from 5.125% to 5.40%, maturing through May 15, 2023, interest paid semiannually.
23,361 - 1,283 24,644 Electric System Revenue Bonds, 1998 Series B, bear interest at rates from 4.75% to 5.50%, maturing through May 15, 2017, interest paid semiannually.
33,281 - 61 33,342 Electric System Revenue Bonds, 2001 Series A, bear interest at rates from 4.50% to 5.125%, maturing through May 15, 2017, interest paid semiannually.
102,937 (2,060) 22 100,899
Electric System Revenue Bonds, 2001 Series B, bear interest at 5.50%, maturing through May 15, 2014, interest paid semiannually.
18,540 - ( 31) 18,509 Electric System Revenue Bonds, 2004 Series A, bear interest at rates from 4.50% to 5.00%, maturing through May 15, 2029, interest paid semiannually. 109,379 - 4 109,383 Electric System Revenue Bonds, 2008 Series A, bear interest at rates from 3.25% to 5.00%, maturing through May 15, 2033, interest paid semiannually. 106,690 (2,770) (200) 103,720 Electric System Revenue Bonds, 2008 Series B, bear interest at rates from 3.25% to 5.00%, maturing through May 15, 2023, interest paid semiannually. 77,956 (4,490) (191) 73,275
501,972 $ (14,830) $ (5,001) 482,141
Less current portion of long-term debt (14,830) (15,038) $ 487,142 $ 467,103
ELECTRIC POWER BOARD OF THE METROPOLITAN GOVERNMENT OF NASHVILLE AND DAVIDSON COUNTY NOTES TO FINANCIAL STATEMENTS YEARS ENDED JUNE 30, 2012 AND 2011
28
4. LONG-TERM DEBT (continued)
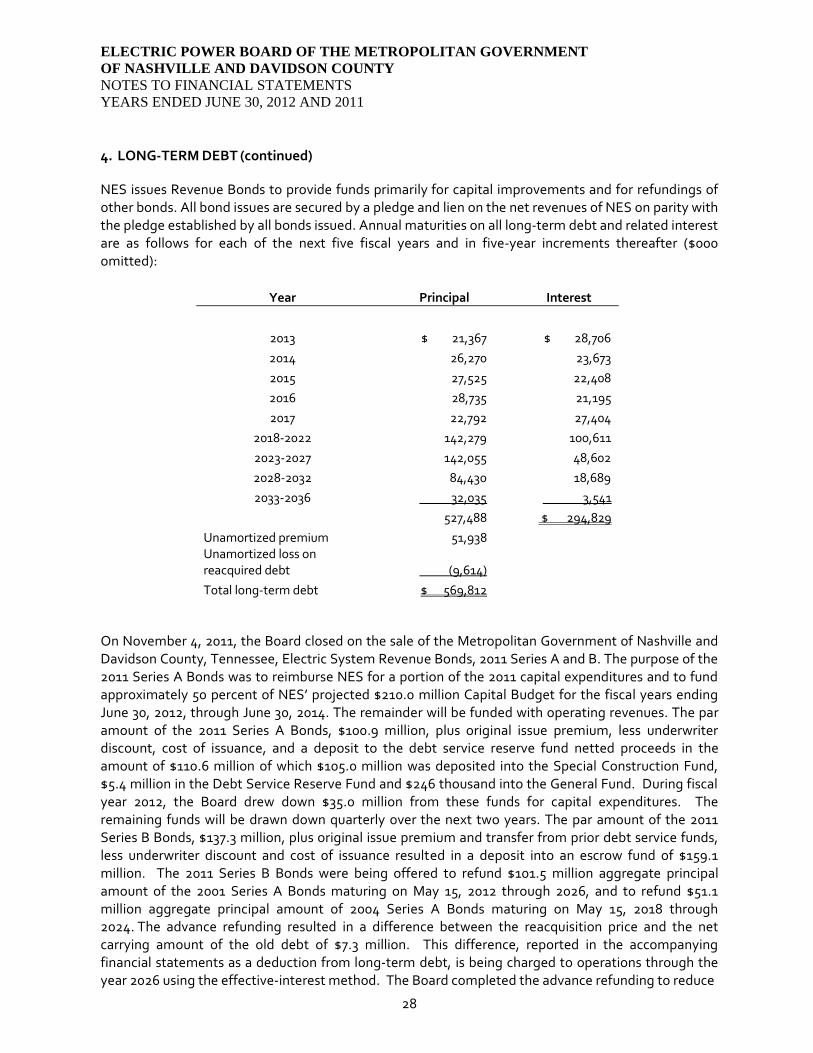
NES issues Revenue Bonds to provide funds primarily for capital improvements and for refundings of other bonds. All bond issues are secured by a pledge and lien on the net revenues of NES on parity with the pledge established by all bonds issued. Annual maturities on all long-term debt and related interest are as follows for each of the next five fiscal years and in five-year increments thereafter ($000 omitted):
Year Principal Interest
2013 $ 21,367 $ 28,706 2014 26,270 23,673 2015 27,525 22,408 2016 28,735 21,195 2017 22,792 27,404
2018-2022 142,279 100,611 2023-2027 142,055 48,602 2028-2032 84,430 18,689 2033-2036 32,035 3,541
527,488 $ 294,829 Unamortized premium 51,938 Unamortized loss on reacquired debt (9,614)
Total long-term debt $ 569,812
On November 4, 2011, the Board closed on the sale of the Metropolitan Government of Nashville and Davidson County, Tennessee, Electric System Revenue Bonds, 2011 Series A and B. The purpose of the 2011 Series A Bonds was to reimburse NES for a portion of the 2011 capital expenditures and to fund approximately 50 percent of NES’ projected $210.0 million Capital Budget for the fiscal years ending June 30, 2012, through June 30, 2014. The remainder will be funded with operating revenues. The par amount of the 2011 Series A Bonds, $100.9 million, plus original issue premium, less underwriter discount, cost of issuance, and a deposit to the debt service reserve fund netted proceeds in the amount of $110.6 million of which $105.0 million was deposited into the Special Construction Fund, $5.4 million in the Debt Service Reserve Fund and $246 thousand into the General Fund. During fiscal year 2012, the Board drew down $35.0 million from these funds for capital expenditures. The remaining funds will be drawn down quarterly over the next two years. The par amount of the 2011 Series B Bonds, $137.3 million, plus original issue premium and transfer from prior debt service funds, less underwriter discount and cost of issuance resulted in a deposit into an escrow fund of $159.1 million. The 2011 Series B Bonds were being offered to refund $101.5 million aggregate principal amount of the 2001 Series A Bonds maturing on May 15, 2012 through 2026, and to refund $51.1 million aggregate principal amount of 2004 Series A Bonds maturing on May 15, 2018 through 2024. The advance refunding resulted in a difference between the reacquisition price and the net carrying amount of the old debt of $7.3 million. This difference, reported in the accompanying financial statements as a deduction from long-term debt, is being charged to operations through the year 2026 using the effective-interest method. The Board completed the advance refunding to reduce
ELECTRIC POWER BOARD OF THE METROPOLITAN GOVERNMENT OF NASHVILLE AND DAVIDSON COUNTY NOTES TO FINANCIAL STATEMENTS YEARS ENDED JUNE 30, 2012 AND 2011
29
4. LONG-TERM DEBT (continued)
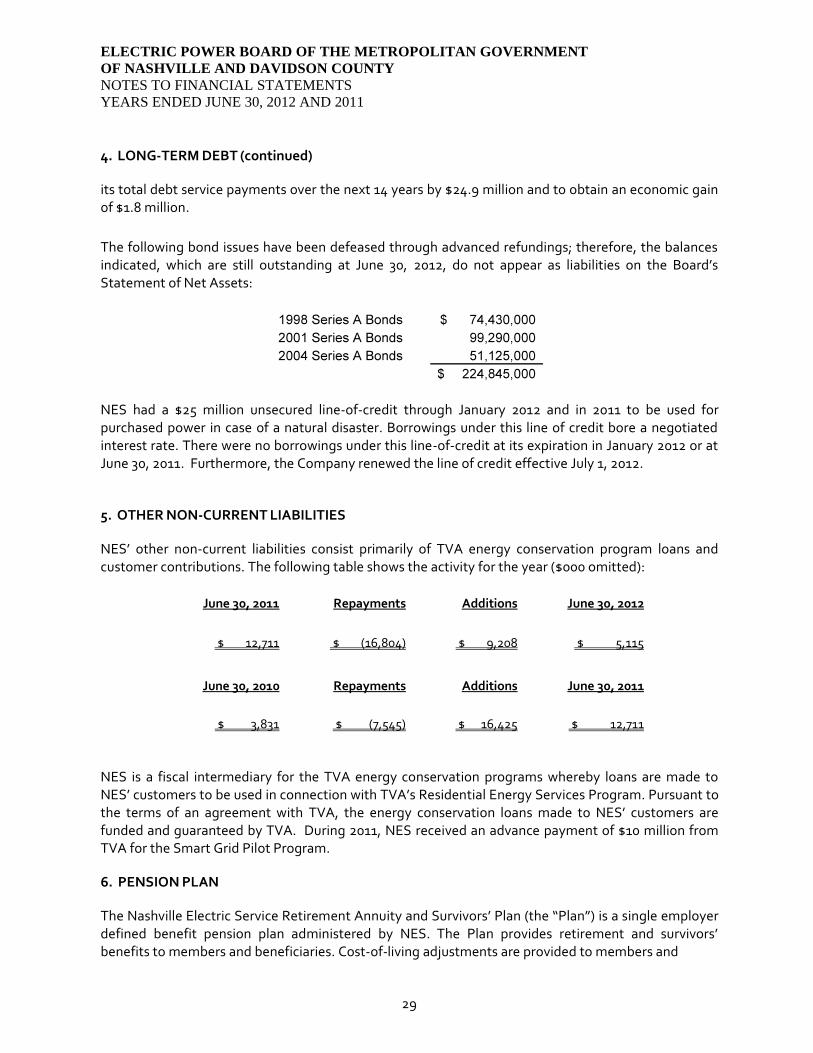
its total debt service payments over the next 14 years by $24.9 million and to obtain an economic gain of $1.8 million. The following bond issues have been defeased through advanced refundings; therefore, the balances indicated, which are still outstanding at June 30, 2012, do not appear as liabilities on the Board’s Statement of Net Assets:
NES had a $25 million unsecured line-of-credit through January 2012 and in 2011 to be used for purchased power in case of a natural disaster. Borrowings under this line of credit bore a negotiated interest rate. There were no borrowings under this line-of-credit at its expiration in January 2012 or at June 30, 2011. Furthermore, the Company renewed the line of credit effective July 1, 2012.
5. OTHER NON-CURRENT LIABILITIES
NES’ other non-current liabilities consist primarily of TVA energy conservation program loans and customer contributions. The following table shows the activity for the year ($000 omitted):
June 30, 2011 Repayments Additions June 30, 2012
$ 12,711 $ (16,804) $ 9,208 $ 5,115
June 30, 2010 Repayments Additions June 30, 2011
$ 3,831 $ (7,545) $ 16,425 $ 12,711
NES is a fiscal intermediary for the TVA energy conservation programs whereby loans are made to NES’ customers to be used in connection with TVA’s Residential Energy Services Program. Pursuant to the terms of an agreement with TVA, the energy conservation loans made to NES’ customers are funded and guaranteed by TVA. During 2011, NES received an advance payment of $10 million from TVA for the Smart Grid Pilot Program.
6. PENSION PLAN
The Nashville Electric Service Retirement Annuity and Survivors’ Plan (the “Plan”) is a single employer defined benefit pension plan administered by NES. The Plan provides retirement and survivors’ benefits to members and beneficiaries. Cost-of-living adjustments are provided to members and
ELECTRIC POWER BOARD OF THE METROPOLITAN GOVERNMENT OF NASHVILLE AND DAVIDSON COUNTY NOTES TO FINANCIAL STATEMENTS YEARS ENDED JUNE 30, 2012 AND 2011
30
6. PENSION PLAN (continued)
beneficiaries annually. The Charter of the Metropolitan Government assigns the authority to establish and amend benefit provisions to NES. The Plan is not required to issue a separate financial report.
At June 30, 2012, all full-time regular employees under age 65 are eligible to participate in the Plan. Employees hired after June 30 are eligible to participate in the Nashville Electric Service Defined Contribution Plan. The vesting provision of the Plan provides for five-year cliff vesting. NES employees who retire at or after age 65 are entitled to annual retirement benefits payable monthly for life in an amount equal to 2 percent of final average compensation multiplied by years in the Plan not in excess of 35 years.
Final average compensation is the average compensation in the 36 consecutive months in which compensation is highest. Unused sick leave may be used to increase credited service and benefit percentage under certain circumstances. Early retirement is an option beginning at age 55 with 15 years of credited service or at age 50 with 30 years of credited service with an actuarially-reduced monthly benefit.
If the participant has attained age 55, and his/her age plus service is 85 or greater, then there is no reduction for early receipt of the benefit. However, a participant cannot use accumulated sick leave to increase effective age to meet the requirements for this unreduced benefit. For a participant with 25 or more years of service, the minimum pension benefit is $1,800 per month.
The contribution requirements of NES are established and may be amended by NES. The Plan is currently non-contributory. NES’ practice is to typically fund at least the minimum contribution for a 30-year funding level. The current rate is 33.24 percent of annual covered payroll. NES contributed 100 percent of the required contribution for the Plan years 2012 and 2011.
The annual required contribution for the current year was determined as part of the April 1, 2011, actuarial valuation using the frozen initial liability method. The actuarial assumptions included (a) 8.0 percent investment rate of return and (b) projected salary increases of 4.5 percent. Both (a) and (b) included an inflation component. The assumptions include cost-of-living post-retirement benefit increases equal to 2 percent per year. The actuarial value of Plan assets is determined using techniques that smooth the effects of short-term volatility in the market value of investments over a three-year period. The unfunded actuarial accrued liability is being amortized over 30 years. The required schedule of funding progress below presents multi-year trend information about whether the actuarial value of plan assets is increasing or decreasing over time relative to the actuarial accrued liability for benefits.
ELECTRIC POWER BOARD OF THE METROPOLITAN GOVERNMENT OF NASHVILLE AND DAVIDSON COUNTY NOTES TO FINANCIAL STATEMENTS YEARS ENDED JUNE 30, 2012 AND 2011
31
6. PENSION PLAN (continued)
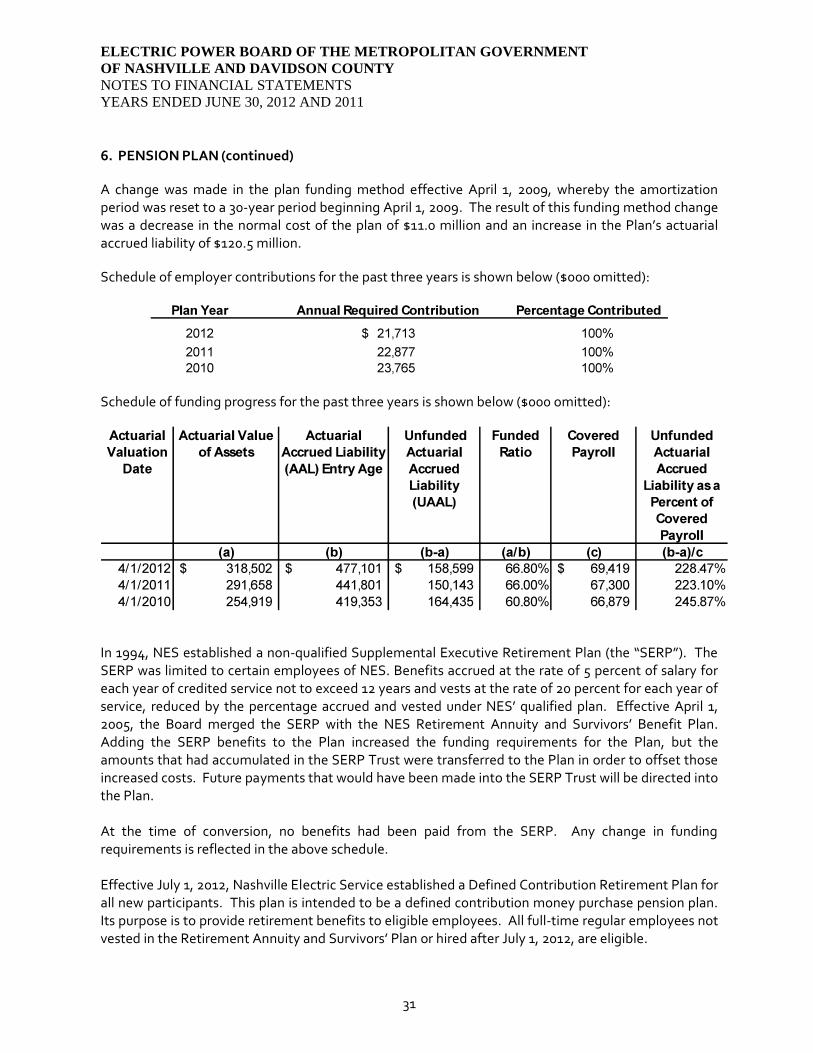
A change was made in the plan funding method effective April 1, 2009, whereby the amortization period was reset to a 30-year period beginning April 1, 2009. The result of this funding method change was a decrease in the normal cost of the plan of $11.0 million and an increase in the Plan’s actuarial accrued liability of $120.5 million.
Schedule of employer contributions for the past three years is shown below ($000 omitted):
Schedule of funding progress for the past three years is shown below ($000 omitted):
In 1994, NES established a non-qualified Supplemental Executive Retirement Plan (the “SERP”). The SERP was limited to certain employees of NES. Benefits accrued at the rate of 5 percent of salary for each year of credited service not to exceed 12 years and vests at the rate of 20 percent for each year of service, reduced by the percentage accrued and vested under NES’ qualified plan. Effective April 1, 2005, the Board merged the SERP with the NES Retirement Annuity and Survivors’ Benefit Plan. Adding the SERP benefits to the Plan increased the funding requirements for the Plan, but the amounts that had accumulated in the SERP Trust were transferred to the Plan in order to offset those increased costs. Future payments that would have been made into the SERP Trust will be directed into the Plan. At the time of conversion, no benefits had been paid from the SERP. Any change in funding requirements is reflected in the above schedule. Effective July 1, 2012, Nashville Electric Service established a Defined Contribution Retirement Plan for all new participants. This plan is intended to be a defined contribution money purchase pension plan. Its purpose is to provide retirement benefits to eligible employees. All full-time regular employees not vested in the Retirement Annuity and Survivors’ Plan or hired after July 1, 2012, are eligible.
ELECTRIC POWER BOARD OF THE METROPOLITAN GOVERNMENT OF NASHVILLE AND DAVIDSON COUNTY NOTES TO FINANCIAL STATEMENTS YEARS ENDED JUNE 30, 2012 AND 2011
32
7. DEFERRED COMPENSATION PLAN
NES has a deferred compensation plan (the “457 Plan”) created in accordance with Internal Revenue Code (“IRC”) Section 457. The 457 Plan, which is available to all full-time employees, permits employees to defer a portion of their salary until future years. Employees may contribute up to the legal limit of their compensation to the 457 Plan with NES providing a matching contribution of up to 3 percent of compensation. The 457 Plan provides that assets or income of the 457 Plan shall be used for the exclusive purpose of providing benefits for participants and their beneficiaries or defraying reasonable expenses of administration of the 457 Plan. Since the assets of the 457 Plan are held in custodial and annuity accounts for the exclusive benefit of 457 Plan participants, the related assets of the 457 Plan are not reflected on the statements of net assets. Employees contributed $3.4 million during each of the years ended June 30, 2012 and 2011. NES contributed $1.9 million and $1.8 million to the 457 Plan for the years ended June 30, 2012 and 2011, respectively.
8. POST-EMPLOYMENT BENEFITS
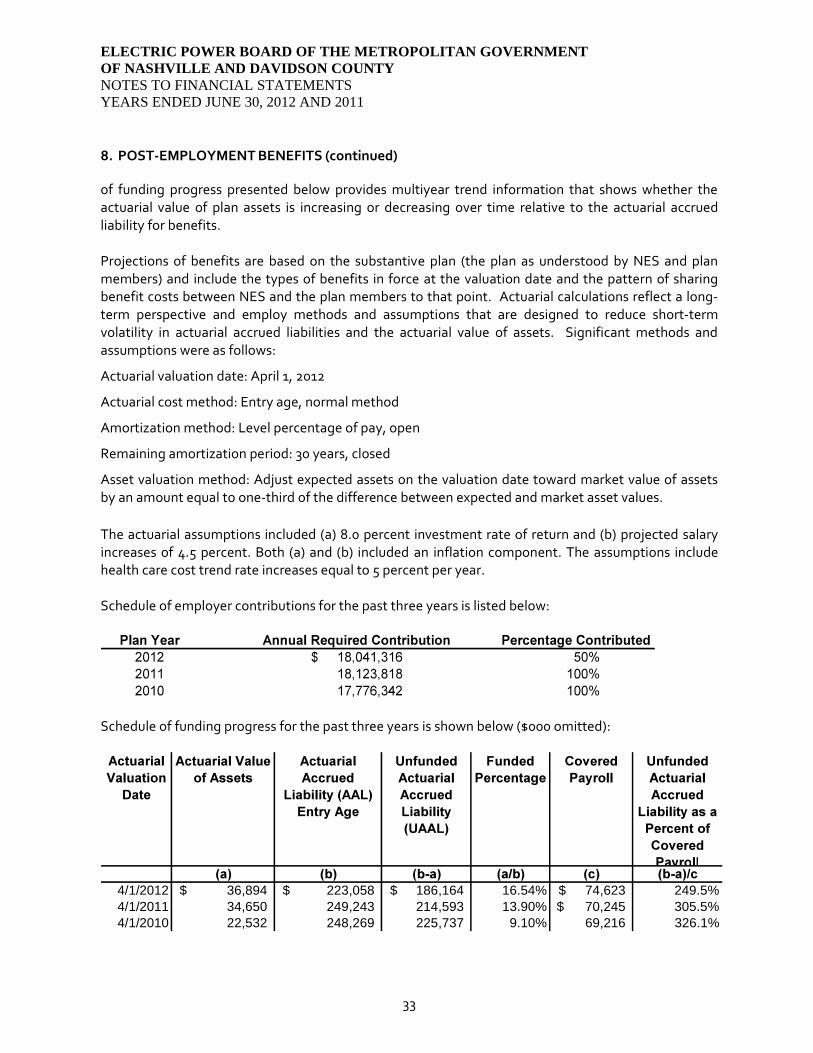
In addition to the pension benefits described in Note 6 and the deferred compensation benefits described in Note 7, NES provides post-retirement medical, dental, and life insurance benefits to all employees who retire from NES under the provisions of the qualified plan and supplemental executive retirement plan. Medical and dental benefits are also provided to their spouses. As of June 30, 2012, approximately 571 retirees meet those eligibility requirements. Expenses for these post-retirement benefits have previously been recognized as retirees report claims. Those incurred claims totaled $10.0 million and $9.0 million for the years ended June 30, 2012 and 2011, respectively. During the year ended June 30, 2008, NES implemented the provisions of GASB Statement No. 45, Accounting and Financial Reporting by Employers for Post-Employment Benefits Other Than Pensions. These provisions were applied prospectively with respect to NES’ Other Post-Employment Benefits (OPEB) Plan. GASB Statement No. 45 requires the accrual of OPEB obligations over the working careers of plan members rather than as claims are incurred. The total expenses that were recognized were $18.1 million during each of the years ended June 30, 2012 and 2011.
The NES OPEB Plan is a single-employer defined benefit plan funded through an irrevocable trust that was established during the year ended June 30, 2008. The OPEB Plan is not required to issue a separate financial report. NES’ annual OPEB cost (expense) is calculated based on the annual required contribution (ARC), an amount actuarially determined in accordance with the parameters of GASB Statement No. 45. The ARC represents a level of funding that, if paid on an ongoing basis, is projected to cover normal cost each year and to amortize any unfunded actuarial liabilities (or funding excess) over a 30-year period beginning April 1, 2009. The current rate is 25.68 percent of annual covered payroll. NES contributed 50 percent of the required contribution for the Plan year. The remaining 50 percent was funded by June 30, 2012. Actuarial valuations involve estimates of the value of reported amounts and assumptions about the probability of events in the future. Amounts determined regarding the funded status of the plan and the annual required contributions of NES are subject to continual revision as actual results are compared to past expectations and new estimates are made about the future. The required schedule
ELECTRIC POWER BOARD OF THE METROPOLITAN GOVERNMENT OF NASHVILLE AND DAVIDSON COUNTY NOTES TO FINANCIAL STATEMENTS YEARS ENDED JUNE 30, 2012 AND 2011
33
8. POST-EMPLOYMENT BENEFITS (continued)
of funding progress presented below provides multiyear trend information that shows whether the actuarial value of plan assets is increasing or decreasing over time relative to the actuarial accrued liability for benefits. Projections of benefits are based on the substantive plan (the plan as understood by NES and plan members) and include the types of benefits in force at the valuation date and the pattern of sharing benefit costs between NES and the plan members to that point. Actuarial calculations reflect a long-term perspective and employ methods and assumptions that are designed to reduce short-term volatility in actuarial accrued liabilities and the actuarial value of assets. Significant methods and assumptions were as follows:
Actuarial valuation date: April 1, 2012
Actuarial cost method: Entry age, normal method
Amortization method: Level percentage of pay, open
Remaining amortization period: 30 years, closed
Asset valuation method: Adjust expected assets on the valuation date toward market value of assets by an amount equal to one-third of the difference between expected and market asset values. The actuarial assumptions included (a) 8.0 percent investment rate of return and (b) projected salary increases of 4.5 percent. Both (a) and (b) included an inflation component. The assumptions include health care cost trend rate increases equal to 5 percent per year. Schedule of employer contributions for the past three years is listed below:
Schedule of funding progress for the past three years is shown below ($000 omitted):
4/1/2012 36,894$ 223,058$ 186,164$ 16.54% 74,623$ 249.5%4/1/2011 34,650 249,243 214,593 13.90% 70,245$ 305.5%4/1/2010 22,532 248,269 225,737 9.10% 69,216 326.1%
ELECTRIC POWER BOARD OF THE METROPOLITAN GOVERNMENT OF NASHVILLE AND DAVIDSON COUNTY NOTES TO FINANCIAL STATEMENTS YEARS ENDED JUNE 30, 2012 AND 2011
34
9. LEASES
Total rental expense entering into the determination of net operating income amounted to approximately $1.0 million in both 2012 and 2011, respectively. Rental expense consists primarily of payments for facilities rental and leasing arrangements for software licensing. NES leases these facilities and software under various cancelable lease agreements. Rental income is received under pole-attachment leases, which are accounted for as operating leases. These leases are cancelable. Therefore, future minimum rentals under these leases are not significant. Rental income from this source totaled $2.1 million and $2.4 million for the years ended June 30, 2012 and 2011, respectively.
10. RISK MANAGEMENT AND LIABILITY
NES is exposed to various risks of loss related to torts; theft or damage to, and destruction of assets; errors and omissions; injuries to employees; and natural disasters. NES is an agency of the Metropolitan Government and is covered under the Tennessee Governmental Tort Liability Act, TCA 29-20-101, et al,(the “Act”) and is self-insured under the act for tort liability. NES is immune from any award or judgment for death, bodily injury and/or property damage in excess of the limits as set forth in the Act. Therefore, NES has not secured insurance coverage in excess of such limits. As of June 30, 2011, NES was a participant in the Metropolitan Government Insurance Pool (the “Pool”) for coverage of most property losses. The Pool is operated as a common risk management and insurance program for several public entities, including NES, the Metropolitan Nashville Airport Authority, the Metropolitan Transit Authority and the Department of Water and Sewerage Services. The Pool is self-sustaining through member premiums. NES subrogates for all losses paid out for the negligence of other parties.
At June 30, 2012, NES is no longer a participant of the Pool. With some of the sub-limits of the Pool coverage being reached as a result of the damage sustained by many participants of the Pool during the flood of 2010, NES deemed it prudent to withdraw from the Pool and obtain commercial property insurance that would no longer have shared sub-limits.
NES is self-insured for employee medical, dental and vision claims and self-insured up to $100,000 for employee medical claims. The changes in the insurance reserves for medical, dental and vision benefits for the years ended June 30, 2012 and 2011, are as follows ($000 omitted):
NES continues to carry commercial insurance for all other risks of loss, including a retention with excess workers’ compensation coverage and employee health and accident insurance. Settled claims resulting from these risks have not exceeded commercial insurance coverage in any of the past three fiscal years.
ELECTRIC POWER BOARD OF THE METROPOLITAN GOVERNMENT OF NASHVILLE AND DAVIDSON COUNTY NOTES TO FINANCIAL STATEMENTS YEARS ENDED JUNE 30, 2012 AND 2011
35
10. RISK MANAGEMENT AND LIABILITY (continued)
NES is party to various lawsuits filed against it in the normal course of business. Management does not believe that damages, if any, arising from outstanding litigation, will have a material effect on the financial position of NES.
11. RELATED PARTY TRANSACTIONS
NES had related party balances and transactions as a result of providing electric power to the Metropolitan Government and entities of the Metropolitan Government, as well as making tax-equivalent payments to the Metropolitan Government and other payments to entities of the Metropolitan Government. These balances and transactions as of and for the years ended June 30, 2012 and 2011, are summarized as follows ($000 omitted):
2012 2011
Balances: Accounts receivable $ 2,479 $ 2,337 Accounts payable - - Transactions: Commercial and industrial revenue—Metropolitan Government Entities 58,963 57,416 Street and highway lighting revenue—Metropolitan Government Entities 6,347 6,266 Tax equivalents operating expense—Metropolitan Government Entities 26,562 25,917
In addition to the receivables above, NES also has a receivable from the Music City Convention Authority of $9.4 million and $7.3 million in 2012 and 2011, respectively.
12. FAIR VALUE OF FINANCIAL INSTRUMENTS
Fair Value of Financial Instruments has been determined by NES using available market information. However, judgment is required in interpreting market data to develop the estimates of fair value. Accordingly, the fair values are not necessarily indicative of the amounts that NES could realize in a current market exchange. The carrying amounts of cash and short-term investments, investments of special funds, accounts receivable and accounts payable are a reasonable estimate of their fair value. The fair value of NES’ long-term debt is estimated to be $624.0 million and $514.1 million at June 30, 2012 and 2011, respectively.
13. EXTRAORDINARY GAIN (LOSS) – FLOOD NES experienced significant damage and loss in connection with heavy rainfall and flooding in the Metro Nashville /Davidson County area in May 2010. The flooding resulted in the declaration of a Federal Disaster area by the Federal Emergency Management Agency. For the fiscal year ended June 30, 2012, NES received insurance recoveries in the amount of $2.0 million, which resulted in an extraordinary gain.
ELECTRIC POWER BOARD OF THE METROPOLITAN GOVERNMENT OF NASHVILLE AND DAVIDSON COUNTY NOTES TO FINANCIAL STATEMENTS YEARS ENDED JUNE 30, 2012 AND 2011
36
At June 30, 2011, NES recorded an extraordinary loss of $2.4 million in damages to reflect the unusual and infrequent nature of the damage and related loss to NES' assets and the associated costs of restoration, repair and replacement. The $2.4 million extraordinary loss was made up of $1.9 million in expenditures and a reduction to the prior year FEMA receivable of $0.5 million.
.
ELECTRIC POWER BOARD OF THE METROPOLITAN GOVERNMENT OF NASHVILLE AND DAVIDSON COUNTY
SUPPLEMENTARY INFORMATION
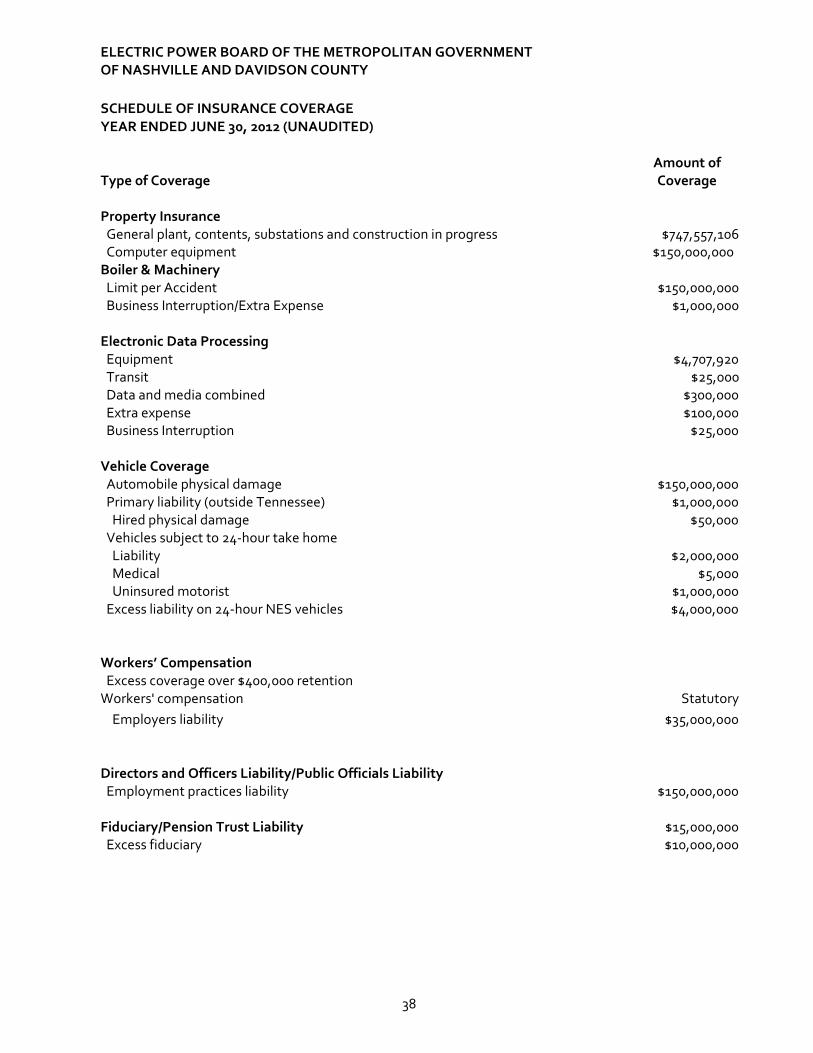
ELECTRIC POWER BOARD OF THE METROPOLITAN GOVERNMENT OF NASHVILLE AND DAVIDSON COUNTY
38
SCHEDULE OF INSURANCE COVERAGE YEAR ENDED JUNE 30, 2012 (UNAUDITED)
Amount of
Type of Coverage Coverage
Property Insurance General plant, contents, substations and construction in progress $747,557,106 Computer equipment $150,000,000 Boiler & Machinery Limit per Accident $150,000,000 Business Interruption/Extra Expense $1,000,000 Electronic Data Processing Equipment $4,707,920 Transit $25,000 Data and media combined $300,000 Extra expense $100,000 Business Interruption $25,000
Vehicle Coverage Automobile physical damage $150,000,000 Primary liability (outside Tennessee) $1,000,000 Hired physical damage $50,000 Vehicles subject to 24-hour take home Liability $2,000,000 Medical $5,000 Uninsured motorist $1,000,000 Excess liability on 24-hour NES vehicles $4,000,000
Workers’ Compensation Excess coverage over $400,000 retention Workers' compensation Statutory Employers liability $35,000,000
Directors and Officers Liability/Public Officials Liability Employment practices liability $150,000,000
Fiduciary/Pension Trust Liability $15,000,000 Excess fiduciary $10,000,000
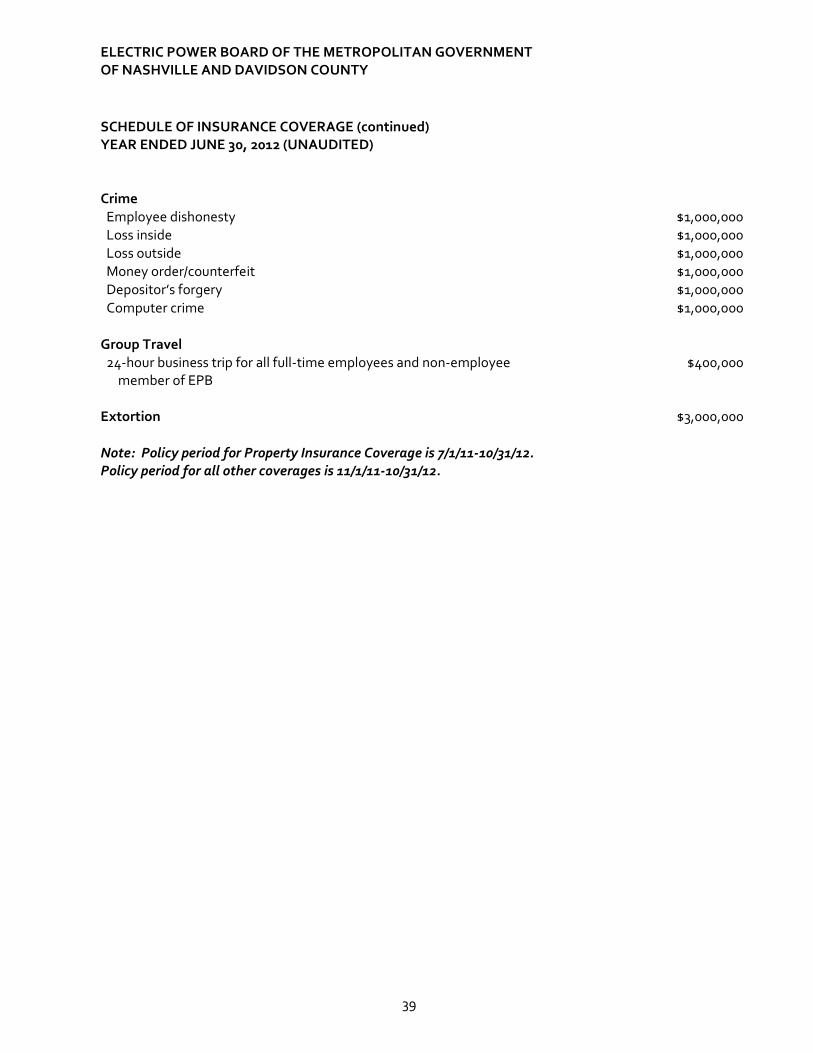
ELECTRIC POWER BOARD OF THE METROPOLITAN GOVERNMENT OF NASHVILLE AND DAVIDSON COUNTY
39
SCHEDULE OF INSURANCE COVERAGE (continued) YEAR ENDED JUNE 30, 2012 (UNAUDITED) Crime Employee dishonesty $1,000,000 Loss inside $1,000,000 Loss outside $1,000,000 Money order/counterfeit $1,000,000 Depositor’s forgery $1,000,000 Computer crime $1,000,000 Group Travel 24-hour business trip for all full-time employees and non-employee member of EPB
$400,000
Extortion $3,000,000 Note: Policy period for Property Insurance Coverage is 7/1/11-10/31/12. Policy period for all other coverages is 11/1/11-10/31/12.
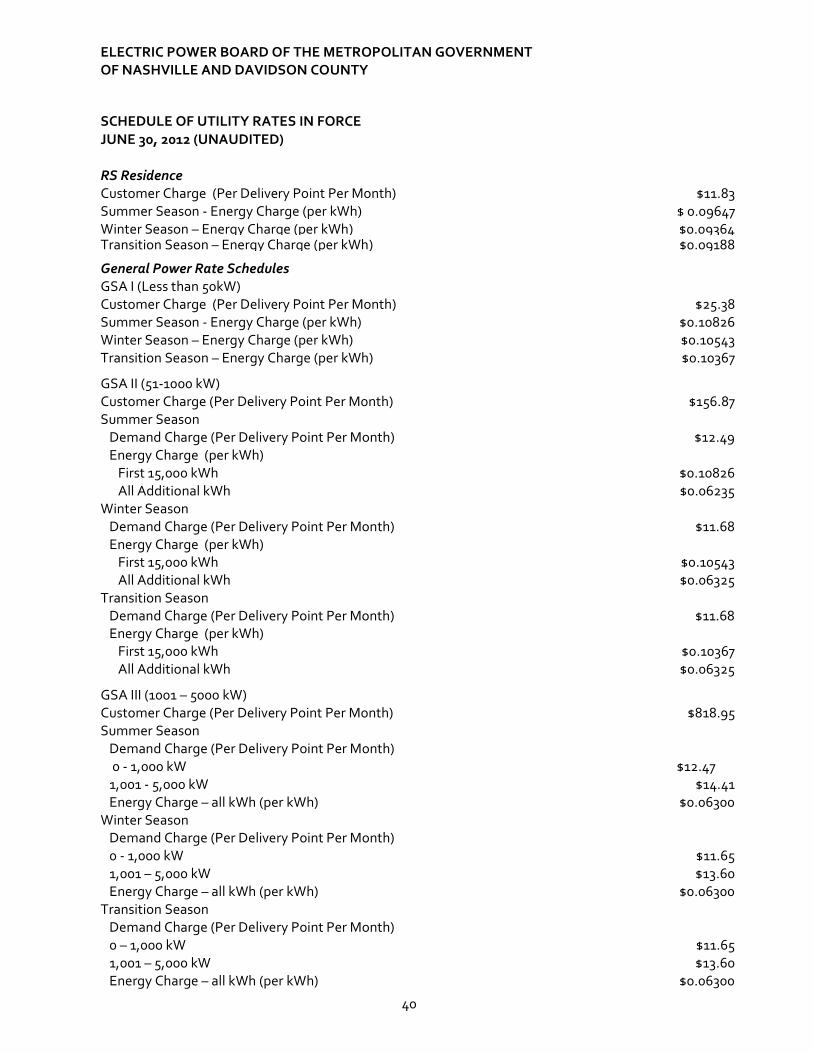
ELECTRIC POWER BOARD OF THE METROPOLITAN GOVERNMENT OF NASHVILLE AND DAVIDSON COUNTY
40
SCHEDULE OF UTILITY RATES IN FORCE JUNE 30, 2012 (UNAUDITED)
RS Residence Customer Charge (Per Delivery Point Per Month) $11.83 Summer Season - Energy Charge (per kWh) $ 0.09647 Winter Season – Energy Charge (per kWh) $0.09364Transition Season – Energy Charge (per kWh) $0.09188
General Power Rate Schedules
GSA I (Less than 50kW) Customer Charge (Per Delivery Point Per Month) $25.38 Summer Season - Energy Charge (per kWh) $0.10826 Winter Season – Energy Charge (per kWh) $0.10543 Transition Season – Energy Charge (per kWh) $0.10367
GSA II (51-1000 kW) Customer Charge (Per Delivery Point Per Month) $156.87 Summer Season Demand Charge (Per Delivery Point Per Month) $12.49 Energy Charge (per kWh) First 15,000 kWh $0.10826 All Additional kWh $0.06235 Winter Season Demand Charge (Per Delivery Point Per Month) $11.68 Energy Charge (per kWh) First 15,000 kWh $0.10543 All Additional kWh $0.06325 Transition Season Demand Charge (Per Delivery Point Per Month) $11.68 Energy Charge (per kWh) First 15,000 kWh $0.10367 All Additional kWh $0.06325
GSA III (1001 – 5000 kW)
Customer Charge (Per Delivery Point Per Month) $818.95 Summer Season Demand Charge (Per Delivery Point Per Month) 0 - 1,000 kW $12.47 1,001 - 5,000 kW $14.41 Energy Charge – all kWh (per kWh) $0.06300 Winter Season Demand Charge (Per Delivery Point Per Month) 0 - 1,000 kW $11.65 1,001 – 5,000 kW $13.60 Energy Charge – all kWh (per kWh) $0.06300 Transition Season Demand Charge (Per Delivery Point Per Month) 0 – 1,000 kW $11.65 1,001 – 5,000 kW $13.60 Energy Charge – all kWh (per kWh) $0.06300
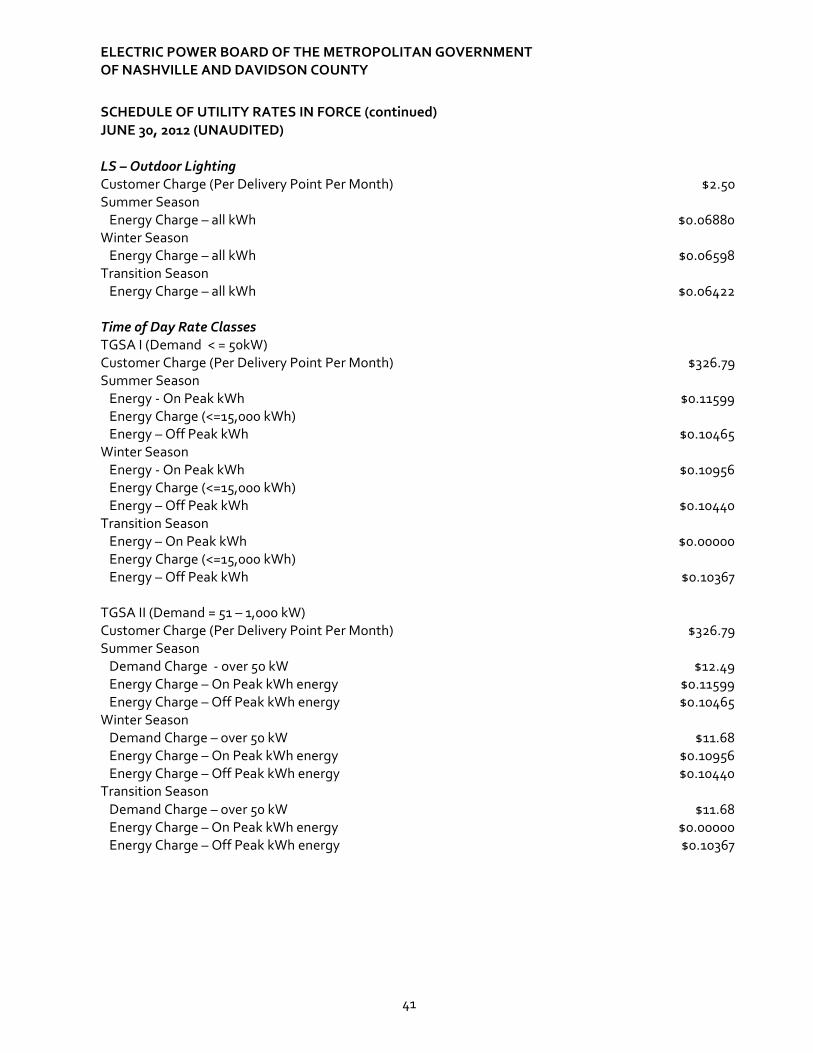
ELECTRIC POWER BOARD OF THE METROPOLITAN GOVERNMENT OF NASHVILLE AND DAVIDSON COUNTY
41
SCHEDULE OF UTILITY RATES IN FORCE (continued) JUNE 30, 2012 (UNAUDITED)
LS – Outdoor Lighting Customer Charge (Per Delivery Point Per Month) $2.50 Summer Season Energy Charge – all kWh $0.06880 Winter Season Energy Charge – all kWh $0.06598 Transition Season Energy Charge – all kWh $0.06422 Time of Day Rate Classes TGSA I (Demand < = 50kW) Customer Charge (Per Delivery Point Per Month) $326.79 Summer Season Energy - On Peak kWh $0.11599 Energy Charge (<=15,000 kWh) Energy – Off Peak kWh $0.10465 Winter Season Energy - On Peak kWh $0.10956 Energy Charge (<=15,000 kWh) Energy – Off Peak kWh $0.10440 Transition Season Energy – On Peak kWh $0.00000 Energy Charge (<=15,000 kWh) Energy – Off Peak kWh $0.10367 TGSA II (Demand = 51 – 1,000 kW) Customer Charge (Per Delivery Point Per Month) $326.79 Summer Season Demand Charge - over 50 kW $12.49 Energy Charge – On Peak kWh energy $0.11599 Energy Charge – Off Peak kWh energy $0.10465 Winter Season Demand Charge – over 50 kW $11.68 Energy Charge – On Peak kWh energy $0.10956 Energy Charge – Off Peak kWh energy $0.10440Transition Season Demand Charge – over 50 kW $11.68 Energy Charge – On Peak kWh energy $0.00000 Energy Charge – Off Peak kWh energy $0.10367
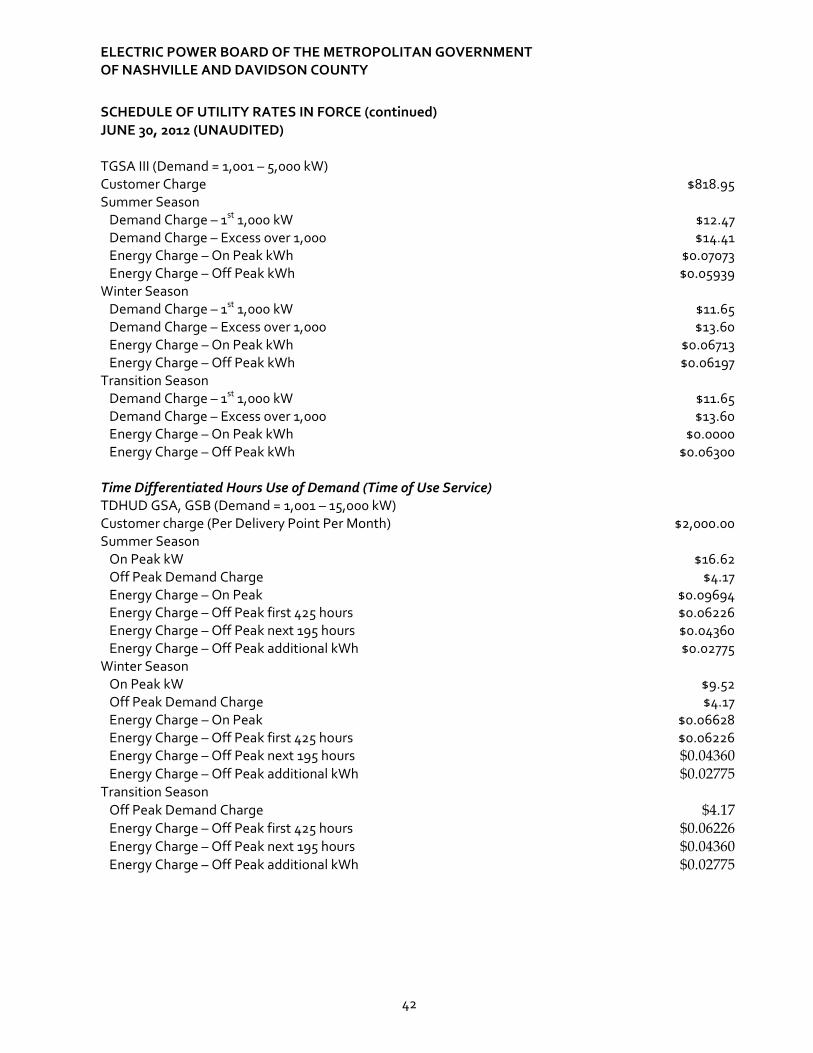
ELECTRIC POWER BOARD OF THE METROPOLITAN GOVERNMENT OF NASHVILLE AND DAVIDSON COUNTY
42
SCHEDULE OF UTILITY RATES IN FORCE (continued) JUNE 30, 2012 (UNAUDITED)
TGSA III (Demand = 1,001 – 5,000 kW) Customer Charge $818.95 Summer Season Demand Charge – 1st 1,000 kW $12.47 Demand Charge – Excess over 1,000 $14.41 Energy Charge – On Peak kWh $0.07073 Energy Charge – Off Peak kWh $0.05939 Winter Season Demand Charge – 1st 1,000 kW $11.65 Demand Charge – Excess over 1,000 $13.60 Energy Charge – On Peak kWh $0.06713 Energy Charge – Off Peak kWh $0.06197 Transition Season Demand Charge – 1st 1,000 kW $11.65 Demand Charge – Excess over 1,000 $13.60 Energy Charge – On Peak kWh $0.0000 Energy Charge – Off Peak kWh $0.06300 Time Differentiated Hours Use of Demand (Time of Use Service) TDHUD GSA, GSB (Demand = 1,001 – 15,000 kW) Customer charge (Per Delivery Point Per Month) $2,000.00 Summer Season On Peak kW $16.62 Off Peak Demand Charge $4.17 Energy Charge – On Peak $0.09694 Energy Charge – Off Peak first 425 hours $0.06226 Energy Charge – Off Peak next 195 hours $0.04360 Energy Charge – Off Peak additional kWh $0.02775 Winter Season On Peak kW $9.52 Off Peak Demand Charge $4.17 Energy Charge – On Peak $0.06628 Energy Charge – Off Peak first 425 hours $0.06226 Energy Charge – Off Peak next 195 hours $0.04360 Energy Charge – Off Peak additional kWh $0.02775 Transition Season Off Peak Demand Charge $4.17 Energy Charge – Off Peak first 425 hours $0.06226 Energy Charge – Off Peak next 195 hours $0.04360 Energy Charge – Off Peak additional kWh $0.02775
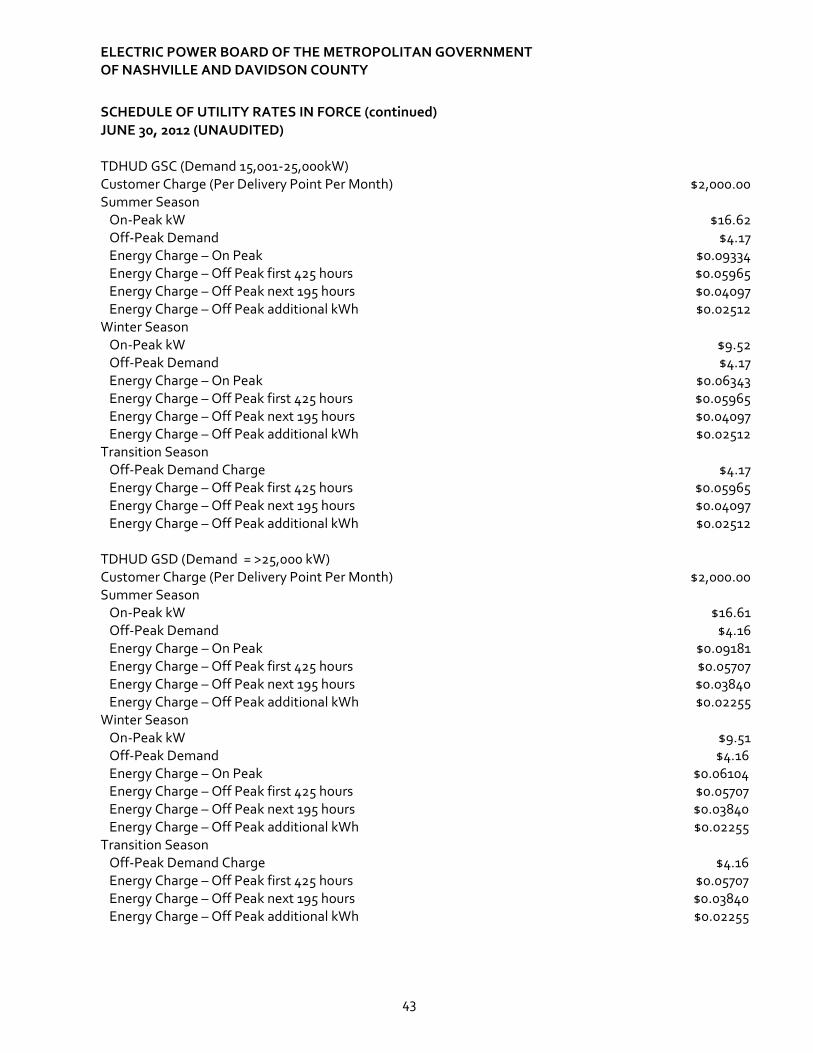
ELECTRIC POWER BOARD OF THE METROPOLITAN GOVERNMENT OF NASHVILLE AND DAVIDSON COUNTY
43
SCHEDULE OF UTILITY RATES IN FORCE (continued) JUNE 30, 2012 (UNAUDITED)
TDHUD GSC (Demand 15,001-25,000kW) Customer Charge (Per Delivery Point Per Month) $2,000.00Summer Season On-Peak kW $16.62 Off-Peak Demand $4.17 Energy Charge – On Peak $0.09334 Energy Charge – Off Peak first 425 hours $0.05965 Energy Charge – Off Peak next 195 hours $0.04097 Energy Charge – Off Peak additional kWh $0.02512Winter Season On-Peak kW $9.52 Off-Peak Demand $4.17 Energy Charge – On Peak $0.06343 Energy Charge – Off Peak first 425 hours $0.05965 Energy Charge – Off Peak next 195 hours $0.04097 Energy Charge – Off Peak additional kWh $0.02512Transition Season Off-Peak Demand Charge $4.17 Energy Charge – Off Peak first 425 hours $0.05965 Energy Charge – Off Peak next 195 hours $0.04097 Energy Charge – Off Peak additional kWh $0.02512 TDHUD GSD (Demand = >25,000 kW) Customer Charge (Per Delivery Point Per Month) $2,000.00Summer Season On-Peak kW $16.61 Off-Peak Demand $4.16 Energy Charge – On Peak $0.09181 Energy Charge – Off Peak first 425 hours $0.05707 Energy Charge – Off Peak next 195 hours $0.03840 Energy Charge – Off Peak additional kWh $0.02255Winter Season On-Peak kW $9.51 Off-Peak Demand $4.16 Energy Charge – On Peak $0.06104 Energy Charge – Off Peak first 425 hours $0.05707 Energy Charge – Off Peak next 195 hours $0.03840 Energy Charge – Off Peak additional kWh $0.02255Transition Season Off-Peak Demand Charge $4.16 Energy Charge – Off Peak first 425 hours $0.05707 Energy Charge – Off Peak next 195 hours $0.03840 Energy Charge – Off Peak additional kWh $0.02255
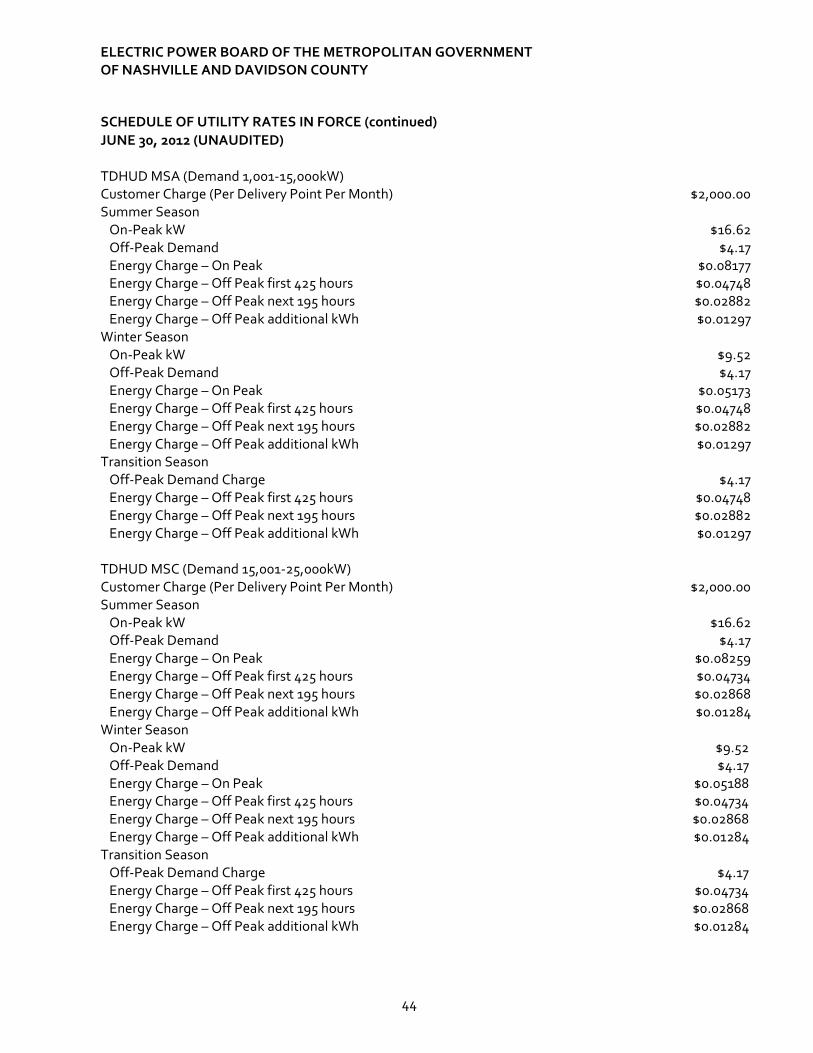
ELECTRIC POWER BOARD OF THE METROPOLITAN GOVERNMENT OF NASHVILLE AND DAVIDSON COUNTY
44
SCHEDULE OF UTILITY RATES IN FORCE (continued) JUNE 30, 2012 (UNAUDITED)
TDHUD MSA (Demand 1,001-15,000kW) Customer Charge (Per Delivery Point Per Month) $2,000.00Summer Season On-Peak kW $16.62 Off-Peak Demand $4.17 Energy Charge – On Peak $0.08177 Energy Charge – Off Peak first 425 hours $0.04748 Energy Charge – Off Peak next 195 hours $0.02882 Energy Charge – Off Peak additional kWh $0.01297Winter Season On-Peak kW $9.52 Off-Peak Demand $4.17 Energy Charge – On Peak $0.05173 Energy Charge – Off Peak first 425 hours $0.04748 Energy Charge – Off Peak next 195 hours $0.02882 Energy Charge – Off Peak additional kWh $0.01297Transition Season Off-Peak Demand Charge $4.17 Energy Charge – Off Peak first 425 hours $0.04748 Energy Charge – Off Peak next 195 hours $0.02882 Energy Charge – Off Peak additional kWh $0.01297 TDHUD MSC (Demand 15,001-25,000kW) Customer Charge (Per Delivery Point Per Month) $2,000.00Summer Season On-Peak kW $16.62 Off-Peak Demand $4.17 Energy Charge – On Peak $0.08259 Energy Charge – Off Peak first 425 hours $0.04734 Energy Charge – Off Peak next 195 hours $0.02868 Energy Charge – Off Peak additional kWh $0.01284Winter Season On-Peak kW $9.52 Off-Peak Demand $4.17 Energy Charge – On Peak $0.05188 Energy Charge – Off Peak first 425 hours $0.04734 Energy Charge – Off Peak next 195 hours $0.02868 Energy Charge – Off Peak additional kWh $0.01284Transition Season Off-Peak Demand Charge $4.17 Energy Charge – Off Peak first 425 hours $0.04734 Energy Charge – Off Peak next 195 hours $0.02868 Energy Charge – Off Peak additional kWh $0.01284
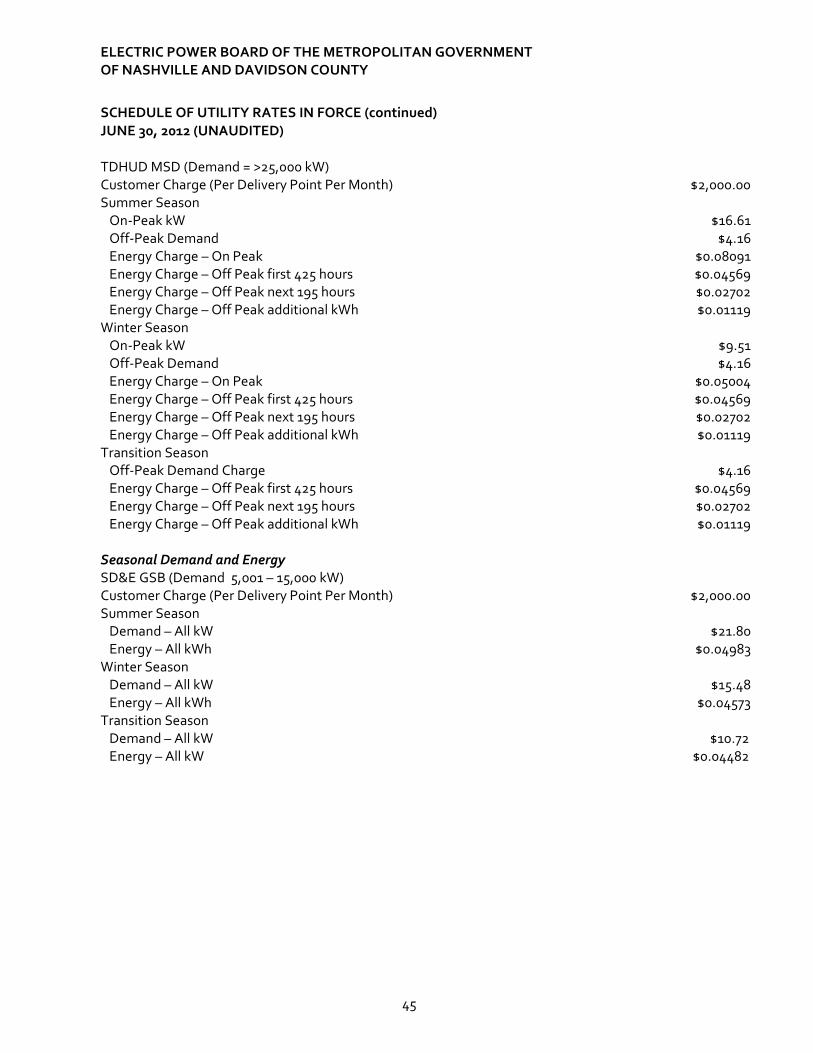
ELECTRIC POWER BOARD OF THE METROPOLITAN GOVERNMENT OF NASHVILLE AND DAVIDSON COUNTY
45
SCHEDULE OF UTILITY RATES IN FORCE (continued) JUNE 30, 2012 (UNAUDITED)
TDHUD MSD (Demand = >25,000 kW) Customer Charge (Per Delivery Point Per Month) $2,000.00Summer Season On-Peak kW $16.61 Off-Peak Demand $4.16 Energy Charge – On Peak $0.08091 Energy Charge – Off Peak first 425 hours $0.04569 Energy Charge – Off Peak next 195 hours $0.02702 Energy Charge – Off Peak additional kWh $0.01119Winter Season On-Peak kW $9.51 Off-Peak Demand $4.16 Energy Charge – On Peak $0.05004 Energy Charge – Off Peak first 425 hours $0.04569 Energy Charge – Off Peak next 195 hours $0.02702 Energy Charge – Off Peak additional kWh $0.01119Transition Season Off-Peak Demand Charge $4.16 Energy Charge – Off Peak first 425 hours $0.04569 Energy Charge – Off Peak next 195 hours $0.02702 Energy Charge – Off Peak additional kWh $0.01119 Seasonal Demand and Energy SD&E GSB (Demand 5,001 – 15,000 kW) Customer Charge (Per Delivery Point Per Month) $2,000.00Summer Season Demand – All kW $21.80 Energy – All kWh $0.04983Winter Season Demand – All kW $15.48 Energy – All kWh $0.04573Transition Season Demand – All kW $10.72 Energy – All kW $0.04482
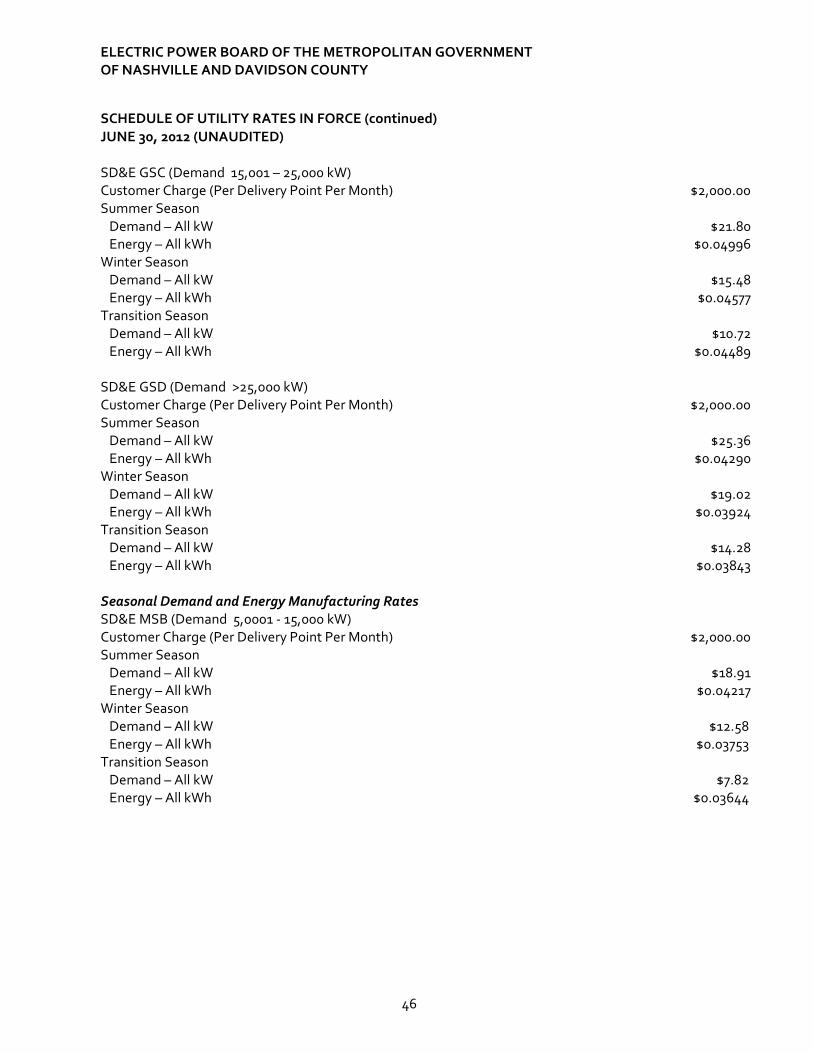
ELECTRIC POWER BOARD OF THE METROPOLITAN GOVERNMENT OF NASHVILLE AND DAVIDSON COUNTY
46
SCHEDULE OF UTILITY RATES IN FORCE (continued) JUNE 30, 2012 (UNAUDITED)
SD&E GSC (Demand 15,001 – 25,000 kW) Customer Charge (Per Delivery Point Per Month) $2,000.00Summer Season Demand – All kW $21.80 Energy – All kWh $0.04996Winter Season Demand – All kW $15.48 Energy – All kWh $0.04577Transition Season Demand – All kW $10.72 Energy – All kWh $0.04489 SD&E GSD (Demand >25,000 kW) Customer Charge (Per Delivery Point Per Month) $2,000.00Summer Season Demand – All kW $25.36 Energy – All kWh $0.04290Winter Season Demand – All kW $19.02 Energy – All kWh $0.03924Transition Season Demand – All kW $14.28 Energy – All kWh $0.03843
Seasonal Demand and Energy Manufacturing Rates SD&E MSB (Demand 5,0001 - 15,000 kW) Customer Charge (Per Delivery Point Per Month) $2,000.00Summer Season Demand – All kW $18.91 Energy – All kWh $0.04217Winter Season Demand – All kW $12.58 Energy – All kWh $0.03753Transition Season Demand – All kW $7.82 Energy – All kWh $0.03644
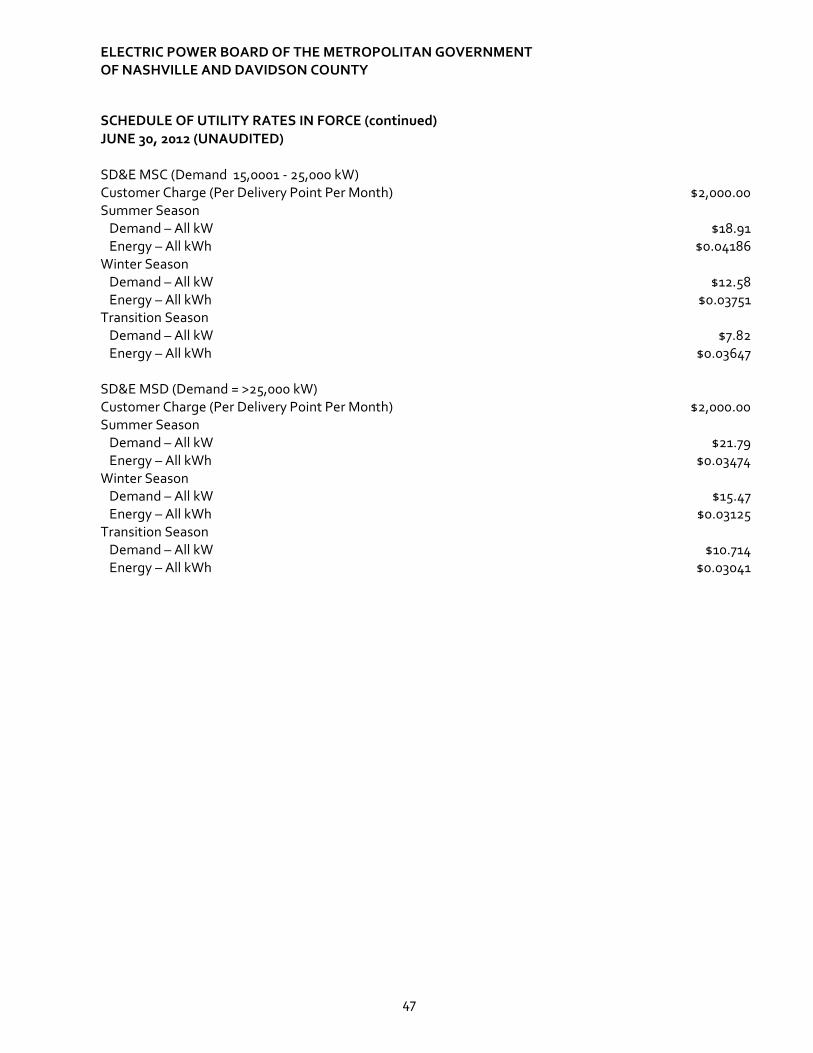
ELECTRIC POWER BOARD OF THE METROPOLITAN GOVERNMENT OF NASHVILLE AND DAVIDSON COUNTY
47
SCHEDULE OF UTILITY RATES IN FORCE (continued) JUNE 30, 2012 (UNAUDITED)
SD&E MSC (Demand 15,0001 - 25,000 kW) Customer Charge (Per Delivery Point Per Month) $2,000.00Summer Season Demand – All kW $18.91 Energy – All kWh $0.04186Winter Season Demand – All kW $12.58 Energy – All kWh $0.03751Transition Season Demand – All kW $7.82 Energy – All kWh $0.03647 SD&E MSD (Demand = >25,000 kW) Customer Charge (Per Delivery Point Per Month) $2,000.00Summer Season Demand – All kW $21.79 Energy – All kWh $0.03474Winter Season Demand – All kW $15.47 Energy – All kWh $0.03125Transition Season Demand – All kW $10.714 Energy – All kWh $0.03041
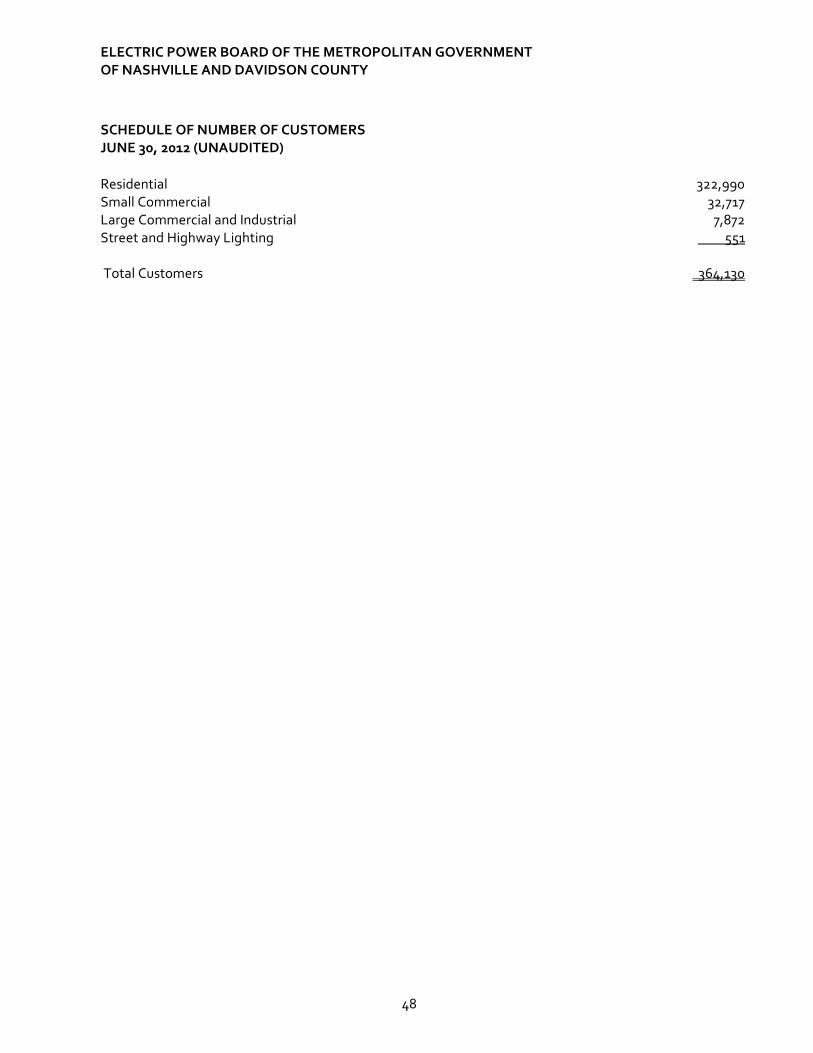
ELECTRIC POWER BOARD OF THE METROPOLITAN GOVERNMENT OF NASHVILLE AND DAVIDSON COUNTY
48
SCHEDULE OF NUMBER OF CUSTOMERS JUNE 30, 2012 (UNAUDITED)
Residential 322,990Small Commercial 32,717Large Commercial and Industrial 7,872Street and Highway Lighting 551 Total Customers 364,130
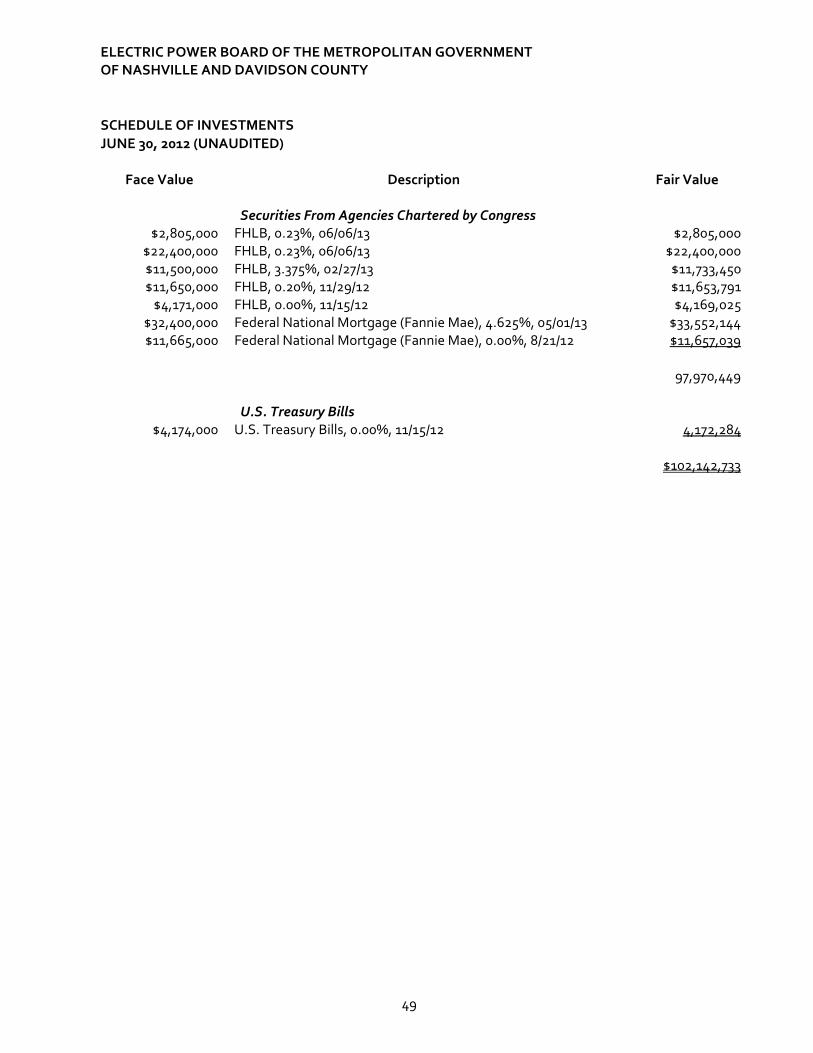
ELECTRIC POWER BOARD OF THE METROPOLITAN GOVERNMENT OF NASHVILLE AND DAVIDSON COUNTY
49
SCHEDULE OF INVESTMENTS JUNE 30, 2012 (UNAUDITED)
Face Value Description Fair Value Securities From Agencies Chartered by Congress
$2,805,000 FHLB, 0.23%, 06/06/13 $2,805,000 $22,400,000 FHLB, 0.23%, 06/06/13 $22,400,000 $11,500,000 FHLB, 3.375%, 02/27/13 $11,733,450 $11,650,000 FHLB, 0.20%, 11/29/12 $11,653,791
$4,171,000 FHLB, 0.00%, 11/15/12 $4,169,025 $32,400,000 Federal National Mortgage (Fannie Mae), 4.625%, 05/01/13 $33,552,144 $11,665,000 Federal National Mortgage (Fannie Mae), 0.00%, 8/21/12 $11,657,039
97,970,449 U.S. Treasury Bills
$4,174,000 U.S. Treasury Bills, 0.00%, 11/15/12 4,172,284 $102,142,733
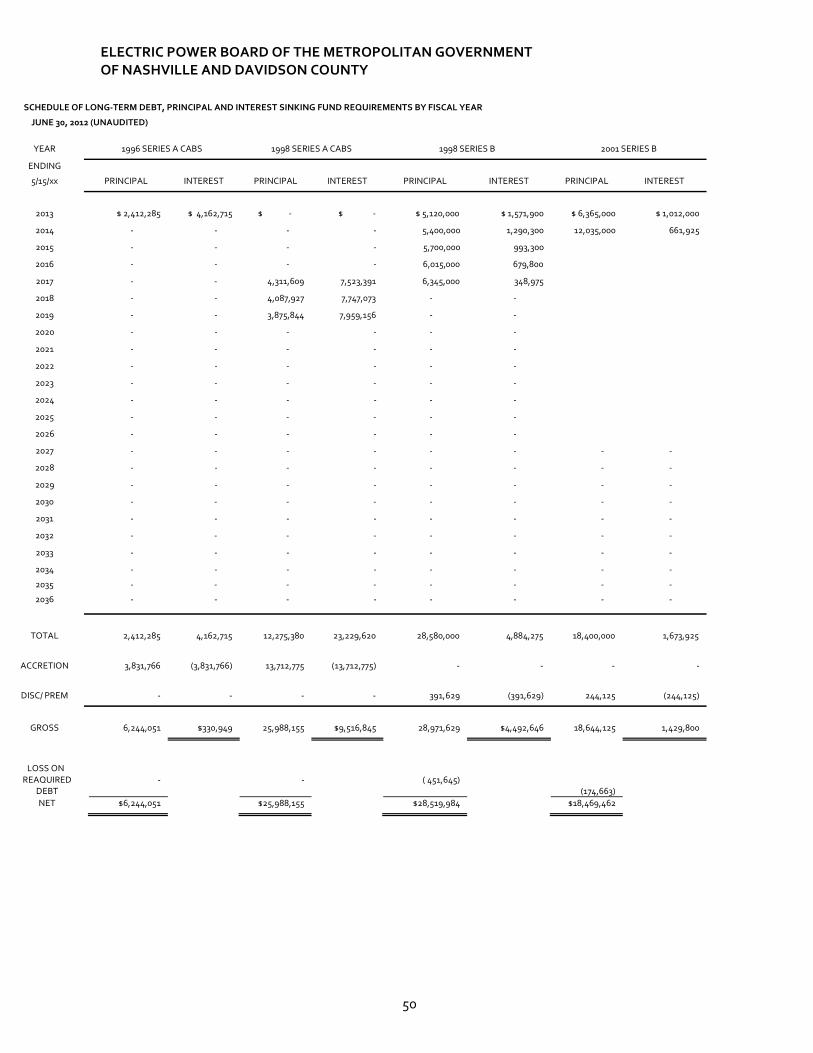
ELECTRIC POWER BOARD OF THE METROPOLITAN GOVERNMENT OF NASHVILLE AND DAVIDSON COUNTY
50
SCHEDULE OF LONG-TERM DEBT, PRINCIPAL AND INTEREST SINKING FUND REQUIREMENTS BY FISCAL YEAR
JUNE 30, 2012 (UNAUDITED)
YEAR 1996 SERIES A CABS 1998 SERIES A CABS 1998 SERIES B 2001 SERIES B
ENDING
5/15/xx PRINCIPAL INTEREST PRINCIPAL INTEREST PRINCIPAL INTEREST PRINCIPAL INTEREST
2013 $ 2,412,285 $ 4,162,715 $ - $ - $ 5,120,000 $ 1,571,900 $ 6,365,000 $ 1,012,000
2014 - - - - 5,400,000 1,290,300 12,035,000 661,925
2015 - - - - 5,700,000 993,300
2016 - - - - 6,015,000 679,800
2017 - - 4,311,609 7,523,391 6,345,000 348,975
2018 - - 4,087,927 7,747,073 - -
2019 - - 3,875,844 7,959,156 - -
2020 - - - - - -
2021 - - - - - -
2022 - - - - - -
2023 - - - - - -
2024 - - - - - -
2025 - - - - - -
2026 - - - - - -
2027 - - - - - - - -
2028 - - - - - - - -
2029 - - - - - - - -
2030 - - - - - - - -
2031 - - - - - - - -
2032 - - - - - - - -
2033 - - - - - - - -
2034 - - - - - - - -
2035 - - - - - - - -
2036 - - - - - - - -
TOTAL 2,412,285 4,162,715 12,275,380 23,229,620 28,580,000 4,884,275 18,400,000 1,673,925
ACCRETION 3,831,766 (3,831,766) 13,712,775 (13,712,775) - - - -
DISC/ PREM - - - - 391,629 (391,629) 244,125 (244,125)
GROSS 6,244,051 $330,949 25,988,155 $9,516,845 28,971,629 $4,492,646 18,644,125 1,429,800
LOSS ON REAQUIRED
DEBT - - ( 451,645)
(174,663)
NET $6,244,051 $25,988,155 $28,519,984 $18,469,462
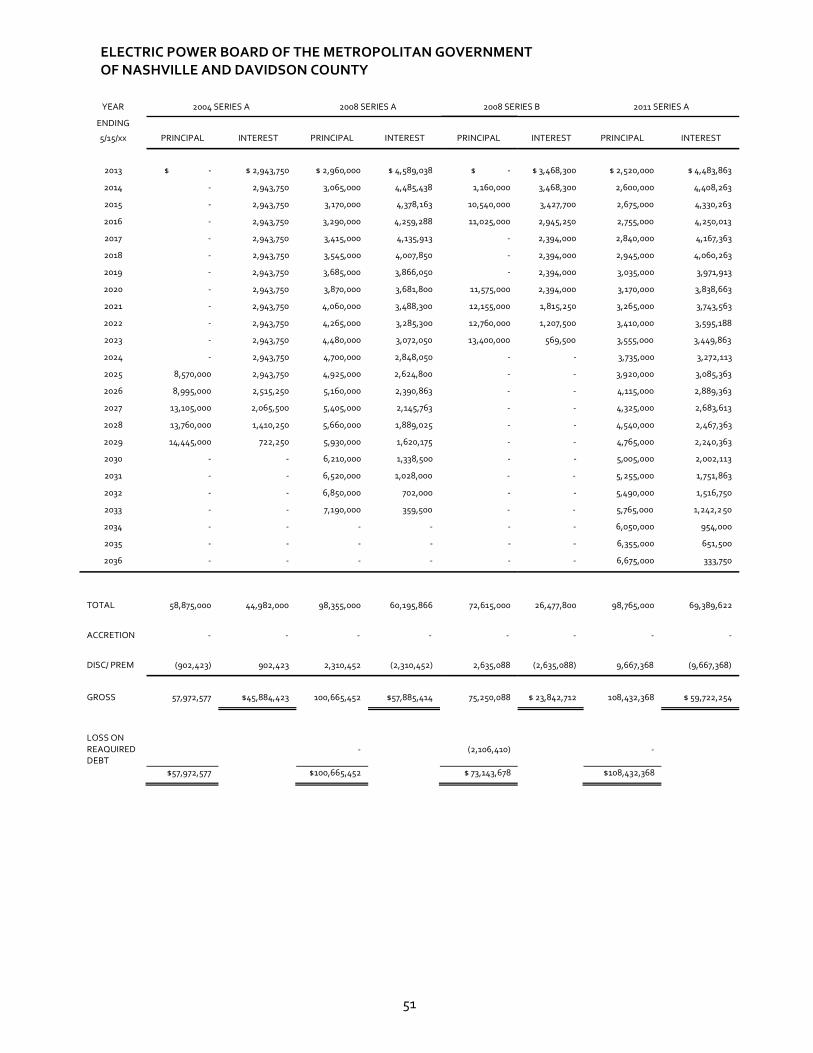
ELECTRIC POWER BOARD OF THE METROPOLITAN GOVERNMENT OF NASHVILLE AND DAVIDSON COUNTY
51
YEAR 2004 SERIES A 2008 SERIES A 2008 SERIES B 2011 SERIES A
ENDING 5/15/xx PRINCIPAL INTEREST PRINCIPAL INTEREST PRINCIPAL INTEREST PRINCIPAL INTEREST
2013 $ - $ 2,943,750 $ 2,960,000 $ 4,589,038 $ - $ 3,468,300 $ 2,520,000 $ 4,483,863
2014 - 2,943,750 3,065,000 4,485,438 1,160,000 3,468,300 2,600,000 4,408,263
2015 - 2,943,750 3,170,000 4,378,163 10,540,000 3,427,700 2,675,000 4,330,263
2016 - 2,943,750 3,290,000 4,259,288 11,025,000 2,945,250 2,755,000 4,250,013
2017 - 2,943,750 3,415,000 4,135,913 - 2,394,000 2,840,000 4,167,363
2018 - 2,943,750 3,545,000 4,007,850 - 2,394,000 2,945,000 4,060,263
2019 - 2,943,750 3,685,000 3,866,050 - 2,394,000 3,035,000 3,971,913
2020 - 2,943,750 3,870,000 3,681,800 11,575,000 2,394,000 3,170,000 3,838,663
2021 - 2,943,750 4,060,000 3,488,300 12,155,000 1,815,250 3,265,000 3,743,563
2022 - 2,943,750 4,265,000 3,285,300 12,760,000 1,207,500 3,410,000 3,595,188
2023 - 2,943,750 4,480,000 3,072,050 13,400,000 569,500 3,555,000 3,449,863
2024 - 2,943,750 4,700,000 2,848,050 - - 3,735,000 3,272,113
2025 8,570,000 2,943,750 4,925,000 2,624,800 - - 3,920,000 3,085,363
2026 8,995,000 2,515,250 5,160,000 2,390,863 - - 4,115,000 2,889,363
2027 13,105,000 2,065,500 5,405,000 2,145,763 - - 4,325,000 2,683,613
2028 13,760,000 1,410,250 5,660,000 1,889,025 - - 4,540,000 2,467,363
2029 14,445,000 722,250 5,930,000 1,620,175 - - 4,765,000 2,240,363
2030 - - 6,210,000 1,338,500 - - 5,005,000 2,002,113
2031 - - 6,520,000 1,028,000 - - 5,255,000 1,751,863
2032 - - 6,850,000 702,000 - - 5,490,000 1,516,750
2033 - - 7,190,000 359,500 - - 5,765,000 1,242,250
2034 - - - - - - 6,050,000 954,000
2035 - - - - - - 6,355,000 651,500
2036 - - - - - - 6,675,000 333,750
TOTAL 58,875,000 44,982,000 98,355,000 60,195,866 72,615,000 26,477,800 98,765,000 69,389,622
ACCRETION - - - - - - - -
DISC/ PREM (902,423) 902,423 2,310,452 (2,310,452) 2,635,088 (2,635,088) 9,667,368 (9,667,368)
GROSS 57,972,577 $45,884,423 100,665,452 $57,885,414 75,250,088 $ 23,842,712 108,432,368 $ 59,722,254
LOSS ON
REAQUIRED DEBT
- (2,106,410) -
$57,972,577 $100,665,452 $ 73,143,678 $108,432,368
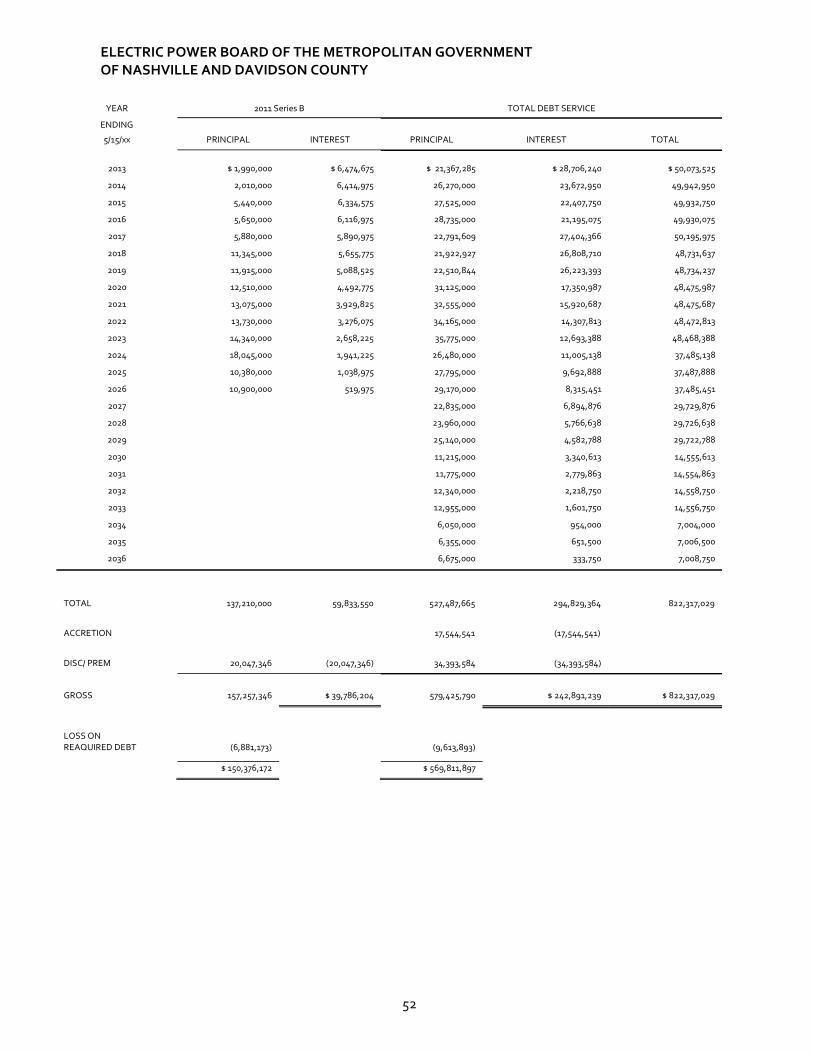
ELECTRIC POWER BOARD OF THE METROPOLITAN GOVERNMENT OF NASHVILLE AND DAVIDSON COUNTY
52
YEAR 2011 Series B TOTAL DEBT SERVICE
ENDING
5/15/xx PRINCIPAL INTEREST PRINCIPAL INTEREST TOTAL
2013 $ 1,990,000 $ 6,474,675 $ 21,367,285 $ 28,706,240 $ 50,073,525
2014 2,010,000 6,414,975 26,270,000 23,672,950 49,942,950
2015 5,440,000 6,334,575 27,525,000 22,407,750 49,932,750
2016 5,650,000 6,116,975 28,735,000 21,195,075 49,930,075
2017 5,880,000 5,890,975 22,791,609 27,404,366 50,195,975
2018 11,345,000 5,655,775 21,922,927 26,808,710 48,731,637
2019 11,915,000 5,088,525 22,510,844 26,223,393 48,734,237
2020 12,510,000 4,492,775 31,125,000 17,350,987 48,475,987
2021 13,075,000 3,929,825 32,555,000 15,920,687 48,475,687
2022 13,730,000 3,276,075 34,165,000 14,307,813 48,472,813
2023 14,340,000 2,658,225 35,775,000 12,693,388 48,468,388
2024 18,045,000 1,941,225 26,480,000 11,005,138 37,485,138
2025 10,380,000 1,038,975 27,795,000 9,692,888 37,487,888
2026 10,900,000 519,975 29,170,000 8,315,451 37,485,451
2027 22,835,000 6,894,876 29,729,876
2028 23,960,000 5,766,638 29,726,638
2029 25,140,000 4,582,788 29,722,788
2030 11,215,000 3,340,613 14,555,613
2031 11,775,000 2,779,863 14,554,863
2032 12,340,000 2,218,750 14,558,750
2033 12,955,000 1,601,750 14,556,750
2034 6,050,000 954,000 7,004,000
2035 6,355,000 651,500 7,006,500
2036 6,675,000 333,750 7,008,750
TOTAL 137,210,000 59,833,550 527,487,665 294,829,364 822,317,029
ACCRETION 17,544,541 (17,544,541)
DISC/ PREM 20,047,346 (20,047,346) 34,393,584 (34,393,584)
GROSS 157,257,346 $ 39,786,204 579,425,790 $ 242,891,239 $ 822,317,029
LOSS ON
REAQUIRED DEBT (6,881,173) (9,613,893)
$ 150,376,172 $ 569,811,897
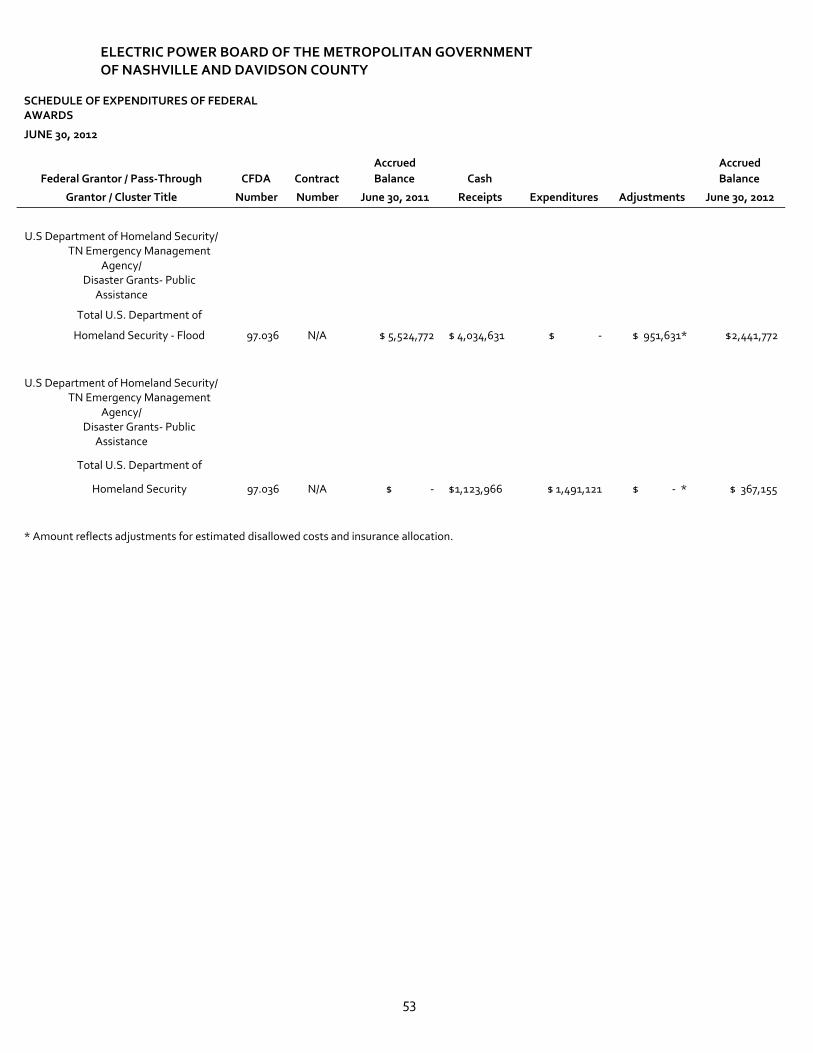
ELECTRIC POWER BOARD OF THE METROPOLITAN GOVERNMENT OF NASHVILLE AND DAVIDSON COUNTY
53
SCHEDULE OF EXPENDITURES OF FEDERAL AWARDS
JUNE 30, 2012
Accrued Accrued Federal Grantor / Pass-Through CFDA Contract Balance Cash Balance
Grantor / Cluster Title Number Number June 30, 2011 Receipts Expenditures Adjustments June 30, 2012
U.S Department of Homeland Security/ TN Emergency Management
Agency/ Disaster Grants- Public
Assistance
Total U.S. Department of
Homeland Security - Flood 97.036 N/A $ 5,524,772 $ 4,034,631 $ - $ 951,631* $2,441,772
U.S Department of Homeland Security/ TN Emergency Management
Agency/ Disaster Grants- Public
Assistance
Total U.S. Department of
Homeland Security 97.036 N/A $ - $1,123,966 $ 1,491,121 $ - * $ 367,155
* Amount reflects adjustments for estimated disallowed costs and insurance allocation.
ELECTRIC POWER BOARD OF THE METROPOLITAN GOVERNMENT OF NASHVILLE AND DAVIDSON COUNTY
54
NOTES TO SCHEDULE OF EXPENDITURES OF FEDERAL AWARDS FOR THE YEAR ENDED JUNE 30, 2012
1. The accompanying schedule of expenditures of federal awards includes the federal grant activity of the Electric Power Board of the Metropolitan Government of Nashville and Davidson County (the “Board”) and is presented on the accrual basis of accounting. The information in this schedule is presented in accordance with the requirements of Office of Management and Budget Circular A-133, Audits of States, Local Governments, and Non-Profit Organizations.
2. The grant revenue amounts received are subject to audit and adjustment. If any expenditures are disallowed by the grantor agency as a result of such an audit, any claim for reimbursement to the grantor agency would become a liability of the Board. In the opinion of management, all grant expenditures are in compliance with the terms of the grant agreements and applicable federal laws and regulations.
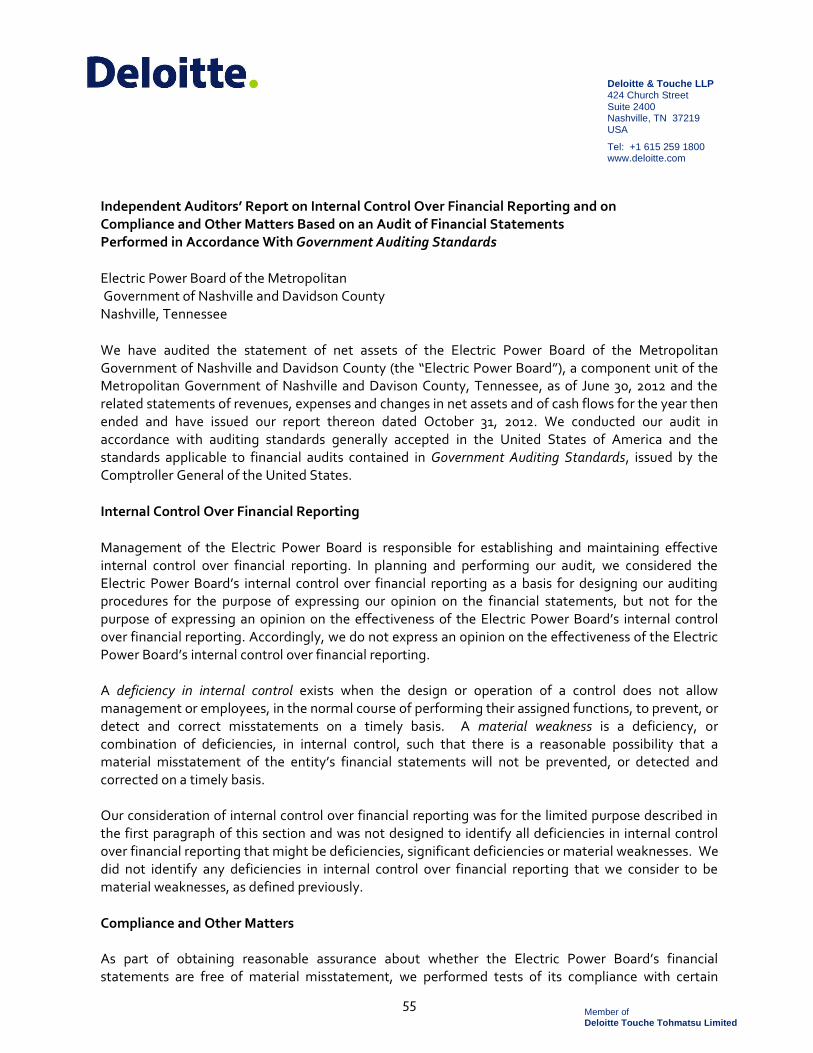
55
Deloitte & Touche LLP424 Church Street Suite 2400 Nashville, TN 37219 USA
Tel: +1 615 259 1800 www.deloitte.com
Independent Auditors’ Report on Internal Control Over Financial Reporting and on Compliance and Other Matters Based on an Audit of Financial Statements Performed in Accordance With Government Auditing Standards
Electric Power Board of the Metropolitan Government of Nashville and Davidson County Nashville, Tennessee
We have audited the statement of net assets of the Electric Power Board of the Metropolitan Government of Nashville and Davidson County (the “Electric Power Board”), a component unit of the Metropolitan Government of Nashville and Davison County, Tennessee, as of June 30, 2012 and the related statements of revenues, expenses and changes in net assets and of cash flows for the year then ended and have issued our report thereon dated October 31, 2012. We conducted our audit in accordance with auditing standards generally accepted in the United States of America and the standards applicable to financial audits contained in Government Auditing Standards, issued by the Comptroller General of the United States.
Internal Control Over Financial Reporting
Management of the Electric Power Board is responsible for establishing and maintaining effective internal control over financial reporting. In planning and performing our audit, we considered the Electric Power Board’s internal control over financial reporting as a basis for designing our auditing procedures for the purpose of expressing our opinion on the financial statements, but not for the purpose of expressing an opinion on the effectiveness of the Electric Power Board’s internal control over financial reporting. Accordingly, we do not express an opinion on the effectiveness of the Electric Power Board’s internal control over financial reporting. A deficiency in internal control exists when the design or operation of a control does not allow management or employees, in the normal course of performing their assigned functions, to prevent, or detect and correct misstatements on a timely basis. A material weakness is a deficiency, or combination of deficiencies, in internal control, such that there is a reasonable possibility that a material misstatement of the entity’s financial statements will not be prevented, or detected and corrected on a timely basis. Our consideration of internal control over financial reporting was for the limited purpose described in the first paragraph of this section and was not designed to identify all deficiencies in internal control over financial reporting that might be deficiencies, significant deficiencies or material weaknesses. We did not identify any deficiencies in internal control over financial reporting that we consider to be material weaknesses, as defined previously.
Compliance and Other Matters As part of obtaining reasonable assurance about whether the Electric Power Board’s financial statements are free of material misstatement, we performed tests of its compliance with certain
Member of Deloitte Touche Tohmatsu Limited

56
provisions of laws, regulations, contracts, and grant agreements, noncompliance with which could have a direct and material effect on the determination of financial statement amounts. However, providing an opinion on compliance with those provisions was not an objective of our audit, and accordingly, we do not express such an opinion. The results of our tests disclosed no instances of noncompliance or other matters that are required to be reported under Government Auditing Standards.
This report is intended solely for the information and use of management, the Audit and Ethics Committee, others within the entity, the State of Tennessee, the Metropolitan Government of Nashville and Davidson County, Tennessee, and the Department of Homeland Security, and is not intended to be and should not be used by anyone other than these specified parties.
October 31, 2012
57
Deloitte & Touche LLP424 Church Street Suite 2400 Nashville, TN 37219 USA
Tel: +1 615 259 1800 www.deloitte.com
Independent Auditors’ Report on Compliance With Requirements That Could Have a Direct and Material Effect on Each Major Program and on Internal Control Over Compliance in Accordance With OMB Circular A-133
Electric Power Board of the Metropolitan Government of Nashville and Davidson County Nashville, Tennessee
Compliance
We have audited the compliance of the Electric Power Board of the Metropolitan Government of Nashville and Davidson County (the “Electric Power Board”), a component unit of the Metropolitan Government of Nashville and Davison County, Tennessee, with the types of compliance requirements described in the OMB Circular A-133 Compliance Supplement that could have a direct and material effect on the Electric Power Board’s major federal program for the year ended June 30, 2012. The Electric Power Board’s major federal program is identified in the summary of independent auditor’s results section of the accompanying schedule of findings and questioned costs. Compliance with the requirements of laws, regulations, contracts, and grants applicable to each of its major federal programs is the responsibility of the Electric Power Board’s management. Our responsibility is to express an opinion on the Electric Power Board’s compliance based on our audit.
We conducted our audit of compliance in accordance with auditing standards generally accepted in the United States of America; the standards applicable to financial audits contained in Government Auditing Standards, issued by the Comptroller General of the United States; and OMB Circular A-133, Audits of States, Local Governments, and Non Profit Organizations. Those standards and OMB Circular A-133 require that we plan and perform the audit to obtain reasonable assurance about whether noncompliance with the types of compliance requirements referred to above that could have a direct and material effect on a major federal program occurred. An audit includes examining, on a test basis, evidence about the Electric Power Board’s compliance with those requirements and performing such other procedures as we considered necessary in the circumstances. We believe that our audit provides a reasonable basis for our opinion. Our audit does not provide a legal determination of the Electric Power Board’s compliance with those requirements.
In our opinion, the Electric Power Board complied, in all material respects, with the compliance requirements referred to above that could have a direct and material effect on its major federal program for the year ended June 30, 2012.
Member of Deloitte Touche Tohmatsu Limited
58
Internal Control Over Compliance
Management of the Electric Power Board is responsible for establishing and maintaining effective internal control over compliance with the requirements of laws, regulations, contracts, and grants applicable to federal programs. In planning and performing our audit, we considered the Electric Power Board’s internal control over compliance with the requirements that could have a direct and material effect on a major federal program to determine the auditing procedures for the purpose of expressing our opinion on compliance and to test and report on internal control over compliance in accordance with OMB Circular A-133, but not for the purpose of expressing an opinion on the effectiveness of internal control over compliance. Accordingly, we do not express an opinion on the effectiveness of the Electric Power Board’s internal control over compliance.
A deficiency in internal control over compliance exists when the design or operation of a control over compliance does not allow management or employees, in the normal course of performing their assigned functions, to prevent, or detect and correct, noncompliance with a type of compliance requirement of a federal program on a timely basis. A material weakness in internal control over compliance is a deficiency, or combination of deficiencies, in internal control over compliance, such that there is a reasonable possibility that material noncompliance with a type of compliance requirement of a federal program will not be prevented, or detected and corrected, on a timely basis. Our consideration of internal control over compliance was for the limited purpose described in the first paragraph of this section and was not designed to identify all deficiencies in internal control over compliance that might be deficiencies, significant deficiencies, or material weaknesses. We did not identify any deficiencies in internal control over compliance that we consider to be material weaknesses, as defined above. This report is intended solely for the information and use of management, The Audit and Ethics Committee, others within the entity, the State of Tennessee, the Metropolitan Government of Nashville and Davidson County, Tennessee, and the Department of Homeland Security, and is not intended to be and should not be used by anyone other than these specified parties.
October 31, 2012
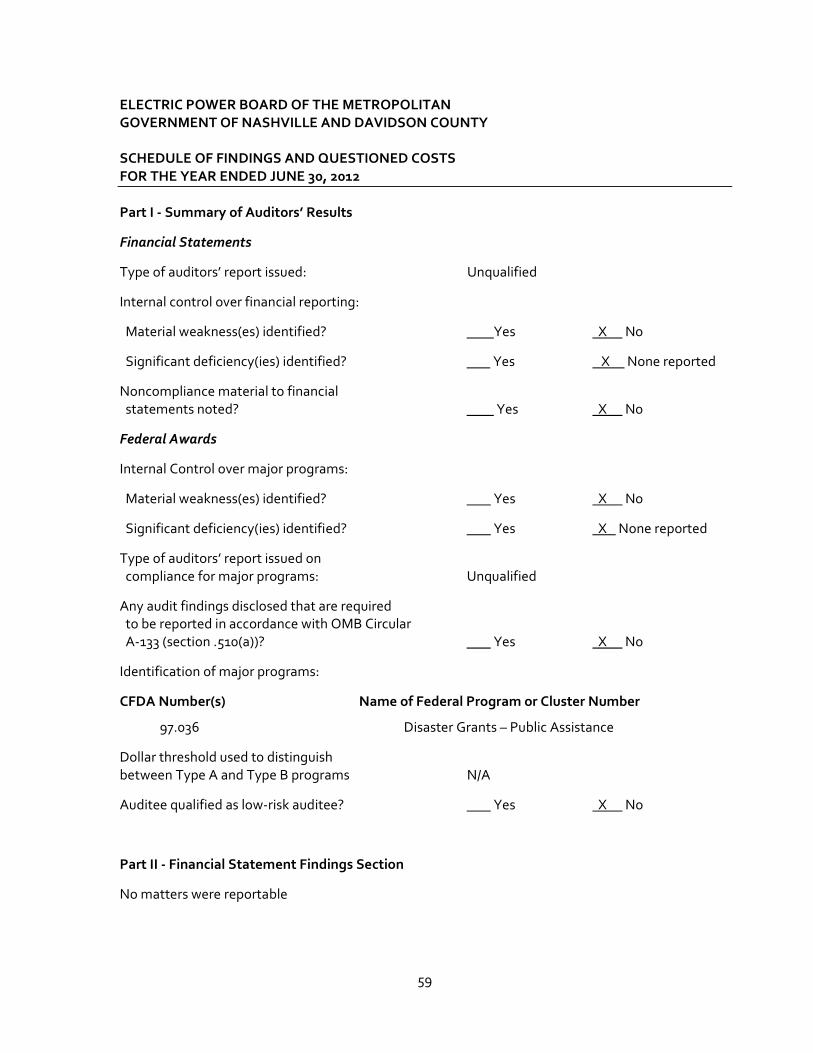
59
ELECTRIC POWER BOARD OF THE METROPOLITAN GOVERNMENT OF NASHVILLE AND DAVIDSON COUNTY SCHEDULE OF FINDINGS AND QUESTIONED COSTS FOR THE YEAR ENDED JUNE 30, 2012
Part I - Summary of Auditors’ Results
Financial Statements
Type of auditors’ report issued: Unqualified
Internal control over financial reporting:
Material weakness(es) identified? Yes X No
Significant deficiency(ies) identified? Yes X None reported
Noncompliance material to financial statements noted? Yes X No
Federal Awards
Internal Control over major programs:
Material weakness(es) identified? Yes X No
Significant deficiency(ies) identified? Yes X None reported
Type of auditors’ report issued on compliance for major programs: Unqualified
Any audit findings disclosed that are required to be reported in accordance with OMB Circular A-133 (section .510(a))? Yes X No
Identification of major programs:
CFDA Number(s) Name of Federal Program or Cluster Number
97.036 Disaster Grants – Public Assistance
Dollar threshold used to distinguish between Type A and Type B programs N/A
Auditee qualified as low-risk auditee? Yes X No
Part II - Financial Statement Findings Section
No matters were reportable
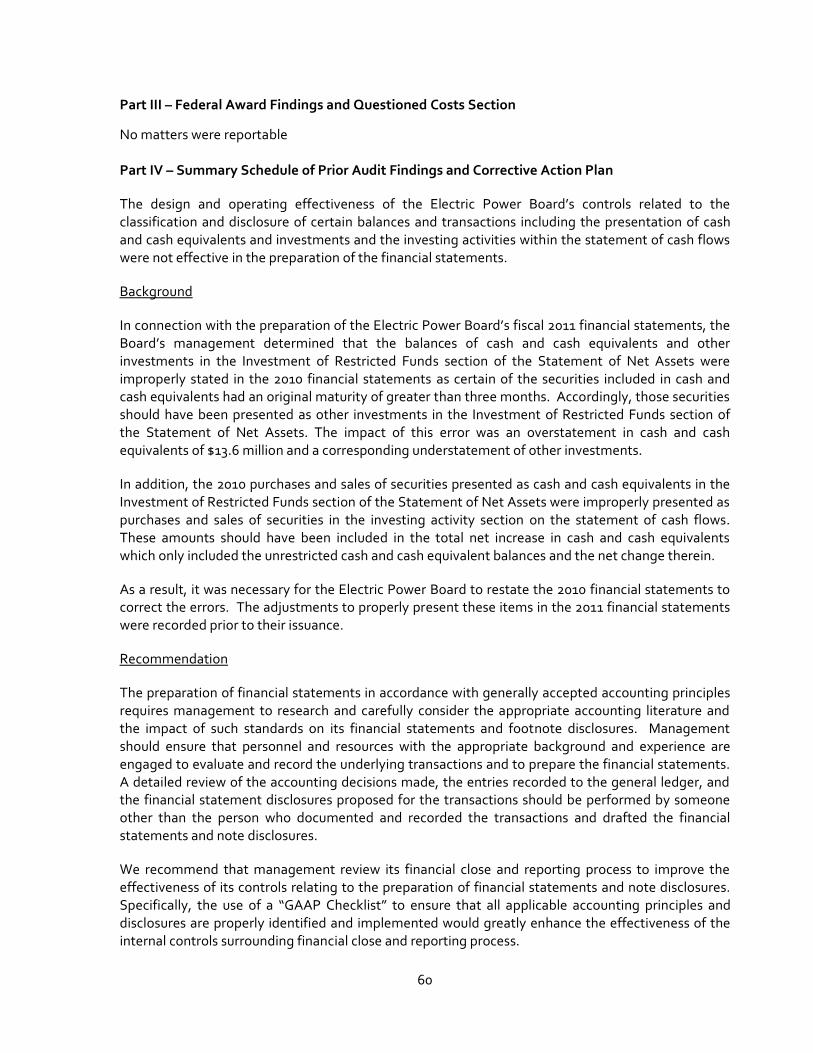
60
Part III – Federal Award Findings and Questioned Costs Section
No matters were reportable
Part IV – Summary Schedule of Prior Audit Findings and Corrective Action Plan
The design and operating effectiveness of the Electric Power Board’s controls related to the classification and disclosure of certain balances and transactions including the presentation of cash and cash equivalents and investments and the investing activities within the statement of cash flows were not effective in the preparation of the financial statements.
Background
In connection with the preparation of the Electric Power Board’s fiscal 2011 financial statements, the Board’s management determined that the balances of cash and cash equivalents and other investments in the Investment of Restricted Funds section of the Statement of Net Assets were improperly stated in the 2010 financial statements as certain of the securities included in cash and cash equivalents had an original maturity of greater than three months. Accordingly, those securities should have been presented as other investments in the Investment of Restricted Funds section of the Statement of Net Assets. The impact of this error was an overstatement in cash and cash equivalents of $13.6 million and a corresponding understatement of other investments.
In addition, the 2010 purchases and sales of securities presented as cash and cash equivalents in the Investment of Restricted Funds section of the Statement of Net Assets were improperly presented as purchases and sales of securities in the investing activity section on the statement of cash flows. These amounts should have been included in the total net increase in cash and cash equivalents which only included the unrestricted cash and cash equivalent balances and the net change therein.
As a result, it was necessary for the Electric Power Board to restate the 2010 financial statements to correct the errors. The adjustments to properly present these items in the 2011 financial statements were recorded prior to their issuance.
Recommendation
The preparation of financial statements in accordance with generally accepted accounting principles requires management to research and carefully consider the appropriate accounting literature and the impact of such standards on its financial statements and footnote disclosures. Management should ensure that personnel and resources with the appropriate background and experience are engaged to evaluate and record the underlying transactions and to prepare the financial statements. A detailed review of the accounting decisions made, the entries recorded to the general ledger, and the financial statement disclosures proposed for the transactions should be performed by someone other than the person who documented and recorded the transactions and drafted the financial statements and note disclosures.
We recommend that management review its financial close and reporting process to improve the effectiveness of its controls relating to the preparation of financial statements and note disclosures. Specifically, the use of a “GAAP Checklist” to ensure that all applicable accounting principles and disclosures are properly identified and implemented would greatly enhance the effectiveness of the internal controls surrounding financial close and reporting process.
61
Management Response and Corrective Action Plan
A skills assessment of the Accounting personnel was prepared and reviewed. Additional training and oversight have been provided based on that information. Some responsibilities have also been reassigned. A GAAP checklist is being used to ensure the adequacy of financial statement disclosures and reporting. Position memorandums are being created more frequently to address the appropriateness of any significant accounting matters and reference the accounting literature upon which the decision was based. The financial statement closing process checklist was also enhanced to cover some of the items that were concerns during the prior year audit. Management believes all deficiencies have been fully remediated.