Embed Size (px)
Citation preview
Concordia Lutheran Church 2501 Woodland Avenue
Duluth, MN
ELECTRIC & NATURAL GAS ENERGY ANALYSIS November 7, 2013
Prepared By:
Peter Gephart [email protected]
(612) 816-3565
Disclaimer of Warranties and Limitation of Liability The suggestions in this Energy Analysis (“Analysis”) are provided as a service to Comfort Systems and Minnesota Power customers and are based on a visual analysis of conditions observed at the time of the survey, information provided by the customer, Comfort Systems and Minnesota Power, and costs based on the energy assessor’s experience on similar projects. The performance guidelines provided in the Analysis are for informational purposes only and are not to be construed as a design document. Comfort Systems and Minnesota Power will not benefit in any way from a customer’s decision to select a particular contractor or vendor to supply or install the products and measures suggested by the energy assessor.
Comfort Systems, Minnesota Power, and the energy assessor do not guarantee that any specific level of energy or costs savings will result from implementing any energy conservation measures described in this Analysis. Comfort Systems, Minnesota Power, and the energy assessor shall not, under any circumstances, be liable to the customer in the event that potential energy savings are not achieved.
Comfort Systems and Minnesota Power advise that customers check with their Comfort Systems/Minnesota Power Account Managers to determine the estimated value of their rebates (if any) and to verify that the equipment qualifies for Comfort Systems and Minnesota Power programs prior to implementation of any conservation measures. Custom Rebate projects require pre-approval prior to purchase and installation in order to qualify for a rebate. The customer is responsible for submitting project information to their Account Manager to obtain pre-approval for Custom Rebate projects and to determine the eligible Custom Rebate amount.
Customers are encouraged to ask for the opinion of contractors and suppliers they have worked with in the past for further information on suggested recommendations. Disturbance, removal or replacement of building materials, equipment, insulation systems, ductwork, piping, boilers, and other potentially hazardous components that contain asbestos, mercury or PCB’s will require proper handling and disposal in accordance with the applicable federal and state laws and regulations. In addition, installations shall follow all applicable energy codes, fire codes, building codes, safety codes, ventilation codes, heating codes, plumbing codes and mechanical codes. The customer is responsible to ensure that the contractor follows such guidelines in implementing the recommendations of this report.
COMFORT SYSTEMS AND MINNESOTA POWER ARE PROVIDING THIS INFORMATION AS A SERVICE TO YOU, OUR CUSTOMER. THE INFORMATION AND SUGGESTIONS IN THIS ASSESSMENT ARE PROVIDED ON AN “AS IS” BASIS ONLY, AND COMFORT SYSTEMS MAKES NO REPRESENTATIONS OR WARRANTIES OF ANY KIND WITH RESPECT TO THIS ASSESSMENT. COMFORT SYSTEMS DISCLAIMS ALL SUCH REPRESENTATIONS AND WARRANTIES, INCLUDING BUT NOT LIMITED TO, WARRANTIES OF MERCHANTABILITY AND FITNESS FOR A PARTICULAR PURPOSE. Neither Comfort Systems, Minnesota Power, nor any of its directors, employees or other representatives will be liable for damages arising out of or in connection with the use of this Analysis, and you, the customer, knowingly and voluntarily release Comfort Systems and Minnesota Power from any such liability in connection with this Analysis. This is a comprehensive limitation of liability that applies to all damages of any kind, including (without limitation) compensatory, direct, indirect, or consequential damages, loss of data, income or profit, loss or of damage to property and claims of third parties.
Customer Information Facility Information: Business Name: Concordia Lutheran Church Service Address: 2501 Woodland Avenue, Duluth, MN 55803 Account(s): 411056010 (ELECTRIC)
270510645-001 (GAS) Customer Contact: Delores Grunwald Customer Phone #: 218-349-8403 Date of Analysis: November 7, 2013 Date of Report: December 20, 2013 Annual Energy Usage: 283 kW; 36,080 kWh (ELECTRIC) 10,624 CCF/Year or Therms/Year (GAS) Building/Business Type: Church Auditor(s): Name: Peter Gephart Email: [email protected] Phone: (612) 816-3565 Name: Charlotte Currier Email: [email protected] Phone: (612) 386-7545 Consulting Firm: Energy Insight, Inc. 7935 Stone Creek Drive, Suite 140 Chanhassen, MN 55317 Phone: (952) 767-7455 Comfort Systems Contact (GAS): Name: Eric Schlacks Email: [email protected] Phone: (218) 730-4060 Minnesota Power Contact (ELECTRIC): Name: Tim Gallagher Email: [email protected] Phone: (218) 355-2909

Executive Summary An Energy Analysis is the first step toward identifying opportunities to keep operating costs low, remain competitive in the marketplace, and start saving energy and money. This report contains specific recommendations to reduce energy usage, many of which are low or no cost opportunities. Some of these recommendations may qualify for a Rebate to help reduce your initial equipment costs and provide a faster payback on your energy investment. Concordia Lutheran Church is located in the Woodland area of Duluth, MN. The church was officially organized in 1942 and has been in several locations since. The current building was dedicated in September 1962. The church has 2 main levels – ground floor and the basement. There are some small offices and miscellaneous rooms on the 3rd floor. The building has several offices, which are located on all 3 levels. There is also a kitchen and large dining/common area and classrooms. The sanctuary is on the main level. The church operates about 15 hours per week and already has ample natural light in some places. In October of 2013, Minnesota Power and Comfort Systems received a request for a combined electric and gas analysis from Delores Grunwald, an energy efficiency advocate for the church. On November 7th 2013, Peter Gephart and Charlotte Currier of Energy Insight Inc. visited the site to conduct the analysis. The main areas for improvement are lighting throughout the facility as well as upgrades and maintenance of the natural gas equipment. Detailed recommendations can be found under the Summary of Opportunities section starting on page 8. Safety Issues:
- During the walkthrough, a box of broken CFL bulbs was discovered in the basement storage closet. These contain mercury, which is a health and environmental hazard, so they should be properly disposed of.
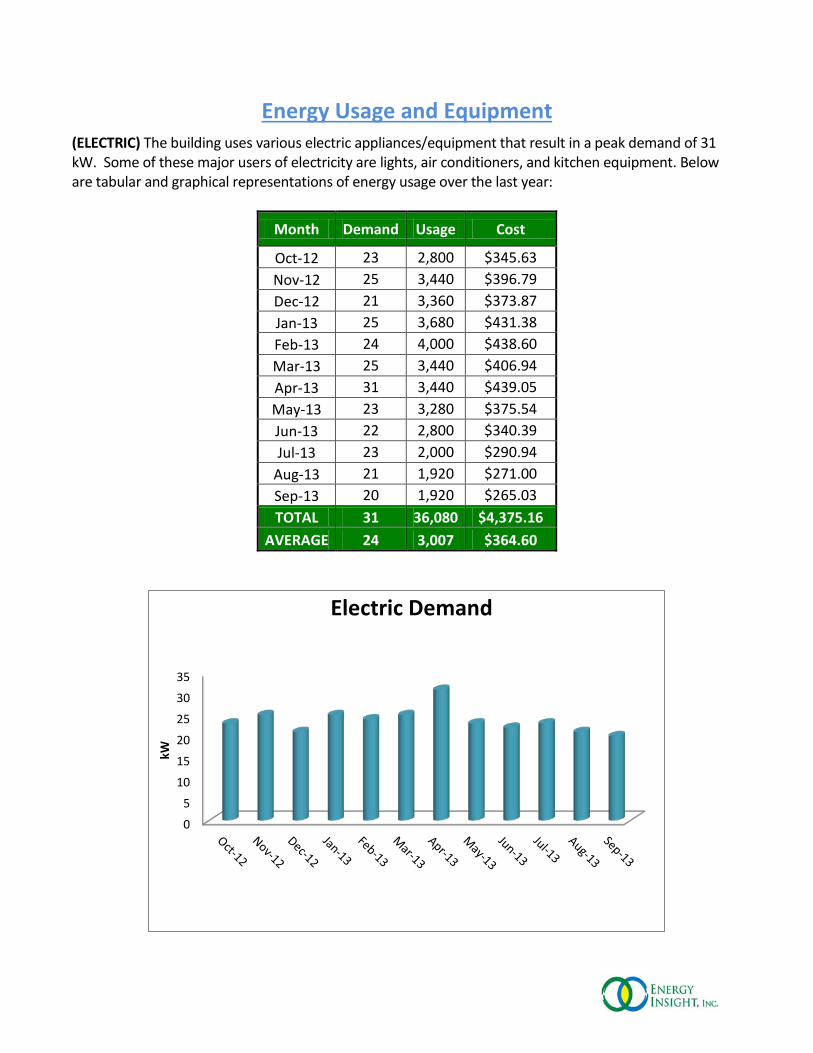
Energy Usage and Equipment (ELECTRIC) The building uses various electric appliances/equipment that result in a peak demand of 31 kW. Some of these major users of electricity are lights, air conditioners, and kitchen equipment. Below are tabular and graphical representations of energy usage over the last year:
Month Demand Usage Cost
Oct-12 23 2,800 $345.63 Nov-12 25 3,440 $396.79 Dec-12 21 3,360 $373.87 Jan-13 25 3,680 $431.38 Feb-13 24 4,000 $438.60 Mar-13 25 3,440 $406.94 Apr-13 31 3,440 $439.05 May-13 23 3,280 $375.54 Jun-13 22 2,800 $340.39 Jul-13 23 2,000 $290.94
Aug-13 21 1,920 $271.00 Sep-13 20 1,920 $265.03 TOTAL 31 36,080 $4,375.16
AVERAGE 24 3,007 $364.60
0
5
10
15
20
25
30
35
kW
Electric Demand
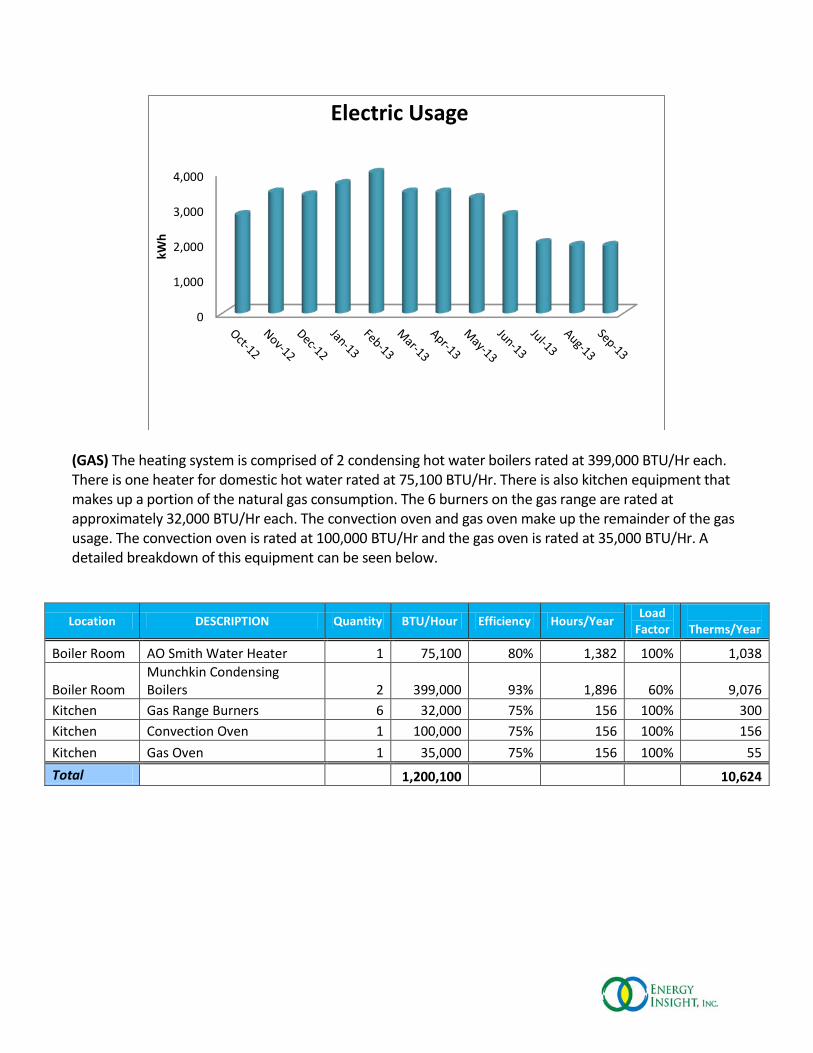
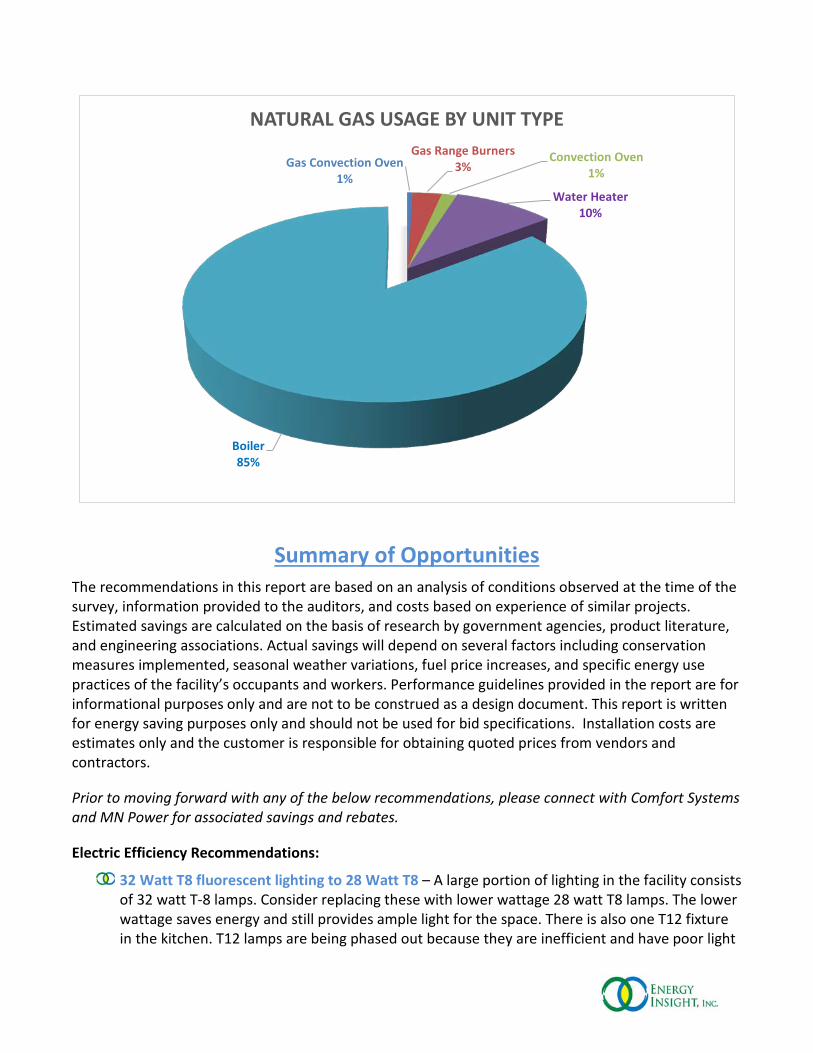
(GAS) The heating system is comprised of 2 condensing hot water boilers rated at 399,000 BTU/Hr each. There is one heater for domestic hot water rated at 75,100 BTU/Hr. There is also kitchen equipment that makes up a portion of the natural gas consumption. The 6 burners on the gas range are rated at approximately 32,000 BTU/Hr each. The convection oven and gas oven make up the remainder of the gas usage. The convection oven is rated at 100,000 BTU/Hr and the gas oven is rated at 35,000 BTU/Hr. A detailed breakdown of this equipment can be seen below.
Location DESCRIPTION Quantity BTU/Hour Efficiency Hours/Year Load Factor
Therms/Year
Boiler Room AO Smith Water Heater 1 75,100 80% 1,382 100% 1,038
Boiler Room Munchkin Condensing Boilers 2 399,000 93% 1,896 60% 9,076
Kitchen Gas Range Burners 6 32,000 75% 156 100% 300 Kitchen Convection Oven 1 100,000 75% 156 100% 156 Kitchen Gas Oven 1 35,000 75% 156 100% 55 Total 1,200,100 10,624
0
1,000
2,000
3,000
4,000kW
h
Electric Usage

Month Total Usage (Therms)
Nov-12 880 Dec-12 1,201 Jan-13 1,484 Feb-13 1,893 Mar-13 1,311 Apr-13 1,082 May-13 946 Jun-13 637 Jul-13 164
Aug-13 72 Sep-13 81 Oct-13 199 Nov-13 674 TOTAL 10,624
0
500
1,000
1,500
2,000
Ther
ms
Summary of Opportunities
The recommendations in this report are based on an analysis of conditions observed at the time of the survey, information provided to the auditors, and costs based on experience of similar projects. Estimated savings are calculated on the basis of research by government agencies, product literature, and engineering associations. Actual savings will depend on several factors including conservation measures implemented, seasonal weather variations, fuel price increases, and specific energy use practices of the facility’s occupants and workers. Performance guidelines provided in the report are for informational purposes only and are not to be construed as a design document. This report is written for energy saving purposes only and should not be used for bid specifications. Installation costs are estimates only and the customer is responsible for obtaining quoted prices from vendors and contractors.
Prior to moving forward with any of the below recommendations, please connect with Comfort Systems and MN Power for associated savings and rebates.
Electric Efficiency Recommendations:
32 Watt T8 fluorescent lighting to 28 Watt T8 – A large portion of lighting in the facility consists of 32 watt T-8 lamps. Consider replacing these with lower wattage 28 watt T8 lamps. The lower wattage saves energy and still provides ample light for the space. There is also one T12 fixture in the kitchen. T12 lamps are being phased out because they are inefficient and have poor light
Gas Convection Oven 1%
Gas Range Burners 3%
Convection Oven 1%
Water Heater 10%
Boiler 85%
NATURAL GAS USAGE BY UNIT TYPE

output. Consider changing this out to a 28 watt T8 as well. The existing magnetic ballast for this will have to be replaced with an electronic ballast, but the fixture is able to remain in place. Implementing this measure saves approximately $303 per year and yields a rebate of $575.
Incandescent lamps to LED – There is incandescent lighting scattered throughout the facility. This consists of 60, 100, and 250 watt lamps as well as exit signs. Replacing this lighting with LED will significantly lower demand. Furthermore LED lamps are rated to last at least 50,000 hours, meaning that they won’t have to be replaced for many years. Replacing all incandescent lamps in the facility with LED bulbs would save approximately $911 per year and yield a rebate of $1,565. Consider asking several suppliers for LED samples to determine whether this measure would suit the needs of your congregation.
Outdoor lighting to LED – Existing high pressure sodium (HPS) and incandescent flood lights on the exterior of the building can be replaced with energy efficient LED fixtures. In particular, the 250 watt HPS fixtures in the parking lot and playground area can be replaced with LED that use around 90 watts, and the awning lights can be replaced with LED screw-in bulbs that use approximately 8 watts each. Also consider adding photo sensors on these fixtures that will turn the lights off when sufficient daylight is available. To replace all exterior lighting with LED would result in a cost savings of about $313 per year and yield a rebate of $247.
Lighting Controls – Install lighting controls such as motion sensors in the areas that are not occupied all the time. This will prevent lights from being left on when they don’t need to be. Implementing this measure will save about $12 annually and yield a rebate of $8.
De-stratification Fans – Consider installing commercial fans in the sanctuary to circulate the air. De-stratification fans work by equalizing the air in a space by circulating hotter air down to the floor to balance temperature in both hot and cold seasons. They reduce energy use and help prevent heat loss through the ceiling.
Computer Equipment Schedule – During the walk-through, it was noticed that some computers were not in use but still on. Even though a computer is in sleep or hibernate mode, it still draws significantly more power than when completely shut down. Shutting off computers and any other electronic devices when not in use results in energy savings.
Insulate around the Window Air Conditioner – At the time of the site visit, it was noted that the window air conditioning unit in the front office had gaps between the unit and the window, which suggests that outside air is infiltrating the conditioned space. Consider adding insulation around the unit to seal up gaps and eliminate unwanted drafts from entering the conditioned space. This will result in heating and cooling savings. When the unit needs to be replaced, consider units with a high Seasonal Energy Efficiency (SEER) rating. Currently, any unit with a SEER rating greater than 13 can qualify for a rebate through Minnesota Power.
Natural Gas Efficiency Recommendations:
Install Controls on Hot Water Circulation Pumps – There is one 1/2 horsepower hot water circulation pump for each of the 2 boilers. These pumps circulate hot water throughout the building. Installing an Electrically Commutated Motor (ECM) on each of these pumps to reduce the flow rate of the boiler system will allow the boiler to heat up less mass during operating
hours while still providing the required heat to the building. This measure would result in gas and electric savings and may qualify for rebates through both utilities.
Install Setback Thermostats – Look for web-based products that are capable of being controlled via computer or smartphone and can be set back. One benefit of these is being able to set back temperature during times when certain areas of the church are not being used. Implementing this measure will result in electric and gas savings due to reduced run time of the boilers and air conditioners.
Perform Regular Boiler Tune-Ups – A professional boiler tune-up can enhance the performance, safety, and efficiency of boilers. Consider doing this every other year to maintain the high efficiency of the boilers.
Install Energy Efficient Water Heaters – Replace the existing hot water heater with a condensing water heater. The recommendation is applicable when the unit needs to be replaced anyway.
Replace Gas Igniters on the Stove with an Electronic Ignition – The current gas pilot lights are always on. Each standing pilot light uses an estimated 17 Therms per year. Consider replacing these with an electronic ignition to turn the burners on only as needed and save approximately $75 in avoided costs each year.
Replace Existing Faucets – Consider replacing existing restroom and kitchen faucets with low flow (0.5 gallons/minute) faucets. This recommendation will reduce hot water consumption as well as general water and sewer consumption. The potential annual savings from implementing this measure is approximately 1,000 gallons of water, roughly 8 Therms, and about $26.00.
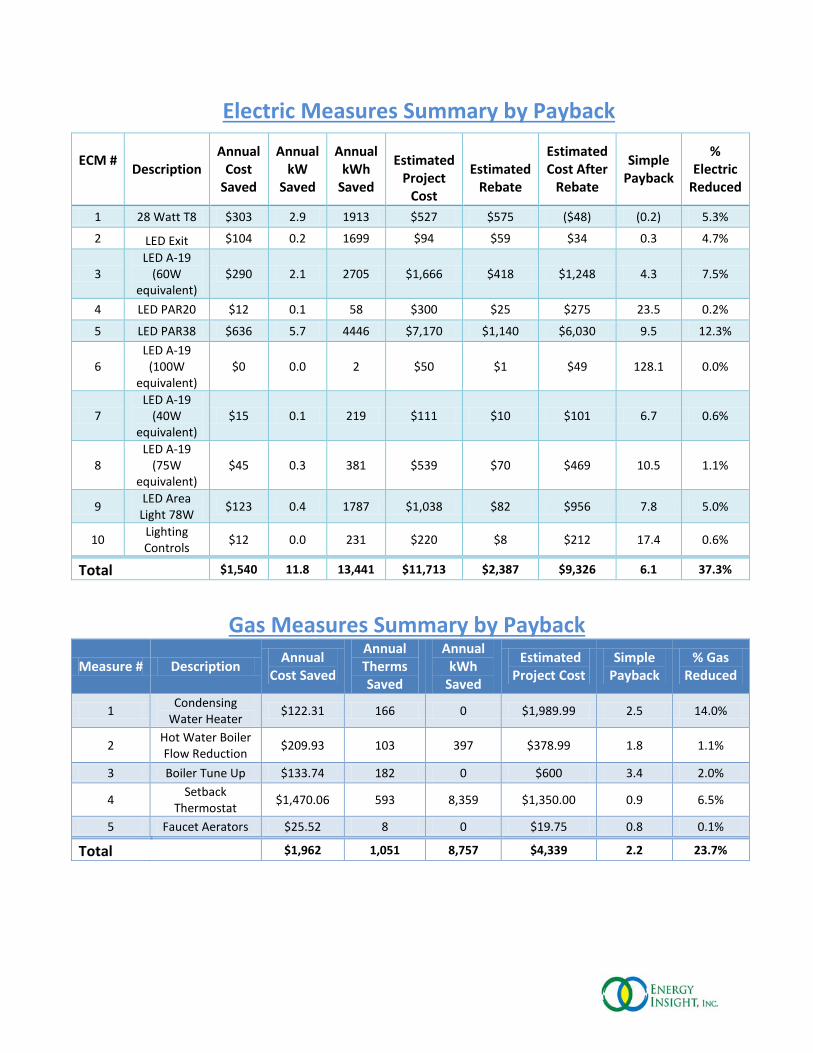
Electric Measures Summary by Payback
ECM # Description
Annual Cost
Saved
Annual kW
Saved
Annual kWh
Saved
Estimated
Project Cost
Estimated
Rebate
Estimated Cost After
Rebate
Simple Payback
% Electric
Reduced
1 28 Watt T8 $303 2.9 1913 $527 $575 ($48) (0.2) 5.3%
2 LED Exit $104 0.2 1699 $94 $59 $34 0.3 4.7%
3 LED A-19
(60W equivalent)
$290 2.1 2705 $1,666 $418 $1,248 4.3 7.5%
4 LED PAR20 $12 0.1 58 $300 $25 $275 23.5 0.2%
5 LED PAR38 $636 5.7 4446 $7,170 $1,140 $6,030 9.5 12.3%
6 LED A-19
(100W equivalent)
$0 0.0 2 $50 $1 $49 128.1 0.0%
7 LED A-19
(40W equivalent)
$15 0.1 219 $111 $10 $101 6.7 0.6%
8 LED A-19
(75W equivalent)
$45 0.3 381 $539 $70 $469 10.5 1.1%
9 LED Area Light 78W $123 0.4 1787 $1,038 $82 $956 7.8 5.0%
10 Lighting Controls $12 0.0 231 $220 $8 $212 17.4 0.6%
Total $1,540 11.8 13,441 $11,713 $2,387 $9,326 6.1 37.3%
Gas Measures Summary by Payback
Measure # Description Annual Cost Saved
Annual Therms Saved
Annual kWh
Saved
Estimated Project Cost
Simple Payback
% Gas Reduced
1 Condensing Water Heater $122.31 166 0 $1,989.99 2.5 14.0%
2 Hot Water Boiler Flow Reduction $209.93 103 397 $378.99 1.8 1.1%
3 Boiler Tune Up $133.74 182 0 $600 3.4 2.0%
4 Setback Thermostat $1,470.06 593 8,359 $1,350.00 0.9 6.5%
5 Faucet Aerators $25.52 8 0 $19.75 0.8 0.1%
Total
$1,962 1,051 8,757 $4,339 2.2 23.7%
Next Steps Step 1 – You’ve already taken steps to reduce energy bills and increase efficiency by having this Electric and Natural Gas Energy Analysis, which has identified energy and cost saving opportunities for your facility. Step 2 – Use this report as a guide to obtain bids from multiple qualified contractors and/or suppliers for the equipment you wish to retrofit or replace with new, higher efficiency equipment or to implement other recommendations suggested by the auditor.
Appendix 1: Calculations
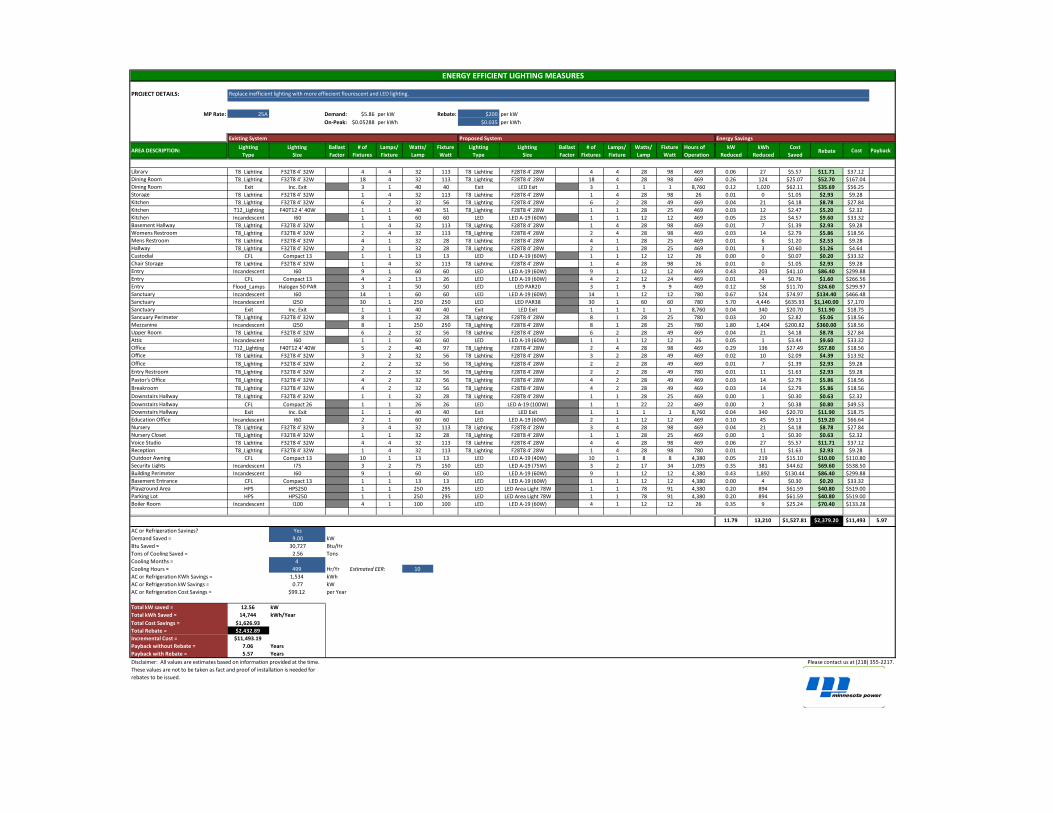
PROJECT DETAILS:
MP Rate: 25A Demand: $5.86 per kW Rebate: $200 per kWOn-Peak: $0.05288 per kWh $0.035 per kWh
AREA DESCRIPTION: Lighting Type
LightingSize
BallastFactor
# ofFixtures
Lamps/Fixture
Watts/Lamp
FixtureWatt
LightingType
LightingSize
BallastFactor
# of Fixtures
Lamps/Fixture
Watts/Lamp
FixtureWatt
Hours ofOperation
kWReduced
kWhReduced
CostSaved
Rebate Cost Payback
Library T8_Lighting F32T8 4’ 32W 4 4 32 113 T8_Lighting F28T8 4’ 28W 4 4 28 98 469 0.06 27 $5.57 $11.71 $37.12Dining Room T8_Lighting F32T8 4’ 32W 18 4 32 113 T8_Lighting F28T8 4’ 28W 18 4 28 98 469 0.26 124 $25.07 $52.70 $167.04Dining Room Exit Inc. Exit 3 1 40 40 Exit LED Exit 3 1 1 1 8,760 0.12 1,020 $62.11 $35.69 $56.25Storage T8_Lighting F32T8 4’ 32W 1 4 32 113 T8_Lighting F28T8 4’ 28W 1 4 28 98 26 0.01 0 $1.05 $2.93 $9.28Kitchen T8_Lighting F32T8 4’ 32W 6 2 32 56 T8_Lighting F28T8 4’ 28W 6 2 28 49 469 0.04 21 $4.18 $8.78 $27.84Kitchen T12_Lighting F40T12 4' 40W 1 1 40 51 T8_Lighting F28T8 4’ 28W 1 1 28 25 469 0.03 12 $2.47 $5.20 $2.32Kitchen Incandescent I60 1 1 60 60 LED LED A-19 (60W) 1 1 12 12 469 0.05 23 $4.57 $9.60 $33.32Basement Hallway T8_Lighting F32T8 4’ 32W 1 4 32 113 T8_Lighting F28T8 4’ 28W 1 4 28 98 469 0.01 7 $1.39 $2.93 $9.28Womens Restroom T8_Lighting F32T8 4’ 32W 2 4 32 113 T8_Lighting F28T8 4’ 28W 2 4 28 98 469 0.03 14 $2.79 $5.86 $18.56Mens Restroom T8_Lighting F32T8 4’ 32W 4 1 32 28 T8_Lighting F28T8 4’ 28W 4 1 28 25 469 0.01 6 $1.20 $2.53 $9.28Hallway T8_Lighting F32T8 4’ 32W 2 1 32 28 T8_Lighting F28T8 4’ 28W 2 1 28 25 469 0.01 3 $0.60 $1.26 $4.64Custodial CFL Compact 13 1 1 13 13 LED LED A-19 (60W) 1 1 12 12 26 0.00 0 $0.07 $0.20 $33.32Chair Storage T8_Lighting F32T8 4’ 32W 1 4 32 113 T8_Lighting F28T8 4’ 28W 1 4 28 98 26 0.01 0 $1.05 $2.93 $9.28Entry Incandescent I60 9 1 60 60 LED LED A-19 (60W) 9 1 12 12 469 0.43 203 $41.10 $86.40 $299.88Entry CFL Compact 13 4 2 13 26 LED LED A-19 (60W) 4 2 12 24 469 0.01 4 $0.76 $1.60 $266.56Entry Flood_Lamps Halogen 50 PAR 3 1 50 50 LED LED PAR20 3 1 9 9 469 0.12 58 $11.70 $24.60 $299.97Sanctuary Incandescent I60 14 1 60 60 LED LED A-19 (60W) 14 1 12 12 780 0.67 524 $74.97 $134.40 $466.48Sanctuary Incandescent I250 30 1 250 250 LED LED PAR38 30 1 60 60 780 5.70 4,446 $635.93 $1,140.00 $7,170Sanctuary Exit Inc. Exit 1 1 40 40 Exit LED Exit 1 1 1 1 8,760 0.04 340 $20.70 $11.90 $18.75Sancuary Perimeter T8_Lighting F32T8 4’ 32W 8 1 32 28 T8_Lighting F28T8 4’ 28W 8 1 28 25 780 0.03 20 $2.82 $5.06 $18.56Mezzanine Incandescent I250 8 1 250 250 T8_Lighting F28T8 4’ 28W 8 1 28 25 780 1.80 1,404 $200.82 $360.00 $18.56Upper Room T8_Lighting F32T8 4’ 32W 6 2 32 56 T8_Lighting F28T8 4’ 28W 6 2 28 49 469 0.04 21 $4.18 $8.78 $27.84Attic Incandescent I60 1 1 60 60 LED LED A-19 (60W) 1 1 12 12 26 0.05 1 $3.44 $9.60 $33.32Office T12_Lighting F40T12 4' 40W 5 2 40 97 T8_Lighting F28T8 4’ 28W 2 4 28 98 469 0.29 136 $27.49 $57.80 $18.56Office T8_Lighting F32T8 4’ 32W 3 2 32 56 T8_Lighting F28T8 4’ 28W 3 2 28 49 469 0.02 10 $2.09 $4.39 $13.92Office T8_Lighting F32T8 4’ 32W 2 2 32 56 T8_Lighting F28T8 4’ 28W 2 2 28 49 469 0.01 7 $1.39 $2.93 $9.28Entry Restroom T8_Lighting F32T8 4’ 32W 2 2 32 56 T8_Lighting F28T8 4’ 28W 2 2 28 49 780 0.01 11 $1.63 $2.93 $9.28Pastor's Office T8_Lighting F32T8 4’ 32W 4 2 32 56 T8_Lighting F28T8 4’ 28W 4 2 28 49 469 0.03 14 $2.79 $5.86 $18.56Breakroom T8_Lighting F32T8 4’ 32W 4 2 32 56 T8_Lighting F28T8 4’ 28W 4 2 28 49 469 0.03 14 $2.79 $5.86 $18.56Downstairs Hallway T8_Lighting F32T8 4’ 32W 1 1 32 28 T8_Lighting F28T8 4’ 28W 1 1 28 25 469 0.00 1 $0.30 $0.63 $2.32Downstairs Hallway CFL Compact 26 1 1 26 26 LED LED A-19 (100W) 1 1 22 22 469 0.00 2 $0.38 $0.80 $49.53Downstairs Hallway Exit Inc. Exit 1 1 40 40 Exit LED Exit 1 1 1 1 8,760 0.04 340 $20.70 $11.90 $18.75Education Office Incandescent I60 2 1 60 60 LED LED A-19 (60W) 2 1 12 12 469 0.10 45 $9.13 $19.20 $66.64Nursery T8_Lighting F32T8 4’ 32W 3 4 32 113 T8_Lighting F28T8 4’ 28W 3 4 28 98 469 0.04 21 $4.18 $8.78 $27.84Nursery Closet T8_Lighting F32T8 4’ 32W 1 1 32 28 T8_Lighting F28T8 4’ 28W 1 1 28 25 469 0.00 1 $0.30 $0.63 $2.32Voice Studio T8_Lighting F32T8 4’ 32W 4 4 32 113 T8_Lighting F28T8 4’ 28W 4 4 28 98 469 0.06 27 $5.57 $11.71 $37.12Reception T8_Lighting F32T8 4’ 32W 1 4 32 113 T8_Lighting F28T8 4’ 28W 1 4 28 98 780 0.01 11 $1.63 $2.93 $9.28Outdoor Awning CFL Compact 13 10 1 13 13 LED LED A-19 (40W) 10 1 8 8 4,380 0.05 219 $15.10 $10.00 $110.80Security Lights Incandescent I75 3 2 75 150 LED LED A-19 (75W) 3 2 17 34 1,095 0.35 381 $44.62 $69.60 $538.50Building Perimeter Incandescent I60 9 1 60 60 LED LED A-19 (60W) 9 1 12 12 4,380 0.43 1,892 $130.44 $86.40 $299.88Basement Entrance CFL Compact 13 1 1 13 13 LED LED A-19 (60W) 1 1 12 12 4,380 0.00 4 $0.30 $0.20 $33.32Playground Area HPS HPS250 1 1 250 295 LED LED Area Light 78W 1 1 78 91 4,380 0.20 894 $61.59 $40.80 $519.00Parking Lot HPS HPS250 1 1 250 295 LED LED Area Light 78W 1 1 78 91 4,380 0.20 894 $61.59 $40.80 $519.00Boiler Room Incandescent I100 4 1 100 100 LED LED A-19 (60W) 4 1 12 12 26 0.35 9 $25.24 $70.40 $133.28
11.79 13,210 $1,527.81 $2,379.20 $11,493 5.97
AC or Refrigeration Savings? YesDemand Saved = 9.00 kWBtu Saved = 30,727 Btu/HrTons of Cooling Saved = 2.56 TonsCooling Months = 4Cooling Hours = 499 Hr/Yr Estimated EER: 10AC or Refrigeration KWh Savings = 1,534 kWhAC or Refrigeration kW Savings = 0.77 kWAC or Refrigeration Cost Savings = $99.12 per Year
Total kW saved = 12.56 kWTotal kWh Saved = 14,744 kWh/YearTotal Cost Savings = $1,626.93Total Rebate = $2,432.89Incremental Cost = $11,493.19Payback without Rebate = 7.06 YearsPayback with Rebate = 5.57 Years
ENERGY EFFICIENT LIGHTING MEASURES
Replace inefficient lighting with more effiecient flourescent and LED lighting.
Disclaimer: All values are estimates based on information provided at the time. These values are not to be taken as fact and proof of installation is needed for rebates to be issued.
Please contact us at (218) 355-2217.
Existing System Proposed System Energy Savings

PROJECT DETAILS:
MP Rate: 25A Demand: $5.86 per kW Rebate: $200 per kWOn-Peak: $0.05288 per kWh $0.035 per kWh
AREA DESCRIPTION: Lighting Type
LightingSize
BallastFactor
# ofFixtures
Lamps/Fixture
FixtureWatt
# SensorsDays per
WeekHours Operating
per DayHours of
OperationHours Occupied
per DayOccupied
HoursUnoccupied
HourskWh
ReducedCost
SavedRebate Cost Payback
Womens Restroom T8_Lighting F28T8 4’ 28W 2 4 98 1 3 3 469 0.5 78 391 77 $4.05 $2.68 $55Mens Restroom T8_Lighting F28T8 4’ 28W 4 1 25 1 3 3 469 0.5 78 391 39 $2.07 $1.37 $55Entry Restroom T8_Lighting F28T8 4’ 28W 2 2 49 1 3 3 469 0.5 78 391 38 $2.03 $1.34 $55Breakroom T8_Lighting F28T8 4’ 28W 4 2 49 1 3 3 469 0.5 78 391 77 $4.05 $2.68 $55
231 $12.20 $8.08 $220 17.37
LIGHT OCCUPANCY SENSORS
Install occupancy sensors in several areas of the church.
PROPOSED SYSTEM ENERGY SAVINGS
Disclaimer: All values are estimates based on information provided at the time. These values are not to be taken as fact and proof of installation is needed for rebates to be issued.
Please contact us at (218) 355-2217.
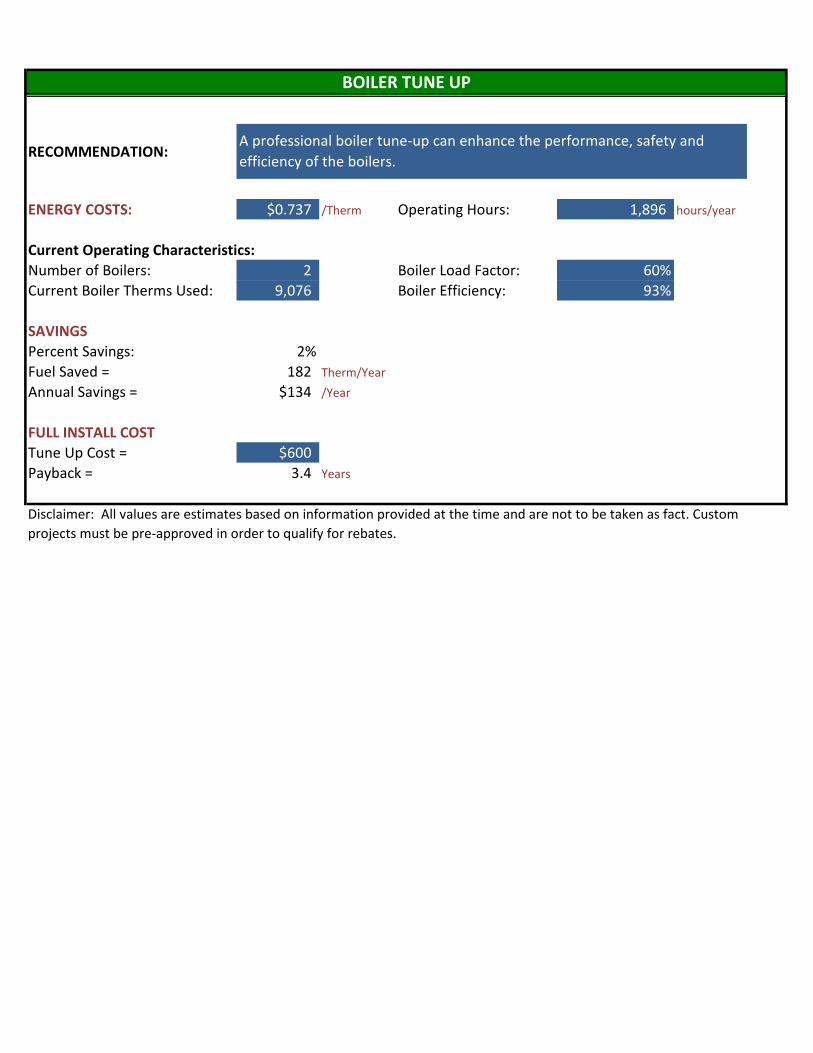
RECOMMENDATION:
ENERGY COSTS: $0.737 /Therm Operating Hours: 1,896 hours/year
Current Operating Characteristics:Number of Boilers: 2 Boiler Load Factor: 60%Current Boiler Therms Used: 9,076 Boiler Efficiency: 93%
SAVINGSPercent Savings: 2%Fuel Saved = 182 Therm/YearAnnual Savings = $134 /Year
FULL INSTALL COSTTune Up Cost = $600Payback = 3.4 Years
BOILER TUNE UP
A professional boiler tune-up can enhance the performance, safety and efficiency of the boilers.
Disclaimer: All values are estimates based on information provided at the time and are not to be taken as fact. Custom projects must be pre-approved in order to qualify for rebates.
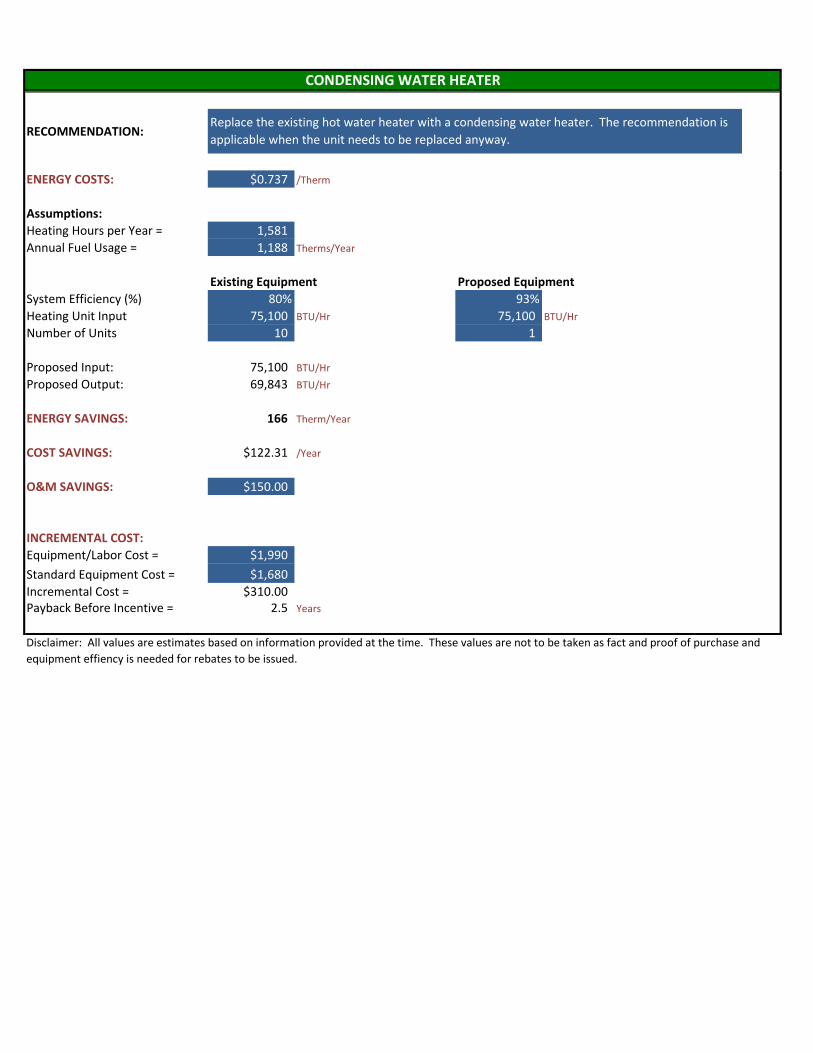
RECOMMENDATION:
ENERGY COSTS: $0.737 /Therm
Assumptions:Heating Hours per Year = 1,581 Annual Fuel Usage = 1,188 Therms/Year
Existing Equipment Proposed EquipmentSystem Efficiency (%) 80% 93%Heating Unit Input 75,100 BTU/Hr 75,100 BTU/HrNumber of Units 10 1
Proposed Input: 75,100 BTU/HrProposed Output: 69,843 BTU/Hr
ENERGY SAVINGS: 166 Therm/Year
COST SAVINGS: $122.31 /Year
O&M SAVINGS: $150.00
INCREMENTAL COST:Equipment/Labor Cost = $1,990Standard Equipment Cost = $1,680Incremental Cost = $310.00Payback Before Incentive = 2.5 Years
CONDENSING WATER HEATER
Replace the existing hot water heater with a condensing water heater. The recommendation is applicable when the unit needs to be replaced anyway.
Disclaimer: All values are estimates based on information provided at the time. These values are not to be taken as fact and proof of purchase and equipment effiency is needed for rebates to be issued.

RECOMMENDATION:
ENERGY COSTS: $0.737 /Therm Number of Boilers: 2 Boiler Efficiency = 93%
Equipment Specifications:Specific Weight of Fluid: 8.2048 lbm per Gal Water Temperature: 165 °FSpecific Heat of Fluid: 1.02 BTU/lbm °F Boiler Operation Hours: 1,896 Diversity Factor: 60%
SystemRated Flow
Operating Flow Rate
(GPM)BTU/Hour
SavedHours of
OperationTherms/Year
Saved0% 0% - - - -
20% 0% 0.2 - - - 25% 0% 0.3 - - - 30% 0% 0.3 - - - 35% 0% 0.4 - - - 40% 0% 0.5 - - - 45% 0% 0.5 - - - 50% 0% 0.6 - - - 55% 0% 0.6 - - - 60% 0% 0.7 - - - 65% 0% 0.7 - - - 70% 10% 0.8 23,302 190 44 75% 20% 0.8 18,642 379 71 80% 10% 0.9 13,981 190 27 85% 10% 1.0 9,321 190 18 90% 0% 1.0 - - - 95% 50% 1.1 - 948 -
100% 0% 1.1 - - -
ENERGY SAVINGS: 103 Therms/Year397 kWh/Year
COST SAVINGS: $209.93 /Year
INCREMENTAL COST:Equipment Cost = $379Labor Cost = $0.00Total Cost = $379Payback = 1.8 Years
HOT WATER BOILER FLOW REDUCTION
Using an ECM to reduce the flow rate of the boiler system will allow the boiler to not have to heat up as much mass during operating hours. This reduction in mass is proportional to a reduction in BTUs.
Disclaimer: All values are estimates based on information provided at the time and are not to be taken as fact. Custom projects must be pre-approved in order to qualify for rebates.
RECOMMENDATION:
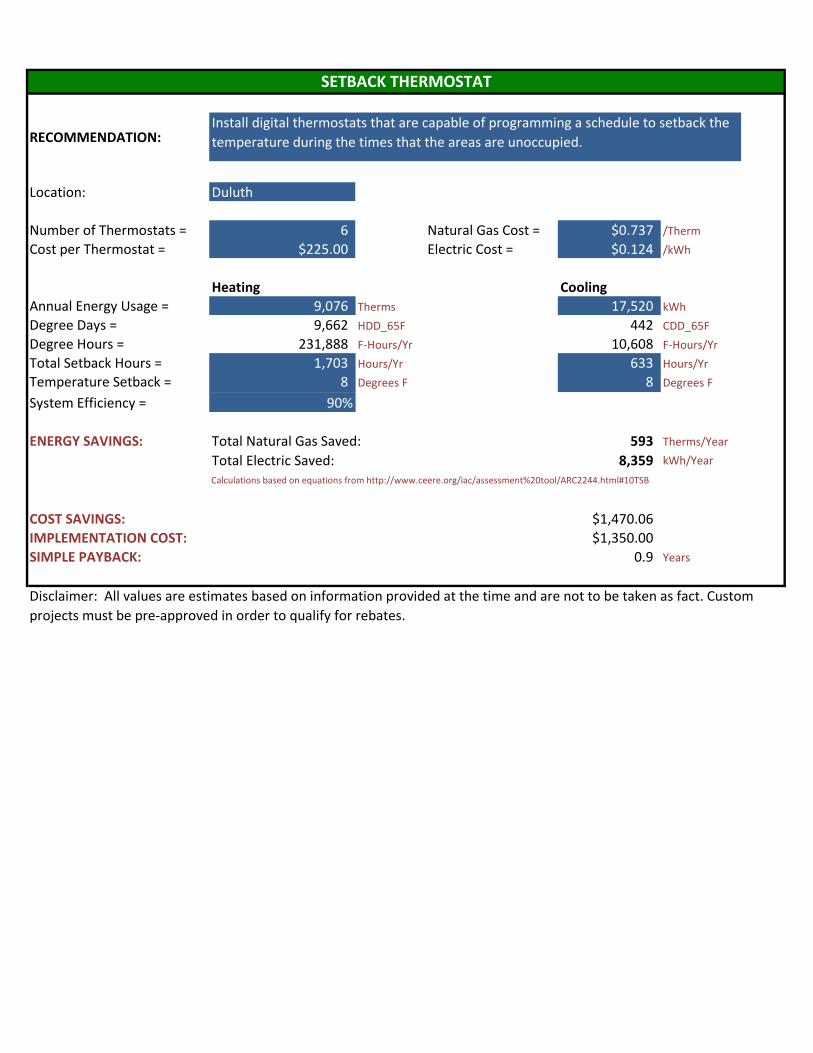
Location: Duluth
Number of Thermostats = 6 Natural Gas Cost = $0.737 /ThermCost per Thermostat = $225.00 Electric Cost = $0.124 /kWh
Heating CoolingAnnual Energy Usage = 9,076 Therms 17,520 kWhDegree Days = 9,662 HDD_65F 442 CDD_65FDegree Hours = 231,888 F-Hours/Yr 10,608 F-Hours/YrTotal Setback Hours = 1,703 Hours/Yr 633 Hours/YrTemperature Setback = 8 Degrees F 8 Degrees F
System Efficiency = 90%
ENERGY SAVINGS: Total Natural Gas Saved: 593 Therms/YearTotal Electric Saved: 8,359 kWh/YearCalculations based on equations from http://www.ceere.org/iac/assessment%20tool/ARC2244.html#10TSB
COST SAVINGS: $1,470.06IMPLEMENTATION COST: $1,350.00SIMPLE PAYBACK: 0.9 Years
SETBACK THERMOSTAT
Install digital thermostats that are capable of programming a schedule to setback the temperature during the times that the areas are unoccupied.
Disclaimer: All values are estimates based on information provided at the time and are not to be taken as fact. Custom projects must be pre-approved in order to qualify for rebates.
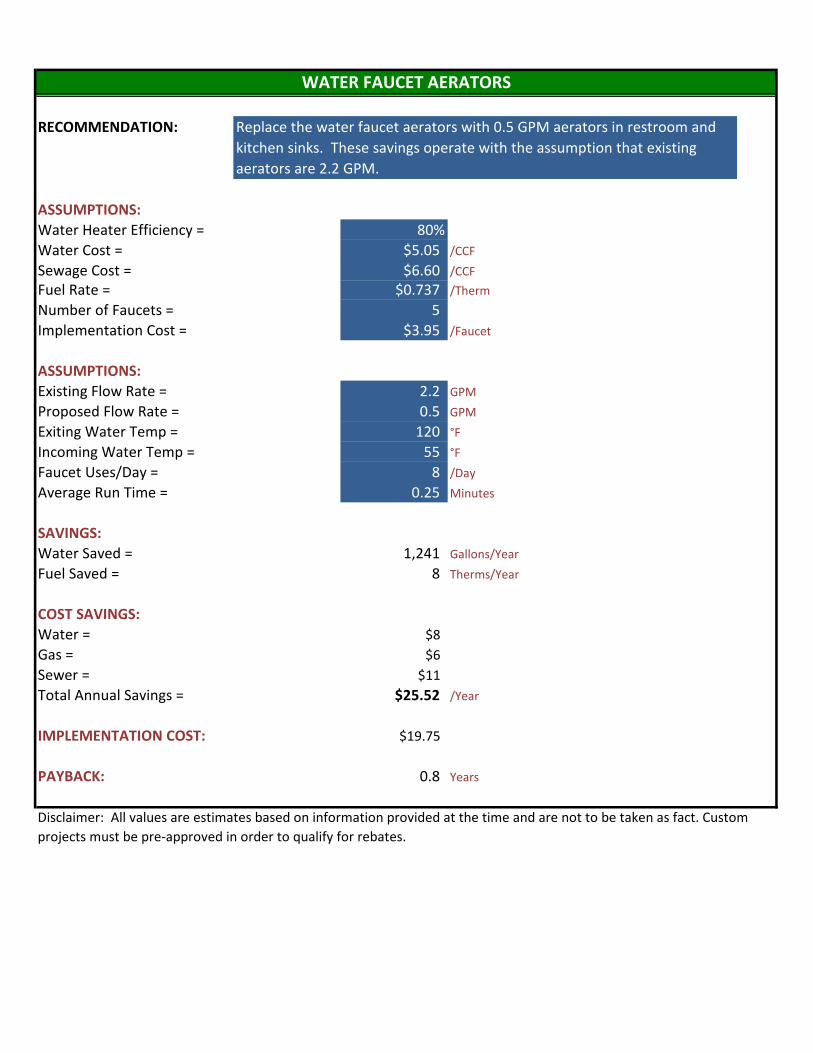
RECOMMENDATION:
ASSUMPTIONS:Water Heater Efficiency = 80%Water Cost = $5.05 /CCFSewage Cost = $6.60 /CCFFuel Rate = $0.737 /ThermNumber of Faucets = 5 Implementation Cost = $3.95 /Faucet
ASSUMPTIONS:Existing Flow Rate = 2.2 GPMProposed Flow Rate = 0.5 GPMExiting Water Temp = 120 °FIncoming Water Temp = 55 °FFaucet Uses/Day = 8 /Day Average Run Time = 0.25 Minutes
SAVINGS:Water Saved = 1,241 Gallons/YearFuel Saved = 8 Therms/Year
COST SAVINGS:Water = $8Gas = $6Sewer = $11Total Annual Savings = $25.52 /Year
IMPLEMENTATION COST: $19.75
PAYBACK: 0.8 Years
WATER FAUCET AERATORS
Replace the water faucet aerators with 0.5 GPM aerators in restroom and kitchen sinks. These savings operate with the assumption that existing aerators are 2.2 GPM.
Disclaimer: All values are estimates based on information provided at the time and are not to be taken as fact. Custom projects must be pre-approved in order to qualify for rebates.