Embed Size (px)
Citation preview
Electric Motor Efficiency under Variable Frequencies and Loads http://www.itrc.org/reports/pdf/r06004.pdf ITRC Report No. R 06-004
Electric Motor Efficiency under Variable Frequencies and Loads
October 2006 Prepared for
California State University Agricultural Research Initiative California Energy Commission Public Interest Electric Research
United States Dept. of Interior Bureau of Reclamation
by
Dr. Charles Burt, Dr. Xianshu Piao, Franklin Gaudi, Bryan Busch, and Dr. NFN Taufik Irrigation Training and Research Center (ITRC) California Polytechnic State University (Cal Poly) San Luis Obispo, CA 93407-0253 805-756-2379 www.itrc.org

Electric Motor Efficiency under Variable Frequencies and Loads http://www.itrc.org/reports/pdf/r06004.pdf ITRC Report No. R 06-004
Irrigation Training and Research Center - i - Electric Motor Efficiency under Variable Speeds and Loads
TABLE OF CONTENTS
Introduction ....................................................................................................................... 1 Background ..................................................................................................................... 1
Procedures and Methods .................................................................................................. 5 Motor Testing Configuration .......................................................................................... 5
Electrical supply.......................................................................................................... 5 Motor test stand........................................................................................................... 6 Motors ......................................................................................................................... 7 Measurements ............................................................................................................. 7
RPM .................................................................................................................................... 8 Torque ................................................................................................................................ 8 Electric Power Characteristics .......................................................................................... 9 IEEE Standard 112-2004 ................................................................................................. 10 On-going Quality Control ................................................................................................ 10
Results .............................................................................................................................. 11 Power Factor ................................................................................................................. 11 VFD Controller Efficiency ........................................................................................... 12 Motor Efficiency ........................................................................................................... 14 Air Conditioning Power Requirement .......................................................................... 17
Conclusions ...................................................................................................................... 18
References ........................................................................................................................ 20
LIST OF APPENDICES
Appendix A: Motor Operating and Testing Procedure Appendix B: Motor Replacement Procedure Appendix C: Sample Data Sheets Appendix D: Equipment Descriptions
Electric Motor Efficiency under Variable Frequencies and Loads http://www.itrc.org/reports/pdf/r06004.pdf ITRC Report No. R 06-004
Irrigation Training and Research Center - ii - Electric Motor Efficiency under Variable Speeds and Loads
LIST OF FIGURES
Figure 1. Induction motor efficiency as a function of load (Natural Resources Canada, 2003) .................................................................................................................. 2
Figure 2. Induction motor power factor (PF) as a function of full-load amperage (Natural Resources Canada, 2003) ................................................................................... 3
Figure 3. Electrical supply for the motor testing ............................................................... 5 Figure 4. Motor test stand. ................................................................................................. 6 Figure 5. Data collection .................................................................................................... 8 Figure 6. Pulse Width Modulation signal compared to sinusoidal .................................... 9 Figure 7. Power Factor versus load .................................................................................. 11 Figure 8. Power Factor versus motor output horsepower for all motors tested with
Danfoss VFD controller ................................................................................... 12 Figure 9. VFD controller efficiency with various motors at 100% RPM and varying
loads ................................................................................................................. 13 Figure 10. VFD controller efficiency with various motors at 40% RPM ........................ 13 Figure 11. Efficiencies of all motors, across-the-line, at various relative loads .............. 14 Figure 12. Motor efficiency at 10% RPM increments under various loads ..................... 15
LIST OF TABLES
Table 1. Full Load Motor Efficiencies at 1800 RPM (Motor Decisions Matter, 2003). ... 2 Table 2. Idealized VFD Efficiency Factor (motor plus VFD controller) that ignores
motor duty-point movement (derived from Wallbom-Carlson, 1998) ............... 4 Table 3. Motor Efficiencies with VFD control (derived from Rooks and Wallace, 2003) 4 Table 4. Motors used in testing and their nameplate specifications .................................. 7 Table 5. Load cell locations on pivot arm for measuring torque ....................................... 9 Table 6. Relative motor efficiencies with and without VFD control ............................... 16
Electric Motor Efficiency under Variable Frequencies and Loads http://www.itrc.org/reports/pdf/r06004.pdf ITRC Report No. R 06-004
Irrigation Training and Research Center - 1 - Electric Motor Efficiency under Variable Speeds and Loads
INTRODUCTION
The Irrigation Training and Research Center (ITRC) of California Polytechnic State University (Cal Poly), San Luis Obispo, completed this study on the behalf of the California State University Agricultural Research Initiative project No. 05-3-009. Funding was also provided by the California Energy Commission Public Interest Electric Research (PIER) program, Agreement No. 400-99-014, and the US Bureau of Reclamation Grant No. 04FG210013. The primary research objective of this study was to determine motor efficiencies under varying speeds (induced by a VFD controller) and loads. A broader objective was to provide sufficient information to designers and economists so that they could estimate total pumping plant power usage with a VFD-controlled installation. Motors were tested with VFDs as well as across-the-line. This study found that, on the average, the relative efficiency of the electrical system with a VFD may be about 8% lower than the relative efficiency of a properly designed, full-load across-the-line system.
Background Electric-powered pumping by irrigation districts and farmers in the U.S. represents a major consumption of electricity. It is estimated (Burt et al, 2003) that the annual agricultural electric pumping usage in California is approximately 10 million MWh/hr. Variable frequency drive-controlled motors have been used in many irrigation applications in attempts to save energy (ITRC, 2002) and/or to improve control in pipelines or canals (Burt and Piao, 2002). Economic tradeoff analyses for comparison of Variable Frequency Drive (VFD) -controlled versus conventional single-speed motor applications for pumps require knowledge of how the efficiencies of the pump, motor, and VFD controller change as the pump flow rate or head changes. The annual energy cost is computed by knowing the hours of operation at various flow rates, the overall pumping plant efficiency at each flow rate, and the cost of power. The procedures for combining pump curves at various speeds with irrigation system curves to determine pump efficiencies are well understood. Some pump companies such as ITT Goulds provide software that combines user-specified system curves at various Revolutions per Minute (RPM) for user-specified pumps (Goulds, 2003). Nominal full load efficiency standards for polyphase induction motors of various sizes have been specified by the US Energy Policy Act of 1992. Those standards apply to all motors manufactured after October 1997. Motor Decisions Matter (2003), an industry group dedicated to improving motor application efficiencies, developed Table 1 for comparison.
Electric Motor Efficiency under Variable Frequencies and Loads http://www.itrc.org/reports/pdf/r06004.pdf ITRC Report No. R 06-004
Irrigation Training and Research Center - 2 - Electric Motor Efficiency under Variable Speeds and Loads
Table 1. Full Load Motor Efficiencies at 1800 RPM (Motor Decisions Matter, 2003).
Size (hp) Pre-
EPActa EPActb
NEMA Premiumc
1.0 76.7 82.5 85.5 1.5 79.1 84.0 86.5 2.0 80.8 84.0 86.5 3.0 81.4 87.5 89.5 5.0 83.3 87.5 89.5 7.5 85.5 89.5 91.7
10.0 85.7 89.5 91.7 15.0 86.6 91.0 92.4 20.0 88.5 91.0 93.0 25.0 89.3 92.4 93.6 30.0 89.6 92.4 93.6 40.0 90.2 93.0 94.1 50.0 91.3 93.0 94.5 60.0 91.8 93.6 95.0 75.0 91.7 94.1 95.4 100.0 92.3 94.5 95.4 125.0 92.2 94.5 95.4 150.0 93.0 95.0 95.8 200.0 93.5 95.0 96.2
a. Pre-EPAct: DOE’s MotorMaster+ software version 4.00.01 (9/26/2003) “Average Standard Efficiency” motor defaults
b. EPAct: Energy Policy Act of 1992 c. NEMA Premium: NEMA MG 1-2003 Table 12-12
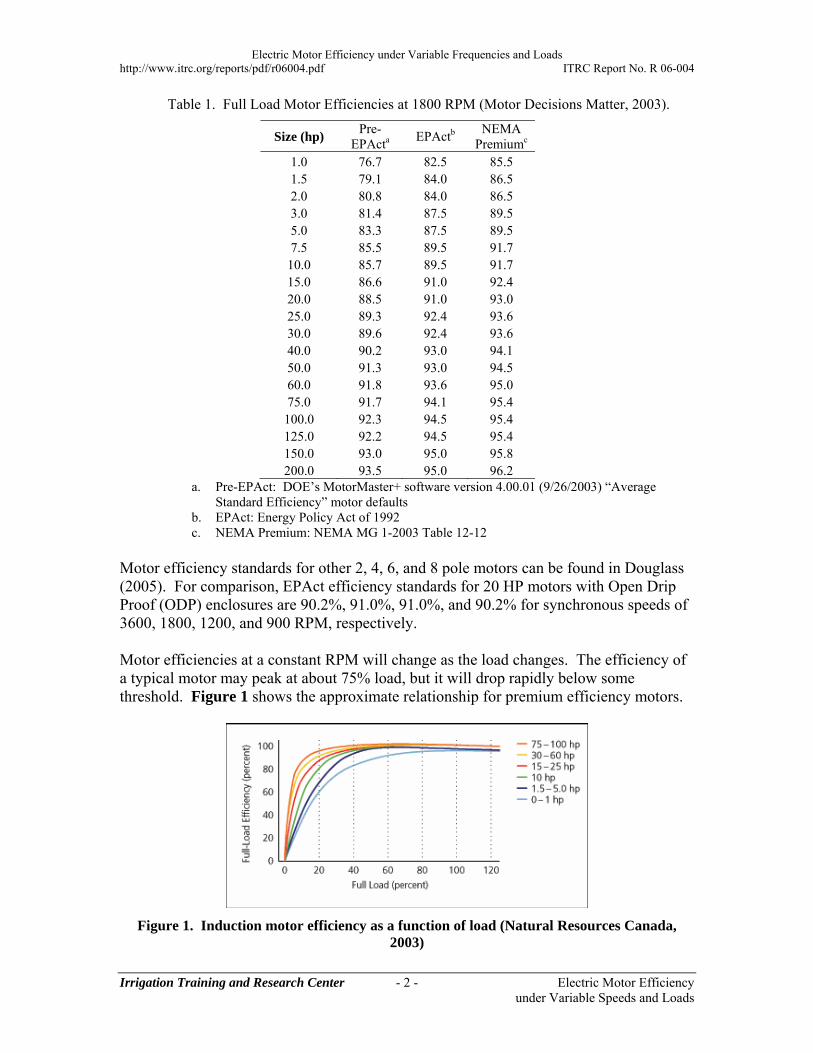
Motor efficiency standards for other 2, 4, 6, and 8 pole motors can be found in Douglass (2005). For comparison, EPAct efficiency standards for 20 HP motors with Open Drip Proof (ODP) enclosures are 90.2%, 91.0%, 91.0%, and 90.2% for synchronous speeds of 3600, 1800, 1200, and 900 RPM, respectively. Motor efficiencies at a constant RPM will change as the load changes. The efficiency of a typical motor may peak at about 75% load, but it will drop rapidly below some threshold. Figure 1 shows the approximate relationship for premium efficiency motors.
Figure 1. Induction motor efficiency as a function of load (Natural Resources Canada, 2003)
Electric Motor Efficiency under Variable Frequencies and Loads http://www.itrc.org/reports/pdf/r06004.pdf ITRC Report No. R 06-004
Irrigation Training and Research Center - 3 - Electric Motor Efficiency under Variable Speeds and Loads
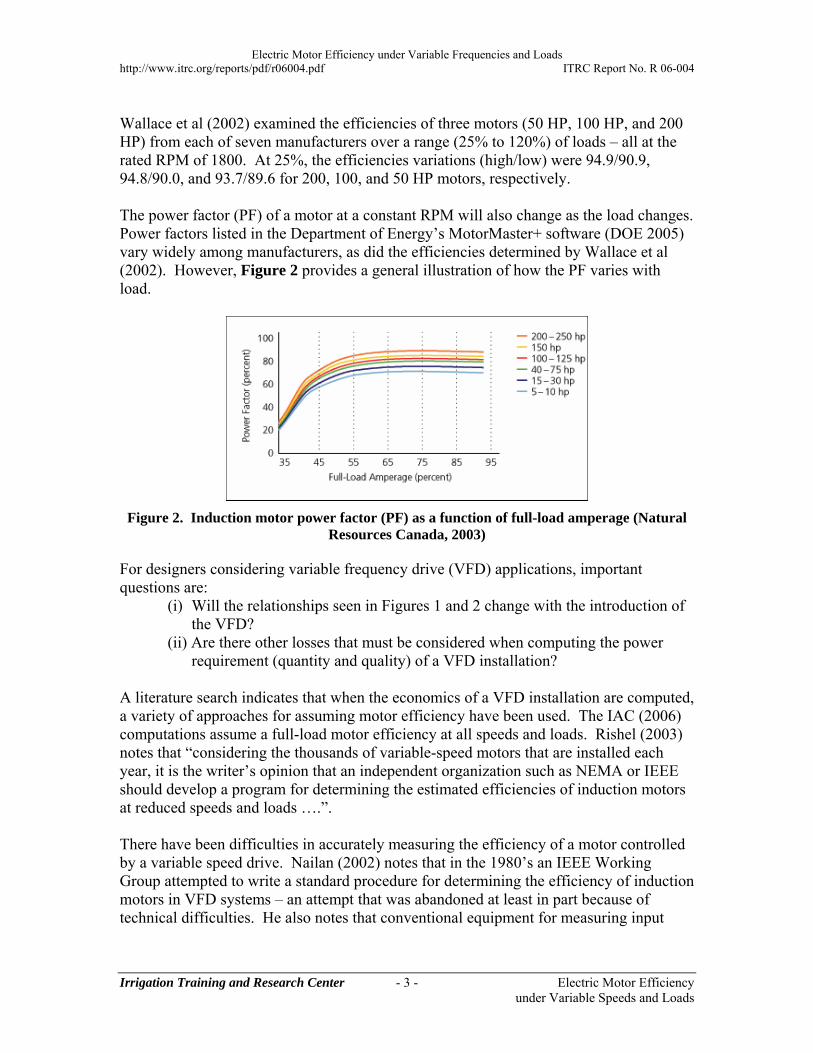
Wallace et al (2002) examined the efficiencies of three motors (50 HP, 100 HP, and 200 HP) from each of seven manufacturers over a range (25% to 120%) of loads – all at the rated RPM of 1800. At 25%, the efficiencies variations (high/low) were 94.9/90.9, 94.8/90.0, and 93.7/89.6 for 200, 100, and 50 HP motors, respectively. The power factor (PF) of a motor at a constant RPM will also change as the load changes. Power factors listed in the Department of Energy’s MotorMaster+ software (DOE 2005) vary widely among manufacturers, as did the efficiencies determined by Wallace et al (2002). However, Figure 2 provides a general illustration of how the PF varies with load.
Figure 2. Induction motor power factor (PF) as a function of full-load amperage (Natural Resources Canada, 2003)
For designers considering variable frequency drive (VFD) applications, important questions are:
(i) Will the relationships seen in Figures 1 and 2 change with the introduction of the VFD?
(ii) Are there other losses that must be considered when computing the power requirement (quantity and quality) of a VFD installation?
A literature search indicates that when the economics of a VFD installation are computed, a variety of approaches for assuming motor efficiency have been used. The IAC (2006) computations assume a full-load motor efficiency at all speeds and loads. Rishel (2003) notes that “considering the thousands of variable-speed motors that are installed each year, it is the writer’s opinion that an independent organization such as NEMA or IEEE should develop a program for determining the estimated efficiencies of induction motors at reduced speeds and loads ….”. There have been difficulties in accurately measuring the efficiency of a motor controlled by a variable speed drive. Nailan (2002) notes that in the 1980’s an IEEE Working Group attempted to write a standard procedure for determining the efficiency of induction motors in VFD systems – an attempt that was abandoned at least in part because of technical difficulties. He also notes that conventional equipment for measuring input
Electric Motor Efficiency under Variable Frequencies and Loads http://www.itrc.org/reports/pdf/r06004.pdf ITRC Report No. R 06-004
Irrigation Training and Research Center - 4 - Electric Motor Efficiency under Variable Speeds and Loads
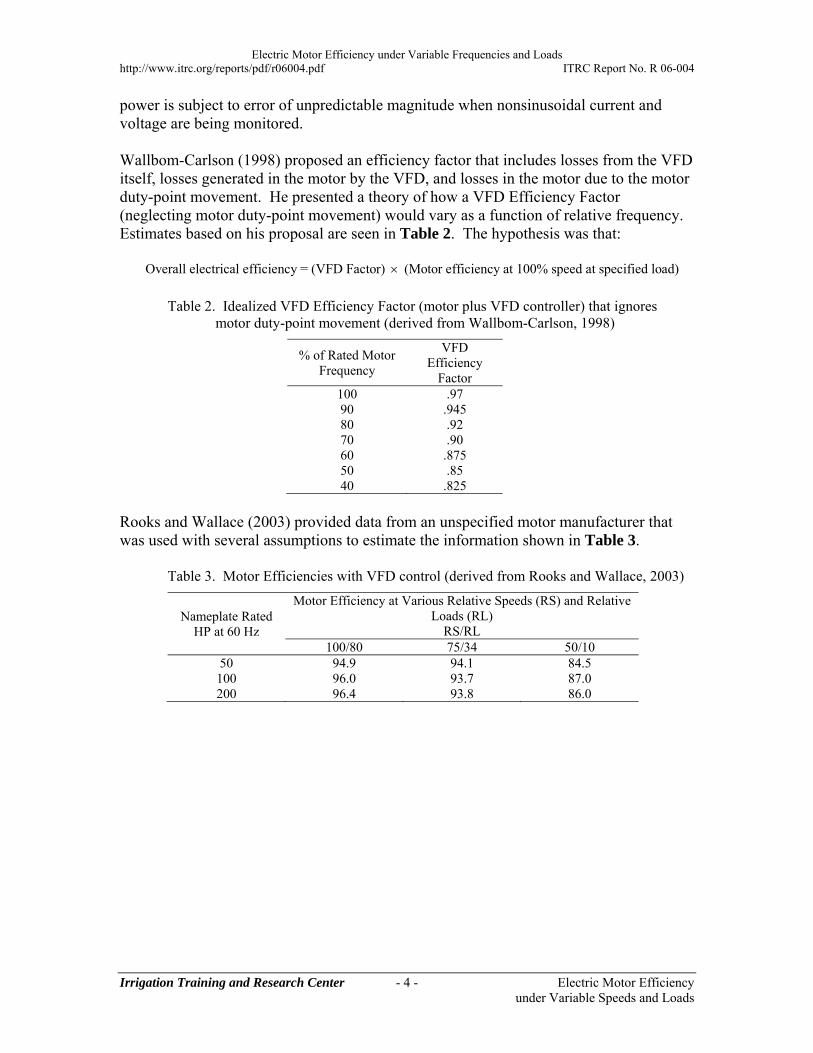
power is subject to error of unpredictable magnitude when nonsinusoidal current and voltage are being monitored. Wallbom-Carlson (1998) proposed an efficiency factor that includes losses from the VFD itself, losses generated in the motor by the VFD, and losses in the motor due to the motor duty-point movement. He presented a theory of how a VFD Efficiency Factor (neglecting motor duty-point movement) would vary as a function of relative frequency. Estimates based on his proposal are seen in Table 2. The hypothesis was that: Overall electrical efficiency = (VFD Factor) (Motor efficiency at 100% speed at specified load)
Table 2. Idealized VFD Efficiency Factor (motor plus VFD controller) that ignores motor duty-point movement (derived from Wallbom-Carlson, 1998)
% of Rated Motor Frequency
VFD Efficiency
Factor 100 .97 90 .945 80 .92 70 .90 60 .875 50 .85 40 .825
Rooks and Wallace (2003) provided data from an unspecified motor manufacturer that was used with several assumptions to estimate the information shown in Table 3.
Table 3. Motor Efficiencies with VFD control (derived from Rooks and Wallace, 2003)
Nameplate Rated HP at 60 Hz
Motor Efficiency at Various Relative Speeds (RS) and Relative Loads (RL)
RS/RL 100/80 75/34 50/10
50 94.9 94.1 84.5 100 96.0 93.7 87.0 200 96.4 93.8 86.0
Electric Motor Efficiency under Variable Frequencies and Loads http://www.itrc.org/reports/pdf/r06004.pdf ITRC Report No. R 06-004
Irrigation Training and Research Center - 5 - Electric Motor Efficiency under Variable Speeds and Loads
PROCEDURES AND METHODS
Motor Testing Configuration Donations were received from Emerson Motor Company (75, 50, and 20 HP premium efficiency motors), Thoma Electric of San Luis Obispo (technical assistance for the electrical installation), Pacific Gas and Electric Co. (pressure gauges), and Branom Instrument Co. of Sacramento (Danfoss VFD controller). A detailed description of the motor testing equipment and setup can be found in Appendix D. The motor testing configuration at the Water Delivery Facility on the Cal Poly campus consisted of:
1. Electrical supply 2. Motor test stand 3. Motors 4. Data
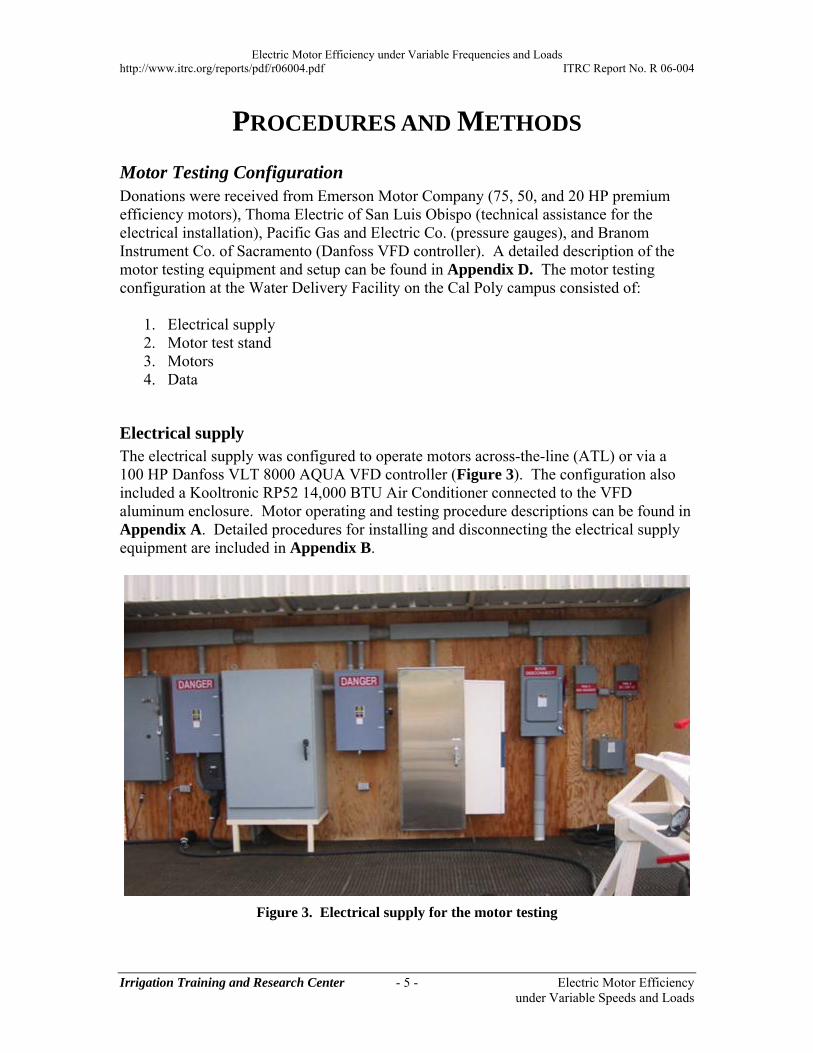
Electrical supply The electrical supply was configured to operate motors across-the-line (ATL) or via a 100 HP Danfoss VLT 8000 AQUA VFD controller (Figure 3). The configuration also included a Kooltronic RP52 14,000 BTU Air Conditioner connected to the VFD aluminum enclosure. Motor operating and testing procedure descriptions can be found in Appendix A. Detailed procedures for installing and disconnecting the electrical supply equipment are included in Appendix B.
Figure 3. Electrical supply for the motor testing
Electric Motor Efficiency under Variable Frequencies and Loads http://www.itrc.org/reports/pdf/r06004.pdf ITRC Report No. R 06-004
Irrigation Training and Research Center - 6 - Electric Motor Efficiency under Variable Speeds and Loads
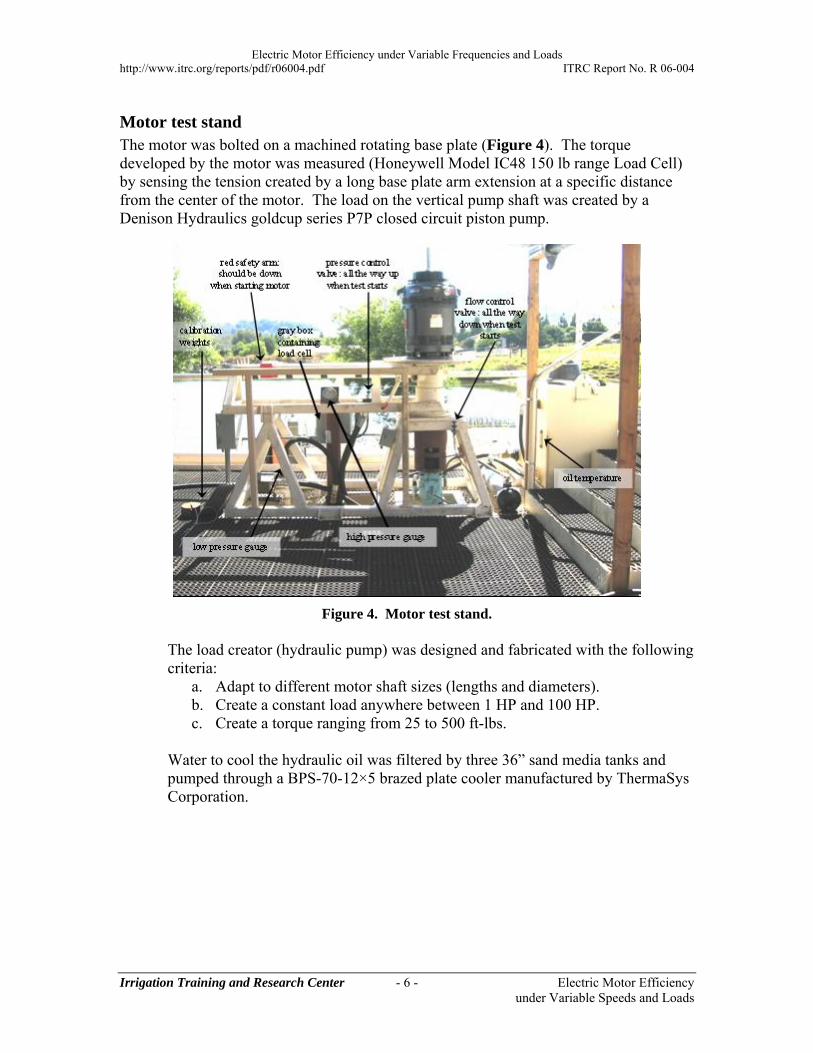
Motor test stand The motor was bolted on a machined rotating base plate (Figure 4). The torque developed by the motor was measured (Honeywell Model IC48 150 lb range Load Cell) by sensing the tension created by a long base plate arm extension at a specific distance from the center of the motor. The load on the vertical pump shaft was created by a Denison Hydraulics goldcup series P7P closed circuit piston pump.
Figure 4. Motor test stand.
The load creator (hydraulic pump) was designed and fabricated with the following criteria:
a. Adapt to different motor shaft sizes (lengths and diameters). b. Create a constant load anywhere between 1 HP and 100 HP. c. Create a torque ranging from 25 to 500 ft-lbs.
Water to cool the hydraulic oil was filtered by three 36” sand media tanks and pumped through a BPS-70-12×5 brazed plate cooler manufactured by ThermaSys Corporation.
Electric Motor Efficiency under Variable Frequencies and Loads http://www.itrc.org/reports/pdf/r06004.pdf ITRC Report No. R 06-004
Irrigation Training and Research Center - 7 - Electric Motor Efficiency under Variable Speeds and Loads
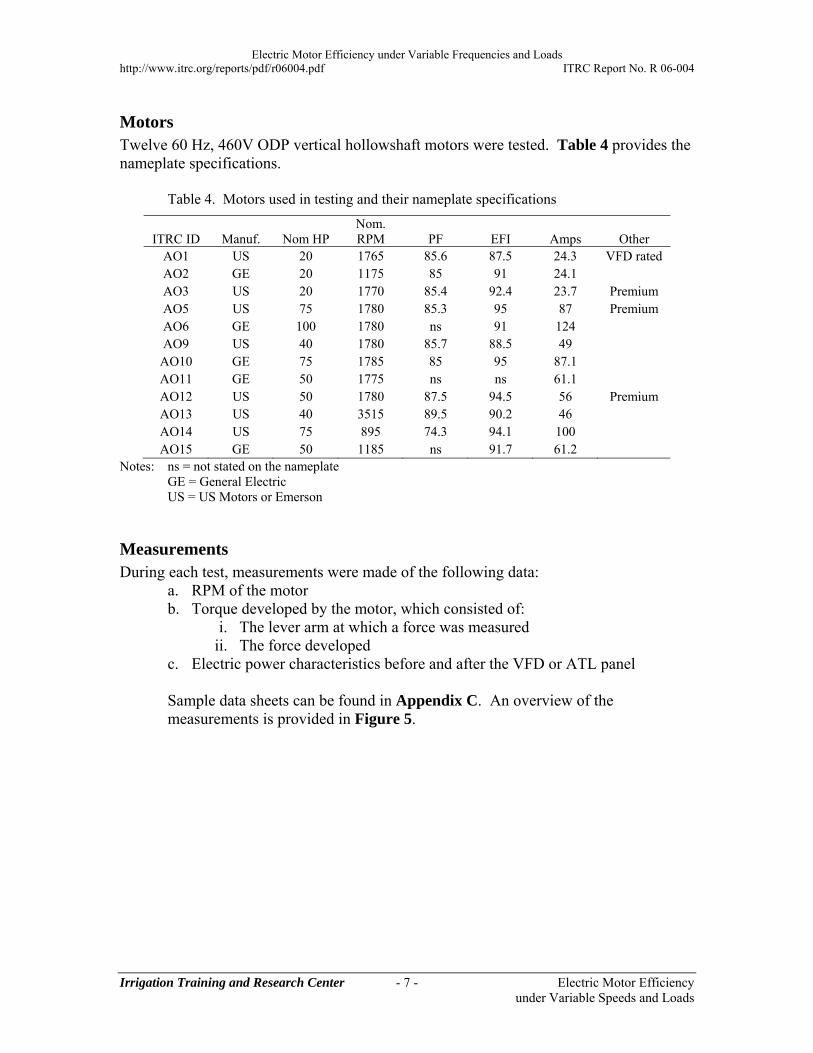
Motors Twelve 60 Hz, 460V ODP vertical hollowshaft motors were tested. Table 4 provides the nameplate specifications.
Table 4. Motors used in testing and their nameplate specifications
ITRC ID Manuf. Nom HP Nom. RPM PF EFI Amps Other
AO1 US 20 1765 85.6 87.5 24.3 VFD rated AO2 GE 20 1175 85 91 24.1 AO3 US 20 1770 85.4 92.4 23.7 Premium AO5 US 75 1780 85.3 95 87 Premium AO6 GE 100 1780 ns 91 124 AO9 US 40 1780 85.7 88.5 49 AO10 GE 75 1785 85 95 87.1 AO11 GE 50 1775 ns ns 61.1 AO12 US 50 1780 87.5 94.5 56 Premium AO13 US 40 3515 89.5 90.2 46 AO14 US 75 895 74.3 94.1 100 AO15 GE 50 1185 ns 91.7 61.2
Notes: ns = not stated on the nameplate GE = General Electric US = US Motors or Emerson
Measurements During each test, measurements were made of the following data:
a. RPM of the motor b. Torque developed by the motor, which consisted of:
i. The lever arm at which a force was measured ii. The force developed
c. Electric power characteristics before and after the VFD or ATL panel
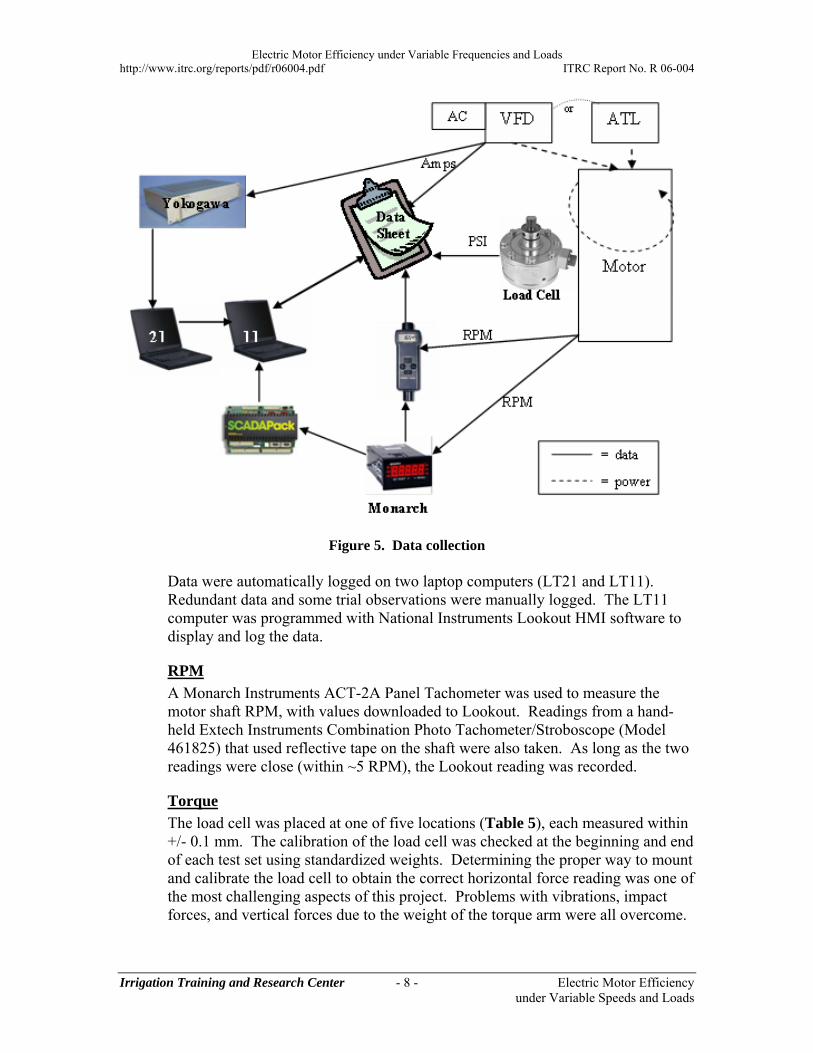
Sample data sheets can be found in Appendix C. An overview of the measurements is provided in Figure 5.
Electric Motor Efficiency under Variable Frequencies and Loads http://www.itrc.org/reports/pdf/r06004.pdf ITRC Report No. R 06-004
Irrigation Training and Research Center - 8 - Electric Motor Efficiency under Variable Speeds and Loads
Figure 5. Data collection
Data were automatically logged on two laptop computers (LT21 and LT11). Redundant data and some trial observations were manually logged. The LT11 computer was programmed with National Instruments Lookout HMI software to display and log the data.
RPM
A Monarch Instruments ACT-2A Panel Tachometer was used to measure the motor shaft RPM, with values downloaded to Lookout. Readings from a hand-held Extech Instruments Combination Photo Tachometer/Stroboscope (Model 461825) that used reflective tape on the shaft were also taken. As long as the two readings were close (within ~5 RPM), the Lookout reading was recorded.
Torque
The load cell was placed at one of five locations (Table 5), each measured within +/- 0.1 mm. The calibration of the load cell was checked at the beginning and end of each test set using standardized weights. Determining the proper way to mount and calibrate the load cell to obtain the correct horizontal force reading was one of the most challenging aspects of this project. Problems with vibrations, impact forces, and vertical forces due to the weight of the torque arm were all overcome.
Electric Motor Efficiency under Variable Frequencies and Loads http://www.itrc.org/reports/pdf/r06004.pdf ITRC Report No. R 06-004
Irrigation Training and Research Center - 9 - Electric Motor Efficiency under Variable Speeds and Loads
The torque was calculated as:
Ft-lb of torque = Distance × Force
The output Horsepower of the motor was then computed as:
Output Horsepower = (Ft-lb of torque) × (RPM/5,252)
Table 5. Load cell locations on pivot arm for measuring torque
Average Distances Between Points
Center to 1st Center to
2nd Center to
3rd Center to
4th Center to
5th
Feet 1.036 2.023 3.013 4.017 5.020
Mm 315.7 616.6 918.4 1224.3 1530.0
Electric Power Characteristics
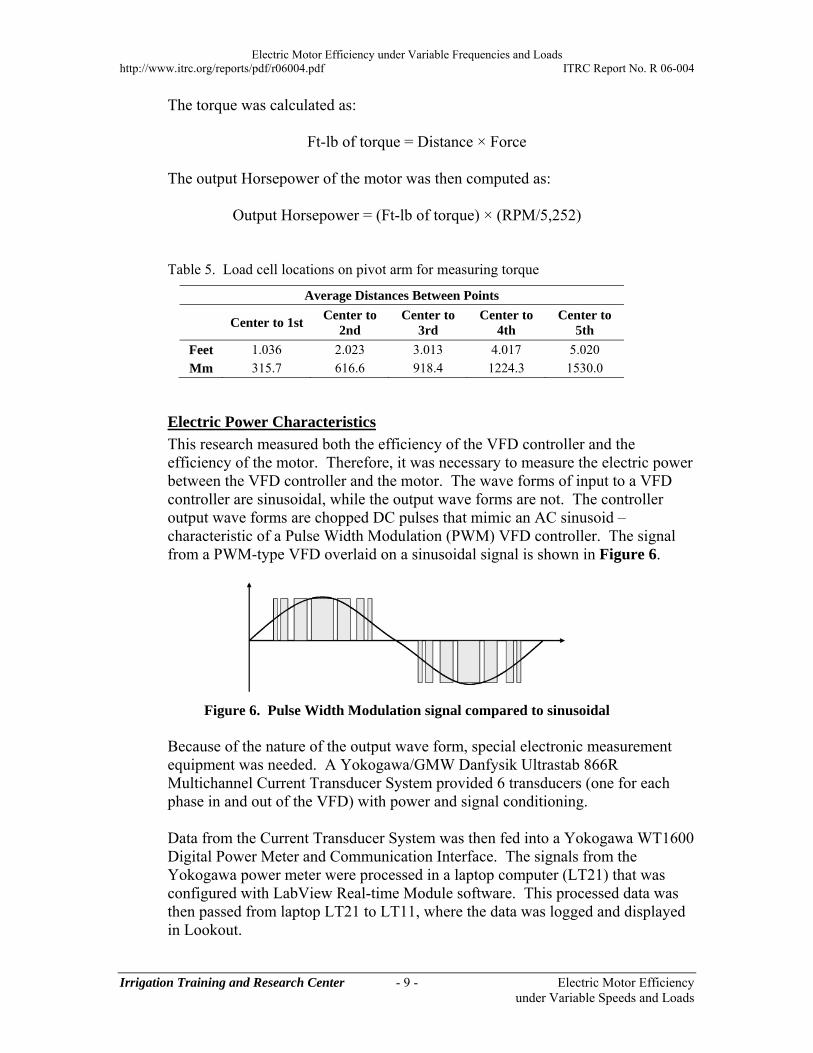
This research measured both the efficiency of the VFD controller and the efficiency of the motor. Therefore, it was necessary to measure the electric power between the VFD controller and the motor. The wave forms of input to a VFD controller are sinusoidal, while the output wave forms are not. The controller output wave forms are chopped DC pulses that mimic an AC sinusoid – characteristic of a Pulse Width Modulation (PWM) VFD controller. The signal from a PWM-type VFD overlaid on a sinusoidal signal is shown in Figure 6.
Figure 6. Pulse Width Modulation signal compared to sinusoidal Because of the nature of the output wave form, special electronic measurement equipment was needed. A Yokogawa/GMW Danfysik Ultrastab 866R Multichannel Current Transducer System provided 6 transducers (one for each phase in and out of the VFD) with power and signal conditioning.
Data from the Current Transducer System was then fed into a Yokogawa WT1600 Digital Power Meter and Communication Interface. The signals from the Yokogawa power meter were processed in a laptop computer (LT21) that was configured with LabView Real-time Module software. This processed data was then passed from laptop LT21 to LT11, where the data was logged and displayed in Lookout.
Electric Motor Efficiency under Variable Frequencies and Loads http://www.itrc.org/reports/pdf/r06004.pdf ITRC Report No. R 06-004
Irrigation Training and Research Center - 10 - Electric Motor Efficiency under Variable Speeds and Loads
The electric power data collected were: Amperage on each phase before and after the VFD Voltage on each phase before and after the VFD VFD frequency Active Power before and after the VFD Apparent Power before and after the VFD Power Factor
IEEE Standard 112-2004
The Institute of Electrical and Electronics Engineers (IEEE) developed IEEE Std 112-2004 for testing polyphase electric induction motors. Specifically, Efficiency Test Method B covers the type of procedure used in this research. Many portions of this test standard are used if one wants to separate the components (friction and windage, core, stator, and rotor) of motor losses. It also provides computational procedures for correction factors for stray-load, non-standard temperatures, and other factors. The procedures used in this research did not have a goal of identifying the component losses, and did not apply the IEEE Std 112-2004 corrections because they were judged to have an insignificant impact on the conclusions of this research project.
On-going Quality Control
On-going quality control of data was maintained by frequent calibration of the load cell, redundant measurements of the motor RPM, and the use of high quality electric power measurement equipment. Each motor was run continuously for a minimum of 12 hours immediately before any measurements were made. To further check for errors, the full set of tests was duplicated for each motor on the same day, after completion of the first set of tests.
Electric Motor Efficiency under Variable Frequencies and Loads http://www.itrc.org/reports/pdf/r06004.pdf ITRC Report No. R 06-004
Irrigation Training and Research Center - 11 - Electric Motor Efficiency under Variable Speeds and Loads
RESULTS
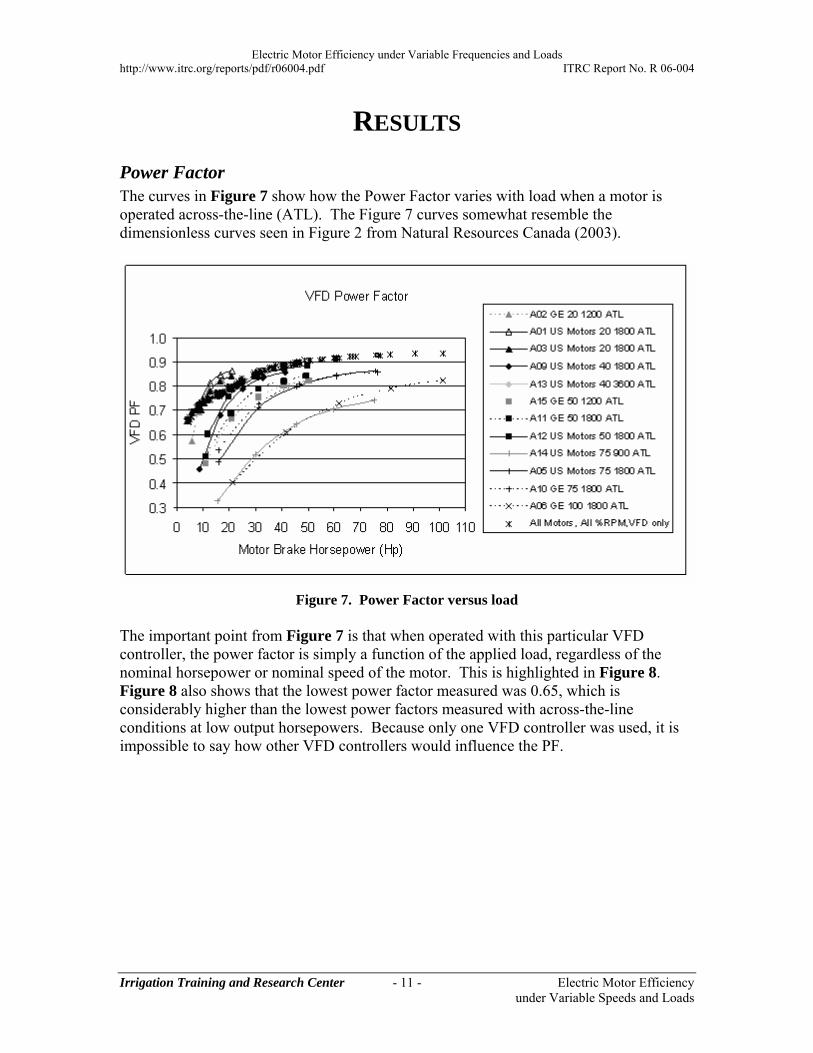
Power Factor The curves in Figure 7 show how the Power Factor varies with load when a motor is operated across-the-line (ATL). The Figure 7 curves somewhat resemble the dimensionless curves seen in Figure 2 from Natural Resources Canada (2003).
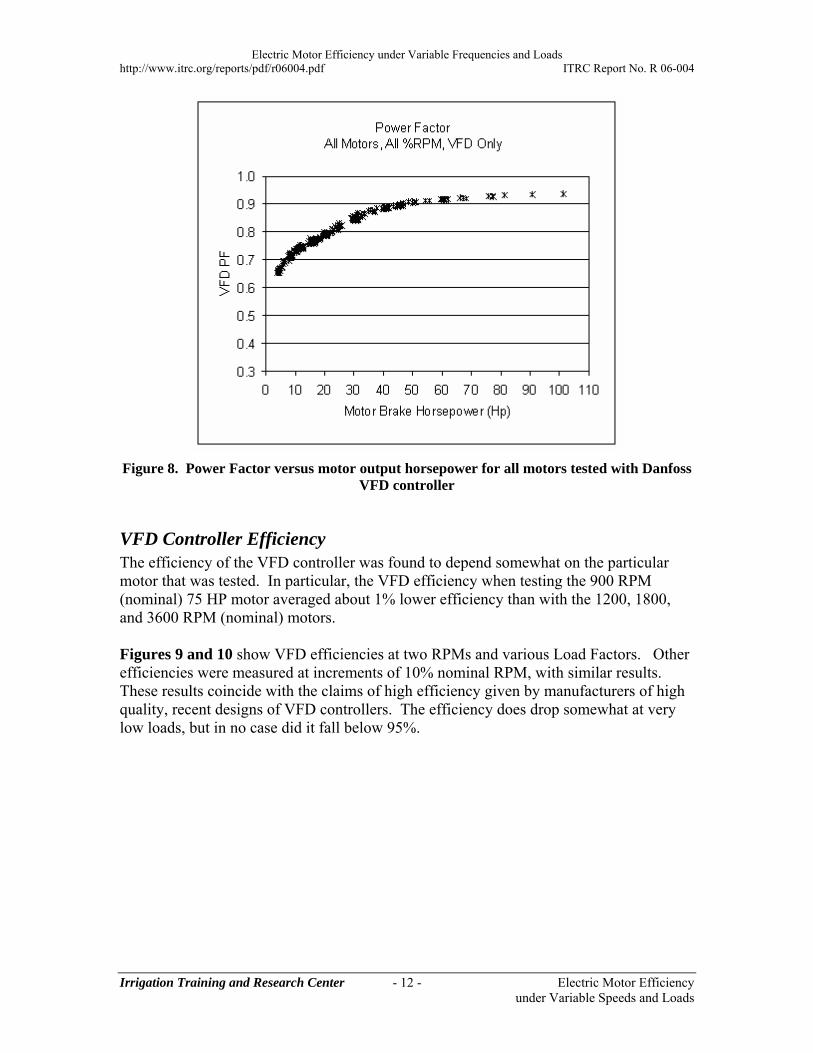
Figure 7. Power Factor versus load The important point from Figure 7 is that when operated with this particular VFD controller, the power factor is simply a function of the applied load, regardless of the nominal horsepower or nominal speed of the motor. This is highlighted in Figure 8. Figure 8 also shows that the lowest power factor measured was 0.65, which is considerably higher than the lowest power factors measured with across-the-line conditions at low output horsepowers. Because only one VFD controller was used, it is impossible to say how other VFD controllers would influence the PF.
Electric Motor Efficiency under Variable Frequencies and Loads http://www.itrc.org/reports/pdf/r06004.pdf ITRC Report No. R 06-004
Irrigation Training and Research Center - 12 - Electric Motor Efficiency under Variable Speeds and Loads
Figure 8. Power Factor versus motor output horsepower for all motors tested with Danfoss VFD controller
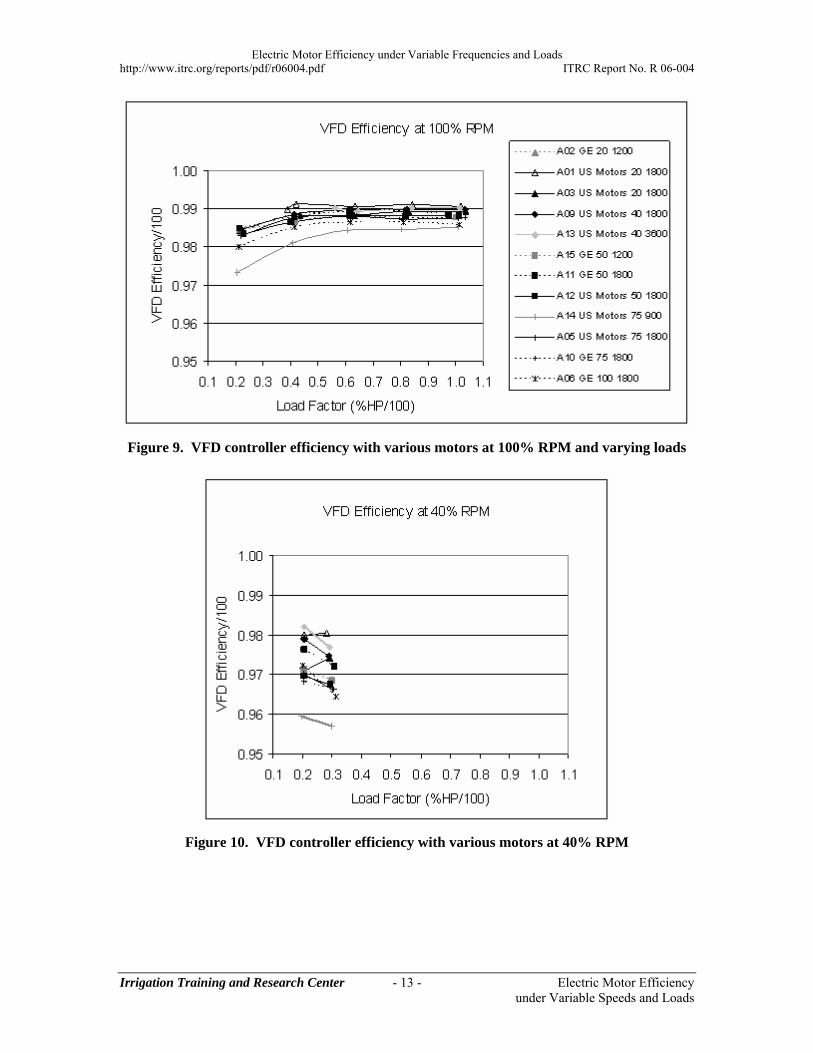
VFD Controller Efficiency The efficiency of the VFD controller was found to depend somewhat on the particular motor that was tested. In particular, the VFD efficiency when testing the 900 RPM (nominal) 75 HP motor averaged about 1% lower efficiency than with the 1200, 1800, and 3600 RPM (nominal) motors. Figures 9 and 10 show VFD efficiencies at two RPMs and various Load Factors. Other efficiencies were measured at increments of 10% nominal RPM, with similar results. These results coincide with the claims of high efficiency given by manufacturers of high quality, recent designs of VFD controllers. The efficiency does drop somewhat at very low loads, but in no case did it fall below 95%.
Electric Motor Efficiency under Variable Frequencies and Loads http://www.itrc.org/reports/pdf/r06004.pdf ITRC Report No. R 06-004
Irrigation Training and Research Center - 13 - Electric Motor Efficiency under Variable Speeds and Loads
Figure 9. VFD controller efficiency with various motors at 100% RPM and varying loads
Figure 10. VFD controller efficiency with various motors at 40% RPM
Electric Motor Efficiency under Variable Frequencies and Loads http://www.itrc.org/reports/pdf/r06004.pdf ITRC Report No. R 06-004
Irrigation Training and Research Center - 14 - Electric Motor Efficiency under Variable Speeds and Loads
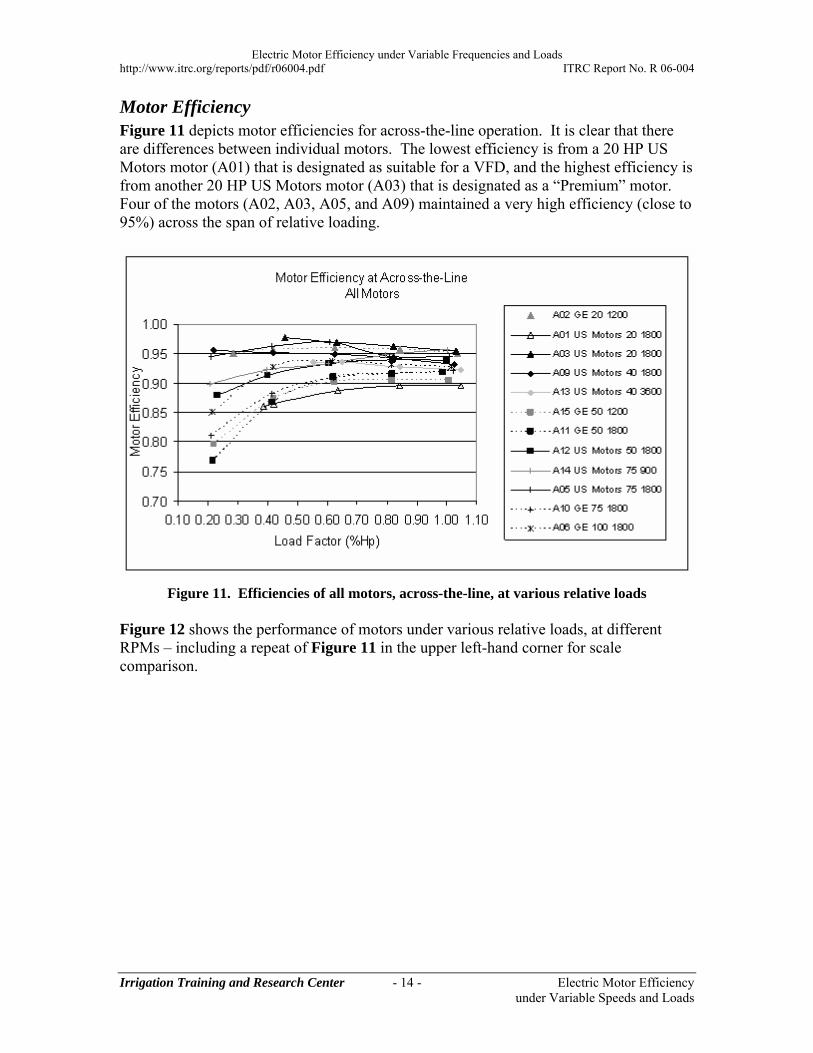
Motor Efficiency Figure 11 depicts motor efficiencies for across-the-line operation. It is clear that there are differences between individual motors. The lowest efficiency is from a 20 HP US Motors motor (A01) that is designated as suitable for a VFD, and the highest efficiency is from another 20 HP US Motors motor (A03) that is designated as a “Premium” motor. Four of the motors (A02, A03, A05, and A09) maintained a very high efficiency (close to 95%) across the span of relative loading.
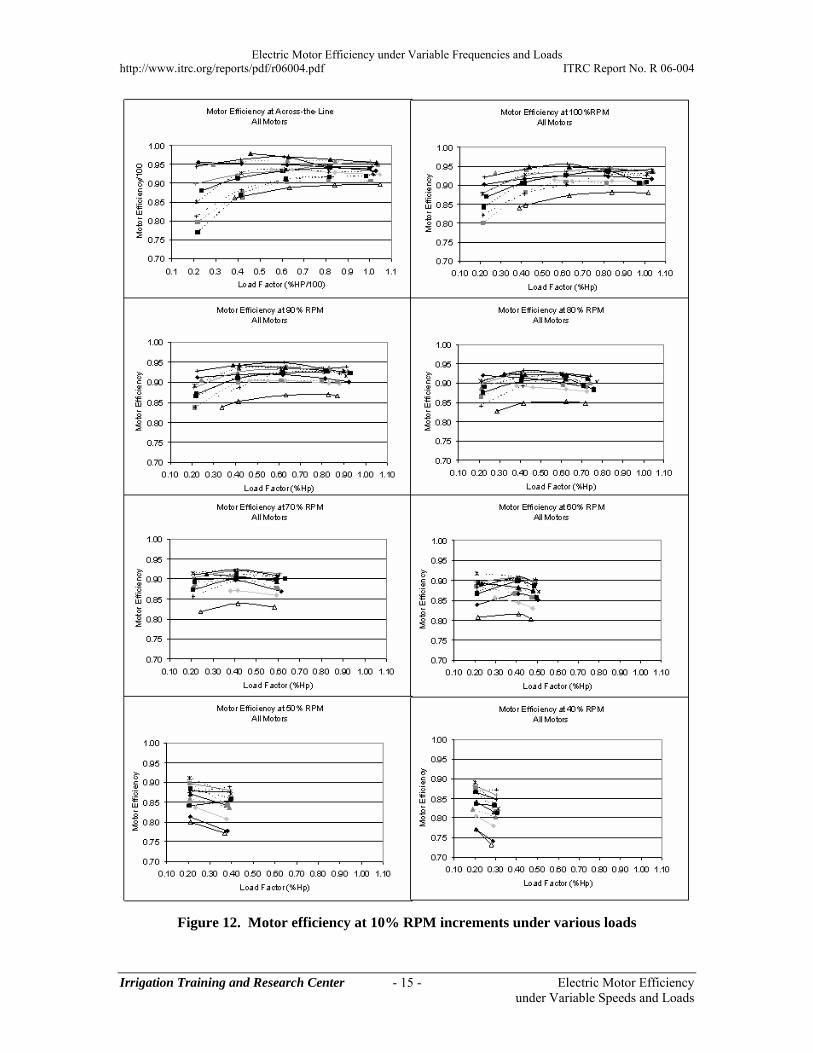
Figure 11. Efficiencies of all motors, across-the-line, at various relative loads Figure 12 shows the performance of motors under various relative loads, at different RPMs – including a repeat of Figure 11 in the upper left-hand corner for scale comparison.
Electric Motor Efficiency under Variable Frequencies and Loads http://www.itrc.org/reports/pdf/r06004.pdf ITRC Report No. R 06-004
Irrigation Training and Research Center - 15 - Electric Motor Efficiency under Variable Speeds and Loads
Figure 12. Motor efficiency at 10% RPM increments under various loads
Electric Motor Efficiency under Variable Frequencies and Loads http://www.itrc.org/reports/pdf/r06004.pdf ITRC Report No. R 06-004
Irrigation Training and Research Center - 16 - Electric Motor Efficiency under Variable Speeds and Loads
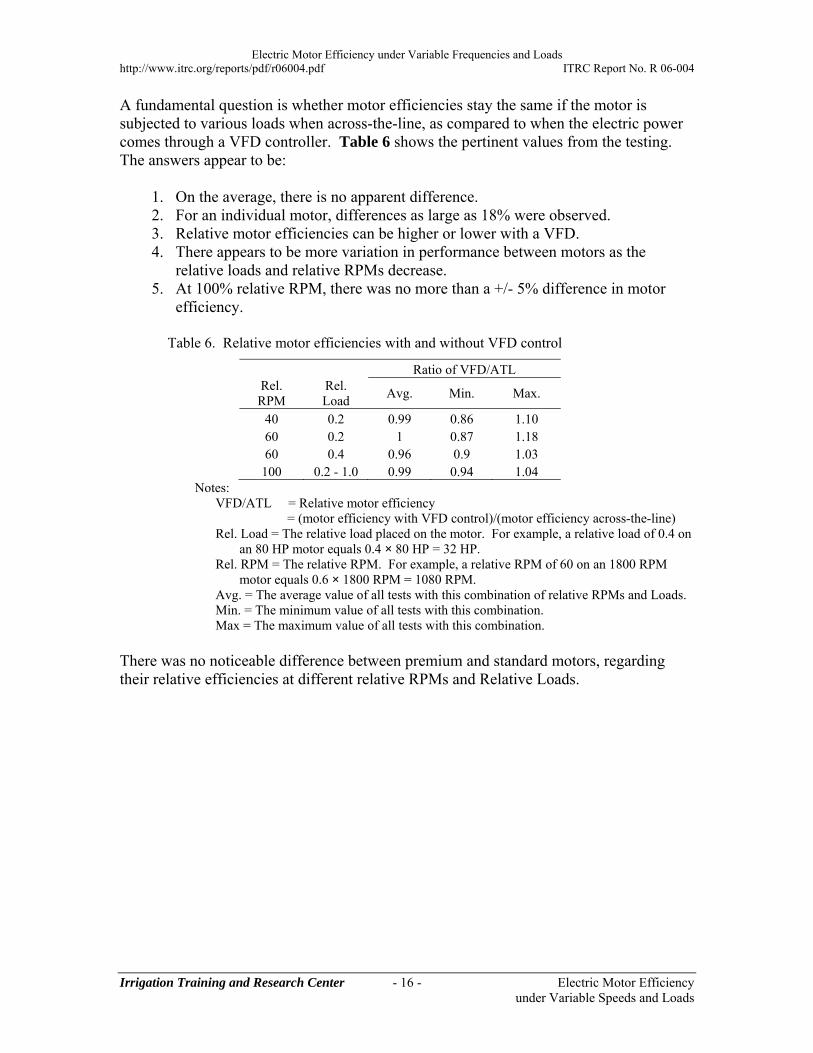
A fundamental question is whether motor efficiencies stay the same if the motor is subjected to various loads when across-the-line, as compared to when the electric power comes through a VFD controller. Table 6 shows the pertinent values from the testing. The answers appear to be:
1. On the average, there is no apparent difference. 2. For an individual motor, differences as large as 18% were observed. 3. Relative motor efficiencies can be higher or lower with a VFD. 4. There appears to be more variation in performance between motors as the
relative loads and relative RPMs decrease. 5. At 100% relative RPM, there was no more than a +/- 5% difference in motor
efficiency.
Table 6. Relative motor efficiencies with and without VFD control
Ratio of VFD/ATL Rel. RPM
Rel. Load
Avg. Min. Max.
40 0.2 0.99 0.86 1.10 60 0.2 1 0.87 1.18 60 0.4 0.96 0.9 1.03
100 0.2 - 1.0 0.99 0.94 1.04 Notes:
VFD/ATL = Relative motor efficiency = (motor efficiency with VFD control)/(motor efficiency across-the-line)
Rel. Load = The relative load placed on the motor. For example, a relative load of 0.4 on an 80 HP motor equals 0.4 × 80 HP = 32 HP.
Rel. RPM = The relative RPM. For example, a relative RPM of 60 on an 1800 RPM motor equals 0.6 × 1800 RPM = 1080 RPM.
Avg. = The average value of all tests with this combination of relative RPMs and Loads. Min. = The minimum value of all tests with this combination. Max = The maximum value of all tests with this combination.
There was no noticeable difference between premium and standard motors, regarding their relative efficiencies at different relative RPMs and Relative Loads.
Electric Motor Efficiency under Variable Frequencies and Loads http://www.itrc.org/reports/pdf/r06004.pdf ITRC Report No. R 06-004
Irrigation Training and Research Center - 17 - Electric Motor Efficiency under Variable Speeds and Loads
Air Conditioning Power Requirement Variable frequency drive controllers generate heat through their inefficiencies. Although the inefficiency may be small, 3-5% - 3% of a 100 HP unit represents 3 HP of heat that must be dissipated. Air conditioning (AC) units – either directly mounted to the VFD panel, or constructed to cool the entire motor control center building – are standard practice for irrigation applications. None of the extensive literature that was examined regarding VFD efficiency made any mention of the additional power required for air conditioning. This research project did not examine the details of AC power requirements. Depending upon the heat released, ambient temperature, and AC design, the power requirement will vary. The authors suggest that if the VFD controller is 97% efficient, the additional power requirement for the AC unit can be estimated as: (100% - 97%) × 2 × Input HP For example, for a Full Load input of 110 HP to a VFD controller that operates at 97% efficiency, the additional power requirement at Full Load would be:
Additional Power = 3% × 2 × 110 HP = 6.6 HP
Electric Motor Efficiency under Variable Frequencies and Loads http://www.itrc.org/reports/pdf/r06004.pdf ITRC Report No. R 06-004
Irrigation Training and Research Center - 18 - Electric Motor Efficiency under Variable Speeds and Loads
CONCLUSIONS
The results of this research lead to the following conclusions that appear to be either unknown or little advertised:
1. Commercially available variable frequency drive (VFD) controllers are available that provide significant improvement of the Power Factor of motors, when compared to across-the-line applications.
2. The efficiency of a VFD controller appears to be slightly impacted by the motor that it is controlling.
3. The following can be stated for the average condition when a motor is subjected to varying loads: The efficiencies of a motor that is operated by a VFD controller will be about the same as the efficiency of a motor that is operated across the line. However, some motors operate with either a higher or lower relative efficiency while being controlled by a VFD controller instead of operating across-the-line.
4. The additional power requirement of an air conditioner for the VFD controller must be considered when determining the total power requirement for the unit and the initial and annual costs.
The data from this research confirm the following frequently noted points:
1. Commercially available VFD controllers maintain high efficiencies across practical ranges of loads and frequencies.
2. Efficiency computations for induction motors that operate under varying loads must consider the significant change in motor efficiency that can occur as the load changes. In particular, motor efficiencies can drop by about 10% as the relative load drops from 60% to 20%. The changes in motor efficiencies as the relative load varies from 100% to 60% are relatively minor.
3. When working above relative loads of 40%, the inherent efficiency of the motor itself is more important than the variation in efficiency due to changing loads.
In summary, on the average, the relative efficiency of the electrical system with a VFD may be about 8% lower than the relative efficiency of a properly designed, full-load across-the-line system. This 8% value assumes:
- No change in motor efficiency - A 3% loss in efficiency through the VFD controller - A parallel 5% additional power requirement for the air conditioner
The 8% is a number that has not historically been available. At first glance, it appears that VFD-controlled applications may not be economical if there is a drop of 8% efficiency. However, the 8% is only part of the story. The 8% assumes that the across-the-line system was truly properly designed. A system with a VFD can adjust for errors,

Electric Motor Efficiency under Variable Frequencies and Loads http://www.itrc.org/reports/pdf/r06004.pdf ITRC Report No. R 06-004
Irrigation Training and Research Center - 19 - Electric Motor Efficiency under Variable Speeds and Loads
but an across-the-line system cannot adjust for errors in estimations of total head or flow rate requirements.
Furthermore, the electric system efficiency is only one part of the overall electric pumping system. To determine the relative efficiency of an overall electric pumping system, one must also account for the changing pump efficiency over time and at different operating points, and the ability of a VFD-controlled system to reduce the total pressure or flow requirement when needed. This research project did not examine those benefits, although they have been well documented by ITRC and others. In addition, for many irrigation pumping applications the improved control of pressures or flows is the dominant benefit rather than power savings.
Electric Motor Efficiency under Variable Frequencies and Loads http://www.itrc.org/reports/pdf/r06004.pdf ITRC Report No. R 06-004
Irrigation Training and Research Center - 20 - Electric Motor Efficiency under Variable Speeds and Loads
REFERENCES
Burt, C.M. and X. Piao. 2002. “Advances in PLC-Based Canal Automation.” Proceedings of the United States Committee on Irrigation and Drainage Conference on Energy, Climate Environment and Water — Issues and Opportunities for Irrigation and Drainage. Held in San Luis Obispo, CA. July 9-12. pp. 409-422. Burt, C.M., D.J. Howes, and G. Wilson. 2003. California Agricultural Water Electrical Energy Requirements. ITRC Report No. R 03-006. Prepared for the Public Interest Electric Research program of the California Energy Commission. Irrigation Training and Research Center. California Polytechnic State University. San Luis Obispo, CA. 154 pages. <http://www.itrc.org/reports/energyreq/energyreq.pdf> DOE. Department of Energy. 2005. MotorMaster+ (Version 4) software. <http://www1.eere.energy.gov/industry/bestpractices/software.html#mm> Douglass, J. 2005 (updated). Induction Motor Efficiency Standards. Washington State University Extension Energy Program. WSUEEP02_029. 8 pg. Goulds. 2003. Turbine Pump Selection, Version 7.1. Developed for Goulds Pump Turbine (ITT Industries) by Engineered Software, Inc. Lacey, WA 98503-5941 IAC. 2006. Electric Motor Systems. Industrial Assessment Center. Center for Energy Efficiency and Renewable Energy. Univ. of Mass., Amherst. <http://www.ceere.org/iac/assessment%20tool/ARC2410.html#efftable> ITRC. 2002. Variable Frequency Drives and SCADA – Are They Worthwhile Investments? ITRC Report No. R 02-006. Irrigation Training and Research Center. California Polytechnic State University. San Luis Obispo, CA. 10 pages. <http://www.itrc.org/reports/vfd/vfdandscada.pdf> Motor Decisions Matter. 2003. “Efficiency Values Used to Estimate Annual Energy Savings” (Spreadsheet). 1-2-3 Approach to Motor Management. <www.motorsmatter.org> Nailan, R.L. 2002. “Just How Important is Drive Motor Efficiency?” Electrical Apparatus. Barker Publications, Inc. Chicago, IL. March issue. Natural Resources Canada. 2003. Technical Fact Sheet – Premium-Efficiency Motors. Cat. No. M144-21/2003E; ISBN 0-662-35668-3. Office of Energy Efficiency. Energy Innovators Initiative. Ottawa, ON. Canada. Rishel, J.B. 2003. “How to Calculate Motor Efficiency for Variable Speed Centrifugal Pumps.” Engineered Systems. August issue.
Electric Motor Efficiency under Variable Frequencies and Loads http://www.itrc.org/reports/pdf/r06004.pdf ITRC Report No. R 06-004
Irrigation Training and Research Center - 21 - Electric Motor Efficiency under Variable Speeds and Loads
Rooks, J.A. and A.K. Wallace. 2003. “Energy Efficiency of Variable Speed Drive Systems.” Pulp and Paper Industry Technical Conference, Conference Record of the 2003 Annual. 16-20 June. Pg. 160-163. Wallace, A.K., J. A. Rooks, and J. R. Holmquist. 2002. “Comparison Testing of IEEE Standard 841 Motors.” IEEE Transaction on Industry Applications. 38(3):763-768. Wallbom-Carlson, A. 1998. “Energy Comparison. VFD vs. On-Off Controlled Pumping Stations.” Scientific Impeller. ITT Flygt AB, Sweden. Pg. 29-32.

Electric Motor Efficiency under Variable Frequencies and Loads http://www.itrc.org/reports/pdf/r06004.pdf ITRC Report No. R 06-004
Irrigation Training and Research Center Electric Motor Efficiency under Variable Speeds and Loads
APPENDIX A Motor Operating and Testing Procedure
Electric Motor Efficiency under Variable Frequencies and Loads http://www.itrc.org/reports/pdf/r06004.pdf ITRC Report No. R 06-004
Irrigation Training and Research Center A-1 Electric Motor Efficiency under Variable Speeds and Loads
Appendix A: Motor Operating and Testing Procedure
1.0. Water Flow
1.1. Valve Position
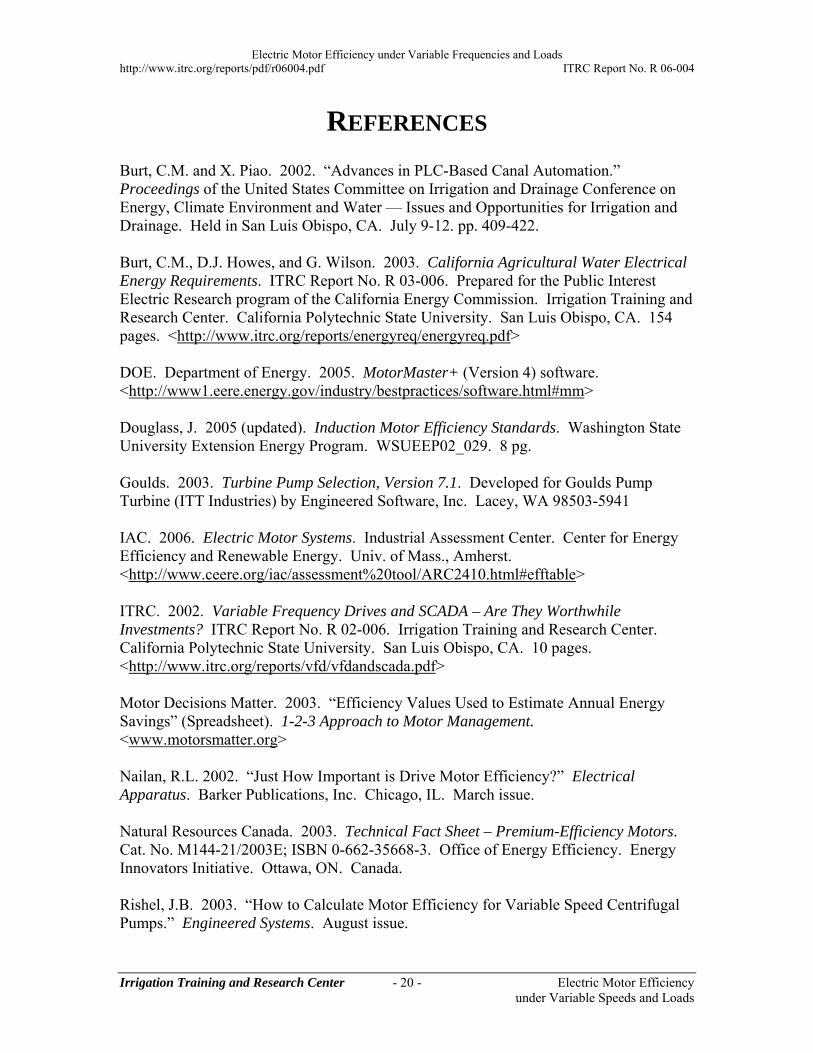
1.1.1. Find valve shown in inset of Figure A-1, below.
Figure A-1. Water source location
1.1.2. Turn valve counterclockwise (open).
1.2. Filter Operation
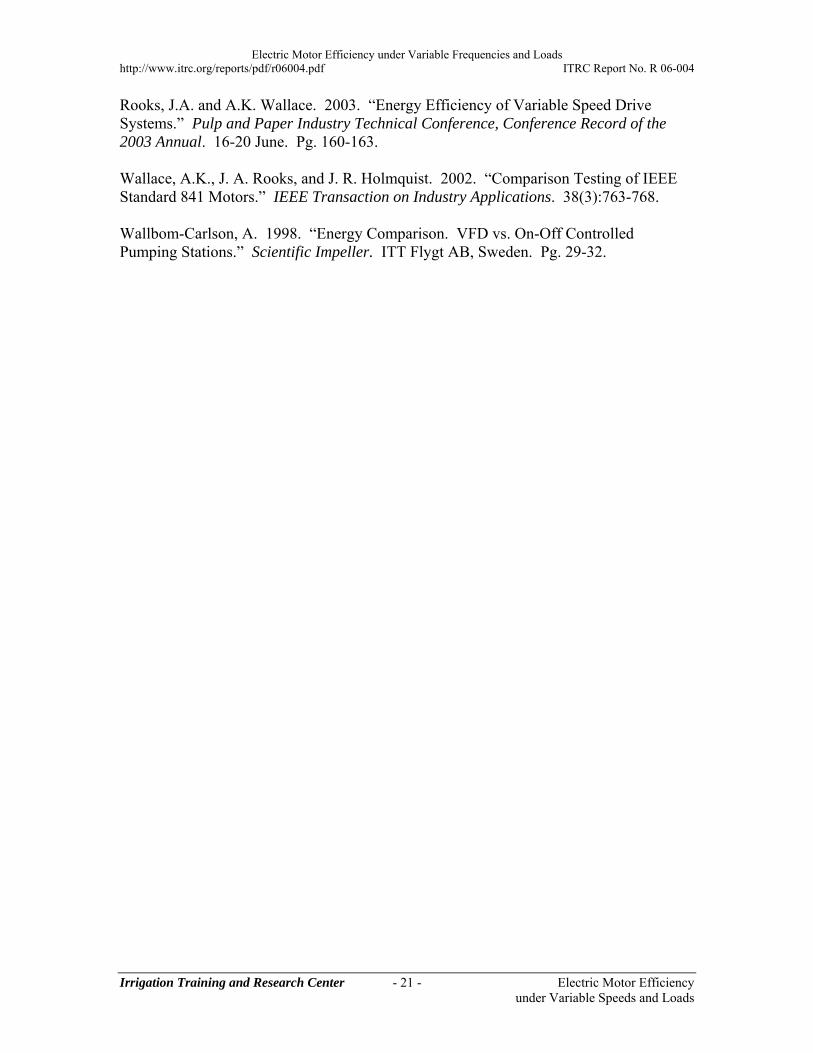
1.2.1. Check that the pressure of the media filter discharge is about ≈15 psi or greater (see Figure A-2, inset).
1.2.2. The backflush controller should be “on”.
1.2.3. The pressure differential switch should be set to 3 psi.
1.2.4. The elapsed time switch should be set to 4 hours.
1.2.5. The pressure differential gauge (located inside the filter control box, behind the panel) should read less than 3 psi; otherwise, the filter should be backflushed.
media filters
Electric Motor Efficiency under Variable Frequencies and Loads http://www.itrc.org/reports/pdf/r06004.pdf ITRC Report No. R 06-004
Irrigation Training and Research Center A-2 Electric Motor Efficiency under Variable Speeds and Loads
Figure A-2. Media filter with pressure gauge behind the solar panel
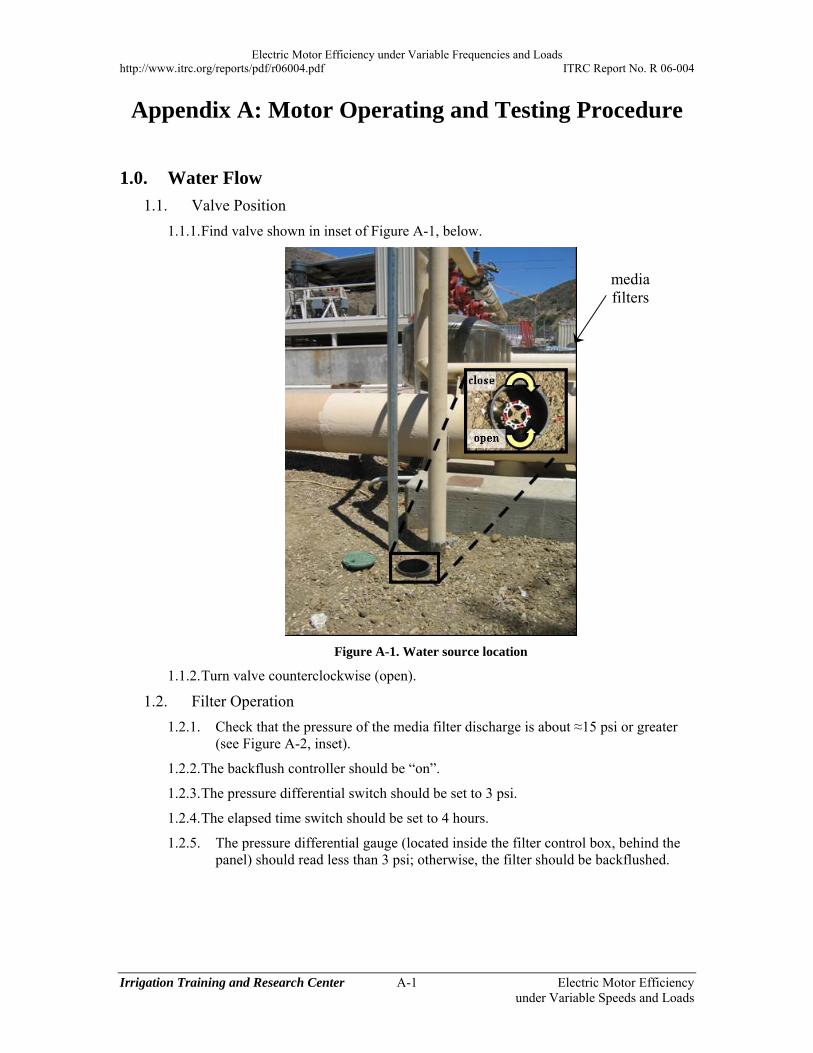
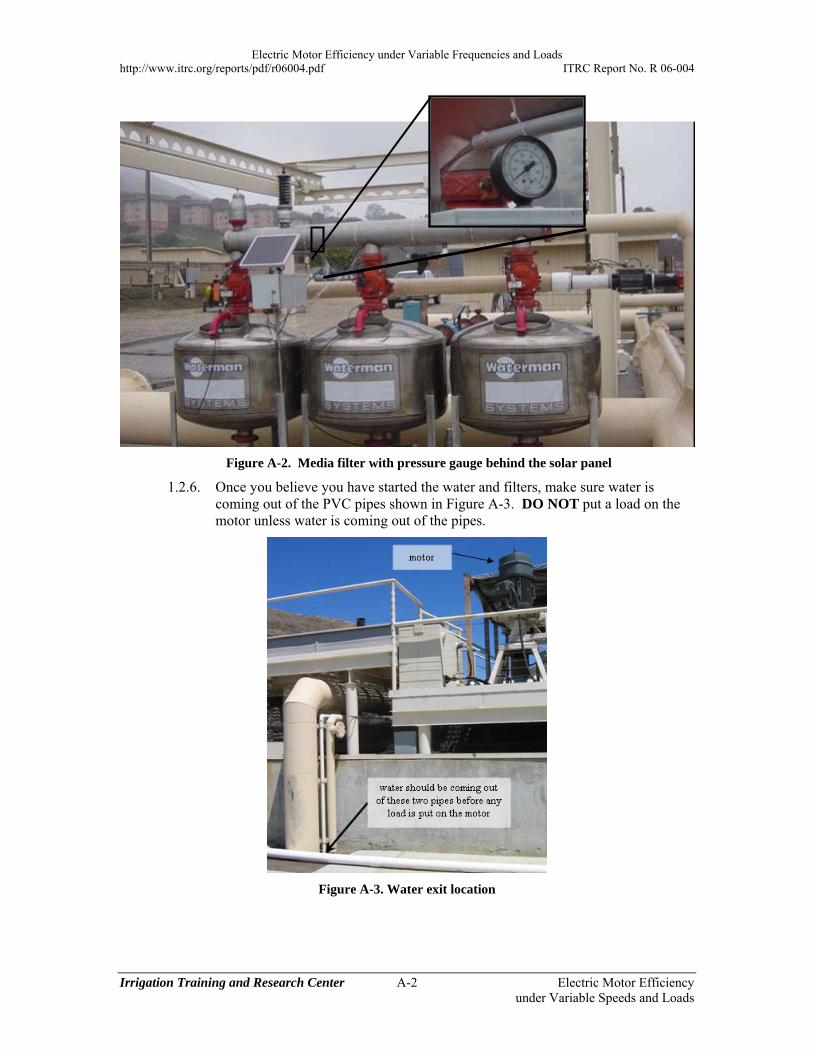
1.2.6. Once you believe you have started the water and filters, make sure water is coming out of the PVC pipes shown in Figure A-3. DO NOT put a load on the motor unless water is coming out of the pipes.
Figure A-3. Water exit location
Electric Motor Efficiency under Variable Frequencies and Loads http://www.itrc.org/reports/pdf/r06004.pdf ITRC Report No. R 06-004
Irrigation Training and Research Center A-3 Electric Motor Efficiency under Variable Speeds and Loads
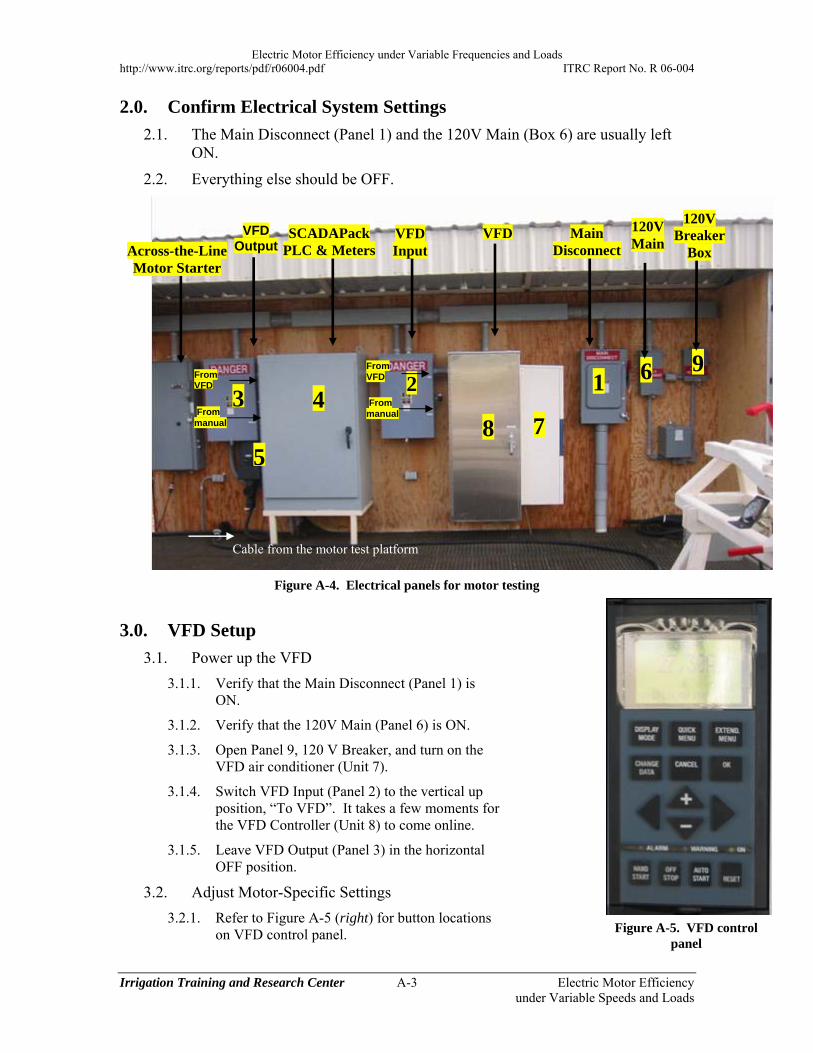
2.0. Confirm Electrical System Settings
2.1. The Main Disconnect (Panel 1) and the 120V Main (Box 6) are usually left ON.
2.2. Everything else should be OFF.
Figure A-4. Electrical panels for motor testing
3.0. VFD Setup
3.1. Power up the VFD
3.1.1. Verify that the Main Disconnect (Panel 1) is ON.
3.1.2. Verify that the 120V Main (Panel 6) is ON.
3.1.3. Open Panel 9, 120 V Breaker, and turn on the VFD air conditioner (Unit 7).
3.1.4. Switch VFD Input (Panel 2) to the vertical up position, “To VFD”. It takes a few moments for the VFD Controller (Unit 8) to come online.
3.1.5. Leave VFD Output (Panel 3) in the horizontal OFF position.
3.2. Adjust Motor-Specific Settings
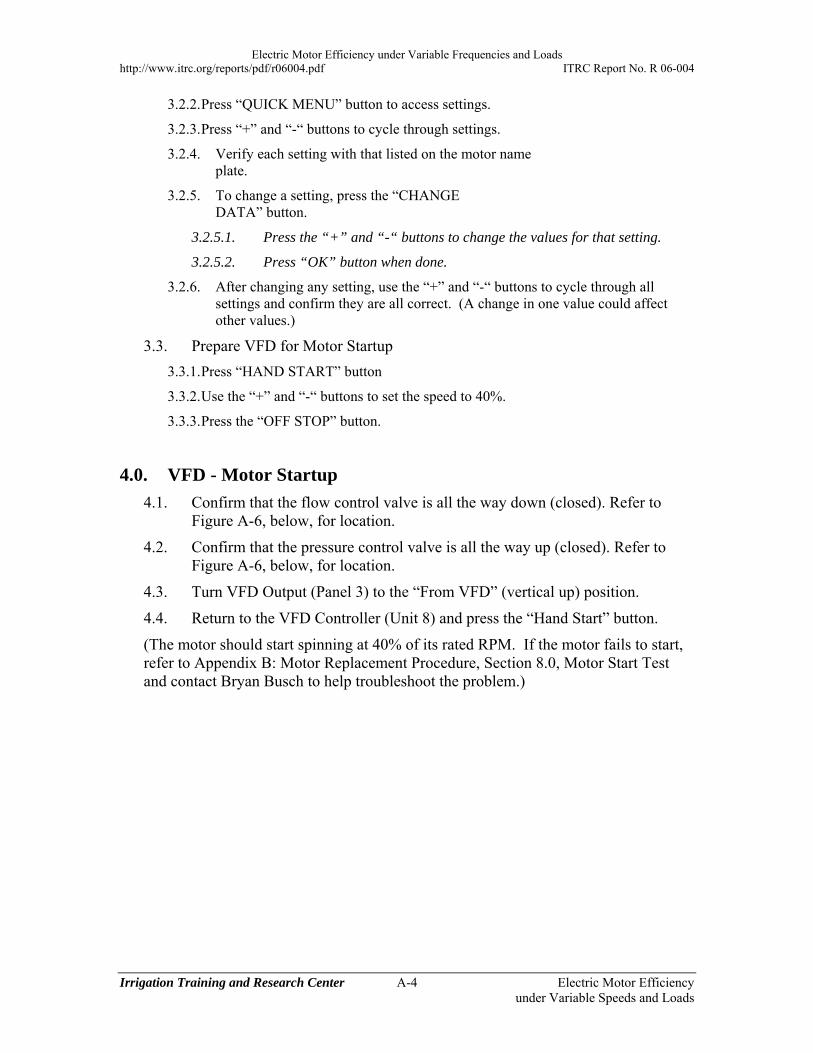
3.2.1. Refer to Figure A-5 (right) for button locations on VFD control panel.
VFDVFD Input
VFD Output
SCADAPack PLC & Meters
Main Disconnect
1
Across-the-Line Motor Starter
6
120V Main
From VFD
Cable from the motor test platform
23 4
8 7 From manual
5
From VFD
From manual
9
120V Breaker
Box
Figure A-5. VFD control panel
Electric Motor Efficiency under Variable Frequencies and Loads http://www.itrc.org/reports/pdf/r06004.pdf ITRC Report No. R 06-004
Irrigation Training and Research Center A-4 Electric Motor Efficiency under Variable Speeds and Loads
3.2.2. Press “QUICK MENU” button to access settings.
3.2.3. Press “+” and “-“ buttons to cycle through settings.
3.2.4. Verify each setting with that listed on the motor name plate.
3.2.5. To change a setting, press the “CHANGE DATA” button.
3.2.5.1. Press the “+” and “-“ buttons to change the values for that setting.
3.2.5.2. Press “OK” button when done.
3.2.6. After changing any setting, use the “+” and “-“ buttons to cycle through all settings and confirm they are all correct. (A change in one value could affect other values.)
3.3. Prepare VFD for Motor Startup
3.3.1. Press “HAND START” button
3.3.2. Use the “+” and “-“ buttons to set the speed to 40%.
3.3.3. Press the “OFF STOP” button.
4.0. VFD - Motor Startup
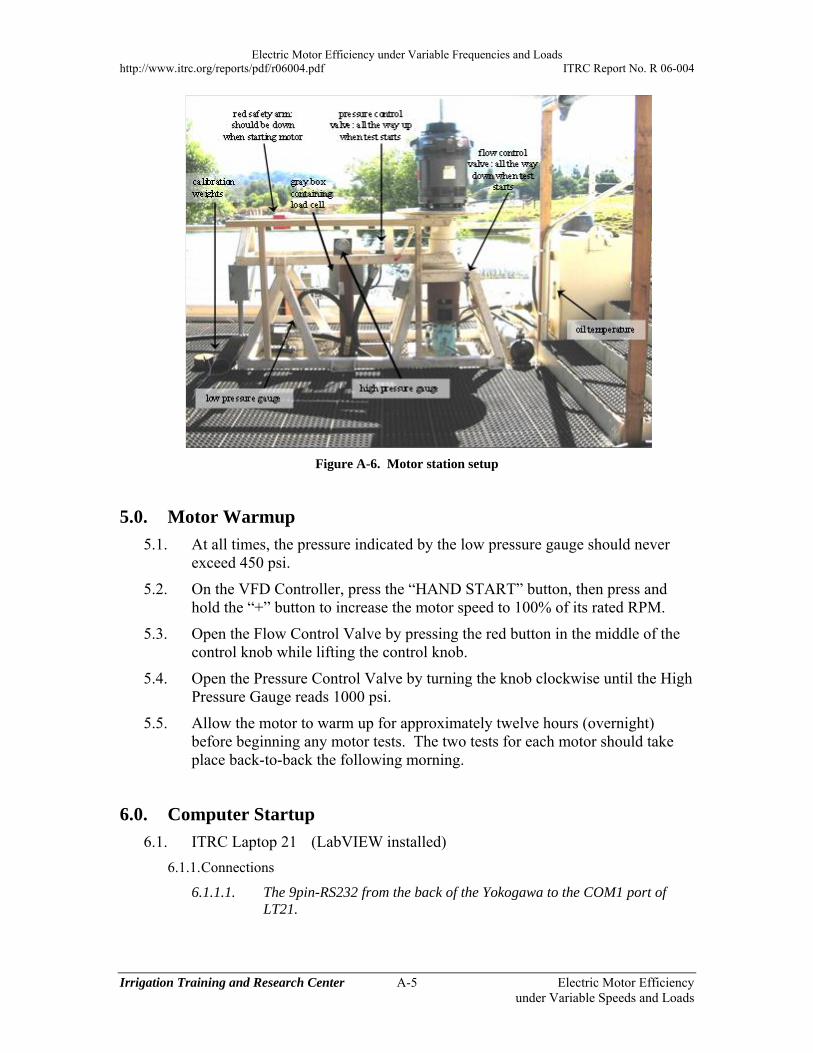
4.1. Confirm that the flow control valve is all the way down (closed). Refer to Figure A-6, below, for location.
4.2. Confirm that the pressure control valve is all the way up (closed). Refer to Figure A-6, below, for location.
4.3. Turn VFD Output (Panel 3) to the “From VFD” (vertical up) position.
4.4. Return to the VFD Controller (Unit 8) and press the “Hand Start” button.
(The motor should start spinning at 40% of its rated RPM. If the motor fails to start, refer to Appendix B: Motor Replacement Procedure, Section 8.0, Motor Start Test and contact Bryan Busch to help troubleshoot the problem.)
Electric Motor Efficiency under Variable Frequencies and Loads http://www.itrc.org/reports/pdf/r06004.pdf ITRC Report No. R 06-004
Irrigation Training and Research Center A-5 Electric Motor Efficiency under Variable Speeds and Loads
Figure A-6. Motor station setup
5.0. Motor Warmup
5.1. At all times, the pressure indicated by the low pressure gauge should never exceed 450 psi.
5.2. On the VFD Controller, press the “HAND START” button, then press and hold the “+” button to increase the motor speed to 100% of its rated RPM.
5.3. Open the Flow Control Valve by pressing the red button in the middle of the control knob while lifting the control knob.
5.4. Open the Pressure Control Valve by turning the knob clockwise until the High Pressure Gauge reads 1000 psi.
5.5. Allow the motor to warm up for approximately twelve hours (overnight) before beginning any motor tests. The two tests for each motor should take place back-to-back the following morning.
6.0. Computer Startup
6.1. ITRC Laptop 21 (LabVIEW installed)
6.1.1. Connections
6.1.1.1. The 9pin-RS232 from the back of the Yokogawa to the COM1 port of LT21.
Electric Motor Efficiency under Variable Frequencies and Loads http://www.itrc.org/reports/pdf/r06004.pdf ITRC Report No. R 06-004
Irrigation Training and Research Center A-6 Electric Motor Efficiency under Variable Speeds and Loads
6.1.1.2. The USB cable (blue) from SCADAPack COM1 Port connects to the lower USB port at the back of LT21.
6.1.2. User name = “xpiao”; Password = “itrc”.
6.1.3. Verify network connections
6.1.3.1. Go to Start > Programs > National Instruments > NI-Serial > Troubleshooting Wizard (or double click the desktop shortcut labeled “Troubleshooting Wizard”).
6.1.3.2. The test will start automatically, and upon completion a text box will appear stating that the test is completed. Press “OK”.
6.1.3.3. If the test is unsuccessful unplug the USB cable from the back of the computer and plug it back in again. Press “Reset” in the Troubleshooting Wizard box to run the test again.
6.1.4. Run Yokogawa WT1600 Driver
6.1.4.1. Go to Start > Programs >National Instruments > LabVIEW 7.1 > LabVIEW (or double click the desktop shortcut labeled “LabVIEW”).
6.1.4.2. It will take about 1-2 minutes to start up and begin running. At this point, the “Active and Apparent Powers” 1 through 6 and the Voltage and Amps 1 through 6 should update automatically.
6.1.4.3. At the top of the screen are stop and start buttons, represented by a right arrow and red circle, respectively. These can be used to run or stop the driver if needed.
6.2. ITRC Laptop 11 (Lookout installed)
6.2.1. Connections
6.2.1.1. The USB plug (gray) from the SCADAPack COM2 Port to on the lower USB port at the back of LT11.
6.2.2. User name = “itrc”; Password = “itrc”
6.2.3. Lookout should start automatically after booting up the computer. If not, go to Start > Programs > National Instruments > Lookout 5.0. The overview screen will appear.
Data displayed on this overview screen is a running average over the previous minute. Therefore it is recommended to wait two (2) minutes after making a change to the system before recording results.
6.3. If using other computers, view Software Installation, Section 19.0, at the end of this manual.
7.0. Load Cell Calibration
7.1. Load Cell Setup
7.1.1. Secure the load cell to the bottom of the support arm.
7.1.2. Plug the data transfer cable into the load cell.
Electric Motor Efficiency under Variable Frequencies and Loads http://www.itrc.org/reports/pdf/r06004.pdf ITRC Report No. R 06-004
Irrigation Training and Research Center A-7 Electric Motor Efficiency under Variable Speeds and Loads
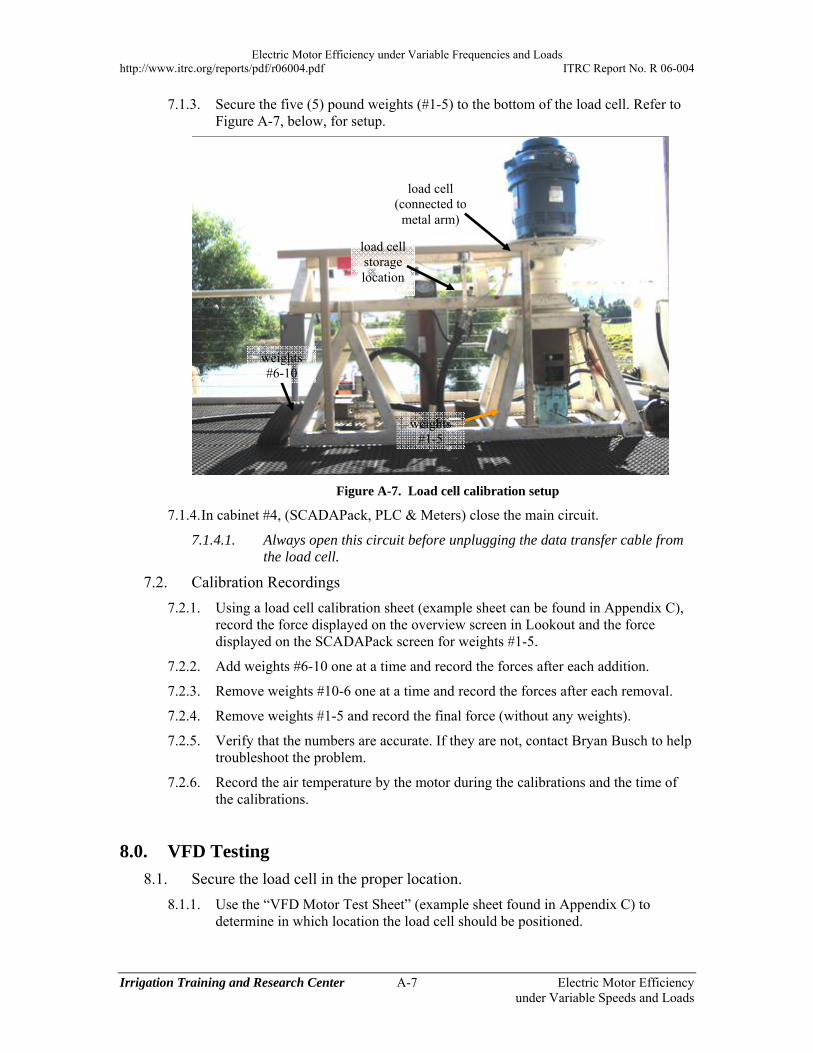
7.1.3. Secure the five (5) pound weights (#1-5) to the bottom of the load cell. Refer to Figure A-7, below, for setup.
Figure A-7. Load cell calibration setup
7.1.4. In cabinet #4, (SCADAPack, PLC & Meters) close the main circuit.
7.1.4.1. Always open this circuit before unplugging the data transfer cable from the load cell.
7.2. Calibration Recordings
7.2.1. Using a load cell calibration sheet (example sheet can be found in Appendix C), record the force displayed on the overview screen in Lookout and the force displayed on the SCADAPack screen for weights #1-5.
7.2.2. Add weights #6-10 one at a time and record the forces after each addition.
7.2.3. Remove weights #10-6 one at a time and record the forces after each removal.
7.2.4. Remove weights #1-5 and record the final force (without any weights).
7.2.5. Verify that the numbers are accurate. If they are not, contact Bryan Busch to help troubleshoot the problem.
7.2.6. Record the air temperature by the motor during the calibrations and the time of the calibrations.
8.0. VFD Testing
8.1. Secure the load cell in the proper location.
8.1.1. Use the “VFD Motor Test Sheet” (example sheet found in Appendix C) to determine in which location the load cell should be positioned.
load cell storage location
weights #6-10
weights #1-5
load cell (connected to
metal arm)
Electric Motor Efficiency under Variable Frequencies and Loads http://www.itrc.org/reports/pdf/r06004.pdf ITRC Report No. R 06-004
Irrigation Training and Research Center A-8 Electric Motor Efficiency under Variable Speeds and Loads
8.2. Click the “Data Entry & Review” button on the overview screen in Lookout on Laptop 11. The data set/view screen will pop up.
8.2.1. Do not change the pre-set sensor calibration constants.
8.2.2. The “Reset Data?” switch should be left on “No”.
8.2.3. Enter a Log File Name in the format “Data_(month)(DD)(YY)” (example: Data_Jan0106).
8.2.4. Enter the motor specifications, which can be found on the motor name plate (PF = Power Factor, EFI = Efficiency).
8.2.5. Under “LC Type”, enter “0” for the type of load cell used (0 = 150 lbs).
8.2.6. Enter the “Load Cell Arm Location in Ft” according to the location where the load cell is installed.
8.2.7. Click the “Overview” button to return to the overview screen.
8.3. Adjust Motor Speed
8.3.1. Always close the flow control and pressure control valves to remove the applied load from the motor before adjusting the motor speed.
8.3.2. On the VFD Controller (Cabinet 8), press the “HAND START” button, then use the “+” and “-“ buttons to set the speed to that indicated on the “VFD Motor Test Sheet” for the test you are running.
8.3.3. Press the “DISPLAY MODE” button twice and the “+” button once to display the current drawn by the motor.
At no time should you apply a load to the motor such that the current drawn exceeds the motor’s maximum amperage rating indicated on the motor name plate.
8.4. Adjust the Applied Load.
8.4.1. Open the Flow Control Valve by pressing the red button in the middle of the control knob while lifting the control knob.
8.4.2. Open the Pressure Control Valve by turning the knob clockwise until the value indicated by the Sensotec A/D converter is nearly equal to the value calculated for the desired force.
8.4.3. Check the VFD display to confirm that the motor’s maximum amperage has not been exceeded.
8.4.3.1. If the maximum amperage has been exceeded, then back off on the applied load until the motor is drawing its maximum amperage.
8.4.3.2. Circle this amperage value on the datasheet to indicate that no further tests at this speed are to be conducted.
8.5. Verify Applied Load
8.5.1. Wait at least one minute since the last adjustment to the system.
8.5.2. Confirm that the force displayed on the overview screen in Lookout is approximately equal to the desired force indicated on the datasheet.
Electric Motor Efficiency under Variable Frequencies and Loads http://www.itrc.org/reports/pdf/r06004.pdf ITRC Report No. R 06-004
Irrigation Training and Research Center A-9 Electric Motor Efficiency under Variable Speeds and Loads
8.5.2.1. If the displayed force is significantly different than the desired force then adjust the pressure control valve accordingly.
8.6. Handheld RPM Measurement
8.6.1. A piece of reflective tape has been applied to the collar joining the bottom of the motor shaft to the top of the pump shaft.
8.6.2. Carefully stand between the motor and the edge of the platform.
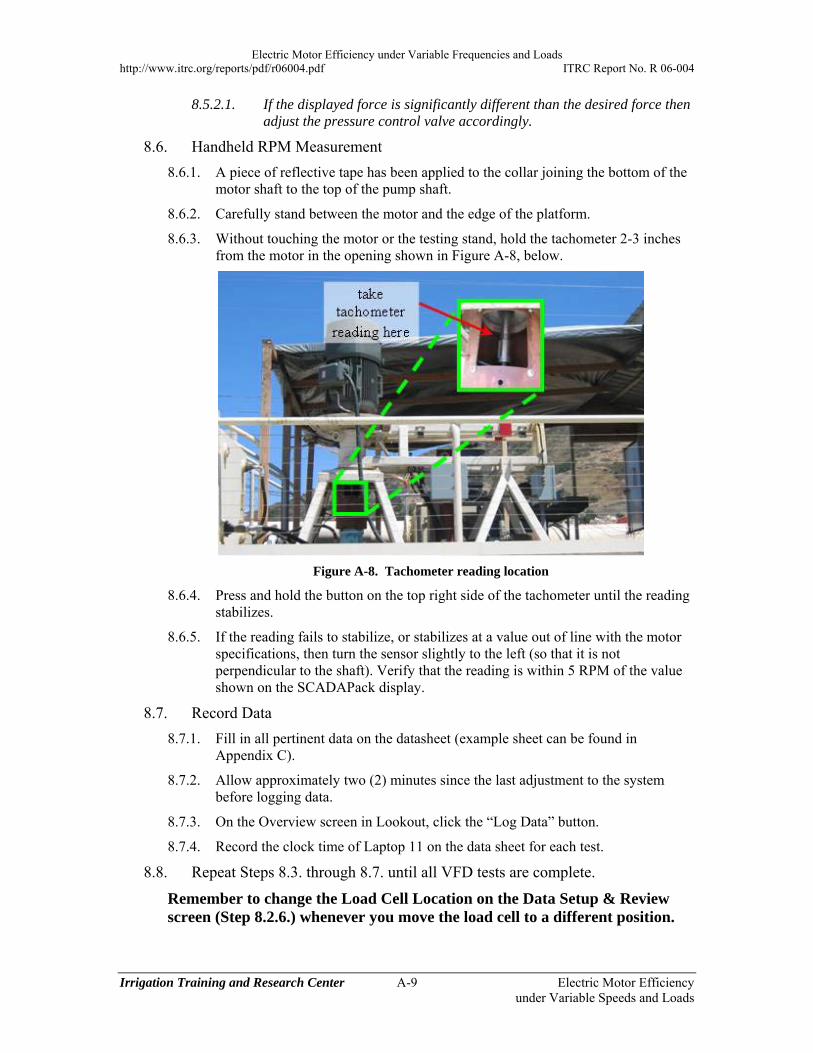
8.6.3. Without touching the motor or the testing stand, hold the tachometer 2-3 inches from the motor in the opening shown in Figure A-8, below.
Figure A-8. Tachometer reading location
8.6.4. Press and hold the button on the top right side of the tachometer until the reading stabilizes.
8.6.5. If the reading fails to stabilize, or stabilizes at a value out of line with the motor specifications, then turn the sensor slightly to the left (so that it is not perpendicular to the shaft). Verify that the reading is within 5 RPM of the value shown on the SCADAPack display.
8.7. Record Data
8.7.1. Fill in all pertinent data on the datasheet (example sheet can be found in Appendix C).
8.7.2. Allow approximately two (2) minutes since the last adjustment to the system before logging data.
8.7.3. On the Overview screen in Lookout, click the “Log Data” button.
8.7.4. Record the clock time of Laptop 11 on the data sheet for each test.
8.8. Repeat Steps 8.3. through 8.7. until all VFD tests are complete.
Remember to change the Load Cell Location on the Data Setup & Review screen (Step 8.2.6.) whenever you move the load cell to a different position.
Electric Motor Efficiency under Variable Frequencies and Loads http://www.itrc.org/reports/pdf/r06004.pdf ITRC Report No. R 06-004
Irrigation Training and Research Center A-10 Electric Motor Efficiency under Variable Speeds and Loads
9.0. VFD-Motor Shutdown
9.1. Remove the load from the motor by closing the flow control and pressure control valves.
9.2. Reduce VFD Speed.
9.2.1. On the VFD Control Panel, press “HAND START” button.
9.2.2. Use the “-“ button to set the speed to 40%.
9.2.3. Press the “OFF STOP” button.
9.3. Shut down VFD.
9.3.1. Pull the switches on Panels 2 & 3 to the horizontal OFF positions.
10.0. Across-The-Line Motor Startup
10.1. Verify that the flow control and pressure control valves are closed. There is no load applied to the motor.
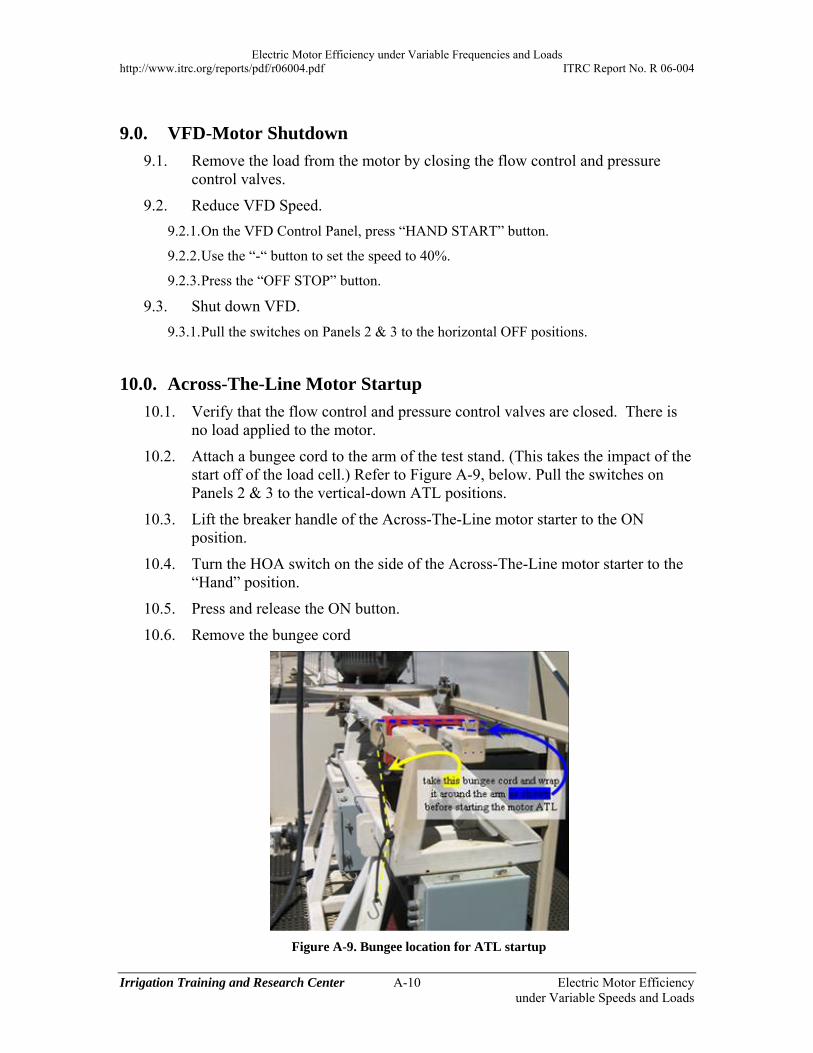
10.2. Attach a bungee cord to the arm of the test stand. (This takes the impact of the start off of the load cell.) Refer to Figure A-9, below. Pull the switches on Panels 2 & 3 to the vertical-down ATL positions.
10.3. Lift the breaker handle of the Across-The-Line motor starter to the ON position.
10.4. Turn the HOA switch on the side of the Across-The-Line motor starter to the “Hand” position.
10.5. Press and release the ON button.
10.6. Remove the bungee cord
Figure A-9. Bungee location for ATL startup
Electric Motor Efficiency under Variable Frequencies and Loads http://www.itrc.org/reports/pdf/r06004.pdf ITRC Report No. R 06-004
Irrigation Training and Research Center A-11 Electric Motor Efficiency under Variable Speeds and Loads
11.0. ATL Testing 11.1. Follow steps 8.4. to 8.7. until all ATL tests are complete.
Remember to change the Load Cell Location (step 8.2.6.) whenever you move the load cell to a different position.
12.0. ATL – Motor Shutdown 12.1. Remove the load from the motor by closing the flow control and pressure
control valves.
12.2. On the ATL – Motor Starter, turn the HOA switch to OFF.
12.3. Pull the switches on Panels 2 & 3 to the horizontal OFF positions.
13.0. Second Motor Test 13.1. Repeat the motor testing procedure (Steps 7-12), recording the data on a new,
identical data sheet.
13.1.1. Data from the computer can continue to be collected in the same folder.
14.0. Post-test Load Cell Calibration 14.1. Repeat step 7.0.
14.1.1. Calibrations will occur three times for each motor: before the first test, between the two tests, and after the second test.
15.0. Computer Shutdown 15.1. Laptop 21
15.1.1. Close the program “LabVIEW.”
15.1.2. Shut down Laptop 21.
15.2. Laptop 11
15.2.1. Close the program “Lookout.”
15.2.2. Save data file to memory stick. File location: C:/ProgramFiles/National_Instruments/Lookout5.0/2006/(month)
15.2.3. Shut down Laptop 11.
16.0. General Cleanup 16.1. Return the computers to Cabinet 4.
16.2. Remove the Load Cell and return it to the gray box shown in Figures 6 & 7.
16.3. The Main Disconnect (Panel 1) and the 120V Main (Box 6) may be left ON. Everything else should be OFF.
Electric Motor Efficiency under Variable Frequencies and Loads http://www.itrc.org/reports/pdf/r06004.pdf ITRC Report No. R 06-004
Irrigation Training and Research Center A-12 Electric Motor Efficiency under Variable Speeds and Loads
16.4. Lock all cabinets.
17.0. Water Shutdown 17.1. Turn water control valve from Figure A-1 clockwise (close).
18.0. Network Communication Troubleshooting If the data on the Lookout HMI screen stops updating frequently (every 3-5 minutes) and seems to lock up, check the Modbus and Serial Port setting on LT11:
18.1. Press “Ctrl+Space” to go into Edit mode (yellow bar on the bottom of the screen appears).
18.1.1. Click “Object”, then “Modify”, then expand the “ITRCLT11” folder by pressing the “+” sign beside it.
18.1.2. Expand the “Process1” folder. Choose “Modbus1”.
18.1.3. Click “OK”, and the “Revise Modbus Secondary” will pop up. On the bottom of this screen, make sure the “Receive timeout:” is set as 2000 msecs.
18.1.4. Click “OK” to finish (leave the COM port as COM6).
18.2. Click “Option”, then “Serial Ports”. From the upper-left pull-down menu, choose “COM6”. Make sure the “Receive gap” is set as 200 bytes. Click “Quit” to finish.
18.3. Click “Ctrl+Space” to exit Edit mode and return to Run mode.
19.0. Software Installation 19.1. Laptop 1 with LabVIEW
19.1.1. National Instruments, LabVIEW 7.1 (Disc 1-2, 12, 19-20) or higher
19.1.2. Industrial Automation OPC Server Ver 5.0
19.1.3. NI-Serial for USB.
19.1.4. Run “visa341full.exe”, which can be found on the VFD work folder CD.
19.2. Laptop 2 with Lookout
19.2.1. National Instruments, Lookout 5.0 software or higher.
19.2.2. ISaGRAF 3.3 can be installed (v. 3.5 version is single-computer license software).
19.2.2.1. ISaGRAF is rarely needed; however, it may be used when troubleshooting or if a PLC code needs to be changed.

Electric Motor Efficiency under Variable Frequencies and Loads http://www.itrc.org/reports/pdf/r06004.pdf ITRC Report No. R 06-004
Irrigation Training and Research Center Electric Motor Efficiency under Variable Speeds and Loads
APPENDIX B Motor Replacement Procedure
Electric Motor Efficiency under Variable Frequencies and Loads http://www.itrc.org/reports/pdf/r06004.pdf ITRC Report No. R 06-004
Irrigation Training and Research Center B-1 Electric Motor Efficiency under Variable Speeds and Loads
Appendix B: Motor Replacement Procedure 1 Electrical Disconnect
1.1 Turn OFF the Main Disconnect (Panel 1).
1.2 Ensure that the switches on Panels 2 & 3 are both OFF.
1.3 Detach Motor Power Cable (Box 5).
1.3.1 Turn dial counterclockwise to the open position.
1.3.2 Turn locking collar clockwise and pull down on plug until it releases. It may be necessary to lift the cap while pulling down on the plug.
1.3.3 Push the cap into position and rotate its locking collar counterclockwise to secure it in place.
1.4 Remove the cover from the electrical access to the motor.
1.5 Disconnect the colored power lines. Set couplers aside for the next installation.
1.6 Disconnect the green ground cable from the motor housing.
1.7 Coil the power cable and set it aside for the next installation.
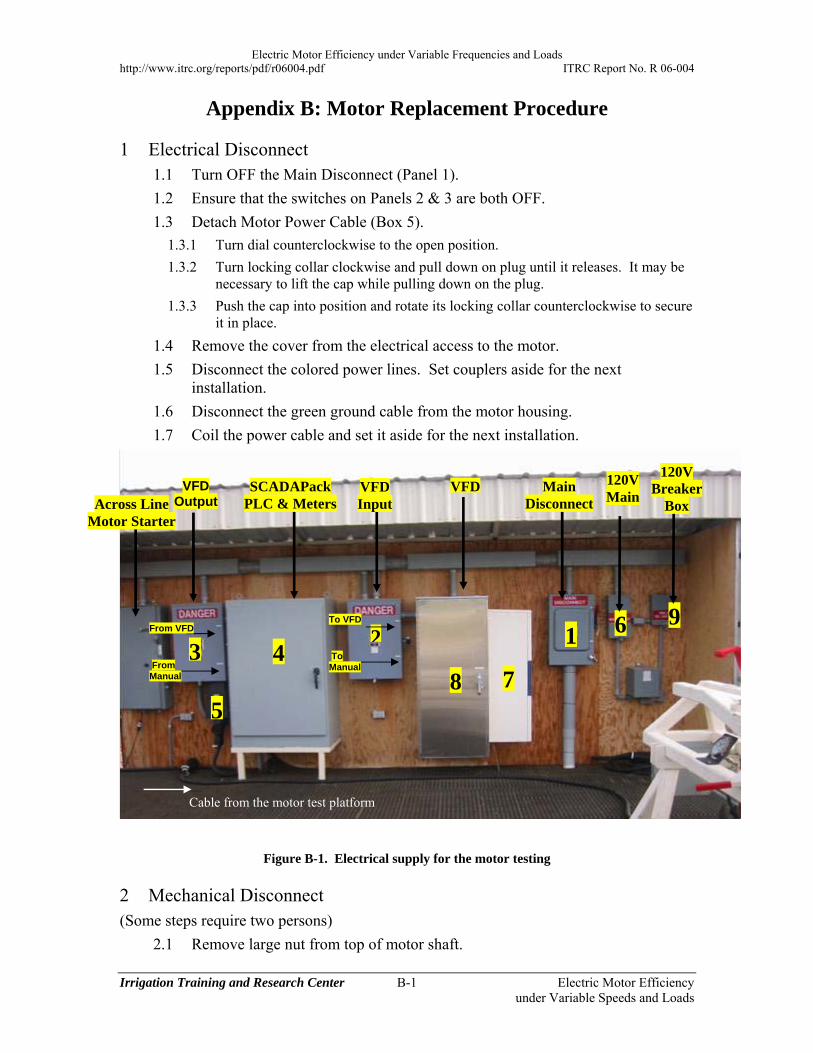
Figure B-1. Electrical supply for the motor testing 2 Mechanical Disconnect (Some steps require two persons)
2.1 Remove large nut from top of motor shaft.
From VFD
Cable from the motor test platform
VFDVFD Input
VFD Output
SCADAPack PLC & Meters
Main Disconnect
1 23 4
8 7 From Manual
Across Line Motor Starter
6
120V Main
5
To VFD
To Manual
9
120V Breaker
Box

Electric Motor Efficiency under Variable Frequencies and Loads http://www.itrc.org/reports/pdf/r06004.pdf ITRC Report No. R 06-004
Irrigation Training and Research Center B-2 Electric Motor Efficiency under Variable Speeds and Loads
2.2 Remove the chuck and key from the top of the motor.
2.3 Rethread the nut to a position approximately 6” from the top of the motor shaft.
2.4 Let the chuck rest on the top of the nut and reinsert the key. This will serve as a handle to unscrew the motor shaft from the collar that is connecting it to the pump below.
2.5 Open the access plate above the pump on the pond side of the test stand.
2.6 One person holds the collar with a crescent wrench while the second person turns the shaft clockwise using the chuck.
2.7 Once free, lift the shaft straight up through the motor. Use gloves if necessary as threads may be sharp.
2.8 Remove the key and chuck from the motor shaft.
2.9 Tape the key to the chuck and replace it on top of the motor.
2.10 Remove collar from pump shaft.
2.11 Return both the collar and the motor shaft to the motor storage area.
3 Motor Removal and Storage (Requires two persons, one properly trained to operate a lift truck)
3.1 Lift truck operator positions lift truck with one (1) fork centered directly above the motor.
3.2 Second person positions sling under the lifting points on each side of the motor and centered over the fork.
3.3 Remove the bolts connecting the motor to the test stand.
3.4 Lift truck operator raises the forks to lift the motor off of the test stand.
3.5 Lift truck operator drives to the shed area and lowers the motor onto its storage skid.
3.6 If the adapter plate was used to attach this motor to the test stand, the adapter plate should be removed prior to putting the motor into storage.
3.6.1 Lower the motor with the adapter plate onto a pair of soft wood boards.
3.6.2 Remove the nuts attaching the motor to the adapter plate.
3.6.3 Using the lift truck, lift the motor and place it onto its skid.
3.6.4 If not required for the next installation, return the adapter plate to the storage area.
3.7 Once the motor is securely bolted to its skid, use the lift truck and/or hand truck to move the motor into the storage area.
4 Motor Installation (Requires two persons, one properly trained to operate a lift truck)
4.1 Move the next motor to be tested out of the storage area using the hand truck.

Electric Motor Efficiency under Variable Frequencies and Loads http://www.itrc.org/reports/pdf/r06004.pdf ITRC Report No. R 06-004
Irrigation Training and Research Center B-3 Electric Motor Efficiency under Variable Speeds and Loads
4.2 Remove the bolts holding the motor to its skid.
4.3 Lift truck operator positions lift truck with one (1) fork centered directly above the motor.
4.4 Second person positions sling under the lifting points on each side of the motor and centered over the fork.
4.5 Lift truck operator raises the forks to lift the motor off of the skid.
4.6 If the adapter plate is needed to attach this motor to the test stand, it should be attached to the motor at this time.
4.6.1 Place the adapter plate onto a pair of soft wood boards.
4.6.2 The lift truck operator should slowly lower the motor onto the adapter plate, while the second person guides it into position by aligning the bolts on the adapter plate with the mounting holes on the motor.
4.6.3 Firmly tighten the nuts attaching the motor to the adapter plate.
4.6.4 Lift truck operator raises the forks to lift the motor with the adapter plate off of the boards.
4.7 Lift truck operator drives to the testing area and raises the motor above the test stand.
4.8 Lift truck operator slowly lowers the motor onto the test stand while the second person guides the motor into position by aligning the holes on the test stand with those on the motor (or adapter plate, if used).
4.9 Firmly tighten the nuts and bolts holding the motor to the test stand.
4.10 Lift truck operator can return the lift truck.
5 Mechanical Connection 5.1 Measure the diameter of the hole in the center of the chuck (on the top of the
motor) to determine the correct motor shaft diameter.
5.2 Select the shaft with this diameter with its matching nut and collar from the storage area.
5.3 Thread the collar onto the pump shaft (in the pond-side access panel) until the top of the pump shaft is aligned with the small hole in the side of the collar.
5.4 Lower the motor shaft through the top of the chuck. Turn the shaft counterclockwise to thread it onto the collar. Use gloves if necessary, as the threads may be sharp.
5.5 Align the key slot in the motor shaft with the key slot on the chuck and insert the key.
5.6 Use a crescent wrench to tight the collar onto the motor shaft using a clockwise rotation.
5.7 Replace the cover on the access panel.
5.8 Thread the large nut onto the motor shaft and tighten it above the chuck.
5.9 Fill the motor with the appropriate weight motor oil.
Electric Motor Efficiency under Variable Frequencies and Loads http://www.itrc.org/reports/pdf/r06004.pdf ITRC Report No. R 06-004
Irrigation Training and Research Center B-4 Electric Motor Efficiency under Variable Speeds and Loads
5.10 Apply 3-4 squirts of grease to each of three (3) grease fittings.
5.10.1 Upper pump shaft bearings.
5.10.2 Lower pump shaft bearings.
5.10.3 Motor bearing.
6 Electrical Connection 6.1 Verify that the Main Disconnect (Panel 1) is OFF and that the switches on
Panels 2 & 3 are both OFF.
6.2 Verify that the power cable you will be installing is in good condition and that it is disconnected from the power supply.
6.3 Locate the motor wiring plate near the motor’s electrical access panel.
6.4 If there are multiple wiring schemes, contact Bryan Busch to verify which should be followed.
6.5 Remove the cover from the motor’s electrical access panel. Each wire should be numbered corresponding to the schematic on the wiring plate.
6.6 Complete any internal wiring connections before connecting the external power cable.
6.7 Connect the external power cable to the motor.
6.7.1 The green cable is ground and should attach directly to the motor housing.
6.7.2 The red cable is line 1 and will normally connect to line 1 on the motor.
6.7.3 The white cable is line 2 and will normally connect to line 2 on the motor.
6.7.4 The black cable is line 3 and will normally connect to line 3 on the motor.
6.8 Always ensure that the cover is securely over the motor’s electrical access panel before applying power to the motor.
6.9 Connect the power cable to the power supply (Box 5).
6.9.1 Remove the cap from the power supply by turning the locking collar counterclockwise.
6.9.2 Align the plug of the power cable so that the semi-circle prong is toward the wall and lift plug into place.
6.9.3 Turn the locking collar on the plug counterclockwise to secure it.
6.9.4 Turn the dial clockwise to the closed position.
7 VFD Setup 7.1 Power up the VFD
7.1.1 Turn Main Disconnect (Panel 1) ON.
7.1.2 Verify that the 120V Main (Panel 6) is ON.
7.1.3 Open Panel 9, 120 V Breaker, and turn on the VFD air conditioner (Unit 7).
Electric Motor Efficiency under Variable Frequencies and Loads http://www.itrc.org/reports/pdf/r06004.pdf ITRC Report No. R 06-004
Irrigation Training and Research Center B-5 Electric Motor Efficiency under Variable Speeds and Loads
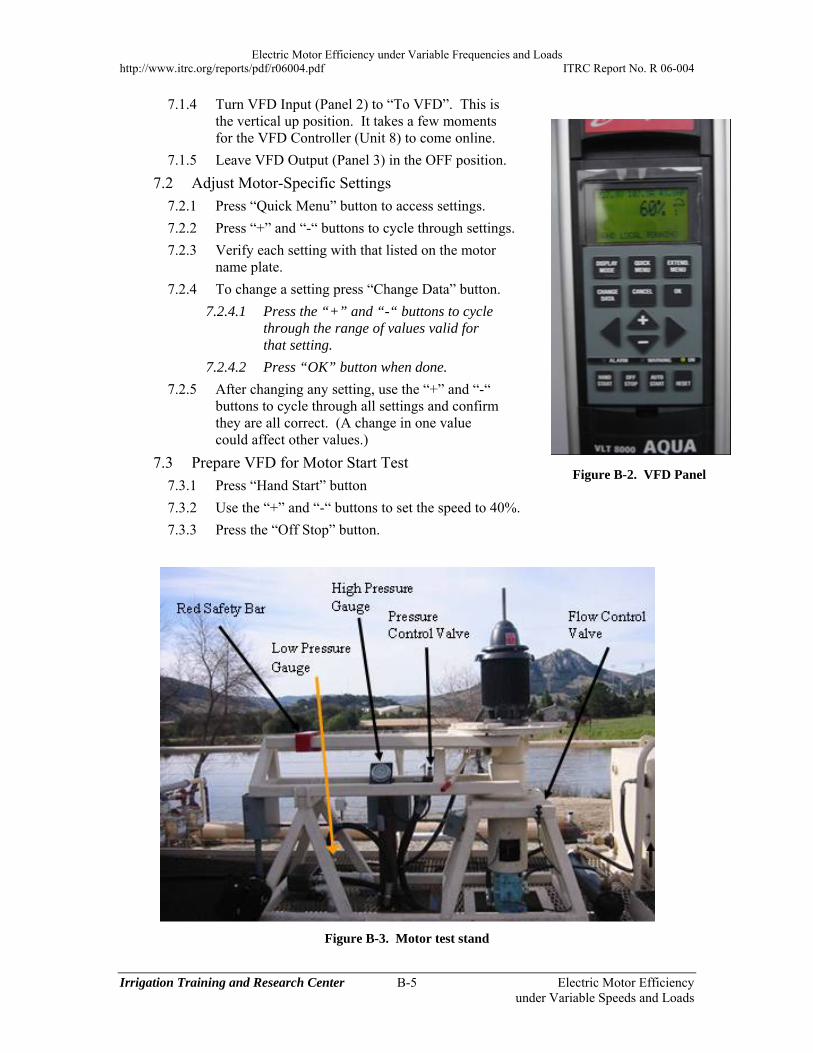
7.1.4 Turn VFD Input (Panel 2) to “To VFD”. This is the vertical up position. It takes a few moments for the VFD Controller (Unit 8) to come online.
7.1.5 Leave VFD Output (Panel 3) in the OFF position.
7.2 Adjust Motor-Specific Settings
7.2.1 Press “Quick Menu” button to access settings.
7.2.2 Press “+” and “-“ buttons to cycle through settings.
7.2.3 Verify each setting with that listed on the motor name plate.
7.2.4 To change a setting press “Change Data” button.
7.2.4.1 Press the “+” and “-“ buttons to cycle through the range of values valid for that setting.
7.2.4.2 Press “OK” button when done.
7.2.5 After changing any setting, use the “+” and “-“ buttons to cycle through all settings and confirm they are all correct. (A change in one value could affect other values.)
7.3 Prepare VFD for Motor Start Test
7.3.1 Press “Hand Start” button
7.3.2 Use the “+” and “-“ buttons to set the speed to 40%.
7.3.3 Press the “Off Stop” button.
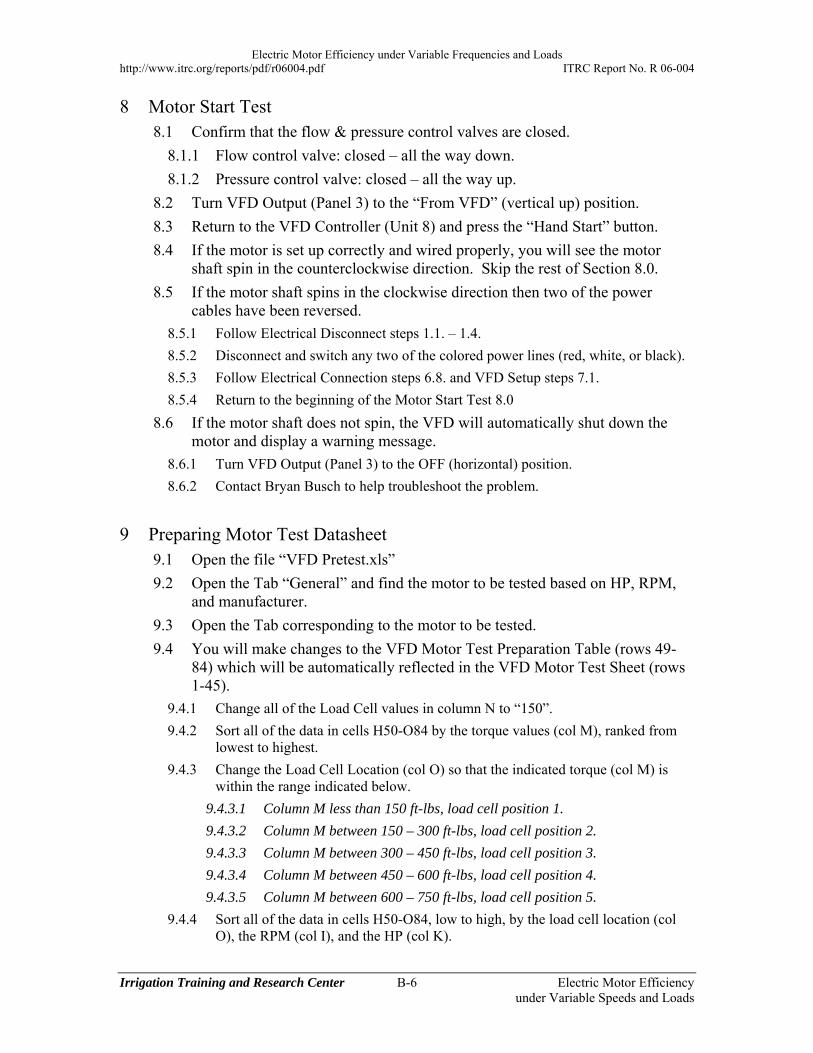
Figure B-3. Motor test stand
Figure B-2. VFD Panel
Electric Motor Efficiency under Variable Frequencies and Loads http://www.itrc.org/reports/pdf/r06004.pdf ITRC Report No. R 06-004
Irrigation Training and Research Center B-6 Electric Motor Efficiency under Variable Speeds and Loads
8 Motor Start Test 8.1 Confirm that the flow & pressure control valves are closed.
8.1.1 Flow control valve: closed – all the way down.
8.1.2 Pressure control valve: closed – all the way up.
8.2 Turn VFD Output (Panel 3) to the “From VFD” (vertical up) position.
8.3 Return to the VFD Controller (Unit 8) and press the “Hand Start” button.
8.4 If the motor is set up correctly and wired properly, you will see the motor shaft spin in the counterclockwise direction. Skip the rest of Section 8.0.
8.5 If the motor shaft spins in the clockwise direction then two of the power cables have been reversed.
8.5.1 Follow Electrical Disconnect steps 1.1. – 1.4.
8.5.2 Disconnect and switch any two of the colored power lines (red, white, or black).
8.5.3 Follow Electrical Connection steps 6.8. and VFD Setup steps 7.1.
8.5.4 Return to the beginning of the Motor Start Test 8.0
8.6 If the motor shaft does not spin, the VFD will automatically shut down the motor and display a warning message.
8.6.1 Turn VFD Output (Panel 3) to the OFF (horizontal) position.
8.6.2 Contact Bryan Busch to help troubleshoot the problem.
9 Preparing Motor Test Datasheet 9.1 Open the file “VFD Pretest.xls”
9.2 Open the Tab “General” and find the motor to be tested based on HP, RPM, and manufacturer.
9.3 Open the Tab corresponding to the motor to be tested.
9.4 You will make changes to the VFD Motor Test Preparation Table (rows 49-84) which will be automatically reflected in the VFD Motor Test Sheet (rows 1-45).
9.4.1 Change all of the Load Cell values in column N to “150”.
9.4.2 Sort all of the data in cells H50-O84 by the torque values (col M), ranked from lowest to highest.
9.4.3 Change the Load Cell Location (col O) so that the indicated torque (col M) is within the range indicated below.
9.4.3.1 Column M less than 150 ft-lbs, load cell position 1.
9.4.3.2 Column M between 150 – 300 ft-lbs, load cell position 2.
9.4.3.3 Column M between 300 – 450 ft-lbs, load cell position 3.
9.4.3.4 Column M between 450 – 600 ft-lbs, load cell position 4.
9.4.3.5 Column M between 600 – 750 ft-lbs, load cell position 5.
9.4.4 Sort all of the data in cells H50-O84, low to high, by the load cell location (col O), the RPM (col I), and the HP (col K).
Electric Motor Efficiency under Variable Frequencies and Loads http://www.itrc.org/reports/pdf/r06004.pdf ITRC Report No. R 06-004
Irrigation Training and Research Center B-7 Electric Motor Efficiency under Variable Speeds and Loads
9.5 On the VFD Motor Test Sheet (rows 1-45) find the values for Force (col E) and Load Cell Location (col G) for the 100% VFD test.
9.6 Re-type these numbers in the corresponding rows for the Across-the-Line test.
9.7 Before printing, confirm that the Print Area includes only the VFD Motor Test Sheet.

Electric Motor Efficiency under Variable Frequencies and Loads http://www.itrc.org/reports/pdf/r06004.pdf ITRC Report No. R 06-004
Irrigation Training and Research Center Electric Motor Efficiency under Variable Speeds and Loads
APPENDIX C Sample Data Sheets

Electric Motor Efficiency under Variable Frequencies and Loads http://www.itrc.org/reports/pdf/r06004.pdf ITRC Report No. R 06-004
Irrigation Training and Research Center C-1 Electric Motor Efficiency under Variable Speeds and Loads
Appendix C: Example Data Sheets Sheet 1: Motor Test Data Collection
A01 Warmup start time: Warmup end time: Date:
US Motors, 460V, 24.3A, PF85.6, EFI 87.5, VFDStable load (lb):
Initial shaft load (lb):
1765 20 Max Amps: People doing test:Lookout Laptop 11 computer time
% Freq. RPM
Desired Force (lbs)
Load Cell
Load Cell
Location (ft)
Actual RPMActual Force
(lb)Shaft Load
(lb)Amperage Low Press. High Press. OK or not? Comment
60% 20 25 170% 17 25 180% 15 25 190% 13 25 1
100% 12 25 140% 15 25 250% 12 25 260% 20 25 270% 17 25 280% 15 25 280% 22 25 290% 13 25 290% 20 25 290% 20 25 2
100% 12 25 2100% 12 25 2100% 18 25 240% 20 25 350% 16 25 360% 20 25 370% 17 25 370% 23 25 380% 20 25 380% 20 25 390% 18 25 3
100% 16 25 340% 22 25 450% 18 25 450% 24 25 460% 20 25 470% 21 25 460% 20 25 540% 119 150 140% 149 150 150% 119 150 1
100% 12 25 1100% 24 25 1100% 12 25 3100% 16 25 3100% 20 25 3A
cros
s-th
e-lin
e
Max RPM
VFD Motor Test Sheet
Motor Description:
File Name (.csv)
VF
D
Norminal HP
Re-entry Loadcell and Loadcell location in Laptop 11 Lookout when do a physical replacement.
Electric Motor Efficiency under Variable Frequencies and Loads http://www.itrc.org/reports/pdf/r06004.pdf ITRC Report No. R 06-004
Irrigation Training and Research Center C-2 Electric Motor Efficiency under Variable Speeds and Loads
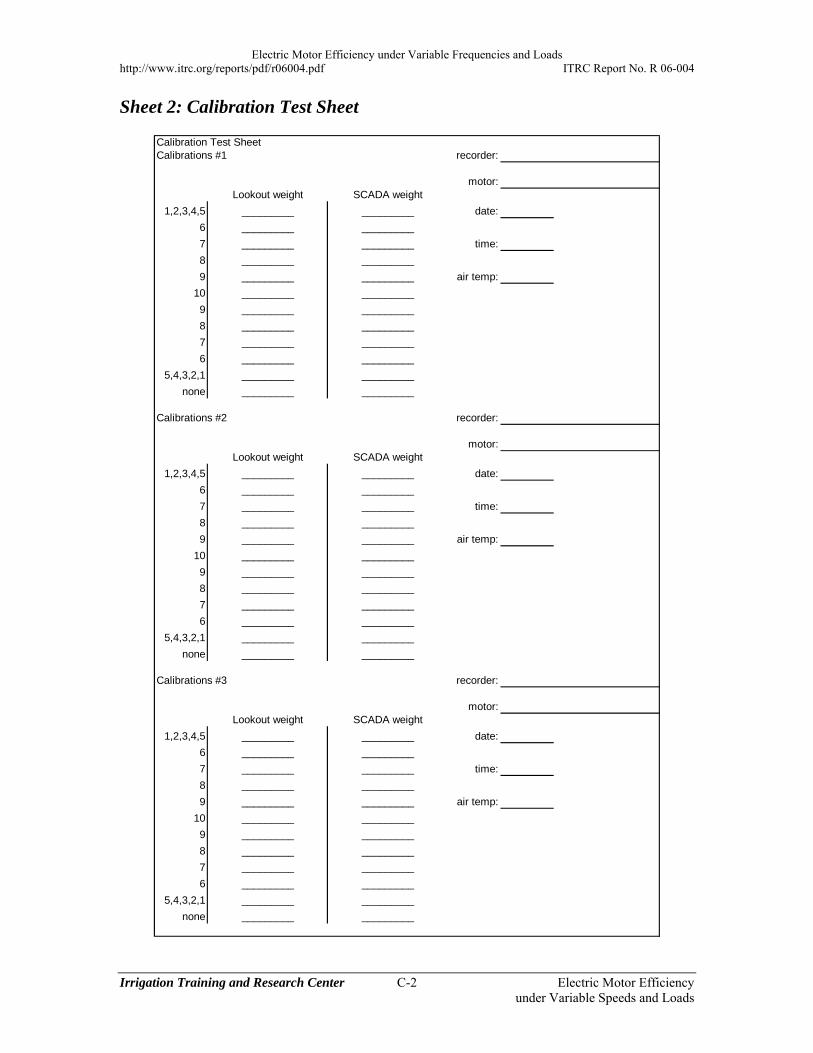
Sheet 2: Calibration Test Sheet
Calibration Test SheetCalibrations #1 recorder:
motor:Lookout weight SCADA weight
1,2,3,4,5 _________ _________ date:
6 _________ _________
7 _________ _________ time:
8 _________ _________
9 _________ _________ air temp:
10 _________ _________
9 _________ _________
8 _________ _________
7 _________ _________
6 _________ _________
5,4,3,2,1 _________ _________
none _________ _________
Calibrations #2 recorder:
motor:Lookout weight SCADA weight
1,2,3,4,5 _________ _________ date:
6 _________ _________
7 _________ _________ time:
8 _________ _________
9 _________ _________ air temp:
10 _________ _________
9 _________ _________
8 _________ _________
7 _________ _________
6 _________ _________
5,4,3,2,1 _________ _________
none _________ _________
Calibrations #3 recorder:
motor:Lookout weight SCADA weight
1,2,3,4,5 _________ _________ date:
6 _________ _________
7 _________ _________ time:
8 _________ _________
9 _________ _________ air temp:
10 _________ _________
9 _________ _________
8 _________ _________
7 _________ _________
6 _________ _________
5,4,3,2,1 _________ _________
none _________ _________

Electric Motor Efficiency under Variable Frequencies and Loads http://www.itrc.org/reports/pdf/r06004.pdf ITRC Report No. R 06-004
Irrigation Training and Research Center Electric Motor Efficiency under Variable Speeds and Loads
APPENDIX D Equipment Descriptions
Electric Motor Efficiency under Variable Frequencies and Loads http://www.itrc.org/reports/pdf/r06004.pdf ITRC Report No. R 06-004
Irrigation Training and Research Center D-1 Electric Motor Efficiency under Variable Speeds and Loads
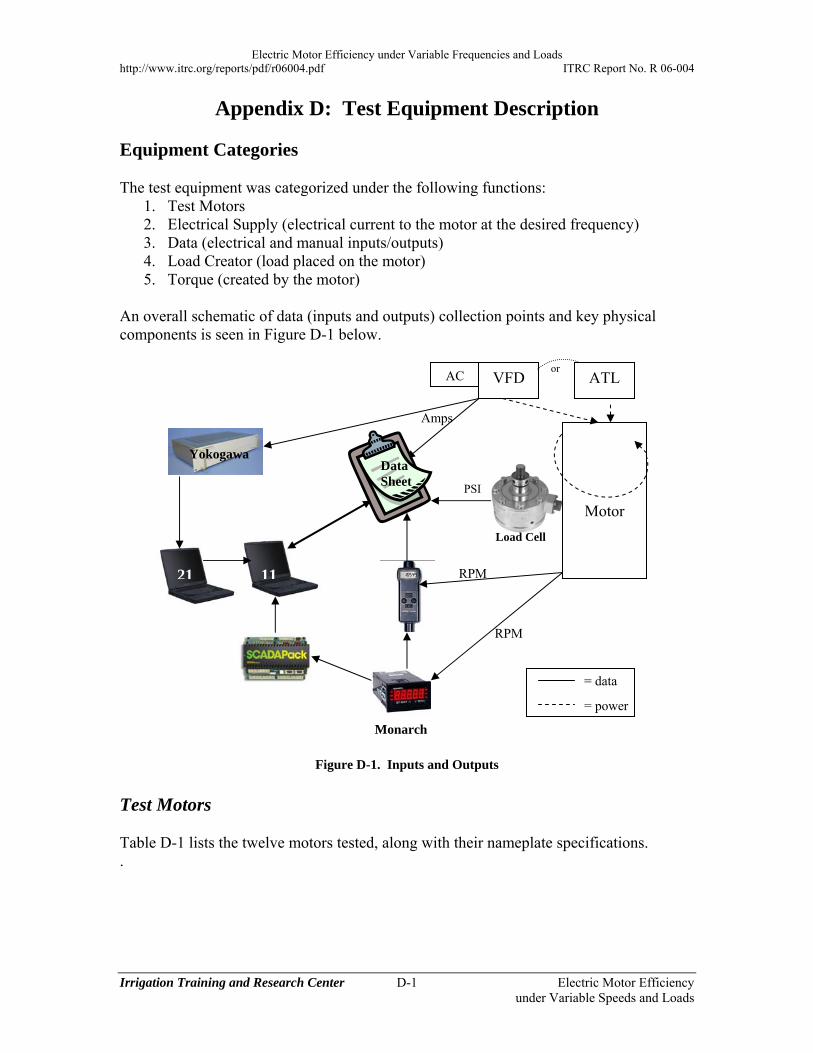
Appendix D: Test Equipment Description Equipment Categories The test equipment was categorized under the following functions:
1. Test Motors 2. Electrical Supply (electrical current to the motor at the desired frequency) 3. Data (electrical and manual inputs/outputs) 4. Load Creator (load placed on the motor) 5. Torque (created by the motor)
An overall schematic of data (inputs and outputs) collection points and key physical components is seen in Figure D-1 below.
Figure D-1. Inputs and Outputs
Test Motors Table D-1 lists the twelve motors tested, along with their nameplate specifications. .
VFD AC ATL
Motor
Data Sheet
Yokogawa
Load creator
RPM
Monarch
LT21 LT11
or
PSI
RPM
Amps
= data
= power
Yokogawa
21 11
Load Cell
Data Sheet
Electric Motor Efficiency under Variable Frequencies and Loads http://www.itrc.org/reports/pdf/r06004.pdf ITRC Report No. R 06-004
Irrigation Training and Research Center D-2 Electric Motor Efficiency under Variable Speeds and Loads
Table D-1. Motors used in testing and their nameplate specifications. All were rated at 60 Hz, 460 V
ITRC ID Manuf. Nom HP Nom. RPM
PF EFI Amps Other
AO1 US 20 1765 85.6 87.5 24.3 VFD rated
A02 GE 20 1175 85 91 24.1 AO3 US 20 1770 85.4 92.4 23.7 Premium AO5 US 75 1780 85.3 95 87 Premium AO6 GE 100 1780 ns 91 124 AO9 US 40 1780 85.7 88.5 49 AO10 GE 75 1785 85 95 87.1 AO11 GE 50 1775 ns ns 61.1 AO12 US 50 1780 87.5 94.5 56 Premium AO13 US 40 3515 89.5 90.2 46 AO14 US 75 895 74.3 94.1 100 AO15 GE 50 1185 ns 91.7 61.2
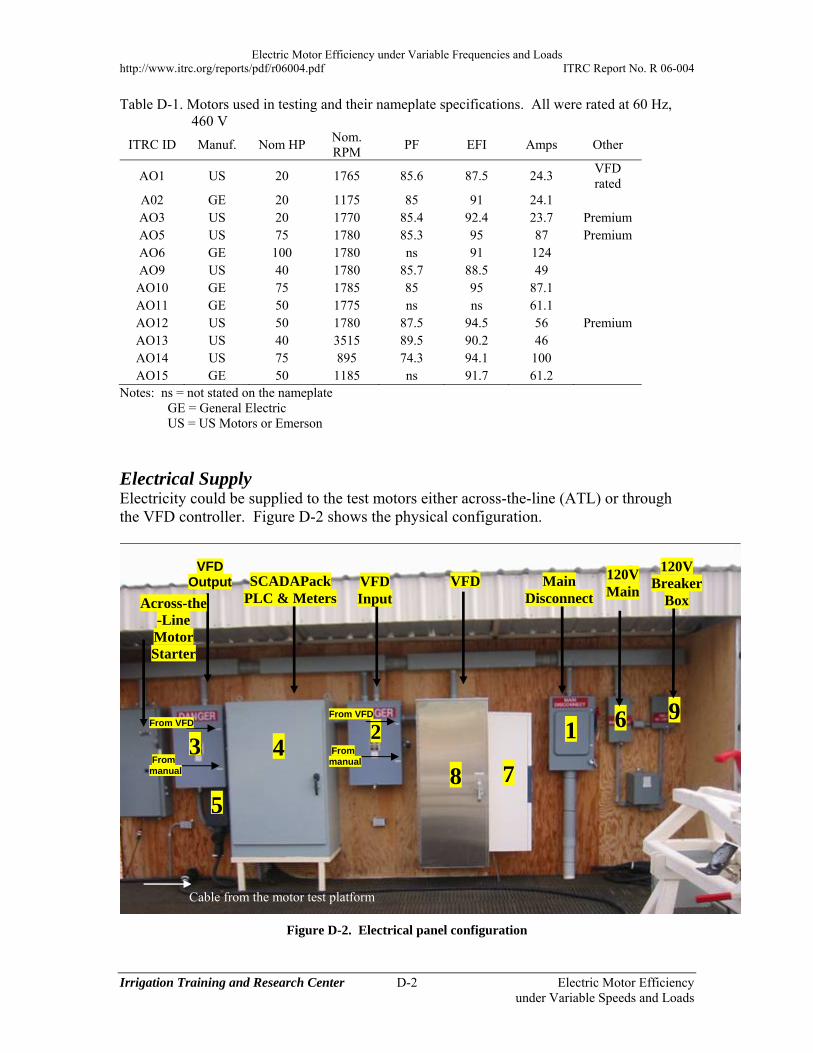
Notes: ns = not stated on the nameplate GE = General Electric US = US Motors or Emerson Electrical Supply Electricity could be supplied to the test motors either across-the-line (ATL) or through the VFD controller. Figure D-2 shows the physical configuration.
Figure D-2. Electrical panel configuration
From VFD
Cable from the motor test platform
VFDVFD Input
VFD Output SCADAPack
PLC & Meters Main
Disconnect
1 23 4
8 7 From manual
Across-the -Line Motor Starter
6
120V Main
5
From VFD
From manual
9
120V Breaker
Box
Electric Motor Efficiency under Variable Frequencies and Loads http://www.itrc.org/reports/pdf/r06004.pdf ITRC Report No. R 06-004
Irrigation Training and Research Center D-3 Electric Motor Efficiency under Variable Speeds and Loads
The following are the key elements of the electrical supply: Danfoss VLT 8000 AQUA (item 8 in Figure D-2) rated for 100 HP.
Nameplate information includes: (815) 639-8600
Ref. # : 370858 Ref 2:50
T/C: VLT8102AT4CN1STR0DLF00C0 IN: 3 x 380 - 480V 50/60 Hz 145A - 128A OUT: 3 x 0 -Vin 0.1 – 1000 Hz 147A – 130A 75Kw/100Hp SW VER 1.31 – 005 IP20/VL and NEMA TYPE 1 Tamb Max x 40 degrees/ 45 degrees Celsius (104/113 degrees F) Bus option: NONE Application option: NONE Serial #: 000225H144 Code #: 178B5770
Kooltronic RP52 14,000 BTU Air Conditioner connected to the VFD aluminum enclosure (item 7 in Figure D-2). This air conditioner receives power from a 20 amp, double-size breaker
Square D Well-Guard Across-the-Line Starter. Control 100 HP Pump Starter NPJ4100 Class 8940
Square D switch to manually change from the VFD to Across-the-Line to and from the alternators. Square D Double Throw Safety Switch 200 Amp/A, 480 Vac. Square D 82344RB
Square D Heavy Duty Safety Switch 200 A, 600 Vac, 600 Vdc as a main disconnect
20A Circuit Breaker. Square D FAL24020 with enclosure FA100RB
Flexible cable for quick connection to the motor. Crouse Hinds quick disconnect connectors (#CH4125C7W) and quick disconnect plugs (#CH4125P7W) were used with a 20’ Carol Cable #81664
120/240V Sub Panel. Square D 50A Q0612L100RB#2R
10KVA Single Phase Transformer. Square D 10S40F with 50A Backfed main
200A Service Disconnect Switch. Square D H365R
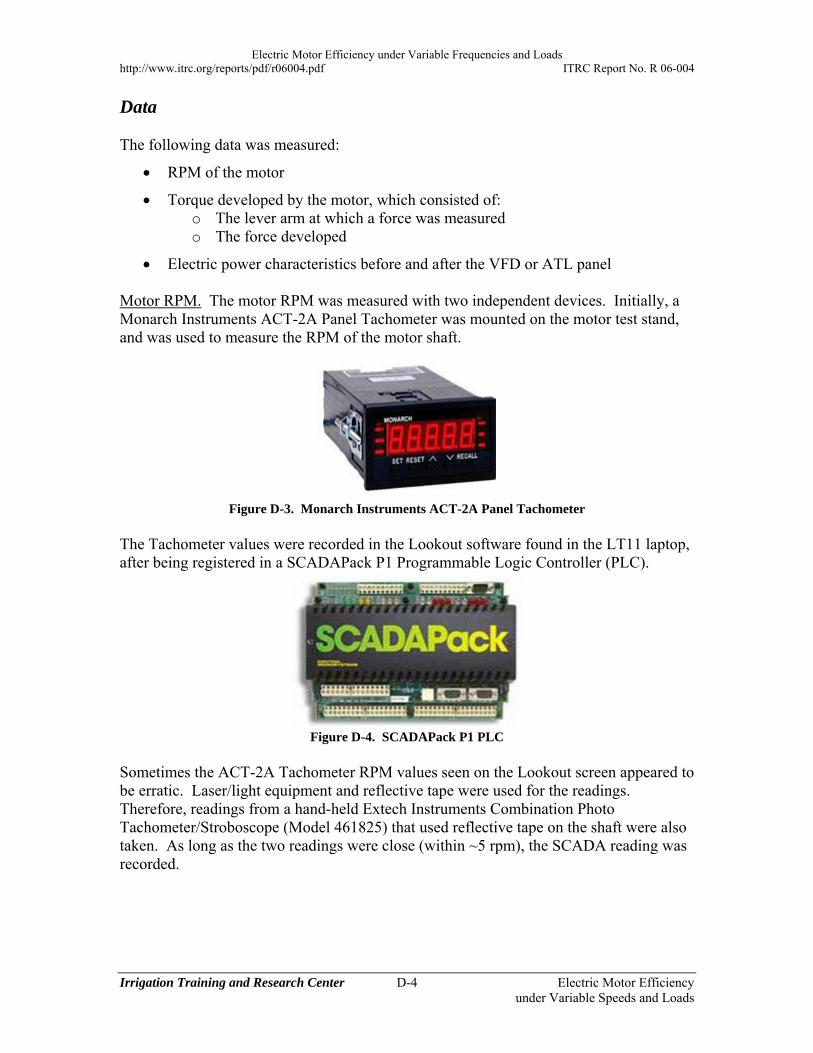
Electric Motor Efficiency under Variable Frequencies and Loads http://www.itrc.org/reports/pdf/r06004.pdf ITRC Report No. R 06-004
Irrigation Training and Research Center D-4 Electric Motor Efficiency under Variable Speeds and Loads
Data The following data was measured:
RPM of the motor
Torque developed by the motor, which consisted of: o The lever arm at which a force was measured o The force developed
Electric power characteristics before and after the VFD or ATL panel Motor RPM. The motor RPM was measured with two independent devices. Initially, a Monarch Instruments ACT-2A Panel Tachometer was mounted on the motor test stand, and was used to measure the RPM of the motor shaft.
Figure D-3. Monarch Instruments ACT-2A Panel Tachometer
The Tachometer values were recorded in the Lookout software found in the LT11 laptop, after being registered in a SCADAPack P1 Programmable Logic Controller (PLC).
Figure D-4. SCADAPack P1 PLC
Sometimes the ACT-2A Tachometer RPM values seen on the Lookout screen appeared to be erratic. Laser/light equipment and reflective tape were used for the readings. Therefore, readings from a hand-held Extech Instruments Combination Photo Tachometer/Stroboscope (Model 461825) that used reflective tape on the shaft were also taken. As long as the two readings were close (within ~5 rpm), the SCADA reading was recorded.
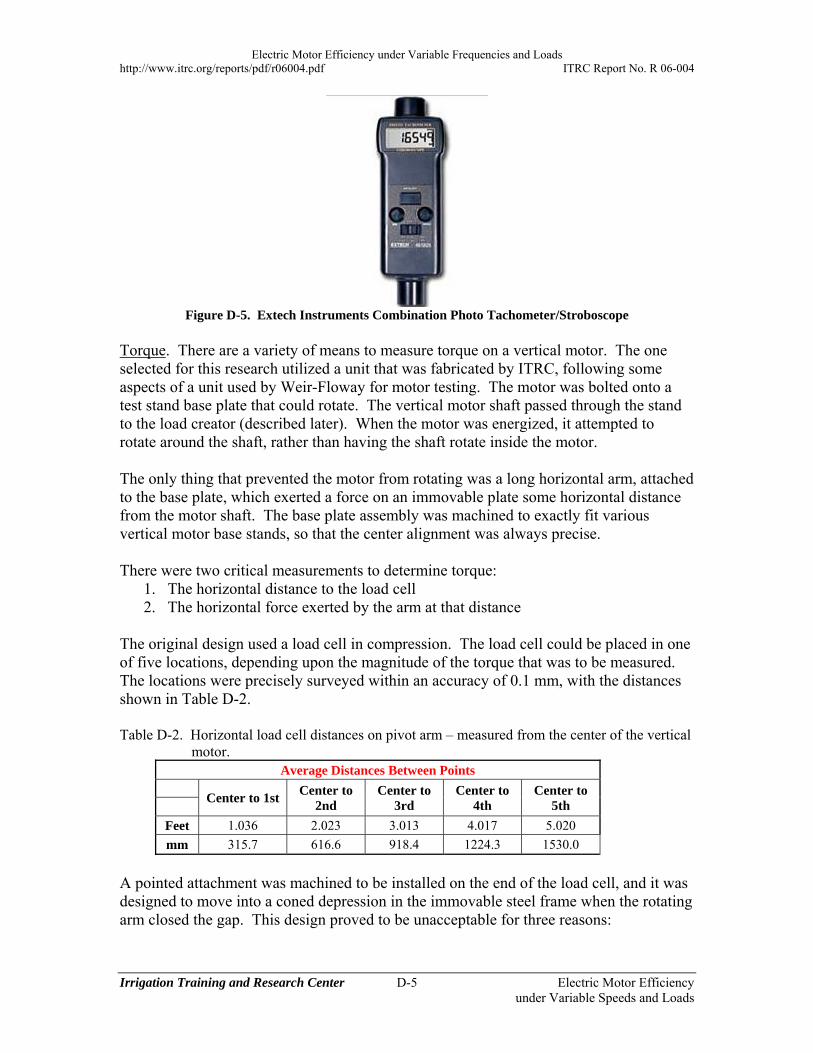
Electric Motor Efficiency under Variable Frequencies and Loads http://www.itrc.org/reports/pdf/r06004.pdf ITRC Report No. R 06-004
Irrigation Training and Research Center D-5 Electric Motor Efficiency under Variable Speeds and Loads
Figure D-5. Extech Instruments Combination Photo Tachometer/Stroboscope
Torque. There are a variety of means to measure torque on a vertical motor. The one selected for this research utilized a unit that was fabricated by ITRC, following some aspects of a unit used by Weir-Floway for motor testing. The motor was bolted onto a test stand base plate that could rotate. The vertical motor shaft passed through the stand to the load creator (described later). When the motor was energized, it attempted to rotate around the shaft, rather than having the shaft rotate inside the motor. The only thing that prevented the motor from rotating was a long horizontal arm, attached to the base plate, which exerted a force on an immovable plate some horizontal distance from the motor shaft. The base plate assembly was machined to exactly fit various vertical motor base stands, so that the center alignment was always precise. There were two critical measurements to determine torque:
1. The horizontal distance to the load cell 2. The horizontal force exerted by the arm at that distance
The original design used a load cell in compression. The load cell could be placed in one of five locations, depending upon the magnitude of the torque that was to be measured. The locations were precisely surveyed within an accuracy of 0.1 mm, with the distances shown in Table D-2. Table D-2. Horizontal load cell distances on pivot arm – measured from the center of the vertical
motor. Average Distances Between Points
Center to 1st
Center to 2nd
Center to 3rd
Center to 4th
Center to 5th
Feet 1.036 2.023 3.013 4.017 5.020
mm 315.7 616.6 918.4 1224.3 1530.0
A pointed attachment was machined to be installed on the end of the load cell, and it was designed to move into a coned depression in the immovable steel frame when the rotating arm closed the gap. This design proved to be unacceptable for three reasons:
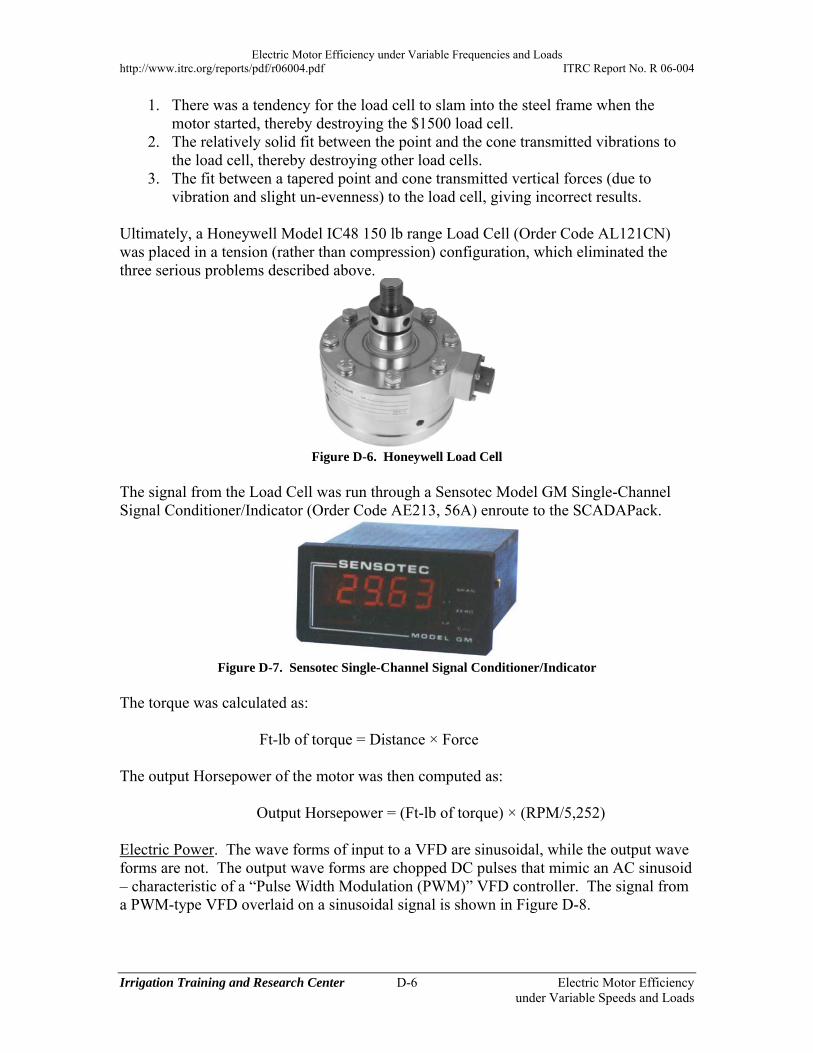
Electric Motor Efficiency under Variable Frequencies and Loads http://www.itrc.org/reports/pdf/r06004.pdf ITRC Report No. R 06-004
Irrigation Training and Research Center D-6 Electric Motor Efficiency under Variable Speeds and Loads
1. There was a tendency for the load cell to slam into the steel frame when the motor started, thereby destroying the $1500 load cell.
2. The relatively solid fit between the point and the cone transmitted vibrations to the load cell, thereby destroying other load cells.
3. The fit between a tapered point and cone transmitted vertical forces (due to vibration and slight un-evenness) to the load cell, giving incorrect results.
Ultimately, a Honeywell Model IC48 150 lb range Load Cell (Order Code AL121CN) was placed in a tension (rather than compression) configuration, which eliminated the three serious problems described above.
Figure D-6. Honeywell Load Cell
The signal from the Load Cell was run through a Sensotec Model GM Single-Channel Signal Conditioner/Indicator (Order Code AE213, 56A) enroute to the SCADAPack.
Figure D-7. Sensotec Single-Channel Signal Conditioner/Indicator
The torque was calculated as: Ft-lb of torque = Distance × Force The output Horsepower of the motor was then computed as:
Output Horsepower = (Ft-lb of torque) × (RPM/5,252) Electric Power. The wave forms of input to a VFD are sinusoidal, while the output wave forms are not. The output wave forms are chopped DC pulses that mimic an AC sinusoid – characteristic of a “Pulse Width Modulation (PWM)” VFD controller. The signal from a PWM-type VFD overlaid on a sinusoidal signal is shown in Figure D-8.
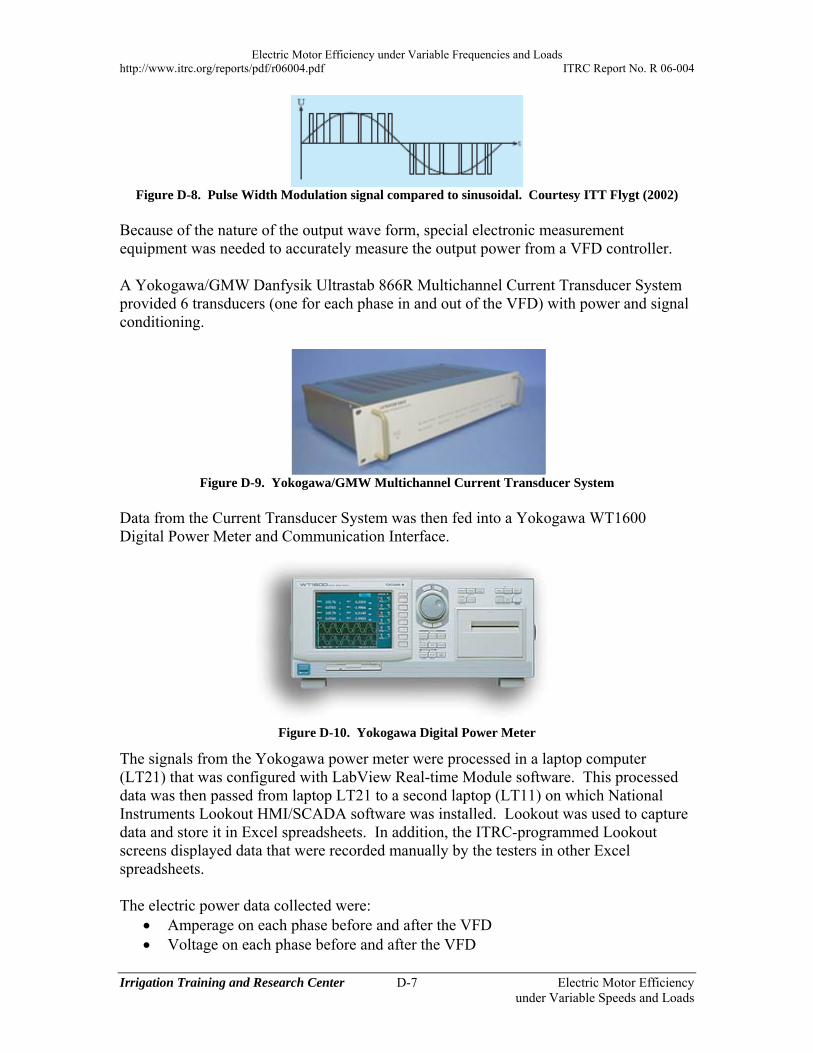
Electric Motor Efficiency under Variable Frequencies and Loads http://www.itrc.org/reports/pdf/r06004.pdf ITRC Report No. R 06-004
Irrigation Training and Research Center D-7 Electric Motor Efficiency under Variable Speeds and Loads
Figure D-8. Pulse Width Modulation signal compared to sinusoidal. Courtesy ITT Flygt (2002)
Because of the nature of the output wave form, special electronic measurement equipment was needed to accurately measure the output power from a VFD controller. A Yokogawa/GMW Danfysik Ultrastab 866R Multichannel Current Transducer System provided 6 transducers (one for each phase in and out of the VFD) with power and signal conditioning.
Figure D-9. Yokogawa/GMW Multichannel Current Transducer System
Data from the Current Transducer System was then fed into a Yokogawa WT1600 Digital Power Meter and Communication Interface.
Figure D-10. Yokogawa Digital Power Meter
The signals from the Yokogawa power meter were processed in a laptop computer (LT21) that was configured with LabView Real-time Module software. This processed data was then passed from laptop LT21 to a second laptop (LT11) on which National Instruments Lookout HMI/SCADA software was installed. Lookout was used to capture data and store it in Excel spreadsheets. In addition, the ITRC-programmed Lookout screens displayed data that were recorded manually by the testers in other Excel spreadsheets. The electric power data collected were:
Amperage on each phase before and after the VFD Voltage on each phase before and after the VFD
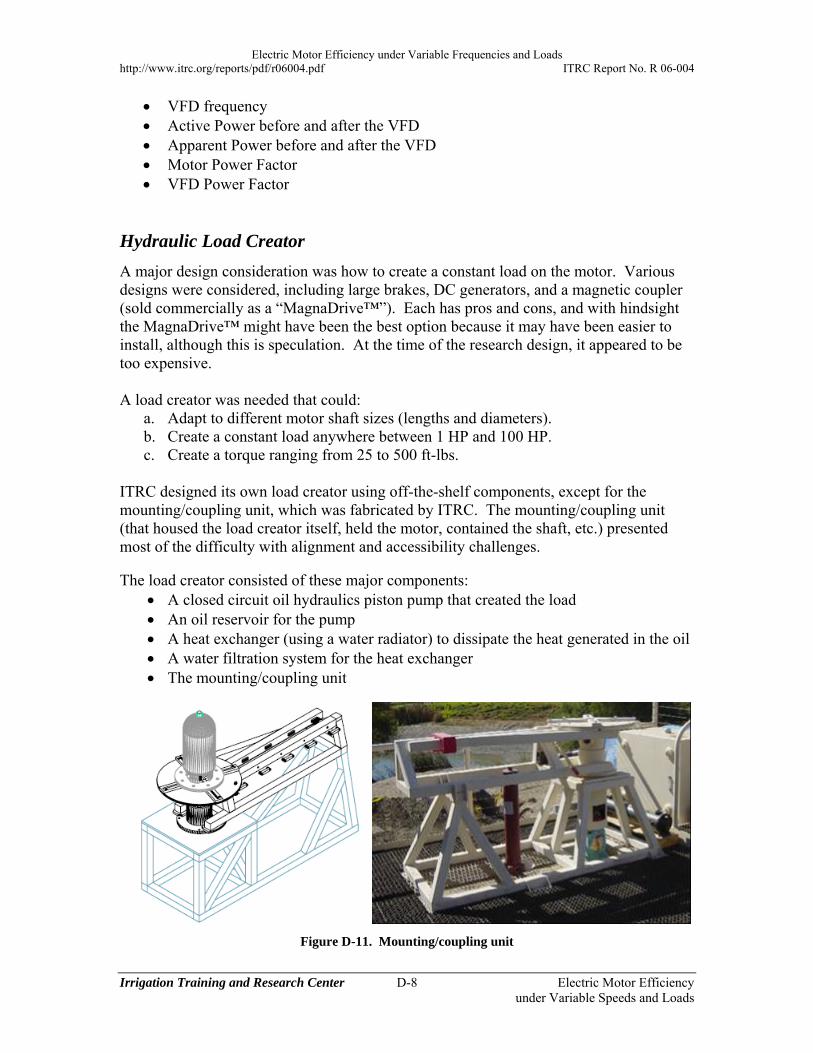
Electric Motor Efficiency under Variable Frequencies and Loads http://www.itrc.org/reports/pdf/r06004.pdf ITRC Report No. R 06-004
Irrigation Training and Research Center D-8 Electric Motor Efficiency under Variable Speeds and Loads
VFD frequency Active Power before and after the VFD Apparent Power before and after the VFD Motor Power Factor VFD Power Factor
Hydraulic Load Creator
A major design consideration was how to create a constant load on the motor. Various designs were considered, including large brakes, DC generators, and a magnetic coupler (sold commercially as a “MagnaDrive™”). Each has pros and cons, and with hindsight the MagnaDrive™ might have been the best option because it may have been easier to install, although this is speculation. At the time of the research design, it appeared to be too expensive. A load creator was needed that could:
a. Adapt to different motor shaft sizes (lengths and diameters). b. Create a constant load anywhere between 1 HP and 100 HP. c. Create a torque ranging from 25 to 500 ft-lbs.
ITRC designed its own load creator using off-the-shelf components, except for the mounting/coupling unit, which was fabricated by ITRC. The mounting/coupling unit (that housed the load creator itself, held the motor, contained the shaft, etc.) presented most of the difficulty with alignment and accessibility challenges. The load creator consisted of these major components:
A closed circuit oil hydraulics piston pump that created the load An oil reservoir for the pump A heat exchanger (using a water radiator) to dissipate the heat generated in the oil A water filtration system for the heat exchanger The mounting/coupling unit
Figure D-11. Mounting/coupling unit
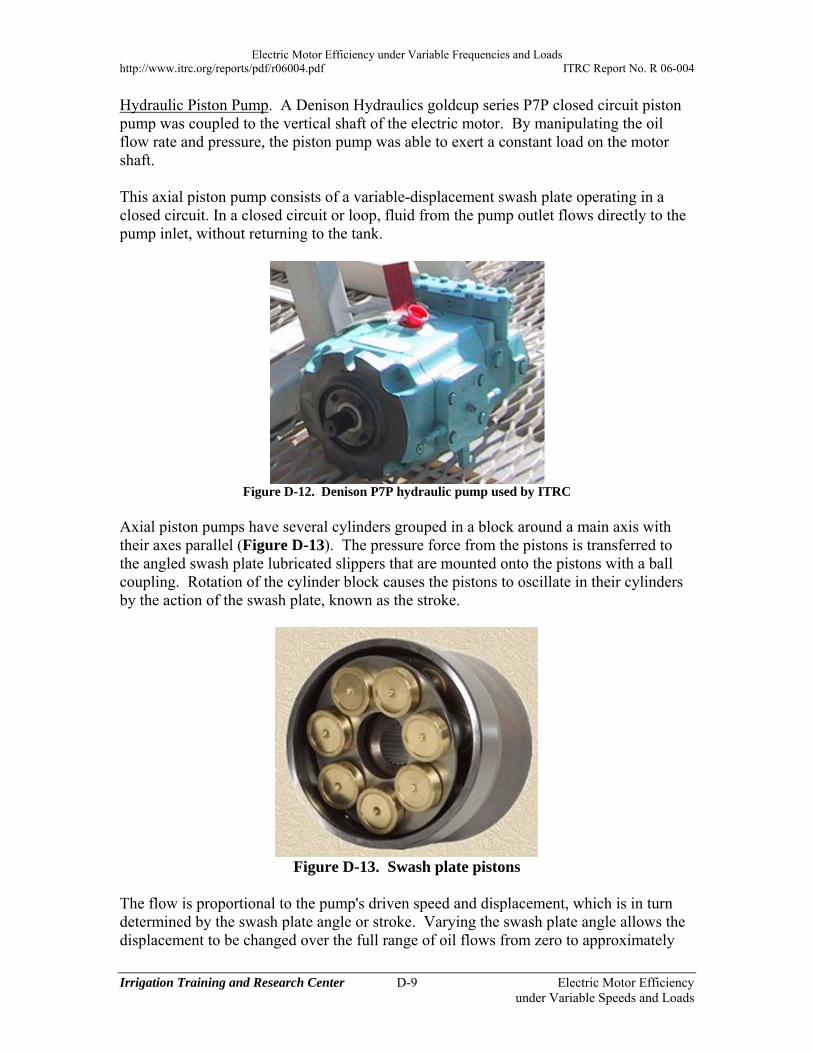
Electric Motor Efficiency under Variable Frequencies and Loads http://www.itrc.org/reports/pdf/r06004.pdf ITRC Report No. R 06-004
Irrigation Training and Research Center D-9 Electric Motor Efficiency under Variable Speeds and Loads
Hydraulic Piston Pump. A Denison Hydraulics goldcup series P7P closed circuit piston pump was coupled to the vertical shaft of the electric motor. By manipulating the oil flow rate and pressure, the piston pump was able to exert a constant load on the motor shaft. This axial piston pump consists of a variable-displacement swash plate operating in a closed circuit. In a closed circuit or loop, fluid from the pump outlet flows directly to the pump inlet, without returning to the tank.
Figure D-12. Denison P7P hydraulic pump used by ITRC
Axial piston pumps have several cylinders grouped in a block around a main axis with their axes parallel (Figure D-13). The pressure force from the pistons is transferred to the angled swash plate lubricated slippers that are mounted onto the pistons with a ball coupling. Rotation of the cylinder block causes the pistons to oscillate in their cylinders by the action of the swash plate, known as the stroke.
Figure D-13. Swash plate pistons
The flow is proportional to the pump's driven speed and displacement, which is in turn determined by the swash plate angle or stroke. Varying the swash plate angle allows the displacement to be changed over the full range of oil flows from zero to approximately
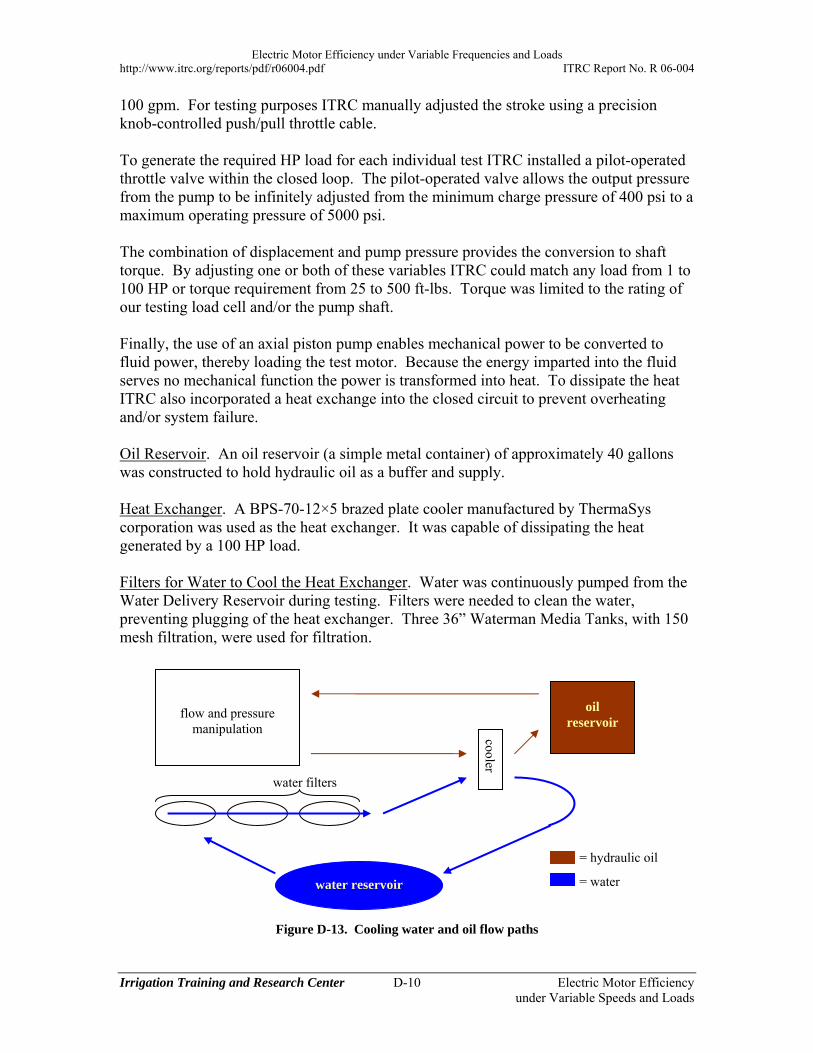
Electric Motor Efficiency under Variable Frequencies and Loads http://www.itrc.org/reports/pdf/r06004.pdf ITRC Report No. R 06-004
Irrigation Training and Research Center D-10 Electric Motor Efficiency under Variable Speeds and Loads
100 gpm. For testing purposes ITRC manually adjusted the stroke using a precision knob-controlled push/pull throttle cable. To generate the required HP load for each individual test ITRC installed a pilot-operated throttle valve within the closed loop. The pilot-operated valve allows the output pressure from the pump to be infinitely adjusted from the minimum charge pressure of 400 psi to a maximum operating pressure of 5000 psi. The combination of displacement and pump pressure provides the conversion to shaft torque. By adjusting one or both of these variables ITRC could match any load from 1 to 100 HP or torque requirement from 25 to 500 ft-lbs. Torque was limited to the rating of our testing load cell and/or the pump shaft. Finally, the use of an axial piston pump enables mechanical power to be converted to fluid power, thereby loading the test motor. Because the energy imparted into the fluid serves no mechanical function the power is transformed into heat. To dissipate the heat ITRC also incorporated a heat exchange into the closed circuit to prevent overheating and/or system failure. Oil Reservoir. An oil reservoir (a simple metal container) of approximately 40 gallons was constructed to hold hydraulic oil as a buffer and supply. Heat Exchanger. A BPS-70-12×5 brazed plate cooler manufactured by ThermaSys corporation was used as the heat exchanger. It was capable of dissipating the heat generated by a 100 HP load. Filters for Water to Cool the Heat Exchanger. Water was continuously pumped from the Water Delivery Reservoir during testing. Filters were needed to clean the water, preventing plugging of the heat exchanger. Three 36” Waterman Media Tanks, with 150 mesh filtration, were used for filtration.
Figure D-13. Cooling water and oil flow paths
water reservoir
oil reservoir
flow and pressure manipulation cooler
water filters
= hydraulic oil
= water
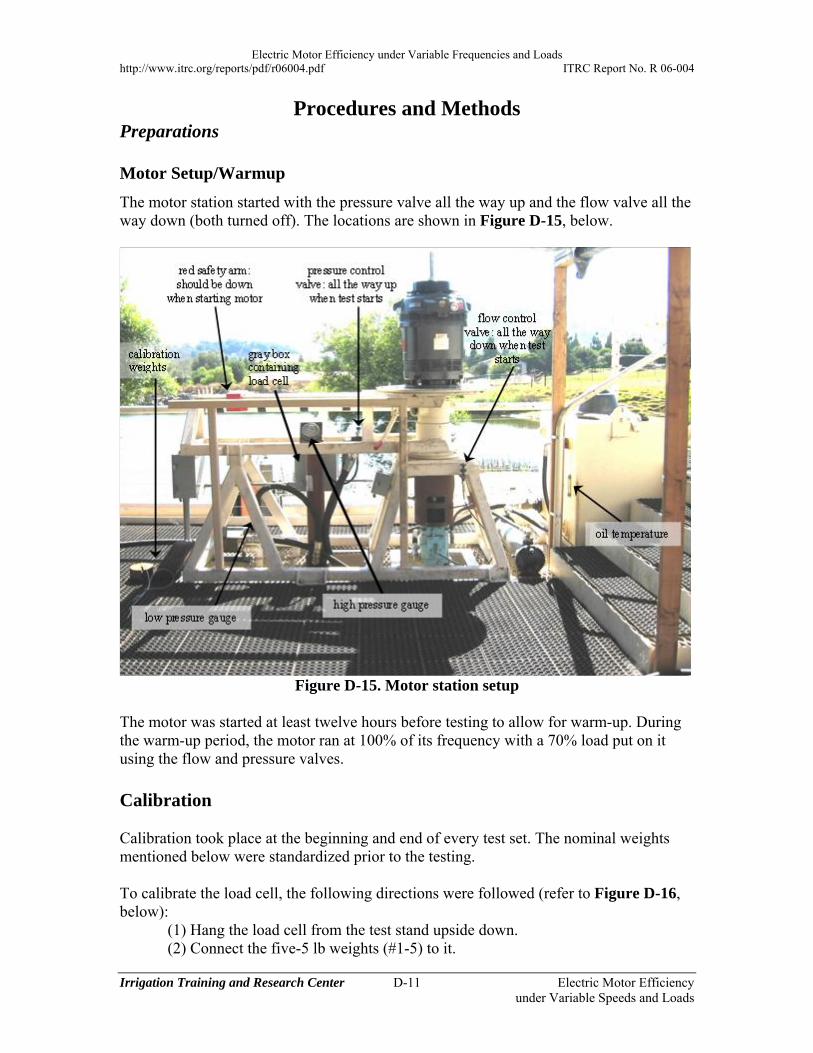
Electric Motor Efficiency under Variable Frequencies and Loads http://www.itrc.org/reports/pdf/r06004.pdf ITRC Report No. R 06-004
Irrigation Training and Research Center D-11 Electric Motor Efficiency under Variable Speeds and Loads
Procedures and Methods Preparations Motor Setup/Warmup
The motor station started with the pressure valve all the way up and the flow valve all the way down (both turned off). The locations are shown in Figure D-15, below.
Figure D-15. Motor station setup
The motor was started at least twelve hours before testing to allow for warm-up. During the warm-up period, the motor ran at 100% of its frequency with a 70% load put on it using the flow and pressure valves. Calibration Calibration took place at the beginning and end of every test set. The nominal weights mentioned below were standardized prior to the testing. To calibrate the load cell, the following directions were followed (refer to Figure D-16, below):
(1) Hang the load cell from the test stand upside down. (2) Connect the five-5 lb weights (#1-5) to it.
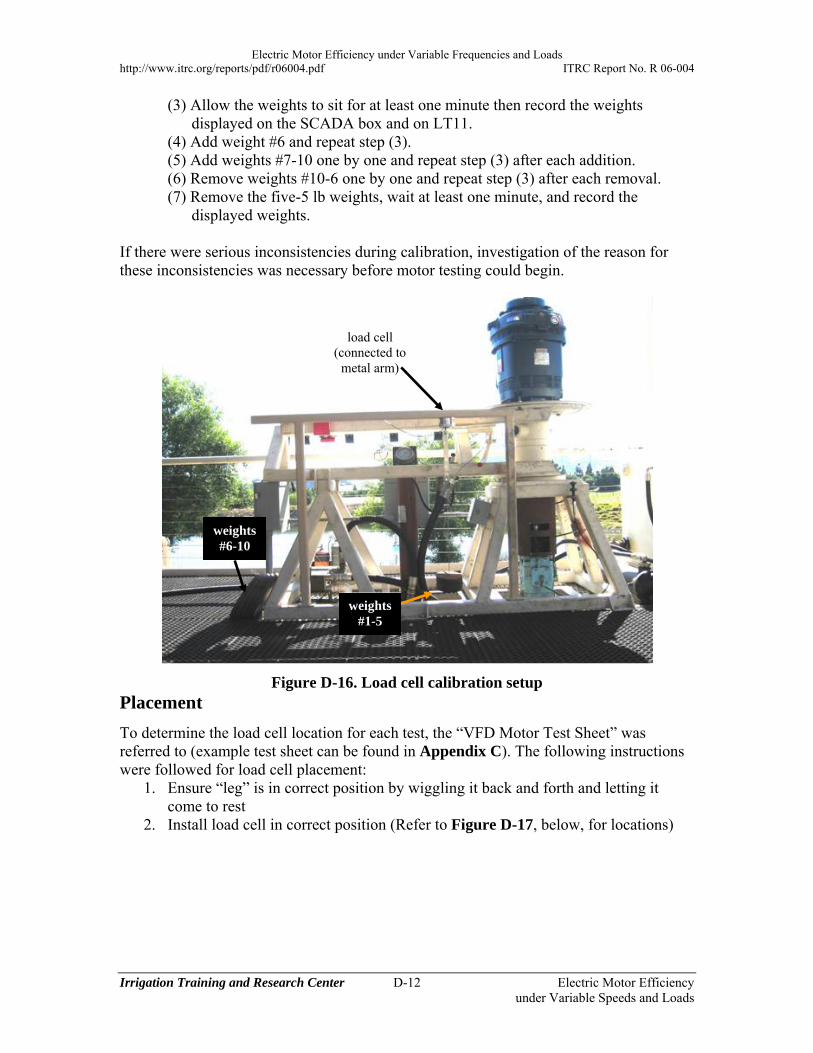
Electric Motor Efficiency under Variable Frequencies and Loads http://www.itrc.org/reports/pdf/r06004.pdf ITRC Report No. R 06-004
Irrigation Training and Research Center D-12 Electric Motor Efficiency under Variable Speeds and Loads
(3) Allow the weights to sit for at least one minute then record the weights displayed on the SCADA box and on LT11.
(4) Add weight #6 and repeat step (3). (5) Add weights #7-10 one by one and repeat step (3) after each addition. (6) Remove weights #10-6 one by one and repeat step (3) after each removal. (7) Remove the five-5 lb weights, wait at least one minute, and record the
displayed weights. If there were serious inconsistencies during calibration, investigation of the reason for these inconsistencies was necessary before motor testing could begin.
Figure D-16. Load cell calibration setup Placement
To determine the load cell location for each test, the “VFD Motor Test Sheet” was referred to (example test sheet can be found in Appendix C). The following instructions were followed for load cell placement:
1. Ensure “leg” is in correct position by wiggling it back and forth and letting it come to rest
2. Install load cell in correct position (Refer to Figure D-17, below, for locations)
weights #6-10
weights #1-5
load cell (connected to
metal arm)
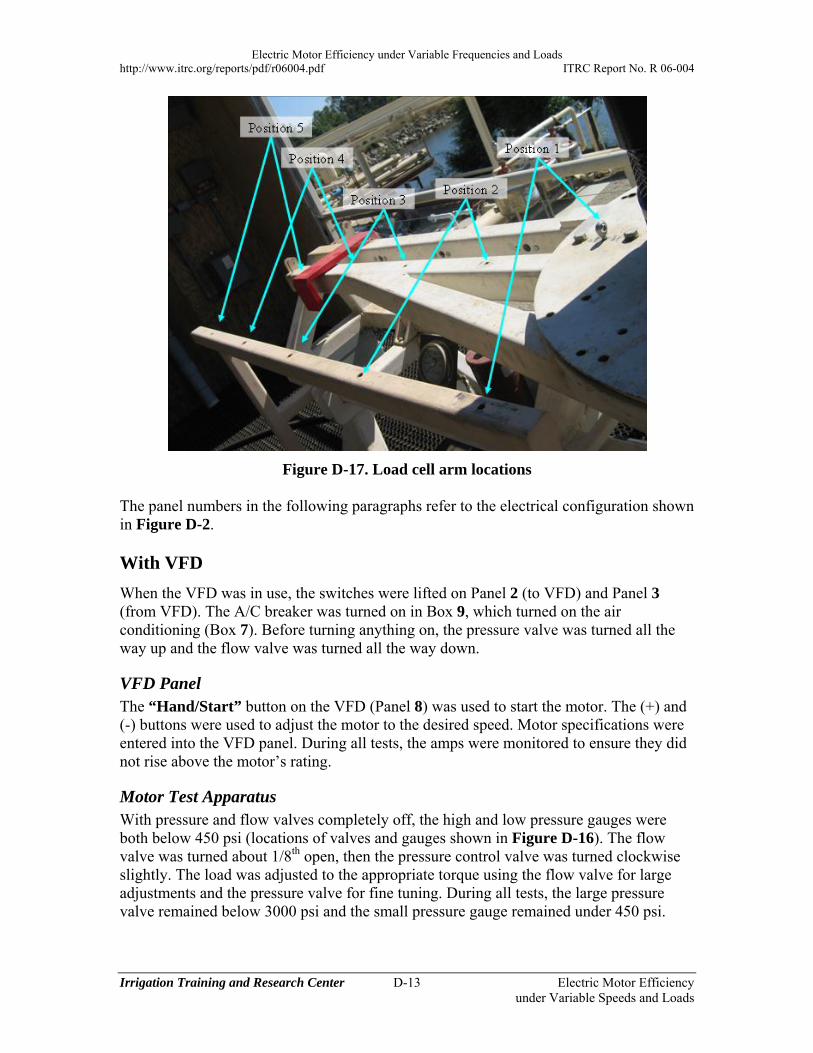
Electric Motor Efficiency under Variable Frequencies and Loads http://www.itrc.org/reports/pdf/r06004.pdf ITRC Report No. R 06-004
Irrigation Training and Research Center D-13 Electric Motor Efficiency under Variable Speeds and Loads
Figure D-17. Load cell arm locations The panel numbers in the following paragraphs refer to the electrical configuration shown in Figure D-2. With VFD
When the VFD was in use, the switches were lifted on Panel 2 (to VFD) and Panel 3 (from VFD). The A/C breaker was turned on in Box 9, which turned on the air conditioning (Box 7). Before turning anything on, the pressure valve was turned all the way up and the flow valve was turned all the way down.
VFD Panel The “Hand/Start” button on the VFD (Panel 8) was used to start the motor. The (+) and (-) buttons were used to adjust the motor to the desired speed. Motor specifications were entered into the VFD panel. During all tests, the amps were monitored to ensure they did not rise above the motor’s rating.
Motor Test Apparatus With pressure and flow valves completely off, the high and low pressure gauges were both below 450 psi (locations of valves and gauges shown in Figure D-16). The flow valve was turned about 1/8th open, then the pressure control valve was turned clockwise slightly. The load was adjusted to the appropriate torque using the flow valve for large adjustments and the pressure valve for fine tuning. During all tests, the large pressure valve remained below 3000 psi and the small pressure gauge remained under 450 psi.
Electric Motor Efficiency under Variable Frequencies and Loads http://www.itrc.org/reports/pdf/r06004.pdf ITRC Report No. R 06-004
Irrigation Training and Research Center D-14 Electric Motor Efficiency under Variable Speeds and Loads
Stopping the Motor Before the motor was stopped, the pressure valve was turned counter-clockwise (off) and the flow control valve was pushed all the way down (off). Then, the “Off/Stop” button in the VFD panel was pressed, stopping the motor. Bypassing VFD (Across-the-Line)
The switches were moved down on Panel 2 (to Manual) and Panel 3 (from Manual).
ALS Panel The disconnect switch was turned on, and then the HOA switch was set to Hand. The motor was then started.
Motor Test Apparatus With pressure and flow valves completely off, the high and low pressure gauges were both below 450 psi (locations of valves and gauges shown in Figure D-16). The flow valve was turned about 1/8th open, then the pressure control valve was turned clockwise slightly. The load was adjusted to the appropriate torque using the flow valve for large adjustments and the pressure valve for fine tuning. During all tests, the large pressure valve remained below 3000 psi and the small pressure gauge remained under 450 psi.
Stopping the Motor Before the motor was stopped, the pressure valve was turned counter-clockwise (off) and the flow control valve was pushing all the way down (off). Then, the HOA switch on the ALS was turned to “Off”. Data Collection
Data was collected for each motor running on the VFD at 40, 50, 60, 70, 80, 90, and 100% of the frequency. For each percent frequency, the load was set to 20, 40, 60, 80, and 100% of the maximum load. This gave 35 load cases for each motor on the VFD. However, if a motor reached maximum current, further tests at that frequency were cancelled. For across-the-line measurements, the motor was run with 20, 40, 60, 80, and 100% of the load (by nature, across-the-line measurements have 100% frequency). During each test, data was collected manually and automatically. Manually collected data was recorded onto a data collection sheet (refer to Appendix C for an example sheet). Automatically collected data was logged in the Lookout program. Manual and automatic recordings were tied together by recording the time on both. Two tests were run for each motor, back to back, starting in the morning. Both tests were completed on the same day. RPM RPMs were recorded automatically in the Lookout program after being verified with a manual, hand-held device. They were also recorded onto a data sheet used to verify automatically recorded data. Force
Electric Motor Efficiency under Variable Frequencies and Loads http://www.itrc.org/reports/pdf/r06004.pdf ITRC Report No. R 06-004
Irrigation Training and Research Center D-15 Electric Motor Efficiency under Variable Speeds and Loads
Force was recorded automatically in the Lookout program in pounds. The torque was then calculated in foot-pounds by multiplying the measured force by the load cell’s location. Shaft Load The shaft load was recorded from the SCADA display. It was recorded manually onto the data collection sheet. Amperage Amps were recorded automatically in the Lookout program and manually onto the data collection sheet. The manual recording was taken from the VFD panel. When the VFD panel was not in use (across-the-line measurements), the manual recording could not be made. If a percent-frequency reached maximum current, no more force readings were recorded (or attempted) for that frequency. Pressure Readings Low and high pressures were recorded to ensure that they were not too high. They were recorded manually onto the data collection sheet. For locations of low and high pressure gauges, refer to Figure D-15. Ok or Not/Comments For each test, the system was checked for overall performance (nothing sounding weird or seeming incorrect). Any comments about the test were also recorded onto the data collection sheet.