Embed Size (px)
Citation preview

Electric Electric Energy Energy
ResourcesResources
Chris NelsonChris NelsonCommissionerCommissioner
SD Public Utilities SD Public Utilities CommissionCommission
October 2012October 2012

The SD Public Utilities The SD Public Utilities CommissionCommission The Commissioners
Chris Nelson – Chairman Kristie Fiegen – Vice Chairman Gary Hanson – Commissioner
Staggered, six-year terms.
Staff of analysts, attorneys, consumer representatives and other professionals work with the Commissioners to carry out the duties of the PUC.

Utility RegulationUtility Regulation
Ensure safe, reliable service at fair and reasonable rates.
Regulate investor-owned electric, natural gas and telephone utilities.
Limited regulatory role: wireless communication companies and cooperative, independent and municipal utilities.

Electricity in South DakotaElectricity in South Dakota
Average Residential Electric Rates per kWh SD: 9.35 ¢ US: 11.4 ¢ Brookings
October through June: 7.0 ¢ July through September: 8.0 ¢
Rural SD 9.55 ¢

Demand and EnergyDemand and Energy
Energy = kWhDemand = kW

ElectricityElectricity DemandDemand

Member LoadMember Load
PeakingPeaking
SurplusSales
SurplusSales
TimeTime
Lo
ad
Combined CycleCombined Cycle
Base LoadGenerationBase LoadGeneration
Electric Load vs. Electric Load vs. GenerationGeneration

Wind EnergyWind Energy
Benefits Sustainable Environmentally-friendly Economic Development
LimitationsCostSubsidyIntermittencyGeneration profile vs. load needsLack of (cost-effective) storage mechanism

Inside a Wind TurbineInside a Wind Turbine

Wind PotentialWind Potential
SD ranks in the top 5 states


Total Bus Bar Costs in Total Bus Bar Costs in Cents/kWh Cents/kWh Total Bus Bar Costs in Total Bus Bar Costs in Cents/kWh Cents/kWh
11.111.19.79.7
7.77.7
12.812.8
6.36.3
Wind Turbine
Combined Cycle

Existing Coal Plants Existing Coal Plants (2010)(2010)

Crow Lake Project CostCrow Lake Project Cost$308 Million$308 Million
Basin Electric$124
Basin Electric$124
Tax Recovery$92
Tax Recovery$92
Grant$92
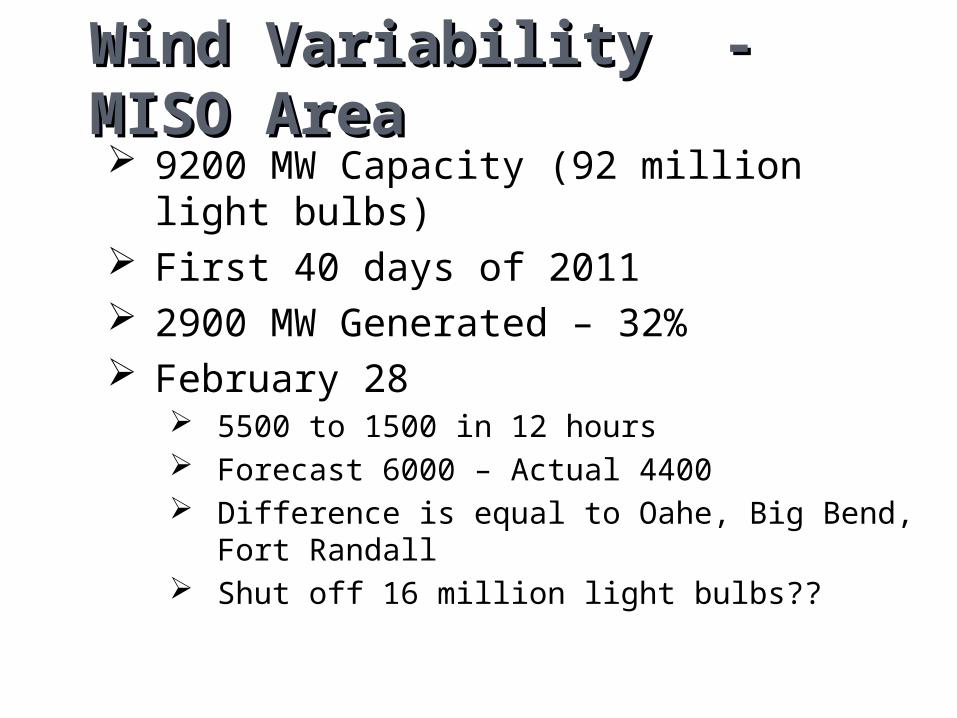
9200 MW Capacity (92 million light bulbs)
First 40 days of 2011 2900 MW Generated – 32% February 28
5500 to 1500 in 12 hours Forecast 6000 – Actual 4400 Difference is equal to Oahe, Big Bend, Fort
Randall Shut off 16 million light bulbs??
Wind Variability - Wind Variability - MISO AreaMISO Area

Wind GenerationWind GenerationApril 2010 Crow LakeApril 2010 Crow Lake

Generation Profile vs. Load ProfileGeneration Profile vs. Load Profile

Recent DevelopmentRecent Development Tatanka Wind Project – 88.5MW
McPherson County Wessington Springs Wind Project – 51MW
Jerauld County Buffalo Ridge I – 50.4MW
Brookings County Titan Wind Project – 25MW
Hand County Day County Wind Farm – 99MW
Day County Buffalo Ridge II – 210MW
Brookings and Deuel Counties PrairieWinds SD1 – 165MW
Jeruald, Aurora and Brule Counties

Successful Wind Successful Wind DevelopmentDevelopment 3 Ingredients for Success:
An excellent wind resource Transmission A buyer for the electricity


Hydroelectric PowerHydroelectric Power
Advantages Minimum pollution Low operations and maintenance costs Reliable and proven over time Renewable
Disadvantages High investment costs Can impact the environment and natural
habitats Large area of land needed, change in
elevation Reliability on rainfall - variable

Hydroelectric DamHydroelectric Dam


Hydroelectric Power in Hydroelectric Power in SDSD 55% of Electric Generation is Hydro Oahe Dam (1962) – 786 MW Big Bend Dam (1966) – 493 MW Fort Randall Dam (1956) – 320 MW Gavins Point Dam (1957) – 132 MW

New Hydro Missouri River Energy Services Red Rock Reservoir, Pella, Iowa 36 MW up to 55 MW
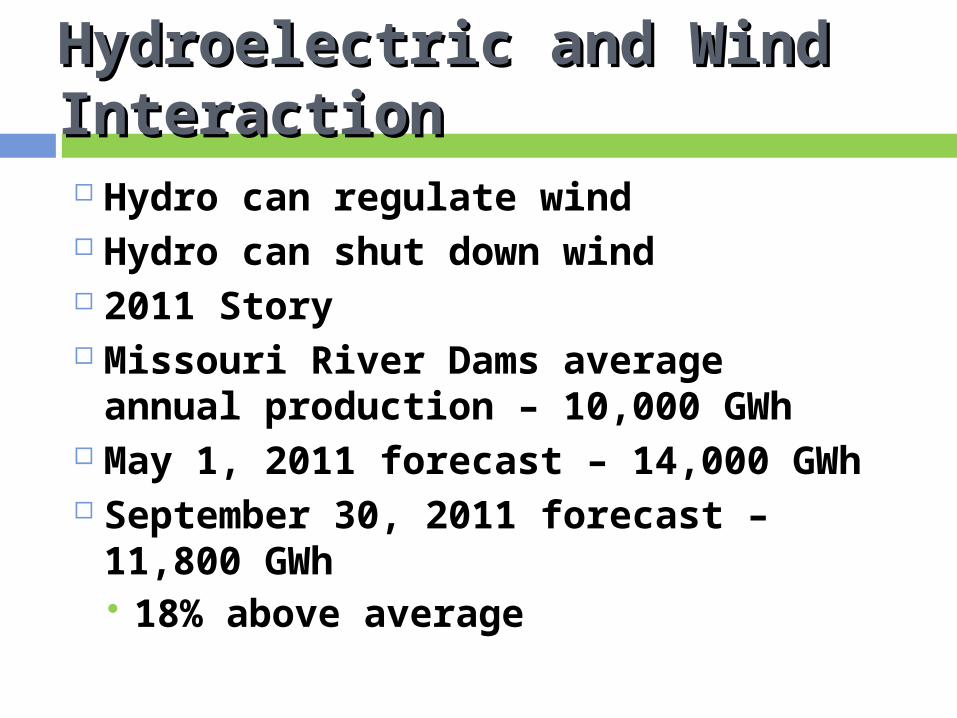
Hydroelectric and Wind Hydroelectric and Wind InteractionInteraction Hydro can regulate wind Hydro can shut down wind 2011 Story Missouri River Dams average
annual production – 10,000 GWh May 1, 2011 forecast – 14,000 GWh September 30, 2011 forecast –
11,800 GWh 18% above average

Solar PowerSolar Power
Advantages Renewable No pollution “Fuel” is free
DisadvantagesInitial CostsAmount of sunlight is not constant Current Issues Technologies and materials are changing
and getting cheaper Competition from China Solyndra

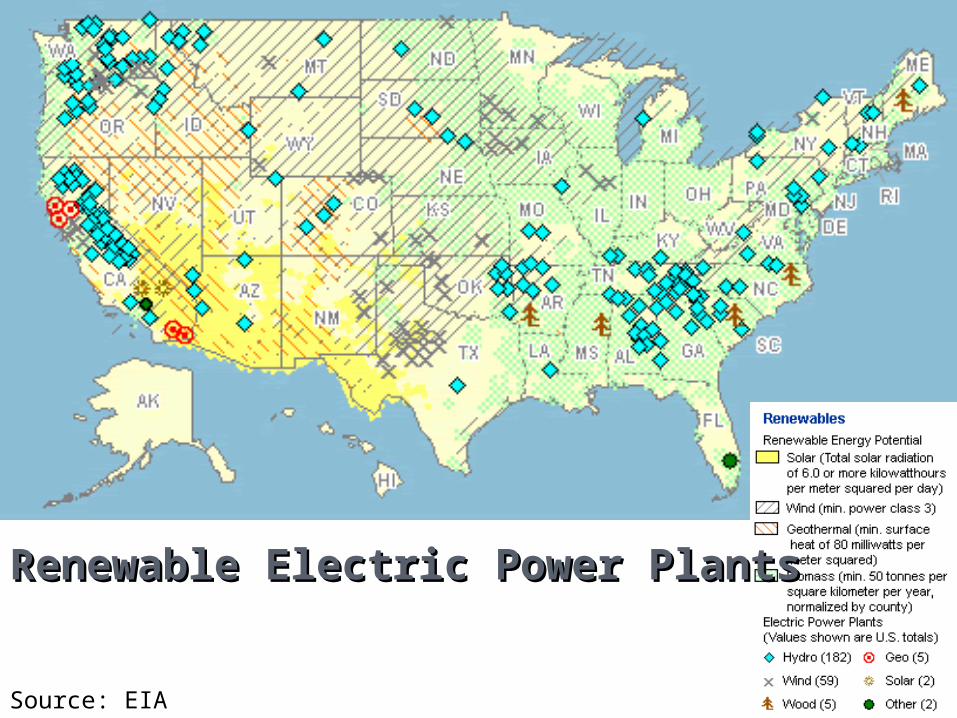
Source: EIA
Renewable Electric Power PlantsRenewable Electric Power Plants

Nuclear PowerNuclear Power
20% of electricity generated in US Most widely used fuel is uranium Advantages
Large amount of energy produced, No emissions Disadvantages
Safety concerns, waste storage, fuel limited, permits Nuclear Power Plants Serving SD
Xcel Energy 3 Nuclear Power Plants in MN
Fukushima, Japan Virginia Earthquake

Source: NRC
Nuclear Power PlantsNuclear Power Plants

Energy Resources Used in Energy Resources Used in SDSD

Energy Resources Generated Energy Resources Generated in SDin SD

Recent Siting DocketsRecent Siting Dockets
CapEx 2020 Power Line White, SD to Twin Cities
Future Siting Dockets White, SD to Big Stone Big Stone to Ellendale, ND

Which Resource is Best? Which Resource is Best?
Best Solution: A Mix of Generation Resources

Energy EfficiencyEnergy Efficiency
How can we Save Energy? No Cost Ways Low-Costs Ways Investments

Thanks for your Thanks for your Questions!Questions!
www.puc.sd.govwww.puc.sd.gov