Embed Size (px)
Citation preview

Electric dipole moments of atoms, molecules,nuclei, and particles
T. E. Chupp
Department of Physics, University of Michigan, Ann Arbor, Michigan 48109, USA
P. Fierlinger
Physik Department and Excellence-Cluster “Universe,” Technische Universitat Munchen,85748 Garching bei Munchen, Germany
M. J. Ramsey-Musolf
Amherst Center for Fundamental Interactions and Department of Physics,University of Massachusetts—Amherst, Amherst, Massachusetts 01003, USA
J. T. Singh
National Superconducting Cyclotron Laboratory and Department of Physics and Astronomy,Michigan State University, East Lansing, Michigan 48824, USA
(published 4 January 2019)
A permanent electric dipole moment (EDM) of a particle or system is a separation of charge along itsangular momentum axis and is a direct signal of T violation and, assuming CPT symmetry, CPviolation. For over 60 years EDMs have been studied, first as a signal of a parity-symmetry violationand then as a signal of CP violation that would clarify its role in nature and in theory. Contemporarymotivations include the role that CP violation plays in explaining the cosmological matter-antimatterasymmetry and the search for new physics. Experiments on a variety of systems have become ever-more sensitive, but provide only upper limits on EDMs, and theory at several scales is crucial tointerpret these limits. Nuclear theory provides connections from standard-model and beyond-standard-model physics to the observable EDMs, and atomic and molecular theory reveal howCP violation is manifest in these systems. EDM results in hadronic systems require that the standard-model QCD parameter of θmust be exceptionally small, which could be explained by the existence ofaxions, also a candidate dark-matter particle. Theoretical results on electroweak baryogenesis showthat new physics is needed to explain the dominance of matter in the Universe. Experimental andtheoretical efforts continue to expand with new ideas and new questions, and this review provides abroad overview of theoretical motivations and interpretations as well as details about experimentaltechniques, experiments, and prospects. The intent is to provide specifics and context as this excitingfield moves forward.
DOI: 10.1103/RevModPhys.91.015001
CONTENTS
I. Introduction 2A. Experimental landscape 4B. Theoretical interpretation 6C. Reach and complementarity 7D. EDMs and baryogenesis 7
II. Theoretical Background 9A. CP and T violation 9B. General framework 9C. Low-energy parameters 10D. EDMs in the standard model 11E. Beyond-standard-model physics 12F. From theory to experiment 16
1. Nucleons 162. Light nuclei 163. Paramagnetic systems 174. Diamagnetic atoms and molecules 17
III. Experimental Techniques 19A. Magnetic shielding 20
1. Cryogenic shields 21B. Magnetometers 22
1. Rb and Cs magnetometers 232. Nuclear-spin magnetometers: 3He and 199Hg 24
C. Magnetic-field-coil design and current sources 24D. Ultracold neutron sources 25
IV. Experiments 29A. The neutron 29
1. Neutron-EDM systematics 312. Neutron-EDM prospects 333. The PSI experiment 334. The PNPI-ILL-PNPI experiment 335. The FRM-II and PanEDM experiments 336. The LANL room-temperature EDM experiment 347. The TRIUMF and KEK experiment 348. The SNS experiment 34
REVIEWS OF MODERN PHYSICS, VOLUME 91, JANUARY–MARCH 2019
0034-6861=2019=91(1)=015001(55) 015001-1 © 2019 American Physical Society

9. Possible EDM experiments at the EuropeanSpallation Source 34
10. Crystal EDM 34B. Paramagnetic atoms: Cs and Tl 35
1. Prospects for alkali-metal atoms 35C. Paramagnetic polar molecules: YbF, ThO,
and 180Hf19Fþ 36D. Solid-state systems 38E. Diamagnetic atoms and molecules 39
1. Xenon 392. Mercury 393. TlF 40
F. Octupole collectivity in diamagnetic systems 401. 225Ra 412. 221=223Rn 42
G. Storage-ring EDMs 43V. Interpretations of Current and Prospective Experiments 46
A. Sole source 46B. Global analysis 46
1. Paramagnetic systems: Limits on de and CS 462. Hadronic parameters and CT 47
VI. Summary and Conclusions 49Acknowledgments 49References 49
I. INTRODUCTION
The measurement and interpretation of permanent electricdipole moments (EDMs) of particles and quantum systemshave been a unique window into the nature of elementaryparticle interactions from the very first proposal of Purcell andRamsey (1950) to search for a neutron EDM as a signal ofparity-symmetry (P) violation. The neutron EDM was notobserved then or since, and we now recognize, as pointed outby Lee and Yang (1957) and Landau (1957a, 1957b), thatEDMs also violate time-reversal symmetry (T). An EDM is adirect signal of T violation, and CPT symmetry (C is chargeconjugation), required of any relativistic field theory (Tureanu,2013), therefore implies that observation of a nonzero P-oddand T-odd EDM is also a signal of CP violation. EDMs havebecome a major focus of contemporary research for severalinterconnected reasons:
(i) EDMs provide a direct experimental probe of CPviolation, a feature of the standard-model (SM) andbeyond-standard-model (BSM) physics;
(ii) the P-violating and T-violating EDM signals dis-tinguish the much weaker CP-violating interactionsfrom the dominant strong and electromagneticinteractions;
(iii) CP violation is a required component of Sakharov’srecipe (Sakharov, 1967) for the baryon asymmetry,the fact that there is more matter than antimatter inthe Universe; however SM CP violation cannotproduce the observed asymmetry, and new CP-violating interactions are required.
The EDM of a system d must be parallel (or antiparallel) tothe average angular momentum of the system ℏhJi. Thus,relative to the center of mass (r ¼ 0),
d ¼Z
rρQd3r ¼ dhJiJ
; ð1Þ
where ρQ is the electric-charge distribution. This is analagousto the magnetic dipole moment (Ramsey, 1956)
μ ¼ 1
2
Zr × JQd3r ¼ μ
hJiJ
; ð2Þ
where JQ is the current density. For a neutral system, e.g., the
neutron, d can be considered a separation of equal charges;
however, for a system with charge Q ≠ 0, d=Q ¼ rQ is thecenter of charge with respect to the center of mass.The interaction of a fermion with magnetic moment μ and
EDM d with electric and magnetic fields can be written
LEM ¼ −μ
2ΨσμνFμνΨ − i
d2Ψσμνγ5FμνΨ; ð3Þ
where Ψ is the fermion field, and Fμν ¼ ∂μAν − ∂νAμ is theelectromagnetic field tensor with Aμ the four-vector electro-magnetic potential. The second term of Eq. (3), first writtendown in this way by Salpeter (1958)1 in analogy to theanomalous magnetic-moment term, reveals parity and time-reversal violation in the Dirac matrix γ5 and the imaginarynumber i, respectively. The corresponding nonrelativisticHamiltonian for a quantum system is
H ¼ −ðμ · Bþ d · EÞ ¼ −ðμJ · Bþ dJ · EÞ=J: ð4Þ
The magnetic field B and the angular momentum operator Jare both even under P but odd under T, while the electric fieldE is odd under P but even under T. The second term,proportional to J · E, is thus P odd and T odd and a directsignal of CP violation assuming CPT invariance.A common approach to measuring an EDM is to apply a
strong electric field and a very well-controlled and charac-terized magnetic field and to measure the shift in the energy, ormore commonly the frequency, of the splitting betweenmagnetic sublevels when E is changed. For a system withtotal angular momentum ℏJ, the EDM frequency shift for twoadjacent levels (jΔmJj ¼ 1) is
jΔωj ¼ jdEjℏJ
: ð5Þ
The precision of a single frequency measurement dependson the interrogation time τ and the signal-to-noise ratio (SNR)for the measurement. The SNR depends on the specifics ofthe technique. For a count-rate-limited experiment with Nparticles measured or interrogated in a single measurementSNR ∝
ffiffiffiffiN
p, and the statistical uncertainty of a single
frequency measurement is given by σω ¼ 1=τffiffiffiffiN
p. In
phase-noise-limited experiments, for example, those using asuperconducting quantum interference device (SQUID)
1In his paper “The Quantum Theory of the Electron,” Dirac (1928)revealed the purely imaginary coupling of the electric field to anelectric moment. This was considered, at the time, unphysicalbecause it was derived from a real Hamiltonian.
Chupp et al.: Electric dipole moments of atoms, molecules, …
Rev. Mod. Phys., Vol. 91, No. 1, January–March 2019 015001-2
magnetometer, the statistical uncertainty of a single frequencymeasurement for constant signal and SNR is given by σω ¼ffiffiffiffiffi12
p=ðτ½SNR�Þ (Chupp et al., 1994; Chibane et al., 1995),
where SNR generally increases asffiffiffiτ
p. The EDM sensitivity
for a pair of frequency measurements with opposite electricfield each lasting a time τ therefore scales as
σd ≳ ℏJE
1ffiffiffiffiffiffiffi2N
p τ−1 ðcountingÞ;
σd ≳ ℏJE
ffiffiffi3
π
rvnV0
τ−3=2 ðphase noiseÞ: ð6Þ
Here V0 is the signal size and vnffiffiffiffiB
pis the noise in a
bandwidth B ¼ 1=ð2πτÞ, with B in Hz.The experimental challenges are to have the largest possible
electric field magnitude E, the longest possible τ, and thehighest possible N or V0=vn. Additionally an ideally small,
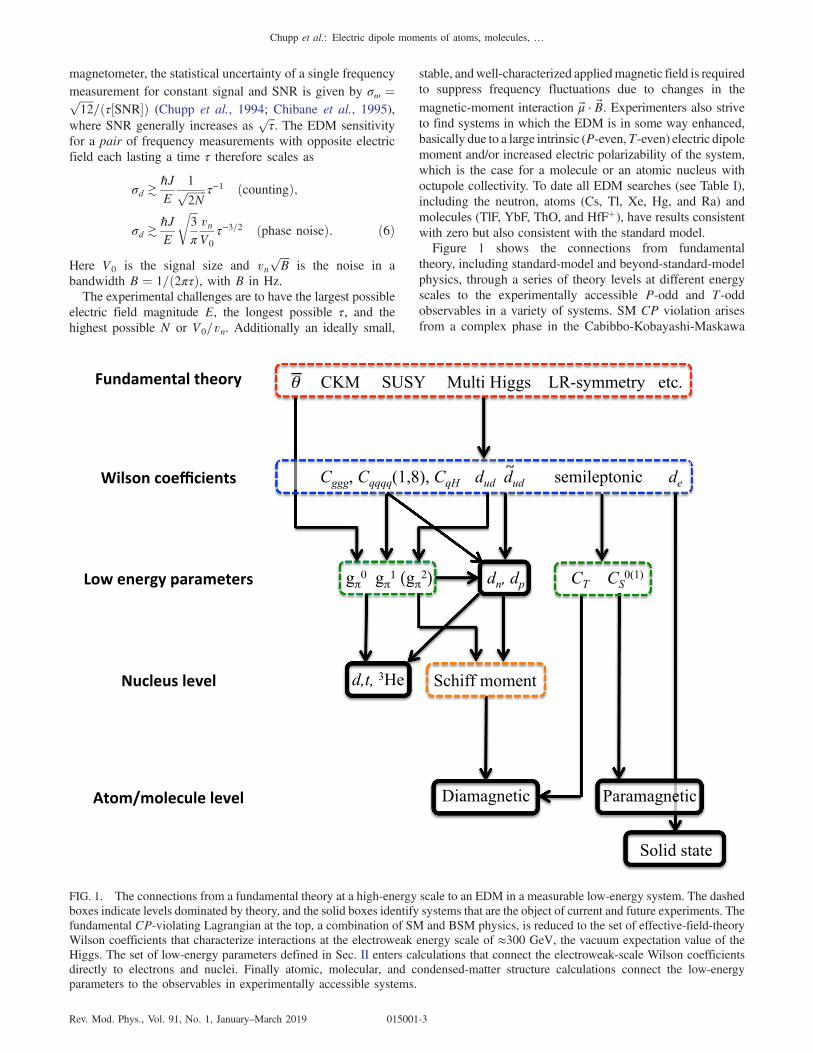
stable, andwell-characterized appliedmagnetic field is requiredto suppress frequency fluctuations due to changes in themagnetic-moment interaction μ · B. Experimenters also striveto find systems in which the EDM is in some way enhanced,basically due to a large intrinsic (P-even,T-even) electric dipolemoment and/or increased electric polarizability of the system,which is the case for a molecule or an atomic nucleus withoctupole collectivity. To date all EDM searches (see Table I),including the neutron, atoms (Cs, Tl, Xe, Hg, and Ra) andmolecules (TlF, YbF, ThO, and HfFþ), have results consistentwith zero but also consistent with the standard model.Figure 1 shows the connections from fundamental
theory, including standard-model and beyond-standard-modelphysics, through a series of theory levels at different energyscales to the experimentally accessible P-odd and T-oddobservables in a variety of systems. SM CP violation arisesfrom a complex phase in the Cabibbo-Kobayashi-Maskawa
FIG. 1. The connections from a fundamental theory at a high-energy scale to an EDM in a measurable low-energy system. The dashedboxes indicate levels dominated by theory, and the solid boxes identify systems that are the object of current and future experiments. Thefundamental CP-violating Lagrangian at the top, a combination of SM and BSM physics, is reduced to the set of effective-field-theoryWilson coefficients that characterize interactions at the electroweak energy scale of ≈300 GeV, the vacuum expectation value of theHiggs. The set of low-energy parameters defined in Sec. II enters calculations that connect the electroweak-scale Wilson coefficientsdirectly to electrons and nuclei. Finally atomic, molecular, and condensed-matter structure calculations connect the low-energyparameters to the observables in experimentally accessible systems.
Chupp et al.: Electric dipole moments of atoms, molecules, …
Rev. Mod. Phys., Vol. 91, No. 1, January–March 2019 015001-3
(CKM) matrix parametrizing the weak interaction (Kobayashiand Maskawa, 1973) and in the gluon GG contribution to thestrong interaction, which is proportional to the parameter θ(Callan, Dashen, and Gross, 1976; Jackiw and Rebbi, 1976; ’tHooft, 1976). TheCKMcontribution to anyobservable EDMismany orders of magnitude smaller than current upper limits,providing a window of opportunity for discovering EDMs thatarise from a nonzero θ or BSM physics. In contrast to CKMCP violation, contributions of BSM physics need not besuppressed unless the CP-violating parameters themselvesare small or the mass scales are high. New BSM interactionsare also required for baryogenesis to account for the cosmicmatter-antimatter asymmetry. EDMs provide a particularlyimportant connection to baryogenesis if the CP-violationenergy scale is not too high compared to the scale ofelectroweak symmetry breaking, and if the responsibleP-odd and T-odd interactions are flavor diagonal (Morrisseyand Ramsey-Musolf, 2012).This review is intended as a broad summary of how EDM
experiment and theory have reached this point and how theywill progress. To do so the motivations and impact of EDMmeasurements along with a context for interpreting the resultsin terms of a set of P-odd and T-odd low-energy parametersare presented in Sec. II. State-of-the art experimental tech-niques and improvements that will drive progress are presentedin some detail in Sec. III, followed by a review of the currentstatus of all experiments and prospects for new and improvedapproaches. The interpretation of these experiments and theimpact of improvements in the context of the low-energy theoryparameters are presented in Sec. V. The conclusions emphasizewhat will be necessary from both theory and experiment forcontinued progress and, perhaps, the discovery of an EDM.We also draw attention to a partial list of important and
classic reviews that include or are fully devoted to EDMs andprovide a number of different perspectives as well as thehistory of the motivations and context: Garwin and Lederman(1959), Shapiro (1968), Sandars (1975, 1993, 2001), Ramsey(1982, 1990a), Barr and Marciano (1989), Bernreuther andSuzuki (1991, 1992), Commins (1993, 1999, 2007), Goluband Lamoreaux (1994), Khriplovich and Lamoreaux (1997),Ginges and Flambaum (2004), Pospelov and Ritz (2005),Roberts and Marciano (2009), Chupp (2010), Dubbers andSchmidt (2011), Fukuyama (2012), Engel, Ramsey-Musolf,and van Kolck (2013), Roberts, Dzuba, and Flambaum(2015), and Yamanaka et al. (2017).
A. Experimental landscape
The neutron was the objective of the early direct EDMmeasurements of Smith, Purcell, and Ramsey due to thereasoning that it was a neutral hadronic (weakly interacting)system and would not be accelerated from the measurementregion by a large static electric field (Purcell and Ramsey,1950; Smith, Purcell, and Ramsey, 1957). The early neutron-EDM measurements (Miller et al., 1967; Baird et al., 1969;Cohen et al., 1969) culminating in the measurement reportedby Dress et al. (1977) used molecular-beam techniquesdeveloped to measure the neutron magnetic moment. Thislimited the observation time for a neutron transiting a meter-
scale apparatus to milliseconds, resulting in linewidths ofhundreds of Hz or more. The beam approach also hadsignificant limitations due to a number of systematic effects,including the interaction of the neutron magnetic moment withthe motional magnetic field (E × v=c2) and leakage currents,both of which shifted the energy when the electric field waschanged. By 1980 advances in ultracold neutron (UCN)production at Leningrad Nuclear Physics Institute (LNPI)(Altarev et al., 1980, 1981) and at the Institute Laue-Langevin(ILL) in Grenoble, France (Smith et al., 1990) enabled the firstEDM measurements with neutrons stored in a “cell.” Themuch smaller UCN speeds and the nearly zero averagevelocity mitigated the motional effects, leading to a seriesof increasingly precise neutron-EDM measurements, whichare discussed in Sec. IV.A. As the rate of UCN productionimproved, leading to smaller statistical errors, the control ofthe magnetic field required advances in magnetic shieldingand magnetometry discussed in Sec. III. Comagnetometry (theuse of a second species less sensitive to CP violation but witha similar magnetic moment in the same measurement volumeand at the same time) mitigated magnetic-field instability anda number of systematic effects. The neutron-EDM experi-ments are rate and statistics limited with typically only a fewthousand UCN per measurement cycle, and advances requirenew UCN sources, which are discussed in detail in Sec. III.D,and corresponding improvements to magnetic shielding,magnetometry, and understanding of systematic effects.The earliest limits on proton and electron EDMs were
established by studies of corrections to the Lamb shift inhydrogen, respectively, by Sternheimer (1959) and bySalpeter (1958) and Feinberg (1958). Limits on the protonEDM were also set by analyzing the out-of-plane componentof the proton spin polarization in a scattering asymmetryexperiment from a carbon target (Rose, 1960). Electron-EDMlimits were derived from frequency shifts in electron para-magnetic resonance (Royce and Bloembergen, 1963), anoma-lous magnetic-moment (g − 2) measurements (Nelson et al.,1959; Wilkinson and Crane, 1963), and scattering measure-ments with spin-zero targets (Margolis, Rosendorff, and Sirlin,1959) of helium (Avakov and Ter-Martirosyan, 1959; Burlesonand Kendall, 1960; Goldemberg and Torizuka, 1963) andcarbon (Rand, 1965). An early limit on the EDM of the muonwas derived from analyzing the vertical component of themuon spin polarization of the Nevis Cyclotron and fringefields, by the measuring asymmetry of the muon decayelectrons (Berley et al., 1958a, 1958b; Berley and Gidal,1960; Charpak et al., 1961).Starting in the 1960s, experimenters turned their attention
to stable atoms and molecule beams in early beam experi-ments pioneered by Sandars and Lipworth (1964). It wasrecognized that these systems provided a rich set of possiblecontributions to the P-odd and T-odd observables, but thecharged constituents, the electron and nucleus, are signifi-cantly shielded from the large external field by the polariza-tion of the atom. This is embodied in Schiff’s theorem (Schiff,1963), which states that for a bound system of pointlikecharged particles the net force and the net electric field at theposition of each charged particle are exactly zero. Theshielding is not perfect for a nucleus of finite size and in
Chupp et al.: Electric dipole moments of atoms, molecules, …
Rev. Mod. Phys., Vol. 91, No. 1, January–March 2019 015001-4

the case of unpaired electrons (paramagnetic systems) due torelativistic effects. In fact for paramagnetic atoms there is aneffective enhancement of the sensitivity to an electron EDMthat is approximately 10Z3α2 as explained by Sandars (1965,1966, 1968a, 1968b), Ignatovich (1969), and Commins,Jackson, and DeMille (2007). Moreover, an atomic EDMcan arise due to T and P violation in the electron-nucleusinteraction that may have a scalar or tensor nature, and theseeffects also increase with Z.Paramagnetic systems with one or more unpaired electrons
(Cs, Tl, YbF, ThO, HfFþ, etc.) are most sensitive to both theelectron EDM de and the nuclear-spin-independent componentof the electron-nucleus coupling (CS), which are likely to beseveral orders of magnitude stronger than tensor and pseudo-scalar contributions, given comparable strength of the intrinsiccouplings (Ginges and Flambaum, 2004). Diamagnetic sys-tems, including 129Xe, 199Hg, and 225Ra atoms, and themoleculeTlF are most sensitive to purely hadronic CP-violating sourcesthat couple through the Schiff moment S, the r2-weightedelectric dipole charge distribution for a nucleus with Z protons,
S ¼ 1
10
Zr2rρQd3r −
1
6Z
Zr2d3r
ZrρQd3r: ð7Þ
The EDM of the nucleusRrρQd3r ¼ dN is unobservable in a
neutral atom and the second term is therefore subtracted from S.FlambaumandGinges (2002) showed that an effectivemodel ofthe Schiff moment is a constant electric field with the nucleusdirected along the nuclear spin,which is probed by the atomic ormolecular electrons through the interaction
H ¼ −4π∇ρeð0Þ · S; ð8Þwhere ∇ρeð0Þ is the gradient of the electron density at thenucleus. As the atomic electrons penetrate the nucleus, theSchiff moment electric force moves the electron cloud withrespect to the atom’s center of mass and induces an EDM alongthe spin.2 In addition, the EDM of a diamagnetic atom ormolecule can arise due to the tensor component of the electron-nucleus coupling CT for atoms and molecules. The electronEDM and CS contribute to the EDM of diamagnetic atoms inhigher order. Themagnetic quadrupolemoment, aP-odd andT-odd distribution of currents in the nucleus, is not shielded in thesame way as electric moments and induces an atomic EDM bycoupling to an unpaired electron (Sushkov, Flambaum, andKhriplovich, 1984). Themagnetic quadrupolemoment requiresa paramagnetic atom with nuclear spin I > 1=2, and cesium isthe only experimental system so far that meets these require-ments. Murthy et al. (1989) presented an analysis of theirexperiment on cesium that extracts the magnetic quadrupolemoment.EDM searches are not confined to neutral systems.
Charged particles and ions can be contained in storage ringsor with time-dependent fields. For example, the paramagneticmolecular ion HfFþ was stored with a rotating electric field
(Cairncross et al., 2017), and the EDM of the muon wasmeasured in conjunction with the g − 2, magnetic-momentanomaly measurements at Brookhaven National Lab (Bennettet al., 2006). In the muon experiment, spin precession due tothe EDM coupling to the motional electric field (v × B) wasmeasured, and an upper limit ondμwas reported (Bennett et al.,2009). Although not a dedicated EDM measurement, thetechnique demonstrated the possibility of a significantlyimproved measurement, which is motivated by theoreticalsuggestions that lepton EDMs may scale with a power ofthe lepton mass (Babu, Barr, and Dorsner, 2001). Storage-ring EDM searches have also been proposed for light nuclei,i.e., the proton, deuteron, and helion (3Heþþ) (Khriplovich,1998; Farley et al., 2004; Rathmann, Saleev, and Nikolaev,2013). The electron EDM can also be measured in specialferroelectric and paramagnetic solid-state systems withquasifree electron spins that can be subjected to applied electricand magnetic fields (Eckel, Sushkov, and Lamoreaux, 2012).We also note that the EDM of theΛ hyperon was measured in aspin-precession measurement (Pondrom et al., 1981), and thatlimits on the τ lepton EDM (Inami et al., 2003) and on neutrinoEDMs have been derived (Commins, 1999, 2007).A compilation of experimental results is presented in Table I,
which separates paramagnetic (electron-spin-dependent) systems
TABLE I. Systems with EDM results and the most recent results aspresented. When de is presented, the assumption is CS ¼ 0, andfor ThO, theCS result assumes de ¼ 0.Qm is the magnetic quadrupolemoment, which requires a paramagnetic atom with nuclear spinI > 1=2. (μN and RCs are the nuclear magneton and the nuclear radiusof 133Cs, respectively.) We have combined statistical and systematicerrors in quadrature for cases where they are separately reported by theexperimenters. References: (a) Player and Sandars (1970); (b) Murthyet al. (1989); (c)Regan et al. (2002); (d)Hudson et al. (2011); (e)Baronet al. (2014); (f) Cairncross et al. (2017); (g) Graner et al. (2017);h Rosenberry (2001); (i) Parker et al. (2015); (j) Cho, Sangster, andHinds (1991); (k) Pendlebury et al. (2015); (l) Bennett et al. (2009);(m) Inami et al. (2003); and (n) Pondrom et al. (1981).
Result 95% u.l. Ref.
Paramagnetic systemsXem dA ¼ ð0.7� 1.4Þ × 10−22 3.1 × 10⁻²² e cm (a)Cs dA ¼ ð−1.8� 6.9Þ × 10−24 1.4 × 10⁻²³ e cm (b)
de ¼ ð−1.5� 5.7Þ × 10−26 1.2 × 10⁻²⁵ e cmCS ¼ ð2.5� 9.8Þ × 10−6 2 × 10⁻⁵
Qm ¼ ð3� 13Þ × 10−8 2.6 × 10⁻⁷ μN RCsTl dA ¼ ð−4.0� 4.3Þ × 10−25 1.1 × 10⁻²⁴ e cm (c)
de ¼ ð6.9� 7.4Þ × 10−28 1.9 × 10⁻²⁷ e cmYbF de ¼ ð−2.4� 5.9Þ × 10−28 1.2 × 10⁻²⁷ e cm (d)ThO de ¼ ð−2.1� 4.5Þ × 10−29 9.7 × 10⁻²⁹ e cm (e)
CS ¼ ð−1.3� 3.0Þ × 10−9 6.4 × 10⁻⁹
HfFþ de ¼ ð0.9� 7.9Þ × 10−29 1.6 × 10⁻²⁸ e cm (f)
Diamagnetic systems199Hg dA ¼ ð2.2� 3.1Þ × 10−30 7.4 × 10⁻³⁰ e cm (g)129Xe dA ¼ ð0.7� 3.3Þ × 10−27 6.6 × 10⁻²⁷ e cm (h)225Ra dA ¼ ð4� 6Þ × 10−24 1.4 × 10⁻²³ e cm (i)TlF d ¼ ð−1.7� 2.9Þ × 10−23 6.5 × 10⁻²³ e cm (j)n dn ¼ ð−0.21� 1.82Þ × 10−26 3.6 × 10⁻²⁶ e cm (k)
Particle systemsμ dμ ¼ ð0.0� 0.9Þ × 10−19 1.8 × 10⁻¹⁹ e cm (l)τ ReðdτÞ¼ ð1.15�1.70Þ×10−17 3.9 × 10⁻¹⁷ e cm (m)Λ dΛ ¼ ð−3.0� 7.4Þ × 10−17 1.6 × 10⁻¹⁶ e cm (n)
2We note that Schiff’s theorem has been recently reevaluated inwork showing that these formulas may be unjustified approximations(Liu et al., 2007); however, there is disagreement on the validity ofthis reformulation (Sen’kov et al., 2008).
Chupp et al.: Electric dipole moments of atoms, molecules, …
Rev. Mod. Phys., Vol. 91, No. 1, January–March 2019 015001-5
from diamagnetic (nuclear and nucleon spin-dependent) sys-tems. In order to cast all results consistently, we expressed theupper limits (u.l.) at 95% confidence levels.3
B. Theoretical interpretation
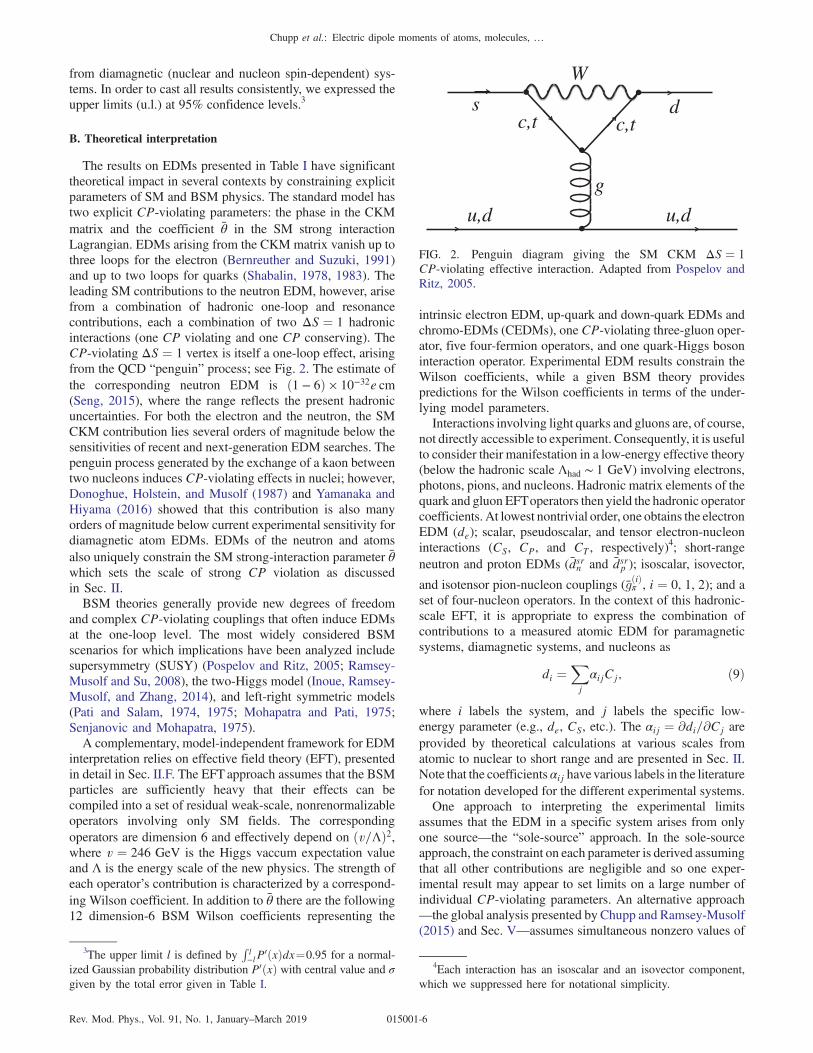
The results on EDMs presented in Table I have significanttheoretical impact in several contexts by constraining explicitparameters of SM and BSM physics. The standard model hastwo explicit CP-violating parameters: the phase in the CKMmatrix and the coefficient θ in the SM strong interactionLagrangian. EDMs arising from the CKM matrix vanish up tothree loops for the electron (Bernreuther and Suzuki, 1991)and up to two loops for quarks (Shabalin, 1978, 1983). Theleading SM contributions to the neutron EDM, however, arisefrom a combination of hadronic one-loop and resonancecontributions, each a combination of two ΔS ¼ 1 hadronicinteractions (one CP violating and one CP conserving). TheCP-violating ΔS ¼ 1 vertex is itself a one-loop effect, arisingfrom the QCD “penguin” process; see Fig. 2. The estimate ofthe corresponding neutron EDM is ð1 − 6Þ × 10−32e cm(Seng, 2015), where the range reflects the present hadronicuncertainties. For both the electron and the neutron, the SMCKM contribution lies several orders of magnitude below thesensitivities of recent and next-generation EDM searches. Thepenguin process generated by the exchange of a kaon betweentwo nucleons induces CP-violating effects in nuclei; however,Donoghue, Holstein, and Musolf (1987) and Yamanaka andHiyama (2016) showed that this contribution is also manyorders of magnitude below current experimental sensitivity fordiamagnetic atom EDMs. EDMs of the neutron and atomsalso uniquely constrain the SM strong-interaction parameter θwhich sets the scale of strong CP violation as discussedin Sec. II.BSM theories generally provide new degrees of freedom
and complex CP-violating couplings that often induce EDMsat the one-loop level. The most widely considered BSMscenarios for which implications have been analyzed includesupersymmetry (SUSY) (Pospelov and Ritz, 2005; Ramsey-Musolf and Su, 2008), the two-Higgs model (Inoue, Ramsey-Musolf, and Zhang, 2014), and left-right symmetric models(Pati and Salam, 1974, 1975; Mohapatra and Pati, 1975;Senjanovic and Mohapatra, 1975).A complementary, model-independent framework for EDM
interpretation relies on effective field theory (EFT), presentedin detail in Sec. II.F. The EFT approach assumes that the BSMparticles are sufficiently heavy that their effects can becompiled into a set of residual weak-scale, nonrenormalizableoperators involving only SM fields. The correspondingoperators are dimension 6 and effectively depend on ðv=ΛÞ2,where v ¼ 246 GeV is the Higgs vaccum expectation valueand Λ is the energy scale of the new physics. The strength ofeach operator’s contribution is characterized by a correspond-ing Wilson coefficient. In addition to θ there are the following12 dimension-6 BSM Wilson coefficients representing the
intrinsic electron EDM, up-quark and down-quark EDMs andchromo-EDMs (CEDMs), one CP-violating three-gluon oper-ator, five four-fermion operators, and one quark-Higgs bosoninteraction operator. Experimental EDM results constrain theWilson coefficients, while a given BSM theory providespredictions for the Wilson coefficients in terms of the under-lying model parameters.Interactions involving light quarks and gluons are, of course,
not directly accessible to experiment. Consequently, it is usefulto consider their manifestation in a low-energy effective theory(below the hadronic scale Λhad ∼ 1 GeV) involving electrons,photons, pions, and nucleons. Hadronic matrix elements of thequark and gluon EFToperators then yield the hadronic operatorcoefficients. At lowest nontrivial order, one obtains the electronEDM (de); scalar, pseudoscalar, and tensor electron-nucleoninteractions (CS, CP, and CT , respectively)4; short-rangeneutron and proton EDMs (dsrn and dsrp ); isoscalar, isovector,
and isotensor pion-nucleon couplings (gðiÞπ , i ¼ 0, 1, 2); and aset of four-nucleon operators. In the context of this hadronic-scale EFT, it is appropriate to express the combination ofcontributions to a measured atomic EDM for paramagneticsystems, diamagnetic systems, and nucleons as
di ¼Xj
αijCj; ð9Þ
where i labels the system, and j labels the specific low-energy parameter (e.g., de, CS, etc.). The αij ¼ ∂di=∂Cj areprovided by theoretical calculations at various scales fromatomic to nuclear to short range and are presented in Sec. II.Note that the coefficients αij havevarious labels in the literaturefor notation developed for the different experimental systems.One approach to interpreting the experimental limits
assumes that the EDM in a specific system arises from onlyone source—the “sole-source” approach. In the sole-sourceapproach, the constraint on each parameter is derived assumingthat all other contributions are negligible and so one exper-imental result may appear to set limits on a large number ofindividual CP-violating parameters. An alternative approach—the global analysis presented by Chupp and Ramsey-Musolf(2015) and Sec. V—assumes simultaneous nonzero values of
u,d u,d
W
s d c,t c,t
g
FIG. 2. Penguin diagram giving the SM CKM ΔS ¼ 1CP-violating effective interaction. Adapted from Pospelov andRitz, 2005.
3The upper limit l is defined byRl−lP
0ðxÞdx¼0.95 for a normal-ized Gaussian probability distribution P0ðxÞ with central value and σgiven by the total error given in Table I.
4Each interaction has an isoscalar and an isovector component,which we suppressed here for notational simplicity.
Chupp et al.: Electric dipole moments of atoms, molecules, …
Rev. Mod. Phys., Vol. 91, No. 1, January–March 2019 015001-6
the dominant parameters globally constrained by the exper-imental results. In the global analysis, paramagnetic systemsare used to set limits on the electron EDM de and the nuclear-spin-independent electron-nucleus coupling CS. Diamagneticsystems set limits on four dominant parameters: two pion-nucleon couplings (gð0Þπ , gð1Þπ ), a specific isospin combination ofnuclear-spin-dependent couplings, and the “short distance”contribution to the neutron EDM dsrn . There is, unfortunately,significant variation and uncertainty in the αij, in particular, forthe nuclear and hadronic calculations, which soften the con-straints on the low-energy parameters.
C. Reach and complementarity
EDMs arising from BSM CP violation depend on acombination of factors, including new CP-violating phases,ϕCPV, the mass scale Λ associated with the new particles, andthe underlying dynamics. In general, an elementary fermionEDM can be expressed as
d ≈ ð10−16e cmÞ�vΛ
�2
ðsinϕCPVÞðyfFÞ; ð10Þ
where v ¼ 246 GeV is the Higgs vacuum expectation value,yf is a Yukawa coupling typically associated with the SMfermions in the system of interest, and F accounts for thedynamics, which may be perturbative or nonperturbative andwill differ depending on the system.For an electron EDM that arises through perturbative
dynamics at the one-loop level F ∼ g2=ð16π2Þ, where g isthe BSM coupling strength. The present electron-EDM upperlimit of ≈ 1 × 10⁻²⁸e cm implies that Λ⪆1–2 TeV for g of theorder of the SM SUð2ÞL gauge coupling strength, andsinϕCPV ≈ 1. This energy scale for Λ, which is comparableto the reach of the neutron and diamagnetic atom EDM limits,rivals the BSMphysics reach of the LHC. It is important to notethat exceptions to these naive estimates of mass scale sensiti-vity can occur. For example, at the level of the underlyingelementary particle physics, an EDM may be enhanced bycontributions of heavy fermion intermediate states, e.g., the topquark, leading to the presence of a larger Yukawa coupling inEq. (10). In paramagnetic atoms and molecules an EDM mayalso be generated by a nuclear-spin-independent scalarT-odd andP-odd electron-quark interaction at tree level, whichgenerally scales with the number of nucleons. In this case, theresulting mass reach for current experimental sensitivies is ashigh as ∼13 000 TeV, as discussed in Sec. V. Models thatgenerate EDMs at two-loop or higher-loop order allow forlighter BSM particles with CP-violating interactions.For the Schiff moment, the additional power of r2 in Eq. (7)
implies that for a given underlying source of CP violation, thecontribution to a diamagnetic atomic or molecular EDM issuppressed compared to that of the neutron by ðRN=RAÞ2,where RN and RA are the nuclear and atomic radii, respec-tively. As a concrete illustration the bound on θ arising fromthe 199Hg EDM limit is comparable to the bound from dn, eventhough the respective EDM limits differ by nearly 4 orders ofmagnitude (see Table I).An example of unique constraints set by EDM searches is
found in the strong CP contribution to the neutron EDM given
by Crewther et al. (1979), Pospelov and Ritz (1999), andShindler, Luu, and de Vries (2015)
dn ≈ ð10−16e cmÞθ: ð11ÞThe parameter θ is naively expected to be of orderunity. However, assuming this is the only contribution to theneutron EDM, the current upper bound from Table I impliesjθj ⪅ 10−10. The corresponding bound obtained from the 199HgEDM limit is comparable. This severe constraint on θ hasmotivated a variety of theoretical explanations. The mostwidely considered explanation is the existence of a sponta-neously broken Peccei-Quinn symmetry (Peccei and Quinn,1977a, 1977b) and an associated particle: the axion (Weinberg,1978; Wilczek, 1978). The axion is also a candidate for theobserved relic density of cold dark matter. The axion proposalhas been very compelling and has spawned a number ofexperimental endeavors summarized, for example, by Grahamet al. (2015).
D. EDMs and baryogenesis
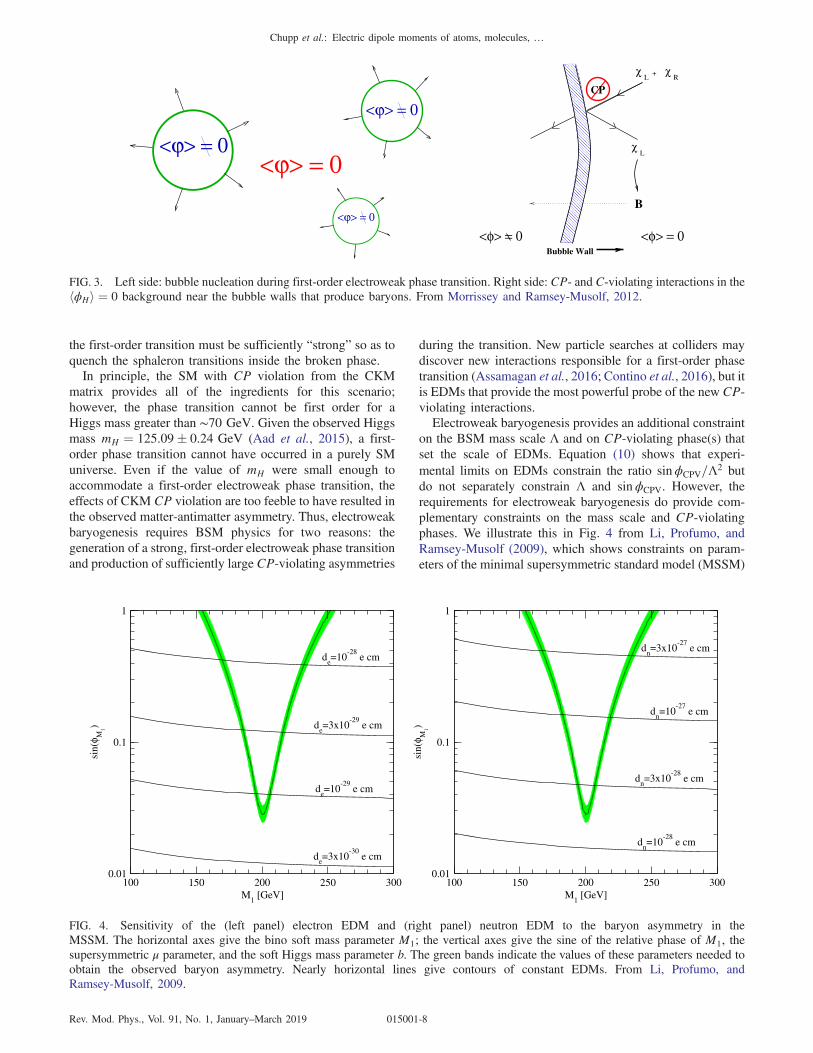
Baryogengesis, the generation of a net asymmetry of matterover antimatter in the early Universe, requires three compo-nents as first explained by Sakharov (1967): (1) violation ofbaryon number B; (2) departure from thermodynamic equi-librium (assuming CPT invariance); and (3) both C-violatingand CP-violating processes. A number of baryogenesisscenarios that satisfy these requirements have been proposed,each typically focusing on a certain era in cosmic history andcorresponding energy scale. Among the most widely consid-ered and experimentally testable scenarios is electroweakbaryogenesis. For recent reviews of electroweak baryogenesis,see Morrissey and Ramsey-Musolf (2012); and see Riotto andTrodden (1999) and Dine and Kusenko (2003) for moregeneral baryogenesis reviews.In the electroweak baryogenesis (EWBG) scenario, the
Universe proceeds from initial conditions having no netbaryon number and vanishing Higgs field expectation valuehϕHi ¼ 0, implying that the standard-model SUð2ÞL × Uð1ÞYelectroweak symmetry has not yet been broken by the Higgsmechanism (giving mass to the W� and Z bosons). As theplasma cools below the electroweak scale of ≈100 GeV, hϕHibecomes nonzero, breaking electroweak symmetry. EWBGrequires that the transition be a first-order phase transition,proceeding via the nucleation of bubbles of broken symmetrywith hϕHi ≠ 0 as suggested in the left side of Fig. 3. Thesebubbles expand and fuse into a single phase with hϕHi ≠ 0.CP-violating and C-violating interactions in the hϕHi ¼ 0background near the bubble walls produce B ≠ 0 in processesthat convert baryons to antileptons or antibaryons to leptonsillustrated on the right side of Fig. 3. These processes arereferred to as sphaleron transitions that arise from a configu-ration of the standard-model fields in the hϕHi ¼ 0 phase thatcorresponds to a saddle point of the electroweak effectiveaction (Klinkhamer and Manton, 1984). As the bubblesexpand and merge, they sweep up the B ≠ 0 regions as theyeventually coalesce into the Universe that persists to thepresent epoch. However, if sphaleron transitions persist insidethe bubbles the baryon number would not be preserved. Thus,
Chupp et al.: Electric dipole moments of atoms, molecules, …
Rev. Mod. Phys., Vol. 91, No. 1, January–March 2019 015001-7
the first-order transition must be sufficiently “strong” so as toquench the sphaleron transitions inside the broken phase.In principle, the SM with CP violation from the CKM
matrix provides all of the ingredients for this scenario;however, the phase transition cannot be first order for aHiggs mass greater than ∼70 GeV. Given the observed Higgsmass mH ¼ 125.09� 0.24 GeV (Aad et al., 2015), a first-order phase transition cannot have occurred in a purely SMuniverse. Even if the value of mH were small enough toaccommodate a first-order electroweak phase transition, theeffects of CKM CP violation are too feeble to have resulted inthe observed matter-antimatter asymmetry. Thus, electroweakbaryogenesis requires BSM physics for two reasons: thegeneration of a strong, first-order electroweak phase transitionand production of sufficiently large CP-violating asymmetries
during the transition. New particle searches at colliders maydiscover new interactions responsible for a first-order phasetransition (Assamagan et al., 2016; Contino et al., 2016), but itis EDMs that provide the most powerful probe of the new CP-violating interactions.Electroweak baryogenesis provides an additional constraint
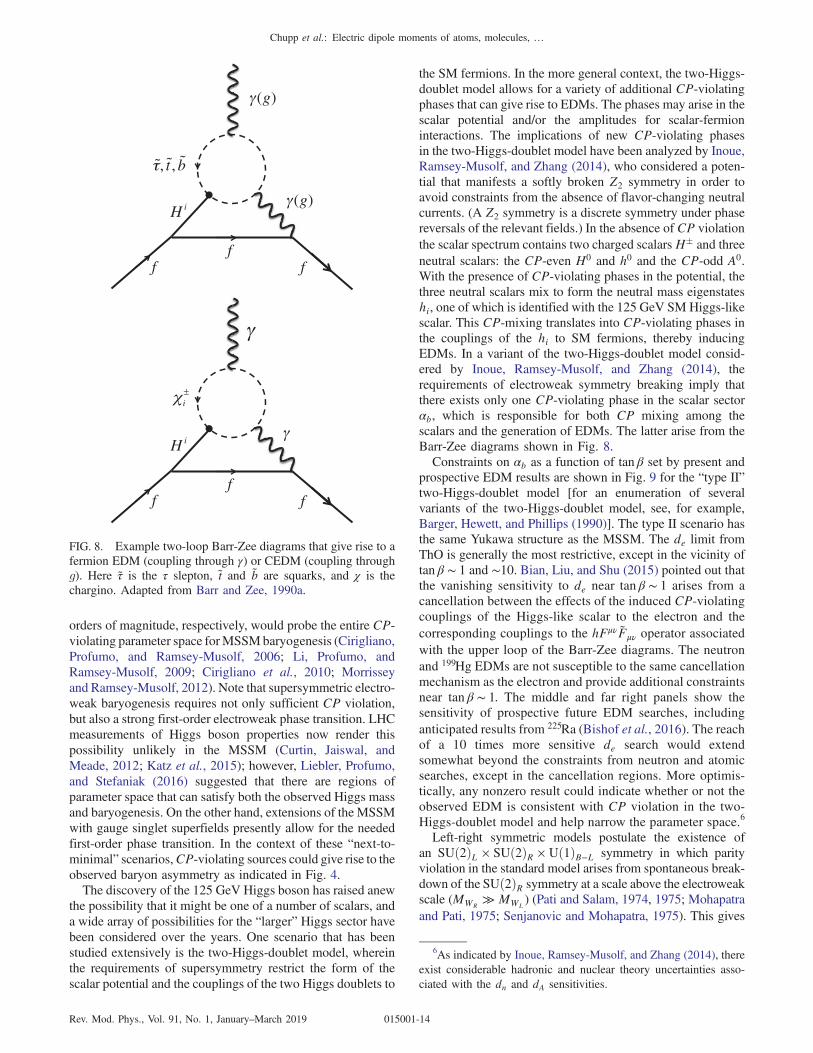
on the BSM mass scale Λ and on CP-violating phase(s) thatset the scale of EDMs. Equation (10) shows that experi-mental limits on EDMs constrain the ratio sinϕCPV=Λ2 butdo not separately constrain Λ and sinϕCPV. However, therequirements for electroweak baryogenesis do provide com-plementary constraints on the mass scale and CP-violatingphases. We illustrate this in Fig. 4 from Li, Profumo, andRamsey-Musolf (2009), which shows constraints on param-eters of the minimal supersymmetric standard model (MSSM)
CP
χR
χL +
χL
B
Bubble Wall
<φ> = 0 <φ> = 0
<ϕ> = 0<ϕ> = 0
<ϕ> = 0
<ϕ> = 0
FIG. 3. Left side: bubble nucleation during first-order electroweak phase transition. Right side: CP- and C-violating interactions in thehϕHi ¼ 0 background near the bubble walls that produce baryons. From Morrissey and Ramsey-Musolf, 2012.
100 150 200 250 300M
1 [GeV]
0.01
0.1
1
sin(
φ M1)
de=10
-28 e cm
de=3x10
-29 e cm
de=10
-29 e cm
de=3x10
-30 e cm
100 150 200 250 300M
1 [GeV]
0.01
0.1
1
sin(
φ M1)
dn=3x10
-27 e cm
dn=10
-27 e cm
dn=3x10
-28 e cm
dn=10
-28 e cm
FIG. 4. Sensitivity of the (left panel) electron EDM and (right panel) neutron EDM to the baryon asymmetry in theMSSM. The horizontal axes give the bino soft mass parameter M1; the vertical axes give the sine of the relative phase of M1, thesupersymmetric μ parameter, and the soft Higgs mass parameter b. The green bands indicate the values of these parameters needed toobtain the observed baryon asymmetry. Nearly horizontal lines give contours of constant EDMs. From Li, Profumo, andRamsey-Musolf, 2009.
Chupp et al.: Electric dipole moments of atoms, molecules, …
Rev. Mod. Phys., Vol. 91, No. 1, January–March 2019 015001-8

needed to generate the observed matter-antimatter asym-metry and the corresponding EDMs that would arise. Thehorizontal and vertical axes give the soft SUSY-breaking binomass parameter M1 and the CP-violating “bino phase”sinðΦMÞ ¼ sinArgðμM1b�Þ. The green bands show the rela-tionship between these parameters needed to produce thematter-antimatter asymmetry, while the nearly horizontallines indicate values of the electron (left panel) and neutron(right panel) EDMs. The EDMs have been computed in thelimit of heavy sfermions, which is consistent with LHCresults, so that EDMs arise from two-loop graphs containingthe electroweak gauginos. Note that the present de limitroughly excludes the region de > 10−28 e cm, while thecurrent neutron-EDM bound does not yet constrain theindicated parameter space. The next-generation electronand neutron-EDM experiments are expected to probe belowde < 10−29 and dn < 10−27e cm.
II. THEORETICAL BACKGROUND
A. CP and T violation
Parity (P), time reversal (T), and charge conjugations (C)are the discrete symmetry transformations of quantummechanics and quantum field theory. Experiment shows thatthe strong and electromagnetic interactions are symmetricunder C, P, and T separately and under CP and T. The weakinteraction, which involves only left-handed neutrinos andright-handed antineutrinos, is maximally antisymmetric underP and C. CP is also violated in weak decays of kaons and bmesons. Symmetry under the combined transformations of C,P, and T (or CPT) is consistent with experiment and is alsorequired for any Lorentz-invariant quantum field theory asembodied in the CPT theorem (Luders, 1954; Jost, 1957;Tureanu, 2013).Parity, a unitary transformation described by ðt;rÞ →
ðtP;rPÞ¼ðt;−rÞ, reverses the handedness of the coordinatesystem, i.e., x × y ¼ z while xP × yP ¼ −zP. Particles haveintrinsic parity, that is, the field describing a particle acquires aphase of �1 under the parity transformation. For fermions,particles and antiparticles have opposite intrinsic parity.The time-reversal transformation is described by ðt; rÞ →
ðtT; rTÞ ¼ ð−t; rÞ, but when this is applied to wave functionsor fields not only is motion reversed (e.g., p → p andJ → −J) but the imaginary phase is reversed as well, i.e.,time reversal includes complex conjugation. Moreover forscattering and decay processes, the initial and final states arereversed, which is a complication for interpreting any experi-ment subject to final-state corrections such as detailed balanceor decay correlation measurements (Callan and Treiman,1967). Thus the antiunitary time-reversal transformationinvolves motion reversal, complex conjugation, and reversalof initial and final states. For an EDM, however, the initial andfinal states are the same, so there is no complication fromfinal-state effects and a definitive observation of an EDM is adirect signature of T violation and, invoking the CPTtheorem, of CP violation.Charge conjugation transforms particles into antiparticles,
reversing charge without reversing the handedness or spin.It is interesting to note, therefore, that CPT symmetry requires
the EDM of a particle and the EDM of its antiparticle be equalin magnitude and opposite in sign:
dhJi!C dhJi!P þ dhJi!T dh−Ji ¼ −dhJi: ð12ÞSimilarly, for the magnetic moments:
μhJi!C μhJi!P þ μhJi!T μh−Ji ¼ −μhJi: ð13Þ
B. General framework
As indicated by Fig. 1, EDMs in experimentally accesiblesystems arise from CP violation at a fundamental level that ismanifest at several energy or length scales. The Lagrangian fora fundamental theory incorporating SM CKM and θ andcontributions together with BSM physics can be written
LCPV ¼ LCKM þ Lθ þ LBSM: ð14ÞThe general framework that connects this to experiment,EFT, absorbs higher-energy processes into a set of operatorsthat contribute at a scale Λ resulting in a set of weakscale, nonrenormalizable operators involving only SM fields.The corresponding amplitudes scale as ðv=ΛÞd−4, where d isthe operator’s canonical dimension and v ¼ 246 GeV is theHiggs vacuum expectation value.The θ term inLCPV enters at EFT dimension 4, while CKM-
generated fermion EDMs are dimension 5, but electroweakSUð2Þ × Uð1Þ gauge invariance requires coupling through theHiggs field making these effectively dimension 6. BSMphysics enters at dimension 6 and higher i.e.,
LBSM → LeffCPV ¼
Xk;d
αðdÞk
�1
Λ
�d−4
OðdÞk ; ð15Þ
where αðdÞk is the Wilson coefficient for each operator OðdÞk , k
denotes all operators for a given d that are invariant under bothSU(2) and U(1), and the operators contain only SM fields.However, when considering only first-generation SM fer-mions and SM bosons, it is sufficient to consider only d ¼ 6.At this order, the relevant set of operators, i.e., the “CP-violating sources” listed in Table II, include the fermionSUð2ÞL and Uð1ÞY electroweak dipole operators and theSUð3ÞC chromoelectric dipole operators; a set of four-fermionsemileptonic and nonleptonic operators; a CP-violating three-gluon operator; and a CP-violating fermion-Higgs operator.After electroweak symmetry breaking, the dipole operatorsinduce the elementary fermion EDMs and chromo-EDMs(CEDMs) as well as analogous fermion couplings to themassive electroweak gauge bosons that are not directlyrelevant to the experimental observables discussed in thisreview. The fermion-Higgs operator induces a four-quark CP-violating operator whose transformation properties are distinctfrom the other four-quark operators listed in Table II.The second term of the electromagnetic Lagrangian in
Eq. (3) describes the EDM interaction for an elementaryfermion f, which couples left-handed to right-handed fer-
mions. Letting the Wilson coefficient αð6ÞfVk¼ gkCfVk
, where
Chupp et al.: Electric dipole moments of atoms, molecules, …
Rev. Mod. Phys., Vol. 91, No. 1, January–March 2019 015001-9

k ¼ B,W,G labels the standard-model electroweak (B andW)and gluon (G) gauge fields
LEDM ¼ −idf2Ψσμνγ5FμνΨ
¼ 1
Λ2ðgBCfBOfB þ 2I3gWCfWOfWÞ; ð16Þ
where df is the fermion EDM, which couples to the electro-magnetic (EM) field Aμ ¼ Bμ cos θW þWμ
3 sin θW (θW is theSM Weinberg angle), is
df ¼ −ffiffiffi2
pe
v
�vΛ
�2
ðImCfB þ 2If3ImCfWÞ
¼ −ð1.13 × 10⁻¹³e fmÞ�vΛ
�2
ImCfγ: ð17Þ
Here
ImCfγ ¼ ImCfB þ 2If3ImCfW ð18Þ
and If3 is the third component of weak isospin for fermion f.The CP-violating quark-gluon interaction can be written interms of an analogous CEDM dq:
LCEDM ¼ −iXq
g3dq2
qσμνTAγ5qGAμν; ð19Þ
where TA (A ¼ 1;…; 8) are the generators of the QCD colorgroup. Note that dq has dimensions of length, because itcouples to gluon fields, not EM fields.Because of electroweak gauge invariance, the coefficients
of the operators that generate EDMs and CEDMs (QqG, QfW ,QfB) contain explicit factors of the Higgs field with Yukawa
couplings Yf ¼ ffiffiffi2
pmf=v. We can write ImCfγ ≡ Yfδf, etc.,
so that
df ¼ −ð1.13 × 10⁻³ e fmÞ�vΛ
�2
Yfδf; ð20Þ
and
dq ¼ −ð1.13 × 10⁻³ fmÞ�vΛ
�2
Yqδq: ð21Þ
In general, we expect δq ∼ δl; thus the up- and down-quarkEDMs would be comparable, but light quark EDM dq wouldbe roughly an order of magnitude larger than the electronEDM. As noted earlier, exceptions to this expectation canarise when the Higgs couples to heavy degrees of freedom inthe loop graphs that generate quark EDMs and CEDMs.Considering only first-generation fermions, there are 15
independent weak-scale coefficients. Translating the electro-weak dipole operators into the elementary fermion EDMsand neglecting couplings to massive gauge bosons leads to aset of 12 d ¼ 6 CP-violating sources—in addition to the θparameter—that induce atomic, hadronic, and nuclear EDMs.
C. Low-energy parameters
As indicated in Fig. 1, the Wilson coefficients are connectedto the experimental observables at the hadronic scale Λhad ∼1 GeV through a set of low-energy parameters involvingpions and nucleons in place of quarks and gluons as well asphotons and electrons. Considering first purely hadronicinteractions, the starting point is a T-odd and P-odd (orTVPV) effective, nonrelativistic Lagrangian containing pionsand nucleons (Engel, Ramsey-Musolf, and van Kolck, 2013):
LTVPVπNN ¼−2Nðd0þ d1τ3ÞSμNvνFμν
þ N½gð0Þπ τ · πþ gð1Þπ π0þ gð2Þπ ð3τ3π0− τ · πÞ�N; ð22Þwhere Sμ is the spin of a nucleon N having velocity vν, τ is theisospin operator, and π ¼ πþ; π0; π− represents the pion field.Four-nucleon interactions are currently being studied and arenot considered in this discussion. Combinations d0 þ d1τ3 ¼d0 ∓ d1 correspond to the short-range contributions to theneutron and proton EDMs. The quark EDMs contribution tothe d0;1 while the quark CEDMs, the three-gluon operator, andthe CP-violating four-quark operators (including the operator
induced by Qφud) will contribute to both d0;1 and gð0Þ;ð1Þ;ð2Þπ .
Generally, the sensitivity of the isotensor coupling gð2Þπ is
significantly suppressed compared to that of gð0Þπ and gð1Þπ . TheT-odd and P-odd pion-nucleon interactions parametrized by
the couplings gðiÞπ contribute to nucleon EDMs as well as tonucleon-nucleon interactions that generate the Schiff moment.
The semileptonic operators Oledq and Oð1;3Þlequ induce effec-
tive nucleon spin-independent and nuclear spin-dependentelectron-nucleon interactions, described by the scalar (S) andtensor (T) interactions:
LS ¼ −GFffiffiffi2
p eiγ5eN½Cð0ÞS þ Cð1Þ
S τ3�N; ð23Þ
LT ¼ 8GFffiffiffi2
p eσμνevνN½Cð0ÞT þ Cð1Þ
T τ3�SμN þ � � � ; ð24Þ
where the Dirac matrices act on the electron wave function,GF is the Fermi constant, and N is a nucleon spinor; the sum
TABLE II. Dimension-6 P-odd and T-odd operators that induceatomic, hadronic, and nuclear EDMs. Here φ is the SM Higgsdoublet, φ ¼ iτ2φ�, and Φ ¼ φ (φ) for If3 < 0 (If3 > 0). Adaptedfrom Engel, Ramsey-Musolf, and van Kolck, 2013.
OfW ðFσμνfRÞτIΦWIμν Fermion SUð2ÞL EDM
OfB ðFσμνfRÞΦBμν Fermion Uð1ÞY EDM
OuG ðQσμνTAuRÞφGAμν u-quark CEDM
OdG ðQσμνTAdRÞφGAμν d-quark CEDM
Qledq ðLjeRÞðdRQjÞ CP-violating semileptonic
Qð1Þledu ðLjeRÞϵjkðQkuRÞ
Qð3Þlequ ðLjσμνeRÞϵjkðQkσμνuRÞ
OG fABCGAνμ GBρ
ν GCμρ CP-violating three gluon
Qð1Þquqd ðQjuRÞϵjkðQkdRÞ CP-violating four quark
Qð8Þquqd ðQjTAuRÞϵjkðQkTAdRÞ
Qφud iðφ†DμφÞuRγμdR CP-violating quark Higgs
Chupp et al.: Electric dipole moments of atoms, molecules, …
Rev. Mod. Phys., Vol. 91, No. 1, January–March 2019 015001-10

over all nucleons is implied, and where the þ � � � indicatesubleading contributions arising from the electron-scalar–nucleon-pseudoscalar interaction.
The coefficients Cð0;1ÞS;T can be expressed in terms of the
underlying semileptonic operator coefficients and the nucleonscalar and tensor form factors:
Cð0ÞS ¼ −gð0ÞS
�vΛ
�2
ImCð−Þeq ;
Cð1ÞS ¼ gð1ÞS
�vΛ
�2
ImCðþÞeq ;
Cð0ÞT ¼ −gð0ÞT
�vΛ
�2
ImCð3Þlequ;
Cð1ÞT ¼ −gð1ÞT
�vΛ
�2
ImCð3Þlequ; ð25Þ
where
Cð�Þeq ¼ Cledq � Cð1Þ
lequ: ð26Þ
The isoscalar and isovector form factors gð0;1ÞΓ are given by
12hNj½uΓuþ dΓd�jNi≡ gð0ÞΓ ψNΓψN; ð27Þ
12hNj½uΓu − dΓd�jNi≡ gð1ÞΓ ψNΓτ3ψN; ð28Þ
where Γ ¼ 1 for S and σμν for T (Engel, Ramsey-Musolf, andvan Kolck, 2013).
D. EDMs in the standard model
CP violation in the CKM matrix leads to nonvanishingcoefficients of the d ¼ 6 CP-violating sources at the multi-loop level. The primary theoretical interest has been theelementary fermion EDMs. The CKM Lagrangian for mixingof left-handed down-type quarks and up-type quarks is
LCKM ¼ −ig2ffiffiffi2
pXp;q
VpqUpL=W
þDqL þ H:c: ð29Þ
Here g2 is the weak coupling constant, =Wþ ¼ γμWþμ is the
chargedW-boson coupling, UpL ¼ u, c, t andDp
L ¼ d, s, b area generation-p left-handed up-type and down-type quarkfields, and Vpq denotes the element of the CKM matrix.The constraints from unitarity and quark-field rephasing forthe three quark generations allow four free parameters: threemagnitudes and a CP-violating phase. Writing
VCKM ¼
264Vud Vus Vub
Vcd Vcs Vcb
Vtd Vts Vtb
375; ð30Þ
the CP-violating effects are proportional to the Jarlskoginvariant
δ ¼ ImðVusV�csVcbV�
ubÞ: ð31ÞA global analysis of experimental determinations ofCP-violating observables in the neutral kaon and B-mesonsystems gives δ ≈ 5 × 10⁻⁵ (Olive and Group, 2014; Charleset al., 2015).
The electron EDM arises at the four-loop level and wasestimated by Ng and Ng (1996) to be
dCKMe ≈eGF
π2
�αEM2π
�3
meδ ≈ 10−38e cm: ð32Þ
For the neutron, the contribution of the valence u and d quarkswas computed by Czarnecki and Krause (1997) to be
dd ≈mdm2
cαSG2Fδ
108π5f
�lnm2
b
m2c; ln
m2W
m2b
�
≈ −0.7 × 10⁻³⁴e cm; ð33Þ
du ≈mum2
sαSG2Fδ
216π5f
�lnm2
b
m2s; ln
m2c
m2s; ln
m2b
m2c; ln
m2W
m2b
�
≈ −0.15 × 10⁻³⁴e cm; ð34Þwhere the f’s are functions of the natural logarithms of themass ratios m2
b=m2c, etc. The valence-quark contribution to the
neutron EDM is
dCKMn ¼ 43dd − 1
3du ≈ −0.9 × 10⁻³⁴e cm: ð35Þ
A significantly larger contribution to dn (and dp) arises from“long distance” meson-exchange contributions, for example,that shown in Fig. 5, where the CP-violating ΔS ¼ 1 hadronicvertices are generated by the penguin process of Fig. 2, whilethe CP-conserving ΔS ¼ 1 couplings arise from the tree-levelstrangeness-changing charged-current interaction [Eq. (29)]. Afull compilation of diagrams and corresponding results for SMneutron and proton EDMs based on heavy baryon chiralperturbation theory was provided by Seng (2015):
jdn;pj ≈ ð1 − 6Þ × 10−32e cm; ð36Þwhere the range reflects the present uncertainty in variouslow-energy constants that enter the heavy baryon effectiveLagrangian and an estimate of the higher order terms neglectedin the heavy baryon expansion.The CKM contribution enters the Schiff moment
through the P-odd and T-odd NN interaction mediated bykaon exchange (Donoghue, Holstein, and Musolf, 1987).Flambaum, Khriplovich, and Sushkov (1986) presented an
n n
+
FIG. 5. Representative chiral loop contribution to the neutronEDM arising from SM CKM CP violation. The ⊗ indicates aCP-violating ΔS ¼ 1 vertex such as that shown in Fig. 2, whilethe • corresponds to a CP-conserving ΔS ¼ 1 interaction.Adapted from Pospelov and Ritz, 2005.
Chupp et al.: Electric dipole moments of atoms, molecules, …
Rev. Mod. Phys., Vol. 91, No. 1, January–March 2019 015001-11

estimate of S using the one-body effective P-odd and T-oddpotential for a valence nucleon
W ¼ GFffiffiffi2
p ηa2mN
σa · ∇ρAðrÞ; ð37Þ
where ρAðrÞ is the nuclear density and, for valence nucleona ¼ n or p, the P-odd and T-odd coupling strength is
ηn ¼ ðN=AÞηnn þ ðZ=AÞηnp;ηp ¼ ðN=AÞηpn þ ðZ=AÞηpp: ð38Þ
In the SM the ηa’s are proportional to GFδ.For 129Xe and 199Hg, both of which have an unpaired
neutron, Flambaum, Khriplovich, and Sushkov (1986) findSchiff moments
Sð129XeÞ ≈ 1.75 × 10⁻⁸ηnpe fm3;
Sð199HgÞ ≈ −1.4 × 10⁻⁸ηnpe fm3. ð39ÞDonoghue, Holstein, and Musolf (1987) corrected an earliercomputation of ηnp by properly taking into account theconstraints from chiral symmetry resulting in jηnpj≲ 10−9,leading to the SM estimates for the atomic EDMs
jdAð129XeÞCKMj≲ 5 × 10⁻³⁵e cm;
jdAð199HgÞCKMj≲ 4 × 10⁻³⁴e cm. ð40Þ
Here we have used dAð129XeÞ=S ¼ 2.7 × 10⁻¹⁸ cm=fm3 anddAð199HgÞ=S ¼ −2.8 × 10⁻¹⁷ cm=fm3 given in Table V.The EDMs of unpaired nucleons also contribute to the
Schiff moment and atomic EDM. For 129Xe and 199Hg, theunpaired neutron is dominant. Combining the dependence ofthe Schiff moment on dn from Yoshinaga, Higashiyama, andArai (2010) for 129Xe and Dmitriev and Sen’kov (2003) for199Hg with the SM estimate for dn:
dAð129XeÞCKMðnÞ ≈ 6 × 10⁻⁶dn;
dAð199HgÞCKMðnÞ ≈ 4 × 10⁻⁴dn; ð41Þ
resulting in
jdAð129XeÞCKMðnÞj≲ 3.6 × 10−37e cm;
jdAð199HgÞCKMðnÞj≲ 2.4 × 10⁻³⁵e cm. ð42Þ
CP violation in the strong interaction arises from the termin the QCD Lagrangian formed by the gluon field Gμν
combined with its dual Gμν ¼ ϵμναβGαβ=2:
Lθ ¼ −αS16π2
θTrðGμνGμνÞ; ð43Þ
where αS is the strong coupling constant.5 This willcontribute to the neutron and proton EDM directly as well
as induce a nuclear Schiff moment through the T-odd andP-odd (isospin-zero) pion-nucleon coupling (Crewther et al.,1979; Pospelov and Ritz, 1999; Shindler, Luu, and de Vries,2015). For the neutron, the results fall in the range
dθn ≈ −ð0.9–1.2Þ × 10−16θe cm: ð44ÞRecently Abramczyk et al. (2017) observed the need to applya correction to lattice QCD computations of the dθn.Thus experimental constraints on EDMs in hadronic systems
can be used to set an upper bound on θ. Assuming thisinteraction is the sole source of CP violation and neglectinguncertainties associated with the hadronic and nuclear physics,limits from dn or from dAð199HgÞ imply θ ⪅ 10−10. Asdiscussed in Sec. V, allowing for multiple sources of CPviolation can weaken this upper bound considerably, but theresulting constraint is nonetheless severe: θ ⪅ 10−6. Eitherway, the small value allowed for a nonvanishing θ parametergives rise to the “strong CP problem.” This may be addressedby the axion solution, which postulates an axion field aðxÞ thatcouples to gluons with the Lagrangian (Peccei and Quinn,1977a, 1977b)
La ¼1
2∂μa∂μa − VðaÞ − aðxÞ
fa
αS8π
GμνGμν: ð45Þ
The first term is the kinetic energy, VðaÞ is the axion potential,the third term is the axion-gluon coupling, and fa is the axiondecay constant, which is analogous to the pion decay constant.The ground state is the minimum of the axion potential, whichshifts the value of θ → θ þ hai=fa and could lead to cancella-tions that suppress θ.Neutrino masses established by neutrino oscillations
give rise to a 3 × 3 neutrino-mixing matrix with a singleCP-violating phase analogous to the CKM phase. Ifneutrinos are Majorana particles, two-loop contributionsto de are possible (Ng and Ng, 1996). However, this turnsout to make a small contribution unless the neutrino massesare very specifically tuned (Archambault, Czarnecki, andPospelov, 2004).
E. Beyond-standard-model physics
Observational and theoretical motivations for beyond-standard-model physics include the need to explain darkmatter, nonvanishing neutrino masses, the observed matter-antimatter asymmetry, and considerations of naturalness,which require a mechanism to solve the “hierarchyproblem” associated with loop corrections to weak-scalephysics. In general, BSM scenarios that address theseissues provide new mechanisms of CP violation that alsogenerate EDMs. Here we discuss the EDM implications ofa few representative BSM scenarios of current interest:SUSY, left-right symmetric models, and extended Higgssectors.SUSY introduces symmetry between fermions and
bosons, postulating an extra Higgs doublet and a set ofnew particles—“superpartners” of the SM particles calledsquarks, sleptons, and gauginos. With this spectrum ofnew particles come new couplings and, most importantly,
5Following Grzadkowski et al. (2010), ϵ0123 ¼ 1. This signconvention is opposite to that used by Pospelov and Ritz (2005)and elsewhere. Consequently, Lθ carries an overall −1 compared towhat frequently appears in the literature.
Chupp et al.: Electric dipole moments of atoms, molecules, …
Rev. Mod. Phys., Vol. 91, No. 1, January–March 2019 015001-12

new CP-violating phases. Although there is currently nodirect experimental evidence for SUSY or SUSY particles,the theory is well motivated by providing a mechanism forsolving the hierarchy problem, unifying the gauge cou-plings, and by providing the new particles as potentialdark-matter candidates. In the MSSM extension, there exist40 additional CP-violating phases, a subset of which caninduce EDMs at the one-loop level. Representative one-loop contributions to the elementary fermion EDMs andquark CEDMs are shown in Figs. 6 and 7, respectively.In each case, the external gauge boson can couple toany internal superpartner carrying the appropriate charge(electric charge for the fermion EDM or color for thechromo EDM).It is useful to adopt several simplifying assumptions:(i) There is a single mass scale MSUSY common to all
superpartners.(ii) There is a common relative phase ϕμ between the
supersymmetric Higgs and Higgsino mass parameterμ and the three SUSY-breaking gaugino masses Mj
(j ¼ 1, 2, 3).(iii) The SUSY-breaking trilinear interactions involving
scalar fermions and the Higgs have a commonphase ϕA.
The resulting one-loop EDMs and CEDMs following fromEqs. (20) and (21) with Λ → MSUSY, Yf the dimensionlessYukawa coupling for the fermion of interest, are (Pospelovand Ritz, 2005; Ramsey-Musolf and Su, 2008)
δe ¼ −qκeffiffiffiffiffiffiffiffiffiffi32π2
p�g2112
sinϕA þ�5g2224
þ g2124
�sinϕμ tan β
�;
δq ¼ −qfκfffiffiffiffiffiffiffiffiffiffi32π2
p� ffiffiffi
2p
g239
ðsinϕμRq − sinϕAÞ þ � � ��;
δq ¼ −κfffiffiffiffiffiffiffiffiffiffi32π2
p�5g2318
ffiffiffi2
p ðsinϕμRq − sinϕAÞ þ � � ��; ð46Þ
where we followed the opposite sign convention for thetrilinear phase ϕA compared to Ramsey-Musolf and Su(2008). In Eq. (46), f refers to the fermion (electron u andd quark), qf is the fermion charge (1, 2=3, and −1=3,respectively, for e, u, and d), mf the fermion mass, andκf ¼ mf=16π2Λ. Also g1;2;3 are the gauge couplings, tan β ¼vu=vd is the ratio of the vacuum expectation values of the twoHiggs doublets, the “þ � � �” indicate contributions from loopsinvolving electroweak gauginos, and Rd ¼ tan β and Ru ¼cot β for down quarks and up quarks, respectively.Turning now to the four-fermion and three-gluon operators:
SUSY scenarios with large tan β can generate EDMs fromCP-violating four-fermion operators (Lebedev and Pospelov,2002; Demir et al., 2004). The Weinberg three-gluon operatorreceives contributions at the two-loop level from squark-gluino loops and at the three-loop level from diagramsinvolving the Higgs bosons. Naively sinϕμ and sinϕA areexpected to be Oð1Þ, and electroweak baryogenesis typicallyrequires larger phases and at least a subset of the superpartnermasses to be well below the TeV scale (Morrissey andRamsey-Musolf, 2012).An analysis of EDM results from de, dn, and dAð199HgÞ by
Pospelov and Ritz (2005) found that jϕμ;Aj ⪅ 10−2 forMSUSY ¼ 500 GeV, i.e., much less than naive expectations,leading to the so-called SUSY-CP problem (Dimopoulos andSutter, 1995). A more general analysis that does not rely onthe assumption of phase universality yields somewhat relaxedconstraints but does not eliminate the SUSY CP problem (Li,Profumo, and Ramsey-Musolf, 2010). Ibrahim and Nath(1998, 1999) pointed out that the individual phases neednot be small themselves if there are sufficient cancellations.However, the dependence of de on ϕμ in Eq. (46) makes this“cancellation scenario” somewhat less plausible. A discussionwithin the context of R-parity violation was presented byYamanaka, Sato, and Kubota (2014).Giudice and Romanino (2004, 2005) and Kane, Kumar, and
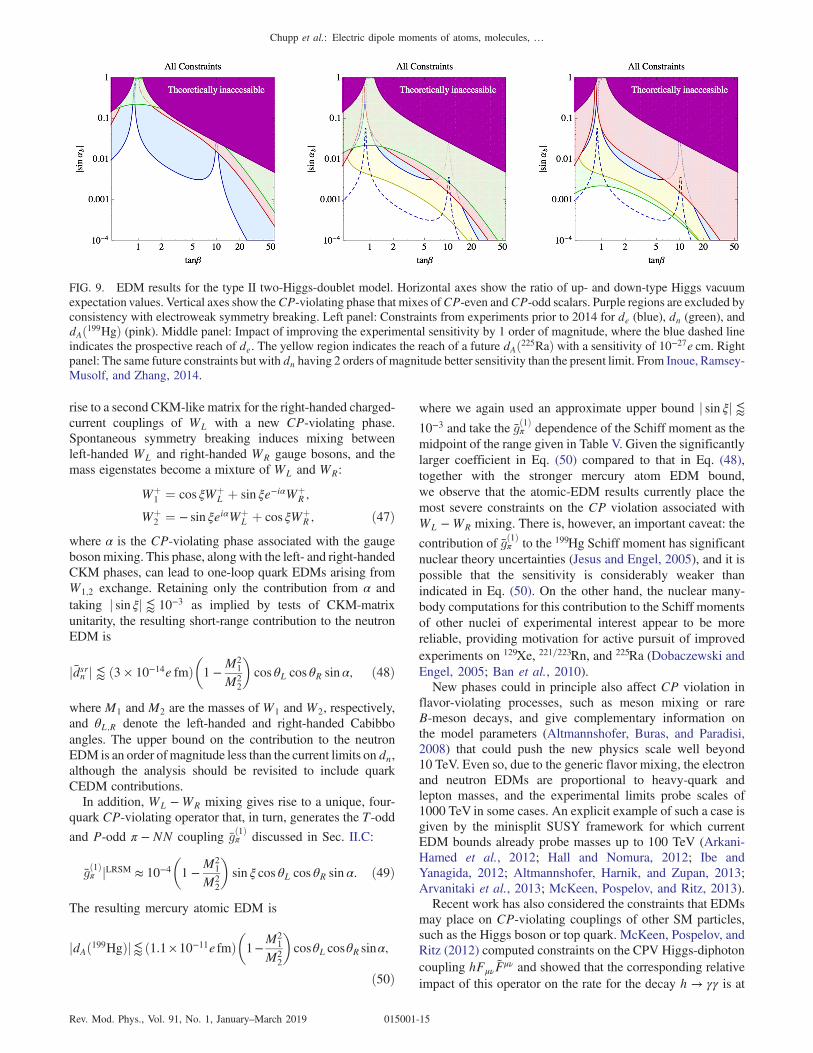
Shao (2010) considered a scenario in which the squark andslepton masses are considerably heavier than 1 TeV, while theelectroweak gauge bosons and Higgsinos remain relativelylight, leading to less constrained phases. Present LHC con-straints on squark masses are consistent with this possibility,although the LHC slepton mass bounds are much weaker. Inthis regime of heavy squarks and sleptons, electroweakbaryogenesis proceeds via CP-violating bino and/or winointeractions in the early Universe, while EDMs of firstgeneration fermions arise at two-loop order through thechargino-neutralino “Barr-Zee diagrams” shown in Fig. 8(Barr and Zee, 1990a, 1990b). Applying this scenario tosupersymmetric baryogenesis and relaxing the phase univer-sality assumption leads to the results given in Fig. 4, showingthat improvements in the sensitivities to de and dn by 1 and 2
f f
pp
μ(q)f
FIG. 6. One-loop fermion EDM generated by coupling toSUSY particles, f0 and χ. Adapted from Ellis, Lee, and Pilaftsis,2008.
qR
qLg qR
g
qL
FIG. 7. An example of BSM couplings of the CEDM to thegluon field g. The crossed-circle indicates interactions that mixthe left- and right-handed squarks. From Tardiff, 2009.
Chupp et al.: Electric dipole moments of atoms, molecules, …
Rev. Mod. Phys., Vol. 91, No. 1, January–March 2019 015001-13
orders of magnitude, respectively, would probe the entire CP-violating parameter space forMSSMbaryogenesis (Cirigliano,Profumo, and Ramsey-Musolf, 2006; Li, Profumo, andRamsey-Musolf, 2009; Cirigliano et al., 2010; Morrisseyand Ramsey-Musolf, 2012). Note that supersymmetric electro-weak baryogenesis requires not only sufficient CP violation,but also a strong first-order electroweak phase transition. LHCmeasurements of Higgs boson properties now render thispossibility unlikely in the MSSM (Curtin, Jaiswal, andMeade, 2012; Katz et al., 2015); however, Liebler, Profumo,and Stefaniak (2016) suggested that there are regions ofparameter space that can satisfy both the observed Higgs massand baryogenesis. On the other hand, extensions of the MSSMwith gauge singlet superfields presently allow for the neededfirst-order phase transition. In the context of these “next-to-minimal” scenarios,CP-violating sources could give rise to theobserved baryon asymmetry as indicated in Fig. 4.The discovery of the 125 GeV Higgs boson has raised anew
the possibility that it might be one of a number of scalars, anda wide array of possibilities for the “larger” Higgs sector havebeen considered over the years. One scenario that has beenstudied extensively is the two-Higgs-doublet model, whereinthe requirements of supersymmetry restrict the form of thescalar potential and the couplings of the two Higgs doublets to
the SM fermions. In the more general context, the two-Higgs-doublet model allows for a variety of additional CP-violatingphases that can give rise to EDMs. The phases may arise in thescalar potential and/or the amplitudes for scalar-fermioninteractions. The implications of new CP-violating phasesin the two-Higgs-doublet model have been analyzed by Inoue,Ramsey-Musolf, and Zhang (2014), who considered a poten-tial that manifests a softly broken Z2 symmetry in order toavoid constraints from the absence of flavor-changing neutralcurrents. (A Z2 symmetry is a discrete symmetry under phasereversals of the relevant fields.) In the absence of CP violationthe scalar spectrum contains two charged scalarsH� and threeneutral scalars: the CP-even H0 and h0 and the CP-odd A0.With the presence of CP-violating phases in the potential, thethree neutral scalars mix to form the neutral mass eigenstateshi, one of which is identified with the 125 GeV SM Higgs-likescalar. This CP-mixing translates into CP-violating phases inthe couplings of the hi to SM fermions, thereby inducingEDMs. In a variant of the two-Higgs-doublet model consid-ered by Inoue, Ramsey-Musolf, and Zhang (2014), therequirements of electroweak symmetry breaking imply thatthere exists only one CP-violating phase in the scalar sectorαb, which is responsible for both CP mixing among thescalars and the generation of EDMs. The latter arise from theBarr-Zee diagrams shown in Fig. 8.Constraints on αb as a function of tan β set by present and
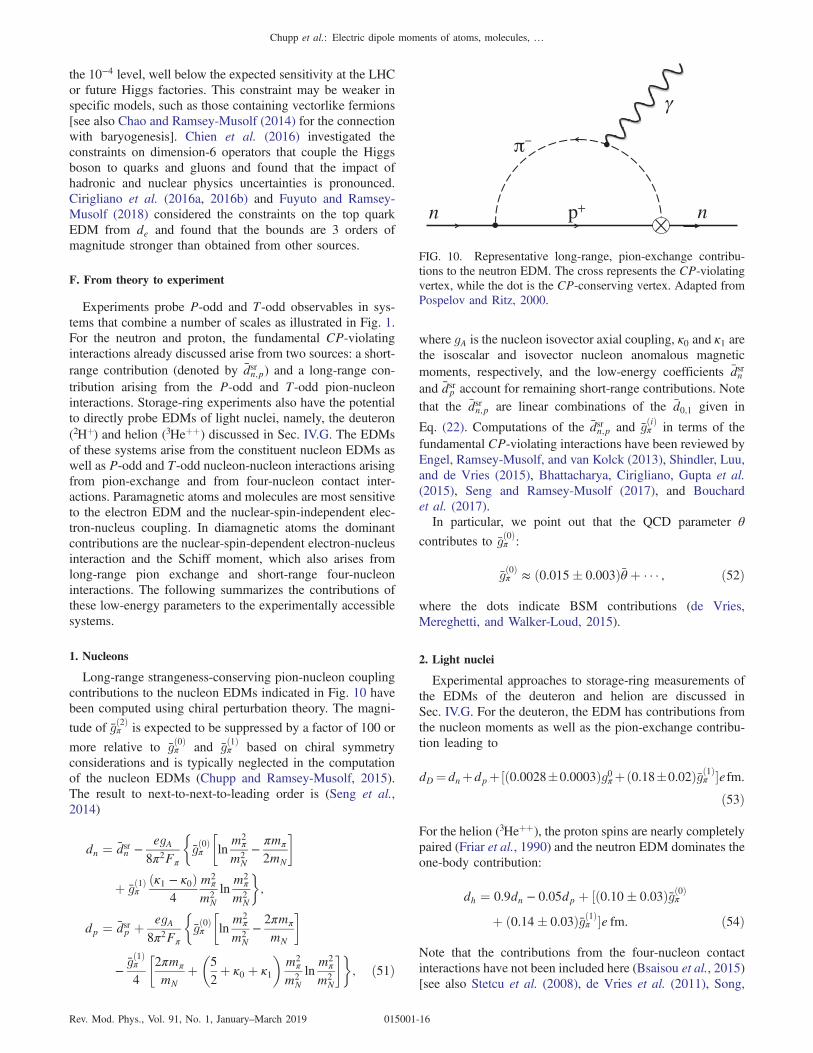
prospective EDM results are shown in Fig. 9 for the “type II”two-Higgs-doublet model [for an enumeration of severalvariants of the two-Higgs-doublet model, see, for example,Barger, Hewett, and Phillips (1990)]. The type II scenario hasthe same Yukawa structure as the MSSM. The de limit fromThO is generally the most restrictive, except in the vicinity oftan β ∼ 1 and ∼10. Bian, Liu, and Shu (2015) pointed out thatthe vanishing sensitivity to de near tan β ∼ 1 arises from acancellation between the effects of the induced CP-violatingcouplings of the Higgs-like scalar to the electron and thecorresponding couplings to the hFμνFμν operator associatedwith the upper loop of the Barr-Zee diagrams. The neutronand 199Hg EDMs are not susceptible to the same cancellationmechanism as the electron and provide additional constraintsnear tan β ∼ 1. The middle and far right panels show thesensitivity of prospective future EDM searches, includinganticipated results from 225Ra (Bishof et al., 2016). The reachof a 10 times more sensitive de search would extendsomewhat beyond the constraints from neutron and atomicsearches, except in the cancellation regions. More optimis-tically, any nonzero result could indicate whether or not theobserved EDM is consistent with CP violation in the two-Higgs-doublet model and help narrow the parameter space.6
Left-right symmetric models postulate the existence ofan SUð2ÞL × SUð2ÞR × Uð1ÞB−L symmetry in which parityviolation in the standard model arises from spontaneous break-down of the SUð2ÞR symmetry at a scale above the electroweakscale (MWR
≫ MWL) (Pati and Salam, 1974, 1975; Mohapatra
and Pati, 1975; Senjanovic and Mohapatra, 1975). This gives
, t , b
(g)
(g)
f f
H i
f
i±
f f
H i
f
FIG. 8. Example two-loop Barr-Zee diagrams that give rise to afermion EDM (coupling through γ) or CEDM (coupling throughg). Here τ is the τ slepton, t and b are squarks, and χ is thechargino. Adapted from Barr and Zee, 1990a.
6As indicated by Inoue, Ramsey-Musolf, and Zhang (2014), thereexist considerable hadronic and nuclear theory uncertainties asso-ciated with the dn and dA sensitivities.
Chupp et al.: Electric dipole moments of atoms, molecules, …
Rev. Mod. Phys., Vol. 91, No. 1, January–March 2019 015001-14
rise to a second CKM-like matrix for the right-handed charged-current couplings of WL with a new CP-violating phase.Spontaneous symmetry breaking induces mixing betweenleft-handed WL and right-handed WR gauge bosons, and themass eigenstates become a mixture of WL and WR:
Wþ1 ¼ cos ξWþ
L þ sin ξe−iαWþR ;
Wþ2 ¼ − sin ξeiαWþ
L þ cos ξWþR ; ð47Þ
where α is the CP-violating phase associated with the gaugebosonmixing. This phase, along with the left- and right-handedCKM phases, can lead to one-loop quark EDMs arising fromW1;2 exchange. Retaining only the contribution from α andtaking j sin ξj ⪅ 10−3 as implied by tests of CKM-matrixunitarity, the resulting short-range contribution to the neutronEDM is
jdsrn j ⪅ ð3 × 10⁻¹⁴e fmÞ�1 −
M21
M22
�cos θL cos θR sinα; ð48Þ
where M1 and M2 are the masses of W1 and W2, respectively,and θL;R denote the left-handed and right-handed Cabibboangles. The upper bound on the contribution to the neutronEDM is an order ofmagnitude less than the current limits on dn,although the analysis should be revisited to include quarkCEDM contributions.In addition, WL −WR mixing gives rise to a unique, four-
quark CP-violating operator that, in turn, generates the T-odd
and P-odd π − NN coupling gð1Þπ discussed in Sec. II.C:
gð1Þπ jLRSM ≈ 10−4�1 −
M21
M22
�sin ξ cos θL cos θR sin α: ð49Þ
The resulting mercury atomic EDM is
jdAð199HgÞj⪅ ð1.1×10⁻¹¹e fmÞ�1−
M21
M22
�cosθL cosθR sinα;
ð50Þ
where we again used an approximate upper bound j sin ξj ⪅10−3 and take the gð1Þπ dependence of the Schiff moment as themidpoint of the range given in Table V. Given the significantlylarger coefficient in Eq. (50) compared to that in Eq. (48),together with the stronger mercury atom EDM bound,we observe that the atomic-EDM results currently place themost severe constraints on the CP violation associated withWL −WR mixing. There is, however, an important caveat: the
contribution of gð1Þπ to the 199Hg Schiff moment has significantnuclear theory uncertainties (Jesus and Engel, 2005), and it ispossible that the sensitivity is considerably weaker thanindicated in Eq. (50). On the other hand, the nuclear many-body computations for this contribution to the Schiff momentsof other nuclei of experimental interest appear to be morereliable, providing motivation for active pursuit of improvedexperiments on 129Xe, 221=223Rn, and 225Ra (Dobaczewski andEngel, 2005; Ban et al., 2010).New phases could in principle also affect CP violation in
flavor-violating processes, such as meson mixing or rareB-meson decays, and give complementary information onthe model parameters (Altmannshofer, Buras, and Paradisi,2008) that could push the new physics scale well beyond10 TeV. Even so, due to the generic flavor mixing, the electronand neutron EDMs are proportional to heavy-quark andlepton masses, and the experimental limits probe scales of1000 TeV in some cases. An explicit example of such a case isgiven by the minisplit SUSY framework for which currentEDM bounds already probe masses up to 100 TeV (Arkani-Hamed et al., 2012; Hall and Nomura, 2012; Ibe andYanagida, 2012; Altmannshofer, Harnik, and Zupan, 2013;Arvanitaki et al., 2013; McKeen, Pospelov, and Ritz, 2013).Recent work has also considered the constraints that EDMs
may place on CP-violating couplings of other SM particles,such as the Higgs boson or top quark. McKeen, Pospelov, andRitz (2012) computed constraints on the CPV Higgs-diphotoncoupling hFμνFμν and showed that the corresponding relativeimpact of this operator on the rate for the decay h → γγ is at
FIG. 9. EDM results for the type II two-Higgs-doublet model. Horizontal axes show the ratio of up- and down-type Higgs vacuumexpectation values. Vertical axes show theCP-violating phase that mixes ofCP-even andCP-odd scalars. Purple regions are excluded byconsistency with electroweak symmetry breaking. Left panel: Constraints from experiments prior to 2014 for de (blue), dn (green), anddAð199HgÞ (pink). Middle panel: Impact of improving the experimental sensitivity by 1 order of magnitude, where the blue dashed lineindicates the prospective reach of de. The yellow region indicates the reach of a future dAð225RaÞ with a sensitivity of 10−27e cm. Rightpanel: The same future constraints but with dn having 2 orders of magnitude better sensitivity than the present limit. From Inoue, Ramsey-Musolf, and Zhang, 2014.
Chupp et al.: Electric dipole moments of atoms, molecules, …
Rev. Mod. Phys., Vol. 91, No. 1, January–March 2019 015001-15
the 10−4 level, well below the expected sensitivity at the LHCor future Higgs factories. This constraint may be weaker inspecific models, such as those containing vectorlike fermions[see also Chao and Ramsey-Musolf (2014) for the connectionwith baryogenesis]. Chien et al. (2016) investigated theconstraints on dimension-6 operators that couple the Higgsboson to quarks and gluons and found that the impact ofhadronic and nuclear physics uncertainties is pronounced.Cirigliano et al. (2016a, 2016b) and Fuyuto and Ramsey-Musolf (2018) considered the constraints on the top quarkEDM from de and found that the bounds are 3 orders ofmagnitude stronger than obtained from other sources.
F. From theory to experiment
Experiments probe P-odd and T-odd observables in sys-tems that combine a number of scales as illustrated in Fig. 1.For the neutron and proton, the fundamental CP-violatinginteractions already discussed arise from two sources: a short-range contribution (denoted by dsrn;p) and a long-range con-tribution arising from the P-odd and T-odd pion-nucleoninteractions. Storage-ring experiments also have the potentialto directly probe EDMs of light nuclei, namely, the deuteron(2Hþ) and helion (3Heþþ) discussed in Sec. IV.G. The EDMsof these systems arise from the constituent nucleon EDMs aswell as P-odd and T-odd nucleon-nucleon interactions arisingfrom pion-exchange and from four-nucleon contact inter-actions. Paramagnetic atoms and molecules are most sensitiveto the electron EDM and the nuclear-spin-independent elec-tron-nucleus coupling. In diamagnetic atoms the dominantcontributions are the nuclear-spin-dependent electron-nucleusinteraction and the Schiff moment, which also arises fromlong-range pion exchange and short-range four-nucleoninteractions. The following summarizes the contributions ofthese low-energy parameters to the experimentally accessiblesystems.
1. Nucleons
Long-range strangeness-conserving pion-nucleon couplingcontributions to the nucleon EDMs indicated in Fig. 10 havebeen computed using chiral perturbation theory. The magni-
tude of gð2Þπ is expected to be suppressed by a factor of 100 or
more relative to gð0Þπ and gð1Þπ based on chiral symmetryconsiderations and is typically neglected in the computationof the nucleon EDMs (Chupp and Ramsey-Musolf, 2015).The result to next-to-next-to-leading order is (Seng et al.,2014)
dn ¼ dsrn −egA
8π2Fπ
�gð0Þπ
�ln
m2π
m2N−πmπ
2mN
�
þ gð1Þπðκ1 − κ0Þ
4
m2π
m2Nln
m2π
m2N
�;
dp ¼ dsrp þ egA8π2Fπ
�gð0Þπ
�ln
m2π
m2N−2πmπ
mN
�
−gð1Þπ
4
�2πmπ
mNþ�5
2þ κ0 þ κ1
�m2
π
m2Nln
m2π
m2N
��; ð51Þ
where gA is the nucleon isovector axial coupling, κ0 and κ1 arethe isoscalar and isovector nucleon anomalous magneticmoments, respectively, and the low-energy coefficients dsrnand dsrp account for remaining short-range contributions. Notethat the dsrn;p are linear combinations of the d0;1 given in
Eq. (22). Computations of the dsrn;p and gðiÞπ in terms of thefundamental CP-violating interactions have been reviewed byEngel, Ramsey-Musolf, and van Kolck (2013), Shindler, Luu,and de Vries (2015), Bhattacharya, Cirigliano, Gupta et al.(2015), Seng and Ramsey-Musolf (2017), and Bouchardet al. (2017).In particular, we point out that the QCD parameter θ
contributes to gð0Þπ :
gð0Þπ ≈ ð0.015� 0.003Þθ þ � � � ; ð52Þ
where the dots indicate BSM contributions (de Vries,Mereghetti, and Walker-Loud, 2015).
2. Light nuclei
Experimental approaches to storage-ring measurements ofthe EDMs of the deuteron and helion are discussed inSec. IV.G. For the deuteron, the EDM has contributions fromthe nucleon moments as well as the pion-exchange contribu-tion leading to
dD¼dnþdpþ½ð0.0028�0.0003Þg0πþð0.18�0.02Þgð1Þπ �efm:
ð53Þ
For the helion (3Heþþ), the proton spins are nearly completelypaired (Friar et al., 1990) and the neutron EDM dominates theone-body contribution:
dh ¼ 0.9dn − 0.05dp þ ½ð0.10� 0.03Þgð0Þπ
þ ð0.14� 0.03Þgð1Þπ �e fm: ð54Þ
Note that the contributions from the four-nucleon contactinteractions have not been included here (Bsaisou et al., 2015)[see also Stetcu et al. (2008), de Vries et al. (2011), Song,
n p+n
FIG. 10. Representative long-range, pion-exchange contribu-tions to the neutron EDM. The cross represents the CP-violatingvertex, while the dot is the CP-conserving vertex. Adapted fromPospelov and Ritz, 2000.
Chupp et al.: Electric dipole moments of atoms, molecules, …
Rev. Mod. Phys., Vol. 91, No. 1, January–March 2019 015001-16
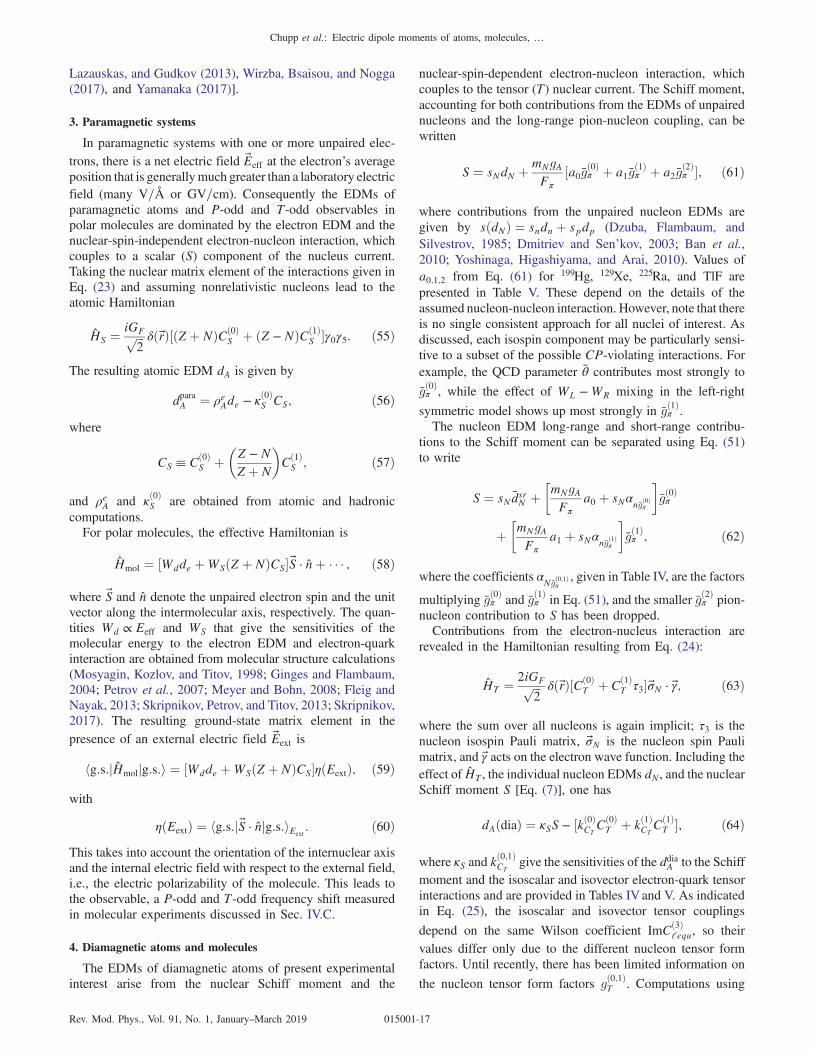
Lazauskas, and Gudkov (2013), Wirzba, Bsaisou, and Nogga(2017), and Yamanaka (2017)].
3. Paramagnetic systems
In paramagnetic systems with one or more unpaired elec-trons, there is a net electric field Eeff at the electron’s averageposition that is generallymuch greater than a laboratory electricfield (many V=Å or GV=cm). Consequently the EDMs ofparamagnetic atoms and P-odd and T-odd observables inpolar molecules are dominated by the electron EDM and thenuclear-spin-independent electron-nucleon interaction, whichcouples to a scalar (S) component of the nucleus current.Taking the nuclear matrix element of the interactions given inEq. (23) and assuming nonrelativistic nucleons lead to theatomic Hamiltonian
HS ¼iGFffiffiffi2
p δðrÞ½ðZ þ NÞCð0ÞS þ ðZ − NÞCð1Þ
S �γ0γ5. ð55Þ
The resulting atomic EDM dA is given by
dparaA ¼ ρeAde − κð0ÞS CS; ð56Þwhere
CS ≡ Cð0ÞS þ
�Z − NZ þ N
�Cð1ÞS ; ð57Þ
and ρeA and κð0ÞS are obtained from atomic and hadroniccomputations.For polar molecules, the effective Hamiltonian is
Hmol ¼ ½Wdde þWSðZ þ NÞCS�S · nþ � � � ; ð58Þ
where S and n denote the unpaired electron spin and the unitvector along the intermolecular axis, respectively. The quan-tities Wd ∝ Eeff and WS that give the sensitivities of themolecular energy to the electron EDM and electron-quarkinteraction are obtained from molecular structure calculations(Mosyagin, Kozlov, and Titov, 1998; Ginges and Flambaum,2004; Petrov et al., 2007; Meyer and Bohn, 2008; Fleig andNayak, 2013; Skripnikov, Petrov, and Titov, 2013; Skripnikov,2017). The resulting ground-state matrix element in thepresence of an external electric field Eext is
hg:s:jHmoljg:s:i ¼ ½Wdde þWSðZ þ NÞCS�ηðEextÞ; ð59Þ
with
ηðEextÞ ¼ hg:s:jS · njg:s:iEext: ð60Þ
This takes into account the orientation of the internuclear axisand the internal electric field with respect to the external field,i.e., the electric polarizability of the molecule. This leads tothe observable, a P-odd and T-odd frequency shift measuredin molecular experiments discussed in Sec. IV.C.
4. Diamagnetic atoms and molecules
The EDMs of diamagnetic atoms of present experimentalinterest arise from the nuclear Schiff moment and the
nuclear-spin-dependent electron-nucleon interaction, whichcouples to the tensor (T) nuclear current. The Schiff moment,accounting for both contributions from the EDMs of unpairednucleons and the long-range pion-nucleon coupling, can bewritten
S ¼ sNdN þmNgAFπ
½a0gð0Þπ þ a1gð1Þπ þ a2g
ð2Þπ �; ð61Þ
where contributions from the unpaired nucleon EDMs aregiven by sðdNÞ ¼ sndn þ spdp (Dzuba, Flambaum, andSilvestrov, 1985; Dmitriev and Sen’kov, 2003; Ban et al.,2010; Yoshinaga, Higashiyama, and Arai, 2010). Values ofa0;1;2 from Eq. (61) for 199Hg, 129Xe, 225Ra, and TlF arepresented in Table V. These depend on the details of theassumed nucleon-nucleon interaction. However, note that thereis no single consistent approach for all nuclei of interest. Asdiscussed, each isospin component may be particularly sensi-tive to a subset of the possible CP-violating interactions. Forexample, the QCD parameter θ contributes most strongly to
gð0Þπ , while the effect of WL −WR mixing in the left-right
symmetric model shows up most strongly in gð1Þπ .The nucleon EDM long-range and short-range contribu-
tions to the Schiff moment can be separated using Eq. (51)to write
S ¼ sNdsrN þ�mNgAFπ
a0 þ sNαngð0Þπ
�gð0Þπ
þ�mNgAFπ
a1 þ sNαngð1Þπ
�gð1Þπ ; ð62Þ
where the coefficients αNgð0;1Þπ, given in Table IV, are the factors
multiplying gð0Þπ and gð1Þπ in Eq. (51), and the smaller gð2Þπ pion-nucleon contribution to S has been dropped.Contributions from the electron-nucleus interaction are
revealed in the Hamiltonian resulting from Eq. (24):
HT ¼ 2iGFffiffiffi2
p δðrÞ½Cð0ÞT þ Cð1Þ
T τ3�σN · γ; ð63Þ
where the sum over all nucleons is again implicit; τ3 is thenucleon isospin Pauli matrix, σN is the nucleon spin Paulimatrix, and γ acts on the electron wave function. Including theeffect of HT , the individual nucleon EDMs dN , and the nuclearSchiff moment S [Eq. (7)], one has
dAðdiaÞ ¼ κSS − ½kð0ÞCTCð0ÞT þ kð1ÞCT
Cð1ÞT �; ð64Þ
where κS and kð0;1ÞCT
give the sensitivities of the ddiaA to the Schiffmoment and the isoscalar and isovector electron-quark tensorinteractions and are provided in Tables IVand V. As indicatedin Eq. (25), the isoscalar and isovector tensor couplings
depend on the same Wilson coefficient ImCð3Þlequ, so their
values differ only due to the different nucleon tensor formfactors. Until recently, there has been limited information on
the nucleon tensor form factors gð0;1ÞT . Computations using
Chupp et al.: Electric dipole moments of atoms, molecules, …
Rev. Mod. Phys., Vol. 91, No. 1, January–March 2019 015001-17
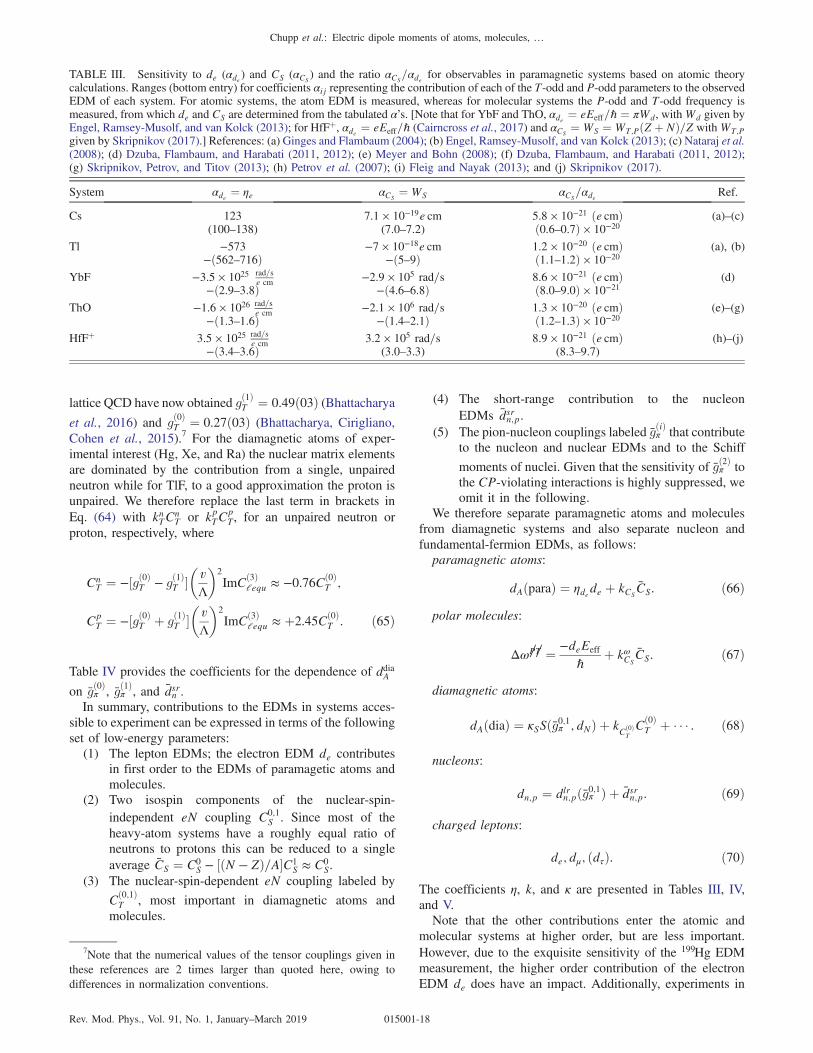
lattice QCD have now obtained gð1ÞT ¼ 0.49ð03Þ (Bhattacharyaet al., 2016) and gð0ÞT ¼ 0.27ð03Þ (Bhattacharya, Cirigliano,Cohen et al., 2015).7 For the diamagnetic atoms of exper-imental interest (Hg, Xe, and Ra) the nuclear matrix elementsare dominated by the contribution from a single, unpairedneutron while for TlF, to a good approximation the proton isunpaired. We therefore replace the last term in brackets inEq. (64) with knTC
nT or kpTC
pT, for an unpaired neutron or
proton, respectively, where
CnT ¼ −½gð0ÞT − gð1ÞT �
�vΛ
�2
ImCð3Þlequ ≈ −0.76Cð0Þ
T ;
CpT ¼ −½gð0ÞT þ gð1ÞT �
�vΛ
�2
ImCð3Þlequ ≈ þ2.45Cð0Þ
T : ð65Þ
Table IV provides the coefficients for the dependence of ddiaA
on gð0Þπ , gð1Þπ , and dsrn .In summary, contributions to the EDMs in systems acces-
sible to experiment can be expressed in terms of the followingset of low-energy parameters:
(1) The lepton EDMs; the electron EDM de contributesin first order to the EDMs of paramagetic atoms andmolecules.
(2) Two isospin components of the nuclear-spin-independent eN coupling C0;1
S . Since most of theheavy-atom systems have a roughly equal ratio ofneutrons to protons this can be reduced to a singleaverage CS ¼ C0
S − ½ðN − ZÞ=A�C1S ≈ C0
S.(3) The nuclear-spin-dependent eN coupling labeled by
Cð0;1ÞT , most important in diamagnetic atoms and
molecules.
(4) The short-range contribution to the nucleonEDMs dsrn;p.
(5) The pion-nucleon couplings labeled gðiÞπ that contributeto the nucleon and nuclear EDMs and to the Schiff
moments of nuclei. Given that the sensitivity of gð2Þπ tothe CP-violating interactions is highly suppressed, weomit it in the following.
We therefore separate paramagnetic atoms and moleculesfrom diamagnetic systems and also separate nucleon andfundamental-fermion EDMs, as follows:paramagnetic atoms:
dAðparaÞ ¼ ηdede þ kCSCS. ð66Þ
polar molecules:
Δω=P=T ¼ −deEeff
ℏþ kωCS
CS. ð67Þ
diamagnetic atoms:
dAðdiaÞ ¼ κSSðg0;1π ; dNÞ þ kCð0ÞTCð0ÞT þ � � � . ð68Þ
nucleons:
dn;p ¼ dlrn;pðg0;1π Þ þ dsrn;p. ð69Þ
charged leptons:
de; dμ; ðdτÞ. ð70Þ
The coefficients η, k, and κ are presented in Tables III, IV,and V.Note that the other contributions enter the atomic and
molecular systems at higher order, but are less important.However, due to the exquisite sensitivity of the 199Hg EDMmeasurement, the higher order contribution of the electronEDM de does have an impact. Additionally, experiments in
TABLE III. Sensitivity to de (αde ) and CS (αCS) and the ratio αCS
=αde for observables in paramagnetic systems based on atomic theorycalculations. Ranges (bottom entry) for coefficients αij representing the contribution of each of the T-odd and P-odd parameters to the observedEDM of each system. For atomic systems, the atom EDM is measured, whereas for molecular systems the P-odd and T-odd frequency ismeasured, from which de and CS are determined from the tabulated α’s. [Note that for YbF and ThO, αde ¼ eEeff=ℏ ¼ πWd, withWd given byEngel, Ramsey-Musolf, and van Kolck (2013); for HfFþ, αde ¼ eEeff=ℏ (Cairncross et al., 2017) and αCS
¼ WS ¼ WT;PðZ þ NÞ=Z withWT;Pgiven by Skripnikov (2017).] References: (a) Ginges and Flambaum (2004); (b) Engel, Ramsey-Musolf, and van Kolck (2013); (c) Nataraj et al.(2008); (d) Dzuba, Flambaum, and Harabati (2011, 2012); (e) Meyer and Bohn (2008); (f) Dzuba, Flambaum, and Harabati (2011, 2012);(g) Skripnikov, Petrov, and Titov (2013); (h) Petrov et al. (2007); (i) Fleig and Nayak (2013); and (j) Skripnikov (2017).
System αde ¼ ηe αCS¼ WS αCS
=αde Ref.
Cs 123 7.1 × 10⁻¹⁹e cm 5.8 × 10⁻²¹ ðe cmÞ (a)–(c)(100–138) (7.0–7.2) ð0.6–0.7Þ × 10−20
Tl −573 −7 × 10⁻¹⁸e cm 1.2 × 10⁻²⁰ ðe cmÞ (a), (b)−ð562–716Þ −ð5–9Þ ð1.1–1.2Þ × 10−20
YbF −3.5 × 1025 rad=se cm −2.9 × 10⁵ rad=s 8.6 × 10⁻²¹ ðe cmÞ (d)
−ð2.9–3.8Þ −ð4.6–6.8Þ ð8.0–9.0Þ × 10−21
ThO −1.6 × 1026 rad=se cm −2.1 × 10⁶ rad=s 1.3 × 10⁻²⁰ ðe cmÞ (e)–(g)
−ð1.3–1.6Þ −ð1.4–2.1Þ ð1.2–1.3Þ × 10−20
HfFþ 3.5 × 1025 rad=se cm 3.2 × 10⁵ rad=s 8.9 × 10⁻²¹ ðe cmÞ (h)–(j)
−ð3.4–3.6Þ (3.0–3.3) (8.3–9.7)
7Note that the numerical values of the tensor couplings given inthese references are 2 times larger than quoted here, owing todifferences in normalization conventions.
Chupp et al.: Electric dipole moments of atoms, molecules, …
Rev. Mod. Phys., Vol. 91, No. 1, January–March 2019 015001-18

paramagnetic solid-state systems with quasifree electrons aredirectly sensitive to de.
III. EXPERIMENTAL TECHNIQUES
The crux of any EDM measurement is to measure the effectof the coupling to an electric field in the background of muchlarger magnetic effects using the unique P-odd and T-oddsignature. Most EDM experiments using beams or cells aremagnetic resonance approaches that measure the energy or,more commonly, frequency given in Eq. (5) of transitionsbetween magnetic sublevels in the presence of a well-controlled magnetic field B, and electric field E aligned eitherparallel or antiparallel to B. Storage-ring experiments withcharged particles measure the result of the additional torque on
the spin due to d × E, where E may arise in part from themotional field v × B. In solid-state electron-EDM experi-ments, the observable is proportional to B · E, where only onefield is applied and the other measured; for example, a strong
electric field Eapplied would polarize electron spins in the
material giving rise to an observable magnetic field Bobserved.Because every system of interest has a magnetic moment,
the magnetic environment is crucial and the magnetic fieldmust be characterized in space and time. Magnetic shielding,magnetic sensors external to the EDM volume, and comagne-tometers that monitor the magnetic field within the EDMvolume during the EDM measurement are all essentialelements of past and future experiments. Comagnetometerspecies are chosen because they are less sensitive to P-odd andT-odd effects than the key species. For example, a 199Hgcomagnetometer was used for the neutron-EDM experiment(Baker et al., 2006), and Na was used as a comagnetometerfor Cs (Weisskopf, 1968) and Tl (Regan et al., 2002). Themeasurement of the 129Xe EDM utilized 3He as the comagne-tometer species (Rosenberry, 2001). In the case of polarmolecules discussed in Sec. IV.C, the comagnetometer can beeffected with one molecular species using combinationsof transitions (Hudson et al., 2002; Baron et al., 2014;Cairncross et al., 2017).
TABLE IV. Coefficients for P-odd and T-odd parameter contributions to EDMs for diamagnetic systems and the neutron. The second line foreach entry is the reasonable range for each coefficient. The ∂dexp=∂de and ∂dexp=∂CS are from Ginges and Flambaum (2004) and are based onMårtensson-Pendrill (1985) and Mårtensson-Pendrill and Öster (1987) for 129Xe and 199Hg. Also see Fleig and Jung (2018) for 199Hg. The∂dexp=∂de and ∂dexp=∂CS for TlF are compiled by Cho, Sangster, and Hinds (1991). The ∂dexp=∂Cð0Þ
T are adjusted for the unpaired neutron in129Xe, 199Hg, and 225Ra using kT from Ginges and Flambaum (2004) and is consistent with Sahoo (2017). For 225Ra ∂dexp=∂Cð0Þ
T is from Dzuba,
Flambaum, and Porsev (2009) and Singh and Sahoo (2015a). The gð0Þπ , gð1Þπ , and dsrn coefficients for atoms and molecules are based on dataprovided in Table V; the range for 225Ra corresponds to 0 ≤ sn ≤ 2 fm2. For TlF, the unpaired neutron is replaced by an unpaired proton and the“best value” assumes dsrp ¼ −dsrn , i.e., mostly isovector in analogy to the anomalous magnetic moment, while the range is defined byjdsrp j ≤ jdsrn j.System ∂dexp=∂de ∂dexp=∂CS ðe cmÞ ∂dexp=∂Cð0Þ
T ðe cmÞ ∂dexp=∂gð0Þπ ðe cmÞ ∂dexp=∂gð1Þπ ðe cmÞ ∂dexp=∂dsrnNeutron 1.5 × 10⁻¹⁴ 1.4 × 10⁻¹⁶ 1
129Xe −0.0008 −4.4 × 10⁻²³ −6.1 × 10⁻²¹ −0.4 × 10⁻¹⁹ −2.2 × 10⁻¹⁹ 1.7 × 10⁻⁵
−4.4 − ð−5.6Þ −6.1 − ð−9.1Þ −23.4 − ð1.8Þ −19 − ð−1.1Þ 1.7–2.4199Hg −0.014 −5.9 × 10⁻²² 3.0 × 10⁻²⁰ −11.8 × 10⁻¹⁸ 0 −5.3 × 10⁻⁴
−0.014 − 0.012 3.0–9.0 −38 − ð−9.9Þ ð−4.9 − 1.6Þ × 10−17 −7.7 − ð−5.2Þ225Ra 5.3 × 10⁻²⁰ 1.7 × 10⁻¹⁵ −6.9 × 10⁻¹⁵
5.3–10.0 6.9–0.9 −27.5 − ð−3.8Þ ð−1.6 − 0Þ × 10−3
TlF 81 2.9 × 10⁻¹⁸ 2.7 × 10⁻¹⁶ 1.9 × 10⁻¹⁴ −1.6 × 10⁻¹³ 0.460.5–2 −0.5 − 0.5
TABLE V. Ranges and “best values” used in Chupp and Ramsey-Musolf (2015) for atomic-EDM sensitivity to the Schiff moment anddependence of the Schiff moments on gð0Þπ and gð1Þπ ; κS and sN . References: TlF (Coveney and Sandars, 1983); Hg (Flambaum, Khriplovich, andSushkov, 1986; Dzuba et al., 2002; Singh and Sahoo, 2015b); Xe (Dzuba, Flambaum, and Silvestrov, 1985; Dzuba et al., 2002; Teruya et al.,2017); Ra (Spevak, Auerbach, and Flambaum, 1997; Dzuba et al., 2002; Singh and Sahoo, 2015a). Values for a0, a1, and a2 are compiledin Engel, Ramsey-Musolf, and van Kolck (2013). The value of sn is from Dzuba, Flambaum, and Silvestrov (1985) for 129Xe and fromDmitriev and Sen’kov (2003) for 199Hg; there is no available calculation of sn for 225Ra. The value for sp for TlF is derived from Cho, Sangster,and Hinds (1991).
System κS ¼ dS ðcm=fm3Þ a0 ¼ S
13.5gð0Þπ
ðe fm3Þ a1 ¼ S13.5gð1Þπ
ðe fm3Þ a2 ¼ S13.5gð2Þπ
ðe fm3Þ sN ðfm2Þ129Xe 0.27 × 10⁻¹⁷ (0.27–0.38) −0.008½−0.005 − ð−0.05Þ� −0.006½−0.003 − ð−0.05Þ� −0.009½−0.005 − ð−0.1Þ� 0.63199Hg −2.8 × 10⁻¹⁷ [−4.0 − ð−2.8Þ] 0.01 (0.005–0.05) �0.02 ð−0.03 − 0.09Þ 0.02(0.01–0.06) 1.895� 0.035225Ra −8.5 × 10⁻¹⁷ [−8.5 − ð−6.8Þ] −1.5½−6 − ð−1Þ� þ6.0 (4–24) −4.0½−15 − ð−3Þ�TlF −7.4 × 10⁻¹⁴ −0.0124 0.1612 −0.0248 0.62
Chupp et al.: Electric dipole moments of atoms, molecules, …
Rev. Mod. Phys., Vol. 91, No. 1, January–March 2019 015001-19
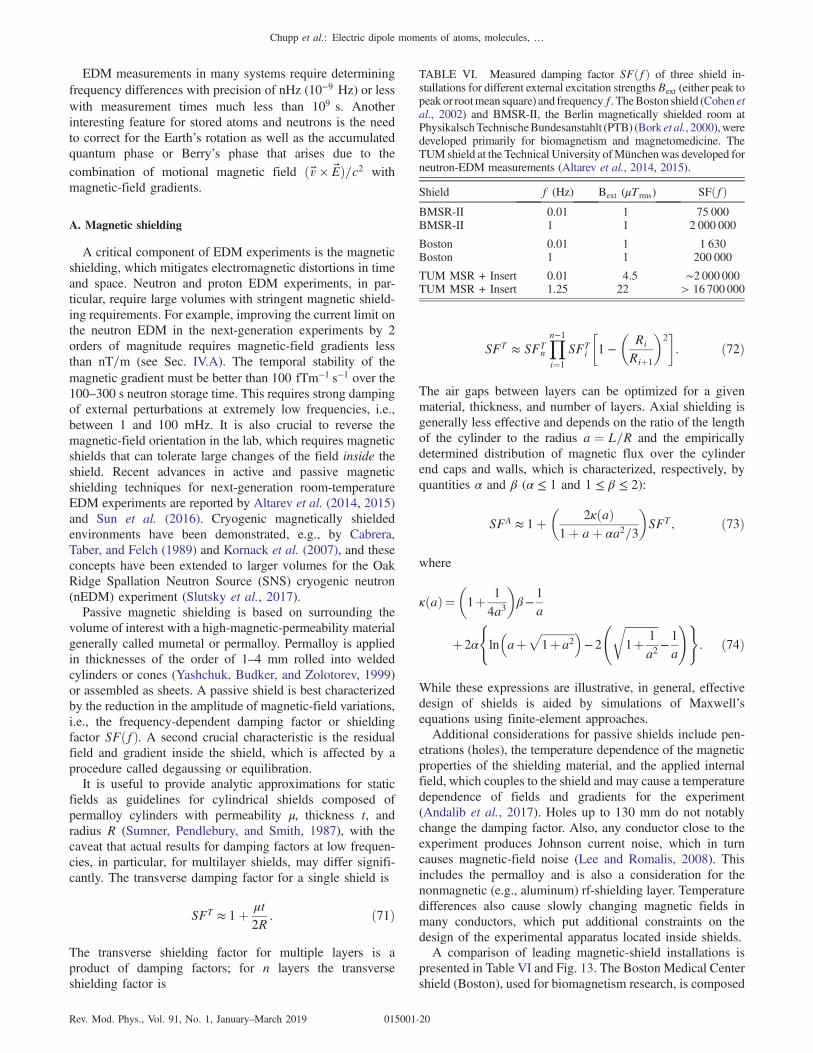
EDM measurements in many systems require determiningfrequency differences with precision of nHz (10−9 Hz) or lesswith measurement times much less than 109 s. Anotherinteresting feature for stored atoms and neutrons is the needto correct for the Earth’s rotation as well as the accumulatedquantum phase or Berry’s phase that arises due to thecombination of motional magnetic field ðv × EÞ=c2 withmagnetic-field gradients.
A. Magnetic shielding
A critical component of EDM experiments is the magneticshielding, which mitigates electromagnetic distortions in timeand space. Neutron and proton EDM experiments, in par-ticular, require large volumes with stringent magnetic shield-ing requirements. For example, improving the current limit onthe neutron EDM in the next-generation experiments by 2orders of magnitude requires magnetic-field gradients lessthan nT=m (see Sec. IV.A). The temporal stability of themagnetic gradient must be better than 100 fTm−1 s−1 over the100–300 s neutron storage time. This requires strong dampingof external perturbations at extremely low frequencies, i.e.,between 1 and 100 mHz. It is also crucial to reverse themagnetic-field orientation in the lab, which requires magneticshields that can tolerate large changes of the field inside theshield. Recent advances in active and passive magneticshielding techniques for next-generation room-temperatureEDM experiments are reported by Altarev et al. (2014, 2015)and Sun et al. (2016). Cryogenic magnetically shieldedenvironments have been demonstrated, e.g., by Cabrera,Taber, and Felch (1989) and Kornack et al. (2007), and theseconcepts have been extended to larger volumes for the OakRidge Spallation Neutron Source (SNS) cryogenic neutron(nEDM) experiment (Slutsky et al., 2017).Passive magnetic shielding is based on surrounding the
volume of interest with a high-magnetic-permeability materialgenerally called mumetal or permalloy. Permalloy is appliedin thicknesses of the order of 1–4 mm rolled into weldedcylinders or cones (Yashchuk, Budker, and Zolotorev, 1999)or assembled as sheets. A passive shield is best characterizedby the reduction in the amplitude of magnetic-field variations,i.e., the frequency-dependent damping factor or shieldingfactor SFðfÞ. A second crucial characteristic is the residualfield and gradient inside the shield, which is affected by aprocedure called degaussing or equilibration.It is useful to provide analytic approximations for static
fields as guidelines for cylindrical shields composed ofpermalloy cylinders with permeability μ, thickness t, andradius R (Sumner, Pendlebury, and Smith, 1987), with thecaveat that actual results for damping factors at low frequen-cies, in particular, for multilayer shields, may differ signifi-cantly. The transverse damping factor for a single shield is
SFT ≈ 1þ μt2R
: ð71Þ
The transverse shielding factor for multiple layers is aproduct of damping factors; for n layers the transverseshielding factor is
SFT ≈ SFTn
Yn−1i¼1
SFTi
�1 −
�Ri
Riþ1
�2�: ð72Þ
The air gaps between layers can be optimized for a givenmaterial, thickness, and number of layers. Axial shielding isgenerally less effective and depends on the ratio of the lengthof the cylinder to the radius a ¼ L=R and the empiricallydetermined distribution of magnetic flux over the cylinderend caps and walls, which is characterized, respectively, byquantities α and β (α ≤ 1 and 1 ≤ β ≤ 2):
SFA ≈ 1þ�
2κðaÞ1þ aþ αa2=3
�SFT; ð73Þ
where
κðaÞ¼�1þ 1
4a3
�β−
1
a
þ2α
(lnaþ
ffiffiffiffiffiffiffiffiffiffiffiffi1þa2
p −2
ffiffiffiffiffiffiffiffiffiffiffiffi1þ 1
a2
r−1
a
!): ð74Þ
While these expressions are illustrative, in general, effectivedesign of shields is aided by simulations of Maxwell’sequations using finite-element approaches.Additional considerations for passive shields include pen-
etrations (holes), the temperature dependence of the magneticproperties of the shielding material, and the applied internalfield, which couples to the shield and may cause a temperaturedependence of fields and gradients for the experiment(Andalib et al., 2017). Holes up to 130 mm do not notablychange the damping factor. Also, any conductor close to theexperiment produces Johnson current noise, which in turncauses magnetic-field noise (Lee and Romalis, 2008). Thisincludes the permalloy and is also a consideration for thenonmagnetic (e.g., aluminum) rf-shielding layer. Temperaturedifferences also cause slowly changing magnetic fields inmany conductors, which put additional constraints on thedesign of the experimental apparatus located inside shields.A comparison of leading magnetic-shield installations is
presented in Table VI and Fig. 13. The Boston Medical Centershield (Boston), used for biomagnetism research, is composed
TABLE VI. Measured damping factor SFðfÞ of three shield in-stallations for different external excitation strengthsBext (either peak topeakor rootmean square) and frequencyf. TheBoston shield (Cohen etal., 2002) and BMSR-II, the Berlin magnetically shielded room atPhysikalschTechnischeBundesanstahlt (PTB) (Bork et al., 2000),weredeveloped primarily for biomagnetism and magnetomedicine. TheTUM shield at the Technical University ofMunchen was developed forneutron-EDM measurements (Altarev et al., 2014, 2015).
Shield f (Hz) Bext (μTrms) SFðfÞBMSR-II 0.01 1 75 000BMSR-II 1 1 2 000 000
Boston 0.01 1 1 630Boston 1 1 200 000
TUM MSR + Insert 0.01 4.5 ∼2 000 000TUM MSR + Insert 1.25 22 > 16 700 000
Chupp et al.: Electric dipole moments of atoms, molecules, …
Rev. Mod. Phys., Vol. 91, No. 1, January–March 2019 015001-20
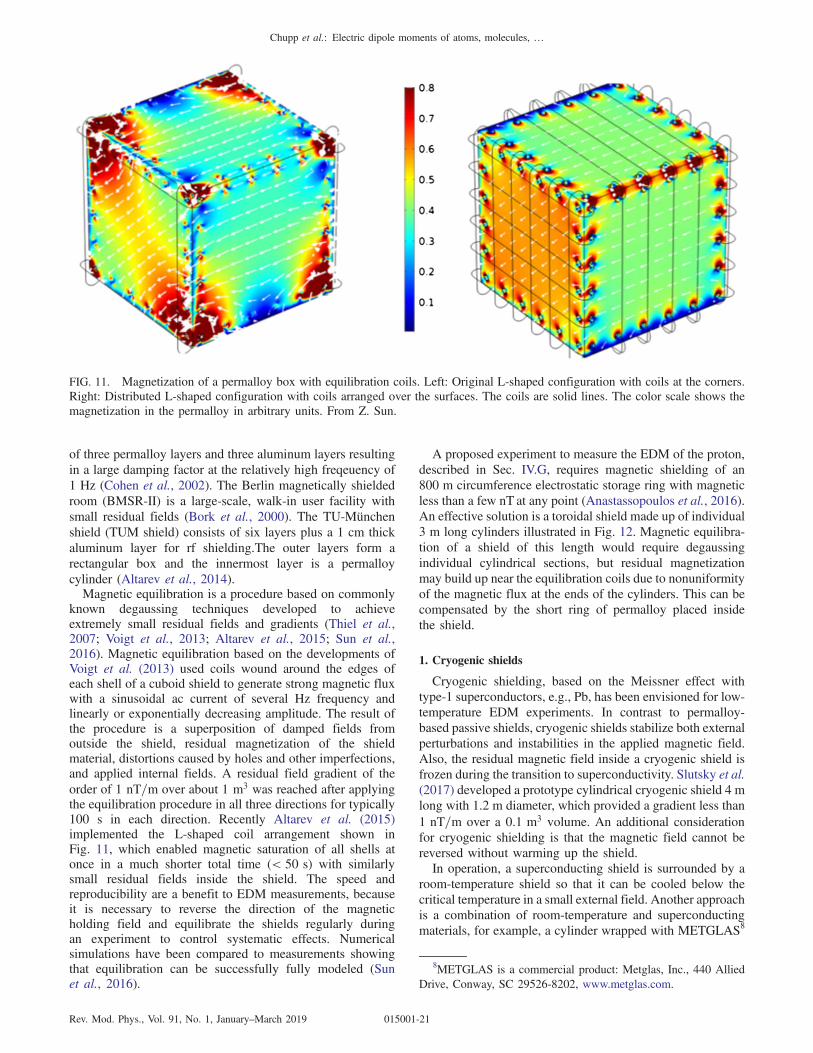
of three permalloy layers and three aluminum layers resultingin a large damping factor at the relatively high freqeuency of1 Hz (Cohen et al., 2002). The Berlin magnetically shieldedroom (BMSR-II) is a large-scale, walk-in user facility withsmall residual fields (Bork et al., 2000). The TU-Munchenshield (TUM shield) consists of six layers plus a 1 cm thickaluminum layer for rf shielding.The outer layers form arectangular box and the innermost layer is a permalloycylinder (Altarev et al., 2014).Magnetic equilibration is a procedure based on commonly
known degaussing techniques developed to achieveextremely small residual fields and gradients (Thiel et al.,2007; Voigt et al., 2013; Altarev et al., 2015; Sun et al.,2016). Magnetic equilibration based on the developments ofVoigt et al. (2013) used coils wound around the edges ofeach shell of a cuboid shield to generate strong magnetic fluxwith a sinusoidal ac current of several Hz frequency andlinearly or exponentially decreasing amplitude. The result ofthe procedure is a superposition of damped fields fromoutside the shield, residual magnetization of the shieldmaterial, distortions caused by holes and other imperfections,and applied internal fields. A residual field gradient of theorder of 1 nT=m over about 1 m3 was reached after applyingthe equilibration procedure in all three directions for typically100 s in each direction. Recently Altarev et al. (2015)implemented the L-shaped coil arrangement shown inFig. 11, which enabled magnetic saturation of all shells atonce in a much shorter total time (< 50 s) with similarlysmall residual fields inside the shield. The speed andreproducibility are a benefit to EDM measurements, becauseit is necessary to reverse the direction of the magneticholding field and equilibrate the shields regularly duringan experiment to control systematic effects. Numericalsimulations have been compared to measurements showingthat equilibration can be successfully fully modeled (Sunet al., 2016).
A proposed experiment to measure the EDM of the proton,described in Sec. IV.G, requires magnetic shielding of an800 m circumference electrostatic storage ring with magneticless than a few nT at any point (Anastassopoulos et al., 2016).An effective solution is a toroidal shield made up of individual3 m long cylinders illustrated in Fig. 12. Magnetic equilibra-tion of a shield of this length would require degaussingindividual cylindrical sections, but residual magnetizationmay build up near the equilibration coils due to nonuniformityof the magnetic flux at the ends of the cylinders. This can becompensated by the short ring of permalloy placed insidethe shield.
1. Cryogenic shields
Cryogenic shielding, based on the Meissner effect withtype-1 superconductors, e.g., Pb, has been envisioned for low-temperature EDM experiments. In contrast to permalloy-based passive shields, cryogenic shields stabilize both externalperturbations and instabilities in the applied magnetic field.Also, the residual magnetic field inside a cryogenic shield isfrozen during the transition to superconductivity. Slutsky et al.(2017) developed a prototype cylindrical cryogenic shield 4 mlong with 1.2 m diameter, which provided a gradient less than1 nT=m over a 0.1 m3 volume. An additional considerationfor cryogenic shielding is that the magnetic field cannot bereversed without warming up the shield.In operation, a superconducting shield is surrounded by a
room-temperature shield so that it can be cooled below thecritical temperature in a small external field. Another approachis a combination of room-temperature and superconductingmaterials, for example, a cylinder wrapped with METGLAS8
FIG. 11. Magnetization of a permalloy box with equilibration coils. Left: Original L-shaped configuration with coils at the corners.Right: Distributed L-shaped configuration with coils arranged over the surfaces. The coils are solid lines. The color scale shows themagnetization in the permalloy in arbitrary units. From Z. Sun.
8METGLAS is a commercial product: Metglas, Inc., 440 AlliedDrive, Conway, SC 29526-8202, www.metglas.com.
Chupp et al.: Electric dipole moments of atoms, molecules, …
Rev. Mod. Phys., Vol. 91, No. 1, January–March 2019 015001-21
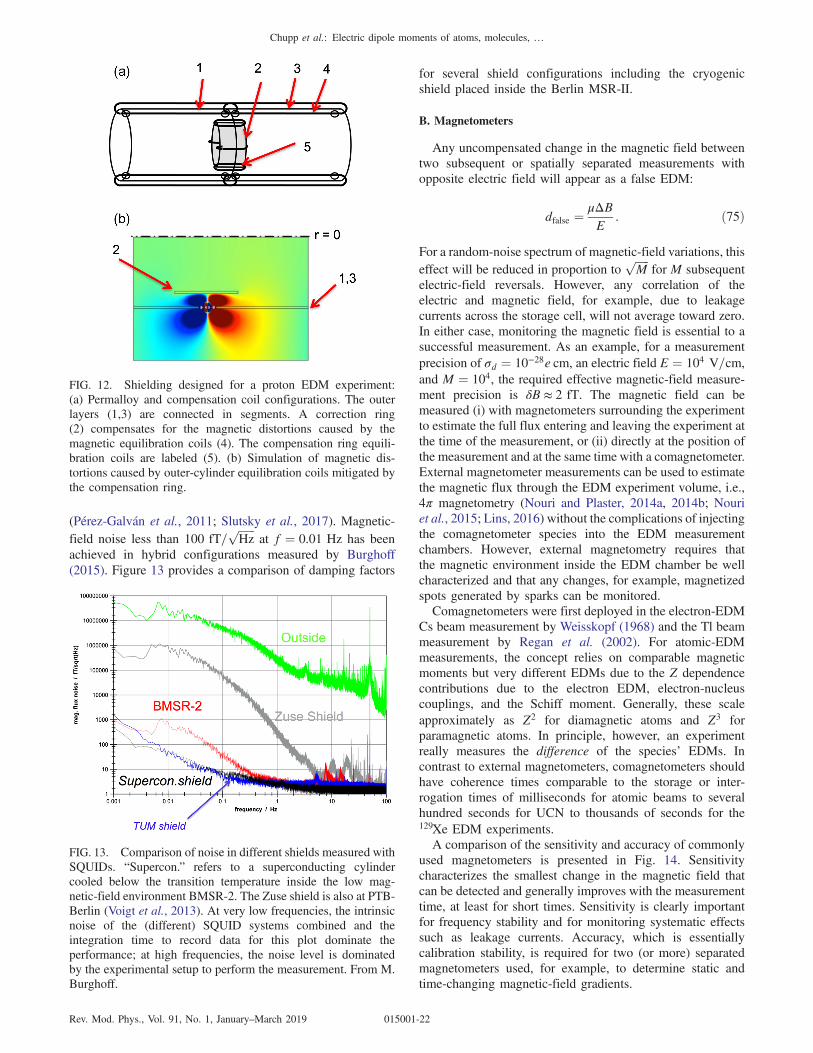
(Perez-Galván et al., 2011; Slutsky et al., 2017). Magnetic-field noise less than 100 fT=
ffiffiffiffiffiffiHz
pat f ¼ 0.01 Hz has been
achieved in hybrid configurations measured by Burghoff(2015). Figure 13 provides a comparison of damping factors
for several shield configurations including the cryogenicshield placed inside the Berlin MSR-II.
B. Magnetometers
Any uncompensated change in the magnetic field betweentwo subsequent or spatially separated measurements withopposite electric field will appear as a false EDM:
dfalse ¼μΔBE
: ð75Þ
For a random-noise spectrum of magnetic-field variations, thiseffect will be reduced in proportion to
ffiffiffiffiffiM
pfor M subsequent
electric-field reversals. However, any correlation of theelectric and magnetic field, for example, due to leakagecurrents across the storage cell, will not average toward zero.In either case, monitoring the magnetic field is essential to asuccessful measurement. As an example, for a measurementprecision of σd ¼ 10−28e cm, an electric field E ¼ 104 V=cm,and M ¼ 104, the required effective magnetic-field measure-ment precision is δB ≈ 2 fT. The magnetic field can bemeasured (i) with magnetometers surrounding the experimentto estimate the full flux entering and leaving the experiment atthe time of the measurement, or (ii) directly at the position ofthe measurement and at the same time with a comagnetometer.External magnetometer measurements can be used to estimatethe magnetic flux through the EDM experiment volume, i.e.,4π magnetometry (Nouri and Plaster, 2014a, 2014b; Nouriet al., 2015; Lins, 2016) without the complications of injectingthe comagnetometer species into the EDM measurementchambers. However, external magnetometry requires thatthe magnetic environment inside the EDM chamber be wellcharacterized and that any changes, for example, magnetizedspots generated by sparks can be monitored.Comagnetometers were first deployed in the electron-EDM
Cs beam measurement by Weisskopf (1968) and the Tl beammeasurement by Regan et al. (2002). For atomic-EDMmeasurements, the concept relies on comparable magneticmoments but very different EDMs due to the Z dependencecontributions due to the electron EDM, electron-nucleuscouplings, and the Schiff moment. Generally, these scaleapproximately as Z2 for diamagnetic atoms and Z3 forparamagnetic atoms. In principle, however, an experimentreally measures the difference of the species’ EDMs. Incontrast to external magnetometers, comagnetometers shouldhave coherence times comparable to the storage or inter-rogation times of milliseconds for atomic beams to severalhundred seconds for UCN to thousands of seconds for the129Xe EDM experiments.A comparison of the sensitivity and accuracy of commonly
used magnetometers is presented in Fig. 14. Sensitivitycharacterizes the smallest change in the magnetic field thatcan be detected and generally improves with the measurementtime, at least for short times. Sensitivity is clearly importantfor frequency stability and for monitoring systematic effectssuch as leakage currents. Accuracy, which is essentiallycalibration stability, is required for two (or more) separatedmagnetometers used, for example, to determine static andtime-changing magnetic-field gradients.
FIG. 13. Comparison of noise in different shields measured withSQUIDs. “Supercon.” refers to a superconducting cylindercooled below the transition temperature inside the low mag-netic-field environment BMSR-2. The Zuse shield is also at PTB-Berlin (Voigt et al., 2013). At very low frequencies, the intrinsicnoise of the (different) SQUID systems combined and theintegration time to record data for this plot dominate theperformance; at high frequencies, the noise level is dominatedby the experimental setup to perform the measurement. From M.Burghoff.
FIG. 12. Shielding designed for a proton EDM experiment:(a) Permalloy and compensation coil configurations. The outerlayers (1,3) are connected in segments. A correction ring(2) compensates for the magnetic distortions caused by themagnetic equilibration coils (4). The compensation ring equili-bration coils are labeled (5). (b) Simulation of magnetic dis-tortions caused by outer-cylinder equilibration coils mitigated bythe compensation ring.
Chupp et al.: Electric dipole moments of atoms, molecules, …
Rev. Mod. Phys., Vol. 91, No. 1, January–March 2019 015001-22
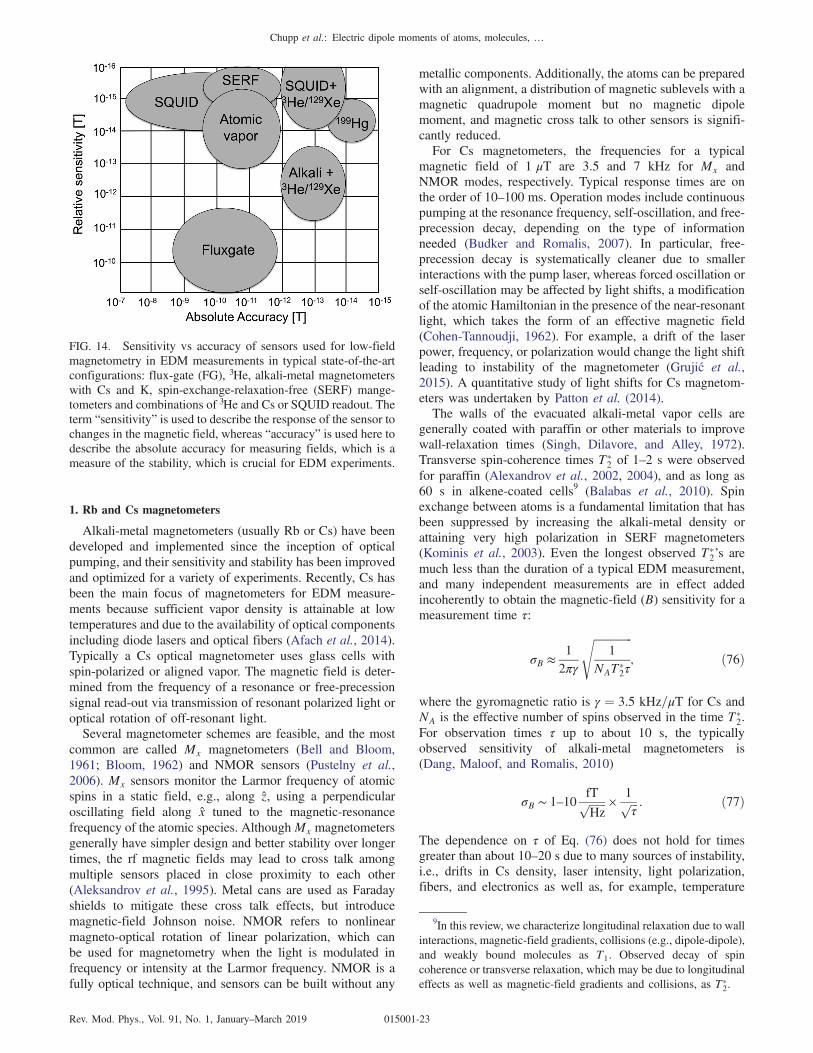
1. Rb and Cs magnetometers
Alkali-metal magnetometers (usually Rb or Cs) have beendeveloped and implemented since the inception of opticalpumping, and their sensitivity and stability has been improvedand optimized for a variety of experiments. Recently, Cs hasbeen the main focus of magnetometers for EDM measure-ments because sufficient vapor density is attainable at lowtemperatures and due to the availability of optical componentsincluding diode lasers and optical fibers (Afach et al., 2014).Typically a Cs optical magnetometer uses glass cells withspin-polarized or aligned vapor. The magnetic field is deter-mined from the frequency of a resonance or free-precessionsignal read-out via transmission of resonant polarized light oroptical rotation of off-resonant light.Several magnetometer schemes are feasible, and the most
common are called Mx magnetometers (Bell and Bloom,1961; Bloom, 1962) and NMOR sensors (Pustelny et al.,2006). Mx sensors monitor the Larmor frequency of atomicspins in a static field, e.g., along z, using a perpendicularoscillating field along x tuned to the magnetic-resonancefrequency of the atomic species. AlthoughMx magnetometersgenerally have simpler design and better stability over longertimes, the rf magnetic fields may lead to cross talk amongmultiple sensors placed in close proximity to each other(Aleksandrov et al., 1995). Metal cans are used as Faradayshields to mitigate these cross talk effects, but introducemagnetic-field Johnson noise. NMOR refers to nonlinearmagneto-optical rotation of linear polarization, which canbe used for magnetometry when the light is modulated infrequency or intensity at the Larmor frequency. NMOR is afully optical technique, and sensors can be built without any
metallic components. Additionally, the atoms can be preparedwith an alignment, a distribution of magnetic sublevels with amagnetic quadrupole moment but no magnetic dipolemoment, and magnetic cross talk to other sensors is signifi-cantly reduced.For Cs magnetometers, the frequencies for a typical
magnetic field of 1 μT are 3.5 and 7 kHz for Mx andNMOR modes, respectively. Typical response times are onthe order of 10–100 ms. Operation modes include continuouspumping at the resonance frequency, self-oscillation, and free-precession decay, depending on the type of informationneeded (Budker and Romalis, 2007). In particular, free-precession decay is systematically cleaner due to smallerinteractions with the pump laser, whereas forced oscillation orself-oscillation may be affected by light shifts, a modificationof the atomic Hamiltonian in the presence of the near-resonantlight, which takes the form of an effective magnetic field(Cohen-Tannoudji, 1962). For example, a drift of the laserpower, frequency, or polarization would change the light shiftleading to instability of the magnetometer (Grujić et al.,2015). A quantitative study of light shifts for Cs magnetom-eters was undertaken by Patton et al. (2014).The walls of the evacuated alkali-metal vapor cells are
generally coated with paraffin or other materials to improvewall-relaxation times (Singh, Dilavore, and Alley, 1972).Transverse spin-coherence times T�
2 of 1–2 s were observedfor paraffin (Alexandrov et al., 2002, 2004), and as long as60 s in alkene-coated cells9 (Balabas et al., 2010). Spinexchange between atoms is a fundamental limitation that hasbeen suppressed by increasing the alkali-metal density orattaining very high polarization in SERF magnetometers(Kominis et al., 2003). Even the longest observed T�
2’s aremuch less than the duration of a typical EDM measurement,and many independent measurements are in effect addedincoherently to obtain the magnetic-field (B) sensitivity for ameasurement time τ:
σB ≈1
2πγ
ffiffiffiffiffiffiffiffiffiffiffiffiffiffi1
NAT�2τ
s; ð76Þ
where the gyromagnetic ratio is γ ¼ 3.5 kHz=μT for Cs andNA is the effective number of spins observed in the time T�
2.For observation times τ up to about 10 s, the typicallyobserved sensitivity of alkali-metal magnetometers is(Dang, Maloof, and Romalis, 2010)
σB ∼ 1–10fTffiffiffiffiffiffiHz
p ×1ffiffiffiτ
p : ð77Þ
The dependence on τ of Eq. (76) does not hold for timesgreater than about 10–20 s due to many sources of instability,i.e., drifts in Cs density, laser intensity, light polarization,fibers, and electronics as well as, for example, temperature
FIG. 14. Sensitivity vs accuracy of sensors used for low-fieldmagnetometry in EDM measurements in typical state-of-the-artconfigurations: flux-gate (FG), 3He, alkali-metal magnetometerswith Cs and K, spin-exchange-relaxation-free (SERF) mange-tometers and combinations of 3He and Cs or SQUID readout. Theterm “sensitivity” is used to describe the response of the sensor tochanges in the magnetic field, whereas “accuracy” is used here todescribe the absolute accuracy for measuring fields, which is ameasure of the stability, which is crucial for EDM experiments.
9In this review, we characterize longitudinal relaxation due to wallinteractions, magnetic-field gradients, collisions (e.g., dipole-dipole),and weakly bound molecules as T1. Observed decay of spincoherence or transverse relaxation, which may be due to longitudinaleffects as well as magnetic-field gradients and collisions, as T�
2.
Chupp et al.: Electric dipole moments of atoms, molecules, …
Rev. Mod. Phys., Vol. 91, No. 1, January–March 2019 015001-23

dependent interactions of the Cs spins with the vaporcell walls.Magnetometers that measure a single frequency propor-
tional to the magnitude of a magnetic field provide informa-tion that is intrinsically a scalar. Several techniques to extractvector information have been developed by Pustelny et al.(2006) and Afach et al. (2015), among others. In addition,approaches that use light shifts along different directions tomodulate the vector information are very promising (Zhivunet al., 2014). Laser-driven Cs atomic magnetometers can alsobe operated in an array, driven by the same laser which canmitigate common-mode noise and drifts, although the pos-sibility of cross talk between magnetometers requires care inthe deployment.
2. Nuclear-spin magnetometers: 3He and 199Hg
Optically pumped external and internal magnetometerswith either 3He or 199Hg have also been proposed forneutron-EDM measurements by Ramsey (1984) and studiedby Green et al. (1998) and Borisov et al. (2000). Severalplanned future room-temperature neutron-EDM experimentsalso plan to use 199Hg as a comagnetometer, and the SNSnEDM experiment will use 3He as a comagnetometer as wellas the detector, as described in Sec. IV.A.For nuclear-spin magnetometers, the spins are prepared
using optical pumping techniques and then set to precessfreely in the magnetic field. For 199Hg, the free precession ismonitored by the transmission of linearly polarized orcircularly polarized light (Green et al., 1998). For 3He, theprecessing magnetization at ≈300 μT has been monitored byinductive pickup (Rosenberry, 2001). For the lower fields usedfor neutron-EDM measurements noninductive sensors such asSQUID magnetometers (Allmendinger et al., 2014; Kuchleret al., 2016) or Cs magnetometers (Koch et al., 2015) havebeen used to monitor 3He precession.The practical sensitivity limit of 199Hg magnetometers is a
few fT for a 100 s integration time using both linearly andcircularly polarized light. For 199Hg, the Larmor frequency is7.79 Hz=μT, which limits the bandwidth for monitoringmagnetic-field variations to about 1 Hz. In the ILL-Sussex-Rutherford neutron EDM 199Hg, the 199Hg coherence time T�
2
was observed to drop to about 60 s when the high voltage wasapplied (Green et al., 1998; Harris et al., 1999). Cleaning thewalls with an oxygen discharge at 1 torr with regular reversalof the E field restored the 199Hg T�
2 to 400 s (Green et al.,1998). Other ways to improve this behavior are beinginvestigated, including adding helium as a buffer gas toreduce the Hg mean-free path which reduces the rate ofdepolarizing wall collisions. Unfortunately, introducinghelium gas also reduces the high-voltage breakdown strengthof the storage cell. The use of a 199Hg comagnetometer furtherreduces the choice of wall coatings for neutron storage, as anycontact with metallic surfaces will generally cause loss of199Hg polarization. Light shifts during readout can also affect199Hg magnetometers. For readout using a resonance lamp, thewidth of the emission spectrum averages over the light shift.For laser readout, light-shift effects for Hg can be mitigated inseveral ways including reducing the readout laser power, free
precession or relaxation in the dark, for which the laserinterrogates the 199Hg phase for short times (e.g., 15 s) at thebeginning and end of the free-precession period, or detuningthe laser to the zero light-shift point (Griffith et al., 2009).For 3He transverse-spin lifetimes T�
2 ∼ 103 s are easilypossible and have been demonstrated at a few mbar pressureeven for cells with volume comparable to the dimensions of aneutron-EDM chamber (Allmendinger et al., 2014). Higher3He pressure is generally necessary for detection of thepolarization by a SQUID sensor or Cs magnetometer. Forneutron-EDM sensitivity of 10−28e cm, 3He pressure of a fewmbar is a possible compromise. In the planned SNS neutron-EDM experiment, the density of highly polarized 3He is muchless, as discussed in Sec. IV.A.Two-photon magnetometry was originally suggested for
129Xe as an alternative to 199Hg due to the smaller neutron-absorption cross section (Degenkolb, 2016). Since the147 nm single photon transition in Xe is too far in theUV, two 256 nm photons could be used for the free-precession measurement (Degenkolb, 2016). For 129Xe mag-netometry, the spin-polarized gas sample would be preparedby spin-exchange optical pumping (SEOP) (Rosen et al.,1999). Ultrafast two-photon spectroscopy (Zinkstok et al.,2006) has the advantages of high peak intensity (two-photonabsorption is proportional to the intensity squared) andcoherence, which allows two photons of different frequenciesto combine thus probing all atoms within the Doppler profile.Homogeneous broadening due to buffer-gas collisions alsohelps cover the Doppler profile. Both the magnetometrysignal and the efficiency for harmonic generation of the UVlight depend on the laser’s peak intensity, resulting inconsiderable enhancement for an ultrafast pulsed lasercompared to a continuous-wave laser of the same averagepower. Picosecond pulses are a good compromise betweenhigh peak intensity and lower damage to crystals and opticssince the dominant damage mechanisms scale with averageintensity (Degenkolb, 2016). One particularly importantfeature of two-photon magnetometry is the spatial resolutionpossible due to the quadratic dependence of the scatteringrate on laser intensity for two-photon transitions. Since thelaser beam can be focused to a small waist and high intensityalong the propagation direction, the scattering rate is highlyposition dependent and can be used to map out a magneticfield with resolution on the order of 1 mm.
C. Magnetic-field-coil design and current sources
The stability and uniformity of the applied magnetic field isessential, and EDM experimenters have brought new inno-vations to the design of magnetic-field coils and currentsources. The basic cylindrical coil is often called thecosine-theta coil, which is based on the principle that thesurface current density for a uniformly magnetized cylinderwith magnetization M is J ¼ M × n, e.g., for M ¼ My, jJzj ∝jy × nj ¼ sinðπ=2 − θÞ ¼ cosðθÞ (θ is the angle measuredfrom the x axis). For a finite length cylinder, the end-capwires can be positioned to reduce end effects as determined bycalculations. Often permalloy is used as a flux return, forexample, as shown in Fig. 15, which has the feature that
Chupp et al.: Electric dipole moments of atoms, molecules, …
Rev. Mod. Phys., Vol. 91, No. 1, January–March 2019 015001-24

the field can be aligned to ≈0.1 mrad for μT fields (Fierlingeret al., 2012).Another interesting approach to coil design for a source free
volume (∇ × H ¼ 0) is provided by solving Laplace’s equa-tion for a magnetic scalar potential ϕB that satisfies therequirement, for example, of a uniform field B ¼ B0z withina cylindrical volume. The currents on the surface of thevolume correspond to equipotential lines, i.e., the current-carrying wires should run along equally spaced equipotentialcontours. For the cylinder with uniform field, this of coursealso corresponds to the cosine-theta configuration; howeverthis approach is particularly useful for different shapes of coilform, e.g., a rectangular box and other field profiles(Crawford, 2015; Maldonado-Velázquez et al., 2017).Ultrastable current sources designed for very specific
currents and loads have been developed using standardtechniques of proportional-integral-differential (PID) or PIfeedback. Current sensing with low-temperature-coefficientresistors compared to ultrastable voltage references, select-ing discrete components to optimize offset drifts, tuning thegain-bandwidth product for different stages of the circuitand temperature stabilization of crucial components canprovide routine performance of 10−7 and better. Feedbackfrom magnetometers has been used to effectively stabilizemagnetic fields to 1 part in 1011 over 1000 s time scales(Rosenberry, 2001).
D. Ultracold neutron sources
UCNs, introduced by Zel’dovich (1959), have velocitiesless than about 7 m=s, corresponding to kinetic energiesEkin < ∼260 neV, temperatures of mK, and wavelengths of
tens of nm (Golub, Richardson, and Lamoreaux, 1991). As aresult of the long wavelength, the interaction of UCNs withmaterial surfaces is characterized by a potential energy calledthe Fermi energy VF that is positive for most materials.Neutrons with kinetic energy less than VF are repelled fromthe chamber walls for any angle of incidence and thus can bestored in a bottle or cell. In Table VII we list UCN properties.The gravitational and magnetic potential energies for maxi-mum UCN kinetic energy correspond to 2.5 m height andmagnetic field 4.3 T, respectively. Thus, for example, neutronscan be stored in a gravitational bottle a few meters deep andcan be polarized by reflecting one spin state from a magnetic-field barrier of ≈5 T.UCNs are in principle present in any moderated
neutron source. In thermal equilibrium, the neutron-densityspectrum is
dρðvnÞdvn
¼ 2Φ0
v2nv4T
expð−v2n=v2TÞ; ð78Þ
where vT ¼ ffiffiffiffiffiffiffiffiffiffiffiffiffiffiffiffiffiffiffi2kBT=mn
p. Integrating the density up to the
velocity corresponding to the Fermi energy for vF ≪ vTresults in a UCN density of
ρUCN ¼Z
vF
0
dρðvnÞ ≈2
3
Φ0
vT
�vFvT
�3
; ð79Þ
for vF ¼ 7 m=s. For a thermal neutron source T ¼ 300 K, thecore flux is Φ0 ∼ 1015 cm−2 s−1, and ρUCN ≈ 100 cm−3. Forcold moderators, typically at 20 K, Φ0 decreases by about anorder of magnitude and the UCN in the moderator is increasedto 1000–2000 cm−3.The world’s best thermal UCN source is illustrated in
Fig. 16 (Steyerl and Malik, 1989). Neutrons with vn <20 m=s are extracted from a T ¼ 20 K liquid D2 moderatorthrough a vertically mounted neutron guide, slowing as theyrise 17 m in the gravitational potential. The neutron guide is atube that transports neutrons using total reflection from thesurface, with the criterion being the normal component ofthe velocity satisfies v⊥ ≤
ffiffiffiffiffiffiffiffiffiffiffiffiffiffiffiffiffi2VF=mn
p. At the end of the guide,
the neutrons reflect from the receding copper blades of a“turbine.” The turbine blades act as moving mirrors that shiftthe neutrons to lower velocity. After several recoils, neutronsexit the turbine. Densities up to 10 UCN cm−3 are available forexperiments.Most modern UCN sources are based on superthermal
conversion introduced by Golub and Pendlebury (1977). Thisachieves higher phase-space density than thermal sources
FIG. 15. B0 coil from the panEDM apparatus. The coil consistsof a closed box of mumetal with a mumetal cylinder inside theshield. The main coil is wound around the cylinder (see text),which induces azimuthal magnetization in the cylindrical shell;correction coils at the ends of the cylinder compensate for thefinite length of the windings and for return current paths.Additional correction coils indicated account for imperfectionsin the geometry.
TABLE VII. Properties of UCN and neutrons relevant to theneutron-EDM experiments. The negative magnetic moment indicatesthat the strong magnetic field seeking neutrons are “spin down” withrespect to the magnetic field.
UCN velocity vUCN < 7 m=sUCN kinetic energy Kinetic energy < 260 neVGravitational energy mng 102 neV=mMagnetic moment μn −60.4 neV=TGyromagnetic ratio γn ¼ 2μn=ℏ 2π × 29.16 MHz=T
Chupp et al.: Electric dipole moments of atoms, molecules, …
Rev. Mod. Phys., Vol. 91, No. 1, January–March 2019 015001-25

using a medium that is not in thermal equilibrium with theneutrons. For example, Fig. 17 shows the dispersion curves fora free neutron and for thermal excitations in superfluid helium(SF-He), a typical choice for a superthermal source material.The curves cross at two points: E0 ¼ 0 and E1 ¼ E0 þ Δ,where Δ ≈ 1 meV corresponding to neutron wavelength λ0 ¼8.9 Å (Golub, Richardson, and Lamoreaux, 1991). This iseffectively a two-state system, and neutrons at E1 canresonantly transfer their energy to the SF-He resulting infinal UCN energy EUCN ≈ E0 with a small spread due to thewidth of the excitations. The process EUCN þ Δ → EUCN,called “down-scattering,” is effectively independent of SF-Hetemperature T. The reverse process, a UCN absorbing energyΔ from the SF-He thermal bath (“up-scattering”), is exponen-tially suppressed for Δ ≥ kBT according to the principle ofdetailed balance, which gives the ratio of the up-scattering and
down-scattering cross sections (Golub, Richardson, andLamoreaux, 1991):
σðEUCN → EUCN þ ΔÞσðEUCN þ Δ → EUCNÞ
¼ EUCN þ ΔEUCN
e−Δ=kBT: ð80Þ
The accumulation of UCN and the increase of the phase-spacedensity of the neutrons does not violate Liouville’s theorem,because the UCN and excitations in SF-He are both part of thesame thermal system. Producing SF-He requires temperaturesT < 2.17 K. However, due to up-scattering T ≤ 0.6 K isoptimal for UCN production.The equilbrium UCN density for a given UCN lifetime τtot
inside an SF-He source is ρUCN ¼ τtotRI , where the UCNproduction rate per unit volume for SF-He density ρSF andincident cold-neutron differential flux dΦ0=dλ is
RI ¼ ρSF
ZdΦ0
dλσðλ → λUCNÞdλ: ð81Þ
For incident neutron wavelength near λ0 ¼ 8.9 Å, and assum-ing a chamber with VF ¼ 252 neV (i.e., Be), the theoreticalUCN production rate based on the combined calculations ofGolub and Pendlebury (1977) and Yoshiki (2003) isRI ¼ð4.55�0.25Þ×10−8dΦ0=dλjλ0 cm−3 s−1, for dΦ0=dλ in
units of neutrons cm−2 s−1 Å−1. Baker et al. (2003) measuredthe production rate for a narrow-band neutron beam near 9 Å,which, when combined with the measured incident flux, isinterpreted as RI ¼ð3.48�0.53Þ×10−8dΦ0=dλjλ0 cm−3 s−1.Minimizing losses during UCN production is critical for
achieving high UCN densities. The loss rate is ultimatelylimited by the neutron lifetime τn with additional contributionsfor a total loss rate:
1
τtot¼ 1
τupþ 1
τwallsþ 1
τslitsþ 1
τabsþ 1
τn. ð82Þ
(1) The thermal up-scattering rate 1=τup is small at thetypical operating temperature of about 0.8 K [seeEq. (80)], and below 0.6 K performance does notfurther improve (Piegsa et al., 2014).
FIG. 16. UCN source at PF-2 at the Institut Max von Laue—Paul Langevin (ILL) in Grenoble, France. Neutrons from the low-energy tail of the cold-neutron spectrum are guided upward andlose energy in the gravitational potential. The turbine furthershifts the spectrum to longer wavelengths to produce UCN thatare provided to a number of experiments including the EDM.From communication group ILL.
1 meV
12.6 Å-1
k
E En = ( k)2
2mn
0.7 Å-1
SF-He
FIG. 17. Single phonon dispersion curve for SF-He with aminimum at k ≈ 2 nm−1 and the free neutron En ¼ ðℏkÞ2=2mn.The two curves intersect at En ¼ 0 and 1 meV corresponding tok ¼ 0.7 Å−1 or λ0 ¼ 8.9 Å.
Chupp et al.: Electric dipole moments of atoms, molecules, …
Rev. Mod. Phys., Vol. 91, No. 1, January–March 2019 015001-26
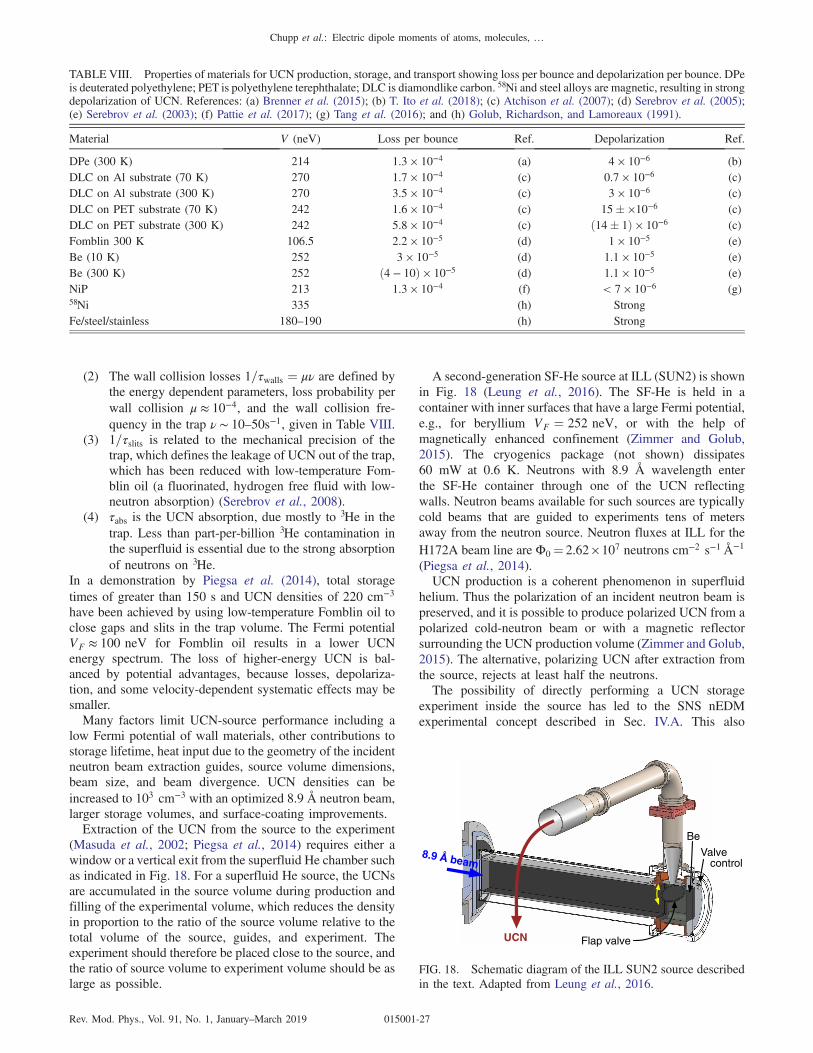
(2) The wall collision losses 1=τwalls ¼ μν are defined bythe energy dependent parameters, loss probability perwall collision μ ≈ 10−4, and the wall collision fre-quency in the trap ν ∼ 10–50s−1, given in Table VIII.
(3) 1=τslits is related to the mechanical precision of thetrap, which defines the leakage of UCN out of the trap,which has been reduced with low-temperature Fom-blin oil (a fluorinated, hydrogen free fluid with low-neutron absorption) (Serebrov et al., 2008).
(4) τabs is the UCN absorption, due mostly to 3He in thetrap. Less than part-per-billion 3He contamination inthe superfluid is essential due to the strong absorptionof neutrons on 3He.
In a demonstration by Piegsa et al. (2014), total storagetimes of greater than 150 s and UCN densities of 220 cm−3
have been achieved by using low-temperature Fomblin oil toclose gaps and slits in the trap volume. The Fermi potentialVF ≈ 100 neV for Fomblin oil results in a lower UCNenergy spectrum. The loss of higher-energy UCN is bal-anced by potential advantages, because losses, depolariza-tion, and some velocity-dependent systematic effects may besmaller.Many factors limit UCN-source performance including a
low Fermi potential of wall materials, other contributions tostorage lifetime, heat input due to the geometry of the incidentneutron beam extraction guides, source volume dimensions,beam size, and beam divergence. UCN densities can beincreased to 103 cm−3 with an optimized 8.9 Å neutron beam,larger storage volumes, and surface-coating improvements.Extraction of the UCN from the source to the experiment
(Masuda et al., 2002; Piegsa et al., 2014) requires either awindow or a vertical exit from the superfluid He chamber suchas indicated in Fig. 18. For a superfluid He source, the UCNsare accumulated in the source volume during production andfilling of the experimental volume, which reduces the densityin proportion to the ratio of the source volume relative to thetotal volume of the source, guides, and experiment. Theexperiment should therefore be placed close to the source, andthe ratio of source volume to experiment volume should be aslarge as possible.
A second-generation SF-He source at ILL (SUN2) is shownin Fig. 18 (Leung et al., 2016). The SF-He is held in acontainer with inner surfaces that have a large Fermi potential,e.g., for beryllium VF ¼ 252 neV, or with the help ofmagnetically enhanced confinement (Zimmer and Golub,2015). The cryogenics package (not shown) dissipates60 mW at 0.6 K. Neutrons with 8.9 Å wavelength enterthe SF-He container through one of the UCN reflectingwalls. Neutron beams available for such sources are typicallycold beams that are guided to experiments tens of metersaway from the neutron source. Neutron fluxes at ILL for theH172A beam line are Φ0 ¼ 2.62×10⁷ neutrons cm−2 s−1 Å−1
(Piegsa et al., 2014).UCN production is a coherent phenomenon in superfluid
helium. Thus the polarization of an incident neutron beam ispreserved, and it is possible to produce polarized UCN from apolarized cold-neutron beam or with a magnetic reflectorsurrounding the UCN production volume (Zimmer and Golub,2015). The alternative, polarizing UCN after extraction fromthe source, rejects at least half the neutrons.The possibility of directly performing a UCN storage
experiment inside the source has led to the SNS nEDMexperimental concept described in Sec. IV.A. This also
TABLE VIII. Properties of materials for UCN production, storage, and transport showing loss per bounce and depolarization per bounce. DPeis deuterated polyethylene; PET is polyethylene terephthalate; DLC is diamondlike carbon. 58Ni and steel alloys are magnetic, resulting in strongdepolarization of UCN. References: (a) Brenner et al. (2015); (b) T. Ito et al. (2018); (c) Atchison et al. (2007); (d) Serebrov et al. (2005);(e) Serebrov et al. (2003); (f) Pattie et al. (2017); (g) Tang et al. (2016); and (h) Golub, Richardson, and Lamoreaux (1991).
Material V (neV) Loss per bounce Ref. Depolarization Ref.
DPe (300 K) 214 1.3 × 10⁻⁴ (a) 4 × 10⁻⁶ (b)DLC on Al substrate (70 K) 270 1.7 × 10⁻⁴ (c) 0.7 × 10⁻⁶ (c)DLC on Al substrate (300 K) 270 3.5 × 10⁻⁴ (c) 3 × 10⁻⁶ (c)DLC on PET substrate (70 K) 242 1.6 × 10⁻⁴ (c) 15� ×10−6 (c)DLC on PET substrate (300 K) 242 5.8 × 10⁻⁴ (c) ð14� 1Þ × 10−6 (c)Fomblin 300 K 106.5 2.2 × 10⁻⁵ (d) 1 × 10⁻⁵ (e)Be (10 K) 252 3 × 10⁻⁵ (d) 1.1 × 10⁻⁵ (e)Be (300 K) 252 ð4 − 10Þ × 10−5 (d) 1.1 × 10⁻⁵ (e)NiP 213 1.3 × 10⁻⁴ (f) < 7 × 10⁻⁶ (g)58Ni 335 (h) StrongFe/steel/stainless 180–190 (h) Strong
8.9 beam
UCN Flap valve
Be
Valve control
FIG. 18. Schematic diagram of the ILL SUN2 source describedin the text. Adapted from Leung et al., 2016.
Chupp et al.: Electric dipole moments of atoms, molecules, …
Rev. Mod. Phys., Vol. 91, No. 1, January–March 2019 015001-27

enables the use of higher electrostatic voltages due to thedielectric properties of the SF-He. Breakdown strengthsexceeding 100 kV=cm have recently been demonstrated ina 1 cm electrode gap (Ito et al., 2014).Alternative superthermal converters include solid deuterium
(Golub and Böning, 1983), deuterated methane or oxygen, aswell as other (para)magnetic or spin-polarized substances(Atchison et al., 2011). The choice of materials for super-thermal UCN production is based on increasing the phase-space density and modes of UCN extraction and are discussedby Nesvizhevsky (2002) and Zimmer (2014a).Solid deuterium (SD2) molecules consisting of two spin-
one deuterons combine to total nuclear spin I ¼ 0 or 2 fororthodeuterium (oD2) and I ¼ 1 for paradeuterium (pD2).The rotational ground state for spin-one bosons is oD2. (ForH2, the ground state is parahydrogen with I ¼ 0.) Rotationalexcitations in SD2 for rotational quantum number J aregiven by
EJ ¼ hcBJðJ þ 1Þ ¼ 3.75 meV × JðJ þ 1Þ; ð83Þ
where B is the rotational constant (Yu, Malik, and Golub,1986). For low-lying excitations, the rotational energy iscomparable to cold neutron energies. At low temperature,the six I ¼ 0, 2 oD2 states and the three I ¼ 1 pD2 states areapproximately equally populated, so the relative population ofortho and para states is 2 to 1. For UCN production, an oD2
concentration ≳95% is necessary to suppress upscattering ofUCN, absorbing energy from oD2 to pD2 transitions. Thisrequires low temperatures as well as a magnetic converter toenhance the spin-flip rate for deuteron spins in a separateapparatus outside the source. One possible converter materialis hydrous iron (III) oxide, cooled to below the triple point ofdeuterium (Liu et al., 2003). The converted oD2 is thentransferred to the UCN source in a gaseous state withoutlosing the orthostate configuration due to very long thermalrelaxation times in the absence of a converter.The conversion cross section per unit volume from cold
neutrons to UCN for a deuterium density ρH2is given by
(Atchison et al., 2005a, 2005b, 2009)
σCN→UCNsD2;8 K ρH2
∼ ð1.11� 0.23Þ × 10−8 cm−1. ð84Þ
The momentum acceptance for cold neutrons is much greaterfor sD2 than for SF-He, leading to a higher production rate inthe source. The UCN lifetime in the sD2 source is given by
1
τUCN;sD2
¼ 1
τupþ 1
τo=pþ 1
τD-absþ 1
τH-absþ 1
τcryst; ð85Þ
where 1=τup accounts for the losses due to thermal up-scattering (elastic scattering of UCN with mK temperatureon nuclei at fewK temperatures in the source) (Liu, Young, andLamoreaux, 2000), 1=τo=p accounts for losses due to scatteringon pD2, 1=τD-abs, 1=τH-abs, and 1=τcryst accounts for absorptionlosses on deuterium, hydrogen, and scattering in the crystal,respectively (Yu, Malik, and Golub, 1986). Most loss channelscan be controlled to better than ð150 msÞ−1, resulting in an
overall UCN lifetime of τUCN;sD2≈ 75 ms in the perfect oD2
crystal at 4 K.UCN densities of 104 cm−3 are in principle feasible inside
the source. In contrast to the SF-He source, which requiresaccumulation in the source for several hundred secondsfollowed by dilution into the guides and experimental volume,sD2 provides an effectively continuous source of UCN,provided efficient extraction to the experiment within a timeτUCN;sD2
. The optimum source thickness based on diffusion ofUCN in this time is ∼1 cm, not taking into account premod-eration or thermal engineering issues that may dictateincreased thickness. Also, UCN extracted from the sourceshould be prevented from diffusing back into the sD2, forexample, by closing off the source with a valve.An sD2 source can provide a steady flux of UCN from the
source and can, in principle, be interfaced directly to theneutron-guide vacuum. However, any UCNs that diffuse backto the D2 will be lost due to the short UCN storage time. Onthe other hand, the UCN density provided by a continuous sD2
source does not depend on the size of the experiment (to firstorder), and large experiment volumes can be filled with UCN.For EDM experiments, the duty cycle of the source can be lessthan 10%, as the filling times of UCN storage chambers aretypically 10–100 s and the cycle time ≈1000 s, which isimportant for accelerator-based spallation neutron sources thatshare the primary accelerator beam.At Los Alamos National Lab, spallation neutrons produced
by a pulsed 800-MeV proton beam striking a tungsten targetare thermalized by beryllium and graphite moderators atambient temperature and further cooled by a cold moderatorthat consists of cooled polyethylene beads (Saunders et al.,2013). The cold neutrons are converted to UCN by down-scattering in an sD2 crystal at 5 K. UCN are verticallyextracted in a 1 m long 58Ni guide that compensates for the100-neV boost that UCNs receive when leaving the sD2. Avalve between the source and vertical guide is closed exceptwhen the proton-beam pulse is incident in order to keep theUCN in the guide from returning to the sD2 and beingabsorbed. When in production, the peak proton current fromthe accelerator was typically 12 mA, delivered in bursts of 10pulses each 625 μs long at 20 Hz, with a 5 s delay betweenbursts; the average current delivered to the spallation target is9 μA. After recent upgrades, the UCN density measured at theend of a 6 m long stainless steel guide was 184� 32 cm−3,and a measurement made with polarized UCN in a bottle,similar to what would be used for an EDM measurement,yielded 39� 7 UCN cm−3 (T. M. Ito et al., 2018). SF-Hesources are also planned at Petersburg Nuclear PhysicsInstitute (PNPI) in St. Petersburg, which calculations suggestmay produce 104 UCN=cm3 (Serebrov et al., 2017).At the Paul-Scherrer Institute (PSI) (Anghel et al., 2009),
the cyclotron provides a 2.2 mA, 590 MeV proton-beamincident on a heavy metal spallation target for 4 s with a dutycycle of 1%. Measurements with a “standard” storage bottleshowed 22 UCN=cm3 of unpolarized UCN (Becker et al.,2015). Another pulsed sD2 source is installed at the pulsedTRIGA reactor in Mainz, where a 200 MW, 20 ms neutronpulse produces UCNs, which leave the source quickly and can(with proper timing) be captured in an experiment using
Chupp et al.: Electric dipole moments of atoms, molecules, …
Rev. Mod. Phys., Vol. 91, No. 1, January–March 2019 015001-28

mechanical shutters. A density of order 10UCNcm−3 in a fewtens of liter volume was achieved (Lauer and Zechlau, 2013).Although the typical lifetimes in sD2 and the energy
dependent production rate have been well determined exper-imentally, the performance of solid deuterium based sources istypically lower than expected for operating sources (seeTable IX). Several issues related to the sD2 crystals havebeen considered in an effort to explain this discrepancy. Forexample, in practical sources, shrinkage of the crystal duringthe cool down may cause cracks and may also reduce thermalcontact to the cooling apparatus. Cracks in the crystal alsochange the neutron mean-free path in the source and thus mayaffect the extraction efficiency. Thermal stress and geometricalalignment of the source may also require preparation of thecrystal from the gas phase instead of freezing from the liquidstate. Another important consideration is guiding the neutronsfrom the sD2 source to an experiment. Until recently, UCNtransmission in long guides had been a limitation, but Zechlau(2016) measured transmission greater than 50% for 80 mm ID,22 m long guides coated with NiMo (in the ratio 85∶15) andincluding three 90° bends.In Table IX, we list the currently operating UCN sources
and an estimate of the performance relevant to the neutron-EDM experiments based on measurements reported in thepapers cited. In some cases, the number of polarized neutronswas reported, as noted; for unpolarized UCN, the reporteddensities should be decreased by at least a factor of 2 toaccount for the loss of one spin state.A number of additional sources based on both SF-He and
sD2 are under construction or planned. The operating SF-Hesources are in principle working at the level of theoreticalestimates. For these sources, scaling to larger neutron fluxwould result in larger heating from the primary beam andrequire increased cryogenic capacity, but is not expected tosignificantly change the performance. At ILL, the SuperSUNsource has significantly larger converter volume, cryogeniccapacity, and will incorporate the magnetic reflector (Zimmerand Golub, 2015) with the expectation of up to 1000 polarizedUCN=cm3. At KEK, a SF-He based source using proton-spallation production of cold neutrons provided 0.7 unpolar-ized UCN=cm3 with 78 W of proton power (Masuda et al.,2002). This source has been moved to TRIUMF, where ordersof magnitude higher proton-beam power will be available.Upgrading the cryogenics to handle higher power is predictedto provide hundreds of UCN=cm3 for experiments. Theconcept of the nEDM experiment under development for
the Spallation Neutron Source at Oak Ridge National Lab is toproduce the UCN within the EDM experiment as demon-strated by O’Shaughnessy et al. (2009) for neutron-lifetimemeasurements as discussed in detail in Sec. IV.A.Plans to adapt the converter design of the sD2 source at the
Mainz TRIGA reactor to the strong core flux from the FRM-IIreactor at the Technical University of Munchen FRM-II areexpected to produce 1000 UCN=cm3. The TRIGA reactoroperates at a lower average power; therefore scaling to ahigher power and radiation dose needs to be explored. An sD2
source is under development at the PULSTAR reactor at NorthCarolina State University that is predicted to provide40 UCN=cm3 for 1 MW (Korobkina et al., 2014).The next major neutron source will be the European
Spallation Source (ESS). The ESS will provide an opportunityfor new UCN source possibilities with even greater densitiesfor future experiments, and a number of UCN source conceptshave been developed (Klinkby et al., 2014; Nesvizhevsky,2014; Pendlebury and Greene, 2014; Zimmer, 2014b;Lychagin et al., 2015). The goal of these proposalsis 103–104 UCN=cm3.
IV. EXPERIMENTS
In this section we review the current status and prospects ofEDM experiments. Our goal is to describe in some detailtechnical aspects of the experiments, systematic errors, near-term improvements, and new concepts under development.Guided in part by the historical procession of experimentsdiscussed in the Introduction, we begin with the neutron andmove onto Cs and other paramagnetic atom and moleculeexperiments. Diamagnetic atoms and molecules includingoctupole-enhanced nuclei follow. Finally we describe thedevelopment of storage-ring experiments to measure EDMsof light nuclei. The results so far are summarized in Table I.
A. The neutron
Here we discuss the neutron-EDM experiment from theoriginal beam measurements to the UCN experiments. Thedominant systematic errors are discussed as well as briefdescriptions of the several efforts underway to improve thesensitivity by 1 to 2 orders of magnitude.The first experiments to search for the neutron EDM used a
cold-neutron beam (Smith, Purcell, and Ramsey, 1957), but by1980 the beam measurements became systematics limited due
TABLE IX. Currently operating UCN sources with UCN densities relevant to EDM experiments based on data reported in the citedreferences. For unpolarized UCN, the reported densities should be decreased by a factor of at least 2 to make a consistent comparison.References: (a) Baker et al. (2006); (b) T. M. Ito et al. (2018); (c) Becker et al. (2015); (d) Lauer and Zechlau (2013); (e) Leung et al. (2016); and(f) Imajo et al. (2016).
Source Type Converter UCN=cm3 Ref.
ILL PF2 Reactor cold source (Turbine) Two polarized; based on detected UCN (a)LANL Spallation sD2 40 polarized; observed in a test chamber (b)PSI Spallation sD2 22 unpolarized; in standard storage bottle (c)TRIGA Mainz Pulsed reactor sD2 Ten unpolarized (d)ILL SUN-II Reactor cold-neutron beam SF-He Ten polarized; from production,
dilution, and polarization(e)
JPARC Spallation VCN Rotating mirror 1.4 unpolarized; measured at source (f)
Chupp et al.: Electric dipole moments of atoms, molecules, …
Rev. Mod. Phys., Vol. 91, No. 1, January–March 2019 015001-29

to complications arising from beam divergence and motional(v × E) effects (Dress et al., 1977). These systematic issuesled to experiments using stored UCN, trading higher neutrondensity for longer observation times and reduced velocity(Altarev et al., 1980). Two recent stored-UCN experimentconfigurations are shown in Fig. 19. For the ILL-Sussex-Rutherford experiment [Fig. 19(a)] (Baker et al., 2006) asingle chamber is used along with a comagnetometer, whilethe Gatchina experiment [Fig. 19(b)] (Altarev et al., 1992,1996) employed a pair of chambers with opposite electricfields and a common magnetic field. In the latter scheme,common-mode time-dependent magnetic-field variations arerejected to the degree to which the common magnetic field isuniform. The ILL experiment is analyzed as a spin-clockcomparison using a variation of Ramsey’s separated oscil-latory field technique to measure two spin-polarized species(neutrons and a 199Hg comagnetometer) in the same volume atthe same time. In the Gatchina approach, both chambers have
very similar systematics and the velocities of the UCN aresmall enough that many systematic effects are negligible at the10−26e cm level.In Ramsey’s technique (Ramsey, 1990b), an interferometer
in time is realized by comparing the phase from a spin clockwith frequency ωL, the Larmor precession frequency, with thephase of a reference clock with frequency ωR after a fixedmeasurement time τ as illustrated in Fig. 20. The optimalobservation time τ is based on the UCN storage time and thepolarization lifetimes (T�
2) of the UCN and the comagnetom-eter. The phases of the spins and the clock evolve at thedifferent frequencies, and the phase difference after a time τ isΔ ¼ ðωL − ωRÞτ. This is read out using the polarization Pz,i.e., the projection of the spin along the B0 field after thesecond pulse is applied. In terms of the number of neutronsdetected with spin parallel (N↑) and antiparallel (N↓) to B0 atthe end of the free-precession cycle, the polarization is
Pz ¼N↑ − N↓
N↑ þ N↓: ð86Þ
For Δ ¼ 0, π=2, π, Pz=P0 ¼ −1, 0, 1, respectively, where P0
is the maximum magnitude of the polarization. To maximizesensitivity to a change of frequency, Δ ¼ �π=2 is chosen toprovide the maximum slope of the fringes:
time
B1( r) P( L) B0
FIG. 20. Ramsey’s technique of separated oscillatory fields. Theexperiment starts out with polarized particles in a stable anduniform magnetic field B0, with a stable external oscillator atfrequency ωR near the Larmor frequency ωL of the particles in theB0 field. First a π=2 pulse of oscillating magnetic field (B1)rotates the polarization into the plane normal to B0, creating asuperposition of spin-up and spin-down states. The spins andexternal clock evolve independently until a second π=2 pulse isapplied. The second pulse measures the phase difference betweenthe oscillator and precessing spins that accumulates during thefree-precession interval. Time evolves from top to bottom in thefigure.
NS
Four-layer μ-metal shield High-voltage lead
Quartz insulating cylinder Magnetic field
coil
Upper electrode
Storage cell
Hg u.v. lamp
PMT for Hg light
Vacuum wall
Mercuryprepolarizing
cell
Hg u.v. lampRF coil to flip spins
Magnet
UCN polarizing foil Approx scale 1 m
(a)
(b)
FIG. 19. Neutron-EDM apparatus from (a) the ILL-Sussex-Rutherford experiment with one chamber for UCN and acomagnetometer. From Baker et al., 2006. (b) The Gatchinaapparatus, as set up at ILL, with two neutron storage chambers sothat parallel and antiparallel E and B field orientations aremeasured simultaneously. From Serebrov et al., 2015. Bothexperiments are run with the storage chamber in vacuum atroom temperature.
Chupp et al.: Electric dipole moments of atoms, molecules, …
Rev. Mod. Phys., Vol. 91, No. 1, January–March 2019 015001-30
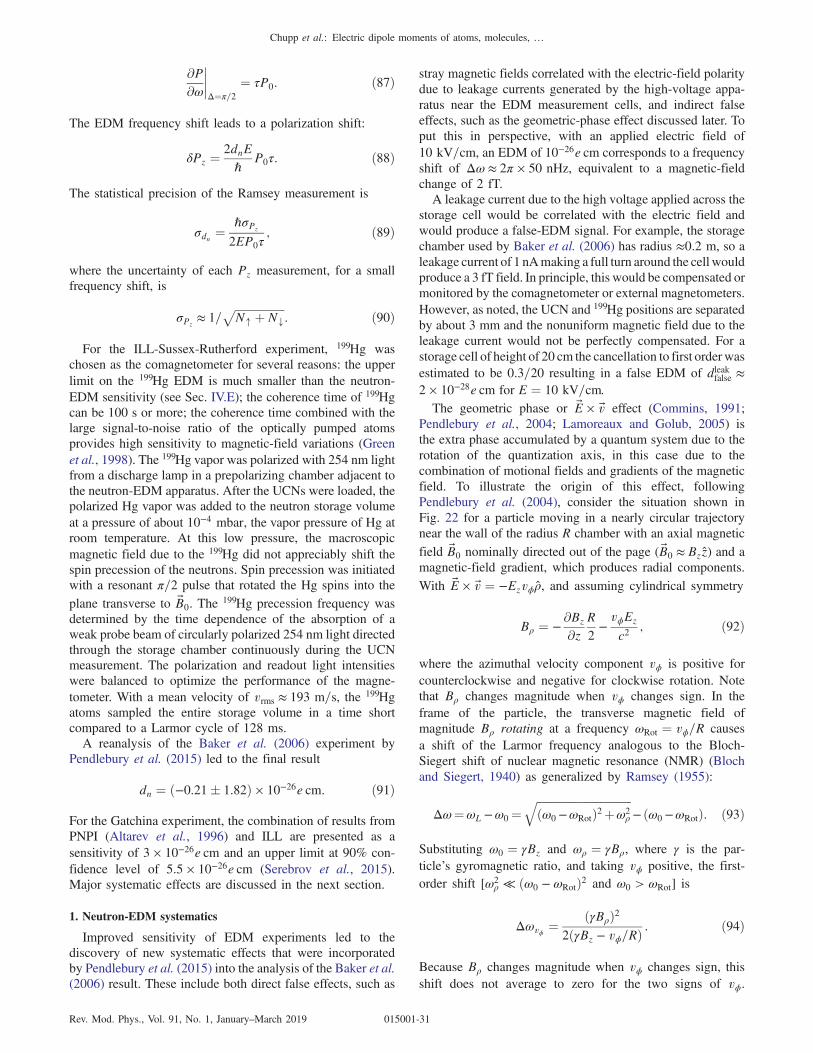
∂P∂ω����Δ¼π=2
¼ τP0: ð87Þ
The EDM frequency shift leads to a polarization shift:
δPz ¼2dnEℏ
P0τ: ð88Þ
The statistical precision of the Ramsey measurement is
σdn ¼ℏσPz
2EP0τ; ð89Þ
where the uncertainty of each Pz measurement, for a smallfrequency shift, is
σPz≈ 1=
ffiffiffiffiffiffiffiffiffiffiffiffiffiffiffiffiffiffiN↑ þ N↓
p: ð90Þ
For the ILL-Sussex-Rutherford experiment, 199Hg waschosen as the comagnetometer for several reasons: the upperlimit on the 199Hg EDM is much smaller than the neutron-EDM sensitivity (see Sec. IV.E); the coherence time of 199Hgcan be 100 s or more; the coherence time combined with thelarge signal-to-noise ratio of the optically pumped atomsprovides high sensitivity to magnetic-field variations (Greenet al., 1998). The 199Hg vapor was polarized with 254 nm lightfrom a discharge lamp in a prepolarizing chamber adjacent tothe neutron-EDM apparatus. After the UCNs were loaded, thepolarized Hg vapor was added to the neutron storage volumeat a pressure of about 10−4 mbar, the vapor pressure of Hg atroom temperature. At this low pressure, the macroscopicmagnetic field due to the 199Hg did not appreciably shift thespin precession of the neutrons. Spin precession was initiatedwith a resonant π=2 pulse that rotated the Hg spins into theplane transverse to B0. The 199Hg precession frequency wasdetermined by the time dependence of the absorption of aweak probe beam of circularly polarized 254 nm light directedthrough the storage chamber continuously during the UCNmeasurement. The polarization and readout light intensitieswere balanced to optimize the performance of the magne-tometer. With a mean velocity of vrms ≈ 193 m=s, the 199Hgatoms sampled the entire storage volume in a time shortcompared to a Larmor cycle of 128 ms.A reanalysis of the Baker et al. (2006) experiment by
Pendlebury et al. (2015) led to the final result
dn ¼ ð−0.21� 1.82Þ × 10−26e cm: ð91Þ
For the Gatchina experiment, the combination of results fromPNPI (Altarev et al., 1996) and ILL are presented as asensitivity of 3 × 10⁻²⁶e cm and an upper limit at 90% con-fidence level of 5.5 × 10⁻²⁶e cm (Serebrov et al., 2015).Major systematic effects are discussed in the next section.
1. Neutron-EDM systematics
Improved sensitivity of EDM experiments led to thediscovery of new systematic effects that were incorporatedby Pendlebury et al. (2015) into the analysis of the Baker et al.(2006) result. These include both direct false effects, such as
stray magnetic fields correlated with the electric-field polaritydue to leakage currents generated by the high-voltage appa-ratus near the EDM measurement cells, and indirect falseeffects, such as the geometric-phase effect discussed later. Toput this in perspective, with an applied electric field of10 kV=cm, an EDM of 10−26e cm corresponds to a frequencyshift of Δω ≈ 2π × 50 nHz, equivalent to a magnetic-fieldchange of 2 fT.A leakage current due to the high voltage applied across the
storage cell would be correlated with the electric field andwould produce a false-EDM signal. For example, the storagechamber used by Baker et al. (2006) has radius ≈0.2 m, so aleakage current of 1 nAmaking a full turn around the cell wouldproduce a 3 fT field. In principle, this would be compensated ormonitored by the comagnetometer or external magnetometers.However, as noted, the UCN and 199Hg positions are separatedby about 3 mm and the nonuniform magnetic field due to theleakage current would not be perfectly compensated. For astorage cell of height of 20 cm the cancellation to first orderwasestimated to be 0.3=20 resulting in a false EDM of dleakfalse ≈2 × 10⁻²⁸e cm for E ¼ 10 kV=cm.The geometric phase or E × v effect (Commins, 1991;
Pendlebury et al., 2004; Lamoreaux and Golub, 2005) isthe extra phase accumulated by a quantum system due to therotation of the quantization axis, in this case due to thecombination of motional fields and gradients of the magneticfield. To illustrate the origin of this effect, followingPendlebury et al. (2004), consider the situation shown inFig. 22 for a particle moving in a nearly circular trajectorynear the wall of the radius R chamber with an axial magneticfield B0 nominally directed out of the page (B0 ≈ Bzz) and amagnetic-field gradient, which produces radial components.With E × v ¼ −Ezvϕρ, and assuming cylindrical symmetry
Bρ ¼ −∂Bz
∂zR2−vϕEz
c2; ð92Þ
where the azimuthal velocity component vϕ is positive forcounterclockwise and negative for clockwise rotation. Notethat Bρ changes magnitude when vϕ changes sign. In theframe of the particle, the transverse magnetic field ofmagnitude Bρ rotating at a frequency ωRot ¼ vϕ=R causesa shift of the Larmor frequency analogous to the Bloch-Siegert shift of nuclear magnetic resonance (NMR) (Blochand Siegert, 1940) as generalized by Ramsey (1955):
Δω¼ωL−ω0 ¼ffiffiffiffiffiffiffiffiffiffiffiffiffiffiffiffiffiffiffiffiffiffiffiffiffiffiffiffiffiffiffiffiffiffiðω0−ωRotÞ2þω2
ρ
q− ðω0−ωRotÞ: ð93Þ
Substituting ω0 ¼ γBz and ωρ ¼ γBρ, where γ is the par-ticle’s gyromagnetic ratio, and taking vϕ positive, the first-order shift [ω2
ρ ≪ ðω0 − ωRotÞ2 and ω0 > ωRot] is
Δωvϕ ¼ ðγBρÞ22ðγBz − vϕ=RÞ
: ð94Þ
Because Bρ changes magnitude when vϕ changes sign, thisshift does not average to zero for the two signs of vϕ.
Chupp et al.: Electric dipole moments of atoms, molecules, …
Rev. Mod. Phys., Vol. 91, No. 1, January–March 2019 015001-31
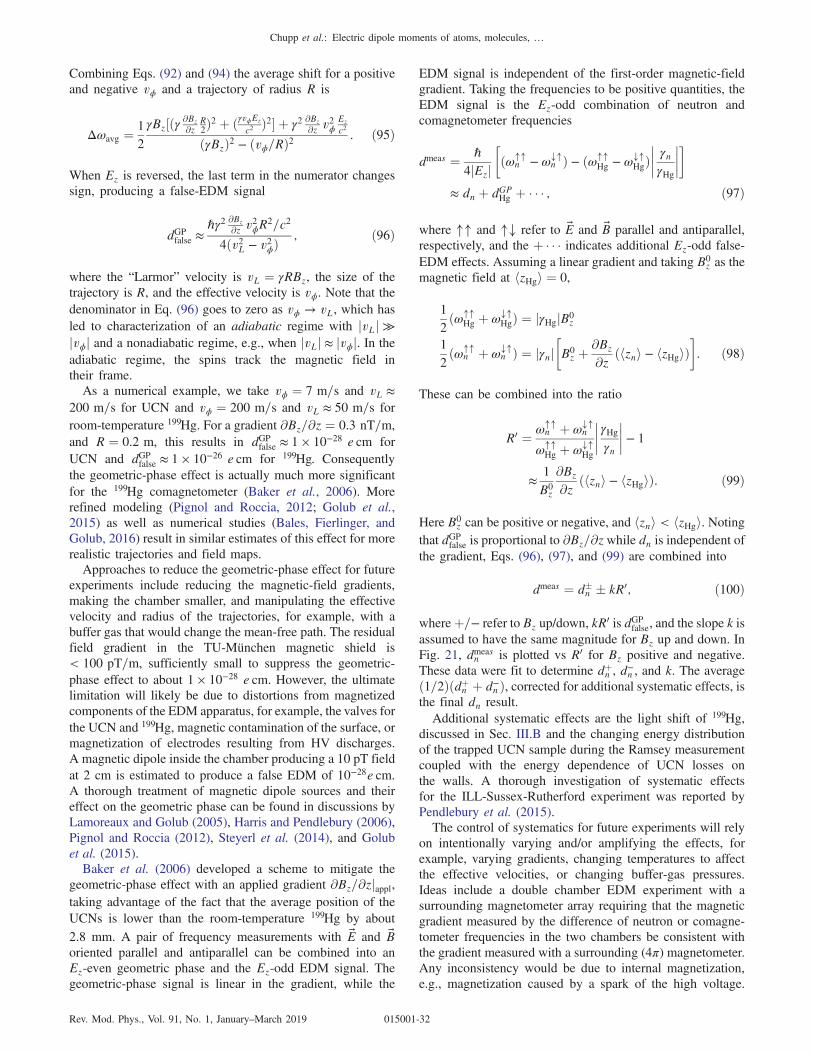
Combining Eqs. (92) and (94) the average shift for a positiveand negative vϕ and a trajectory of radius R is
Δωavg ¼1
2
γBz½ðγ ∂Bz∂zR2Þ2 þ ðγvϕEz
c2 Þ2� þ γ2 ∂Bz∂z v2ϕEz
c2
ðγBzÞ2 − ðvϕ=RÞ2: ð95Þ
When Ez is reversed, the last term in the numerator changessign, producing a false-EDM signal
dGPfalse ≈ℏγ2 ∂Bz∂z v2ϕR2=c2
4ðv2L − v2ϕÞ; ð96Þ
where the “Larmor” velocity is vL ¼ γRBz, the size of thetrajectory is R, and the effective velocity is vϕ. Note that thedenominator in Eq. (96) goes to zero as vϕ → vL, which hasled to characterization of an adiabatic regime with jvLj ≫jvϕj and a nonadiabatic regime, e.g., when jvLj ≈ jvϕj. In theadiabatic regime, the spins track the magnetic field intheir frame.As a numerical example, we take vϕ ¼ 7 m=s and vL ≈
200 m=s for UCN and vϕ ¼ 200 m=s and vL ≈ 50 m=s forroom-temperature 199Hg. For a gradient ∂Bz=∂z ¼ 0.3 nT=m,and R ¼ 0.2 m, this results in dGPfalse ≈ 1 × 10⁻²⁸ e cm forUCN and dGPfalse ≈ 1 × 10⁻²⁶ e cm for 199Hg. Consequentlythe geometric-phase effect is actually much more significantfor the 199Hg comagnetometer (Baker et al., 2006). Morerefined modeling (Pignol and Roccia, 2012; Golub et al.,2015) as well as numerical studies (Bales, Fierlinger, andGolub, 2016) result in similar estimates of this effect for morerealistic trajectories and field maps.Approaches to reduce the geometric-phase effect for future
experiments include reducing the magnetic-field gradients,making the chamber smaller, and manipulating the effectivevelocity and radius of the trajectories, for example, with abuffer gas that would change the mean-free path. The residualfield gradient in the TU-Munchen magnetic shield is< 100 pT=m, sufficiently small to suppress the geometric-phase effect to about 1 × 10⁻²⁸ e cm. However, the ultimatelimitation will likely be due to distortions from magnetizedcomponents of the EDM apparatus, for example, the valves forthe UCN and 199Hg, magnetic contamination of the surface, ormagnetization of electrodes resulting from HV discharges.A magnetic dipole inside the chamber producing a 10 pT fieldat 2 cm is estimated to produce a false EDM of 10−28e cm.A thorough treatment of magnetic dipole sources and theireffect on the geometric phase can be found in discussions byLamoreaux and Golub (2005), Harris and Pendlebury (2006),Pignol and Roccia (2012), Steyerl et al. (2014), and Golubet al. (2015).Baker et al. (2006) developed a scheme to mitigate the
geometric-phase effect with an applied gradient ∂Bz=∂zjappl,taking advantage of the fact that the average position of theUCNs is lower than the room-temperature 199Hg by about2.8 mm. A pair of frequency measurements with E and Boriented parallel and antiparallel can be combined into anEz-even geometric phase and the Ez-odd EDM signal. Thegeometric-phase signal is linear in the gradient, while the
EDM signal is independent of the first-order magnetic-fieldgradient. Taking the frequencies to be positive quantities, theEDM signal is the Ez-odd combination of neutron andcomagnetometer frequencies
dmeas ¼ ℏ4jEzj
�ðω↑↑
n − ω↓↑n Þ − ðω↑↑
Hg − ω↓↑HgÞ���� γnγHg
�����
≈ dn þ dGPHg þ � � � ; ð97Þ
where ↑↑ and ↑↓ refer to E and B parallel and antiparallel,respectively, and the þ � � � indicates additional Ez-odd false-EDM effects. Assuming a linear gradient and taking B0
z as themagnetic field at hzHgi ¼ 0,
1
2ðω↑↑
Hg þ ω↓↑HgÞ ¼ jγHgjB0
z
1
2ðω↑↑
n þ ω↓↑n Þ ¼ jγnj
�B0z þ
∂Bz
∂z ðhzni − hzHgiÞ�. ð98Þ
These can be combined into the ratio
R0 ¼ ω↑↑n þ ω↓↑
n
ω↑↑Hg þ ω↓↑
Hg
���� γHgγn���� − 1
≈1
B0z
∂Bz
∂z ðhzni − hzHgiÞ: ð99Þ
Here B0z can be positive or negative, and hzni < hzHgi. Noting
that dGPfalse is proportional to ∂Bz=∂zwhile dn is independent ofthe gradient, Eqs. (96), (97), and (99) are combined into
dmeas ¼ d�n � kR0; ð100Þ
whereþ=− refer to Bz up/down, kR0 is dGPfalse, and the slope k isassumed to have the same magnitude for Bz up and down. InFig. 21, dmeas
n is plotted vs R0 for Bz positive and negative.These data were fit to determine dþn , d−n , and k. The averageð1=2Þðdþn þ d−n Þ, corrected for additional systematic effects, isthe final dn result.Additional systematic effects are the light shift of 199Hg,
discussed in Sec. III.B and the changing energy distributionof the trapped UCN sample during the Ramsey measurementcoupled with the energy dependence of UCN losses onthe walls. A thorough investigation of systematic effectsfor the ILL-Sussex-Rutherford experiment was reported byPendlebury et al. (2015).The control of systematics for future experiments will rely
on intentionally varying and/or amplifying the effects, forexample, varying gradients, changing temperatures to affectthe effective velocities, or changing buffer-gas pressures.Ideas include a double chamber EDM experiment with asurrounding magnetometer array requiring that the magneticgradient measured by the difference of neutron or comagne-tometer frequencies in the two chambers be consistent withthe gradient measured with a surrounding (4π) magnetometer.Any inconsistency would be due to internal magnetization,e.g., magnetization caused by a spark of the high voltage.
Chupp et al.: Electric dipole moments of atoms, molecules, …
Rev. Mod. Phys., Vol. 91, No. 1, January–March 2019 015001-32

We also anticipate that most future EDM experiments willintroduce blind analysis techniques.
2. Neutron-EDM prospects
Several neutron-EDM experiments are under developmentwith the prospects of improving the sensitivity by 1 andeventually 2 orders of magnitude. In addition to the novel ideaof probing P-odd and T-odd neutron scattering in a crystal,several experiments use UCN from a variety of differentsources listed in Sec. III.D. In the case of the SNS EDMexperiment, the experiment is the source.
3. The PSI experiment
For the neutron-EDM program at the PSI near Zurich alarge collaboration will use the UCN source described inSec. III.D. In a first-generation effort, the original ILL-Sussex-Rutherford apparatus (Baker et al., 2006) was moved andrebuilt with significant improvements to the neutron storagebottle lifetime, neutron polarization detection, magneticshielding, Hg comagnetometer, and the addition of Csmagnetometers. With these improvements, a result with
sensitivity at the 1 × 10⁻²⁶e cm level is expected. Plans areunderway for an improved experiment with a double-EDMchamber that is expected to extend the sensitivity to as lowas 10−27e cm.
4. The PNPI-ILL-PNPI experiment
The Gatchina EDM experiment, shown in Fig. 19, has beenrunning at ILL, where it is expected to improve on the result ofSerebrov et al. (2015). Over the longer term, the UCN sourceat the PNPI research reactor is expected to provide up to104 UCN=cm3 (Serebrov et al., 2017) and could extend thesensitivity to 2 × 10⁻²⁸e cm.
5. The FRM-II and PanEDM experiments
The EDM experiment, originally developed at the FRM-IIreactor (Altarev et al., 2012), has been moved to ILL to coupleto the SuperSun UCN source and was renamed PanEDM. It isa modular concept with UCN confined in two adjacent room-temperature chambers with opposite electric field. Ramsey’stechnique will be applied to both cells simultaneously, and theEDM phase shift will have the opposite sign in the twochambers. Magnetometry will be effected by two 199Hgmagnetometers above and below the EDM chambers. Inaddition, an array of Cs atomic-vapor magnetometers will
R
z
B
x
y
z
v >0
Bz
z
R
2
v Ez
Bz
z
R
2
v Ez
v <0
R
FIG. 22. Contributions to the geometric-phase effect. Top:A nonuniform magnetic field that leads to radial magnetic-fieldcomponents. Bottom: Particle trajectories and contributions to Bρ
from the gradient and motional magnetic fields. The left sideshows a positive azimuthal velocity, and the right side shows anegative azimuthal velocity. The average frequency shift for thetwo counterpropagating trajectories is given by Eq. (96). Adaptedfrom Pendlebury et al., 2004.
-100
-50
0
50
100
-10 0 10 20
ED
M (
10-2
6 ec
m)
R' (ppm)
B down
-100
-50
0
50
100
-10 0 10 20
ED
M (
10-2
6 ec
m)
R' (ppm)
B up
FIG. 21. Dependence of the measured Ez-odd EDM signal onthe magnetic-field gradient, represented by R0, for two Bzorientations. The y axis labeled “EDM” refers to dmeas inEq. (97). The data points with error bars are from a typical datarun. The solid red lines are linear fits to Eq. (100) for the data setwith B up and B down. From Baker et al., 2006.
Chupp et al.: Electric dipole moments of atoms, molecules, …
Rev. Mod. Phys., Vol. 91, No. 1, January–March 2019 015001-33
be placed near the EDM chambers. Plans call for two phases:Phase 1 will use the SuperSun source without the magneticreflector with the sensitivity goal of 10−27e cm; phase 2 willemploy the magnetic reflector, and a factor of 3 to 4improvement is expected. With no comagnetometer, therequirements on magnetic shielding and external magnetom-etry are more stringent, but it is expected that the electric fieldcan be increased by 50% or more compared to what could beapplied with a Hg comagnetometer.
6. The LANL room-temperature EDM experiment
The recent fourfold increase in the LANL UCNsource performance (T. M. Ito et al., 2018) has providedmotivation to develop a nEDM experiment. The concept is adouble cell with a Hg comagnetometer and external magne-tometry. There is also the possibility to study 3He as acomagnetometer monitored with either a SQUID or bydetection of UCN capture on 3He by detecting recoil protonswith scintillators. The plan is to deploy state-of-the-artmagnetic shielding and to optimize storage volumes andUCN guide volumes to the LANL UCN source. The sensi-tivity goal is 1–3 × 10⁻²⁷e cm.
7. The TRIUMF and KEK experiment
The TRIUMF and KEK experiment is based on a SF-Hesource coupled to the high-intensity proton beam fromthe TRIUMF cyclotron (Masuda et al., 2002). Because ofthe dilution of UCN when such a source is coupled to theexperiment volume, the EDM chamber will be smaller than inother experiments. A further option discussed for this room-temperature neutron-EDM experiment is the use of a low-pressure 129Xe-based comagnetometer (Masuda et al., 2012)with two-photon readout (Alden et al., 2011), introduced inSec. III.B, as well as a 199Hg comagnetometer designed toaddress the geometric-phase and leakage-current systematiceffects.
8. The SNS experiment
A major effort underway in the US is the cryogenic SNS-nEDM experiment. The concept introduces a number of novelfeatures based on the proposal by Golub and Lamoreaux(1994). The plan is to produce UCN in SF-He from a cold-neutron beam within the EDM-storage volumes. Cryogenicsuperconducting shielding and the high dielectric strength ofSF-He are expected to provide reduced systematics and higherelectric fields than room-temperature vacuum experiments.A small amount of highly polarized 3He will be introducedinto the EDM chambers to serve as both a comagnetometerand a spin analyzer. UCN are captured by 3He in a spin-singletstate due to an unbound resonance in nþ 3He with emissionof a proton and triton with a total energy of 764 keV(nþ 3He → 1Hþ 3H). Thus, effectively, only neutrons withspin opposite the 3He spin are captured, and the rate ofemission of the proton and triton will measure the projectionof the relative spin orientation of the neutron and 3He. Theproton and triton will be detected by scintillation in the SF-Hedue to the formation and decay of He� molecules and emissionof 84 nm photons. The UV photons are converted to longer
wavelengths for detection by photomultipliers after absorptionon the surface coating of deuterated tetraphenyl-butadiene(dTPB) polymer matrix, chosen due to the low loss of UCNon the deuterium. As the UCN and 3He spins precess theabsorption is modulated at the difference of precession rates.The change of modulation frequency of the scintillation lightwith electric field would signal a difference of the two species’EDMs and, assuming the 3He atomic EDM is much smallerdue to Schiff screening (Dzuba, Flambaum, and Ginges,2007), the neutron EDM.The precession frequency of 3He is 32.43 MHz=T, com-
pared to 29.16 MHz=T for the neutron, so any systematiceffect (false EDM) due to a change of magnetic fieldcorrelated with the electric field is suppressed by a factorof about 10. However, it is possible to shift the precessionfrequencies of both species with an oscillating magnetic fieldvia the Ramsey-Bloch-Siegert effect [Eq. (93)], with ωRot setbetween the two free-precession frequencies to “dress” thespins (Cohen-Tannoudji and Haroche, 1969). This results inpotentially orders of magnitude more sensitive comagnetom-etry. Alternatively, the 3He spin precession can be independ-ently monitored with SQUID sensors to signal any changes inthe magnetic field. The precessing 3He magnetization can bemonitored with SQUID magnetometers (Kim and Clayton,2015). The geometric phase will affect 3He, and the mean-freepath of the 3He atoms depends on temperature, which isnominally 0.4–0.5 K, but can be adjusted to scan the geo-metric-phase effect. After each measurement, the depolarized3He must be removed from the superfluid helium using a heat-flush and phonon wind technique (McClintock, Meredith, andWigmore, 1984).
9. Possible EDM experiments at the European Spallation Source
A fundamental-neutron-physics program was proposed forthe European Spallation Source (Pignol, Soldner, andTheroine, 2014). In addition to possible UCN EDM experi-ments, a reprised beam experiment was proposed (Piegsa,2013). In this concept, the pulsed structure of the ESS wouldprovide velocity discrimination and could be used to monitorv × E effects with the much greater statistical power providedby the cold-neutron beam.
10. Crystal EDM
P-odd and T-odd rotation of the neutron spin in Lauediffraction of polarized neutrons incident on a crystal issensitive to the neutron-EDM interaction with the stronginterplanar electric field. The first experiment on CdS wasundertaken by Shull and Nathans (1967), who founddn ¼ ð2.4� 3.9Þ × 10−22e cm. Fedorov et al. (2010) carriedout an experiment at the ILL cold-neutron beam facility PF1Bmeasuring the spin rotation of monochromatic polarizedneutrons incident on a quartz crystal. The effective electricfield was estimated to be of the order of 108 V=cm. Thefinal neutron spin directions were analyzed for differentincident neutron spin to separate the EDM effect fromthe Mott-Schwinger interaction with atomic electrons in thecrystal. The result from about one week of data wasdn ¼ ½2.5� 6.5ðstatÞ � 5.5ðsystÞ� × 10−24e cm. Prospects for
Chupp et al.: Electric dipole moments of atoms, molecules, …
Rev. Mod. Phys., Vol. 91, No. 1, January–March 2019 015001-34

an improved setup suggest that the sensitivity can be improvedto 2 × 10⁻²⁶e cm for 100 days of data taking (Fedorovet al., 2010).
B. Paramagnetic atoms: Cs and Tl
The EDM of a paramagnetic system is most sensitive to theelectron EDM de and the strength CS of a nuclear-spin-independent electron-nucleus coupling corresponding to ascalar nuclear current. The tensor nuclear current contributionis several orders of magnitude smaller, and the pseudoscalarcontribution vanishes in the limit of zero velocity (i.e., infinitenuclear mass).The first direct atomic-EDM experiment—measurement
of the frequency shift of the cesium atom EDM in anatomic beam with a modulated electric field—was under-taken by Sandars and Lipworth (1964) and collaborators.There are many challenges to such a measurement. First,the atomic beam, traveling at several hundred m/s, transitedan apparatus of length less than a meter so that linewidthsof several kHz were observed (Ramsey’s separated oscil-latory field technique was used). Second, due to theunpaired electron, the cesium atom has a large magneticmoment that couples both to external magnetic fields and tothe motional magnetic field Bm ¼ v × E=c2. The magneticfield produced by any leakage currents would change withthe modulation of the electric field and could provide afalse-EDM signal. Misalignment of the applied magneticand electric fields also produces a false signal. By determin-ing the center of a resonance line to a precision better than thelinewidth, i.e., line splitting by more than 10 000, the frequencyshift sensitivity was of the order of 0.1 Hz. The result is dCs ¼ð2.2� 0.1Þ × 10−19 e cm with an electric field up to60 kV=cm. The error is statistical only, and the finite EDMsignal is attributed to the motional effect due to a misalignmentof 10 mrad (Sandars and Lipworth, 1964). Subsequent workusing other alkali-metal species with lower Z and lesssensitivity to T-odd and P-odd interactions to monitor mag-netic-field effects—now called a comagnetometer—led to theresult dCs ¼ð5.1�4.4Þ×10−20ecm (Carrico et al., 1968).Shortly after that publication, Weisskopf (1968) andcollaborators presented a significantly improved resultbased on a longer interaction region, correspondingly nar-rower resonance lines, and a sodium comagnetometerdCs ¼ ð0.8� 1.8Þ × 10−22 e cm.The cesium atomic beam EDM experiments were ulti-
mately limited by the linewidths, count-rate limitations, andby systematic errors due to motional magnetic-field effects,although the atomic beam machines provided the capabilityto use other, lighter alkali-metal species, i.e., a comagne-tometer, significantly reducing the motional-field systematicerrors (Weisskopf, 1968). Another approach was the vaporcell experiment developed by Hunter and collaborators(Murthy et al., 1989). The confined atoms provided muchnarrower resonance linewidths (≈50 Hz), and also greatlymitigated motional-field effects. Although a comagnetom-eter was not practical in the vapor cell, the leakage currentswere directly measured and set the systematic uncertainty inthe final result
dCs ¼ ½−1.8� 6.7ðstatÞ � 1.8ðsystÞ� × 10−24e cm: ð101Þ
Sandars’s group performed an atomic beam experiment tosearch for an electric dipole moment in the 3P2 metastablestate of xenon with a comagnetometer beam of krypton(Player and Sandars, 1970; Harrison, Player, and Sandars,1971). In the strong applied electric field, the parity-allowedsplittings are proportional to m2
JE2 and to the magnetic-field
component along E. The EDM signal would be a splittinglinear in E; however, transitions that change the magneticquantum number mJ are not practical due to the sensitivity ofthe E2 term to a change of the magnitude of the electricfield. Thus the ΔjmJj ¼ 0 transition mJ ¼ −1 → mJ ¼ þ1was measured. With the xenon-krypton comparison,the difference of EDMs was found to be jdXe − dKrj ¼ð0.7� 2.2Þ × 10−22e cm, where the errors are 90% C.L.Commins et al. (1994) developed a vertical counterpropa-
gating thallium atomic beam and subsequently added sodiumbeams as a comagnetometer (Regan et al., 2002). Theseexperiments pioneered a new understanding of some of themost important systematic effects for EDM experiments,including those mitigated by the comagnetometer and thegeometric-phase effect (Commins, 1991; Pendlebury et al.,2004; Barabanov, Golub, and Lamoreaux, 2006). The mostrecent result can be interpreted as
dTl ¼ ð−4.0� 4.3Þ × 10−25e cm: ð102Þ
1. Prospects for alkali-metal atoms
Laser cooling and trapping of cesium and francium offerpromising new directions, and several approaches are beingpursued. Cesium atomic fountain clocks based on launchingatoms from a laser cooled or trapped sample have moved tothe forefront of time keeping. Narrow linewidths (τ ≈ 1 s) areattained as the atoms move up and then down through aresonance region. While the 133Cs atomic frequency standarduses the ΔmF ¼ 0 transition, which is insensitive to smallmagnetic fields in first order, an EDM measurement must useΔmF ≥ 1. From Eq. (5), with T ¼ 1 s, τ ≫ T, and N ¼ 106,the expected uncertainty on ω is expected to be aboutδω ≈ 10−3 Hz, which is consistent with observations of theAllan variance representing the short-term instability ofcesium-fountain clocks (σω=ω≈10−13 for ω¼ 2π×9.2GHz)(Weyers, Lipphardt, and Schnatz, 2009). For an EDMmeasurement with an electric field of 100 kV=cm, whichmay be feasible, each 1 s shot would have a sensitivity of6 × 10−24e cm, comparable to the sensitivities of both thecesium and thallium measurements. Thus significant improve-ment is possible, and a demonstration experiment with about1000 atoms per shot and E ¼ 60 kV=cm was reported as ameasurement of de by Amini, Munger, and Gould (2007). Theresult can be interpreted as dCs ¼ ð−0.57� 1.6Þ × 10−20e cm(they used ηe ¼ 114 for cesium). The major limitation inthis demonstration was the necessity to map out the entireresonance-line shape spectrum, which is the combination oftransitions among the nine hyperfine sublevels and inhomo-geneities of the applied magnetic field in the resonance region.
Chupp et al.: Electric dipole moments of atoms, molecules, …
Rev. Mod. Phys., Vol. 91, No. 1, January–March 2019 015001-35

This subjected the measurement to slow magnetic-field driftsthat would need to be monitored or compensated. If theseproblems are solved, the statistical sensitivity could be sig-nificantly improved with several orders of magnitude moreatoms, higher electric-field and duty-factor improvements.However, the major systematic effect due to v × E was about2 × 10−22e cm (Amini, Munger, and Gould, 2007). This couldultimately limit the sensitivity of a single species fountainmeasurement.For francium ηde , the ratio of atomic EDM to electron EDM
from Eq. (66) is in the range 900–1200 (Ginges andFlambaum, 2004), and kCS
should be similarly enhancedfor francium. Francium can be produced in significantquantities in isotope-separator rare-isotope production facili-ties, and 210Fr has been produced, laser cooled, and trapped ina magneto-optical trap (MOT) (Gomez et al., 2008). Theexperiment has been moved to the isotope-separator facility(ISAC) at TRIUMF in Vancouver, Canada. A parallel effort isunderway at Tohoku University Cyclotron and RadioisotopeCenter (CYRIC) (Sakemi et al., 2011; Kawamura et al.,2014). Francium isotopes have half-lives of 20 min (for 212Fr)or less, and any experiment would need to be “on-line,” that isthe EDM apparatus would be at the site of the rare-isotopeproduction facility. Applying the cesium-fountain approachto francium may lead the way to a future program at theFacility for Rare Isotope Beams (FRIB) at Michigan StateUniversity.The fountain concept allows linewidths on the order of
1 Hz, limited by the time for the cold atoms with verticalvelocity of a few m/s to rise and fall about 1 m. Another ideabeing pursued by D. Weiss and collaborators is to stop andcool alkali-metal atoms in optical molasses near the apogee oftheir trajectory and trap them in an optical lattice formed in abuild-up cavity (Fang and Weiss, 2009). Storage times in thelattice could be many seconds. The lattice would be loadedwith multiple launches, filling lattice sites that extend over5–10 cm, and 108 or more atoms could be used for the EDMmeasurement. After loading the lattice, the atoms would beoptically pumped to maximum polarization and then thepopulation transferred to the mF ¼ 0 state by a series ofmicrowave pulses. A large electric field (e.g., 150 kV=cm)would define the quantization axis in nominally zero magneticfield, and the energies would be proportional to m2
F due to theparity-allowed interaction.In another planned innovation, a Ramsey separated-field
approach would be used with the free-precession intervalinitiated by pulses that transfer atoms to a superposition ofmF ¼ F andmF ¼ −F states and terminated by a set of pulsescoherent with the initial pulses. The relative populationstransferred back to the mF ¼ 0 state would be probed byoptical fluorescence that could be imaged with about 1 mmspatial resolution (Zhu et al., 2013). With the large size of thelattice, the superposition of stretched levels (mF ¼ �F) wouldamplify the sensitivity by a factor of F relative to experimentsthat monitor ΔmF ¼ 1 transitions (Xu and Heinzen, 1999).In a measurement time τ ¼ 3 s, and N ¼ 2 × 10⁸, an EDMsensitivity of 6.5 × 10⁻²⁶e cm for the cesium atom is expected.The optical lattice can also trap rubidium, which could be usedas a comagnetometer.
C. Paramagnetic polar molecules: YbF, ThO, and 180Hf19F+
Molecular-beam EDM experiments exploit several featuresof diatomic polar molecules, usually one light and one heavyatom; most significantly the strong interatomic electric fieldwith characteristic strength of 10–100 GV=cm. The pioneer-ing molecular-beam EDM approach of Coveney and Sandars(1983) and Wilkening, Ramsey, and Larson (1984) usedthallium fluoride (TlF) which is diamagnetic and is discussedin the next section. A number of groups have followed thelead of Hudson et al. (2002) and investigated paramagneticmolecules. The most sensitive measurements in paramagneticsystems are from YbF (Hudson et al., 2011), ThO (Baronet al., 2014, 2017), and HfFþ (Cairncross et al., 2017).In addition, efforts using the molecular ion ThFþ, which issimilar in electronic structure, are underway by Loh et al.(2013) .Experimentally, the internal electric dipole moment D is
oriented parallel or antiparallel to a relatively modest appliedelectric field in the lab Elab ¼ Elabz. In essence the molecule’selectric polarizability is very large resulting in an effectivemolecular dipole moment Dz ∝ Elab. In the atomic beam, theaverage orientation of Dz can be expressed as a polarizationPz ¼ Dz=jDj, for example, the dependence of Pz for YbF isshown in Fig. 23. For ThO and HfFþ, which are effectivelyfully electrically polarized by a relatively small laboratoryelectric field, the estimated effective internal electric fields areEeff ≈ 84 and ≈ 23 GV=cm, respectively, which can be foundin Table III using Eeff ¼ ℏαde=e.The electronic energy-level structure of a ΣΛΩ ¼3 Δ1, e.g.,
F ¼ 1 state in the polar molecule ThO, is shown in Fig. 24.The quantum numbers labeled by capital Greek letters indicateangular momentum projected on the internuclear axis (Σ ¼ 3indicates the electron-spin triplet state, orbital angularmomentum Λ ¼ 2 is labeled by Δ, and the total of spinand orbital angular momentum and rotation is Ω ¼ 1). The3Δ1 state also results in a relatively small magnetic moment asthe spin and orbital moments cancel. As shown, the laboratoryelectric field electrically polarizes the molecule, providingtwo directions of the internal electric field with differentsplittings due to the EDM, but the same magnetic-field
0
5
10
15
20
0 10 20 30
Applied field E (kV/cm)
Eef
f (
GV
/cm
)
FIG. 23. The effective electric field Eeff in YbF as a function ofthe applied electric field (Elab in the text). The fully saturated Eeffcorresponds to Pz ¼ 1. From Hudson et al., 2002.
Chupp et al.: Electric dipole moments of atoms, molecules, …
Rev. Mod. Phys., Vol. 91, No. 1, January–March 2019 015001-36
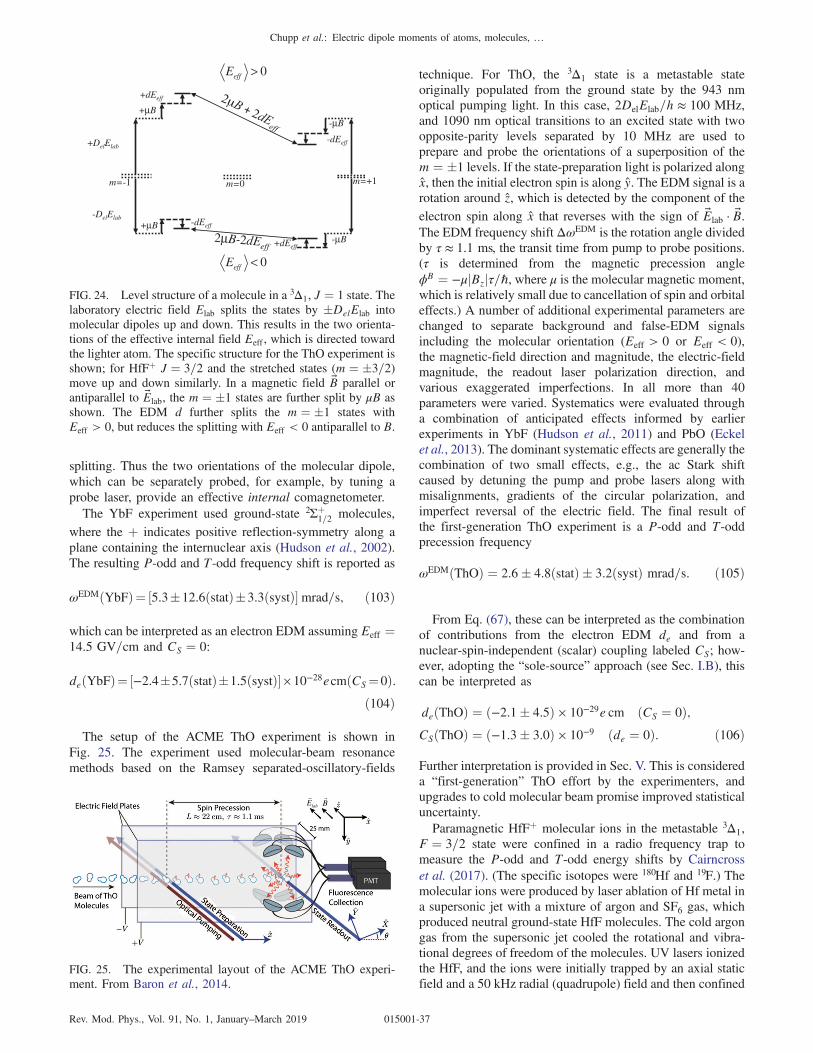
splitting. Thus the two orientations of the molecular dipole,which can be separately probed, for example, by tuning aprobe laser, provide an effective internal comagnetometer.The YbF experiment used ground-state 2Σþ
1=2 molecules,where the þ indicates positive reflection-symmetry along aplane containing the internuclear axis (Hudson et al., 2002).The resulting P-odd and T-odd frequency shift is reported as
ωEDMðYbFÞ¼ ½5.3�12.6ðstatÞ�3.3ðsystÞ�mrad=s; ð103Þ
which can be interpreted as an electron EDM assuming Eeff ¼14.5 GV=cm and CS ¼ 0:
deðYbFÞ¼ ½−2.4�5.7ðstatÞ�1.5ðsystÞ�×10−28ecmðCS¼0Þ:ð104Þ
The setup of the ACME ThO experiment is shown inFig. 25. The experiment used molecular-beam resonancemethods based on the Ramsey separated-oscillatory-fields
technique. For ThO, the 3Δ1 state is a metastable stateoriginally populated from the ground state by the 943 nmoptical pumping light. In this case, 2DelElab=h ≈ 100 MHz,and 1090 nm optical transitions to an excited state with twoopposite-parity levels separated by 10 MHz are used toprepare and probe the orientations of a superposition of them ¼ �1 levels. If the state-preparation light is polarized alongx, then the initial electron spin is along y. The EDM signal is arotation around z, which is detected by the component of theelectron spin along x that reverses with the sign of Elab · B.The EDM frequency shift ΔωEDM is the rotation angle dividedby τ ≈ 1.1 ms, the transit time from pump to probe positions.(τ is determined from the magnetic precession angleϕB ¼ −μjBzjτ=ℏ, where μ is the molecular magnetic moment,which is relatively small due to cancellation of spin and orbitaleffects.) A number of additional experimental parameters arechanged to separate background and false-EDM signalsincluding the molecular orientation (Eeff > 0 or Eeff < 0),the magnetic-field direction and magnitude, the electric-fieldmagnitude, the readout laser polarization direction, andvarious exaggerated imperfections. In all more than 40parameters were varied. Systematics were evaluated througha combination of anticipated effects informed by earlierexperiments in YbF (Hudson et al., 2011) and PbO (Eckelet al., 2013). The dominant systematic effects are generally thecombination of two small effects, e.g., the ac Stark shiftcaused by detuning the pump and probe lasers along withmisalignments, gradients of the circular polarization, andimperfect reversal of the electric field. The final result ofthe first-generation ThO experiment is a P-odd and T-oddprecession frequency
ωEDMðThOÞ ¼ 2.6� 4.8ðstatÞ � 3.2ðsystÞ mrad=s: ð105Þ
From Eq. (67), these can be interpreted as the combinationof contributions from the electron EDM de and from anuclear-spin-independent (scalar) coupling labeled CS; how-ever, adopting the “sole-source” approach (see Sec. I.B), thiscan be interpreted as
deðThOÞ ¼ ð−2.1� 4.5Þ × 10−29e cm ðCS ¼ 0Þ;CSðThOÞ ¼ ð−1.3� 3.0Þ × 10−9 ðde ¼ 0Þ: ð106Þ
Further interpretation is provided in Sec. V. This is considereda “first-generation” ThO effort by the experimenters, andupgrades to cold molecular beam promise improved statisticaluncertainty.Paramagnetic HfFþ molecular ions in the metastable 3Δ1,
F ¼ 3=2 state were confined in a radio frequency trap tomeasure the P-odd and T-odd energy shifts by Cairncrosset al. (2017). (The specific isotopes were 180Hf and 19F.) Themolecular ions were produced by laser ablation of Hf metal ina supersonic jet with a mixture of argon and SF6 gas, whichproduced neutral ground-state HfF molecules. The cold argongas from the supersonic jet cooled the rotational and vibra-tional degrees of freedom of the molecules. UV lasers ionizedthe HfF, and the ions were initially trapped by an axial staticfield and a 50 kHz radial (quadrupole) field and then confined
+DelElab
+dEeff
-μB
-dEeff
-μB +dEeff
+μB
+μB -dEeff
Eeff > 0
Eeff < 0
-DelElab
2μB 2dEeff
m=-1 m=0 m=+1
FIG. 24. Level structure of a molecule in a 3Δ1, J ¼ 1 state. Thelaboratory electric field Elab splits the states by �DelElab intomolecular dipoles up and down. This results in the two orienta-tions of the effective internal field Eeff , which is directed towardthe lighter atom. The specific structure for the ThO experiment isshown; for HfFþ J ¼ 3=2 and the stretched states (m ¼ �3=2)move up and down similarly. In a magnetic field B parallel orantiparallel to Elab, the m ¼ �1 states are further split by μB asshown. The EDM d further splits the m ¼ �1 states withEeff > 0, but reduces the splitting with Eeff < 0 antiparallel to B.
Elab B
FIG. 25. The experimental layout of the ACME ThO experi-ment. From Baron et al., 2014.
Chupp et al.: Electric dipole moments of atoms, molecules, …
Rev. Mod. Phys., Vol. 91, No. 1, January–March 2019 015001-37

by a uniform electric field rotating at 250 kHz. The result wasthat the ions rotated in a circle of about 1 mm diameter. Anaxial magnetic-field gradient created the bias field in the restframe of the ions. The Ramsey-style EDM measurementconsisted of laser preparation of a polarized spin state followedby a π=2 pulse, which created a superposition ofmF ¼ �3=2, afree-precession time of about 700 ms, and a second π=2 pulse.The final phase was read out by selective laser depopulation ofalternatingmF ¼ �3=2 levels followed by laser ionization anddetection of the Hfþ and background ions by a microchannelplate. Systematic effects are studied by observing frequencyshifts in channels that are not sensitive to the P-odd and T-oddeffects. The important systematic effects included nonidealreversal of the rotating magnetic field combined with thedifferent gyromagnetic ratios of the upper (labeled Eeff > 0)and lower (labeled Eeff < 0) pairs of states (doublets) due toStark mixing with J ¼ 2 states, geometric phases, and back-ground. The difference of frequencies for two flips that projectthe EDM—flipping the bias magnetic field and flippingEeff byselecting the upper to lower pair of states—was reported:
ωBDðHfFþÞ¼2π½0.1�0.87ðstatÞ�0.2ðsystÞ�mrad=s: ð107Þ
Assuming CS ¼ 0, the resulting sole-source electron EDM is
deðHfFþÞ¼ ½0.9�7.7ðstatÞ�1.7ðsystÞ�×10−29ecm: ð108Þ
The authors did not provide a soul-source limit onCS; however,Skripnikov (2017) calculated αCS
≈ 2.0 × 10⁶ rad=s, whichis used in the analysis presented in Sec. V, which includesresults from ThO and 180Hf 19Fþ to constrain de and CSsimultaneously.A second-generation ion trap thatmay confine 10 timesmore
HfFþ ions in a larger volume combined with improvedelectrode design is expected to provide an order of magnitudehigher sensitivity (Cairncross et al., 2017). The JILAgroup also intends to perform an experiment on ThFþ
(Eeff ≈ 36 GV=cm), for which the ground state is 3Δ1 provid-ing for coherence times that are not limited by the lifetime of anexcited state. It has also been pointed out that an experimentwith the isotope 177Hf (18.6% abundance) with nuclear spinI ¼ 7=2 would be sensitive to the P-odd and T-odd magnetic-quadruople moment (Skripnikov, Titov, and Flambaum, 2017).A recent proposal to study the orientation-dependent
hyperfine structure of polar molecules in a rare-gas matrix,which is sensitive to the electron EDM was presented byVutha, Horbatsch, and Hessels (2018). Another promisingidea is to store paramagnetic molecular ions or other particlesin an electrostatic storage ring of a few meters diameter, usedas a large ion trap.10 Such a configuration enables the storageof molecular ions of all possible configurations of states. InTaO, for example, the ground-state structure is ΣΛΩ ¼3 Δ1,and ions could be trapped electrostatically for several hours inbunches of up to 107 ions with kinetic energies of the order100 keV. Preparation and readout of the molecular statesrelevant for EDM measurements would be done with lasers.
Because of the sub-kHz angular frequency of the particles, thesmall molecular magnetic dipole moment, and the eddycurrent and rf shielded environment provided by the vacuumhousing of the storage ring, no compensation of the ambientmagnetic fields is necessary. The long storage times in the ringallow for a large number of repetitions of the experimentfor each configuration, and the large number of ions stored inthe ring may enable up to 6 orders of magnitude greatersensitivity to de. At this level, EDMs and Majorana neutrinoshave model dependent connections, thus enabling a newpath to access physics beyond the SM (Ng and Ng, 1996;Archambault, Czarnecki, and Pospelov, 2004). Additionally,radium or radon ions could be stored, taking advantageof the octupole-enhanced Schiff moment or nuclear EDMdiscussed next.
D. Solid-state systems
The electron EDM can also be measured in specialferroelectric and paramagnetic solid-state systems withquasifree electron spins that can be subjected to appliedelectric and magnetic fields. Advantages of such a systemare as follows:
(i) a high number density of unpaired electrons(1022 cm−3), providing signal amplification;
(ii) confinement of the electrons, mitigating such effectsas motional fields;
(iii) features of solid-state samples including collectiveeffects, e.g., for ferroelectric systems, a largeelectric field spin polarizes the electrons resultingin a magnetization that reverses with the electricfield; and
(iv) minimal magnetic order to mitigate spurious mag-netic effects.
A cryogenic experiment increases the electron polarizationand provides for detection of the resulting magnetization bySQUID magnetometers. The desired properties of an idealmaterial follow from consideration of the specific require-ments of the EDM search (Shapiro, 1968; Ignatovich, 1969;Buhmann, Dzuba, and Sushkov, 2002; Liu and Lamoreaux,2004; Sushkov, Eckel, and Lamoreaux, 2009, 2010).The polycrystal Gd3Ga5O12 (gadolinium gallium
garnet) provides seven unpaired atomic electrons, highresistivity (1014 Ωm), and high dielectric strength(1 GV=m). Enhancement of the electron EDM leads to anatomic EDM of Gd3þ atoms in the lattice dGd3þ ≈ 20de, andthe result de ¼ð−5.57�7.98stat�0.12systÞ×10−25ecm wasreached with 5 days of data (Kim et al., 2015). An experi-ment in the paramagnetic ferroelectric Eu0.5Ba0.5TiO3 mea-sured de ¼ ð−1.07� 3.06stat � 1.74systÞ × 10−25e cm (Eckel,Sushkov, and Lamoreaux, 2012). Although this result isseveral orders of magnitude short of the sensitivity ofparamagnetic molecules, improvements to magnetic noiseand shielding can improve sensitivity. Other materials underconsideration include SrTiO3 doped with Eu2þ (Muller andBurkard, 1979; Viana et al., 1994). Another approach inparamagnetic ferroelectrics detects the electric field pro-duced by the electron EDM that is magnetically aligned bypolarized spins (Heidenreich et al., 2005).
10A ring with in principle suitable parameters exists (von Hahnet al., 2016).
Chupp et al.: Electric dipole moments of atoms, molecules, …
Rev. Mod. Phys., Vol. 91, No. 1, January–March 2019 015001-38

E. Diamagnetic atoms and molecules
Diamagnetic atoms have the experimentally attractivefeature that they can be contained in room-temperature cellswith long polarization and spin-coherence lifetimes T1 and T�
2,because the nuclear spin is well shielded by the closedelectron shell. Diamagnetic atoms can also be spin polarizedusing optical-pumping techniques, providing the largest pos-sible signal-to-noise ratios and optimal statistical precision.Combined with techniques to carefully monitor and controlsystematic effects, measurements with 129Xe (Vold et al.,1984), with 129Xe=3He (Rosenberry, 2001), and the series ofmeasurements with 199Hg (Romalis et al., 2001; Griffith et al.,2009; Swallows et al., 2013; Graner et al., 2016) are the mostsensitive EDM measurements to date. The most recent 199Hgresult stands alone in its sensitivity to various sources of CPviolation (Graner et al., 2017). The diamagnetic molecule TlFwas used in pioneering work by Hinds and Sandars (1980) andWilkening, Ramsey, and Larson (1984). The most recentand most precise TlF result was reported by Cho, Sangster,and Hinds (1991), and a new effort to greatly improve thesensitivity is underway (Norrgard et al., 2017).As discussed in Sec. II.F and in Eq. (68), the dominant
contributions to the atomic EDM in diamagnetic atoms is theSchiff moment of the nucleus and the nuclear-spin-dependent
electron-nucleus force with coefficient Cð0ÞT . The Schiff
moment itself can arise from T-odd and P-odd NN inter-actions and from the EDMs of the individual nucleons (both129Xe and 199Hg have an unpaired neutron). However, thesesources can be related, depending on the nature of the P-oddand T-odd interactions as discussed in Sec. II.
1. Xenon
Xenon is the heaviest stable noble gas, and 129Xe is a spin-1=2 isotope. Spin-1=2 atoms in cells have the advantage thatonly magnetic dipole interactions with external fields, withother atoms, and with the cell walls are allowed. This leads tolonger spin-coherence times and narrow linewidths comparedto atoms with nuclear spin K > 1=2, which are subject, forexample, to electric quadrupole interactions, in particular,with the cell walls (Chupp and Hoare, 1990; Wu et al., 1990).Spin relaxation times of several hundreds of seconds andlonger are observed for free-induction decay. In natural xenon,the abundance of 129Xe is 26%; however isotopically enrichedgas is available. Polarization of 129Xe generally of greater than10%, and approaching 100%, is possible using spin exchange,mediated by the hyperfine interaction, with laser opticallypumped alkali-metal vapor (Zeng et al., 1985). Spin exchangealso makes it possible to use the alkali-metal vapor to monitorthe free precession of 129Xe polarization.The first EDM measurement in 129Xe by Fortson and
collaborators (Vold et al., 1984) used spin exchange withlaser optically pumped rubidium to polarize 129Xe in a stack ofthree cylindrical cells with electric fields of magnitude 3.2 to4.9 kV=cm applied parallel and antiparallel to a uniform andwell-shielded 10 μT magnetic field. The stack of cells, treatedas magnetometers, allows sums and differences of the free-precession frequencies to be used to determine the average
magnetic field, and the average magnetic-field gradient. Athird combination of the three frequencies is the EDM signal.One potential systematic error for such a system was theeffective magnetic field due to the hyperfine interaction,caused by any rubidium polarization projection along theelectric-field axis that somehow changed when the electricfields were changed. One successful approach was to “quench”the polarization of the two rubidium isotopes with resonance rfmagnetic fields (Oteiza, 1992). Another concern was anychange in the leakage currents that flowed across the cellsdue to the applied voltages that was different for different cells.Both effectswere studied and found to be small compared to thestatistical error of the measurement. The EDM of 129Xe wasmeasured to be dXe ¼ ð−0.3� 1.1Þ × 10−26e cm, where theerror is statistical only.Another approach to measure the 129Xe EDM used spin-
exchange pumped noble-gas masers of 129Xe and 3He (Chuppet al., 1994; Stoner et al., 1996; Bear et al., 1998). Spin-exchange optical pumping is practical, in principle, for anyodd-A noble gas, and a population inversion can be pumped inmultiple species with the same sign of the magnetic moment.The two species have very different sensitivity to the Schiffmoment and to other P-odd and T-odd interactions, which areapproximately proportional to Z2, but similar sensitivity tomagnetic-field effects, particularly those produced by leakagecurrents that can change when the electric field is changed.Thus the 3He served as a comagnetometer occupying nearlythe same volume as the 129Xe in a single measurement cell(Chupp et al., 1988). The result reported by Rosenberry(2001) was
dAð129XeÞ¼ ½0.7�3.3ðstatÞ�0.1ðsystÞ�×10−27ecm: ð109Þ
Several experimental efforts to improve the 129Xe EDMsensitivity by 2–3 orders of magnitude are underway, includ-ing the active maser (Yoshimi et al., 2002), highly polarizedliquid 129Xe detected with SQUID magnetometers (Ledbetter,2005; Ledbetter, Savukov, and Romalis, 2005), and gas-phaseexperiments with 3He comagnetometry and SQUID-magne-tometer detection (Heil et al., 2013; Kuchler, Fierlinger, andWurm, 2014). The SQUID-magnetometer experiments havedemonstrated signal and noise ratios that suggest 1 to 3 ordersof magnitude improvement in sensitivity to the 129Xe EDM ispossible in the near future.
2. Mercury
The 199Hg experiments undertaken by Fortson’s group(Romalis et al., 2001; Griffith et al., 2009; Graner et al.,2016) built on the ideas used in their 129Xe buffer-gas cellexperiment (Vold et al., 1984). However, there are two crucialdifferences with mercury: it is more chemically reactive,resulting in shorter coherence times, and it is heavier andthus generally more sensitive to sources of T and P violation.The most recent experiment (Graner et al., 2016) used a stackof four cells sealed with sulfur-free vacuum sealant anddirectly pumped and probed the 199Hg with a 254 nm laser(Harber and Romalis, 2000) as illustrated in Fig. 26. The outertwo of the four cells have no electric field and the inner two
Chupp et al.: Electric dipole moments of atoms, molecules, …
Rev. Mod. Phys., Vol. 91, No. 1, January–March 2019 015001-39

have electric fields in opposite directions so that a differenceof the free-precession frequencies for the two inner cells is anEDM signal. An EDM-like difference of the outer cellfrequencies was attributed to spurious effects such as non-uniform leakage currents correlated with the electric-fieldreversals and were therefore scaled and subtracted from theinner-cell frequency difference to determine the EDM fre-quency shift. The magnitudes of the leakage currents werealso monitored directly and used to set a maximum E-fieldcorrelated frequency shift that contributed to the systematicerror estimate. Other systematic error sources exploredincluded effects of high-voltage sparks on the EDM signalsand a number of possible correlations of experimentallymonitored parameters (e.g., laser power and magnetic-fieldfluctuations outside the magnetic shields). There were noapparent correlations, and the leakage current (�0.5 pA) wasso small that only upper limits on the systematic errors couldbe estimated. The most recent result is (Graner et al., 2017)
dAð199HgÞ¼ ½2.20�2.75ðstatÞ�1.48ðsystÞ�×10−30ecm:
ð110Þ
3. TlF
Molecular-beam experiments using TlF were pursued bySandars (Harrison, Sandars, and Wright, 1969a, 1969b; Hindsand Sandars, 1980), Ramsey (Wilkening, Ramsey, and Larson,1984), and Hinds (Schropp et al., 1987; Cho, Sangster, andHinds, 1991). For molecular beams, the systematic errorsassociated with the v × E and leakage-current effects aremitigated by using a relatively small applied electric field toalign the intermolecular axis as is the casewith polar moleculesdiscussed in Sec. IV.C. This results in a large internal electricfield at the thallium nucleus (Coveney and Sandars, 1983). Theexperiment is set up to detect an alignment of a spin or angularmomentum along the electric field by detecting precessionaround the internuclear axis, i.e., the frequency shift when therelative orientation of applied electric and magnetic fieldsare reversed. When the average projection of the thalliumnuclear spin on the internuclear axis is taken into account(hcos θσλi ¼ 0.524), a frequency shift for full electric polari-zation is determined to be d ¼ ð−0.13� 0.22Þ × 10−3 Hz.With the applied electric field of 29.5 kV=cm, the most recentresult (Cho, Sangster, and Hinds, 1991) is interpreted as apermanent dipole moment of the thallium molecule of
dTlF ¼ ð−1.7� 2.9Þ × 10−23e cm: ð111ÞFor TlF, the electron spins form a singlet, but both stable
isotopes of thallium (203Tl and 205Tl) have nuclear spinJπ ¼ 1=2þ, and the dipole distribution in the nucleus wouldbe aligned with the spin through T and P violation. This givesrise to the Schiff moment. An alternative (and the original)interpretation is based on the observation that in the odd-Athallium isotopes, one proton remains unpaired and can inducethe molecular EDM through both the Schiff moment [seeEqs. (37) and (38)] and magnetic interactions (Coveney andSandars, 1983). Separating these, the proton EDM wouldproduce a magnetic contribution to a molecular EDM ofdp−magTlF ¼ 0.13dp, and a contribution to the Schiff moment
that would produce a molecular EDM estimated to bedp−volTlF ¼ 0.46dp. The TlF molecular EDM can also arise fromthe electron EDM and from P- and T-violating scalar andtensor electron-hadron interactions. However, paramagnetic
systems are more sensitive to Cð0;1ÞS and diamagnetic systems
such as TlF are more sensitive toCð0;1ÞT . Thus this measurement
has been interpreted as a (model-dependent) measurement ofthe proton EDM: dp ¼ ð−3.7� 6.3Þ × 10−23 e cm.A new effort is underway to measure CP violation in TlF
using cooled molecules, which is based on work by Hunteret al. (2012) and Norrgard et al. (2017). This would combineadvantages of longer free-precession times and greater stat-istical power, which could provide several orders of magni-tude greater sensitivity compared to the result of Cho,Sangster, and Hinds (1991).
F. Octupole collectivity in diamagnetic systems
Recently, experimental efforts have focused on exploitingthe enhanced Schiff moment in nuclei with closely spacedground-state parity doublets and strong E1 matrix elements,characteristic of isotopes with nuclear octupole collectivity.For proton and neutron numbers in the range Z or N ≈ 34, 56,88, and N ≈ 134, nulceons near the Fermi surface populatestates of opposite parity separated by total angular momentum3ℏ, corresponding to reflection asymmetric states that leadto permanent octupole deformation or octupole vibration.In either case the intrinsic dipole moment is polarized alongthe nuclear spin by P-odd and T-odd interactions leading tothe nuclear Schiff moment, which is enhanced by the electricpolarizability of the nucleus, in analogy to polar molecules(see Sec. IV.C). In the two-state approximation, the resultingSchiff moment can be parametrized as
S ∝ ηeβ2β
23ZA
2=3r30Eþ − E−
; ð112Þ
where η represents the strength of the P-odd and T-oddinteraction, β2 and β3 are the quadrupole and octupole defor-mation parameters, andE� are the energies of the opposite-paritystates (Spevak and Auerbach, 1995; Auerbach, Flambaum, andSpevak, 1996; Spevak, Auerbach, and Flambaum, 1997). Notethat the octupole deformation parameter enters S quadratically,which means that both octupole vibrations and permanentdeformation are equally effective (Flambaum and Zelevinsky,2003; Zelevinsky, Volya, and Auerbach, 2008). Permanent
(a) (b)
FIG. 26. The experimental layout of the Seattle 199Hg experi-ment. From Graner et al., 2016.
Chupp et al.: Electric dipole moments of atoms, molecules, …
Rev. Mod. Phys., Vol. 91, No. 1, January–March 2019 015001-40
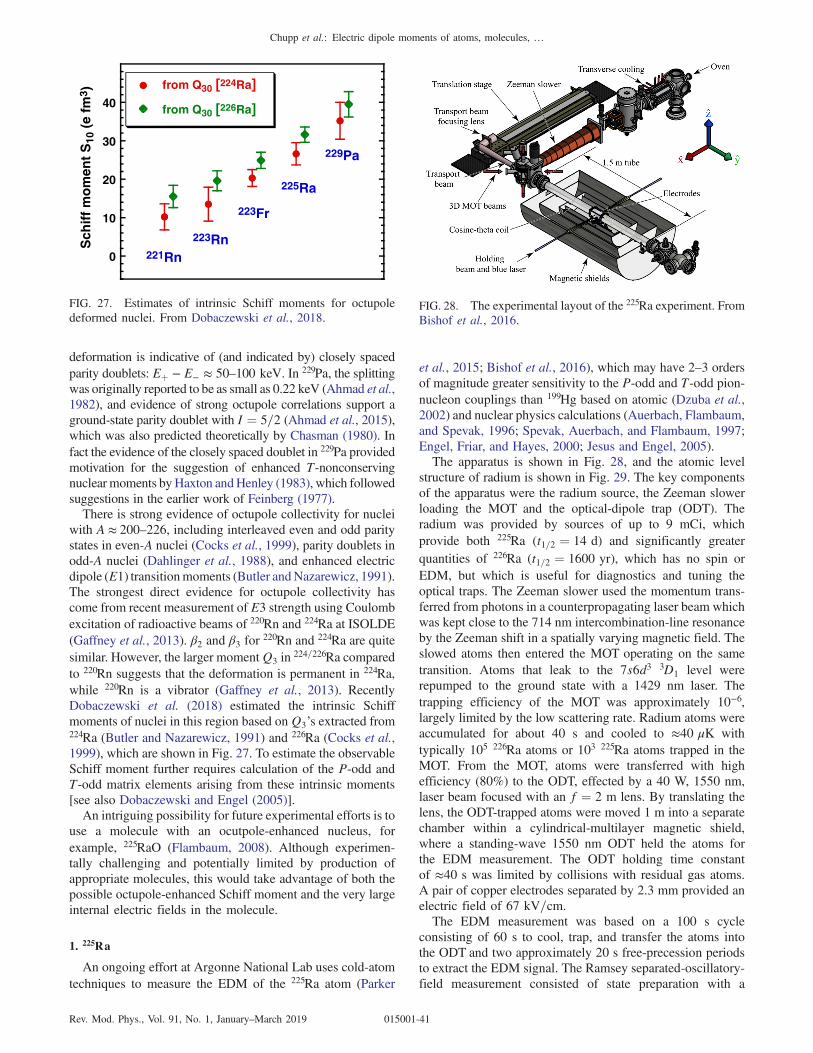
deformation is indicative of (and indicated by) closely spacedparity doublets: Eþ − E− ≈ 50–100 keV. In 229Pa, the splittingwas originally reported to be as small as 0.22 keV (Ahmad et al.,1982), and evidence of strong octupole correlations support aground-state parity doublet with I ¼ 5=2 (Ahmad et al., 2015),which was also predicted theoretically by Chasman (1980). Infact the evidence of the closely spaced doublet in 229Pa providedmotivation for the suggestion of enhanced T-nonconservingnuclear moments byHaxton andHenley (1983), which followedsuggestions in the earlier work of Feinberg (1977).There is strong evidence of octupole collectivity for nuclei
with A ≈ 200–226, including interleaved even and odd paritystates in even-A nuclei (Cocks et al., 1999), parity doublets inodd-A nuclei (Dahlinger et al., 1988), and enhanced electricdipole (E1) transitionmoments (Butler andNazarewicz, 1991).The strongest direct evidence for octupole collectivity hascome from recent measurement of E3 strength using Coulombexcitation of radioactive beams of 220Rn and 224Ra at ISOLDE(Gaffney et al., 2013). β2 and β3 for 220Rn and 224Ra are quitesimilar. However, the larger momentQ3 in 224=226Ra comparedto 220Rn suggests that the deformation is permanent in 224Ra,while 220Rn is a vibrator (Gaffney et al., 2013). RecentlyDobaczewski et al. (2018) estimated the intrinsic Schiffmoments of nuclei in this region based onQ3’s extracted from224Ra (Butler and Nazarewicz, 1991) and 226Ra (Cocks et al.,1999), which are shown in Fig. 27. To estimate the observableSchiff moment further requires calculation of the P-odd andT-odd matrix elements arising from these intrinsic moments[see also Dobaczewski and Engel (2005)].An intriguing possibility for future experimental efforts is to
use a molecule with an ocutpole-enhanced nucleus, forexample, 225RaO (Flambaum, 2008). Although experimen-tally challenging and potentially limited by production ofappropriate molecules, this would take advantage of both thepossible octupole-enhanced Schiff moment and the very largeinternal electric fields in the molecule.
1. 225Ra
An ongoing effort at Argonne National Lab uses cold-atomtechniques to measure the EDM of the 225Ra atom (Parker
et al., 2015; Bishof et al., 2016), which may have 2–3 ordersof magnitude greater sensitivity to the P-odd and T-odd pion-nucleon couplings than 199Hg based on atomic (Dzuba et al.,2002) and nuclear physics calculations (Auerbach, Flambaum,and Spevak, 1996; Spevak, Auerbach, and Flambaum, 1997;Engel, Friar, and Hayes, 2000; Jesus and Engel, 2005).The apparatus is shown in Fig. 28, and the atomic level
structure of radium is shown in Fig. 29. The key componentsof the apparatus were the radium source, the Zeeman slowerloading the MOT and the optical-dipole trap (ODT). Theradium was provided by sources of up to 9 mCi, whichprovide both 225Ra (t1=2 ¼ 14 d) and significantly greaterquantities of 226Ra (t1=2 ¼ 1600 yr), which has no spin orEDM, but which is useful for diagnostics and tuning theoptical traps. The Zeeman slower used the momentum trans-ferred from photons in a counterpropagating laser beam whichwas kept close to the 714 nm intercombination-line resonanceby the Zeeman shift in a spatially varying magnetic field. Theslowed atoms then entered the MOT operating on the sametransition. Atoms that leak to the 7s6d3 3D1 level wererepumped to the ground state with a 1429 nm laser. Thetrapping efficiency of the MOT was approximately 10−6,largely limited by the low scattering rate. Radium atoms wereaccumulated for about 40 s and cooled to ≈40 μK withtypically 105 226Ra atoms or 103 225Ra atoms trapped in theMOT. From the MOT, atoms were transferred with highefficiency (80%) to the ODT, effected by a 40 W, 1550 nm,laser beam focused with an f ¼ 2 m lens. By translating thelens, the ODT-trapped atoms were moved 1 m into a separatechamber within a cylindrical-multilayer magnetic shield,where a standing-wave 1550 nm ODT held the atoms forthe EDM measurement. The ODT holding time constantof ≈40 s was limited by collisions with residual gas atoms.A pair of copper electrodes separated by 2.3 mm provided anelectric field of 67 kV=cm.The EDM measurement was based on a 100 s cycle
consisting of 60 s to cool, trap, and transfer the atoms intothe ODT and two approximately 20 s free-precession periodsto extract the EDM signal. The Ramsey separated-oscillatory-field measurement consisted of state preparation with a
from Q30 [224Ra]
from Q30 [226Ra]
221Rn
Sch
iff
mo
men
t S
10 (
e fm
3 )
223Rn
223Fr
225Ra
229Pa
0
10
20
30
40
FIG. 27. Estimates of intrinsic Schiff moments for octupoledeformed nuclei. From Dobaczewski et al., 2018.
FIG. 28. The experimental layout of the 225Ra experiment. FromBishof et al., 2016.
Chupp et al.: Electric dipole moments of atoms, molecules, …
Rev. Mod. Phys., Vol. 91, No. 1, January–March 2019 015001-41
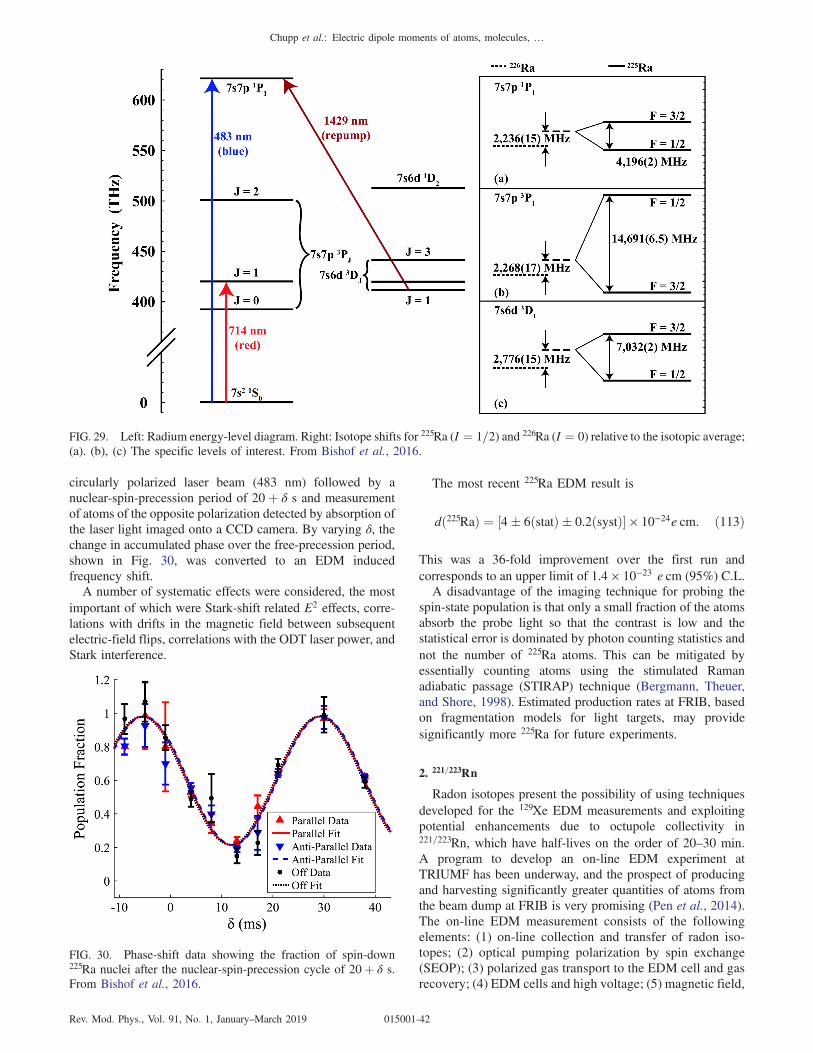
circularly polarized laser beam (483 nm) followed by anuclear-spin-precession period of 20þ δ s and measurementof atoms of the opposite polarization detected by absorption ofthe laser light imaged onto a CCD camera. By varying δ, thechange in accumulated phase over the free-precession period,shown in Fig. 30, was converted to an EDM inducedfrequency shift.A number of systematic effects were considered, the most
important of which were Stark-shift related E2 effects, corre-lations with drifts in the magnetic field between subsequentelectric-field flips, correlations with the ODT laser power, andStark interference.
The most recent 225Ra EDM result is
dð225RaÞ ¼ ½4� 6ðstatÞ � 0.2ðsystÞ� × 10−24e cm: ð113Þ
This was a 36-fold improvement over the first run andcorresponds to an upper limit of 1.4 × 10⁻²³ e cm (95%) C.L.A disadvantage of the imaging technique for probing the
spin-state population is that only a small fraction of the atomsabsorb the probe light so that the contrast is low and thestatistical error is dominated by photon counting statistics andnot the number of 225Ra atoms. This can be mitigated byessentially counting atoms using the stimulated Ramanadiabatic passage (STIRAP) technique (Bergmann, Theuer,and Shore, 1998). Estimated production rates at FRIB, basedon fragmentation models for light targets, may providesignificantly more 225Ra for future experiments.
2. 221=223Rn
Radon isotopes present the possibility of using techniquesdeveloped for the 129Xe EDM measurements and exploitingpotential enhancements due to octupole collectivity in221=223Rn, which have half-lives on the order of 20–30 min.A program to develop an on-line EDM experiment atTRIUMF has been underway, and the prospect of producingand harvesting significantly greater quantities of atoms fromthe beam dump at FRIB is very promising (Pen et al., 2014).The on-line EDM measurement consists of the followingelements: (1) on-line collection and transfer of radon iso-topes; (2) optical pumping polarization by spin exchange(SEOP); (3) polarized gas transport to the EDM cell and gasrecovery; (4) EDM cells and high voltage; (5) magnetic field,
FIG. 29. Left: Radium energy-level diagram. Right: Isotope shifts for 225Ra (I ¼ 1=2) and 226Ra (I ¼ 0) relative to the isotopic average;(a). (b), (c) The specific levels of interest. From Bishof et al., 2016.
FIG. 30. Phase-shift data showing the fraction of spin-down225Ra nuclei after the nuclear-spin-precession cycle of 20þ δ s.From Bishof et al., 2016.
Chupp et al.: Electric dipole moments of atoms, molecules, …
Rev. Mod. Phys., Vol. 91, No. 1, January–March 2019 015001-42
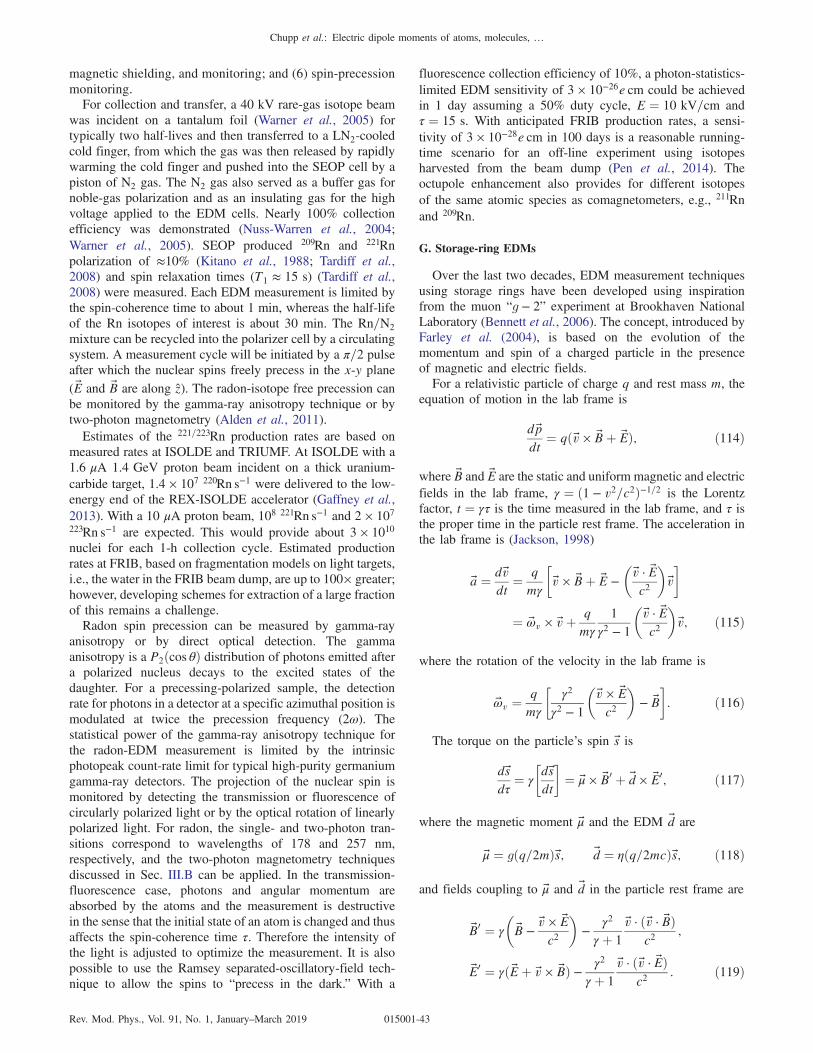
magnetic shielding, and monitoring; and (6) spin-precessionmonitoring.For collection and transfer, a 40 kV rare-gas isotope beam
was incident on a tantalum foil (Warner et al., 2005) fortypically two half-lives and then transferred to a LN2-cooledcold finger, from which the gas was then released by rapidlywarming the cold finger and pushed into the SEOP cell by apiston of N2 gas. The N2 gas also served as a buffer gas fornoble-gas polarization and as an insulating gas for the highvoltage applied to the EDM cells. Nearly 100% collectionefficiency was demonstrated (Nuss-Warren et al., 2004;Warner et al., 2005). SEOP produced 209Rn and 221Rnpolarization of ≈10% (Kitano et al., 1988; Tardiff et al.,2008) and spin relaxation times (T1 ≈ 15 s) (Tardiff et al.,2008) were measured. Each EDM measurement is limited bythe spin-coherence time to about 1 min, whereas the half-lifeof the Rn isotopes of interest is about 30 min. The Rn=N2
mixture can be recycled into the polarizer cell by a circulatingsystem. A measurement cycle will be initiated by a π=2 pulseafter which the nuclear spins freely precess in the x-y plane(E and B are along z). The radon-isotope free precession canbe monitored by the gamma-ray anisotropy technique or bytwo-photon magnetometry (Alden et al., 2011).Estimates of the 221=223Rn production rates are based on
measured rates at ISOLDE and TRIUMF. At ISOLDE with a1.6 μA 1.4 GeV proton beam incident on a thick uranium-carbide target, 1.4 × 10⁷ 220Rn s−1 were delivered to the low-energy end of the REX-ISOLDE accelerator (Gaffney et al.,2013). With a 10 μA proton beam, 108 221Rn s−1 and 2 × 10⁷
223Rn s−1 are expected. This would provide about 3 × 10¹⁰
nuclei for each 1-h collection cycle. Estimated productionrates at FRIB, based on fragmentation models on light targets,i.e., the water in the FRIB beam dump, are up to 100× greater;however, developing schemes for extraction of a large fractionof this remains a challenge.Radon spin precession can be measured by gamma-ray
anisotropy or by direct optical detection. The gammaanisotropy is a P2ðcos θÞ distribution of photons emitted aftera polarized nucleus decays to the excited states of thedaughter. For a precessing-polarized sample, the detectionrate for photons in a detector at a specific azimuthal position ismodulated at twice the precession frequency (2ω). Thestatistical power of the gamma-ray anisotropy technique forthe radon-EDM measurement is limited by the intrinsicphotopeak count-rate limit for typical high-purity germaniumgamma-ray detectors. The projection of the nuclear spin ismonitored by detecting the transmission or fluorescence ofcircularly polarized light or by the optical rotation of linearlypolarized light. For radon, the single- and two-photon tran-sitions correspond to wavelengths of 178 and 257 nm,respectively, and the two-photon magnetometry techniquesdiscussed in Sec. III.B can be applied. In the transmission-fluorescence case, photons and angular momentum areabsorbed by the atoms and the measurement is destructivein the sense that the initial state of an atom is changed and thusaffects the spin-coherence time τ. Therefore the intensity ofthe light is adjusted to optimize the measurement. It is alsopossible to use the Ramsey separated-oscillatory-field tech-nique to allow the spins to “precess in the dark.” With a
fluorescence collection efficiency of 10%, a photon-statistics-limited EDM sensitivity of 3 × 10⁻²⁶e cm could be achievedin 1 day assuming a 50% duty cycle, E ¼ 10 kV=cm andτ ¼ 15 s. With anticipated FRIB production rates, a sensi-tivity of 3 × 10⁻²⁸e cm in 100 days is a reasonable running-time scenario for an off-line experiment using isotopesharvested from the beam dump (Pen et al., 2014). Theoctupole enhancement also provides for different isotopesof the same atomic species as comagnetometers, e.g., 211Rnand 209Rn.
G. Storage-ring EDMs
Over the last two decades, EDM measurement techniquesusing storage rings have been developed using inspirationfrom the muon “g − 2” experiment at Brookhaven NationalLaboratory (Bennett et al., 2006). The concept, introduced byFarley et al. (2004), is based on the evolution of themomentum and spin of a charged particle in the presenceof magnetic and electric fields.For a relativistic particle of charge q and rest mass m, the
equation of motion in the lab frame is
dpdt
¼ qðv × Bþ EÞ; ð114Þ
where B and E are the static and uniform magnetic and electricfields in the lab frame, γ ¼ ð1 − v2=c2Þ−1=2 is the Lorentzfactor, t ¼ γτ is the time measured in the lab frame, and τ isthe proper time in the particle rest frame. The acceleration inthe lab frame is (Jackson, 1998)
a ¼ dvdt
¼ qmγ
�v × Bþ E −
�v · Ec2
�v
�
¼ ωv × vþ qmγ
1
γ2 − 1
�v · Ec2
�v; ð115Þ
where the rotation of the velocity in the lab frame is
ωv ¼qmγ
�γ2
γ2 − 1
�v × Ec2
�− B
�: ð116Þ
The torque on the particle’s spin s is
dsdτ
¼ γ
�dsdt
�¼ μ × B0 þ d × E0; ð117Þ
where the magnetic moment μ and the EDM d are
μ ¼ gðq=2mÞs; d ¼ ηðq=2mcÞs; ð118Þ
and fields coupling to μ and d in the particle rest frame are
B0 ¼ γ
�B −
v × Ec2
�−
γ2
γ þ 1
v · ðv · BÞc2
;
E0 ¼ γðEþ v × BÞ − γ2
γ þ 1
v · ðv · EÞc2
: ð119Þ
Chupp et al.: Electric dipole moments of atoms, molecules, …
Rev. Mod. Phys., Vol. 91, No. 1, January–March 2019 015001-43
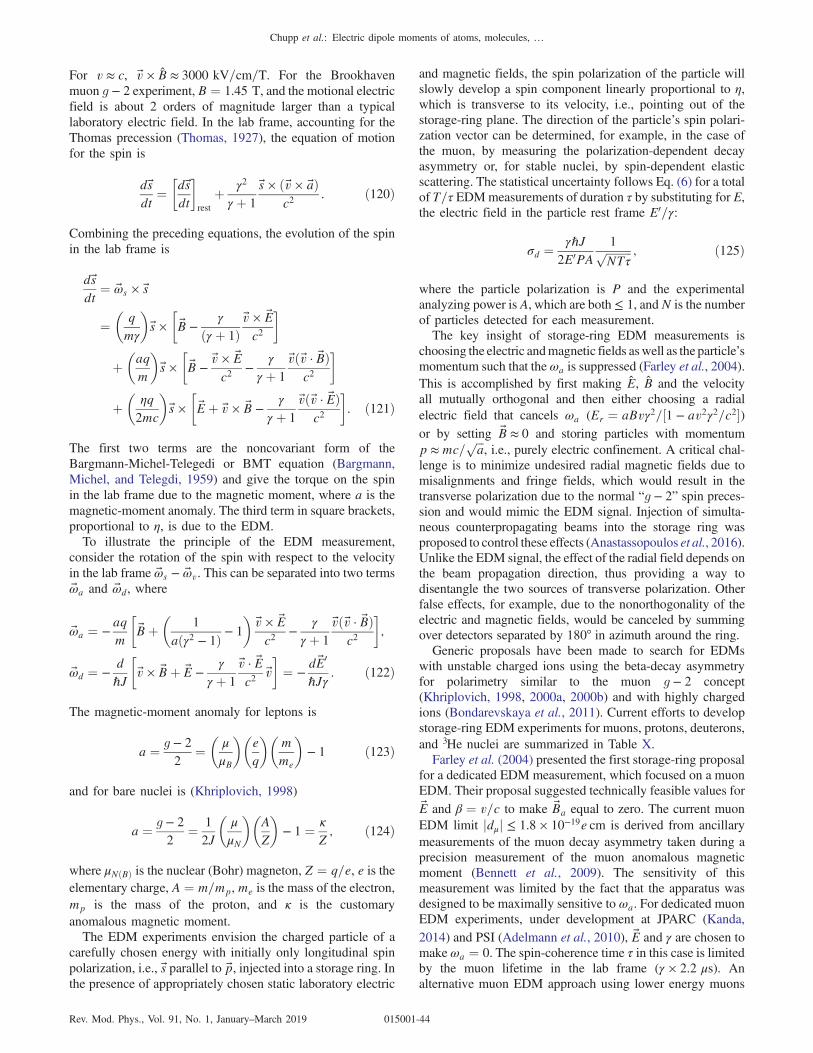
For v ≈ c, v × B ≈ 3000 kV=cm=T. For the Brookhavenmuon g − 2 experiment, B ¼ 1.45 T, and the motional electricfield is about 2 orders of magnitude larger than a typicallaboratory electric field. In the lab frame, accounting for theThomas precession (Thomas, 1927), the equation of motionfor the spin is
dsdt
¼�dsdt
�rest
þ γ2
γ þ 1
s × ðv × aÞc2
. ð120Þ
Combining the preceding equations, the evolution of the spinin the lab frame is
dsdt
¼ ωs × s
¼�
qmγ
�s ×
�B −
γ
ðγ þ 1Þv × Ec2
�
þ�aqm
�s ×
�B −
v × Ec2
−γ
γ þ 1
vðv · BÞc2
�
þ�
ηq2mc
�s ×
�Eþ v × B −
γ
γ þ 1
vðv · EÞc2
�: ð121Þ
The first two terms are the noncovariant form of theBargmann-Michel-Telegedi or BMT equation (Bargmann,Michel, and Telegdi, 1959) and give the torque on the spinin the lab frame due to the magnetic moment, where a is themagnetic-moment anomaly. The third term in square brackets,proportional to η, is due to the EDM.To illustrate the principle of the EDM measurement,
consider the rotation of the spin with respect to the velocityin the lab frame ωs − ωv. This can be separated into two termsωa and ωd, where
ωa ¼ −aqm
�Bþ
�1
aðγ2 − 1Þ − 1
�v × Ec2
−γ
γ þ 1
vðv · BÞc2
�;
ωd ¼ −dℏJ
�v × Bþ E −
γ
γ þ 1
v · Ec2
v
�¼ −
dE0
ℏJγ: ð122Þ
The magnetic-moment anomaly for leptons is
a ¼ g − 2
2¼�μ
μB
��eq
��mme
�− 1 ð123Þ
and for bare nuclei is (Khriplovich, 1998)
a ¼ g − 2
2¼ 1
2J
�μ
μN
��AZ
�− 1 ¼ κ
Z; ð124Þ
where μNðBÞ is the nuclear (Bohr) magneton, Z ¼ q=e, e is theelementary charge, A ¼ m=mp,me is the mass of the electron,mp is the mass of the proton, and κ is the customaryanomalous magnetic moment.The EDM experiments envision the charged particle of a
carefully chosen energy with initially only longitudinal spinpolarization, i.e., s parallel to p, injected into a storage ring. Inthe presence of appropriately chosen static laboratory electric
and magnetic fields, the spin polarization of the particle willslowly develop a spin component linearly proportional to η,which is transverse to its velocity, i.e., pointing out of thestorage-ring plane. The direction of the particle’s spin polari-zation vector can be determined, for example, in the case ofthe muon, by measuring the polarization-dependent decayasymmetry or, for stable nuclei, by spin-dependent elasticscattering. The statistical uncertainty follows Eq. (6) for a totalof T=τ EDMmeasurements of duration τ by substituting for E,the electric field in the particle rest frame E0=γ:
σd ¼γℏJ
2E0PA1ffiffiffiffiffiffiffiffiffiNTτ
p ; ð125Þ
where the particle polarization is P and the experimentalanalyzing power is A, which are both≤ 1, andN is the numberof particles detected for each measurement.The key insight of storage-ring EDM measurements is
choosing the electric andmagnetic fields aswell as the particle’smomentum such that the ωa is suppressed (Farley et al., 2004).This is accomplished by first making E, B and the velocityall mutually orthogonal and then either choosing a radialelectric field that cancels ωa (Er ¼ aBvγ2=½1 − av2γ2=c2�)or by setting B ≈ 0 and storing particles with momentump ≈mc=
ffiffiffia
p, i.e., purely electric confinement. A critical chal-
lenge is to minimize undesired radial magnetic fields due tomisalignments and fringe fields, which would result in thetransverse polarization due to the normal “g − 2” spin preces-sion and would mimic the EDM signal. Injection of simulta-neous counterpropagating beams into the storage ring wasproposed to control these effects (Anastassopoulos et al., 2016).Unlike the EDM signal, the effect of the radial field depends onthe beam propagation direction, thus providing a way todisentangle the two sources of transverse polarization. Otherfalse effects, for example, due to the nonorthogonality of theelectric and magnetic fields, would be canceled by summingover detectors separated by 180° in azimuth around the ring.Generic proposals have been made to search for EDMs
with unstable charged ions using the beta-decay asymmetryfor polarimetry similar to the muon g − 2 concept(Khriplovich, 1998, 2000a, 2000b) and with highly chargedions (Bondarevskaya et al., 2011). Current efforts to developstorage-ring EDM experiments for muons, protons, deuterons,and 3He nuclei are summarized in Table X.Farley et al. (2004) presented the first storage-ring proposal
for a dedicated EDM measurement, which focused on a muonEDM. Their proposal suggested technically feasible values forE and β ¼ v=c to make Ba equal to zero. The current muonEDM limit jdμj ≤ 1.8 × 10⁻¹⁹e cm is derived from ancillarymeasurements of the muon decay asymmetry taken during aprecision measurement of the muon anomalous magneticmoment (Bennett et al., 2009). The sensitivity of thismeasurement was limited by the fact that the apparatus wasdesigned to be maximally sensitive to ωa. For dedicated muonEDM experiments, under development at JPARC (Kanda,2014) and PSI (Adelmann et al., 2010), E and γ are chosen tomake ωa ¼ 0. The spin-coherence time τ in this case is limitedby the muon lifetime in the lab frame (γ × 2.2 μs). Analternative muon EDM approach using lower energy muons
Chupp et al.: Electric dipole moments of atoms, molecules, …
Rev. Mod. Phys., Vol. 91, No. 1, January–March 2019 015001-44

and a smaller and more compact storage ring is beingdeveloped at PSI. A proposal for injecting muons into sucha compact storage ring as well as an evaluation of thesystematic effects due specifically to the lower muon energywas presented by Adelmann et al. (2010).The two main differences between an experiment designed
for muons and one designed for light nuclei are the need formore careful control of the beam properties to preserve thespin coherence and, of course, a different spin polarimetryscheme. A spread in the beam position and momentum smearsthe cancellation of the g − 2 spin precession which would,after many cycles, result in decoherence of the beam. Since themuon spin-coherence time is limited by the finite muonlifetime, this is not as critical for the muon EDM experiment.For the case of a proton EDM search, choosing B ¼ 0 andβ ¼ 1=
ffiffiffiffiffiffiffiffiffiffiffiaþ 1
psuppresses the β × E term (Anastassopoulos
et al., 2016). This requires effective magnetic shielding, suchas that discussed in Sec. III.A. The electric storage ring withbending radius R ¼ ðm=eÞ=E ffiffiffiffiffiffiffiffiffiffiffiffiffiffiffiffiffiffi
aðaþ 1Þpis generally only
possible for particles with positive magnetic-moment anoma-lies (a > 0). With E ¼ 106 V=m, a bending radius of R ≈10 m is required for protons. Progress has been made indescribing the challenging problem of orbital and spindynamics inside electrostatic rings (Mane, 2008, 2012,2014a, 2014b, 2014c, 2015a, 2015b, 2015c; Hacömeroğluand Semertzidis, 2014; Metodiev et al., 2015), developingsimulation code for electrostatic rings (Talman and Talman,2015a, 2015b), and calculating the fringe fields for differentplate geometries (Metodiev et al., 2014). To achieve sensi-tivity of 10−29e cm, impractically small residual magneticfields would be required, thus two counterpropagating beamswithin the same storage ring are envisioned, for which avertical separation would develop in the presence of a radialmagnetic field. After several cycles around the ring, thisvertical separation would be large enough to measure usingSQUID magnetometers as precision beam position monitors.The development of an electric storage-ring experimentdedicated to measurement of the proton EDM is being pursuedby the Storage Ring EDM Collaboration srEDM (Rathmann,Saleev, and Nikolaev, 2013).
A magnetic storage ring could also be used to measure theJ ¼ 1 deuteron EDM using a similar technique. The deuteronpolarization would be analyzed by the asymmetry in elasticscattering from a carbon target (Brantjes et al., 2012). Thegoal for the deuteron EDM experiment is to maintain the spincoherence for at least as long as the vacuum-limited ionstorage time which is about 103 s for a vacuum of 10−10 Torr,which has been demonstrated at the cooler synchrotron(COSY) storage ring (Guidoboni et al., 2016). The theoryof spin evolution for a J ¼ 1 particle in electromagnetic fieldswas developed by Silenko (2015).The Julich Electric Dipole moment Investigations (JEDI)
Collaboration in Germany is undertaking precursor experi-ments while developing long term plans to measure the EDMsof the proton, deuteron, and 3He using an “all-in-one” electricand magnetic storage ring (Rathmann, Saleev, and Nikolaev,2013). An intermediate step is direct measurement of theproton and deuteron EDMs with lower statistical sensitivityusing the presently available magnetostatic COSY storagering with some modifications. The main challenge is tointroduce beam-line elements that prevent the spin precessiondue to the magnetic-moment anomaly from washing out thetorque on the spin generated by the presence of an EDM. Onesuggestion is to synchronize the EDM torque to the magnetic-moment anomaly spin precession (Orlov, Morse, andSemertzidis, 2006); however, the approach being developedfor COSY by the JEDI Collaboration is to partially “freeze” orlock the spin to the momentum using a beam element called a“magic” rf Wien filter (Morse, Orlov, and Semertzidis, 2013).If the parameters of the Wien filter are carefully chosen, onecomponent of the particle’s spin does not undergo the usualmagnetic-moment anomaly spin precession, which wouldallow the EDM torque to build up a transverse polarization.Spin polarimetry is critical both for measuring the EDM
signal as well as for diagnosing and improving the spin-coherence time. Significant progress has been made towardcontrolling systematics related to spin polarimetry for deuter-ons. Results indicate that precision polarimetry for bothdeuterons and protons is feasible at the ppm level, which isrequired for a 10−29e cm EDM sensitivity. Preliminary efforts
TABLE X. Relevant parameters for proposed storage-ring EDM searches. The present muon EDM limit is 1.8 × 10⁻¹⁹e cm and the indirectlimit on the proton EDM derived from the atomic-EDM limit of 199Hg is 2 × 10⁻²⁵e cm. The magnetic-moment anomaly is calculated usingvalues for the unshielded magnetic moments of the particles from CODATA 2014 (Mohr, Newell, and Taylor, 2016). The sign convention forpositively charged particles is such that the magnetic field is vertical and the particles are circulating clockwise. References are E989: muong − 2 experiment at Fermilab (Gorringe and Hertzog, 2015); E34: muon g − 2 experiment at JPARC (Gorringe and Hertzog, 2015); srEDM:muon EDM at JPARC (Kanda, 2014); “all-electric” proton EDM at Brookhaven (Anastassopoulos et al., 2016); deuteron EDM at JPARC(Morse, 2011); PSI: compact muon EDM (Adelmann et al., 2010); JEDI: “all-in-one” proton, deuteron, and helion EDM at COSY (Rathmann,Saleev, and Nikolaev, 2013).
Particle J a jpj (GeV=c) γ jBj (T) jEj ðkV=cmÞ jE0j=γ ðkV=cmÞ R (m) σgoald (e cm) Ref.
μ� 1=2 þ0.001 17 3.094 29.3 1.45 0.0 4300 7.11 10−21 E9890.3 3.0 3.0 0.0 8500 0.333 10−21 E340.5 5.0 0.25 22.0 760 7.0 10−24 srEDM0.125 1.57 1.0 6.7 2300 0.42 10−24 PSI
pþ 1=2 þ1.792 85 0.7007 1.248 0.0 80.0 80 52.3 10−29 srEDM0.7007 1.248 0.0 140.0 140 30.0 10−29 JEDI
dþ 1 −0.142 99 1.0 1.13 0.5 120.0 580 8.4 10−29 srEDM1.000 1.13 0.135 33.0 160 30.0 10−29 JEDI
3Heþþ 1=2 −4.184 15 1.211 1.09 0.042 140.0 89 30.0 10−29 JEDI
Chupp et al.: Electric dipole moments of atoms, molecules, …
Rev. Mod. Phys., Vol. 91, No. 1, January–March 2019 015001-45

to measure and improve spin-coherence times of deuteronsusing the COSY storage ring have also been reported (Benatiet al., 2012, 2013; Bagdasarian et al., 2014). High precision(10−10) control and monitoring of the spin motion of deuter-ons at COSY has also been demonstrated (Eversmann et al.,2015). Plans are also underway to develop an ion source andpolarimetry for 3He by the JEDI Collaboration. Althoughsignificant effort is still required to perform storage-ring EDMexperiments, they would provide the most direct and cleanmeasurements of the EDM of light ions and muons and wouldimprove the limits on their EDMs by several orders ofmagnitude.
V. INTERPRETATIONS OF CURRENT AND PROSPECTIVEEXPERIMENTS
In general there are many possible contributions to theEDM of any system accessible to experiment, for example, theneutron EDM may arise due to a number of sources includingshort-range, e.g., quark EDMs, and long-range pion-nucleon
couplings characterized by gð0Þπ and gð1Þπ . One approach toputting EDM results in context has been to use the upper limitfrom an experiment to set limits on individual phenomeno-logical parameters by making use of theoretical calculationsthat establish the dependence on the individual parameters.This is the conventional approach, and is based on thereasoning that if the measured EDM is small then either allthe contributions to the EDM (all the αiCi) are small as well orlarge contributions must effectively cancel, that is haveopposite signs and similar magnitudes. While such a cancella-tion would be fortuitous, it may be “required” in the sense thatany underlying source of CP violation generally contributesCP violation in more than one way. Take, for example, a left-
right symmetric model, which contributes to both gð1Þπ and theshort-range part of the neutron EDM dsrn as given in Eqs. (48),(49), and (51). A cancellation would require a value of sin ξ lessthan 2 × 10⁻⁶. Thus in this model, either the phase α is verysmall or the mixing angle is very small, or both.
A. Sole source
Sole-source limits on the low-energy parameters are pre-sented in Table XI along with the system that sets the limits.The most conservative upper limit is derived using thesmallest jαijj from the ranges presented in Tables III andIV. The sole-source short-range neutron contribution assumes
gð0Þπ ¼ gð1Þπ ¼ 0. For the short-range proton contribution, themodel of Coveney and Sandars (1983) is used for TlF andfrom Dmitriev and Sen’kov (2003) for 199Hg. The combina-tion of light quark EDMs dd − ð1=3Þdu is derived from thelimit on dn. The parameter θ and the combination of CEDMs
dd − du are derived from the sole-source limits on gð0Þπ and
gð1Þπ , respectively.
B. Global analysis
A global analysis of EDM results was introduced by Chuppand Ramsey-Musolf (2015) and is updated here. In thisapproach simultaneous limits are set on six low-energy
parameters: de, CS, CT , gð0Þπ , gð1Þπ , and the short-rangecomponent of the neutron EDM dsrn . New results fromHfFþ, 199Hg, and 225Ra along with clarifications of the isospindependence of CT are included in the analysis presented next.
1. Paramagnetic systems: Limits on de and CS
Results are listed in Table I for paramagnetic systems Cs,Tl, YbF, ThO, and HfFþ. Following Dzuba, Flambaum, andHarabati (2011, 2012) we take the electron-EDM resultreported by each author to be the combination
dexpj ¼ de þ�αCS
αde
�jCS: ð126Þ
The αCS=αde are listed in Table III. As pointed out by Dzuba,
Flambaum, and Harabati (2011, 2012), although there is asignificant range of αde and αCS
from different authors forseveral cases, there is much less dispersion in the ratio αCS
=αde .In Fig. 31, we plot de vs CS for the d
exppara for ThO and HfFþ
along with 68% and 95% confidence-level contours for χ2 onthe de-CS space, where
χ2 ¼Xi
½dexpi − de − ðαCS=αdeÞiCS�2
σ2i: ð127Þ
Here i sums over Cs, Tl, YbF, ThO, and HfFþ, but only ThOand HfFþ have significant impact. The range of ðαCS
=αdeÞjexpressed in Table III, about 10%, is accommodated byadding in quadrature to the total experimental uncertaintyfor each system. The resulting constraints from all para-magnetic systems on de and CS at 68% C.L. are
de ¼ð0.8�4.2Þ×10−28ecm; CS ¼ð−0.9�3.7Þ×10−8:
ð128Þ
TABLE XI. Sole-source limits (95% C.L.) on the absolute value ofthe low-energy (LE) parameters presented in Sec. II.C for severalexperimental systems assuming a single contribution to the EDM or,for molecules, the P-odd and T-odd observables. The lower part ofthe table presents limits on other parameters derived from the bestlimits on the low-energy parameters.
LE parameter System 95% u.l.
de ThO 9.2 × 10⁻²⁹e cmCS ThO 8.6 × 10⁻⁹
CT199Hg 3.6 × 10⁻¹⁰
gð0Þπ199Hg 3.8 × 10⁻¹²
gð1Þπ199Hg 3.8 × 10⁻¹³
gð2Þπ199Hg 2.6 × 10⁻¹¹
dsrn Neutron 3.3 × 10⁻²⁶e cmdsrp TlF 8.7 × 10⁻²³e cmdsrp 199Hg 2.0 × 10⁻²⁵e cm
Other parametersdd ≈3=4dn 2.5 × 10⁻²⁶e cmθ ≈gð0Þπ =ð0.015Þ 2.5 × 10⁻¹⁰
dd − du 5 × 10⁻¹⁵gð1Þπ e cm 2 × 10⁻²⁷e cm
Chupp et al.: Electric dipole moments of atoms, molecules, …
Rev. Mod. Phys., Vol. 91, No. 1, January–March 2019 015001-46

The upper limits at 95% C.L. are
jdej< 8.4×10⁻²⁸ecm; jCSj< 7.5×10⁻⁸ ð95% C:L:Þ:ð129Þ
Corresponding 95% C.L. constraints on δeðv=ΛÞ2 and
ImCð−Þeq ðv=ΛÞ2, obtained from those for de and CS by dividing
by −3.2 × 10⁻²²e cm and −12.7, respectively, are
jδeðv=ΛÞ2j < 2.6 × 10⁻⁶; ImCð−Þeq ðv=ΛÞ2 < 5.9 × 10⁻⁹:
ð130Þ
The 199Hg result is not included in the constraints of Eq. (128),but has been used to constrain de and CS, for example, byChupp and Ramsey-Musolf (2015), Fleig and Jung (2018),and Jung (2013). Particularly notable is that the limits on thescalar quark-pseudoscalar electron interaction may place a
lower bound on the mass scale Λ of roughly 103 TeV or more.This has been applied in the context of leptoquark models byFuyuto, Ramsey-Musolf, and Shen (2018).
2. Hadronic parameters and CT
Since the introduction of our global analysis, there havebeen advances in hadronic and atomic theory along with threesignificant experimental developments in the diamagnetic andhadronic systems:
(i) The 4 times more sensitive result for 199Hg (Graneret al., 2017).
(ii) Reanalysis of the neutron EDM which increased theuncertainty and moved the centroid by about 1=4 σ(Pendlebury et al., 2015).
(iii) Results from the octupole deformed 225Ra (Bishofet al., 2016).
There are experimental results in five systems and four
parameters dsrn , CT , gð0Þπ , and gð1Þπ , which are fully constrained
once de and CS are fixed from the paramagnetic-systemresults. In order to provide estimates of the allowed ranges ofthe four parameters, χ2 is defined as
χ2ðCjÞ ¼Xi
ðdexpi − diÞ2σ2dexpi
; ð131Þ
where di have the form given in Eq. (9). The four parametersCj are varied to determine χ2 contours for a specific set of αij.For 68% C.L. and four parameters, χ2 − χ2min < 4.7. The αijare varied over the ranges presented in Table IV to reflect thehadronic-theory uncertainties. Estimates of the constraints arepresented as ranges in Table XII, which has been updated fromChupp and Ramsey-Musolf (2015). The significant improve-ment in limits on CT is largely due to the change in sensitivityestimates (αiC0
T) due to the recent calculations of the tensor
form factors [see Eq. (65)] (Bhattacharya, Cirigliano, Cohen
et al., 2015; Bhattacharya et al., 2016). Limits on gð0Þπ also
improve by about 50% while limits on gð1Þπ and dsrn are about50% less stringent.
Since gð0Þπ and gð1Þπ also contribute to the neutron EDM, theshort-range neutron contribution dsrn is notably much lessconstrained than the experimental limit on the neutron EDM
4 x10⁻⁶
2
0
-2
-4
-e (v
2/2)
-6 x10⁻⁹
-4 -2 0 2 4 6
-ImCeq(-)
(v2/
2)
-1.5 x10⁻²⁷
-1.0
-0.5
0.0
0.5
1.0
d e (
e-cm
)
-5 x10⁻⁸ 0 5
CS
ThO
HfF+
FIG. 31. Electron EDM de as a function of CS from theexperimental results in ThO and HfFþ with 1σ experimentalerror bars. Also shown are 68% and 95% χ2 contours for allparamagnetic systems including Cs, Tl, and YbF. The top andright axes show the corresponding dimensionless Wilson coef-ficients δe and ImCð−Þ
eq normalized to the squared scale ratioðv=ΛÞ2.
TABLE XII. Revised values and ranges for coefficients for diamagnetic systems and the neutron. The first three rows give the 68% C.L. rangeallowed by experiment combined with the best values of the coefficients αij covering the reasonable range of αHg;gð1Þπ
with αRa;dsrn ¼ −8 × 10⁻⁴;the fourth row gives ranges of coefficients for the entire reasonable ranges of the coefficients αij given in Table IV, and the bottom row presentsthe 95% C.L. upper limits on the coefficients for the full reasonable ranges of the coefficients.
dsrn (e cm) gð0Þπ gð1Þπ Cð0ÞT
Range from best valueswith αg1π ðHgÞ ¼ þ1.6 × 10⁻¹⁷
ð−4.8–9.8Þ × 10−23 ð−6.6–3.2Þ × 10−9 ð−1.0–0.5Þ × 10−9 ð−3.5–1.6Þ × 10−7
Range from best valueswith αg1π ðHgÞ ¼ 0
ð−4.3–3.4Þ × 10−23 ð−2.3–2.9Þ × 10−9 ð−0.6–1.3Þ × 10−9 ð−3.2–4.0Þ × 10−7
Range from best valueswith αg1π ðHgÞ ¼ −4.9 × 10⁻¹⁷
ð−9.3–2.6Þ × 10−23 ð−1.8–6.3Þ × 10−9 ð−1.2–0.4Þ × 10−9 ð−11–3.8Þ × 10−7
Range from full variation of αij ð−12–12Þ × 10−23 ð−7.9–7.8Þ × 10−9 ð−1.3–1.1Þ × 10−9 ð−6.6–4.6Þ × 10−7
Upper limits (95% C.L.) 2.4 × 10⁻²² 1.5 × 10⁻⁸ 2.4 × 10⁻⁹ 1.1 × 10⁻⁶
Chupp et al.: Electric dipole moments of atoms, molecules, …
Rev. Mod. Phys., Vol. 91, No. 1, January–March 2019 015001-47
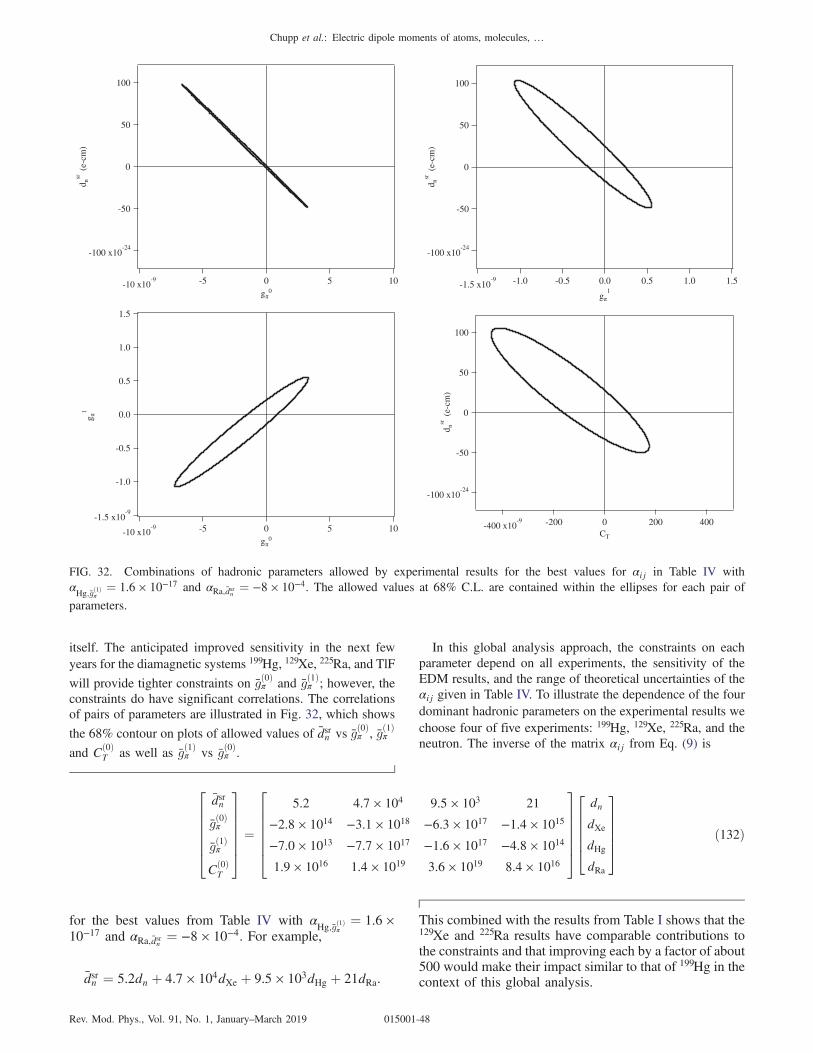
itself. The anticipated improved sensitivity in the next fewyears for the diamagnetic systems 199Hg, 129Xe, 225Ra, and TlF
will provide tighter constraints on gð0Þπ and gð1Þπ ; however, theconstraints do have significant correlations. The correlationsof pairs of parameters are illustrated in Fig. 32, which shows
the 68% contour on plots of allowed values of dsrn vs gð0Þπ , gð1Þπ
and Cð0ÞT as well as gð1Þπ vs gð0Þπ .
In this global analysis approach, the constraints on eachparameter depend on all experiments, the sensitivity of theEDM results, and the range of theoretical uncertainties of theαij given in Table IV. To illustrate the dependence of the fourdominant hadronic parameters on the experimental results wechoose four of five experiments: 199Hg, 129Xe, 225Ra, and theneutron. The inverse of the matrix αij from Eq. (9) is
2666664
dsrn
gð0Þπ
gð1Þπ
Cð0ÞT
3777775 ¼
2666664
5.2 4.7 × 10⁴ 9.5 × 10³ 21
−2.8 × 10¹⁴ −3.1 × 10¹⁸ −6.3 × 10¹⁷ −1.4 × 10¹⁵
−7.0 × 10¹³ −7.7 × 10¹⁷ −1.6 × 10¹⁷ −4.8 × 10¹⁴
1.9 × 10¹⁶ 1.4 × 10¹⁹ 3.6 × 10¹⁹ 8.4 × 10¹⁶
3777775
266664
dndXedHgdRa
377775 ð132Þ
for the best values from Table IV with αHg;gð1Þπ
¼ 1.6 ×10⁻¹⁷ and αRa;dsrn ¼ −8 × 10⁻⁴. For example,
dsrn ¼ 5.2dn þ 4.7 × 10⁴dXe þ 9.5 × 10³dHg þ 21dRa.
This combined with the results from Table I shows that the129Xe and 225Ra results have comparable contributions tothe constraints and that improving each by a factor of about500 would make their impact similar to that of 199Hg in thecontext of this global analysis.
-100 x10-24
-50
0
50
100d n
sr (
e-cm
)
-10 x10-9 -5 0 5 10
g 0
g 0
-100 x10-24
-50
0
50
100
d nsr
(e-
cm)
-1.5 x10⁻⁹ -1.0 -0.5 0.0 0.5 1.0 1.5
g1
-1.5 x10⁻⁹
-1.0
-0.5
0.0
0.5
1.0
1.5
g1
-10 x10-9 -5 0 5 10
-100 x10-24
-50
0
50
100
d nsr
(e-
cm)
-400 x10-9 -200 0 200 400
CT
FIG. 32. Combinations of hadronic parameters allowed by experimental results for the best values for αij in Table IV withαHg;gð1Þπ
¼ 1.6 × 10⁻¹⁷ and αRa;dsrn ¼ −8 × 10⁻⁴. The allowed values at 68% C.L. are contained within the ellipses for each pair of
parameters.
Chupp et al.: Electric dipole moments of atoms, molecules, …
Rev. Mod. Phys., Vol. 91, No. 1, January–March 2019 015001-48

VI. SUMMARY AND CONCLUSIONS
We live in exciting times for EDMs. The observation andexplanations of the baryon asymmetry call for BSM sources ofCP violation that produce EDMs that may be discovered inthe next generation of experiments in a variety of systems.Experiment has marched forward with greater sensitivityrecently achieved for the neutron and 199Hg, a tremendousadvance in complexity and sensitivity for ThO, and HfFþ
polar-molecule experiments sensitive to the electron EDM,and with new techniques providing results from the octupoledeformed 225Ra. The next generation of experiments on theneutron will take advantage of new ideas and techniquesincorporated into UCN sources and EDM techniques at anumber of laboratories around the world. And new approachesto magnetic shielding and magnetometry and comagnetom-etry along with a deeper understanding of systematic effectswill be essential to achieving the next step in sensitivity in allsystems. Storage rings and rare isotopes are expected to benew approaches that move forward in the coming years.Interpretations of EDM limits and eventually finite results
continue to advance with more quantitative connections tobaryogenesis and clarification of effective-field theoryapproaches that connect fundamental quantum field theoryto low-energy parameters relevant to the structure of nucleons,nuclei, atoms, and molecules. The theory of EDMs bringstogether theoretical approaches at each of these scales; how-ever, the nucleus is a particularly difficult system for calcu-lations and introduces the largest uncertainties in connectingexperiment to theory. The best experimental result, in 199Hg, ischallenged by significant nuclear theory uncertainties.With theincreasing interest in EDMs due to their role in connectingcosmology, particle physics, and nuclear, atomic, and molecu-lar physics, the motivations for tackling these problems inhadronic theory become stronger.Even in light of current uncertainties, interpretation of EDM
results from the sole-source perspective or in the context of aglobal analysis show that CP-violating parameters are sur-prisingly small. In the case of the QCD parameter θ this leadsto the strong-CP problem and its potential solution via theaxion hypothesis, which may also provide an explanation ofnonbaryonic dark matter. In a generic approach to CPviolation consistent with current limits, combined with anassumption that the phases are of order unity, the mass scaleprobed is tens of TeV or greater, emphasizing the comple-mentarity of EDMs and the LHC as well as future higher-energy colliders. In the context of models that introduce newphases, such as SUSY variants and left-right symmetricmodels, either the phases appear to be far less than naturallyexpected or the mass scale of CP violation is quite large,which introduces challenges with the connection to electro-weak baryogenesis.The definitive observation of an EDM in any system will be
a tremendous achievement, but a single system alone may notclarify the questions arising in the connections to fundamentaltheory and to cosmology, for example, separating weak andstrong CP violation. We therefore conclude by calling forefforts in several systems—paramagnetic systems mostsensitive to the electron EDM and electron-spin-dependent
CP-violating interactions as well as diamagnetic atoms,molecules, nucleons, and nuclear systems where hadronicCP violation is dominant. We also call for advanced theoryefforts, in particular, nuclear theory, which must improve tosharpen interpretation of EDM results in all systems.
ACKNOWLEDGMENTS
We thank everyone in the community who has providedinput and advice as well as encouragement. In particular, weare grateful to Martin Burghoff, Will Cairncross, VincenzoCirigliano, Skyler Degenkolb, Matthew Dietrich, PeterGeltenbort, Takeyasu Ito, Martin Jung, Kent Leung, Zheng-Tian Lu, Kia Boon Ng, Natasha Sachdeva, Z Sun, Yan Zhou,and Oliver Zimmer. We also acknowledge the ExcellenceCluster Universe, MIAPP, the Munich Institute for AstronomyandAstrophysics andMITP, theMainz Institute for TheoreticalPhysics for hosting and providing the opportunity to collabo-rate. T. E. C. was supported by the U.S. Department of EnergyGrant No. DE-FG0204ER41331. P. F. was supported by theDeutsche Forschungsgemeinschaft (DFG) Priority ProgramSPPPrecision ExperimentswithCold andUltra-ColdNeutronsand the DFG cluster of excellence “Origin and Structure of theUniverse.” M. J. R-M. was supported by the U.S. Departmentof Energy Grant No. DE-SC0011095. And J. T. S. was sup-ported by Michigan State University.
REFERENCES
Aad, G., et al. (ATLAS, CMS Collaborations), 2015, Phys. Rev. Lett.114, 191803.
Abramczyk, M., S. Aoki, T. Blum, T. Izubuchi, H. Ohki, and S.Syritsyn, 2017, Phys. Rev. D 96, 014501.
Adelmann, A., K. Kirch, C. J. G. Onderwater, and T. Schietinger,2010, J. Phys. G 37, 085001.
Afach, S., et al., 2014, J. Appl. Phys. 116, 084510.Afach, S., et al., 2015, Opt. Express 23, 22108.Ahmad, I., R. R. Chasman, J. P. Greene, F. G. Kondev, and S. Zhu,2015, Phys. Rev. C 92, 024313.
Ahmad, I., J. E. Gindler, R. R. Betts, R. R. Chasman, and A. M.Friedman, 1982, Phys. Rev. Lett. 49, 1758.
Alden, E., S. Degenkolb, T. Chupp, and A. Leanhardt, 2011, ReportNo. BAPS-DAMOP 2011.
Aleksandrov, E.,M.Balabas, A.Vershovskii, A. Ivanov,N.Yakobson,V. Velichanskii, and N. Senkov, 1995, Opt. Spectrosc. 78, 292[http://adsabs.harvard.edu/abs/1995OptSp..78..292A].
Alexandrov, E. B., M. V. Balabas, D. Budker, D. English, D. F.Kimball, C.-H. Li, and V. V. Yashchuk, 2002, Phys. Rev. A 66,042903.
Alexandrov, E. B., M. V. Balabas, D. Budker, D. English, D. F.Kimball, C.-H. Li, and V. V. Yashchuk, 2004, Phys. Rev. A 70,049902.
Allmendinger, F., W. Heil, S. Karpuk, W. Kilian, A. Scharth, U.Schmidt, A. Schnabel, Y. Sobolev, and K. Tullney, 2014, Phys. Rev.Lett. 112, 110801.
Altarev, I., et al., 1996, Yad. Fiz. 59N7, 1204 [Phys. At. Nucl. 59,1152 (1996)] [http://inspirehep.net/record/432002?ln=en].
Altarev, I., et al., 2012, Nuovo Cimento Soc. Ital. Fis. C 035N04,122.
Altarev, I., et al., 2014, Rev. Sci. Instrum. 85, 075106.Altarev, I., et al., 2015, J. Appl. Phys. 117, 233903.
Chupp et al.: Electric dipole moments of atoms, molecules, …
Rev. Mod. Phys., Vol. 91, No. 1, January–March 2019 015001-49
Altarev, I. S., et al., 1980, Nucl. Phys. A 341, 269.Altarev, I. S., et al., 1981, Phys. Lett. B 102, 13.Altarev, I. S., et al., 1992, Phys. Lett. B 276, 242.Altmannshofer, W., A. J. Buras, and P. Paradisi, 2008, Phys. Lett. B669, 239.
Altmannshofer, W., R. Harnik, and J. Zupan, 2013, J. High EnergyPhys. 11, 202.
Amini, J. M., C. T. Munger, and H. Gould, 2007, Phys. Rev. A 75,063416.
Anastassopoulos, V., et al., 2016, Rev. Sci. Instrum. 87, 115116.Andalib, T., J. Martin, C. Bidinosti, R. Mammei, B. Jamieson, M.Lang, and T. Kikawa, 2017, Nucl. Instrum. Methods Phys. Res.,Sect. A 867, 139.
Anghel, A., et al., 2009, Nucl. Instrum. Methods Phys. Res., Sect. A611, 272.
Archambault, J. P., A. Czarnecki, and M. Pospelov, 2004, Phys. Rev.D 70, 073006.
Arkani-Hamed, N., A. Gupta, D. E. Kaplan, N. Weiner, and T.Zorawski, 2012, arXiv:1212.6971.
Arvanitaki, A., N. Craig, S. Dimopoulos, and G. Villadoro, 2013, J.High Energy Phys. 02, 126.
Assamagan, K., et al., 2016, arXiv:1604.05324.Atchison, F., et al., 2005a, Phys. Rev. Lett. 95, 182502.Atchison, F., et al., 2005b, Phys. Rev. C 71, 054601.Atchison, F., et al., 2007, Phys. Rev. C 76, 044001.Atchison, F., et al., 2009, Nucl. Instrum. Methods Phys. Res., Sect. A611, 252.
Atchison, F., et al., 2011, Europhys. Lett. 95, 12001.Auerbach, N., V. V. Flambaum, and V. Spevak, 1996, Phys. Rev. Lett.76, 4316.
Avakov, G., and K. Ter-Martirosyan, 1959, Nucl. Phys. 13, 685.Babu, K. S., S. M. Barr, and I. Dorsner, 2001, Phys. Rev. D 64,053009.
Bagdasarian, Z., et al., 2014, Phys. Rev. STAccel. Beams 17, 052803.Baird, J. K., P. D. Miller, W. B. Dress, and N. F. Ramsey, 1969, Phys.Rev. 179, 1285.
Baker, C., et al., 2003, Phys. Lett. A 308, 67.Baker, C. A., et al., 2006, Phys. Rev. Lett. 97, 131801.Balabas, M. V., T. Karaulanov, M. P. Ledbetter, and D. Budker, 2010,Phys. Rev. Lett. 105, 070801.
Bales, M. J., P. Fierlinger, and R. Golub, 2016, Europhys. Lett. 116,43002.
Ban, S., J. Dobaczewski, J. Engel, and A. Shukla, 2010, Phys. Rev. C82, 015501.
Barabanov, A. L., R. Golub, and S. K. Lamoreaux, 2006, Phys. Rev.A 74, 052115.
Barger, V., J. L. Hewett, and R. J. N. Phillips, 1990, Phys. Rev. D 41,3421.
Bargmann, V., L. Michel, and V. L. Telegdi, 1959, Phys. Rev. Lett. 2,435.
Baron, J., et al., 2014, Science 343, 269.Baron, J.,et al., 2017, New J. Phys. 19, 073029.Barr, S. M., and W. J. Marciano, 1989, in CP Violation, edited by C.Jarlskog (World Scientific, Singapore), pp. 455–499.
Barr, S. M., and A. Zee, 1990a, Phys. Rev. Lett. 65, 21.Barr, S. M., and A. Zee, 1990b, Phys. Rev. Lett. 65, 2920.Bear, D., T. E. Chupp, K. Cooper, S. DeDeo, M. Rosenberry, R. E.Stoner, and R. L. Walsworth, 1998, Phys. Rev. A 57, 5006.
Becker, H., et al., 2015, Nucl. Instrum. Methods Phys. Res., Sect. A777, 20.
Bell, W. E., and A. L. Bloom, 1961, Phys. Rev. Lett. 6, 280.Benati, P., et al., 2012, Phys. Rev. ST Accel. Beams 15, 124202.Benati, P., et al., 2013, Phys. Rev. ST Accel. Beams 16, 049901.
Bennett, G. W., et al. (Muon g-2 Collaboration), 2006, Phys. Rev. D73, 072003.
Bennett, G. W., et al. (Muon (g-2) Collaboration), 2009, Phys. Rev. D80, 052008.
Bergmann, K., H. Theuer, and B.W. Shore, 1998, Rev. Mod. Phys.70, 1003.
Berley, D., R. L. Garwin, G. Gidal, and L. M. Lederman, 1958a,Phys. Rev. Lett. 1, 144.
Berley, D., R. L. Garwin, G. Gidal, and L. M. Lederman, 1958b,Phys. Rev. Lett. 1, 263.
Berley, D., and G. Gidal, 1960, Phys. Rev. 118, 1086.Bernreuther, W., and M. Suzuki, 1991, Rev. Mod. Phys. 63, 313.Bernreuther, W., and M. Suzuki, 1992, Rev. Mod. Phys. 64, 633.Bhattacharya, T., V. Cirigliano, S. D. Cohen, R. Gupta, A. Joseph,H.-W. Lin, and B. Yoon (Precision Neutron Decay Matrix Elements(PNDME) Collaboration), 2015, Phys. Rev. D 92, 094511.
Bhattacharya, T., V. Cirigliano, S. D. Cohen, R. Gupta, H.-W. Lin,and B. Yoon (Precision Neutron Decay Matrix Elements (PNDME)Collaboration), 2016, Phys. Rev. D 94, 054508.
Bhattacharya, T., V. Cirigliano, R. Gupta, H.-W. Lin, and B. Yoon(PNDME Collaboration), 2015, Phys. Rev. Lett. 115, 212002.
Bian, L., T. Liu, and J. Shu, 2015, Phys. Rev. Lett. 115, 021801.Bishof, M., et al., 2016, Phys. Rev. C 94, 025501.Bloch, F., and A. Siegert, 1940, Phys. Rev. 57, 522.Bloom, A. L., 1962, Appl. Opt. 1, 61.Bondarevskaya, A., A. Prozorov, L. Labzowsky, G. Plunien, D.Liesen, and F. Bosch, 2011, Phys. Rep. 507, 1.
Borisov, Y.,W.Heil,M. Leduc, V. Lobashev, E. Otten, andY. Sobolev,2000, Nucl. Instrum. Methods Phys. Res., Sect. A 440, 483.
Bork, J., H. D. Hahlbohm, R. Klein, and A. Schnabel, 2000,BIOMAG 2000, edited by Jukka Nenonen, R. J. Ilmoniemi, andT. Katila (Helsinki University of Technology, Espoo, Finland),pp. 970–973.
Bouchard, C., C. C. Chang, T. Kurth, K. Orginos, and A. Walker-Loud, 2017, Phys. Rev. D 96, 014504.
Brantjes, N., et al., 2012, Nucl. Instrum. Methods Phys. Res., Sect. A664, 49.
Brenner, T., et al., 2015, Appl. Phys. Lett. 107, 121604.Bsaisou, J., J. de Vries, C. Hanhart, S. Liebig, U.-G. Meißner, D.Minossi, A. Nogga, and A. Wirzba, 2015, J. High Energy Phys. 03,104.
Budker, D., and M. Romalis, 2007, Nat. Phys. 3, 227.Buhmann, S. Y., V. A. Dzuba, and O. P. Sushkov, 2002, Phys. Rev. A66, 042109.
Burghoff, M., 2015, 2nd Status Meeting of the DFG Priority Program1491, Wildbad Kreuth.
Burleson, G. R., and H. Kendall, 1960, Nucl. Phys. 19, 68.Butler, P., and W. Nazarewicz, 1991, Nucl. Phys. A 533, 249.Cabrera, B., M. Taber, and S. B. Felch, 1989, in Near Zero: NewFrontiers of Physics, edited by J. D. Fairbank et al. (W. H. Freeman& Co., New York), p. 312.
Cairncross, W. B., D. N. Gresh, M. Grau, K. C. Cossel, T. S. Roussy,Y. Ni, Y. Zhou, J. Ye, and E. A. Cornell, 2017, Phys. Rev. Lett. 119,153001.
Callan, C., R. Dashen, and D. Gross, 1976, Phys. Lett. B 63, 334.Callan, C. G., and S. B. Treiman, 1967, Phys. Rev. 162, 1494.Carrico, J. P., E. Lipworth, P. G. H. Sandars, T. S. Stein, and M. C.Weisskopf, 1968, Phys. Rev. 174, 125.
Chao, W., and M. J. Ramsey-Musolf, 2014, J. High Energy Phys. 10,180.
Charles, J., et al. (CKMfitter Group), 2015, Phys. Rev. D 91, 073007.Charpak, G., F. J. M. Parley, R. L. Garwin, T. Muller, J. C. Sens, andA. Zichighi, 1961, Nuovo Cimento 22, 1043.
Chupp et al.: Electric dipole moments of atoms, molecules, …
Rev. Mod. Phys., Vol. 91, No. 1, January–March 2019 015001-50

Chasman, R., 1980, Phys. Lett. B 96, 7.Chibane, Y., S. K. Lamoreaux, J. M. Pendlebury, and K. F. Smith,1995, Meas. Sci. Technol. 6, 1671.
Chien, Y. T., V. Cirigliano, W. Dekens, J. de Vries, and E. Mereghetti,2016, J. High Energy Phys. 02, 11.
Cho, D., K. Sangster, and E. A. Hinds, 1991, Phys. Rev. A 44, 2783.Chupp, T., 2010, in Advances in Atomic, Molecular, and OpticalPhysics, Vol. 59, edited by E. Arimondo, P. Berman, and C. Lin(Academic Press, New York), pp. 129–174.
Chupp, T., and M. Ramsey-Musolf, 2015, Phys. Rev. C 91, 035502.Chupp, T. E., and R. J. Hoare, 1990, Phys. Rev. Lett. 64, 2261.Chupp, T. E., R. J. Hoare, R. L. Walsworth, and B. Wu, 1994, Phys.Rev. Lett. 72, 2363.
Chupp, T. E., E. R. Oteiza, J. M. Richardson, and T. R. White, 1988,Phys. Rev. A 38, 3998.
Cirigliano, V., W. Dekens, J. de Vries, and E. Mereghetti, 2016a,Phys. Rev. D 94, 034031.
Cirigliano, V., W. Dekens, J. de Vries, and E. Mereghetti, 2016b,Phys. Rev. D 94, 016002.
Cirigliano, V., Y. Li, S. Profumo, and M. J. Ramsey-Musolf, 2010, J.High Energy Phys. 01, 2.
Cirigliano, V., S. Profumo, and M. J. Ramsey-Musolf, 2006, J. HighEnergy Phys. 07, 002.
Cocks, J., et al., 1999, Nucl. Phys. A 645, 61.Cohen, D., U. Schlaepfer, S. Ahlfors, M. Haemaelaeinen, and E.Halgren, 2002, BIOMAG 2002, edited by Hannes Nowak,Jens Haueisen, Frank Geissler, and Ralph Huonker (VDE Verlag,Berlin), p. 919.
Cohen, V.W., R. Nathans, H. B. Silsbee, E. Lipworth, and N. F.Ramsey, 1969, Phys. Rev. 177, 1942.
Cohen-Tannoudji, C., 1962, Ann. Phys. (Paris) 13, 423.Cohen-Tannoudji, C., and S.Haroche, 1969, J. Phys. (France) 30, 153.Commins, E. D., 1991, Am. J. Phys. 59, 1077.Commins, E. D., 1993, Phys. Scr. T46, 92.Commins, E. D., 1999, Adv. At. Mol. Opt. Phys. 40, 1.Commins, E. D., 2007, J. Phys. Soc. Jpn. 76, 111010.Commins, E. D., J. D. Jackson, and D. P. DeMille, 2007, Am. J. Phys.75, 532.
Commins, E. D., S. B. Ross, D. DeMille, and B. C. Regan, 1994,Phys. Rev. A 50, 2960.
Contino, R., et al., 2016, arXiv:1606.09408.Coveney, P. V., and P. G. H. Sandars, 1983, J. Phys. B 16, 3727.Crawford, C., 2015, private communication.Crewther, R., P. D. Vecchia, G. Veneziano, and E. Witten, 1979,Phys. Lett. B 88, 123; 91, 487(E) (1980).
Curtin, D., P. Jaiswal, and P. Meade, 2012, J. High Energy Phys. 08, 5.Czarnecki, A., and B. Krause, 1997, Phys. Rev. Lett. 78, 4339.Dahlinger, M., E. Kankeleit, D. Habs, D. Schwalm, B. Schwartz, R.Simon, J. Burrows, and P. Butler, 1988, Nucl. Phys. A 484, 337.
Dang, H. B., A. C. Maloof, and M. V. Romalis, 2010, Appl. Phys.Lett. 97, 151110.
Degenkolb, S. M., 2016, Optical Magnetometry Using MultiphotonTransitions, Ph.D. thesis (University of Michigan).
Demir, D., O. Lebedev, K. A. Olive, M. Pospelov, and A. Ritz, 2004,Nucl. Phys. B 680, 339.
de Vries, J., R. Higa, C.-P. Liu, E. Mereghetti, I. Stetcu, R. G. E.Timmermans, and U. van Kolck, 2011, Phys. Rev. C 84, 065501.
de Vries, J., E. Mereghetti, and A. Walker-Loud, 2015, Phys. Rev. C92, 045201.
Dimopoulos, S., and D. Sutter, 1995, Nucl. Phys. B 452, 496.Dine, M., and A. Kusenko, 2003, Rev. Mod. Phys. 76, 1.Dirac, P. A. M., 1928, Proc. R. Soc. A 117, 610.Dmitriev, V. F., and R. A. Sen’kov, 2003, Phys. At. Nucl. 66, 1940.
Dobaczewski, J., and J. Engel, 2005, Phys. Rev. Lett. 94, 232502.Dobaczewski, J., J. Engel, M. Kortelainen, and P. Becker, 2018,Phys. Rev. Lett. 121, 232501.
Donoghue, J. F., B. R. Holstein, and M. Musolf, 1987, Phys. Lett. B196, 196.
Dress, W. B., P. D. Miller, J. M. Pendlebury, P. Perrin, and N. F.Ramsey, 1977, Phys. Rev. D 15, 9.
Dubbers, D., and M. G. Schmidt, 2011, Rev. Mod. Phys. 83, 1111.Dzuba, V., V. Flambaum, and P. Silvestrov, 1985, Phys. Lett. B 154, 93.Dzuba, V. A., V. V. Flambaum, and J. S. M. Ginges, 2007, Phys. Rev.A 76, 034501.
Dzuba, V. A., V. V. Flambaum, J. S. M. Ginges, andM. Kozlov, 2002,Phys. Rev. A 66, 012111.
Dzuba, V. A., V. V. Flambaum, and C. Harabati, 2011, Phys. Rev. A84, 052108.
Dzuba, V. A., V. V. Flambaum, and C. Harabati, 2012, Phys. Rev. A85, 029901.
Dzuba, V. A., V. V. Flambaum, and S. G. Porsev, 2009, Phys. Rev. A80, 032120.
Eckel, S., P. Hamilton, E. Kirilov, H.W. Smith, and D. DeMille,2013, Phys. Rev. A 87, 052130.
Eckel, S., A. O. Sushkov, and S. K. Lamoreaux, 2012, Phys. Rev.Lett. 109, 193003.
Ellis, J., J. S. Lee, and A. Pilaftsis, 2008, J. High Energy Phys. 10,049.
Engel, J., J. L. Friar, and A. C. Hayes, 2000, Phys. Rev. C 61,035502.
Engel, J., M. J. Ramsey-Musolf, and U. van Kolck, 2013, Prog. Part.Nucl. Phys. 71, 21.
Eversmann, D., et al. (JEDI Collaboration), 2015, Phys. Rev. Lett.115, 094801.
Fang, F., and D. S. Weiss, 2009, Opt. Lett. 34, 169.Farley, F. J. M., K. Jungmann, J. P. Miller, W.M. Morse, Y. F. Orlov,B. L. Roberts, Y. K. Semertzidis, A. Silenko, and E. J. Stephenson,2004, Phys. Rev. Lett. 93, 052001.
Fedorov, V., et al., 2010, Phys. Lett. B 694, 22.Feinberg, G., 1958, Phys. Rev. 112, 1637.Feinberg, G., 1977, Trans. N.Y. Acad. Sci. 38, 26.Fierlinger, P., R. Stoepler, I. Altarev, and A. Schnabel, 2012, PatentWO 2012156278 A1.
Flambaum, V., I. Khriplovich, and O. Sushkov, 1986, Nucl. Phys. A449, 750.
Flambaum, V. V., 2008, Phys. Rev. A 77, 024501.Flambaum, V. V., and J. S.M. Ginges, 2002, Phys. Rev. A 65, 032113.Flambaum, V. V., and V. G. Zelevinsky, 2003, Phys. Rev. C 68,035502.
Fleig, T., and M. Jung, 2018, J. High Energy Phys. 07, 12.Fleig, T., and M. K. Nayak, 2013, Phys. Rev. A 88, 032514.Friar, J. L., B. F. Gibson, G. L. Payne, A. M. Bernstein, and T. E.Chupp, 1990, Phys. Rev. C 42, 2310.
Fukuyama, T., 2012, Int. J. Mod. Phys. A 27, 1230015.Fuyuto, K., and M. Ramsey-Musolf, 2018, Phys. Lett. B 781, 492.Fuyuto,K.,M.Ramsey-Musolf, andT. Shen, 2018, arXiv:1804.01137.Gaffney, L. P., et al., 2013, Nature (London) 497, 199.Garwin, R. L., and L. M. Lederman, 1959, Nuovo Cimento 11, 776.Ginges, J., and V. Flambaum, 2004, Phys. Rep. 397, 63.Giudice, G., and A. Romanino, 2004, Nucl. Phys. B 699, 65.Giudice, G., and A. Romanino, 2005, Nucl. Phys. B 706, 487.Goldemberg, J., and Y. Torizuka, 1963, Phys. Rev. 129, 2580.Golub, R., and K. Böning, 1983, Z. Phys. B 51, 95.Golub, R., C. Kaufman, G. Muller, and A. Steyerl, 2015, Phys. Rev.A 92, 062123.
Golub, R., and S. K. Lamoreaux, 1994, Phys. Rep. 237, 1.
Chupp et al.: Electric dipole moments of atoms, molecules, …
Rev. Mod. Phys., Vol. 91, No. 1, January–March 2019 015001-51

Golub, R., and J. Pendlebury, 1977, Phys. Lett. A 62, 337.Golub, R., D. J. Richardson, and S. K. Lamoreaux, 1991, Ultra-ColdNeutrons (Taylor and Francis Group, New York, New York).
Gomez, E., S. Aubin, L. A. Orozco, G. D. Sprouse, E. Iskrenova-Tchoukova, and M. S. Safronova, 2008, Phys. Rev. Lett. 100,172502.
Gorringe, T., and D. Hertzog, 2015, Prog. Part. Nucl. Phys. 84, 73.Graham, P. W., I. G. Irastorza, S. K. Lamoreaux, A. Lindner, andK. A. van Bibber, 2015, Annu. Rev. Nucl. Part. Sci. 65, 485.
Graner, B., Y. Chen, E. G. Lindahl, and B. R. Heckel, 2016, Phys.Rev. Lett. 116, 161601.
Graner, B., Y. Chen, E. G. Lindahl, and B. R. Heckel, 2017, Phys.Rev. Lett. 119, 119901.
Green, K., P. Harris, P. Iaydjiev, D. May, J. Pendlebury, K. Smith, M.van der Grinten, P. Geltenbort, and S. Ivanov, 1998, Nucl. Instrum.Methods Phys. Res., Sect. A 404, 381.
Griffith, W. C., M. D. Swallows, T. H. Loftus, M. V. Romalis, B. R.Heckel, and E. N. Fortson, 2009, Phys. Rev. Lett. 102, 101601.
Grujić, Z. D., P. A. Koss, G. Bison, and A. Weis, 2015, Eur. Phys. J.D 69, 135.
Grzadkowski, B., M. Iskrzyński, M. Misiak, and J. Rosiek, 2010, J.High Energy Phys. 10, 85.
Guidoboni, G., et al. (JEDI Collaboration), 2016, Phys. Rev. Lett.117, 054801.
Hacömeroğlu, S., and Y. K. Semertzidis, 2014, Nucl. Instrum.Methods Phys. Res., Sect. A 743, 96.
Hall, L. J., and Y. Nomura, 2012, J. High Energy Phys. 01, 82.Harber, D. M., and M. V. Romalis, 2000, Phys. Rev. A 63, 013402.Harris, P. G., and J. M. Pendlebury, 2006, Phys. Rev. A 73, 014101.Harris, P. G., et al., 1999, Phys. Rev. Lett. 82, 904.Harrison, G. E., M. A. Player, and P. G. H. Sandars, 1971, J. Phys. E4, 750.
Harrison, G. E., P. G. H. Sandars, and S. J. Wright, 1969a, Phys. Rev.Lett. 23, 274.
Harrison, G. E., P. G. H. Sandars, and S. J. Wright, 1969b, Phys. Rev.Lett. 22, 1263.
Haxton, W. C., and E. M. Henley, 1983, Phys. Rev. Lett. 51, 1937.Heidenreich, B. J., et al., 2005, Phys. Rev. Lett. 95, 253004.Heil, W., et al., 2013, Ann. Phys. (Berlin) 525, 539.Hinds, E. A., and P. G. H. Sandars, 1980, Phys. Rev. A 21, 480.Hudson, J. J., D. M. Kara, I. J. Smallman, B. E. Sauer, M. R. Tarbutt,and E. A. Hinds, 2011, Nature (London) 473, 493.
Hudson, J. J., B. E. Sauer, M. R. Tarbutt, and E. A. Hinds, 2002,Phys. Rev. Lett. 89, 023003.
Hunter, L. R., S. K. Peck, A. S. Greenspon, S. S. Alam, and D.DeMille, 2012, Phys. Rev. A 85, 012511.
Ibe, M., and T. T. Yanagida, 2012, Phys. Lett. B 709, 374.Ibrahim, T., and P. Nath, 1998, Phys. Rev. D 58, 111301.Ibrahim, T., and P. Nath, 1999, Phys. Rev. D 60, 099902.Ignatovich, V. K., 1969a, Zh. Eksp. Teor. Fiz. 56, 2019 [Sov. Phys.JETP 29, 1084 (1969)] [http://www.jetp.ac.ru/cgi-bin/dn/e_029_06_1084.pdf].
Imajo, S., et al., 2016, Prog. Theor. Exp. Phys. 2016, 013C02.Inami, K., et al., 2003, Phys. Lett. B 551, 16.Inoue, S., M. J. Ramsey-Musolf, and Y. Zhang, 2014, Phys. Rev. D89, 115023.
Ito, T., et al., 2018, Los Alamos National Laboratory Report No. LA-UR-18-28335.
Ito, T. M., et al., 2014, arXiv:1401.5435.Ito, T. M., et al., 2018, Phys. Rev. C 97, 012501.Jackiw, R., and C. Rebbi, 1976, Phys. Rev. Lett. 37, 172.Jackson, J. D., 1998, Classical Electrodynamics (Wiley, New York).Jesus, J. H. d., and J. Engel, 2005, Phys. Rev. C 72, 045503.
Jost, R., 1957, Helv. Phys. Acta 30, 409.Jung, M., 2013, J. High Energy Phys. 05, 168.Kanda, S., 2014, Nucl. Phys. B, Proc. Suppl. 253–255, 212.Kane, G., P. Kumar, and J. Shao, 2010, Phys. Rev. D 82, 055005.Katz, A., M. Perelstein, M. J. Ramsey-Musolf, and P. Winslow, 2015,Phys. Rev. D 92, 095019.
Kawamura, Hirokazu, et al., 2014, Eur. Phys. J. Web Conf. 66,05009.
Khriplovich, I., 1998, Phys. Lett. B 444, 98.Khriplovich, I., 2000a, Nucl. Phys. A 663–664, 147c.Khriplovich, I., 2000b, Hyperfine Interact. 127, 365.Khriplovich, I. B., and S. K. Lamoreaux, 1997, CP Violation WithoutStrangeness: Electric Dipole Moments of Particles, Atoms, andMolecules (Springer-Verlag, Berlin).
Kim, Y. J., and S. M. Clayton, 2015, IEEE Trans. Appl. Supercond.25, 1.
Kim, Y. J., C.-Y. Liu, S. K. Lamoreaux, G. Visser, B. Kunkler, A. N.Matlashov, J. C. Long, and T. G. Reddy, 2015, Phys. Rev. D 91,102004.
Kitano, M., et al., 1988, Phys. Rev. Lett. 60, 2133.Klinkby, E., K. Batkov, F. Mezei, E. Pitcher, T. Schaenfeldt, A.Takibayev, and L. Zanini, 2014, Adv. High Energy Phys. 2014,241639.
Klinkhamer, F. R., and N. S. Manton, 1984, Phys. Rev. D 30, 2212.Kobayashi, M., and T. Maskawa, 1973, Prog. Theor. Phys. 49, 652.Koch, H.-C., et al., 2015, Eur. Phys. J. D 69, 202.Kominis, I. K., T. W. Kornack, J. C. Allred, and M. V. Romalis, 2003,Nature (London) 422, 596.
Kornack, T. W., S. J. Smullin, S.-K. Lee, and M. V. Romalis, 2007,Appl. Phys. Lett. 90, 223501.
Korobkina, E., G. Medlin, B. Wehring, A. Hawari, P. Huffman, A.Young, B. Beaumont, and G. Palmquist, 2014, Nucl. Instrum.Methods Phys. Res., Sect. A 767, 169.
Kuchler, F., P. Fierlinger, and D. Wurm, 2014, Eur. Phys. J. WebConf. 66, 05011.
Kuchler, F., et al., 2016, Hyperfine Interact. 237, 95.Lamoreaux, S. K., and R. Golub, 2005, Phys. Rev. A 71, 032104.Landau, L., 1957a, Zh. Eksp. Teor. Fiz. 32, 405 [Sov. Phys. JETP 5,336 (1957)].
Landau, L., 1957b, Nucl. Phys. 3, 127.Lauer, T., and T. Zechlau, 2013, Eur. Phys. J. A 49, 104.Lebedev, O., and M. Pospelov, 2002, Phys. Rev. Lett. 89, 101801.Ledbetter, M. P., 2005, “Progress Toward a Search for a PermanentElectric Dipole Moment in Liquid 129Xe.”, Ph.D. thesis (PrincetonUniversity).
Ledbetter, M. P., I. M. Savukov, and M. V. Romalis, 2005, Phys. Rev.Lett. 94, 060801.
Lee, S.-K., and M. V. Romalis, 2008, J. Appl. Phys. 103, 084904.Lee, T. D., and C. N. Yang, 1957, Brookhaven National Laboratory(BNL), Upton, NY Technical Report No. BNL-443 (T-91).
Leung, K. K. H., S. Ivanov, F. M. Piegsa, M. Simson, and O. Zimmer,2016, Phys. Rev. C 93, 025501.
Li, Y., S. Profumo, and M. Ramsey-Musolf, 2009, Phys. Lett. B 673,95.
Li, Y., S. Profumo, and M. Ramsey-Musolf, 2010, J. High EnergyPhys. 08, 62.
Liebler, S., S. Profumo, and T. Stefaniak, 2016, J. High Energy Phys.04, 143.
Lins, T., 2016, High Precision Physics in Low Magnetic Fields:Implementation of a Sub-Nanotesla Field with Femtotesla Tem-poral Stability, Ph.D. thesis (Technische Universitat Munchen).
Liu, C.-P.,M. J.Ramsey-Musolf,W. C.Haxton,R. G. E.Timmermans,and A. E. L. Dieperink, 2007, Phys. Rev. C 76, 035503.
Chupp et al.: Electric dipole moments of atoms, molecules, …
Rev. Mod. Phys., Vol. 91, No. 1, January–March 2019 015001-52
Liu, C.-Y., S. Lamoreaux, A. Saunders, D. Smith, and A. Young,2003, Nucl. Instrum. Methods Phys. Res., Sect. A 508, 257.
Liu, C.-Y., and S. K. Lamoreaux, 2004, Mod. Phys. Lett. A 19, 1235.Liu, C.-Y., A. R. Young, and S. K. Lamoreaux, 2000, Phys. Rev. B62, R3581.
Loh, H., K. C. Cossel, M. C. Grau, K.-K. Ni, E. R. Meyer, J. L. Bohn,J. Ye, and E. A. Cornell, 2013, Science 342, 1220.
Luders, G., 1954, Kong. Dan. Vid. Sel. Mat. Fys. Med. 28N5, 1[https://inspirehep.net/record/48330/].
Lychagin, E. V.,A.Yu.Muzychka,G. V.Nekhaev,V. V.Nesvizhevsky,E. I. Sharapov, and A. V. Strelkov, 2015, Adv. High Energy Phys.2015, 547620.
Maldonado-Velázquez, M., L. Barrón-Palos, C. Crawford, and W.M.Snow, 2017, Nucl. Instrum. Methods Phys. Res., Sect. A 854, 127.
Mane, S., 2008, Nucl. Instrum.Methods Phys. Res., Sect. A 596, 288.Mane, S., 2012, Nucl. Instrum. Methods Phys. Res., Sect. A 687, 40.Mane, S., 2014a,Nucl. Instrum.Methods Phys.Res., Sect.A 764, 167.Mane, S., 2014b, Nucl. Instrum. Methods Phys. Res., Sect. A 767,252.
Mane, S., 2014c, Nucl. Instrum. Methods Phys. Res., Sect. A 758, 77.Mane, S., 2015a, Nucl. Instrum. Methods Phys. Res., Sect. A 794, 3.Mane, S., 2015b, Nucl. Instrum. Methods Phys. Res., Sect. A 769,26.
Mane, S., 2015c, Nucl. Instrum. Methods Phys. Res., Sect. A 770,36.
Margolis, B., S. Rosendorff, and A. Sirlin, 1959, Phys. Rev. 114,1530.
Mårtensson-Pendrill, A.-M., 1985, Phys. Rev. Lett. 54, 1153.Mårtensson-Pendrill, A.-M., and P. Öster, 1987, Phys. Scr. 36, 444.Masuda, Y., K. Asahi, K. Hatanaka, S.-C. Jeong, S. Kawasaki, R.Matsumiya, K. Matsuta, M. Mihara, and Y. Watanabe, 2012, Phys.Lett. A 376, 1347.
Masuda, Y., T. Kitagaki, K. Hatanaka, M. Higuchi, S. Ishimoto, Y.Kiyanagi, K. Morimoto, S. Muto, and M. Yoshimura, 2002, Phys.Rev. Lett. 89, 284801.
McClintock, P. V. E., D. J. Meredith, and J. K. Wigmore, 1984,Matter at Low Temperatures (Wiley Interscience, New York).
McKeen, D., M. Pospelov, and A. Ritz, 2012, Phys. Rev. D 86,113004.
McKeen, D., M. Pospelov, and A. Ritz, 2013, Phys. Rev. D 87,113002.
Metodiev, E., et al., 2015, Nucl. Instrum. Methods Phys. Res., Sect.A 797, 311.
Metodiev, E. M., K. L. Huang, Y. K. Semertzidis, and W.M. Morse,2014, Phys. Rev. ST Accel. Beams 17, 074002.
Meyer, E. R., and J. L. Bohn, 2008, Phys. Rev. A 78, 010502.Miller, P. D., W. B. Dress, J. K. Baird, and N. F. Ramsey, 1967, Phys.Rev. Lett. 19, 381.
Mohapatra, R. N., and J. C. Pati, 1975, Phys. Rev. D 11, 566.Mohr, P. J., D. B. Newell, and B. N. Taylor, 2016, Rev. Mod. Phys.88, 035009.
Morrissey, D. E., and M. J. Ramsey-Musolf, 2012, New J. Phys. 14,125003.
Morse, W.M., 2011, Hyperfine Interact. 199, 93.Morse, W. M., Y. F. Orlov, and Y. K. Semertzidis, 2013, Phys. Rev.ST Accel. Beams 16, 114001.
Mosyagin, N. S., M. G. Kozlov, and A. V. Titov, 1998, J. Phys. B 31,L763.
Muller, K. A., and H. Burkard, 1979, Phys. Rev. B 19, 3593.Murthy, S. A., D. Krause, Z. L. Li, and L. R. Hunter, 1989, Phys. Rev.Lett. 63, 965.
Nataraj, H. S., B. K. Sahoo, B. P. Das, and D. Mukherjee, 2008, Phys.Rev. Lett. 101, 033002.
Nelson, D. F., A. A. Schupp, R. W. Pidd, and H. R. Crane, 1959,Phys. Rev. Lett. 2, 492.
Nesvizhevsky, V. V., 2002, Yad. Fiz. 65, 426 [Phys. At. Nucl. 65, 400(2002)].
Nesvizhevsky, V. V., 2014, arXiv:1405.7495.Ng, D., and J. N. Ng, 1996, Mod. Phys. Lett. A 11, 211.Norrgard, E. B., E. R. Edwards, D. J. McCarron, M. H. Steinecker, D.DeMille, S. S. Alam, S. K. Peck, N. S. Wadia, and L. R. Hunter,2017, Phys. Rev. A 95, 062506.
Nouri, N., A. Biswas, M. Brown, R. Carr, B. Filippone, C. Osthelder,B. Plaster, S. Slutsky, and C. Swank, 2015, J. Instrum. 10, P12003.
Nouri, N., and B. Plaster, 2014a, J. Instrum. 9, P11009.Nouri, N., and B. Plaster, 2014b, Nucl. Instrum. Methods Phys. Res.,Sect. A 767, 92.
Nuss-Warren, S., et al., 2004, Nucl. Instrum. Methods Phys. Res.,Sect. A 533, 275.
Olive, K., and P. D. Group, 2014, Chin. Phys. C 38, 090001.Orlov, Y. F., W.M. Morse, and Y. K. Semertzidis, 2006, Phys. Rev.Lett. 96, 214802.
O’Shaughnessy, C., et al., 2009, Nucl. Instrum. Methods Phys. Res.,Sect. A 611, 171.
Oteiza, E. R., 1992, Search for a Permanent Electric Dipole Momentin XENON-129 Using Simultaneous HELIUM-3 Magnetometry,Ph.D. thesis (Harvard University).
Parker, R. H., et al., 2015, Phys. Rev. Lett. 114, 233002.Pati, J. C., and A. Salam, 1974, Phys. Rev. D 10, 275.Pati, J. C., and A. Salam, 1975, Phys. Rev. D 11, 703.Pattie, R., et al., 2017, Nucl. Instrum. Methods Phys. Res., Sect. A872, 64.
Patton, B., E. Zhivun, D. C. Hovde, and D. Budker, 2014, Phys. Rev.Lett. 113, 013001.
Peccei, R. D., and H. R. Quinn, 1977a, Phys. Rev. D 16, 1791.Peccei, R. D., and H. R. Quinn, 1977b, Phys. Rev. Lett. 38, 1440.Pen, A., T. Mastren, G. F. Peaslee, K. Petrasky, P. A. DeYoung, D. J.Morrissey, and S. E. Lapi, 2014, Nucl. Instrum. Methods Phys.Res., Sect. A 747, 62.
Pendlebury, J., and G. Greene, 2014, Phys. Procedia 51, 78.Pendlebury, J. M., et al., 2004, Phys. Rev. A 70, 032102.Pendlebury, J. M., et al., 2015, Phys. Rev. D 92, 092003.Perez-Galván, A., B. Plaster, J. Boissevain, R. Carr, B. Filippone, M.Mendenhall, R. Schmid, R. Alarcon, and S. Balascuta, 2011, Nucl.Instrum. Methods Phys. Res., Sect. A 660, 147.
Petrov, A. N., N. S. Mosyagin, T. A. Isaev, and A. V. Titov, 2007,Phys. Rev. A 76, 030501.
Piegsa, F. M., 2013, Phys. Rev. C 88, 045502.Piegsa, F. M., M. Fertl, S. N. Ivanov, M. Kreuz, K. K. H. Leung, P.Schmidt-Wellenburg, T. Soldner, and O. Zimmer, 2014, Phys. Rev.C 90, 015501.
Pignol, G., and S. Roccia, 2012, Phys. Rev. A 85, 042105.Pignol, G., T. Soldner, and C. Theroine, 2014, Phys. Procedia 51, 3.Player, M. A., and P. G. H. Sandars, 1970, J. Phys. B 3, 1620.Pondrom, L., R. Handler, M. Sheaff, P. T. Cox, J. Dworkin, O. E.Overseth, T. Devlin, L. Schachinger, and K. Heller, 1981, Phys.Rev. D 23, 814.
Pospelov, M., and A. Ritz, 1999, Phys. Rev. Lett. 83, 2526.Pospelov, M., and A. Ritz, 2000, Nucl. Phys. B 573, 177.Pospelov, M., and A. Ritz, 2005, Ann. Phys. (Amsterdam) 318,119.
Purcell, E. M., and N. F. Ramsey, 1950, Phys. Rev. 78, 807.Pustelny, S., W. Gawlik, S. M. Rochester, D. F. J. Kimball, V. V.Yashchuk, and D. Budker, 2006, Phys. Rev. A 74, 063420.
Ramsey, N., 1982, Annu. Rev. Nucl. Part. Sci. 32, 211.Ramsey, N. F., 1955, Phys. Rev. 100, 1191.
Chupp et al.: Electric dipole moments of atoms, molecules, …
Rev. Mod. Phys., Vol. 91, No. 1, January–March 2019 015001-53

Ramsey, N. F., 1956, Molecular Beams (Oxford University Press,New York).
Ramsey, N. F., 1984, Acta Phys. Hung. 55, 117 [https://link.springer.com/article/10.1007/BF03155926].
Ramsey, N. F., 1990a, Annu. Rev. Nucl. Part. Sci. 40, 1.Ramsey, N. F., 1990b, Rev. Mod. Phys. 62, 541.Ramsey-Musolf, M., and S. Su, 2008, Phys. Rep. 456, 1.Rand, R. E., 1965, Phys. Rev. 140, B1605.Rathmann, F., A. Saleev, and N. N. Nikolaev (the Jedi and srEdmcollaborations), 2013, J. Phys. Conf. Ser. 447, 012011.
Regan, B. C., E. D. Commins, C. J. Schmidt, and D. DeMille, 2002,Phys. Rev. Lett. 88, 071805.
Riotto, A., and M. Trodden, 1999, Annu. Rev. Nucl. Part. Sci. 49, 35.Roberts, B., V. Dzuba, and V. Flambaum, 2015, Annu. Rev. Nucl.Part. Sci. 65, 63.
Roberts, B. L., and W. J. Marciano, 2009, Lepton Dipole Moments(World Scientific, Singapore).
Romalis, M. V., W. C. Griffith, J. P. Jacobs, and E. N. Fortson, 2001,Phys. Rev. Lett. 86, 2505.
Rose, B., 1960, in Proceedings, 10th International Conferenceon High-Energy Physics (ICHEP 60) (University of Rochester,Rochester, NY), pp. 787–788.
Rosen, M. S., T. E. Chupp, K. P. Coulter, R. C. Welsh, and S. D.Swanson, 1999, Rev. Sci. Instrum. 70, 1546.
Rosenberry, M., 2001, Phys. Rev. Lett. 86, 22.Royce, E. B., and N. Bloembergen, 1963, Phys. Rev. 131, 1912.Sahoo, B. K., 2017, Phys. Rev. D 95, 013002.Sakemi, Y., et al., 2011, J. Phys. Conf. Ser. 302, 012051.Sakharov, A., 1967, ZhETF Pis’ma 5, 32 [JETP Lett. 5, 24 (1967)][http://jetpletters.ac.ru/ps/1643/article_25089.shtml].
Salpeter, E. E., 1958, Phys. Rev. 112, 1642.Sandars, P., 1965, Phys. Lett. 14, 194.Sandars, P., 1966, Phys. Lett. 22, 290.Sandars, P. G. H., 1968a, J. Phys. B 1, 499.Sandars, P. G. H., 1968b, J. Phys. B 1, 511.Sandars, P. G. H., 1975, in Atomic Physics 4, edited by G. zuPutlitz, E.W. Weber, and A. Winnacker (Springer, Boston, MA),pp. 71–92.
Sandars, P. G. H., 1993, Phys. Scr. T46, 16.Sandars, P. G. H., 2001, Contemp. Phys. 42, 97.Sandars, P. G. H., and E. Lipworth, 1964, Phys. Rev. Lett. 13, 718.Saunders, A., et al., 2013, Rev. Sci. Instrum. 84, 013304.Schiff, L. I., 1963, Phys. Rev. 132, 2194.Schropp, D., D. Cho, T. Vold, and E. A. Hinds, 1987, Phys. Rev. Lett.59, 991.
Seng, C.-Y., 2015, Phys. Rev. C 91, 025502.Seng, C.-Y., J. de Vries, E. Mereghetti, H. H. Patel, and M. Ramsey-Musolf, 2014, Phys. Lett. B 736, 147.
Seng, C.-Y., and M. Ramsey-Musolf, 2017, Phys. Rev. C 96, 065204.Senjanovic, G., and R. N. Mohapatra, 1975, Phys. Rev. D 12, 1502.Sen’kov, R. A., N. Auerbach, V. V. Flambaum, and V. G. Zelevinsky,2008, Phys. Rev. A 77, 014101.
Serebrov, A., N. Romanenko, O. Zherebtsov, M. Lasakov, A.Vasiliev, A. Fomin, P. Geltenbort, I. Krasnoshekova, A. Kharitonov,and V. Varlamov, 2005, Phys. Lett. A 335, 327.
Serebrov, A., et al., 2003, Phys. Lett. A 313, 373.Serebrov, A. P., V. A. Lyamkin, A. K. Fomin, D. V. Prudnikov, O. Y.Samodurov, and A. S. Kanin, 2017, J. Phys. Conf. Ser. 798,012147.
Serebrov, A. P., et al., 2008, Phys. Rev. C 78, 035505.Serebrov, A. P., et al., 2015, Phys. Rev. C 92, 055501.Shabalin, E., 1978, Yad. Fiz. 28, 151 [Sov. J. Nucl. Phys. 28, 75(1978)] [http://inspirehep.net/record/130243].
Shabalin, E., 1983, Usp. Fiz. Nauk 139, 561 [Sov. Phys. Usp. 26, 297(1983)].
Shapiro, F. L., 1968, Usp. Fiz. Nauk 95, 145 [Sov. Phys. Usp. 11, 345(1968)].
Shindler, A., T. Luu, and J. de Vries, 2015, Phys. Rev. D 92,094518.
Shull, C. G., and R. Nathans, 1967, Phys. Rev. Lett. 19, 384.Silenko, A. J., 2015, J. Phys. G 42, 075109.Singh, G., P. Dilavore, and C. O. Alley, 1972, Rev. Sci. Instrum. 43,1388.
Singh, Y., and B. K. Sahoo, 2015a, Phys. Rev. A 92, 022502.Singh, Y., and B. K. Sahoo, 2015b, Phys. Rev. A 91, 030501.Skripnikov, L. V., 2017, J. Chem. Phys. 147, 021101.Skripnikov, L. V., A. N. Petrov, and A. V. Titov, 2013, J. Chem. Phys.139, 221103.
Skripnikov, L. V., A. V. Titov, and V. V. Flambaum, 2017, Phys. Rev.A 95, 022512.
Slutsky, S., et al., 2017, Nucl. Instrum. Methods Phys. Res., Sect. A862, 36.
Smith, J. H., E. M. Purcell, and N. F. Ramsey, 1957, Phys. Rev. 108,120.
Smith, K., et al., 1990, Phys. Lett. B 234, 191.Song, Y.-H., R. Lazauskas, and V. Gudkov, 2013, Phys. Rev. C 87,015501.
Spevak, V., and N. Auerbach, 1995, Phys. Lett. B 359, 254.Spevak, V., N. Auerbach, and V. V. Flambaum, 1997, Phys. Rev. C56, 1357.
Sternheimer, R. M., 1959, Phys. Rev. 113, 828.Stetcu, I., C.-P. Liu, J. Friar, A. Hayes, and P. Navrtil, 2008, Phys.Lett. B 665, 168.
Steyerl, A., C. Kaufman, G. Muller, S. S. Malik, A. M. Desai, and R.Golub, 2014, Phys. Rev. A 89, 052129.
Steyerl, A., and S. S. Malik, 1989, Nucl. Instrum. Methods Phys.Res., Sect. A 284, 200.
Stoner, R. E., M. A. Rosenberry, J. T. Wright, T. E. Chupp, E. R.Oteiza, and R. L. Walsworth, 1996, Phys. Rev. Lett. 77, 3971.
Sumner, T. J., J. M. Pendlebury, and K. F. Smith, 1987, J. Phys. D 20,1095.
Sun, Z., M. Reisner, P. Fierlinger, A. Schnabel, S. Stuiber, and L. Li,2016, J. Appl. Phys. 119, 193902.
Sushkov, A. O., S. Eckel, and S. K. Lamoreaux, 2009, Phys. Rev. A79, 022118.
Sushkov, A. O., S. Eckel, and S. K. Lamoreaux, 2010, Phys. Rev. A81, 022104.
Sushkov, O. P., V. V. Flambaum, and I. B. Khriplovich, 1984, Zh.Eksp. Teor. Fiz. 87, 1521 [http://www.jetp.ac.ru/cgi-bin/dn/e_060_05_0873.pdf] [Sov. Phys. JETP 60, 873 (1984)].
Swallows, M. D., T. H. Loftus, , W. C. Griffith, B. R. Heckel,E. N. Fortson, and M. V. Romalis, 2013, Phys. Rev. A 87,012102.
Talman, R. M., and J. D. Talman, 2015a, Phys. Rev. STAccel. Beams18, 074004.
Talman, R. M., and J. D. Talman, 2015b, Phys. Rev. STAccel. Beams18, 074003.
Tang, Z., et al., 2016, Nucl. Instrum. Methods Phys. Res., Sect. A827, 32.
Tardiff, E. R., 2009, Towards a Measurement of the Electric DipoleMoment of radon-223, Ph.D. thesis (University of Michigan).
Tardiff, E. R., et al., 2008, Phys. Rev. C 77, 052501.Teruya, E., N. Yoshinaga, K. Higashiyama, and K. Asahi, 2017,Phys. Rev. C 96, 015501.
Thiel, F., A. Schnabel, S. Knappe-Grneberg, D. Stollfu, and M.Burghoff, 2007, Rev. Sci. Instrum. 78, 035106.
Chupp et al.: Electric dipole moments of atoms, molecules, …
Rev. Mod. Phys., Vol. 91, No. 1, January–March 2019 015001-54

Thomas, L., 1927, The London, Edinburgh, and Dublin Philosophi-cal Magazine and Journal of Science 3, 1.
’t Hooft, G., 1976, Phys. Rev. Lett. 37, 8.Tureanu, A., 2013, J. Phys. Conf. Ser. 474, 012031.Viana, R., P. Lunkenheimer, J. Hemberger, R. Böhmer, and A. Loidl,1994, Phys. Rev. B 50, 601.
Voigt, J., S. Knappe-Gruneberg, A. Schnabel, R. Körber, andM. Burghoff, 2013, Metrology and Measurement Systems 20,239.
Vold, T. G., F. J. Raab, B. Heckel, and E. N. Fortson, 1984, Phys.Rev. Lett. 52, 2229.
von Hahn, R., et al., 2016, Rev. Sci. Instrum. 87, 063115.Vutha, A. C., M. Horbatsch, and E. A. Hessels, 2018, Phys. Rev. A98, 032513.
Warner, T., et al., 2005, Nucl. Instrum. Methods Phys. Res., Sect. A538, 135.
Weinberg, S., 1978, Phys. Rev. Lett. 40, 223.Weisskopf, M., 1968, Phys. Rev. Lett. 21, 1645.Weyers, S., B. Lipphardt, and H. Schnatz, 2009, Phys. Rev. A 79,031803.
Wilczek, F., 1978, Phys. Rev. Lett. 40, 279.Wilkening, D. A., N. F. Ramsey, and D. J. Larson, 1984, Phys. Rev. A29, 425.
Wilkinson, D. T., and H. R. Crane, 1963, Phys. Rev. 130, 852.Wirzba, A., J. Bsaisou, and A. Nogga, 2017, Int. J. Mod. Phys. E 26,1740031.
Wu, Z., W. Happer, M. Kitano, and J. Daniels, 1990, Phys. Rev. A 42,2774.
Xu, G., and D. J. Heinzen, 1999, Phys. Rev. A 59, R922.Yamanaka, N., 2017, Int. J. Mod. Phys. E 26, 1730002.Yamanaka, N., and E. Hiyama, 2016, J. High Energy Phys. 02, 67.
Yamanaka, N., B. K. Sahoo, N. Yoshinaga, T. Sato, K. Asahi, andB. P. Das, 2017, Eur. Phys. J. A 53, 54.
Yamanaka, N., T. Sato, and T. Kubota, 2014, J. High Energy Phys.12, 110.
Yashchuk, V., D. Budker, and M. Zolotorev, 1999, AIP Conf. Proc.457, 177.
Yoshiki, H., 2003, Comput. Phys. Commun. 151, 141.Yoshimi, A., K. Asahi, K. Sakai, M. Tsuda, K. Yogo, H. Ogawa, T.Suzuki, and M. Nagakura, 2002, Phys. Lett. A 304, 13.
Yoshinaga, N., K. Higashiyama, and R. Arai, 2010, Prog. Theor.Phys. 124, 1115.
Yu, Z.-C., S. S. Malik, and R. Golub, 1986, Z. Phys. B 62, 137.Zechlau, T. S., 2016, Ultra-Cold Neutron Transport and SpinManipulation System for the Measurement of the Neutron ElectricDipole Moment, thesis (Technische Universitaat Muenchen).
Zel’dovich, Y. B., 1959, Zh. Eksp. Teor. Fiz. 36, 1952 [Sov. Phys.JETP 9, 1389 (1959)] [http://www.jetp.ac.ru/cgi-bin/e/index/e/9/6/p1389?a=list].
Zelevinsky, V., A. Volya, and N. Auerbach, 2008, Phys. Rev. C 78,014310.
Zeng, X., Z. Wu, T. Call, E. Miron, D. Schreiber, and W. Happer,1985, Phys. Rev. A 31, 260.
Zhivun, E., A. Wickenbrock, B. Patton, and D. Budker, 2014, Appl.Phys. Lett. 105, 192406.
Zhu, K., N. Solmeyer, C. Tang, and D. S. Weiss, 2013, Phys. Rev.Lett. 111, 243006.
Zimmer, O., 2014a, arXiv:1406.3783.Zimmer, O., 2014b, Phys. Procedia 51, 85.Zimmer, O., and R. Golub, 2015, Phys. Rev. C 92, 015501.Zinkstok, R. T., S. Witte, W. Ubachs, W. Hogervorst, and K. S.Eikema, 2006, Phys. Rev. A 73, 061801.
Chupp et al.: Electric dipole moments of atoms, molecules, …
Rev. Mod. Phys., Vol. 91, No. 1, January–March 2019 015001-55