Embed Size (px)
Citation preview
Institute for Empirical Research in Economics
University of Zurich
Working Paper Series
ISSN 1424-0459
Working Paper No. 421
Elections and Deceptions:
An Experimental Study on the Behavioral Effects of
Democracy
Luca Corazzini, Sebastian Kube, Michel André Maréchal and
Antonio Nicolò
Revised version, May 2012
Elections and Deceptions:
An Experimental Study on the Behavioral Effects of
Democracy∗
Luca Corazzini, Sebastian Kube, Michel Andre Marechal, and Antonio Nicolo
May, 2012
Abstract
How do democratic elections affect policy making? Traditionally, the virtue of elections
has been seen in their role as means of screening and sanctioning shirking public officials.
This paper proposes a novel rationale for elections and political campaigns considering
that candidates incur psychological costs of lying. These non-pecuniary costs imply that
political campaigns constitute an anchor and guide subsequent behavior, even in the absence
of reputational or image concerns. Our lab experiments reveal that promises are more than
cheap talk. They influence the behavior of both voters and their representatives. Strikingly,
the electorate is better off when their leaders are elected democratically rather than being
appointed exogenously. In addition, we find that representatives are more likely to serve
the public interest when their approval rates are high. Taken together, our results suggest
that electoral competition and campaigns confer important benefits beyond their screening
and sanctioning functions.
JEL classification: D72, C92, D03.
Keywords: Costs of Lying, Electoral Competition, Laboratory Experiment.
∗ Corazzini: Department of Economics and Management ”Marco Fanno”, University of Padua, via del Santo,
33, 35123, Padova, Italy, email: [email protected]. Kube: University of Bonn, Department of Economics,
Adenauerallee 24-42, 53113 Bonn, Germany, email: kube(at)uni-bonn.de. Marechal: University of Zurich,
Department of Economics, Laboratory for Social and Neural Systems Research, Bluemlisalpstrasse 10, CH-8006
Zurich, Switzerland, email: michel.marechal(at)econ.uzh.ch. Nicolo: Department of Economics and Management
”Marco Fanno”, University of Padua, via del Santo, 33, 35123, Padova, Italy, email: [email protected].
We are grateful to Michele Bernasconi, Monika Butler, Alain Cohn Simon Evenett, Ernst Fehr, Simon Gachter,
Jens Grosser, Sally Gschwend, John Hey, Martin Leroch, Herve Moulin, Ryan McKay, Clemens Puppe, Rupert
Sausgruber, Robert Sugden, Christian Thoni, Jean-Robert Tyran, Roberto Weber as well as the audiences at the
NYU Experimental Political Science Conference 2010, ASSET Meeting 2009, ESA European Regional Meeting
2008/2009, APET Conference 2009, EPCS Conference 2008, Bocconi University, Florida State University, IMT
- Lucca, University of Messina, Universitat Jaume I of Castellon, and University of Zurich for very helpful
discussions and comments.
.
“We have won with an ample margin. But, far from putting us in a position of privilege,
this puts us instead in a position of greater responsibility and obligation.”
Argentina’s first lady, Cristina Fernandez de Kirchner, after winning the general election
with 45% of all votes - almost twice the number of the runner-up (2007/10/29)
Introduction
Are political campaigns beneficial for society? Expenditures for political campaigns are sky-
rocketing (e.g. see, Benoit and Marsh 2008; Stratmann 2005) and often described as an in-
efficient “arms-race” (e.g. see, Abrams and Settle 2004). Although electoral campaigns are
anything but cheap, rational choice scholars generally consider their content as cheap talk (e.g.
see, Barro 1973; Ferejohn 1986; Austen-Smith and Banks 1989). Candidates can promise al-
most anything in pre-election campaigns, but voters do not have any direct means to enforce
promises (see Manin, Przeworski and Stokes 1999).1
We outline a psychological rationale why voters might benefit from elections and electoral
campaigns. Our idea is based on the observation that human behavior is not characterized by
pure self-interest, but is also driven by other-regarding preferences and intrinsic norm compli-
ance (e.g. Cooper and Kagel 2009; Fowler and Kam 2007; Fehr and Schmidt 2002). Extensive
experimental evidence suggests that people tend to tell the truth in strategic situations, even
if reputation is not at stake. Scholars usually explain this phenomenon by arguing that people
incur psychological costs if they do not live up to their promises. Several reasons for such
non-pecuniary costs of lying have been suggested, as for example the desire to maintain a
positive self-image (see Fischbacher and Heusi 2008; Mazar, Amir and Ariely 2008). Others
have argued that people feel guilty if they do not meet others’ expectations (see Baumeister
and Heatherton 1994; Charness and Dufwenberg 2006). Whatever the exact roots of the costs
of lying are, their existence implies that electoral campaigns might not just be cheap talk.
They have the potential to serve as anchors for actual office behavior. To the extent to which
promises anchor the incumbent’s subsequent behavior, the constituency is likely to benefit from
electoral competition, where candidates outrun each other with campaign promises.
We test our conjecture with incentivized lab experiments studying both the behavior of
1Elections serve as an indirect instrument for promoting representation. In repeated elections with non-binding or a complete lack of term limits, voters can threaten to vote dishonest politicians out of office (e.g. see,Key 1966; Ferejohn 1986).
1
representative and voters in a stylized delegated democracy. In our benchmark “Election”
treatment two candidates competed for office in an election with five voters. Both candidates
simultaneously promised how much money they would distribute to the electorate if they won.
Promises were not enforceable and thus non-binding for the candidates. The electorate was
therefore uncertain about how their representatives would behave once elected. The winner
was determined by majority rule and was entrusted with a budget that she could share with
the electorate or keep for herself. This game captures the elementary tradeoff representatives
face in situations where their personal interests do not coincide with those of the public.2
We compare treatment Election with two additional treatments. In treatment “Random”,
we eliminated electoral competition by replacing the election with a random selection mech-
anism. The approval rate was randomly determined by the experimenter using a large die
in front of all participants. By contrasting treatment Election with Random, we are able to
analyze the causal effects of electoral competition on promises and office behavior. In the
second additional treatment “NoCampaign”, voters could choose their preferred candidate as
in treatment Election, but the candidates were not allowed to run electoral campaigns. This
treatment sheds light on the impact of campaign promises on the candidates’ benevolence.
Our experiment provides the following insights. First, electoral competition intensified
campaign promises. Candidates promised significantly more benefits in democratic elections
than if they were randomly appointed. Second, promises served as an anchor for subsequent
office behavior. We find that on average candidates fulfilled their promises to a degree of roughly
60 percent, despite conflicting self-interest and the absence of reputational concerns. This
suggests that lying creates non-pecuniary or psychological costs. Third, eliminating electoral
competition led to a substantial drop in the candidates’ benevolence. Furthermore, we observe
that when candidates were not allowed to make any promises (in treatment NoCampaign),
voters were just as badly off as in the absence of elections. Together, these results suggest
that not only electoral competition matters, but also the ability to make pre-election promises.
Finally, we found that the larger their share of supporters, the more benevolent were the
candidates. This indicates that the costs of lying increase with the share of supporters a
candidate would let down. This relationship was much weaker in the two control treatments
2Our setup can easily be reinterpreted to mimic a scenario where politicians have to decide how much costlyeffort (e.g. for solving problems, fighting corruption, etc.) they want to provide, where effort is beneficial for thecitizens.
2
NoCampaign and Random, where the approval rate was less or not informative about voters’
expectations.
We opted for an experimental approach because it allows us to identify the impact of lying
aversion under tightly controlled conditions. A separation of intrinsically motivated honesty
from reputational motives is inherently difficult with observational field data, as politicians
often face looming re-elections, future career plans, or other image concerns. Moreover, voters
can weed out dishonest candidates in repeated elections, creating additional potential for se-
lection bias. It is important to disentangle the psychological costs of lying from reputational
motives and adverse selection because it improves our knowledge about how elections influence
leadership behavior and it provides valuable input for the design of political institutions. We
designed our experiment in such a way that we can sidestep reputational concerns and selection
effects. Because our election was only for one term, voters could not punish or weed out less
benevolent leaders. Moreover, all participants interacted anonymously with each other using
a computer interface and their true identities were never revealed to the other participants at
any point in time. Another advantage of our experimental approach is that we can exogenously
assign constituencies to different democratic institutions. We thus avoid the methodological
problems implied by the potential endogeneity of political institutions (e.g. see Besley and Case
2003).3
Related Literature
How do electoral institutions affect policy making? The theoretical literature has predominantly
focused on two key mechanisms through which elections influence policy making. According
to the accountability or moral hazard view (see Key 1966; Barro 1973; Ferejohn 1986), the
threat of looming re-elections disciplines incumbents. Other theories have emphasized the role
of elections as a selection device, giving voters the opportunity to weed out incompetent or
dishonest politicians (see Fearon 1999; Besley 2005; Ashworth 2005; Gordon, Huber and Landa
2007; Ashworth and de Mesquita 2008).4 Disentangling selection from accountability effects is
challenging, because both mechanisms often have observationally equivalent implications. A
common empirical approach is to take advantage of binding term limits and to analyze how the
3We discuss the potential limitations of our lab experimental approach in the conclusion.4In the presence of informational asymmetries repeated elections can also create counterproductive incentives
for politicians to pander to public opinion (see Maskin and Tirole 2004; Canes-Wrone, Herron and Shotts 2001).
3
lack of electoral incentives affects policy making in the last term. The evidence is consistent
with both accountability and selection effects (see Besley and Case 2003). Alt, de Mesquita and
Rose (2011) for example use variation in U.S. gubernatorial term limits across states and time
and find that the impact of re-election incentives and selection on government performance are
of similar magnitude (see also Ferraz and Finan 2011; Gagliarducci and Nannicini N.d.; Rothen-
berg and Sanders 2000 for further recent evidence on selection and accountability effects). We
rule out reputational concerns in our study by design, and are able to control for selection
effects. We therefore contribute to this extensive literature by providing novel evidence that
elections convey motivational benefits beyond their role as a selection and sanctioning device.
Our paper further adds to the literature in the following ways. First, scholars of pledge
fulfillment analyzed the extent to which elected representatives and political parties live up to
their campaign promises. Petry (2009) surveyed 18 studies from various countries and found
that 67 percent of promises are kept on average. The degree of pledge fulfillment is often
noted as surprisingly high, because the general population tends to believe that politicians are
untrustworthy (see Thomson 2011). While most of the literature has focused on party promises,
fewer papers studied promise keeping (or congruence with pre-election issue positions) on the
level of a single individual. Individual level studies have drawn similar conclusions (e.g. see
Fishel 1985; Sulkin and Swigger 2008; Sulkin 2009; Ringquist and Dasse 2004; Schwarz, Schadel
and Ladner 2010). Both reputational concerns and the psychological costs of lying can explain
promise keeping in all existing studies. Our controlled lab experiment allows us to disentangle
the psychological cost of lying from other pecuniary costs implied by a loss of reputation.
Moreover, we exogenously manipulate key features of democratic institution. We are thus able
to study the causal effects of democratic institutions on candidates’ behavior, complementing
the existing field studies.
Second, random appointment of public officials by lot (also known as “sortition”) was a
core feature in the ancient Athenian democracy (see Headlam 1933; Manin, Przeworski and
Stokes 1999). Various forms of sortition were also practiced in medieval and renaissance Italian
city-states (mostly Florence and Venice), 16th century England, as well as in some of the Lands-
gemeinden in Switzerland until 1837 (see Engelstad 1989; Carson and Martin 1999; Tridimas
2011).5 A well known modern form of random selection of social decision makers are juries in
5See also Elster 1989 for a more general discussion of randomization in social decision-making.
4
court cases. Advocates of sortition have argued that random appointment of public officials
achieves a more accurate descriptive representation (e.g. Mueller, Tollison and Thomas 1972;
Burnheim 1985). Moreover, random appointment is thought to attenuate the incentives for
self-interested rent-seeking activities and promotes political equality (see Lockard 2003; Mul-
gan 1984). Our results suggest that these potential benefits should be carefully weighed against
the potential costs of less motivated representatives.
Third, we add to the growing field of experimental political economy (e.g. see Woon 2011;
Grosser and Schram 2010; Morton and Williams 2010; Grosser and Schram 2006; Kube and
Puppe 2009). Three related studies analyzed the effects of democratic choice on cooperation and
public goods provision. Hamman, Weber and Woon (2011) find higher public goods provision
when contribution decisions are democratically delegated rather than decentralized. Hamman
et al. complement our results by focusing on the role of elections in selecting pro-social repre-
sentatives. The experiments by Dal Bo, Foster and Putterman (2010) suggest that the impact
of a given rule depends on whether it was democratically chosen or exogenously imposed on the
subjects through another mechanism. Olken (2010) conducted a field experiment in Indonesia
to study the causal effects of direct democratic participation in local development programs. He
found that direct participation in the political decision making process increased satisfaction
and the perceived legitimacy of the program. We complement these studies by showing that
democratic elections and higher electoral support can increase the leaders’ benevolence.
Finally, a recent strand of experiments analyzed the behavioral implications of leadership
(e.g. Hermalin 1998; De Cremer and van Knippenberg 2005; Guth et al. 2007; Glockner and
Normann 2011; Gachter and Sefton N.d.). Leadership in existing experiments is typically
assigned exogenously (i.e. randomly). Our results suggest that leaders may behave differently
if they have to compete for leadership rather than if their role is exogenously assigned (see
also Brandts, Guth and Stiehler 2006; Brandts, Cooper and Weber 2011), particularly when
competition promotes promise making.
Experimental Design
We conducted laboratory experiments to study democratic elections under controlled condi-
tions. The experiments were conducted at the University of Bonn (BonnEconLab). Subjects
5
were randomly recruited from the BonnEconLab general subject pool, which consisted of ap-
proximately 3000 students from all disciplines and and from various stages in their studies;
psychology students were excluded.6 We ran five sessions with a total of 210 subjects. This
resulted in 10 independent constituencies for each of the three treatments. Each constituency
consisted of seven participants, who were randomly divided into two candidates (A and B) and
an electorate of five voters.
Subjects made their decisions on the computer screen using the z-tree interface (Fischbacher
2007). Every computer was located in a private booth ensuring that the participants interacted
anonymously with each other. This high degree of anonymity was required in order to rule
out any reputational concerns among the participants. At the beginning of the experiment,
all subjects received written instructions explaining the different stages of the game and the
payoffs (see the Supporting Information for sample instructions). After participants had read
the instructions, they answered control questions, ensuring that everyone understood the game.
All earnings were computed in tokens and converted into cash using an exchange rate of e4
per 100 tokens at the end of the experiment. Subjects received an additional show-up-fee of
e4 for their participation. The entire experiment lasted approximately 40 minutes.
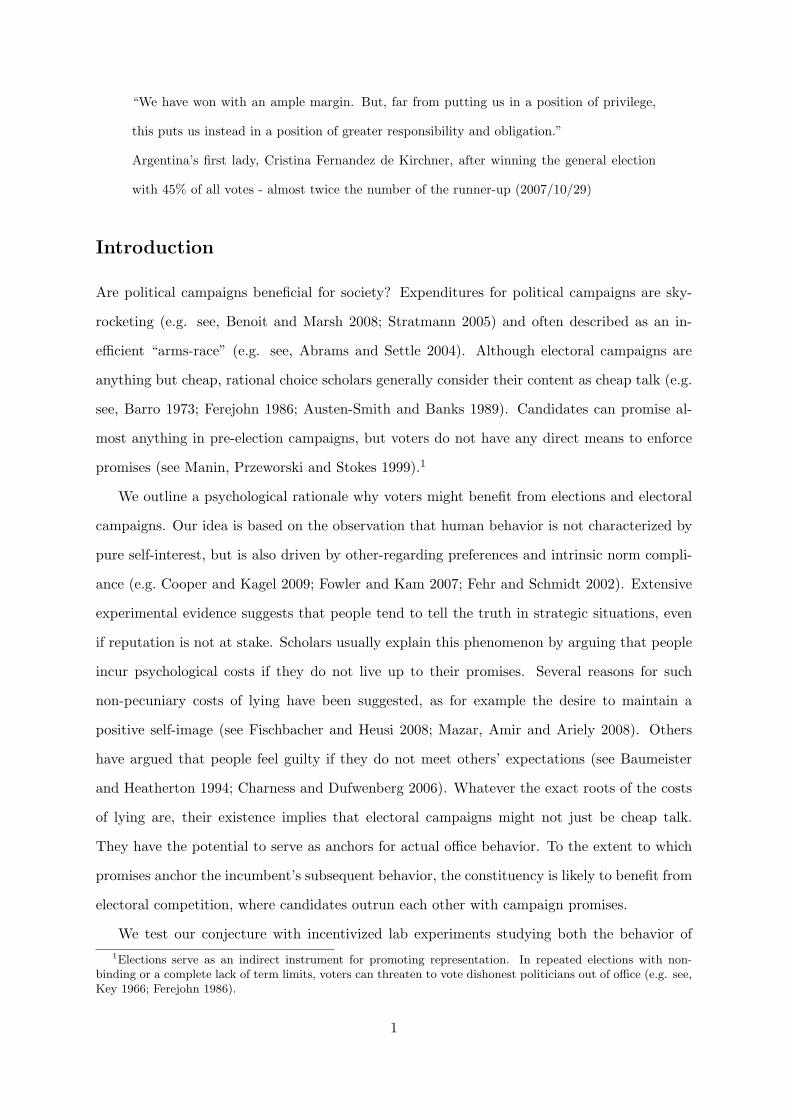
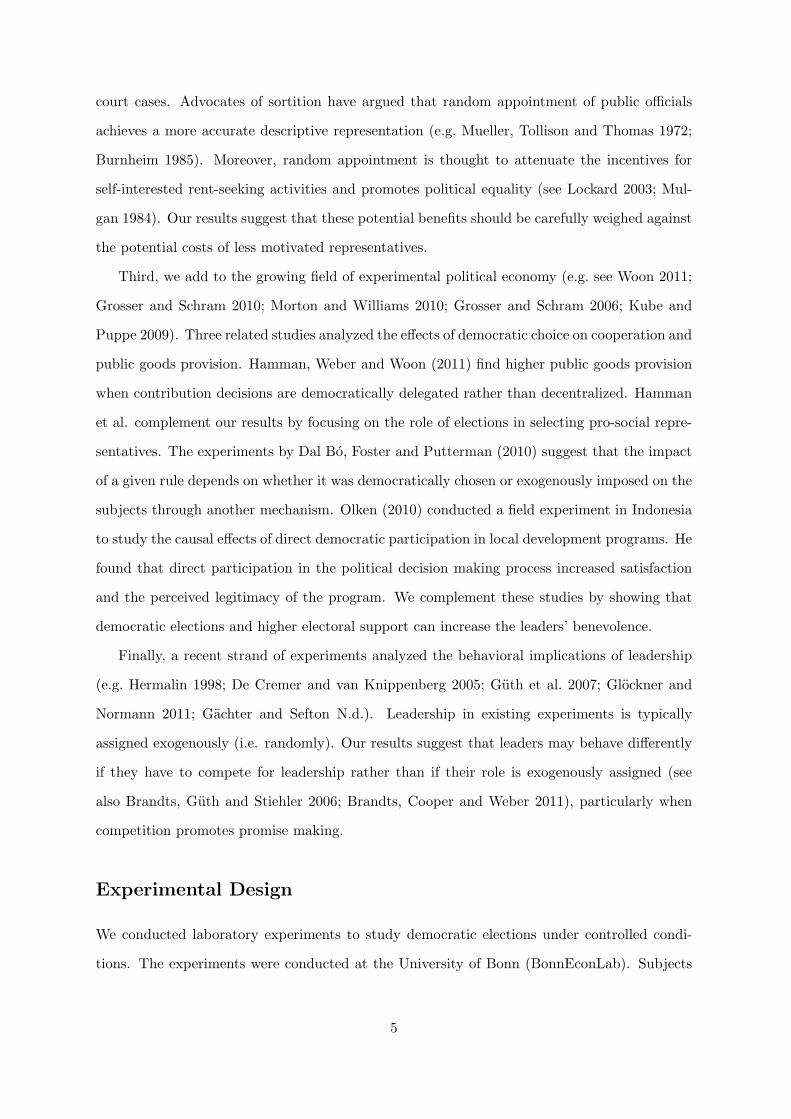
The benchmark treatment “Election” consisted of the following five stages (see Figure 1):
Figure 1: Timeline: Treatment Election
Group of seven subjects is randomly divided into two candidates and five voters
Political campaign
Voting (result is only announced in stage 5)
Distribution
Elicitation of beliefs
Realization
Stage)0( )1( )2( )3( )4( )5(
Stage 1 Campaigns: In the first stage, candidates pursued their electoral campaigns.
Campaigns were non-binding and consisted of two parts. In the compulsory part, candidates
promised citizens how many tokens (between 0 and the maximum budget of 450 tokens) they
would distribute equally among the citizens. In addition, candidates had the option of sending a
text message (up to 300 characters) to the electorate. Both candidates pursued their campaigns
6Table 5 in the Appendix reports the background characteristics of our subjects.
6
simultaneously and their campaigns were not revealed to the opponent.
Stage 2 Voting: Each citizen voted for one of the two candidates in the second stage.
The winner was determined by majority rule, received a fixed payment of 30 tokens, and was
entrusted with a discretionary budget of 450 tokens. The outcome of the election was only
announced later on, in Stage 5 of the game.
Stage 3 Distribution: Before the candidates knew the outcome of the election, they
decided how many tokens they would actually distribute, conditional on winning the election
with 60, 80, or 100 percent of votes.7 This design feature made it possible to analyze the
behavior of both winners and losers, therefore circumventing a potential selection bias from
citizens electing the more benevolent candidates.
Stage 4 Belief elicitation: In stage four, citizens had to guess how many tokens each
candidate would distribute, and each candidate guessed (conditional on the outcome of the
election) the average amount citizens expect her to distribute. In order to elicit beliefs in an
incentive-compatible way, we rewarded correct beliefs with 10 tokens. The reward was reduced
by one token for each unit that the stated belief differed from the actual value, down to a
minimum of zero tokens.8
Stage 5 Payoff realization: The winner of the election was announced in the final stage
and, depending on the actual approval rate and the choices made in stage 3, the payoffs were
realized.
Every participant played this election game only once, and their identities were not revealed
at any point in time. This allowed us to rule out reputational concerns and to test whether
elections confer benefits beyond their functions as a sanctioning and selection device in repeated
settings.
We conducted two additional treatments. Treatment “Random” was identical to treatment
Election, except that the electoral outcome was randomly determined by the experimenter us-
ing a large die visible for everyone. This was common knowledge among all participants.9 This
7This approach of eliciting conditional responses is frequently used in the experimental literature and iscalled the “strategy method” (see Selten 1967). From a game-theoretic perspective, the strategy method doesnot differ from eliciting direct (i.e. unconditional) responses. Brandts and Charness (2000) surveyed experimentscomparing behavior using the strategy and the direct response method. They find no qualitative differences inbehavior. Moreover, since we applied the strategy method to all of our treatments, it should not have any impacton differences between treatments.
8We report our analysis of second-order beliefs in the Supporting Information.9The rules of the game were transparent to all participants, and the experiment did not involve any form of
deception.
7
procedure eliminated electoral competition and the rationale for making generous promises.
In the second treatment, “NoCampaign”, citizens voted for their candidates as in treatment
Election, but candidates were not allowed to run electoral campaigns. Together, our three treat-
ments allow us to identify the causal effect of candidates’ promises and electoral competition
on the representatives’ behavior.10
Framework and Hypotheses
In this section, we provide a simple formal framework of electoral competition and campaign
promises, where voters are uninformed about the candidates’ honesty. Recent theoretical ap-
proaches, analyzing the influence of costs of lying in models of spatial electoral competition,
inspired our framework (Banks 1990; Callander and Wilkie 2007; Callander 2008; Kartik and
McAfee 2007). Our framework departs from these models in two dimensions. First, we as-
sume that costs of lying increase with approval. The rationale behind this assumption is that
approval rates reflect voters’ expectations. As highlighted in our opening quote by Cristina
Fernandez de Kirchner, voters’ expectations can increase feelings of obligation and guilt in
elected representatives (see also Baumeister and Heatherton 1994; Charness and Dufwenberg
2006 for a discussion about the relationship between feelings of guilt and expectation). Second,
rather than assuming that the preferences of candidates and voters are distributed over a policy
space, we model a situation in which the interests of politicians and voters are unambiguously
in conflict.
Following our experimental design, we assume that two candidates i (where i = A,B),
compete for office in a one-shot election with an odd, finite number of voters, n ≥ 3.11 Both
candidates simultaneously make their promises, Pi, in the first stage of the game. Voters then
cast their vote for their preferred candidate. Let us indicate the number of votes for the winner
with k and the simple majority with m = n+12 . Conditional on the realized approval rate,
kn ≥ m
n = n+12n , the elected candidate chooses how much money Si she actually distributes in
10We ran an additional classroom experiment to classify the text messages candidates sent in treatmentsElection and Random, following Houser and Xiao (2011). We recruited 59 students uninvolved in the experimentsabove. After providing the verbal instructions for the original experiment, we gave students a list containing thecandidates’ messages and asked them to classify each message as a “statement of intent or promise” or “emptytalk”. At the end of the classroom experiment, 10 participants were randomly selected and paid according tothe following: they earned two euros for each message they classified in the same way as the majority of theother students. Our results remain unchanged if we control for the type of text messages candidates sent. Theadditional results are available upon request.
11We refer to male voters and female candidates.
8
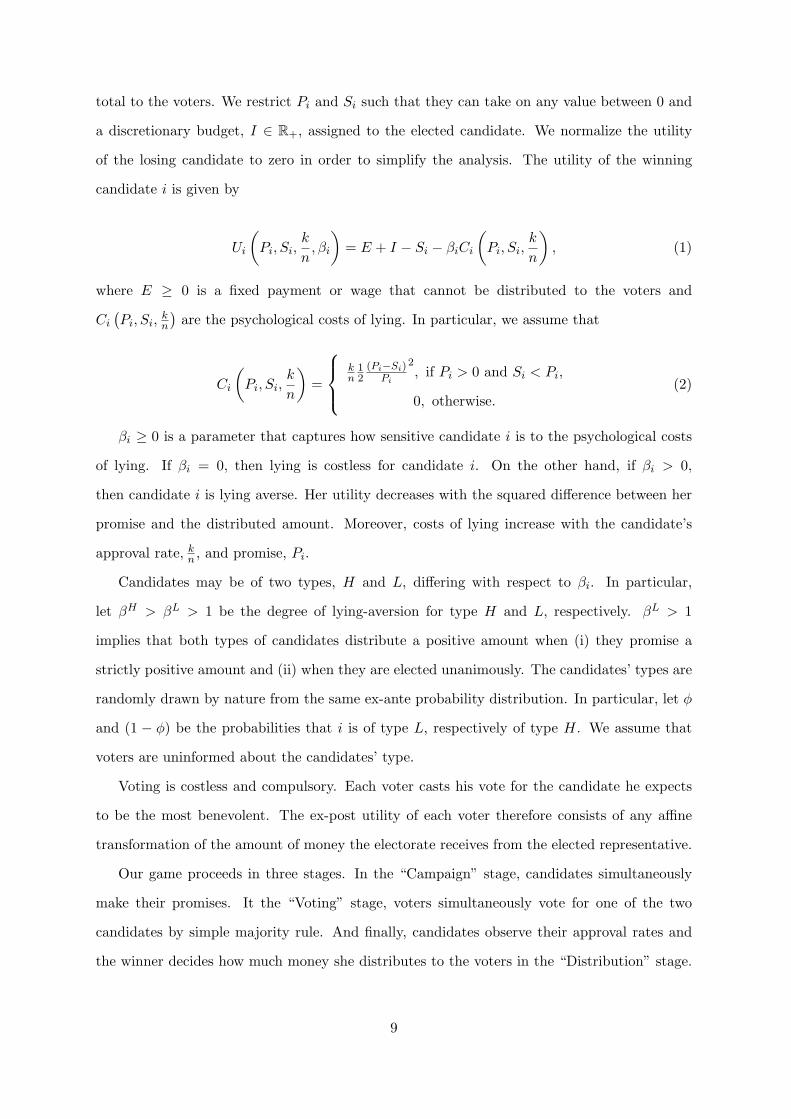
total to the voters. We restrict Pi and Si such that they can take on any value between 0 and
a discretionary budget, I ∈ R+, assigned to the elected candidate. We normalize the utility
of the losing candidate to zero in order to simplify the analysis. The utility of the winning
candidate i is given by
Ui
(Pi, Si,
k
n, βi
)= E + I − Si − βiCi
(Pi, Si,
k
n
), (1)
where E ≥ 0 is a fixed payment or wage that cannot be distributed to the voters and
Ci
(Pi, Si,
kn
)are the psychological costs of lying. In particular, we assume that
Ci
(Pi, Si,
k
n
)=
kn12(Pi−Si)
Pi
2, if Pi > 0 and Si < Pi,
0, otherwise.(2)
βi ≥ 0 is a parameter that captures how sensitive candidate i is to the psychological costs
of lying. If βi = 0, then lying is costless for candidate i. On the other hand, if βi > 0,
then candidate i is lying averse. Her utility decreases with the squared difference between her
promise and the distributed amount. Moreover, costs of lying increase with the candidate’s
approval rate, kn , and promise, Pi.
Candidates may be of two types, H and L, differing with respect to βi. In particular,
let βH > βL > 1 be the degree of lying-aversion for type H and L, respectively. βL > 1
implies that both types of candidates distribute a positive amount when (i) they promise a
strictly positive amount and (ii) when they are elected unanimously. The candidates’ types are
randomly drawn by nature from the same ex-ante probability distribution. In particular, let ϕ
and (1 − ϕ) be the probabilities that i is of type L, respectively of type H. We assume that
voters are uninformed about the candidates’ type.
Voting is costless and compulsory. Each voter casts his vote for the candidate he expects
to be the most benevolent. The ex-post utility of each voter therefore consists of any affine
transformation of the amount of money the electorate receives from the elected representative.
Our game proceeds in three stages. In the “Campaign” stage, candidates simultaneously
make their promises. It the “Voting” stage, voters simultaneously vote for one of the two
candidates by simple majority rule. And finally, candidates observe their approval rates and
the winner decides how much money she distributes to the voters in the “Distribution” stage.
9
We focus on Perfect Bayesian equilibria where voters do not play weakly dominated strategy.12
In equilibrium, the model produces the following testable predictions (formal statements
and proofs in the appendix):
H1. Candidates promise to be more benevolent when they face electoral competition than
when they are randomly appointed.
H2. The candidates’ promises influence voting behavior.
H3. Voters are better off when candidates are democratically elected rather than when
leaders are randomly selected.
H4. The larger candidates’ promises and the higher their approval rates, the more benev-
olent are the elected candidates.
We derive these predictions solving the election game using backward induction. When lying
is costly, candidates tend to keep their promises. Voters anticipate that candidates partially
fulfill their pledges and are therefore more likely to cast their vote for the candidate who
promises more. In competitive democratic elections, candidates use higher promises to attract
more votes. Taken together, these considerations imply that voters are better off when their
representatives are democratically elected rather than appointed exogenously.
Experimental Results
Our results are presented in three steps. First, we analyze the impact of electoral competition
on campaign promises. We then test whether voters consider promises to be cheap talk, and
whether electoral outcomes reflect voters’ expectations. Finally, we investigate the extent to
which electoral competition and campaigns affect the behavior of office holders.
Campaigns
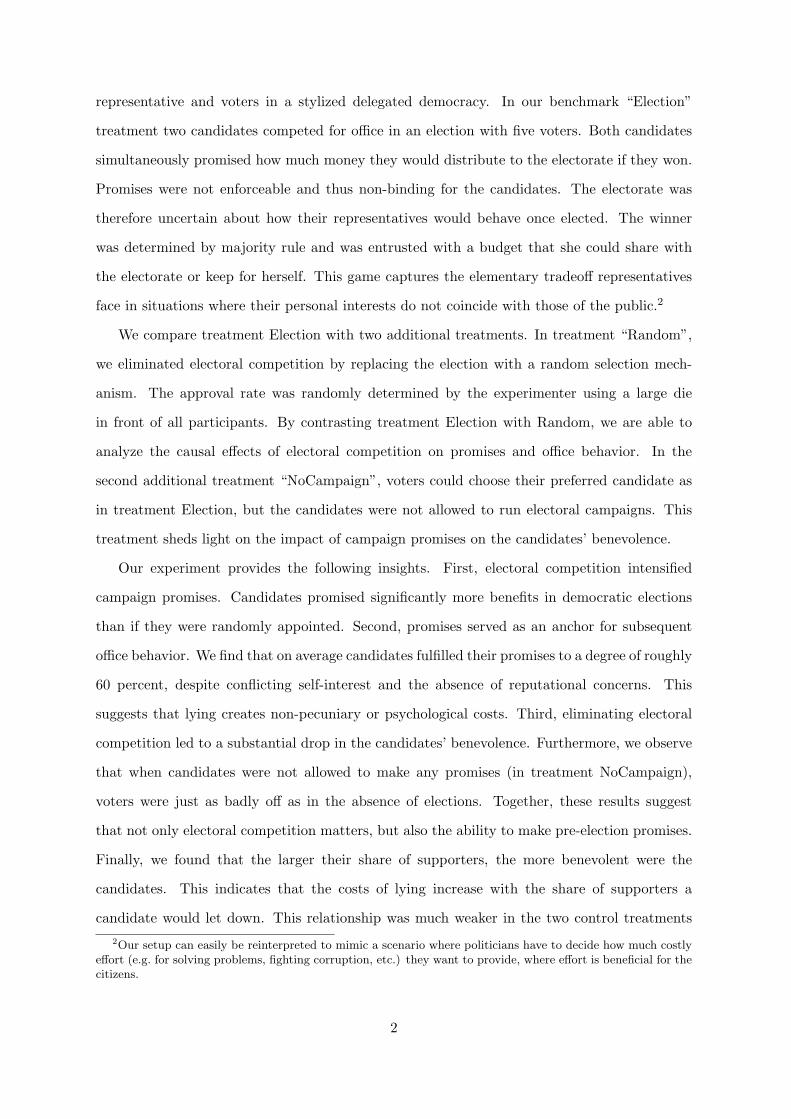
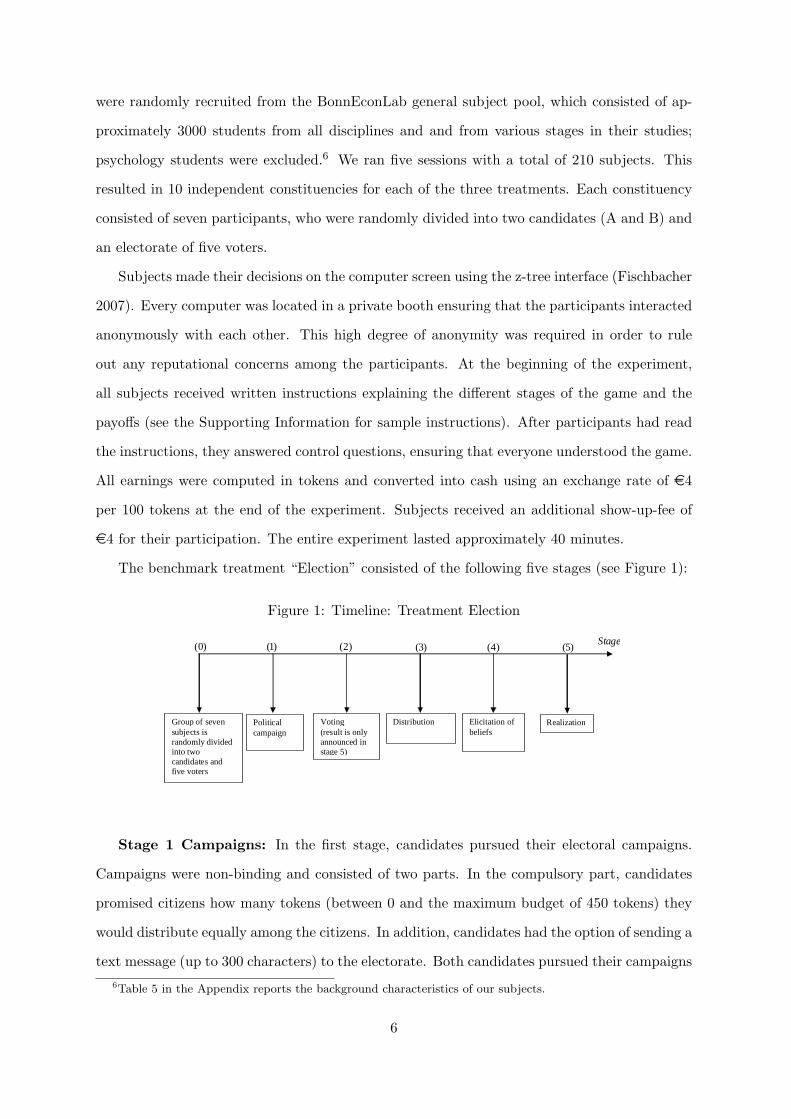
Figure 2 shows kernel density estimates for the amount of money the candidates promised, de-
pending on whether they were democratically elected (Election) or appointed by lot (Random).
While candidates frequently promised low amounts of money in treatment Random, most
promises in treatment Election were in the top range of the available budget. In comparison
with treatment Random, promises in Election were on average twice as high (165 versus 325
12As shown in the Appendix, this assumption rules out unintuitive equilibria where voters prefer candidateswho promise and distribute zero rather than candidates who promise and distribute strictly positive amounts.
10
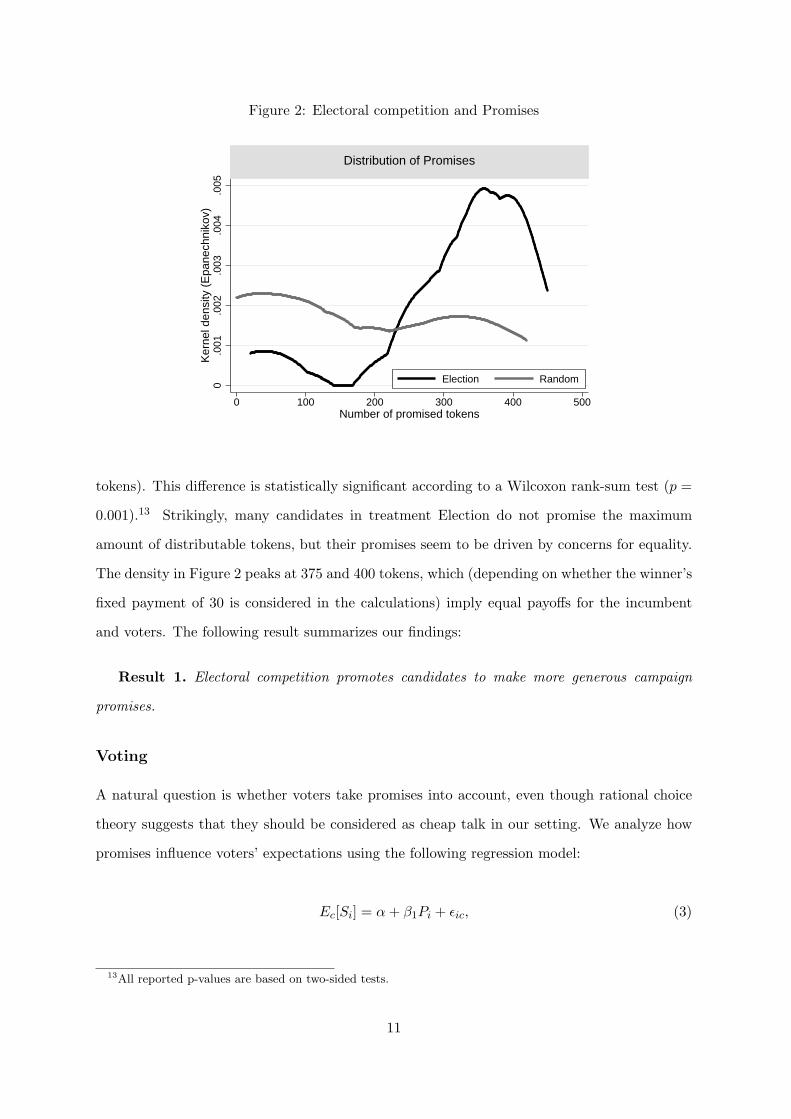
Figure 2: Electoral competition and Promises
0.0
01.0
02.0
03.0
04.0
05K
erne
l den
sity
(E
pane
chni
kov)
0 100 200 300 400 500Number of promised tokens
Election Random
Distribution of Promises
tokens). This difference is statistically significant according to a Wilcoxon rank-sum test (p =
0.001).13 Strikingly, many candidates in treatment Election do not promise the maximum
amount of distributable tokens, but their promises seem to be driven by concerns for equality.
The density in Figure 2 peaks at 375 and 400 tokens, which (depending on whether the winner’s
fixed payment of 30 is considered in the calculations) imply equal payoffs for the incumbent
and voters. The following result summarizes our findings:
Result 1. Electoral competition promotes candidates to make more generous campaign
promises.
Voting
A natural question is whether voters take promises into account, even though rational choice
theory suggests that they should be considered as cheap talk in our setting. We analyze how
promises influence voters’ expectations using the following regression model:
Ec[Si] = α+ β1Pi + ϵic, (3)
13All reported p-values are based on two-sided tests.
11
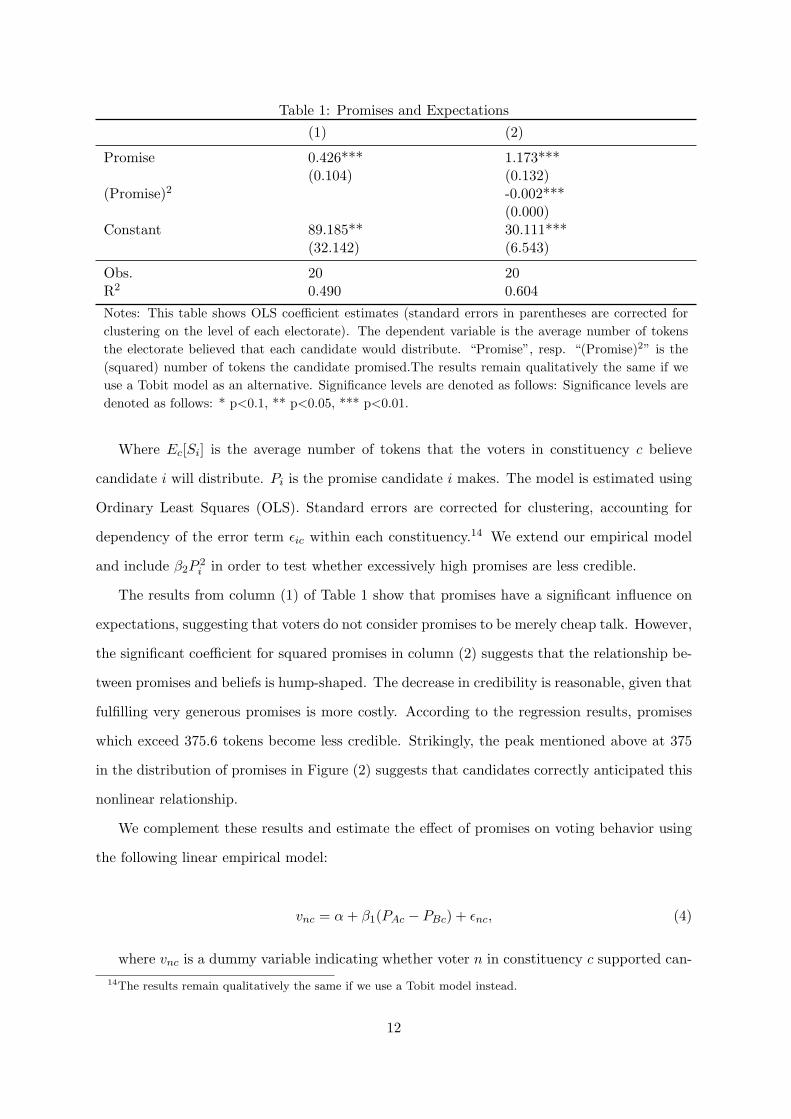
Table 1: Promises and Expectations
(1) (2)
Promise 0.426*** 1.173***(0.104) (0.132)
(Promise)2 -0.002***(0.000)
Constant 89.185** 30.111***(32.142) (6.543)
Obs. 20 20R2 0.490 0.604
Notes: This table shows OLS coefficient estimates (standard errors in parentheses are corrected for
clustering on the level of each electorate). The dependent variable is the average number of tokens
the electorate believed that each candidate would distribute. “Promise”, resp. “(Promise)2” is the
(squared) number of tokens the candidate promised.The results remain qualitatively the same if we
use a Tobit model as an alternative. Significance levels are denoted as follows: Significance levels are
denoted as follows: * p<0.1, ** p<0.05, *** p<0.01.
Where Ec[Si] is the average number of tokens that the voters in constituency c believe
candidate i will distribute. Pi is the promise candidate i makes. The model is estimated using
Ordinary Least Squares (OLS). Standard errors are corrected for clustering, accounting for
dependency of the error term ϵic within each constituency.14 We extend our empirical model
and include β2P2i in order to test whether excessively high promises are less credible.
The results from column (1) of Table 1 show that promises have a significant influence on
expectations, suggesting that voters do not consider promises to be merely cheap talk. However,
the significant coefficient for squared promises in column (2) suggests that the relationship be-
tween promises and beliefs is hump-shaped. The decrease in credibility is reasonable, given that
fulfilling very generous promises is more costly. According to the regression results, promises
which exceed 375.6 tokens become less credible. Strikingly, the peak mentioned above at 375
in the distribution of promises in Figure (2) suggests that candidates correctly anticipated this
nonlinear relationship.
We complement these results and estimate the effect of promises on voting behavior using
the following linear empirical model:
vnc = α+ β1(PAc − PBc) + ϵnc, (4)
where vnc is a dummy variable indicating whether voter n in constituency c supported can-
14The results remain qualitatively the same if we use a Tobit model instead.
12
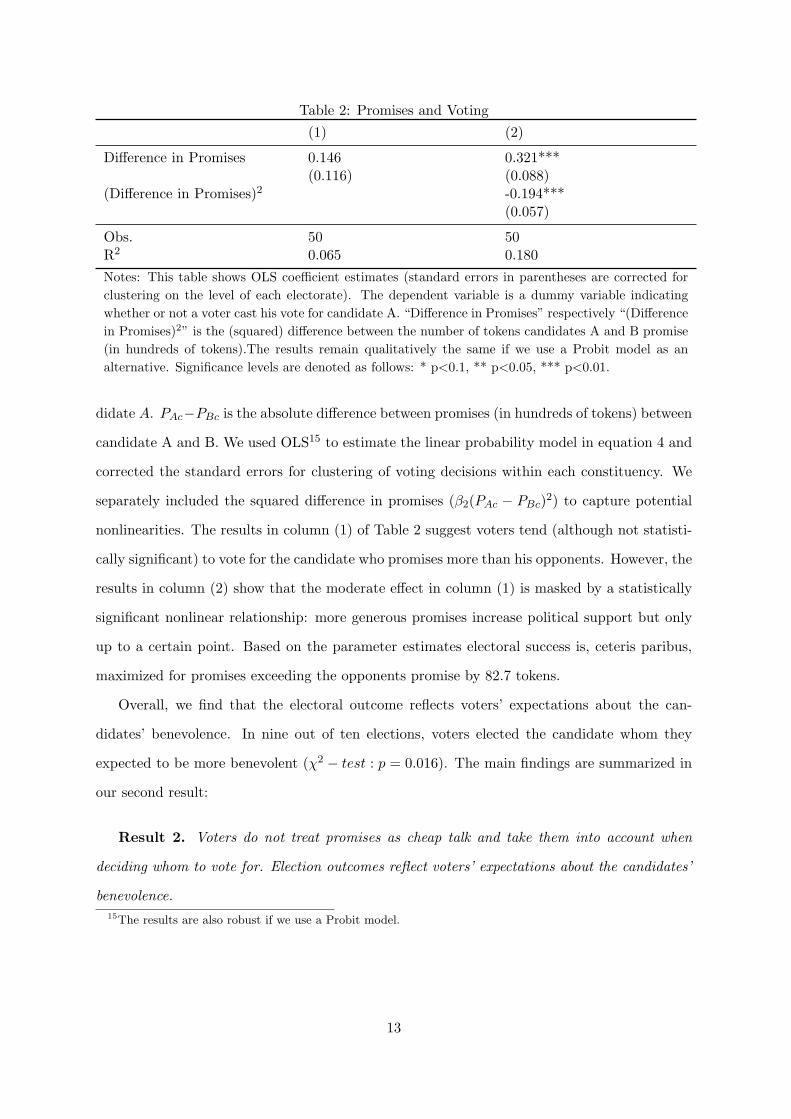
Table 2: Promises and Voting
(1) (2)
Difference in Promises 0.146 0.321***(0.116) (0.088)
(Difference in Promises)2 -0.194***(0.057)
Obs. 50 50R2 0.065 0.180
Notes: This table shows OLS coefficient estimates (standard errors in parentheses are corrected for
clustering on the level of each electorate). The dependent variable is a dummy variable indicating
whether or not a voter cast his vote for candidate A. “Difference in Promises” respectively “(Difference
in Promises)2” is the (squared) difference between the number of tokens candidates A and B promise
(in hundreds of tokens).The results remain qualitatively the same if we use a Probit model as an
alternative. Significance levels are denoted as follows: * p<0.1, ** p<0.05, *** p<0.01.
didate A. PAc−PBc is the absolute difference between promises (in hundreds of tokens) between
candidate A and B. We used OLS15 to estimate the linear probability model in equation 4 and
corrected the standard errors for clustering of voting decisions within each constituency. We
separately included the squared difference in promises (β2(PAc − PBc)2) to capture potential
nonlinearities. The results in column (1) of Table 2 suggest voters tend (although not statisti-
cally significant) to vote for the candidate who promises more than his opponents. However, the
results in column (2) show that the moderate effect in column (1) is masked by a statistically
significant nonlinear relationship: more generous promises increase political support but only
up to a certain point. Based on the parameter estimates electoral success is, ceteris paribus,
maximized for promises exceeding the opponents promise by 82.7 tokens.
Overall, we find that the electoral outcome reflects voters’ expectations about the can-
didates’ benevolence. In nine out of ten elections, voters elected the candidate whom they
expected to be more benevolent (χ2 − test : p = 0.016). The main findings are summarized in
our second result:
Result 2. Voters do not treat promises as cheap talk and take them into account when
deciding whom to vote for. Election outcomes reflect voters’ expectations about the candidates’
benevolence.
15The results are also robust if we use a Probit model.
13
Benevolence of Representatives
We have shown that candidates promise more if they face electoral competition rather than
if they are randomly appointed. But do candidates live up to their promises? We answer
this question by creating a measure of promise fulfillment. Our measure consists of the ratio
between the actual number of distributed tokens and the candidate’s promise.16 On average,
we find relatively high levels of pledge fulfillment in treatment Election (59.8% with a 95%
confidence interval of: 43.8%, 75.7%) as well as in Random (63.4% with a 95% confidence
interval of: 42.8%, 84.0%). Strikingly, these rates of pledge fulfillment are comparable with the
degree of pledge fulfillment observed in field studies (see Petry 2009).
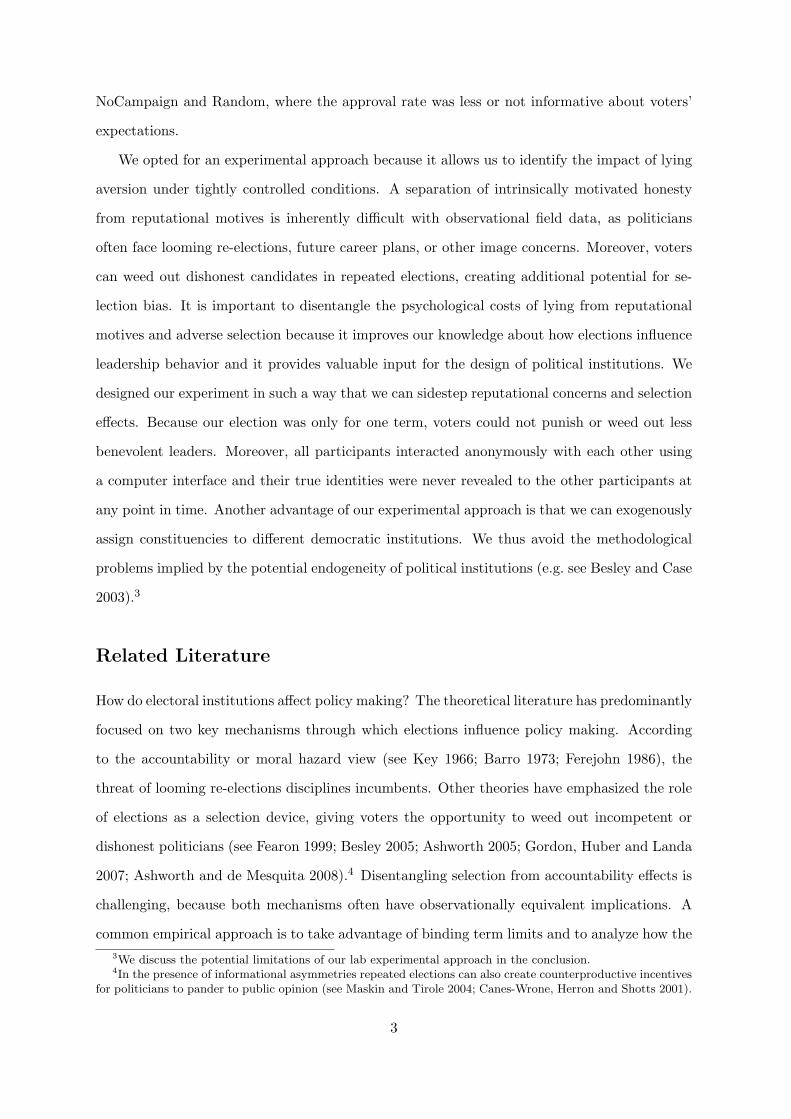
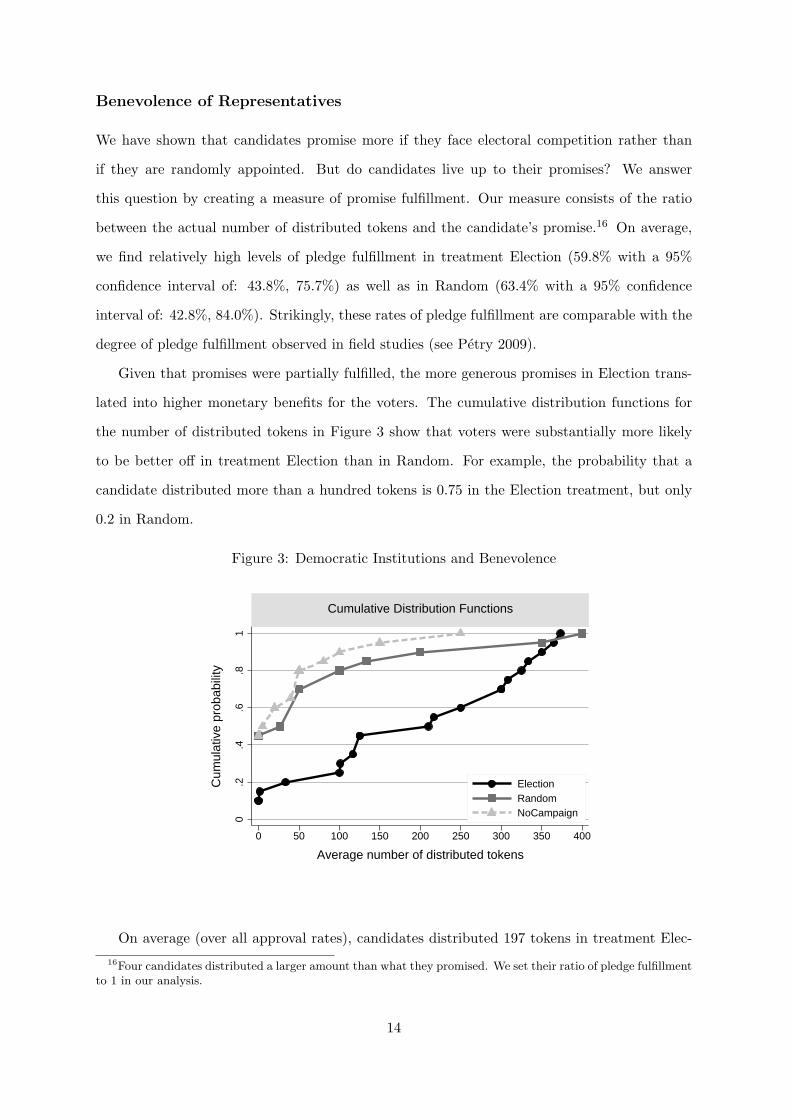
Given that promises were partially fulfilled, the more generous promises in Election trans-
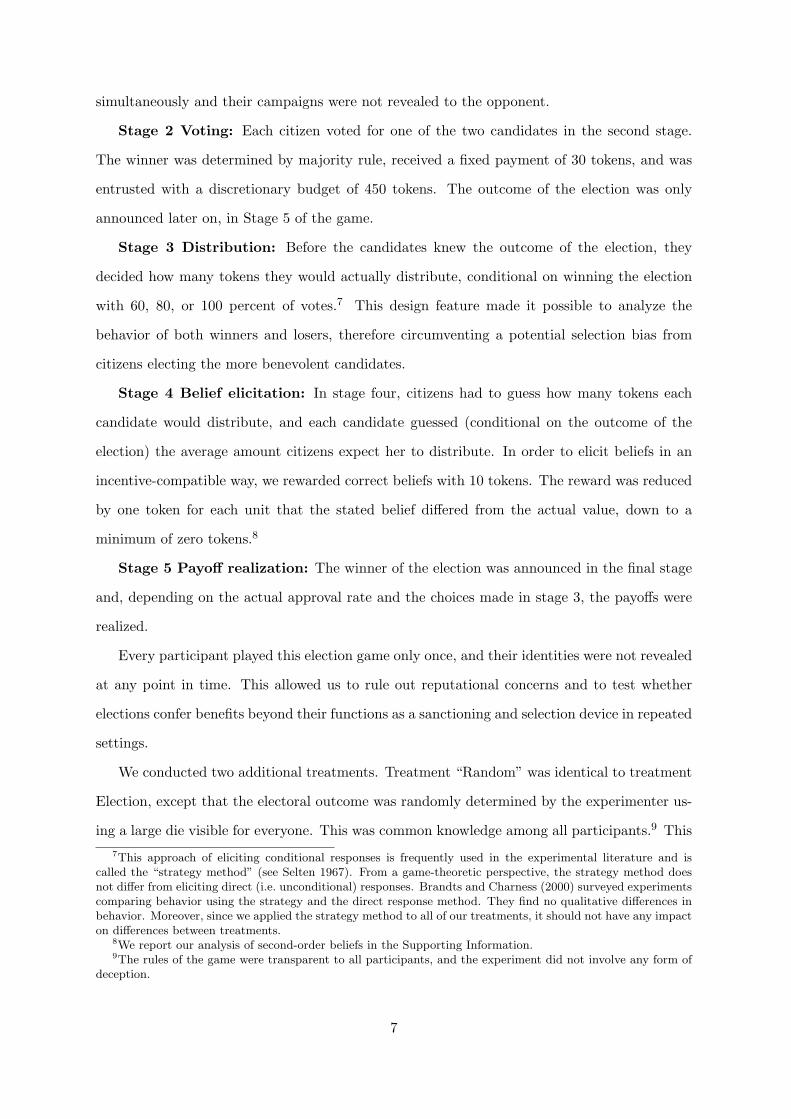
lated into higher monetary benefits for the voters. The cumulative distribution functions for
the number of distributed tokens in Figure 3 show that voters were substantially more likely
to be better off in treatment Election than in Random. For example, the probability that a
candidate distributed more than a hundred tokens is 0.75 in the Election treatment, but only
0.2 in Random.
Figure 3: Democratic Institutions and Benevolence
0.2
.4.6
.81
Cum
ulat
ive
prob
abili
ty
0 50 100 150 200 250 300 350 400
Average number of distributed tokens
ElectionRandomNoCampaign
Cumulative Distribution Functions
On average (over all approval rates), candidates distributed 197 tokens in treatment Elec-
16Four candidates distributed a larger amount than what they promised. We set their ratio of pledge fulfillmentto 1 in our analysis.
14
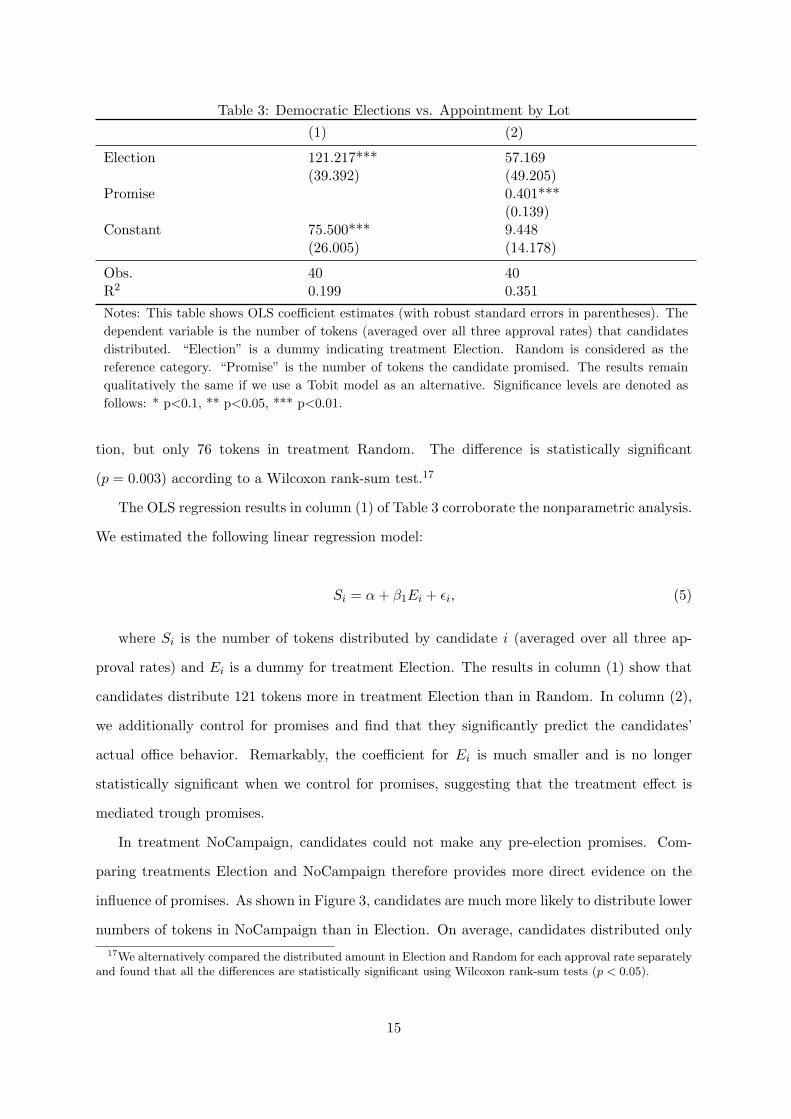
Table 3: Democratic Elections vs. Appointment by Lot
(1) (2)
Election 121.217*** 57.169(39.392) (49.205)
Promise 0.401***(0.139)
Constant 75.500*** 9.448(26.005) (14.178)
Obs. 40 40R2 0.199 0.351
Notes: This table shows OLS coefficient estimates (with robust standard errors in parentheses). The
dependent variable is the number of tokens (averaged over all three approval rates) that candidates
distributed. “Election” is a dummy indicating treatment Election. Random is considered as the
reference category. “Promise” is the number of tokens the candidate promised. The results remain
qualitatively the same if we use a Tobit model as an alternative. Significance levels are denoted as
follows: * p<0.1, ** p<0.05, *** p<0.01.
tion, but only 76 tokens in treatment Random. The difference is statistically significant
(p = 0.003) according to a Wilcoxon rank-sum test.17
The OLS regression results in column (1) of Table 3 corroborate the nonparametric analysis.
We estimated the following linear regression model:
Si = α+ β1Ei + ϵi, (5)
where Si is the number of tokens distributed by candidate i (averaged over all three ap-
proval rates) and Ei is a dummy for treatment Election. The results in column (1) show that
candidates distribute 121 tokens more in treatment Election than in Random. In column (2),
we additionally control for promises and find that they significantly predict the candidates’
actual office behavior. Remarkably, the coefficient for Ei is much smaller and is no longer
statistically significant when we control for promises, suggesting that the treatment effect is
mediated trough promises.
In treatment NoCampaign, candidates could not make any pre-election promises. Com-
paring treatments Election and NoCampaign therefore provides more direct evidence on the
influence of promises. As shown in Figure 3, candidates are much more likely to distribute lower
numbers of tokens in NoCampaign than in Election. On average, candidates distributed only
17We alternatively compared the distributed amount in Election and Random for each approval rate separatelyand found that all the differences are statistically significant using Wilcoxon rank-sum tests (p < 0.05).
15
41 tokens in NoCampaign. This is significantly less than in treatment Election (Kolmogorov-
Smirnov test: p < 0.001). Although candidates distributed slightly more tokens in Random
than in NoCampaign, the difference is statistically insignificant (0.522).18 We summarize these
findings as follows:
Result 3. Representatives behave more benevolently when they are democratically elected
than when they are randomly appointed by lot. The difference seems to be driven by the less
generous promises in the absence of electoral competition. Eliminating the possibility of making
campaign promises leads to a corresponding reduction in the monetary payoff for the electorate.
We have shown that the approval rate in an election is a signal of how much voters trust
the candidates. The psychological costs of disappointing others should therefore increase with
the approval rate in the Election treatment. In contrast, the randomly generated approval rate
in treatment Random contains no information about voters’ expectations. And in the NoCam-
paign treatment, voters have no information about the different candidates, i.e. the voters’
choices can be considered unintentional. We should consequently see a positive correlation
between approval rates and the number of tokens distributed in the Election treatment, but
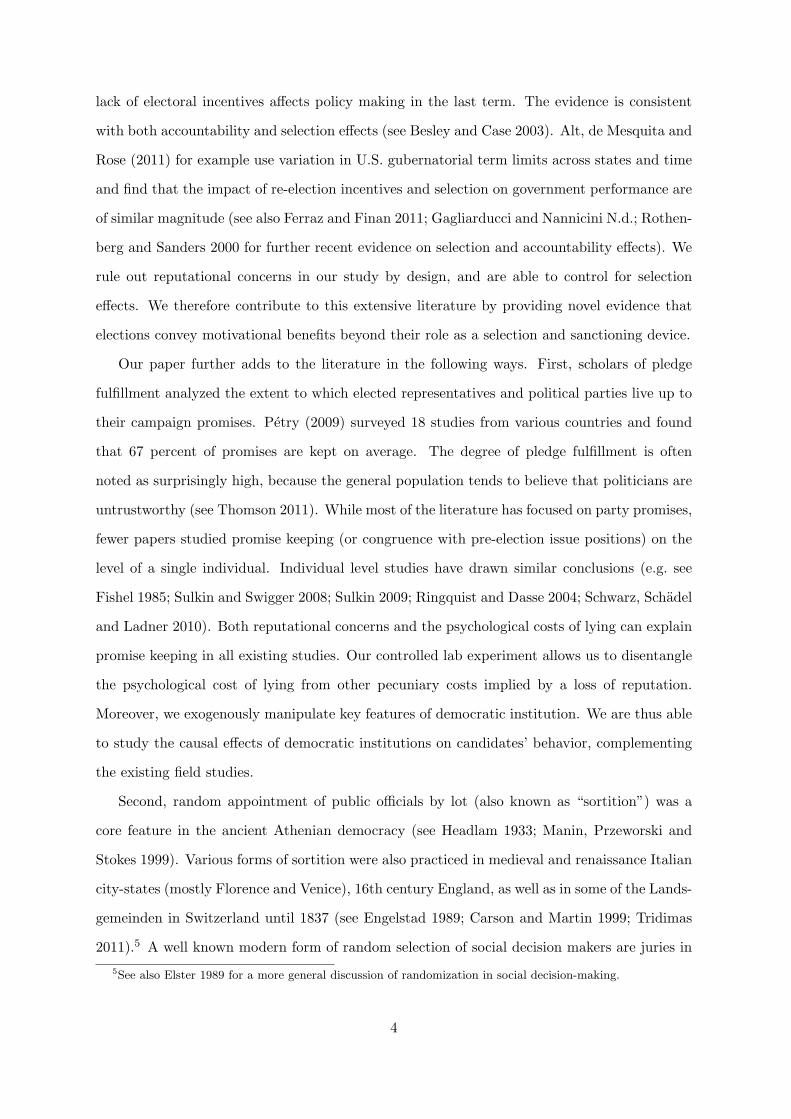
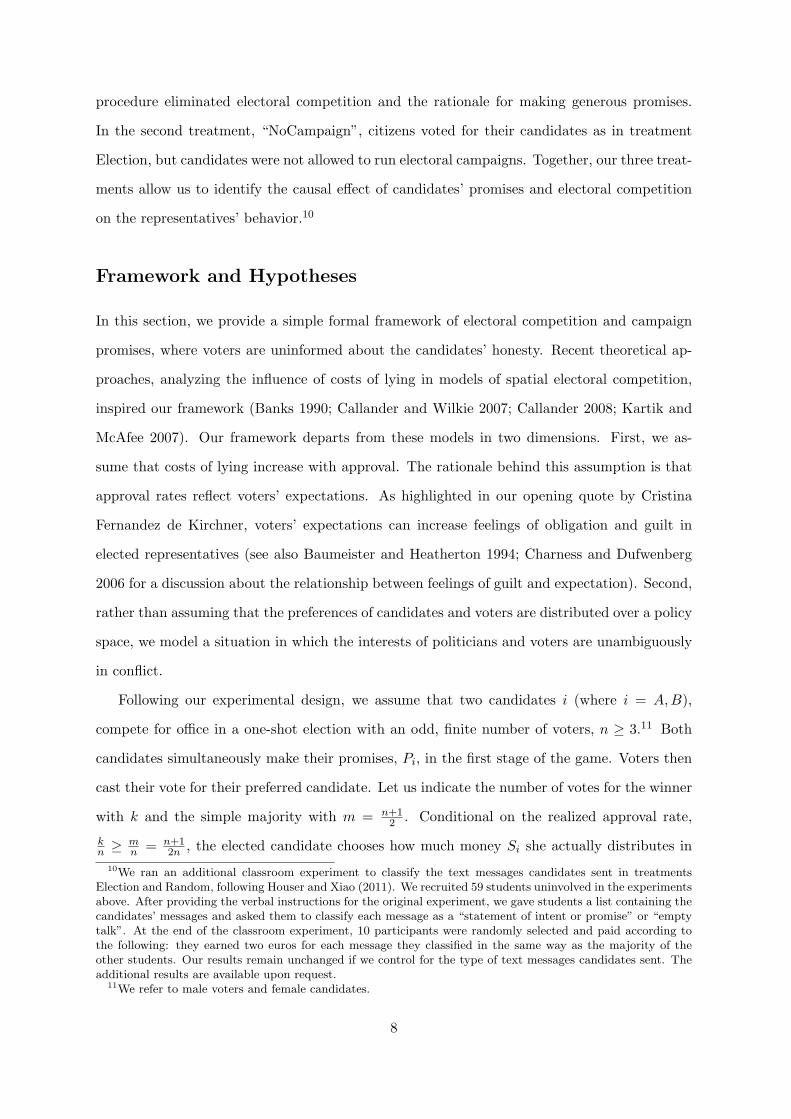
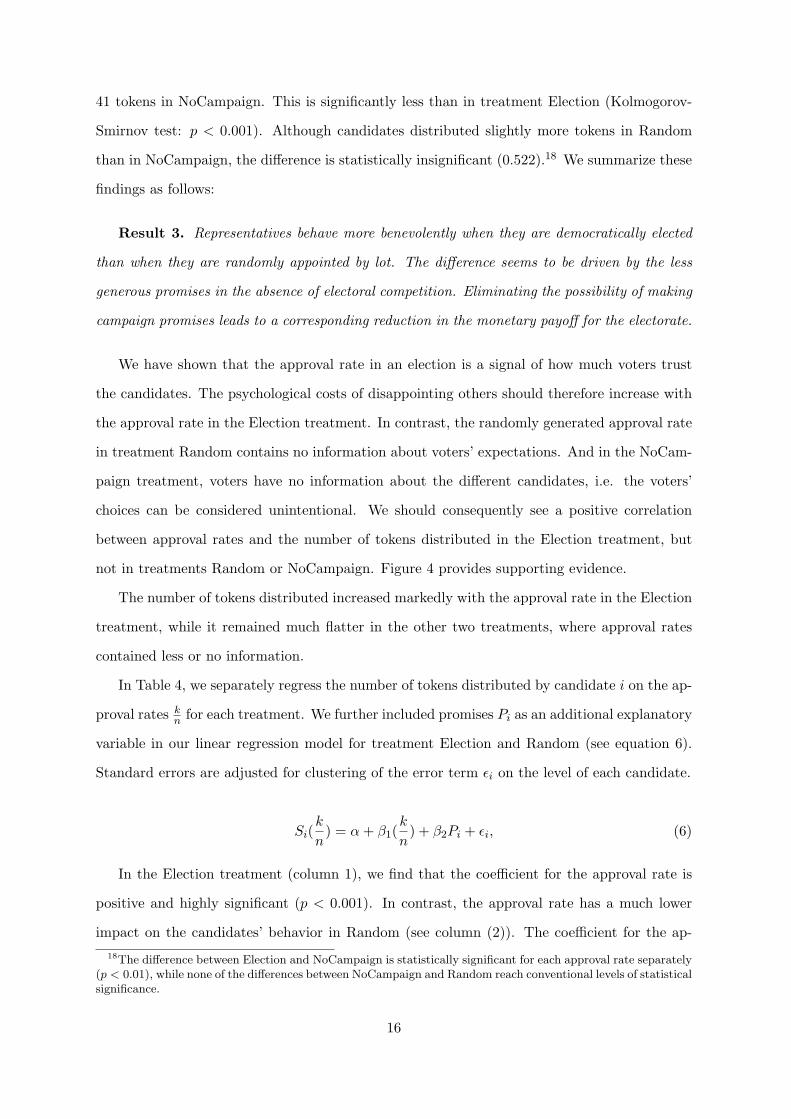
not in treatments Random or NoCampaign. Figure 4 provides supporting evidence.
The number of tokens distributed increased markedly with the approval rate in the Election
treatment, while it remained much flatter in the other two treatments, where approval rates
contained less or no information.
In Table 4, we separately regress the number of tokens distributed by candidate i on the ap-
proval rates kn for each treatment. We further included promises Pi as an additional explanatory
variable in our linear regression model for treatment Election and Random (see equation 6).
Standard errors are adjusted for clustering of the error term ϵi on the level of each candidate.
Si(k
n) = α+ β1(
k
n) + β2Pi + ϵi, (6)
In the Election treatment (column 1), we find that the coefficient for the approval rate is
positive and highly significant (p < 0.001). In contrast, the approval rate has a much lower
impact on the candidates’ behavior in Random (see column (2)). The coefficient for the ap-
18The difference between Election and NoCampaign is statistically significant for each approval rate separately(p < 0.01), while none of the differences between NoCampaign and Random reach conventional levels of statisticalsignificance.
16
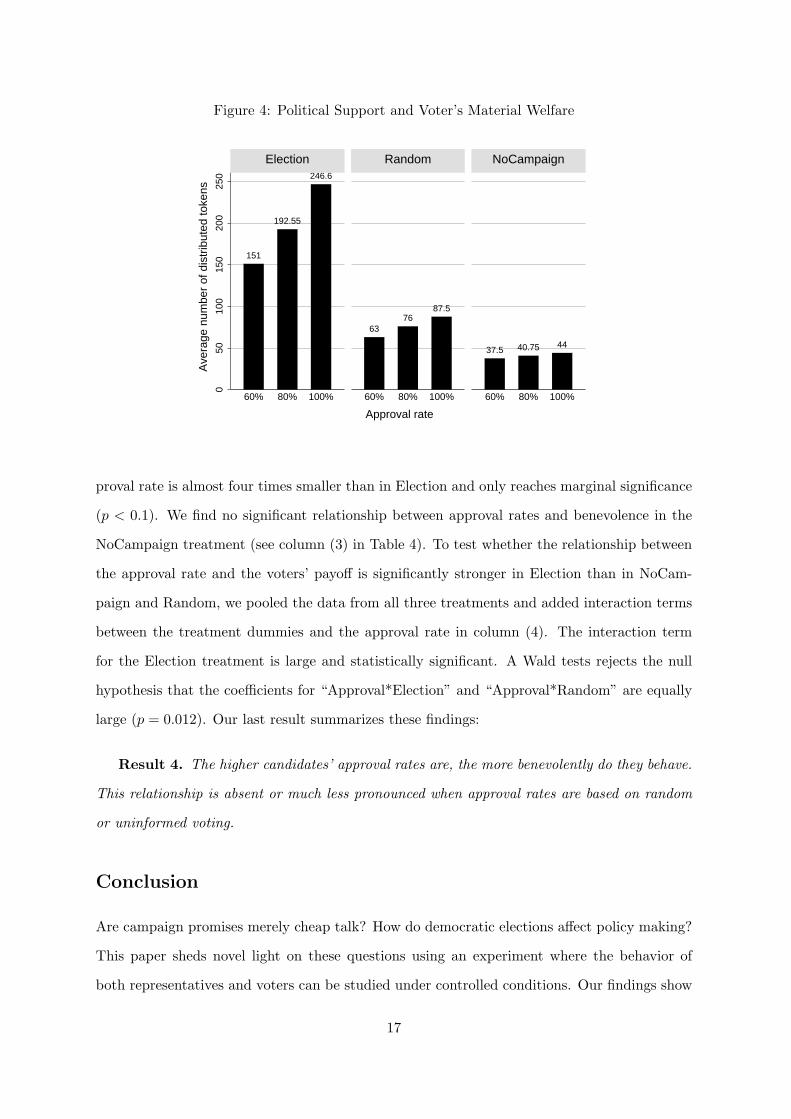
Figure 4: Political Support and Voter’s Material Welfare
151
192.55
246.6
6376
87.5
37.5 40.75 44
050
100
150
200
250
60% 80% 100% 60% 80% 100% 60% 80% 100%
Election Random NoCampaign
Ave
rage
num
ber
of d
istr
ibut
ed to
kens
Approval rate
proval rate is almost four times smaller than in Election and only reaches marginal significance
(p < 0.1). We find no significant relationship between approval rates and benevolence in the
NoCampaign treatment (see column (3) in Table 4). To test whether the relationship between
the approval rate and the voters’ payoff is significantly stronger in Election than in NoCam-
paign and Random, we pooled the data from all three treatments and added interaction terms
between the treatment dummies and the approval rate in column (4). The interaction term
for the Election treatment is large and statistically significant. A Wald tests rejects the null
hypothesis that the coefficients for “Approval*Election” and “Approval*Random” are equally
large (p = 0.012). Our last result summarizes these findings:
Result 4. The higher candidates’ approval rates are, the more benevolently do they behave.
This relationship is absent or much less pronounced when approval rates are based on random
or uninformed voting.
Conclusion
Are campaign promises merely cheap talk? How do democratic elections affect policy making?
This paper sheds novel light on these questions using an experiment where the behavior of
both representatives and voters can be studied under controlled conditions. Our findings show
17
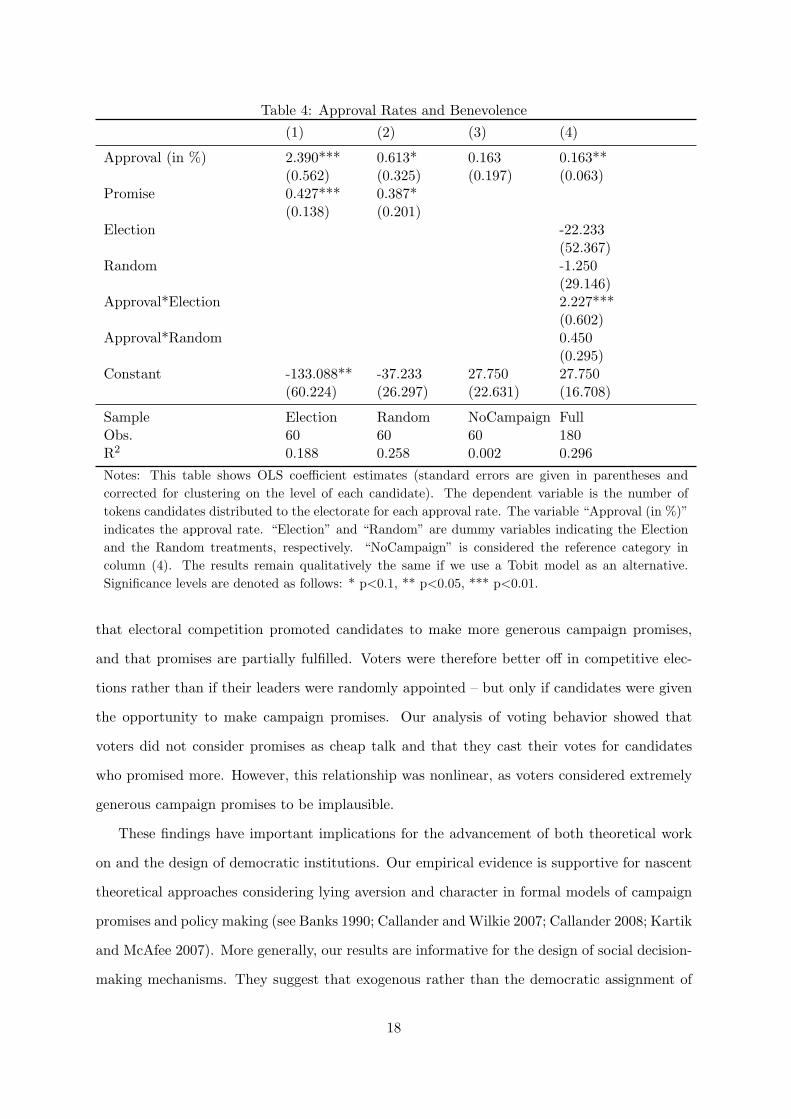
Table 4: Approval Rates and Benevolence
(1) (2) (3) (4)
Approval (in %) 2.390*** 0.613* 0.163 0.163**(0.562) (0.325) (0.197) (0.063)
Promise 0.427*** 0.387*(0.138) (0.201)
Election -22.233(52.367)
Random -1.250(29.146)
Approval*Election 2.227***(0.602)
Approval*Random 0.450(0.295)
Constant -133.088** -37.233 27.750 27.750(60.224) (26.297) (22.631) (16.708)
Sample Election Random NoCampaign FullObs. 60 60 60 180R2 0.188 0.258 0.002 0.296
Notes: This table shows OLS coefficient estimates (standard errors are given in parentheses and
corrected for clustering on the level of each candidate). The dependent variable is the number of
tokens candidates distributed to the electorate for each approval rate. The variable “Approval (in %)”
indicates the approval rate. “Election” and “Random” are dummy variables indicating the Election
and the Random treatments, respectively. “NoCampaign” is considered the reference category in
column (4). The results remain qualitatively the same if we use a Tobit model as an alternative.
Significance levels are denoted as follows: * p<0.1, ** p<0.05, *** p<0.01.
that electoral competition promoted candidates to make more generous campaign promises,
and that promises are partially fulfilled. Voters were therefore better off in competitive elec-
tions rather than if their leaders were randomly appointed – but only if candidates were given
the opportunity to make campaign promises. Our analysis of voting behavior showed that
voters did not consider promises as cheap talk and that they cast their votes for candidates
who promised more. However, this relationship was nonlinear, as voters considered extremely
generous campaign promises to be implausible.
These findings have important implications for the advancement of both theoretical work
on and the design of democratic institutions. Our empirical evidence is supportive for nascent
theoretical approaches considering lying aversion and character in formal models of campaign
promises and policy making (see Banks 1990; Callander andWilkie 2007; Callander 2008; Kartik
and McAfee 2007). More generally, our results are informative for the design of social decision-
making mechanisms. They suggest that exogenous rather than the democratic assignment of
18
decision rights, as in office rotation schemes, for example, might produce unwanted side-effects
due to less intrinsically motivated representatives. Non-pecuniary motivational effects provide
a novel explanation for recent empirical findings showing that elected regulators or judges
behave differently than appointed ones (see Besley and Case 2003).
Although our controlled experiment allows for straightforward causal interpretations, this
approach also entails limitations. For example, in order to properly identify the psychological
cost of lying, we had to impose a higher degree of anonymity than that typically present in
the field. How re-election and image concerns interact with psychological motivations is an
interesting open question. Some experimental evidence suggests that reputational concerns
are complementary and amplify pro-social behavior in social dilemmas (e.g. Brown, Falk and
Fehr 2004). Another potential concern is that our student subject pool is not necessarily
representative for professional politicians. However, the existing evidence comparing students
with non-standard subject pools such as CEOs, public servants, or representative populations
suggests that student samples tend to provide a lower bound for the relevance of pro-social
behavior (see Fehr and List 2004; Alatas et al. 2009; Falk, Meier and Zehnder N.d.; Cappelen
et al. 2011). Moreover, Dawes, Loewen and Fowler (2011) provide evidence suggesting that the
relationship between social preferences and political participation is positive. We believe that
our experiment provides a simple and parsimonious framework that can be further enriched,
opening interesting avenues for future research. For example, one could analyze self-selection by
adding a stage where each participant is given the choice of running for office. Other extensions
include comparing the influence of high and low fixed wages on office holders or modifying the
distribution mechanism such that representatives can discriminate between different types of
voter.
Appendix A: Theoretical Framework
In this appendix, we present the main results of the theoretical framework. We assume that the
utility of candidate i when she promises Pi in the Political Campaign stage, wins the electoral
competition with an approval rate that is equal to kn ≥ m
n = n+12n ,19 and distributes Si to voters
in the Distribution stage is given by:
19k indicates the number of votes for the winner and m = n+12
is the simple majority.
19
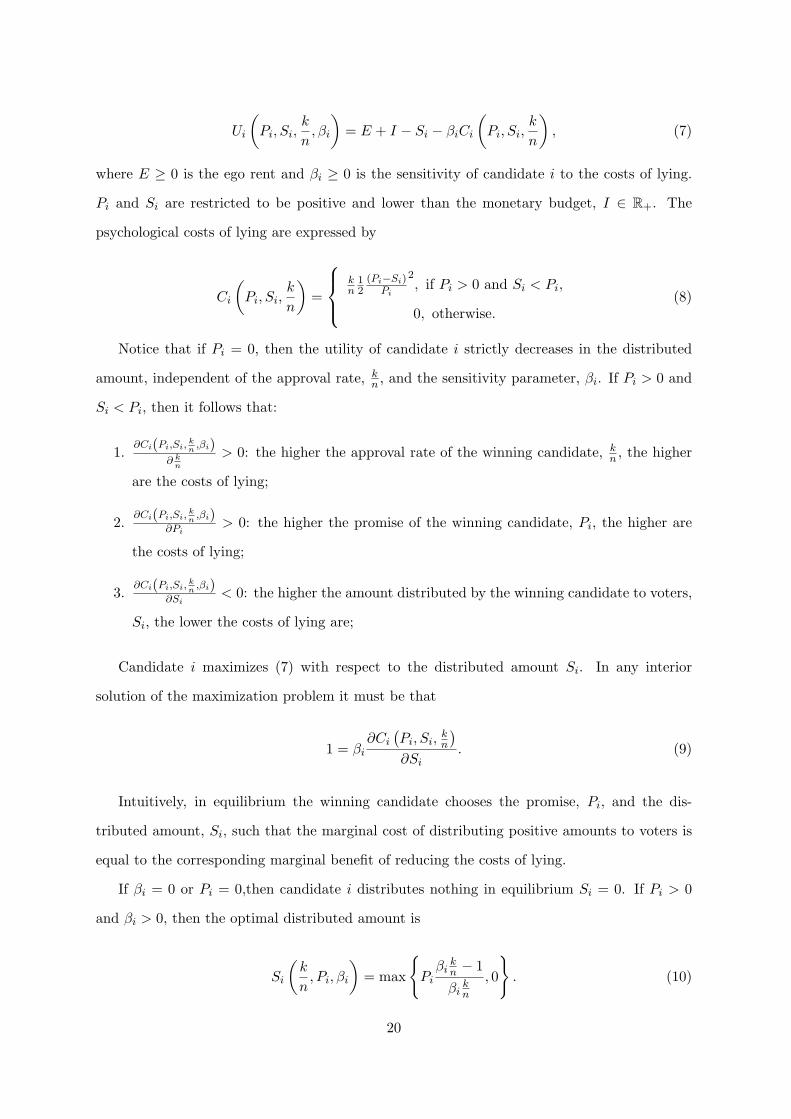
Ui
(Pi, Si,
k
n, βi
)= E + I − Si − βiCi
(Pi, Si,
k
n
), (7)
where E ≥ 0 is the ego rent and βi ≥ 0 is the sensitivity of candidate i to the costs of lying.
Pi and Si are restricted to be positive and lower than the monetary budget, I ∈ R+. The
psychological costs of lying are expressed by
Ci
(Pi, Si,
k
n
)=
kn12(Pi−Si)
Pi
2, if Pi > 0 and Si < Pi,
0, otherwise.(8)
Notice that if Pi = 0, then the utility of candidate i strictly decreases in the distributed
amount, independent of the approval rate, kn , and the sensitivity parameter, βi. If Pi > 0 and
Si < Pi, then it follows that:
1.∂Ci(Pi,Si,
kn,βi)
∂ kn
> 0: the higher the approval rate of the winning candidate, kn , the higher
are the costs of lying;
2.∂Ci(Pi,Si,
kn,βi)
∂Pi> 0: the higher the promise of the winning candidate, Pi, the higher are
the costs of lying;
3.∂Ci(Pi,Si,
kn,βi)
∂Si< 0: the higher the amount distributed by the winning candidate to voters,
Si, the lower the costs of lying are;
Candidate i maximizes (7) with respect to the distributed amount Si. In any interior
solution of the maximization problem it must be that
1 = βi∂Ci
(Pi, Si,
kn
)∂Si
. (9)
Intuitively, in equilibrium the winning candidate chooses the promise, Pi, and the dis-
tributed amount, Si, such that the marginal cost of distributing positive amounts to voters is
equal to the corresponding marginal benefit of reducing the costs of lying.
If βi = 0 or Pi = 0,then candidate i distributes nothing in equilibrium Si = 0. If Pi > 0
and βi > 0, then the optimal distributed amount is
Si
(k
n, Pi, βi
)= max
{Pi
βikn − 1
βikn
, 0
}. (10)
20
Candidates can be of a two types, H and L. The two types of candidates differ in the
magnitude of the sensitivity parameter, namely βH > βL > 1.20 This assumption implies that
both types distribute a positive amount if elected unanimously when they make strictly positive
promises. Let ϕ and (1−ϕ) be the probabilities that i is an L−type and an H−type candidate,
respectively. Without loss of generality, let us assume E = 0. We focus on Perfect Bayesian
equilibria, where voters do not play weakly dominated strategies. The following results define
the four testable predictions presented in the experimental design. The first proposition states
that in electoral competitions, lie-averse candidates use promises strategically to increase their
approval rate.
Proposition 1 In any equilibrium of the electoral game with political campaign, the winning
candidate promises a positive amount in equilibrium.
Proof. Suppose that there is an equilibrium in which both candidates promise nothing and,
therefore, distribute nothing if elected. In this equilibrium, candidate i wins the elections with
a probability that is equal to or less than 12 . If she deviates and promises ε > 0, then, regardless
of her type, she distributes a positive amount when elected unanimously. Hence, voting for the
candidate who promises zero is a weakly dominated strategy. All voters vote for candidate i,
who wins the elections unanimously, k = n. Therefore, deviating is profitable for candidate i if
and only if 12I < I−εβi−1
βi− 1
2βiε which holds as long as ε < I βi
2βi−1 . Finally, suppose that there
exists an equilibrium in which one candidate promises zero, her opponent promises a positive
amount, and the former is elected. This equilibrium contradicts the assumption that voters do
not play weakly dominated strategies.
By proposition 1, candidates make positive promises in the political campaign. By combin-
ing this result with equation (10), it follows that voters receive positive payoffs in equilibrium.
Corollary 2 In any equilibrium of the game with a political campaign, the winning candidate
partially fulfills her promises and distributes a positive amount.
Of course, the elections are beneficial for voters if and only if candidates truly compete
through promises in the political campaign. If either the political campaign stage is removed
or the winner of the elections is randomly selected, then voters’ equilibrium payoff is 0. This
is formally stated in the next proposition.
20We discuss the extension where some candidates are purely selfish later in the text.
21
Proposition 3 If either the winning candidate is randomly appointed or the political campaign
stage is removed from the electoral game, then candidates promise nothing and, in equilibrium,
the winning candidate distributes nothing to voters.
Proof. If the winning candidate is randomly appointed, then the promise made in the political
campaign does not influence the probability of winning the elections and neither candidate
promises anything. Similarly, if the political campaign stage is removed, Pi = 0 for both
i = A,B. Therefore, by equation (10), the winning candidate distributes nothing to voters in
either situation.
Corollary 4 Voters are better off when candidates compete for appointment by making promises
in the political campaign stage.
Now, let us describe a standard pooling equilibrium of the electoral game in which voters
do not play weakly dominated strategies. Regardless of their type, both candidates promise I.
If candidate i is elected with k votes, she distributes Iβi
kn−1
βikn
, with βi = βH if i is an H − type
and βi = βL if i is an L − type. Each voter casts his vote for the candidate who makes the
largest promise, while they vote randomly if both candidates make the same promise. Each
voter assigns a probability of ϕ to i being an H− type candidate when she promises I, while he
assigns a probability of 1 to i being an L− type candidate when she makes any other promise.
In equilibrium, the expected payoff of candidate i is 12
1n−k+1
n∑k=m
I 1βi
kn
> 0.
If she deviates, all voters vote for the other candidate and her payoff is null. When both
candidates promise the same amount, the deviation of a voter is irrelevant. If candidate −i
promises less than I, then deviating and voting for −i reduces voters’ payoffs. Indeed, candidate
i that promises I wins with n − 1 votes and distributes max
{Iβi
n−1n
−1
βin−1n
, 0
}< I βi−1
βi. In the
pooling equilibrium, both candidates make the same promise. However, candidates in our
experiment make different promises and voters vote with higher probability for the candidate
who makes the largest promise. These empirical findings are consistent with our model if
we introduce a natural assumption on voters’ behavior: If both candidates make the same
promise, then each voter casts his vote randomly. This assumption rules out unreasonable
separating equilibria such as a situation in which, regardless of their type, candidate A promises
0 < PA < I, candidate B promises PB = I and all voters vote for candidate A although this
22
is detrimental for their expected payoff. We now turn our attention to separating equilibria in
which candidates make different promises.
Proposition 5 In any symmetric separating equilibrium, each voter votes for the candidate
who makes the largest promise with probability greater than 12 .
Proof. In a symmetric separating equilibrium, an H − type candidate promises PH and an
L−type candidate promises PL, with PH = PL. By contradiction, suppose that voters vote for
the candidate who makes the lowest promise with probability π > 12 . Without loss of generality,
suppose PH > PL. If candidate i is an H − type, she makes the largest promise PH and her
expected payoff is given by:
(1− ϕ)
n∑k=m
n
k
(1− π)n
[I − PH +
1
2βH kn
PH
]+ ϕ
n∑k=m
n
k
1
2n
[I − PH +
1
2βH kn
PH
].
(11)
If candidate i deviates and promises PL, she gets:
(1− ϕ)
n∑k=m
n
k
1
2n
[I − PL +
1
2βL kn
PL
]+ ϕ
n∑k=m
n
k
πn
[I − PL +
1
2βL kn
PL
](12)
Since π > 12 and PL < PH , the deviation is profitable.
It is easy to show that separating equilibria exist for a non empty set of parameters. For
instance, when βH is large enough, βL is small enough and ϕ is large enough, there exists a
separating equilibrium in which: (i) L−type candidates promise I and distribute IβL k
n−1
βL kn
when
they win with k votes; (ii) H − type candidates promise PH < I βH(βL−1)βL(βH−1)
and distribute less
than L− type candidates for any approval rate; (iii) voters’ beliefs are such that they assign a
probability of 1 to a candidate being an L−type when she promises strictly more than PH , and
a probability of 1 to a candidate being an H− type when she promises less than PH ; (iv) voters
vote for the candidate they expect (conditional on their beliefs) to be the most benevolent if
elected. If voters expect the two candidates to distribute the same amount, they vote for the
candidate who makes the larger promise. Finally, if the two candidates make the same promise,
voters cast their votes randomly.
The previous equilibrium has a simple intuition. An L − type candidate wins against an
H − type, while a candidate wins with a probability of 1/2 against an opponent of the same
23
type. If βH is large enough, for an H−type candidate, competing against an L−type candidate
is ”too costly”: she promises the entire budget, I, and, if elected, distributes a large amount to
voters. Therefore an H − type candidate prefers to reduce her promise and win the elections
with lower probability. Namely, she wins the elections with a probability of 1/2 when she
competes against an opponent of the same type (a situation that occurs with a probability
of 1 − ϕ). In contrast, if ϕ is large enough and βL is small enough, an L − type candidate
competing against an opponent of the same type prefers to promise the entire budget, I, and
win the elections with a probability of 1/2.
We conclude with two remarks. First, some candidates in the Election treatment distribute
more than they promised. Moreover, some candidates in the other two treatments, Random and
NoCampaign, distribute positive amounts (which are nevertheless significantly lower than the
distributed amounts in Election). Also, the amounts candidates distribute are not correlated
with the approval rate in NoCampaign and weakly correlated with promises in Random. Our
model can be easily extended to account for these empirical results by assuming that candidates
(also) exhibit preferences for egalitarianism. For instance, consider the following extension of
the utility function of candidate i:
Ui(Pi, Si,k
n, βi, αi) = I + E − Si − βiCi
(Pi, Si,
k
n
)− αimax
[0,
1
2(I
n
n+ 1− Si)
2
], (13)
where αi ≥ 0 is the sensitivity of candidate i to egalitarianism. By (13), when either
βi = 0, or Pi = 0, or under random appointment, the winning candidate distributes Si =
max{I nn+1 − 1
αi, 0}
for egalitarian concerns.
Second, we find in our experiment that excessively high promises generate distrust. In
order to rationalize this evidence, our model can be extended to include a third type of (selfish)
candidate, denoted O−type, such that βO = 0. Selfish candidates always distribute zero if they
win the elections and their promises are mere cheap talk. Consider a model with three types:
O,H and L. As follows, we provide the intuition of how introducing the O − type candidates
can change the previous results. A separating equilibrium cannot exist because voters never
vote for a selfish candidate. If the probability that a candidate is an O − type is sufficiently
24
high, then there pooling equilibria exist such that, regardless of their type, candidates promise
a positive amount P ≤ I and voters assign a probability of 1 to a candidate being selfish if she
promises more than P . On the other hand, if the probability that a candidate is an O − type
is sufficiently low, there also exist semi-pooling equilibria in which L − type and O − type
candidates promise PL,O ≤ I and H − type candidates promise PH , with PH < PL,O. Voters
vote for the candidate who promises PL,O if the other candidate promises PH , and voters
assign probability 1 to a candidate being selfish when she promises more than PL,O. Hence,
making an excessively large promise generates distrust and reduces the probability of winning
the elections.21
21Indeed, it is easy to show that assigning probability 1 to a candidate being selfish when she promises morethan P (PL,O) in the pooling (semi-pooling) equilibria is the unique profile of voters’ beliefs that satisfiesstandard refinement criteria for Bayesian equilibria, such as the D1 criterion.
25
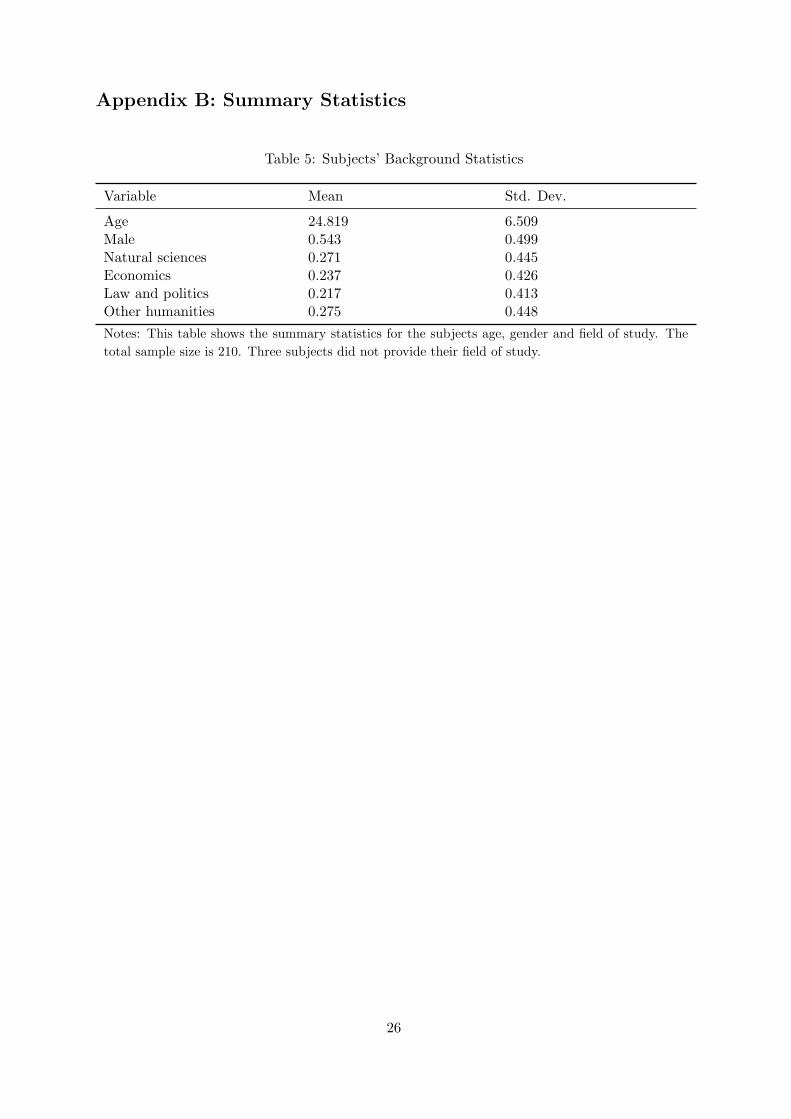
Appendix B: Summary Statistics
Table 5: Subjects’ Background Statistics
Variable Mean Std. Dev.
Age 24.819 6.509Male 0.543 0.499Natural sciences 0.271 0.445Economics 0.237 0.426Law and politics 0.217 0.413Other humanities 0.275 0.448
Notes: This table shows the summary statistics for the subjects age, gender and field of study. The
total sample size is 210. Three subjects did not provide their field of study.
26
References
Abrams, Burton A. and Russel F. Settle. 2004. “Campaign Finance Reform: A Public Choice
Perspective.” Public Choice 120:379–400.
Alatas, Vivi, Lisa Cameron, Ananish Chaudhuri, Nisvan Erkal and Lata Gangadharan. 2009.
“Subject Pool Effects in a Corruption Experiment: A Comparison of Indonesian Public
Servants and Indonesian Students.” Experimental Economics 12:113–132.
Alt, James, Ethan Bueno de Mesquita and Shanna Rose. 2011. “Disentangling Accountabil-
ity and Competence in Elections: Evidence from U.S. Term Limits.” Journal of Politics
73(1):171–186.
Ashworth, Scott. 2005. “Reputational Dynamics and Political Careers.” Journal of Law, Eco-
nomics, and Organization 21(2):441–466.
Ashworth, Scott and Ethan Bueno de Mesquita. 2008. “Electoral Selection, Strategic Challenger
Entry, and the Incumbency Advantage.” Journal of Politics 70(3):1006–1025.
Austen-Smith, D. and J. Banks. 1989. Electoral Accountability and Incumbency. In Models of
strategic choice in politics, ed. P.C. Ordeshook. Ann Arbor: University of Michigan Press.
Banks, Jeffrey S. 1990. “A Model of Electoral Competition with Incomplete Information.”
Journal of Economic Theory 50(2):209–325.
Barro, Robert J. 1973. “The Control of Politicians: An Economic Model.” Public Choice
14(1):19–42.
Baumeister, Roy F., Stillwell Arlene M. and Todd F. Heatherton. 1994. “Guilt: An Interper-
sonal Approach.” Psychological Bulletin 115(2):243–267.
Benoit, Kenneth and Michael Marsh. 2008. “The Campaign Value of Incumbency: A New
Solution to the Puzzle of Less Effective Incumbent Spending.” American Journal of Political
Science 52:874–890.
Besley, Timothy. 2005. “Political Selection.” Journal of Economic Perspectives 19(3):43–60.
Besley, Timothy and Anne Case. 2003. “Political Institutions and Policy Choices: Evidence
from the United States.” Journal of Economic Literature 41(1):7–73.
27
Brandts, Jordi, David Cooper and Roberto Weber. 2011. “Legitimacy, Social Distance, and
Leadership in the Turnaround Game.” Working Paper Department of Economics, Florida
State University .
Brandts, Jordi and Gary Charness. 2000. “The Strategy Versus the Direct-response Method:
A First Survey of Experimental Comparisons.” Experimental Economics 2(3):227–238.
Brandts, Jordi, Werner Guth and Andreas Stiehler. 2006. “I want YOU! An Experiment Study-
ing Motivational Effects When Assigning Distributive Power.” Labour Economics 13(1):1–17.
Brown, Martin, Armin Falk and Ernst Fehr. 2004. “Relational contracts and the nature of
market interactions.” Econometrica 72(3):747–780.
Burnheim, John. 1985. Is democracy possible?: The alternative to electoral politics. University
of California Press.
Callander, Steven. 2008. “Political Motivations.” Review of Economic Studies 75(3):671–697.
Callander, Steven and Simon Wilkie. 2007. “Lies, Damned Lies, and Political Campaigns.”
Games and Economic Behavior 60(2):262–286.
Canes-Wrone, Brandice, Michael C. Herron and Kenneth W. Shotts. 2001. “Leadership and
pandering: A theory of executive policymaking.” American Journal of Political Science
45(3):532–550.
Cappelen, Alexander W., Knut Nygaard, Erik Sorensen and Bertil Tungodden. 2011. “So-
cial Preferences in the Lab: A Comparison of Students and a Representative Population.”
Working Paper.
Carson, Lyn and Brian Martin. 1999. Random Selection in Politics. Westpoint, Conn. and
London: Praeger.
Charness, Gary and Martin Dufwenberg. 2006. “Promises and Partnership.” Econometrica
74(6):1579–1601.
Cooper, David J. and John H. Kagel. 2009. “Other Regarding Preferences: A Selective Survey
of Experimental Results.” Unpublished manuscript .
28
Dal Bo, Pedro, Andrew Foster and Louis Putterman. 2010. “Institutions and Behavior: Exper-
imental Evidence on the Effects of Democracy.” American Economic Review 100:2205–2229.
Dawes, Christopher T., Peter John Loewen and James H. Fowler. 2011. “Social Preferences
and Political Participation.” Journal of Politics 73:845–856.
De Cremer, David and Daan van Knippenberg. 2005. “Cooperation as a Function of Leader
Self-Sacrifice, Trust, and Identification.” Leadership and Organization Development Journal
26(5):355–369.
Elster, Jon. 1989. Solomonic Judgements. Cambridge: Cambridge University Press.
Engelstad, Fredrik. 1989. “The Assignment of Political Office By Lot.” Social Science Infor-
mation 28:23–50.
Falk, Armin, Stephan Meier and Christian Zehnder. N.d. “Do Lab Experiments Misrepresent
Social Preferences? The Case of Self-selected Student Samples.” Journal of the European
Economic Association. Forthcoming.
Fearon, James D. 1999. Electoral Accountability and the Control of Politicians: Selecting Good
Types versus Sanctioning Poor Performance. In Democracy, Accountability, and Represen-
tation, ed. Adam Manin, Bernard Przeworski and Susan Stokes. Cambridge: Cambridge
University Press.
Fehr, Ernst and John A. List. 2004. “The hidden costs and returns of incentives — trust and
trustworthiness among CEOs.” Journal of the European Economic Association 2(5):743–771.
Fehr, Ernst and Klaus M. Schmidt. 2002. Theories of Fairness and Reciprocity - Evidence and
Economic Applications. In Advances in Economics and Econometrics, 8th World Congress,
Econometric Society Monographs, ed. L. Hansen M. Dewatripont and S. Turnovsky. Cam-
bridge: Cambridge University Press.
Ferejohn, John. 1986. “Incumbent Performance and Electoral Control.” Public Choice 50(1):5–
26.
Ferraz, Claudio and Frederico Finan. 2011. “Electoral Accountability and Corruption: Evidence
from the Audits of Local Governments.” American Economic Review 101(4):1274–1311.
29

Fischbacher, Urs. 2007. “Z-Tree: Zurich Toolbox for Ready-Made Economic Experiments.”
Experimental Economics 10(2):171–178.
Fischbacher, Urs and Franziska Heusi. 2008. Lies in Disguise - An Experimental Study on
Cheating. TWI Research Paper Series 40.
Fishel, Jeff. 1985. Presidents and promises: From campaign pledge to presidential performance.
Washington, D.C.: CQ Press.
Fowler, James H. and Cindy D. Kam. 2007. “Beyond the Self: Social Identity, Altruism, and
Political Participation.” Journal of Politics 69(3):813–827.
Gachter, Simon, Daniele Nosenzo Elke Renner and Martin Sefton. N.d. “Who Makes a Good
Leader? Cooperativeness, Optimism, and Leading-by-Example.” Economic Inquiry. Forth-
coming.
Gagliarducci, Stefano and Tommaso Nannicini. N.d. “Do Better Paid Politicians Perform
Better? Disentangling Incentives from Selection.” Journal of the European Economic Asso-
ciation. Forthcoming.
Glockner, Andreas, Bernd Irlenbusch Sebastian Kube Andreas Nicklisch and Hans-Theo Nor-
mann. 2011. “Leading with(out) Sacrifice? A Public-Goods Experiment with a Super-
Additive Player.” Economic Inquiry 49(2):591–597.
Gordon, Sanford C., Gregory A. Huber and Dimitri Landa. 2007. “Challenger Entry and Voter
Learning.” American Political Science Review 101:303–320.
Grosser, Jens and Arthur Schram. 2006. “Neighborhood information exchange and voter par-
ticipation.” American Political Science Review 100(2):235–248.
Grosser, Jens and Arthur Schram. 2010. “Public Opinion Polls, Voter Turnout, and Welfare:
An Experimental Study.” American Journal of Political Science 54(3):700–717.
Guth, Werner, M. Vittoria Levati, Matthias Sutter and Eline Van Der Heijden. 2007. “Lead-
ing by example with and without exclusion power in voluntary contribution experiments.”
Journal of Public Economics 91(5-6):1023–1042.
30
Hamman, John R., Roberto Weber and Jonathan Woon. 2011. “An Experimental Investigation
of Electoral Delegation and the Provision of Public Goods.” American Journal of Political
Science 55(4):738–752.
Headlam, James Wycliffe. 1933. Election by Lot at Athens. Cambridge: Cambridge University
Press.
Hermalin, Benjamin E. 1998. “Toward an Economic Theory of Leadership: Leading by Exam-
ple.” American Economic Review 88(5):1188–1206.
Houser, Daniel and Erte Xiao. 2011. “Classification of Natural Language Messages Using A
Coordination Game.” Experimental Economics 14(1):1–14.
Kartik, Navin and R. Preston McAfee. 2007. “Signaling Character in Electoral Competition.”
American Economic Review 97(3):852–870.
Key, V. O. 1966. The Responsible Electorate Rationality in Presidential Voting 1936-1960.
Belknap Press of Harvard University Press.
Kube, Sebastian and Clemens Puppe. 2009. “(When and How) Do Voters Try to Manipulate?
Experimental Evidence from Borda Elections.” Public Choice 139(1):39–52.
Lockard, Alan A. 2003. Sortition. In The Encyclopedia of Public Choice, ed. Charles K. Rowley
and Friedrich Schneider. Springer US pp. 857–860.
Manin, Bernard, Adam Przeworski and Susan C. Stokes. 1999. Elections and Representation.
In Democracy, Accountability, and Representation, ed. Adam Manin, Bernard Przeworski
and Susan Stokes. Cambridge: Cambridge University Press.
Maskin, Eric and Jean Tirole. 2004. “The Politician and the Judge: Accountability in Govern-
ment.” American Economic Review 94(4):1034–1054.
Mazar, Nina, On Amir and Dan Ariely. 2008. “The Dishonesty of Honest People: A Theory of
Self-Concept Maintenance.” Journal of Marketing Research 45(6):633–644.
Morton, Rebecca and Kenneth Williams. 2010. From Nature to the Lab: Experimental Political
Science and the Study of Causality. Cambridge: Cambridge University Press.
31
Mueller, Dennis C., Robert D. Tollison and D. Willett Thomas. 1972. “Representative Democ-
racy via Random Selection.” Public Choice 12(1):57–68.
Mulgan, Richard G. 1984. “Lot as a democratic device of selection.” Review of Politics
46(4):539–560.
Olken, Benjamin A. 2010. “Direct Democracy and Local Public Goods: Evidence from a Field
Experiment in Indonesia.” American Political Science Review 104(2):243–267.
Petry, Francois und Collette, Benoıt. 2009. “Measuring How Political Parties Keep Their
Promises: A Positive Perspective from Political Science.” Studies in Public Choice 15(2):65–
80.
Ringquist, Evan J. and Carl Dasse. 2004. “Lies, Damned Lies, and Campaign Promises.” Social
Science Quarterly 85(2):400–419.
Rothenberg, Lawrence S. and Mitchell S. Sanders. 2000. “Severing the Electoral Connection:
Shirking in the Contemporary Congress.” American Journal of Political Science 44(2):316–
325.
Schwarz, Daniel, Lisa Schadel and Andreas Ladner. 2010. “Pre-Election Positions and Voting
Behaviour in Parliament: Consistency among Swiss MPs.” Swiss Political Science Review
16(3):533–564.
Selten, Reinhard. 1967. Die Strategiemethode zur Erforschung des Eingeschrankt Ratio-
nalen Verhaltens im Rahmen eines Oligopolexperiments. In Beitrage zur Experimentellen
Wirtschaftsforschung, ed. H. Sauermann. Mohr Siebeck pp. 136–68.
Stratmann, T. 2005. “Some Talk: Money in Politics. A (Partial) Review of the Literature.”
Public Choice 124(1):135–156.
Sulkin, Thomas. 2009. “Campaign Appeals and Legislative Action.” Journal of Politics
71(3):1093–1108.
Sulkin, Tracy and Nathaniel Swigger. 2008. “Is There Truth in Advertising? Campaign Ad
Images as Signals about Legislative Behavior.” The Journal of Politics 70(1):232–244.
32
Thomson, Robert. 2011. “Citizens evaluations of the fulfillment of election pledges: Evidence
from Ireland.” Journal of Politics 73(1):187–201.
Tridimas, George. 2011. “Constitutional choice in ancient Athens: the rationality of selection
to office by lot.” Constitutional Political Economy 23(1):1–21.
Woon, Jonathan. 2011. “Democratic Accountability and Retrospective Voting: A Laboratory
Experiment.” Working Paper .
33