Embed Size (px)
Citation preview
A N N U A L R E P O R T
2 0 1 0
EE LL BB GG RR OO UU PP
Page
Chairman's statement 2
Corporate governance 4
Board of directors 6
Seven year financial review 7
Financial highlights 8
Annual financial statements
Directors' responsibility statement 9
Certificate by the company secretary 9
Independent auditor’s report 10
Directors' report 11
Accounting policies 12
Balance sheets 20
Income statements 21
Statements of comprehensive income 22
Statements of changes in equity 23
Cash flow statements 25
Notes to the annual financial statements 26
Subsidiaries and joint ventures 67
Analysis of ordinary shareholders 68
Directors' interests in ordinary shares 68
Ordinary share statistics 69
Shareholders' diary 69
Administration 70
Notice of annual general meeting 71
Proxy form Insert
Notes to the proxy form Insert
Contents
1

ELB Group is a total solutions provider to the mining, minerals,power, port, construction and industrial sectors in the field ofmaterials handling and appropriate modular process plants. Thisis achieved through ELB generated innovation, in-housecapability and the supply, with world class partners, of equipmentand technology. The Group operates in Africa and Australia.
ELB is an investment holding company owning 85 percent ofELB Engineering Limited (ELB Engineering Group) with theremaining 15 percent owned by the ELB Educational Trustestablished as the Group’s BEE partner promoting the educationof historically disadvantaged South Africans specifically inengineering disciplines.
ELB ENGINEERING GROUP
ELB EQUIPMENT has a number of locally designed andmanufactured products and represents internationally renownedmanufacturers whose products are designed to meet industrialisedfirst-world standards. Operating in three specialised divisions,each with responsibility for specific products, it provides astreamlined and professional service that can offer the industry awide selection of products.
Construction Equipment
• Ditch Witch Trenching & Directional Drilling Equipment
• MST Backhoe Loaders
• Mitsubishi Motor Graders
• Sakai Compaction Equipment
• Mustang Skid Steer Loaders
Earthmoving Equipment
• Kawasaki Wheel Loaders
• Sumitomo Tracked Excavators
Mining / Quarrying Equipment
• Allu-SM Screener-Crusher Buckets
• Furukawa Drill Rigs
• Furukawa Hydraulic Breakers
• Taurus Heavy Duty Rotary Barrel Screens **
• ELB Static & Mobile Conveyors **
• Pegson Mobile & Static Crushing Plants
• Oresizer Vertical Shaft Impact Crushers **
• Powerscreen Mobile & Static Screens
• Tecman Underground and Surface Boom Systems
• Telestack conveyor systems
** Designed and manufactured by ELB Equipment
In order to service its customer base effectively, ELB Equipmentbased in Boksburg has branches in Cape Town, Durban,Kimberley, Kathu, Brits, George, Middleburg and Wolmaransstadas well as a well-established dealer network throughout South
Africa and other Southern African states. In addition to offeringparts and field service round-the-clock, a large centralised andfully equipped refurbishing facility is available for rebuilding andrefurbishing of ELB Equipment products.
DITCH WITCH AUSTRALIA is an importer and distributor ofUnderground and Utility Construction Equipment.
Product Lines include
• Ditch Witch Trenching and Directional Drilling Equipment,Compact Utility Equipment Vacuums and Electronic Pipeand Cable Locators
• Stanley Hydraulic Power Packs and Tools
• Trenchmaster Mini Trencher
• Bedmaster Bed Defining Machines
• McLaughlin Case Boring Equipment, Augers and CutterHeads
• Belle Concrete and Mortar Mixers and CompactionEquipment
• Tesmec Rock Trenching Equipment and Bucket Wheel Trenchers and Rock Milling Equipment
• Akkerman Inc. Microtunnelling, Pipe Jacking Tunnellingproducts
• Komptech GMBH commercial composting and alternativefuel processing machinery; mobile diesel and electricpowered equipment to shred, sort, sift and windrow turnorganic material for the production of compost and biomassalternative organic based fuel from green waste, forestryresidue and organic industrial waste products.
Markets served in Australia are gas, water, sewage, electricity,communications, the Defence Forces, Green Waste Recycling,Commercial and Industrial Waste Disposal, Biomass AlternativeFuel Production and the Oil and Gas Pipeline Industry.
Ditch Witch Australia distributes direct through sales and serviceoffices in Sydney, Melbourne, Adelaide, Perth and Brisbane.
ELB ENGINEERING SERVICES The business focuses on thesupply of a total engineered materials handling solutions to themining, minerals, industrial, port and power sectors based on itsown in house capability as well as technology agreements withworld class product and know how companies.
Bulk Materials Handling
Augmenting the in-house expertise base, ELB EngineeringServices has an exclusive licence with FAM, Germany. Thecapability encompasses the supply of turnkey packages from runof mine tip to ship loading including all conveyor options,stockyard equipment, port equipment and simulation modelling.
THOR, based in Canada, work exclusively with ELB to provide aworld class mobile telescopic radial luffing stacker. Thecapabilities of this equipment are unique in the Southern Africanregion with regards to flexibility and capability.
Chairman’s statement
2

Pneumatic Conveying
ELB Engineering Services’ capability for the supply of most typesof pneumatic conveying is supported by the world classtechnology from Claudius Peters. Claudius Peters provides thevast majority of equipment required for the grinding, handling,cooling, mixing, storing and out loading in the Cement, Lime, Ash,Alumina and Gypsum industry. Claudius Peters are considered aworld leader in providing total solutions into the above industries.
Cyclonaire, from the USA, provide specialised pneumaticconveying booster technology via ELB in the region.
Modular Plants
EPE is a joint venture between ELB Engineering Services andPBA from Cape Town, to provide the modular process plant intothe total solution for this business.
Life Extension Services
ELB Engineering Services have developed a leading capabilityinto the assessment, engineering and refurbishment of bulkmaterials handling equipment.
Ports of Africa
ELB Engineering Services formed a joint venture with A Cubedto address total Port solutions to the African Market. This entitycovers aspects from logistical studies through to the implemen-tation of the total engineering port solution.
FINANCIAL RESULTS
The ELB Group has once again produced satisfactory results con-sidering that trading conditions remained difficult during the period.
Sales decreased marginally by 0,4 percent from R1 246 millionin 2009 to R1 241 million in 2010.
Headline earnings per share on the other hand increased by3,4 percent from 189,1 cents per share in 2009 to 195,6 centsper share in 2010.
Net asset value per share increased by 19,3 percent from 1 078cents per share in 2009 to 1 286 cents per share in 2010.
PROSPECTS
The ELB Group will continue to benefit from its strategy of focusingon material handling and appropriate process plant solutions.
The prospects for the coming twelve months are moreencouraging than they were this time last year.
DIVIDENDS
The final dividend of 30 cents per share reflects the Board’sconfidence in the prospects for the ELB Group going forward.
The total dividend for the year is therefore 42 cents per shareversus 30 cents per share for the 2009 financial year.
SOCIAL RESPONSIBILITY
As mentioned above ELB’s empowerment partner is the ELBEducational Trust established to promote education of histor-ically disadvantaged South Africans in engineering disciplines.To this end bursaries were awarded to students at various SouthAfrican universities.
ELB also made substantial donations to the St Vincent Schoolfor the Deaf, the Masibambane College in Orange Farm, theJohn Wesley Community Centre in Benoni and the LigbronAcademy of Technology. These institutions have been identifiedas worthy of ELB’s support and will further assist the historicallydisadvantaged in our community.
CONCLUSION
I would like to thank all those who have contributed to the furtherimproved performance of ELB over the past year.
Each year offers its own challenges which will need dedicationand commitment from all those involved.
A G Fletcher
20 October 2010
Chairman’s statement(continued)
3
ENGINEERED TO DELIVER
4
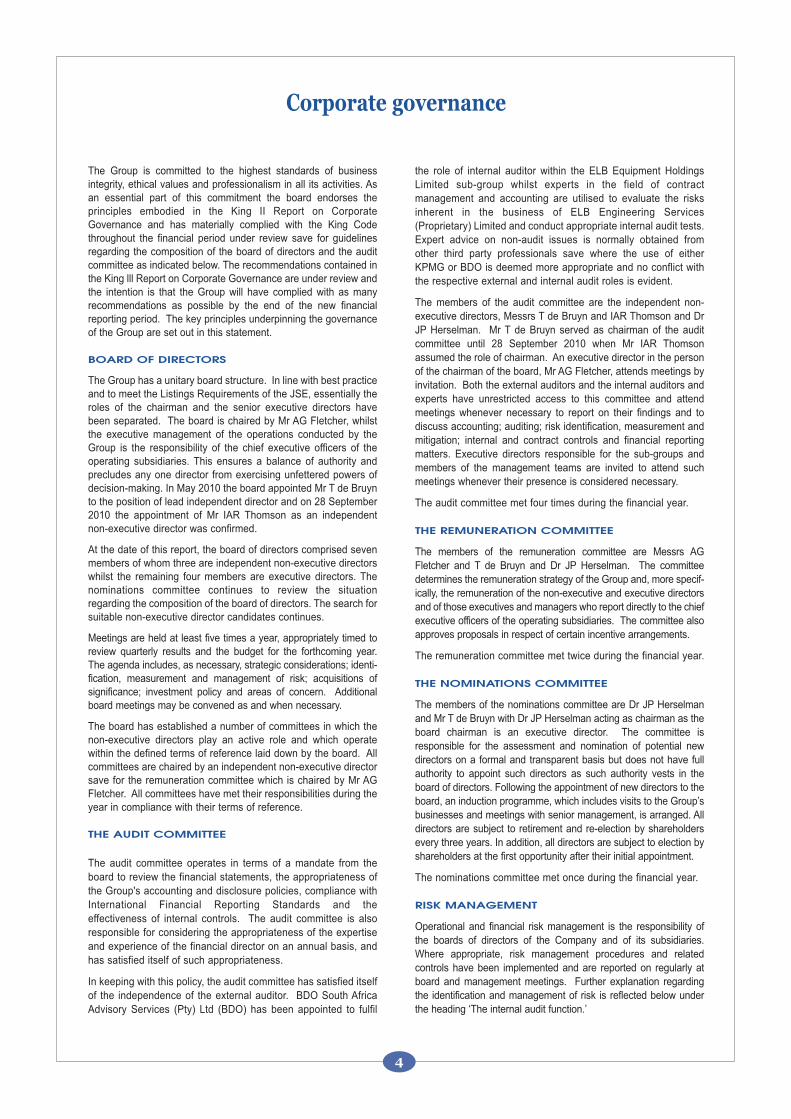
The Group is committed to the highest standards of businessintegrity, ethical values and professionalism in all its activities. Asan essential part of this commitment the board endorses theprinciples embodied in the King II Report on CorporateGovernance and has materially complied with the King Codethroughout the financial period under review save for guidelinesregarding the composition of the board of directors and the auditcommittee as indicated below. The recommendations contained inthe King lll Report on Corporate Governance are under review andthe intention is that the Group will have complied with as manyrecommendations as possible by the end of the new financialreporting period. The key principles underpinning the governanceof the Group are set out in this statement.
BOARD OF DIRECTORS
The Group has a unitary board structure. In line with best practiceand to meet the Listings Requirements of the JSE, essentially theroles of the chairman and the senior executive directors havebeen separated. The board is chaired by Mr AG Fletcher, whilstthe executive management of the operations conducted by theGroup is the responsibility of the chief executive officers of theoperating subsidiaries. This ensures a balance of authority andprecludes any one director from exercising unfettered powers ofdecision-making. In May 2010 the board appointed Mr T de Bruynto the position of lead independent director and on 28 September2010 the appointment of Mr IAR Thomson as an independentnon-executive director was confirmed.
At the date of this report, the board of directors comprised sevenmembers of whom three are independent non-executive directorswhilst the remaining four members are executive directors. Thenominations committee continues to review the situationregarding the composition of the board of directors. The search forsuitable non-executive director candidates continues.
Meetings are held at least five times a year, appropriately timed toreview quarterly results and the budget for the forthcoming year.The agenda includes, as necessary, strategic considerations; identi-fication, measurement and management of risk; acquisitions ofsignificance; investment policy and areas of concern. Additionalboard meetings may be convened as and when necessary.
The board has established a number of committees in which thenon-executive directors play an active role and which operatewithin the defined terms of reference laid down by the board. Allcommittees are chaired by an independent non-executive directorsave for the remuneration committee which is chaired by Mr AGFletcher. All committees have met their responsibilities during theyear in compliance with their terms of reference.
THE AUDIT COMMITTEE
The audit committee operates in terms of a mandate from theboard to review the financial statements, the appropriateness ofthe Group's accounting and disclosure policies, compliance withInternational Financial Reporting Standards and theeffectiveness of internal controls. The audit committee is alsoresponsible for considering the appropriateness of the expertiseand experience of the financial director on an annual basis, andhas satisfied itself of such appropriateness.
In keeping with this policy, the audit committee has satisfied itselfof the independence of the external auditor. BDO South AfricaAdvisory Services (Pty) Ltd (BDO) has been appointed to fulfil
the role of internal auditor within the ELB Equipment HoldingsLimited sub-group whilst experts in the field of contractmanagement and accounting are utilised to evaluate the risksinherent in the business of ELB Engineering Services(Proprietary) Limited and conduct appropriate internal audit tests.Expert advice on non-audit issues is normally obtained fromother third party professionals save where the use of eitherKPMG or BDO is deemed more appropriate and no conflict withthe respective external and internal audit roles is evident.
The members of the audit committee are the independent non-executive directors, Messrs T de Bruyn and IAR Thomson and DrJP Herselman. Mr T de Bruyn served as chairman of the auditcommittee until 28 September 2010 when Mr IAR Thomsonassumed the role of chairman. An executive director in the personof the chairman of the board, Mr AG Fletcher, attends meetings byinvitation. Both the external auditors and the internal auditors andexperts have unrestricted access to this committee and attendmeetings whenever necessary to report on their findings and todiscuss accounting; auditing; risk identification, measurement andmitigation; internal and contract controls and financial reportingmatters. Executive directors responsible for the sub-groups andmembers of the management teams are invited to attend suchmeetings whenever their presence is considered necessary.
The audit committee met four times during the financial year.
THE REMUNERATION COMMITTEE
The members of the remuneration committee are Messrs AGFletcher and T de Bruyn and Dr JP Herselman. The committeedetermines the remuneration strategy of the Group and, more specif-ically, the remuneration of the non-executive and executive directorsand of those executives and managers who report directly to the chiefexecutive officers of the operating subsidiaries. The committee alsoapproves proposals in respect of certain incentive arrangements.
The remuneration committee met twice during the financial year.
THE NOMINATIONS COMMITTEE
The members of the nominations committee are Dr JP Herselmanand Mr T de Bruyn with Dr JP Herselman acting as chairman as theboard chairman is an executive director. The committee isresponsible for the assessment and nomination of potential newdirectors on a formal and transparent basis but does not have fullauthority to appoint such directors as such authority vests in theboard of directors. Following the appointment of new directors to theboard, an induction programme, which includes visits to the Group’sbusinesses and meetings with senior management, is arranged. Alldirectors are subject to retirement and re-election by shareholdersevery three years. In addition, all directors are subject to election byshareholders at the first opportunity after their initial appointment.
The nominations committee met once during the financial year.
RISK MANAGEMENT
Operational and financial risk management is the responsibility ofthe boards of directors of the Company and of its subsidiaries.Where appropriate, risk management procedures and relatedcontrols have been implemented and are reported on regularly atboard and management meetings. Further explanation regardingthe identification and management of risk is reflected below underthe heading ‘The internal audit function.’
Corporate governance
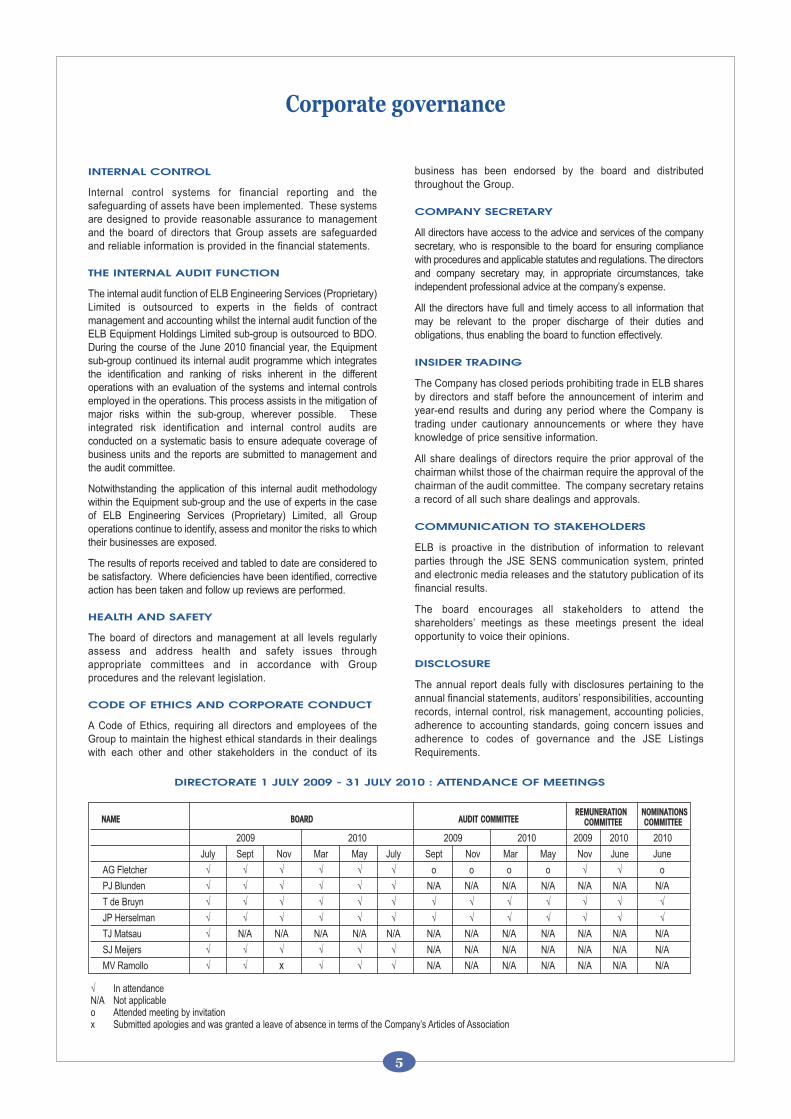
RREEMMUUNNEERRAATTIIOONN NNOOMMIINNAATTIIOONNSSNNAAMMEE BBOOAARRDD AAUUDDIITT CCOOMMMMIITTTTEEEE CCOOMMMMIITTTTEEEE CCOOMMMMIITTTTEEEE
2009 2010 2009 2010 2009 2010 2010
July Sept Nov Mar May July Sept Nov Mar May Nov June June
AG Fletcher √ √ √ √ √ √ o o o o √ √ o
PJ Blunden √ √ √ √ √ √ N/A N/A N/A N/A N/A N/A N/A
T de Bruyn √ √ √ √ √ √ √ √ √ √ √ √ √
JP Herselman √ √ √ √ √ √ √ √ √ √ √ √ √
TJ Matsau √ N/A N/A N/A N/A N/A N/A N/A N/A N/A N/A N/A N/A
SJ Meijers √ √ √ √ √ √ N/A N/A N/A N/A N/A N/A N/A
MV Ramollo √ √ x √ √ √ N/A N/A N/A N/A N/A N/A N/A
DIRECTORATE 1 JULY 2009 - 31 JULY 2010 : ATTENDANCE OF MEETINGS
Corporate governance
5
INTERNAL CONTROL
Internal control systems for financial reporting and thesafeguarding of assets have been implemented. These systemsare designed to provide reasonable assurance to managementand the board of directors that Group assets are safeguardedand reliable information is provided in the financial statements.
THE INTERNAL AUDIT FUNCTION
The internal audit function of ELB Engineering Services (Proprietary)Limited is outsourced to experts in the fields of contractmanagement and accounting whilst the internal audit function of theELB Equipment Holdings Limited sub-group is outsourced to BDO.During the course of the June 2010 financial year, the Equipmentsub-group continued its internal audit programme which integratesthe identification and ranking of risks inherent in the differentoperations with an evaluation of the systems and internal controlsemployed in the operations. This process assists in the mitigation ofmajor risks within the sub-group, wherever possible. Theseintegrated risk identification and internal control audits areconducted on a systematic basis to ensure adequate coverage ofbusiness units and the reports are submitted to management andthe audit committee.
Notwithstanding the application of this internal audit methodologywithin the Equipment sub-group and the use of experts in the caseof ELB Engineering Services (Proprietary) Limited, all Groupoperations continue to identify, assess and monitor the risks to whichtheir businesses are exposed.
The results of reports received and tabled to date are considered tobe satisfactory. Where deficiencies have been identified, correctiveaction has been taken and follow up reviews are performed.
HEALTH AND SAFETY
The board of directors and management at all levels regularlyassess and address health and safety issues throughappropriate committees and in accordance with Groupprocedures and the relevant legislation.
CODE OF ETHICS AND CORPORATE CONDUCT
A Code of Ethics, requiring all directors and employees of theGroup to maintain the highest ethical standards in their dealingswith each other and other stakeholders in the conduct of its
business has been endorsed by the board and distributedthroughout the Group.
COMPANY SECRETARY
All directors have access to the advice and services of the companysecretary, who is responsible to the board for ensuring compliancewith procedures and applicable statutes and regulations. The directorsand company secretary may, in appropriate circumstances, takeindependent professional advice at the company’s expense.
All the directors have full and timely access to all information thatmay be relevant to the proper discharge of their duties andobligations, thus enabling the board to function effectively.
INSIDER TRADING
The Company has closed periods prohibiting trade in ELB sharesby directors and staff before the announcement of interim andyear-end results and during any period where the Company istrading under cautionary announcements or where they haveknowledge of price sensitive information.
All share dealings of directors require the prior approval of thechairman whilst those of the chairman require the approval of thechairman of the audit committee. The company secretary retainsa record of all such share dealings and approvals.
COMMUNICATION TO STAKEHOLDERS
ELB is proactive in the distribution of information to relevantparties through the JSE SENS communication system, printedand electronic media releases and the statutory publication of itsfinancial results.
The board encourages all stakeholders to attend theshareholders’ meetings as these meetings present the idealopportunity to voice their opinions.
DISCLOSURE
The annual report deals fully with disclosures pertaining to theannual financial statements, auditors’ responsibilities, accountingrecords, internal control, risk management, accounting policies,adherence to accounting standards, going concern issues andadherence to codes of governance and the JSE ListingsRequirements.
√ In attendanceN/A Not applicableo Attended meeting by invitationx Submitted apologies and was granted a leave of absence in terms of the Company’s Articles of Association
EXECUTIVE
Anthony Garth Fletcher (58) ‡
BCom, CA(SA)
Chairman of the board.
Appointed financial director in May 2009.
Appointed chairman of the board in May 2006.
Appointed to the board in 1996.
Also served as chairman from 1998 - 2003.
Peter John Blunden (55)
BCom
Chief executive - ELB Equipment.
Appointed to the board in 2002.
Joined the Group in 1978.
Dr Stephen John Meijers (49)
PhD (Mech Eng), BSc (Mech Eng), MAP (Wits),SEP (Wits/Harvard)
Chief executive - ELB Engineering Services.
Appointed to the board in May 2006.
Mollo Victor Ramollo (55)
BSc (Elec Eng)
Appointed to the board in 2003.
Board of directors
6
NON EXECUTIVE
Theunis de Bruyn (42) †‡#*
BCom, CA(SA)
Appointed to the board in 2005.
Dr John Paul Herselman (67) †‡#*
Dr Ing, Dipl Ing, BSc (Chem Eng)
Appointed to the board in 1986.
Ian Alan Richard Thomson (67) †*
BCom, CA(SA)
Appointed to the board in September 2010.
† Member of the audit committee
‡ Member of the remuneration committee
# Member of the nominations committee
* Independent
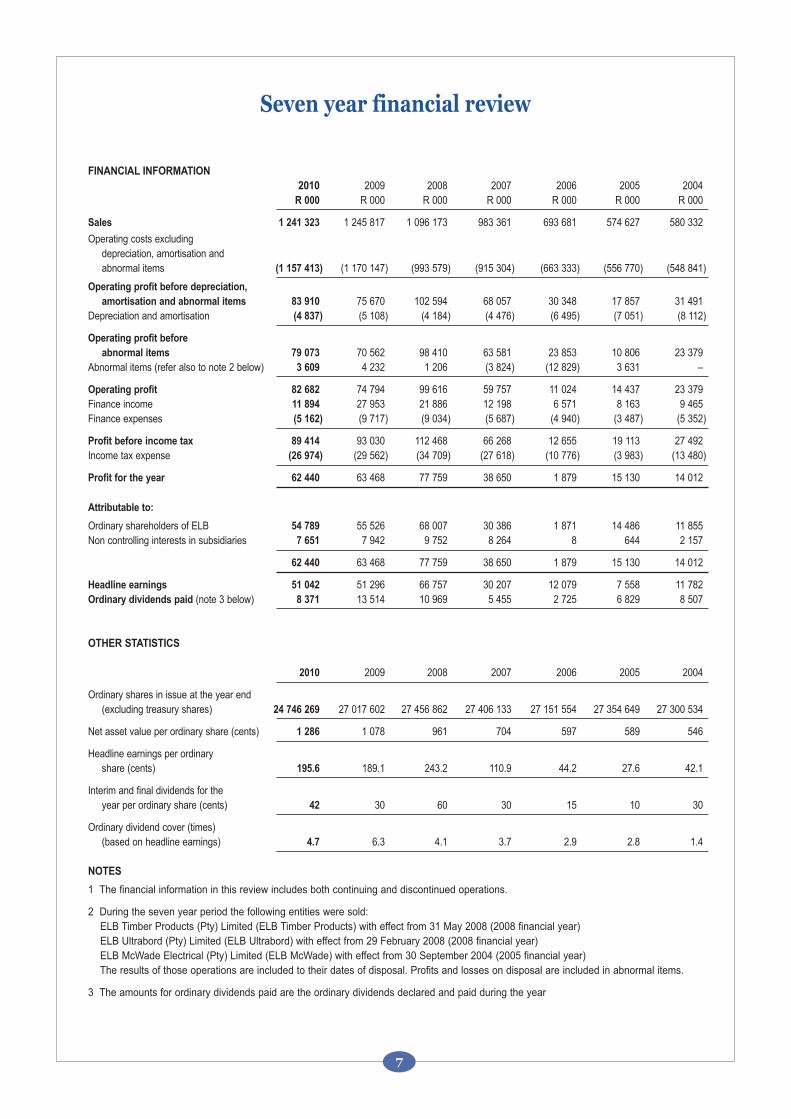
FINANCIAL INFORMATION
2010 2009 2008 2007 2006 2005 2004 R 000 R 000 R 000 R 000 R 000 R 000 R 000
Sales 1 241 323 1 245 817 1 096 173 983 361 693 681 574 627 580 332
Operating costs excluding depreciation, amortisation and abnormal items (1 157 413) (1 170 147) (993 579) (915 304) (663 333) (556 770) (548 841)
Operating profit before depreciation,
amortisation and abnormal items 83 910 75 670 102 594 68 057 30 348 17 857 31 491 Depreciation and amortisation (4 837) (5 108) (4 184) (4 476) (6 495) (7 051) (8 112)
Operating profit before
abnormal items 79 073 70 562 98 410 63 581 23 853 10 806 23 379 Abnormal items (refer also to note 2 below) 3 609 4 232 1 206 (3 824) (12 829) 3 631 –
Operating profit 82 682 74 794 99 616 59 757 11 024 14 437 23 379 Finance income 11 894 27 953 21 886 12 198 6 571 8 163 9 465 Finance expenses (5 162) (9 717) (9 034) (5 687) (4 940) (3 487) (5 352)
Profit before income tax 89 414 93 030 112 468 66 268 12 655 19 113 27 492 Income tax expense (26 974) (29 562) (34 709) (27 618) (10 776) (3 983) (13 480)
Profit for the year 62 440 63 468 77 759 38 650 1 879 15 130 14 012
Attributable to:
Ordinary shareholders of ELB 54 789 55 526 68 007 30 386 1 871 14 486 11 855 Non controlling interests in subsidiaries 7 651 7 942 9 752 8 264 8 644 2 157
62 440 63 468 77 759 38 650 1 879 15 130 14 012
Headline earnings 51 042 51 296 66 757 30 207 12 079 7 558 11 782 Ordinary dividends paid (note 3 below) 8 371 13 514 10 969 5 455 2 725 6 829 8 507
OTHER STATISTICS
2010 2009 2008 2007 2006 2005 2004
Ordinary shares in issue at the year end (excluding treasury shares) 24 746 269 27 017 602 27 456 862 27 406 133 27 151 554 27 354 649 27 300 534
Net asset value per ordinary share (cents) 1 286 1 078 961 704 597 589 546
Headline earnings per ordinaryshare (cents) 195.6 189.1 243.2 110.9 44.2 27.6 42.1
Interim and final dividends for theyear per ordinary share (cents) 42 30 60 30 15 10 30
Ordinary dividend cover (times) (based on headline earnings) 4.7 6.3 4.1 3.7 2.9 2.8 1.4
NOTES
1 The financial information in this review includes both continuing and discontinued operations.
2 During the seven year period the following entities were sold:ELB Timber Products (Pty) Limited (ELB Timber Products) with effect from 31 May 2008 (2008 financial year)ELB Ultrabord (Pty) Limited (ELB Ultrabord) with effect from 29 February 2008 (2008 financial year)ELB McWade Electrical (Pty) Limited (ELB McWade) with effect from 30 September 2004 (2005 financial year)The results of those operations are included to their dates of disposal. Profits and losses on disposal are included in abnormal items.
3 The amounts for ordinary dividends paid are the ordinary dividends declared and paid during the year
Seven year financial review
7
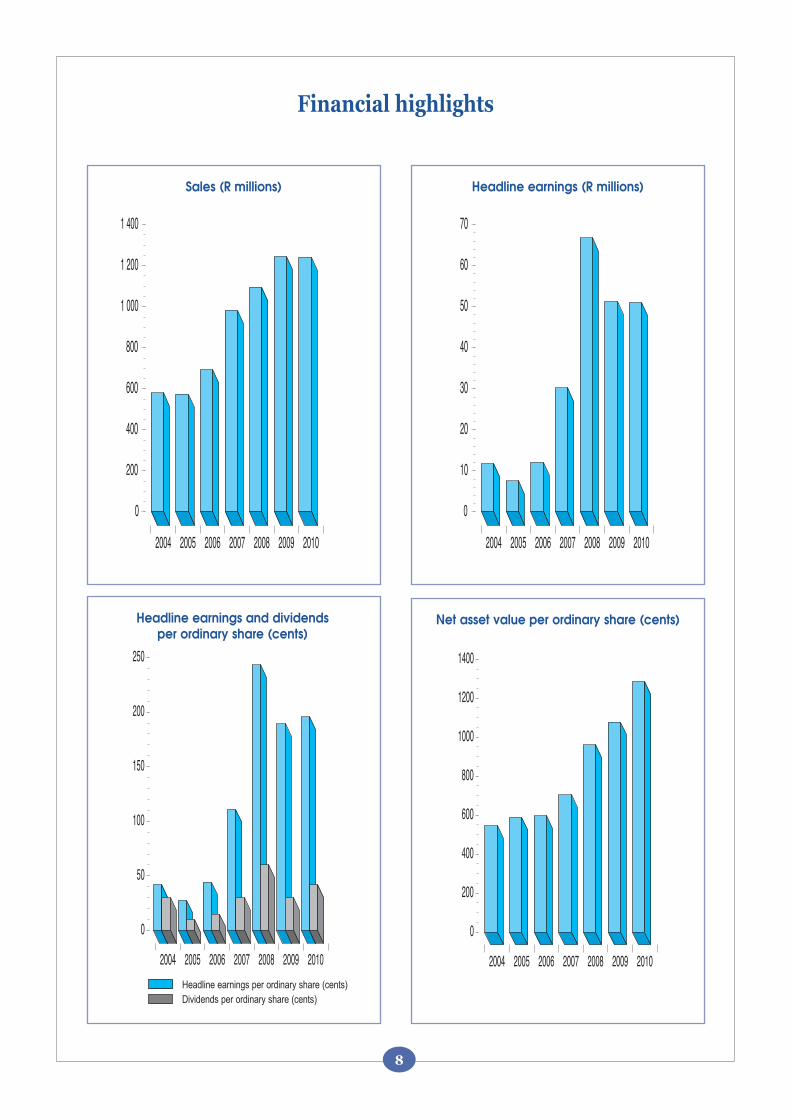
Financial highlights
8
2004 2005 2006 2007 2008 2009 2010
0
200
400
600
800
1 000
1 200
1 400
2004 2005 2006 2007 2008 2009 2010
0
10
20
30
40
50
60
70
2004 2005 2006 2007 2008 2009 2010
0
50
100
150
200
250
2004 2005 2006 2007 2008 2009 2010
0
200
400
600
800
1000
1200
1400
Sales (R millions) Headline earnings (R millions)
Net asset value per ordinary share (cents)Headline earnings and dividends per ordinary share (cents)
Headline earnings per ordinary share (cents)Dividends per ordinary share (cents)
The directors of the Company are responsible for the preparation and presentation of the Group and Company annual financial statementsof ELB Group Limited, comprising the balance sheets at 30 June 2010, and the directors’ report, the income statements, the statementsof comprehensive income, the statements of changes in equity and the cash flow statements for the year then ended, the accountingpolicies, the explanatory notes to the annual financial statements and the schedule of subsidiaries and joint ventures; in accordance withInternational Financial Reporting Standards (IFRS) and in the manner required by the Companies Act of South Africa, and as set out onpages 11 to 67. The Company’s independent auditor is responsible for conducting an audit in accordance with International Standards onAuditing and for examining the annual financial statements in order to determine whether the financial statements are in accordance withIFRS, the Companies Act of South Africa; and for reporting to shareholders their opinion on the annual financial statements. The auditor’sunmodified report appears on page 10.
The directors’ responsibility includes maintaining adequate accounting records and an effective system of risk management, selecting andapplying appropriate accounting policies, making accounting estimates that are reasonable in the circumstances and the preparation ofthe supplementary schedules included in these financial statements.
The directors are also responsible for developing and maintaining effective systems of internal control to provide reasonable assuranceas to the accuracy of the annual financial statements and also to provide reasonable assurance as to the prevention and detection ofmaterial misstatement and loss. These systems and procedures are implemented and monitored by suitably trained, skilled personnel.The Group’s internal audit function appraises independently the Group entities’ internal controls and reports to the audit committee. Theaudit committee reviews matters concerning risk, risk management, accounting policies, internal control and auditing and financialreporting. Nothing has come to the attention of the directors to indicate any material breakdowns of the internal controls, systems andprocedures during the year.
The directors have reviewed the budgets and forecasts of the Group’s businesses and have no reason to doubt the continued support ofthe Group’s suppliers and bankers. Based on these projections and considering the Group’s current financial position and the financingfacilities available to it, and after taking into account the continued support of the Group’s suppliers and bankers, the directors believe thatthe Group has adequate resources to continue its operations for the foreseeable future. Accordingly the directors are satisfied that thegoing concern basis of accounting remains appropriate, and the Group and Company annual financial statements have been preparedon that basis.
Approval of the Group and Company annual financial statements
The Group and Company annual financial statements of ELB Group Limited, as identified in the first paragraph, have been approved bythe board of directors and are signed on its behalf by:
AG Fletcher T de Bruyn
Chairman Director
Boksburg20 October 2010
Directors’ responsibility statement
9
I, the undersigned DG Jones, hereby certify that to the best of my knowledge and belief, arrived at after due and careful enquiry, for theyear ended 30 June 2010, the Company has lodged with the Registrar of Companies all returns as are required of a public company interms of the South African Companies Act of 1973, as amended, and that all such returns are true, correct and up to date, and that alllegal requirements have been fulfilled.
DG Jones
Company secretary
20 October 2010
Certificate by the company secretary
To the members of ELB Group Limited
Report on the financial statements
We have audited the group annual financial statements and the annual financial statements of ELB Group Limited, which comprise the
balance sheets at 30 June 2010, and the income statements, the statements of comprehensive income, the statements of changes in
equity and cash flow statements for the year then ended, and the notes to the financial statements, which include a summary of
significant accounting policies and other explanatory notes, and the directors’ report as set out on pages 11 to 67.
Directors’ responsibility for the financial statements
The company’s directors are responsible for the preparation and fair presentation of these financial statements in accordance with
International Financial Reporting Standards and in the manner required by the Companies Act of South Africa. This responsibility
includes: designing, implementing and maintaining internal control relevant to the preparation and fair presentation of financial
statements that are free from material misstatement, whether due to fraud or error; selecting and applying appropriate accounting
policies; and making accounting estimates that are reasonable in the circumstances
Auditor’s responsibility
Our responsibility is to express an opinion on these financial statements based on our audit. We conducted our audit in accordance
with International Standards on Auditing. Those standards require that we comply with ethical requirements and plan and perform the
audit to obtain reasonable assurance whether the financial statements are free from material misstatement.
An audit involves performing procedures to obtain audit evidence about the amounts and disclosures in the financial statements. The
procedures selected depend on the auditor’s judgement, including the assessment of the risks of material misstatement of the financial
statements, whether due to fraud or error. In making those risk assessments, the auditor considers internal control relevant to the
entity’s preparation and fair presentation of the financial statements in order to design audit procedures that are appropriate in the
circumstances, but not for the purpose of expressing an opinion on the effectiveness of the entity’s internal control. An audit also
includes evaluating the appropriateness of accounting policies used and the reasonableness of accounting estimates made by
management, as well as evaluating the overall presentation of the financial statements.
We believe that the audit evidence we have obtained is sufficient and appropriate to provide a basis for our audit opinion.
Opinion
In our opinion, these financial statements present fairly, in all material respects, the consolidated and separate financial position of ELB
Group Limited at 30 June 2010, and its consolidated and separate financial performance and consolidated and separate cash flows
for the year then ended in accordance with International Financial Reporting Standards, and in the manner required by the Companies
Act of South Africa.
KPMG Inc
Registered Auditor
Per C Esslemont
Chartered Accountant (SA) Registered AuditorDirector
20 October 2010
Independent auditor’s report
10
To the shareholders
Your directors submit the annual financial statements for theCompany and the Group for the year ended 30 June 2010 withtheir report on the results and operations.
NATURE OF THE BUSINESS
The Company operates as an investment holding companyderiving most of its distributable income from dividends. Themajor investment at the end of June 2010 is in ELB EngineeringLimited (ELB Engineering Group) which supplies equipment andtechnical solutions through two sub-groups, ELB EquipmentHoldings Limited (ELB Equipment Holdings) and ELB EngineeringServices (Proprietary) Limited (ELB Engineering Services). ELBEquipment Holdings continues to administer the Group treasury.
ELB ENGINEERING GROUP
ELB owns 85% of the ordinary share capital as well as 100% ofthe cumulative convertible redeemable preference shares issuedby ELB Engineering Group. The South African equipmentoperations housed in the division ELB Equipment Limitedproduced creditable results although conditions remained difficult.The Ditch Witch Australia joint venture operations, in which ELBEquipment Holdings has an 84.2% interest, reported profits inexcess of those budgeted notwithstanding the difficult tradingconditions. ELB Engineering Services continued to expand itsbusiness and also reported sales and profits ahead of budget.
Headline earnings attributable to the Company’s investment in ELBEngineering Group amounted to R39,9 million (2009 - R42,3 million).
ACCOUNTING POLICIES
The annual report has been prepared in accordance with theSouth African Companies Act and complies with InternationalFinancial Reporting Standards (IFRS). The accounting policies areconsistent with those outlined in the 2009 annual report with thefollowing exceptions. IAS 1 (revised) introduced changes to thepresentation of the financial statements. IFRS 8 requires thatsegment information be now based on internal managementreports rather than the definitions and classifications of the oldstandard. IAS 23 stipulates that borrowing costs directly attrib-utable to the acquisition, construction or production of a qualifyingasset be capitalised as part of the cost of the asset, instead ofbeing expensed which was the benchmark treatment of theprevious version. No borrowing costs were capitalised in thefinancial year under review in term of the revised IAS 23.
GENERAL
The Group continues to support the principles of good corporategovernance contained in the first King Report and the subsequentKing II Report and is in the process of reviewing and implementingprinciples outlined in the more recent King lll Report. Furtherdetails are provided in the Corporate Governance statement onpages 4 and 5 of this report.
The operating entities within the Group have complied with therequirements of the Employment Equity Act and the SkillsDevelopment Act.
DIVIDENDS
An interim dividend of 12 cents (2009 – 10 cents) per ordinary sharewas paid on 10 May 2010 and a final dividend in respect of the yearof 30 cents (2009 – 20 cents) per ordinary share was declared on21 September 2010 and is payable on 1 November 2010.
Dividends in respect of the 6% fixed cumulative preference shareswere declared simultaneously with the interim and final ordinarydividends referred to above.
SHARE CAPITAL
Details of the authorised and issued share capital at 30 June 2010are set out in notes 16 and 17 to the annual financial statements.There was no change in either the authorised ordinary sharecapital or the authorised preference share capital during the year.The issued preference share capital remained at the level of 3 8006% fixed cumulative preference shares at the end of June 2009,as no redemption of such shares by the Company occurred on theopen market during the year under review. Similarly, the issuedordinary share capital of 33 860 000 shares at 30 June 2009remained unchanged at the end of June 2010.
On 19 November 2007 shareholders approved a resolution whichplaced 5% of the authorised ordinary shares of the Companyunder the control of the directors for the purposes of the Company’sShare Incentive Scheme. At the year end, 30 June 2010, 2 215 000(2009 - 2 215 000) options over ordinary shares in the Companyhad been granted in terms of the Scheme. Since 30 June 2010,and to the date of this report, a further 210 000 options havebeen granted. No options had been exercised by 30 June 2010.Subsequent to this date and to the date of this report 344 000options have been exercised. The ordinary shares in the Companyallocated to the participants as a consequence of such exercisehave been issued from shares held by the Trust which wereacquired in the open market for purposes of the Scheme.
ELB shares held by the Group’s share trusts and incentive sharesnot as yet paid for by participants are regarded as shares underthe control of the trusts and are eliminated on consolidation astreasury shares.
DIRECTORATE
The names as well as a brief history of the directors of theCompany appear on page 6 whilst the name of the Companysecretary in office at the date of this report, and the Company’sbusiness and postal addresses appear on page 70.
The following appointments, resignations and retirementsoccurred during the financial period under review and until thedate of this report.
AppointmentsIAR Thomson 28 September 2010
ResignationsTJ Matsau 1 September 2009
In compliance with the JSE Listings Requirements, Mr T de Bruyn,an independent non-executive director, was appointed the leadindependent director on 21 May 2010.
In terms of the Company’s Articles of Association, the followingdirectors retire at the forthcoming Annual General Meeting and,being eligible, are available for re-election: Messrs MV Ramolloand IAR Thomson.
Details of directors’ remuneration and options in respect ofordinary shares in the Company are contained in note 33 to theannual financial statements. Details of directors’ interests inthe ordinary shares of the Company are provided on page 68.
POST BALANCE SHEET DATE EVENTS
No material fact or circumstance has occurred after the financialyear end, being 30 June 2010, and the date of this report.
Directors’ report
11
Introduction
The reporting entity is ELB Group Limited (the Company), acompany domiciled in South Africa. The Company and itssubsidiaries, joint ventures and share trusts are collectivelyreferred to as the Group. The annual financial statements for theyear ended 30 June 2010 comprise the annual financialstatements of the Company (the Company annual financialstatements) and the consolidated annual financial statementswhich incorporate the annual financial statements of the Companyand the annual financial statements of its subsidiaries, jointventures and share trusts (the Group annual financial statements).The separate Company annual financial statements and Groupannual financial statements are together referred to hereafter asthe annual financial statements.
The annual financial statements were authorised for issue by thedirectors of the Company on 20 October 2010.
Compliance
The annual financial statements have been prepared inaccordance with International Financial Reporting Standards(IFRS) and interpretations of those Standards, as issued by theInternational Accounting Standards Board (IASB); the SouthAfrican statements and interpretations of Generally AcceptedAccounting Practice (GAAP) as well as the accounting guides andcirculars, all issued by the South African Institute of CharteredAccountants (SAICA); and the requirements of the Companies Actof South Africa.
Basis of preparation
The annual financial statements are presented in South AfricanRands, which is the functional currency of the Company, roundedto the nearest thousand. They are prepared on the historical costbasis, modified by restatement of certain financial instruments tofair value. Accrual accounting is used. The annual financialstatements are also prepared on the going concern basis since thedirectors believe that the Company and the Group have adequateresources to continue operating for the foreseeable future. Detailssupporting the going concern assessment are given in thedirectors’ responsibility statement.
During the year the following accounting standards, which had aneffect on the reporting of the Group for the year, became effective.
Amendments to IAS 1 – Presentation of financial statements.
The term ‘total comprehensive income’ was introduced by therevised IAS 1. The term covers all changes in equity during aperiod other than changes arising from transactions with owners intheir capacity as owners. Total comprehensive income may bepresented in an income statement, which arrives at profit for theperiod, as before, and a separate statement of comprehensiveincome detailing the other equity changes (‘other comprehensiveincome’) covered by the term. This presentation has been adoptedin these annual financial statements.
Alternatively total comprehensive income may be presented in asingle statement of comprehensive income, which effectivelycombines the income statement and all non owner equity changesin a single statement. Such a statement would have a significanteffect on the presentation of the annual financial statements. Thealternative presentation has not been adopted.
Amendments to IAS 23 – Borrowing costs
The revised IAS 23 generally requires the capitalisation ofborrowing costs that can be directly attributable to the acquisition,construction or production of a qualifying asset, as part of the costof such asset. The revised standard does not permit the option,practised by the Group until 30 June 2009, of recognising allborrowing costs as an expense, which was the benchmarktreatment of the previous version. The change in accounting policywill be applied prospectively to new qualifying assets acquired,constructed or produced after 30 June 2009. The change will haveparticular relevance to the purchase of property. In the year ended30 June 2010 (the first period of application) although an additionalproperty was acquired, the requirements for capitalising borrowingcosts did not arise and no interest was capitalised. The revisiontherefore had no effect in the current year.
IFRS 7 – Financial instruments: disclosure
An amendment to the standard requires that, in the risk analysis forfinancial instruments, the financial instruments measured at fair valuethrough profit or loss be tabled in a fair value hierarchy that reflectsthe significance of the inputs used in making the measurements.
IFRS 8 – Operating segments
The new standard introduces the ‘management approach’ tosegment reporting. This approach requires segment reporting tobe based on the internal reports regularly reviewed by the Group’schief operating decision maker in order to assess each segment’sperformance and to allocate resources to each segment.
Implementation of the above standards had no effect on profit orearnings per ordinary share for the year. Other standards andinterpretations which became effective in the current financial yearwere either not relevant to the operations of the Group or had noeffect on the Group’s accounting policies.
Except for the implementation of the above standards, theaccounting policies set out below have been applied consistently toall periods presented in these annual financial statements and havealso been applied consistently by all Group entities. Accountingpolicies are the specific principles, bases, conventions, rules andpractices applied in preparing and presenting the annual financialstatements. Changes in accounting policies are accounted for inaccordance with the transitional provisions in the applicablestandard. If no such guidance is given the change is appliedretrospectively as if the accounting policy had been applied in thepast, and comparative amounts are restated where applicable.Where it is impractical to apply a change retrospectively the changeis applied prospectively to transactions, other events and conditionsoccurring after the date that the policy changed.
The preparation of the annual financial statements in accordancewith IFRS requires management to make judgements, estimatesand assumptions that affect the application of accounting policiesand reported amounts of assets and liabilities and income andexpense. The estimates and underlying assumptions are based onhistorical experience and various other factors that are believed tobe reasonable under the circumstances. Actual results may differfrom these estimates. The estimates and assumptions are reviewedon an ongoing basis. Revisions to accounting estimates arerecognised in the period in which the estimate is revised if therevision affects only that period, or in the period of the revision andfuture periods if the revision affects both current and future periods.
Accounting policies
12
Accounting policies involving a higher degree of complexity andwhere assumptions and estimates are significant to the financialstatements are useful life, residual value and impairment ofproperty, plant and equipment, the recognition of deferred incometax assets, construction contracts and the provisions for trade backcommitments. Further information is given in the accountingpolicies relating to these activities.
There are no key assumptions concerning the future and otherkey sources of estimation uncertainty at the balance sheet datethat management have assessed as having a significant risk ofcausing material adjustment to the carrying amounts of assetsand liabilities in the next financial year.
Foreign currency transactions
Transactions in foreign currencies are translated into therespective currencies of the group entities at the rates of exchangeruling at the dates of the transactions. Gains and losses onsettlement, arising from fluctuations in exchange rates, arerecognised in profit or loss. Monetary assets and liabilitiesdenominated in foreign currencies at the end of the reportingperiod are translated to South African Rands at the rates ruling atthat date. Gains or losses on translation are recognised in profit orloss. Non monetary assets and liabilities that are measured athistorical cost in foreign currencies are translated using theexchange rates at the dates of the transactions. Non monetaryassets and liabilities that are measured at fair value are translatedat the exchange rate at the date that the fair value was determined.
Prior period errors
Where an error relating to a prior period is sufficiently material soas to distort the presentation of the results or the financialposition, then such error is reflected as a prior period correctionin the statement of changes in equity, and the comparatives inthe annual financial statements are restated.
Consolidation
Basis
The annual financial statements show the financial position andresults of the Company and the consolidated financial position andresults of the Group. Intra group transactions and balances andunrealised profits and losses on intra group transactions areeliminated in the Group annual financial statements, on consoli-dation. Unrealised profits on transactions with joint ventures areeliminated to the extent of the Group’s interest in those entities,and unrealised losses are similarly eliminated, but where there isevidence of impairment such impairment is not eliminated.
Subsidiaries
Subsidiaries are entities controlled by the Group. Control existswhen the Group has the power, directly or indirectly, to govern thefinancial and operating policies of an entity so as to obtain benefitsfrom its activities. In assessing control, potential voting rights thatpresently are exercisable or convertible are taken into account. Thefinancial statements of subsidiaries are included in the Group annualfinancial statements from the date that control commences until thedate that control ceases.
Non controlling interests in the net assets of consolidatedsubsidiaries are shown separately from the Group equity therein.Non controlling interests consist of the amounts of those interests in
subsidiaries at acquisition plus the non controlling interests’subsequent share of changes in equity of the subsidiaries. Onacquisition the non controlling interests are measured at theirproportion of the at acquisition date fair values of the identifiableassets and liabilities acquired.
Joint ventures
Joint ventures are entities over which the Group exercises jointcontrol in terms of a contractual agreement. Joint ventures areproportionately consolidated, whereby the Group’s share of the jointventures’ assets, liabilities, income, expenses and cash flows arecombined with similar items on a line by line basis in the Groupannual financial statements from the date that joint controlcommences until the date that joint control ceases.
Share trusts and treasury shares
The financial statements of the Group’s share trusts are included inthe Group annual financial statements. Ordinary shares in theCompany under the control of the Group’s share trusts are classifiedas treasury shares and reduce the number of ordinary shares inissue. The dividends on the treasury shares reduce the amounts ofthe ordinary dividends paid in the Group annual financialstatements. Dividends received by participants in the share trustsare recognised in profit or loss in the Group annual financialstatements as employee benefits in operating expenses. Ordinaryshares under the control of the share trusts are included as adeduction from issued ordinary share capital in the Group annualfinancial statements. All costs relating to the acquisition of treasuryshares as well as gains or losses on disposal or cancellation oftreasury shares are recognised directly in equity through the Groupstatement of changes in equity.
Business combinations
Business combinations are accounted for using the acquisitionmethod at the acquisition date, which is the date on which control istransferred to the Group. The cost of the acquisition of a subsidiaryor interest in any other business entity is measured at the aggregatefair values, at the date of exchange, of the assets given, liabilitiesincurred, and equity instruments issued, plus any costs directlyattributable to the business combination.
The acquiree’s identifiable assets, liabilities and contingent liabilitiesthat meet the conditions for recognition under IFRS 3 are recognisedat their fair values at the acquisition date, except for non currentassets classified as held for sale in accordance with IFRS 5 whichare recognised and measured at fair value less costs to sell. On anacquisition-by-acquisition basis, the Group recognises any noncontrolling interest in the acquiree either at fair value or the noncontrolling interest’s proportionate share of the acquiree’s netassets.
Goodwill is measured initially as the excess of the fair value of theconsideration transferred over the Group’s interest in the net fairvalue of the identifiable assets, liabilities and contingent liabilitiesrecognised. Where the Group’s interest in the net assets recognisedat the acquisition date is in excess of the cost of the acquisition, theGroup reassesses the identification and measurement of theacquiree’s net assets and the measurement of the cost ofacquisition. If after reassessment the Group’s interest in the netassets exceeds the cost of the acquisition, the excess is recognisedin profit or loss as a bargain purchase price.
Accounting policies(continued)
13
When control is achieved in stages, the fair value of the interestheld immediately before acquiring control is measured. Thecarrying amount is adjusted to the fair value with any gain or lossfrom the adjustment recognised in profit or loss. The fair valueimmediately before acquiring control is included as part of thecost of acquisition.
Goodwill relating to subsidiaries and joint ventures is initiallyrecognised as an asset at cost. Goodwill is not amortised but isreviewed annually at the balance sheet date for impairment.Impairments are recognised as a loss in profit or loss. Goodwillimpairments are not reversed. After initial recognition goodwill ismeasured subsequently at cost less accumulated impairment losses.
The Group carried no goodwill at the dates of the current andcomparative balance sheets.
Foreign entities
All foreign entities within the Group have functional currenciesdifferent to the presentation currency of the Group. The functionalcurrency of an entity is determined based on the currency of theprimary economic environment in which the entity operates. Theresults and financial positions of the foreign entities are included inthe Group annual financial statements using the methods oftranslation described hereafter. The income statements aretranslated at the weighted average rates of exchange for theappropriate periods, except for material non recurring or materialinfrequent items that are translated at the exchange rate at the dateof the transactions. The balance sheets are translated at the rates ofexchange ruling at the balance sheet date. Items in the statementsof comprehensive income and the statements of changes in equityare translated at the weighted average rate of exchange for regularlyrecurring transactions or the rate of exchange at the date of thetransaction for non recurring or infrequent transactions. The gains orlosses on translation are recognised in the foreign currencytranslation reserve through the Group statement of comprehensiveincome and the Group statement of changes in equity. Items in theforeign currency translation reserve that are no longer relevant toany operations or structures of the Group are transferred out of thereserve to retained earnings. Such redundant items usually arisefrom the disposal or restructure of operations, or from changes inaccounting policies.
Recognition and derecognition of assetsand liabilities
An asset is a resource controlled by an entity as a result of a pastevent and from which future economic benefits are expected to flow.An asset is recognised when it is probable that future economicbenefits associated with it will flow to the Group and its cost or fairvalue can be measured reliably.
A liability is a present obligation of an entity arising from a past eventthe settlement of which is expected to result in an outflow from theentity of resources embodying economic benefits. A liability isrecognised when it is probable that future economic benefitsassociated with it will flow from the Group and its cost or fair valuecan be measured reliably.
A financial asset is any asset that is cash or cash equivalent; acontractual right to receive cash or cash equivalent or anotherfinancial asset; a contractual right to exchange financial instrumentswith another entity on potentially favourable terms; or a contract thatwill or may be settled in the entity’s own equity instruments.
A financial liability is any liability that is a contractual obligation todeliver cash or cash equivalent or another financial asset to anotherentity, or to exchange financial assets or financial liabilities withanother entity under conditions that are potentially unfavourable tothe entity; or a contract that will or may be settled in the entity’s ownequity instruments.
A financial instrument is any contract that gives rise to a financialasset of one entity and a financial liability or equity instrument ofanother entity. A financial instrument is recognised when an entitywithin the Group becomes a party to the contractual provisions of theinstrument. A financial asset and a financial liability as a result of afirm commitment is recognised only when one of the parties hasperformed under the contract.
Financial assets or parts thereof are derecognised and removedfrom the balance sheet when the contractual right to receive thecash flows or other financial assets have been transferred or haveexpired or if substantially all the risks and rewards of ownership havepassed. Where substantially all the risks and rewards of ownershiphave not been transferred or retained, the financial assets arederecognised if they are no longer controlled. Where control isretained financial assets are recognised only to the extent of thecontinuing involvement in those assets.
All other assets are derecognised on disposal or when no futureeconomic benefits are expected from their use.
Financial liabilities are derecognised when the relevant obligationshave either been discharged or cancelled, or have expired.
Property, plant and equipment
Property, plant and equipment represent tangible assets that areheld for use in the production or supply of goods and services, forrental to others, or for administrative purposes and are expected tobe used during more than one reporting period.
Property, plant and equipment are stated at cost, less accumulateddepreciation and accumulated impairment losses.
Cost includes all expenditure that is directly attributable to theacquisition of the asset. The cost of self constructed assetsincludes the cost of materials and direct labour, any other costsdirectly associated with bringing the assets to a working conditionfor their intended use, and the costs of dismantling and removingthe items and restoring the site on which they are located. Costalso includes, where applicable, the borrowing costs attributable tothe asset, during such period where it is necessary to prepare theasset for its intended use, to the time that the asset is substantiallyready for its intended use.
The cost of replacing part of an item of property, plant and equipmentis recognised in the carrying amount of the item if it is probable thatfuture economic benefits embodied within the part will flow to theGroup, and its cost can be measured reliably. The carrying amount ofthe replaced part is derecognised. The cost of maintaining property,plant and equipment is recognised in profit or loss.
Depreciation is the systematic allocation of the depreciableamount of an asset over its useful life. The depreciable amount ofan asset is the cost of the asset, or other amount substituted forcost, less its residual value. Residual value is the estimatedamount that an entity would currently obtain from disposal of theasset, after deducting the estimated costs of disposal; if the assetwere already of the age and in the condition expected at the end
14
Accounting policies(continued)
of its useful life. Useful life is the period over which an asset isexpected to be available for use or the number of production orsimilar units expected to be obtained from the asset. When partsof an item of property, plant and equipment have different usefullives, they are accounted for as seperate items (majorcomponents) of property, plant and equipment.
Property, plant and equipment, including capitalised leasedassets but excluding the aircraft mentioned below, aredepreciated at rates intended to write them off on a straight linebasis over their useful lives to their residual values. Thedepreciation expense is recognised in profit or loss. Depreciationmethods, useful lives and residual values are reviewed annuallyat the balance sheet date.
The aircraft is owned by a joint venture partnership in which theGroup has a 34% interest. The aircraft is not depreciated but isstated at its fair value at each balance sheet date. The fair valueadjustment is recognised in profit or loss.
Profits and losses on disposals of property, plant and equipmentare determined by comparing the proceeds from the disposalswith the carrying amounts of the items sold, and are recognisedin profit or loss.
Intangible assets
Intangible assets are identifiable non monetary assets withoutphysical substance.
Intangible assets are stated at cost, less accumulated amorti-sation and accumulated impairment losses. Intangible assets areamortised to their residual values on a straight line basis overtheir useful lives, which are relatively short and usually five years.
The carrying amount of each intangible asset is reviewed at eachreporting date and impairment losses are recognised wherenecessary.
The Group carried no intangible assets at the dates of the currentand comparative balance sheets.
Research costs, arising from original and planned investigationsundertaken with the prospect of gaining new scientific ortechnical knowledge and understanding, are recognised in profitor loss as they are incurred.
Impairment of non financial assets
The Group’s non financial assets, other than inventories anddeferred income tax assets, which are separately reviewed andprovided against where necessary, are assessed annually at thebalance sheet date to determine whether there are any indicationsof impairment. If any such indication exists for any asset, therecoverable amount of that asset is estimated in order todetermine the extent of any impairment loss for the asset. Therecoverable amount is the higher of the asset’s fair value lessexpenses to sell, or the asset’s value in use. Value in use isestimated taking into account future cash flows, forecast marketconditions and the expected life of the asset. Such cash flows arediscounted using pre tax discount rates that reflect current marketassessments of the time value of money and the risks associatedwith the specific asset. For an asset that does not generate largelyindependent cash flows, the recoverable amount is determined forthe cash generating unit to which the asset belongs. An asset’scash generating unit is the smallest identifiable group of assets
that includes the asset and that generates cash inflows that arelargely independent of the cash inflows from other assets orgroups of assets.
Impairment losses are recognised whenever the carrying amountof a non financial asset or its cash generating unit, as isapplicable, exceeds the recoverable amount. Impairment lossesare recognised in profit or loss.
An impairment loss in respect of goodwill is not reversed or reduced.For other non financial assets the impairment loss is assessed ateach balance sheet date for indications that the impairment loss hasreduced or no longer exists. Where an impairment loss is reduced orreversed the carrying amount of the asset is increased to the revisedestimate of its recoverable amount but limited to the carrying amountthat would have been determined, net of depreciation or amorti-sation, had no impairment loss had been recognised in prior periods.Reductions or reversals of impairment losses are recognised inprofit or loss.
Interest in subsidiaries
The Company’s interest in subsidiaries comprises equityinvestments in the subsidiaries and loans to the subsidiaries.These are carried at cost less impairments. Impairments areassessed with reference to the net equity and projectedprofitability of subsidiaries.
Construction contracts
A construction contract is a contract specifically negotiated for theconstruction of an asset or a combination of assets that are closelyinterrelated or interdependent in terms of their design, technologyand function or their ultimate purpose or use. A fixed price contractis a contract where the contractor agrees to a fixed contract price ora fixed rate per unit of output, and might be subject to cost escalationclauses. Escalation clauses allow amounts payable under suchcontracts to be adjusted for increases in items such as salary andwage rates, amended charges by statutory authorities, marketprices of materials and commodities, currency exchange rates anddelivery charges. A cost plus contract is a contract where thecontractor is reimbursed for allowable or otherwise defined costs,plus a percentage of these costs or a fixed fee.
Revenue from fixed price construction contracts is recognised foreach contract on the stage of completion method, based generallyon the ratio of costs incurred to date to total estimated costs, or oncompleted manhours to date to estimated total manhours, or on theproportion of physical progress to date to the completed contract. Allpossible contingencies requiring additional costs or manhours, orwhich impede physical progress, are reviewed in determining thestage of completion. In management’s judgement and from historicalexperience, contracts which are not yet 30% complete areconsidered to be contracts where the outcome cannot be estimatedwith reasonable assurance, and revenue on these contracts isrecognised only to the extent of contract costs incurred to date thatare considered to be recoverable.
Revenue from cost plus construction contracts is recognised for theservices rendered to date in terms of the contracts.
Terms and conditions negotiated with clients vary from oneconstruction contract to another. These terms and conditions influencecontract pricing and are inextricably interwoven with contractprofitability.
Accounting policies(continued)
15
When it is probable, for any contract, that total contract costs willexceed total contract revenue the expected loss is recognisedimmediately for all such contracts.
Construction contract work not yet billed represents costs incurredon construction contracts plus profits recognised that have not yetbeen included in billings to clients.
Construction contract liabilities comprise billings to clients inadvance of the stage of completion and provisions for estimatedcosts relevant to the stage of completion. Charges from suppliers forgoods delivered or services rendered to date on contracts, wherethese are not yet settled, and any additional accruals related thereto,are carried separately as trade payables.
Inventories
Inventories are assets held for sale in the normal course ofbusiness, or held in the process of production for such sale, orheld in the form of materials or supplies to be consumed in theproduction process or in the rendering of services.
Inventories are valued at the lower of cost, determined on thefirst in first out (FIFO) method or weighted average cost basis,and net realisable value. Production overheads are included inthe cost of work in progress and manufactured finished goods.
Net realisable value is the estimated selling price in the ordinarycourse of business, less the estimated costs of completion andthe estimated selling expenses.
Financial instruments
Financial instruments are described in the accounting policy for therecognition and derecognition of assets and liabilities. The differentcategories of these instruments, their initial recognition andsubsequent measurement, are outlined below. Fair value in thenotes below is market value of the instrument if listed, or a valuedetermined using an appropriate valuation model if unlisted.
Loans and receivables
Loans and receivables are non derivative financial assets with fixedor determinable payments that are not quoted in an active marketand are recognised initially at fair value plus transaction costs. Fairvalue adjustments are recognised in profit or loss. Subsequent toinitial recognition loans and receivables are stated at amortised costusing the effective interest rate method, less impairments.Impairment is equal to the difference between the carrying amountof a loan or receivable and the present value of the estimated futurecash flows discounted at the original effective interest rate.Impairments are established when there is evidence that amountswill not be realised in accordance with the original terms of the loansand receivables. In addition collective impairments are made basedon management’s assessment of current trading and economicconditions. Impairments and impairment reversals and reductionsare recognised in profit or loss.
Financial assets at fair value through profit or loss
Financial assets at fair value through profit or loss comprisefinancial assets classified as held for trading, derivativeinstruments and those financial assets designated at fair valuethrough profit or loss on initial recognition. Financial assets at fairvalue through profit or loss are recognised initially at fair value
and are measured subsequently also at fair value. Fair valuegains and losses are recognised in profit or loss. Additionalinformation on derivative instruments is included in a separateparagraph below.
Cash and cash equivalents
Cash and cash equivalents comprise cash balances and call andterm deposits and are initially recognised at fair value plustransaction costs. Fair value adjustments are recognised in profitor loss. Subsequent to initial recognition cash and cashequivalents are stated at amortised cost using the effectiveinterest rate method.
Short term borrowings and bank overdrafts form an integral partof the Group’s cash management and are included as acomponent of net cash and cash equivalents for purposes of thecash flow statement.
Financial liabilities
Financial liabilities at fair value through profit or loss, whichincludes derivative instruments, are recognised initially at fairvalue and are measured subsequently also at fair value. Tradeand other payables and all other financial liabilities except thosedescribed above, are recognised initially at fair value plustransaction costs and thereafter stated at amortised cost usingthe effective interest rate method. Fair value adjustments arerecognised in profit or loss.
Derivative instruments
The Group uses derivative financial instruments to manage itsexposure to foreign currency exchange price risks arising fromoperating activities. The Group does not hold or issue derivativeinstruments for dealing purposes.
Derivative instruments used are foreign currency forwardexchange contracts (FECs) which are classified as held fortrading and measured at fair value. Fair value adjustments arerecognised in profit or loss. Fair value is determined bycomparing the contractual value to the value of an equivalentFEC with the same maturity date but contracted at the balancesheet date.
Financial guarantee contracts
A financial guarantee contract is a contract that requires the issuerto reimburse the holder for losses sustained by the holder wherethe debtor or debtors specified in the contract fails to makepayments that are contractually due. Financial guarantee contractsthat are issued by the Group are recognised initially at fair valueplus transaction costs and are stated subsequently at the higher ofthe amount of the obligation under contract determined inaccordance with IAS 37 and the amount initially recognised, lessaccumulated amortisation. Fair value adjustments and amorti-sation expenses are recognised in profit or loss.
Offset
A financial asset and a financial liability are offset and the netamount reported in the balance sheet only when the Group has alegally enforceable right to set off the recognised amounts, andintends to settle on a net basis, or to realise the asset and settlethe liability simultaneously.
Accounting policies(continued)
16
Non current assets held for sale and discontinued operations
Non current assets (or disposal groups comprising assets andliabilities) that are expected to be recovered primarily through sale rather than through continuing use are classified as held for sale.Immediately before classification as held for sale, the assets (orcomponents of a disposal group) are remeasured in accordancewith the Group’s accounting policies. Then, on initial classification asheld for sale, non current assets and disposal groups are recognisedat the lower of carrying amount and fair value less costs to sell.Impairment losses on initial classification as held for sale areincluded in profit or loss, even when there is a revaluation. The sameapplies to gains and losses on subsequent remeasurement. Gainsare not recognised in excess of any cumulative impairment loss.
A discontinued operation is a component of the Group’s businessthat represents a separate major line of business or geographicalarea of operations. Classification as a discontinued operation occursupon the earlier of disposal or when the operation meets the criteriato be classified as held for sale. Discontinued operations areseparately recognised in the annual financial statements oncemanagement has made a commitment to discontinue the operationwithout a realistic possibility of withdrawal. The comparative incomestatement and comparative statement of comprehensive income arerestated as if the operation had been discontinued from the start ofthe comparative period.
Provisions
A provision is recognised in the balance sheet when the Group hasa present legal or constructive obligation as a result of past events,and it is probable that an outflow of economic benefits will berequired to settle the obligation, and a reliable estimate can be madeof the obligation. If the effect is material, a provision is determined bydiscounting the expected future cash flows at a pre tax rate thatreflects current market assessments of the time value of money andthe risks specific to the obligation. The unwinding of the discount isrecognised in profit or loss as a finance cost.
Restructuring
A provision for restructuring is recognised when the Group hasapproved a detailed and formal restructuring plan, and therestructuring has either commenced or has been announcedpublicly. Future operating losses are not provided for.
Onerous contracts
A provision for onerous contracts is recognised when theexpected benefits to be derived by the Group from a contract arelower than the unavoidable cost of meeting the obligations underthe contract. The provision is measured at the present value ofthe lower of the expected cost of terminating the contract and theexpected net cost of continuing with the contract. Before aprovision is established the Group recognises any impairmentloss on the assets associated with that contract.
Revenue
Sales
Sales revenue comprises the fair value of the consideration receivedor receivable for the sale of goods, revenue recognised onconstruction contracts, and for other services rendered in the courseof the Group’s operating activities. Sales revenue excludes value
added tax (VAT), goods and services tax (GST), and rebates anddiscounts. Sales within the Group are eliminated. Revenue from thesale of goods is recognised when the significant risks and rewards ofownership have transferred to the buyer. Revenue for servicesrendered is recognised as services are rendered. Revenue forservices rendered includes commission, which is stated separately.Revenue is not recognised when it cannot be measured reliably orwhere there are significant uncertainties regarding the recovery of theconsideration due, associated costs or the possible return of goods,or continuing management involvement with the goods delivered orservices rendered.
The recognition of revenue on construction contracts is detailedin the accounting policy regarding that activity.
Interest received
Interest received is recognised on a time proportion basis usingthe effective interest rate method.
Dividends received
Dividends are recognised when the right to receive payment isestablished; with the exception of dividends on preference shareinvestments which are recognised on a time proportion basis, usingthe effective interest rate method, in the period to which they relate.
Cost of sales
When inventories are sold the carrying amount is recognised as partof the cost of sales. Any write downs of inventory to net realisablevalue and all losses of inventories or reversals of previous writedowns or losses are recognised in cost of sales in the period thewrite down, loss or reversal occurs.
Employee benefits
Employee benefits expense
All short term employee benefit expenses such as salaries,bonuses, allowances, leave pay entitlement and medical aid andother contributions are measured and recognised in full on anundiscounted basis in profit or loss in the period in which theemployees render the related services. Termination costs arerecognised in full on an undiscounted basis in profit or loss whenthe commitment to the termination plan is made. Dividendsdeclared by the Company and received by the ELB ParticipantsShare Trust and thereafter distributed to participants areclassified as employee benefits expense; as are dividends onCompany shares allocated to participants by the ELB ShareIncentive Trust, but which are not yet paid up and remain underthe control of the Trust.
Retirement benefits
The Group provides a defined contribution retirement plan and adefined benefit retirement plan (now closed to new entrants), theassets of which are held in separate funds, for the benefit ofemployees. The Group’s contributions to the plans arerecognised as an expense in the period to which they relate.
A defined contribution retirement plan is a post employmentbenefit plan under which an entity pays contributions into aseparate entity and will have no legal or constructive obligation topay further amounts.
A defined benefit retirement plan is a post employment benefit planother than a defined contribution retirement plan. The Group’s net
Accounting policies(continued)
17
obligation in respect of the defined benefit retirement plan iscalculated by estimating the amount of future benefit that employeeshave earned in return for their service in the current and pastperiods. The benefit is discounted to its present value. Anyunrecognised past service costs and the fair value of the plan assetsare deducted. The calculation is performed annually by a qualifiedactuary using the projected unit credit method. When the definedbenefit retirement plan is in surplus, which is the position currently,and in the absence of imminent circumstances likely to eliminate thesurplus, the Group would usually recognise no additional costs otherthan contributions. The Group applies the corridor method forrecognising actuarial gains or losses in respect of the defined benefitretirement plan. There has been no spreading and the full gain orloss in excess of the corridor is recognised in each reporting period.
Share based payment transactions
Equity settled share options
The fair value of share options granted to Group employees isrecognised as an employee benefits expense in profit or loss, with acorresponding and compensating increase in equity reserves. Thefair value is measured at grant date and expensed in profit or lossover the period during which the employee becomes unconditionallyentitled to the equity instruments. The fair value of the instrumentsgranted is measured using generally accepted valuation techniques,taking into account the terms and conditions upon which theinstruments are granted. The amount recognised as an expense isadjusted to reflect the number of awards for which the relatedservice and non market vesting conditions are expected to be met,such that the total expense ultimately recognised is based on theactual number of share options that vest.
Leases
Leases are classified as finance leases or operating leases at theinception of the lease. A finance lease effectively transfers fromthe lessor to the lessee all the risks and rewards of ownership ofthe underlying asset, without transferring legal ownership. Anoperating lease is a lease where the lessor effectively retainssubstantially all the risks and rewards.
Where an asset is acquired under a finance lease the asset iscapitalised at the beginning of the lease term at the lower of its fairvalue or the present value of the minimum lease payments. Thecorresponding rental obligations, net of finance charges, are raisedas a non current interest bearing borrowing from the lessor. Eachlease payment is allocated between the reduction of the borrowingand interest expense. Subsequent to initial recognition the asset isaccounted for in accordance with the accounting policy applicableto the asset.
Rental expenses under operating leases are recognised in profit orloss on a straight line basis over the terms of the leases.Contingent rentals, where applicable, are recognised in profit orloss as they accrue.
Abnormal items
Abnormal items are items of income and expense whose size,nature or incidence do not occur in the normal day to dayoperations of the Group and are necessary for separate classifi-cation so as to give a meaningful presentation of the operatingperformance of the Group.
Interest paid
Interest paid comprises interest paid on borrowings calculated on theprincipal outstanding and using the effective interest rate method.
Borrowing costs
Borrowing costs are interest paid and other costs incurred by anentity in the borrowing of funds. Borrowing costs directly attributableto the acquisition, construction or production of assets thatnecessarily take a substantial period of time to prepare for theirintended use or sale are added to the cost of those assets until suchtime as the assets are substantially ready for their intended use orsale. All other borrowing costs are recognised as an expense inprofit or loss in the period in which they are incurred.
Income tax
Income tax expense or credit on the profit or loss for the periodcomprises payable and deferred income tax. Income tax isrecognised in profit or loss except to the extent that it relates toitems recognised in other comprehensive income or directly inequity, where such income tax is accordingly also so recognised.Payable income tax comprises income tax calculated on the basisof the expected taxable income for the period, using the incometax rates based on the laws that have been enacted or substan-tively enacted by the reporting date, and which are applicable forthe period; and any adjustments of income tax payable for priorperiods. When an adjustment in respect of a prior period arisesfrom an error and is sufficiently material so as to misrepresent theresults for the reporting period, then such error is treated inaccordance with the accounting policy on prior period errors.
Deferred income tax is determined using the balance sheetmethod and is measured at the income tax rates based on the lawsthat have been enacted or substantively enacted by the reportingdate. Deferred income tax is recognised on taxable and deductibletemporary differences, unutilised secondary tax on companies(STC) credits, other income tax credits and income tax lossescarried forward. Temporary differences are differences betweenthe carrying amounts of assets and liabilities for financial reportingpurposes and their income tax bases. Deferred income tax is notrecognised for the following temporary differences:
– the initial recognition of goodwill;
– the initial recognition of an asset or liability in a transactionwhich is not a business combination and at the time of thetransaction affects neither the accounting profit nor thetaxable income; and
– temporary differences associated with investments insubsidiaries, joint ventures and branches where the entity isable to control the timing of the reversal of the temporarydifferences and it is probable that the temporary differenceswill not reverse in the foreseeable future.
The income tax rates applicable to temporary differences arethose income tax rates, described above, that are expected to beapplied to the temporary differences when they reverse.
The effect on deferred income tax of any changes in income taxrates is recognised in profit or loss, except where it relates toitems previously charged or credited to other comprehensiveincome or directly to equity through the statement of changes in
Accounting policies(continued)
18
equity where the deferred income tax effects are accordingly alsoso recognised. Deferred income tax assets are recognised to theextent that it is probable that future taxable income will beavailable against which unused income tax credits, income taxlosses carried forward and deductible temporary differences canbe recovered. Deferred income tax assets are reduced to theextent that it is no longer probable that the related income taxbenefits will be realised. Deferred income tax liabilities areamounts of income taxes payable in future periods in respect oftaxable temporary differences.
Deferred income tax assets and liabilities are offset when thereis a legally enforceable right of offset and where the deferredincome tax relates to the same fiscal authority with the sametaxable entity.
Headline earnings
Headline earnings comprise the net profit attributable to ordinaryshareholders of the Company after adjusting for profit or loss onthe disposal of plant and equipment and material income andexpense items excluded from headline earnings in accordancewith The South African Institute of Chartered Accountants’ circular3 of 2009 on headline earnings.
Earnings per ordinary share and headlineearnings per ordinary share
Basic earnings per ordinary share and basic headline earnings perordinary share are calculated by dividing the profit attributable toordinary shareholders of the Company and headline earnings,respectively, by the weighted average number of ordinary sharesin issue for the year, excluding the treasury shares held by theGroup’s share trusts. Diluted earnings per ordinary share anddiluted headline earnings per ordinary share, respectively,recognise the dilutory effect of the equity settled share options thathave been awarded and accepted, but not yet exercised.
Dividends paid and payable
Dividends declared to equity holders are included in the statementof changes in equity in the period in which they are declared. STCexpenses and STC credits are recognised in profit or loss in theperiod in which the dividends are declared.
Operating segments
An operating segment is a component of the Group that engagesin business activities from which it may earn revenues (includingrevenues and expenses relating to transactions with othercomponents of the Group) and for which discrete financialinformation is available. The operating results and financialinformation of the Group’s segments is reported to the Group’schief operating decision maker, to assess the performance of thesegments and to make decisions regarding resources to beallocated to the segments.
Inter segmental transactions, where applicable, are made on anarms length basis.
The Group’s format for segment reporting is based on operatingsegments and is representative of the internal structure used formanagement reporting. The Group reports its segments based onthe location of its operating activities. Segment reports are madeon operations in Africa and operations in Australia.
Accounting standards, amendments andinterpretations in issue but not yet effective
Certain new standards and amendments and interpretations toexisting standards have been published that are mandatory but noteffective for the Group annual financial statements, and which theGroup has not early adopted. These standards will not have amaterial effect on the Group annual financial statements.
IFRS 9 – Financial instrumentsEffective for financial periods commencing on or after 1 January 2013.IFRS 9 is the first standard issued as part of a wider project toreplace IAS 39 – Financial instruments: recognition andmeasurement. The standard retains but simplifies the mixedmeasurement model and establishes two primary measurementcategories for financial assets: amortised cost and fair value. Thebasis of classification depends on the entity’s business model andthe contractual cash flow characteristics of the financial asset. Theguidance in IAS 39 on impairment of financial assets and hedgeaccounting continues to apply. Prior periods need not be restatedif an entity adopts the standard for reporting periods beginningbefore 1 January 2012. Although having a minimal present effectfor the Group, the new standard could simplify future classifi-cations and measurements.
IAS 24 – Related party disclosuresEffective for financial periods commencing on or after 1 January2011. This standard clarifies and simplifies the definition of arelated party.
Other new standards, amendments and interpretations not yeteffective will not have a significant effect on the Group annualfinancial statements. Those applicable to the Group are:
IFRS 7 – Financial instruments: disclosureIAS 1 – Presentation of financial statements
Accounting policies(continued)
19
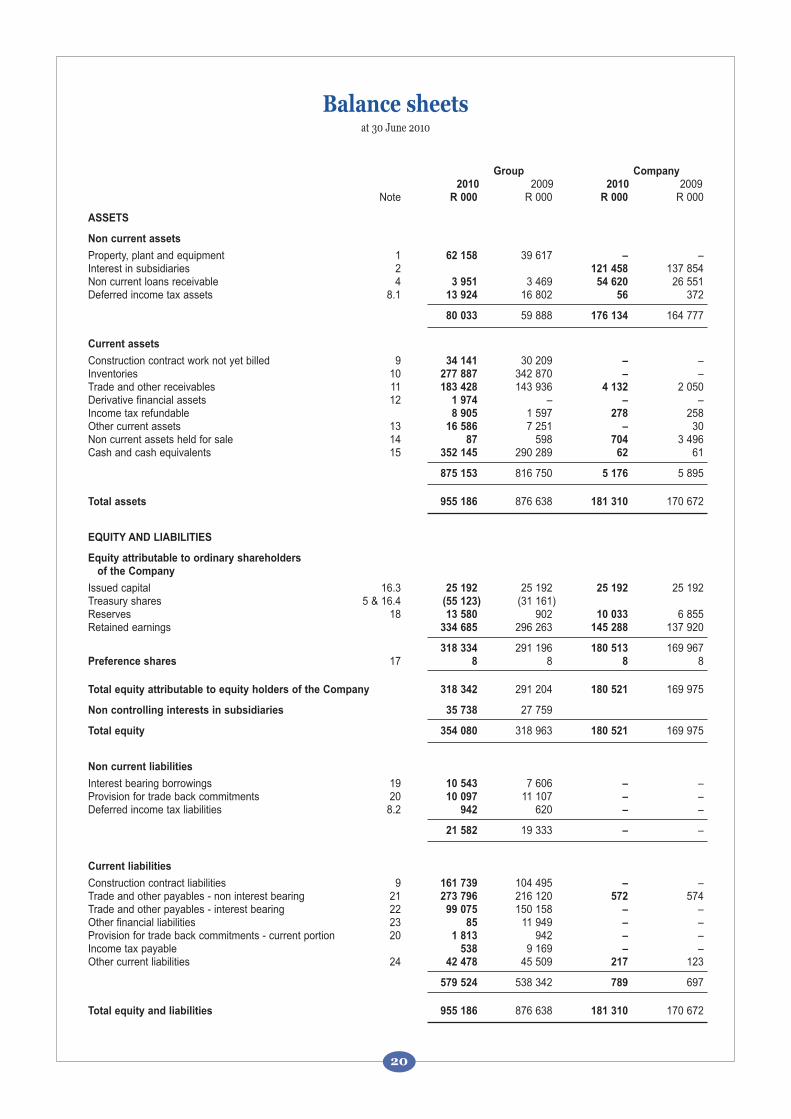
Group Company 2010 2009 2010 2009
Note R 000 R 000 R 000 R 000
ASSETS
Non current assets
Property, plant and equipment 1 62 158 39 617 – –Interest in subsidiaries 2 121 458 137 854Non current loans receivable 4 3 951 3 469 54 620 26 551Deferred income tax assets 8.1 13 924 16 802 56 372
80 033 59 888 176 134 164 777
Current assets
Construction contract work not yet billed 9 34 141 30 209 – –Inventories 10 277 887 342 870 – –Trade and other receivables 11 183 428 143 936 4 132 2 050Derivative financial assets 12 1 974 – – –Income tax refundable 8 905 1 597 278 258Other current assets 13 16 586 7 251 – 30Non current assets held for sale 14 87 598 704 3 496Cash and cash equivalents 15 352 145 290 289 62 61
875 153 816 750 5 176 5 895
Total assets 955 186 876 638 181 310 170 672
EQUITY AND LIABILITIES
Equity attributable to ordinary shareholders of the Company
Issued capital 16.3 25 192 25 192 25 192 25 192Treasury shares 5 & 16.4 (55 123) (31 161)Reserves 18 13 580 902 10 033 6 855Retained earnings 334 685 296 263 145 288 137 920
318 334 291 196 180 513 169 967Preference shares 17 8 8 8 8
Total equity attributable to equity holders of the Company 318 342 291 204 180 521 169 975
Non controlling interests in subsidiaries 35 738 27 759
Total equity 354 080 318 963 180 521 169 975
Non current liabilities
Interest bearing borrowings 19 10 543 7 606 – –Provision for trade back commitments 20 10 097 11 107 – –Deferred income tax liabilities 8.2 942 620 – –
21 582 19 333 – –
Current liabilities
Construction contract liabilities 9 161 739 104 495 – –Trade and other payables - non interest bearing 21 273 796 216 120 572 574Trade and other payables - interest bearing 22 99 075 150 158 – –Other financial liabilities 23 85 11 949 – –Provision for trade back commitments - current portion 20 1 813 942 – –Income tax payable 538 9 169 – –Other current liabilities 24 42 478 45 509 217 123
579 524 538 342 789 697
Total equity and liabilities 955 186 876 638 181 310 170 672
Balance sheetsat 30 June 2010
20
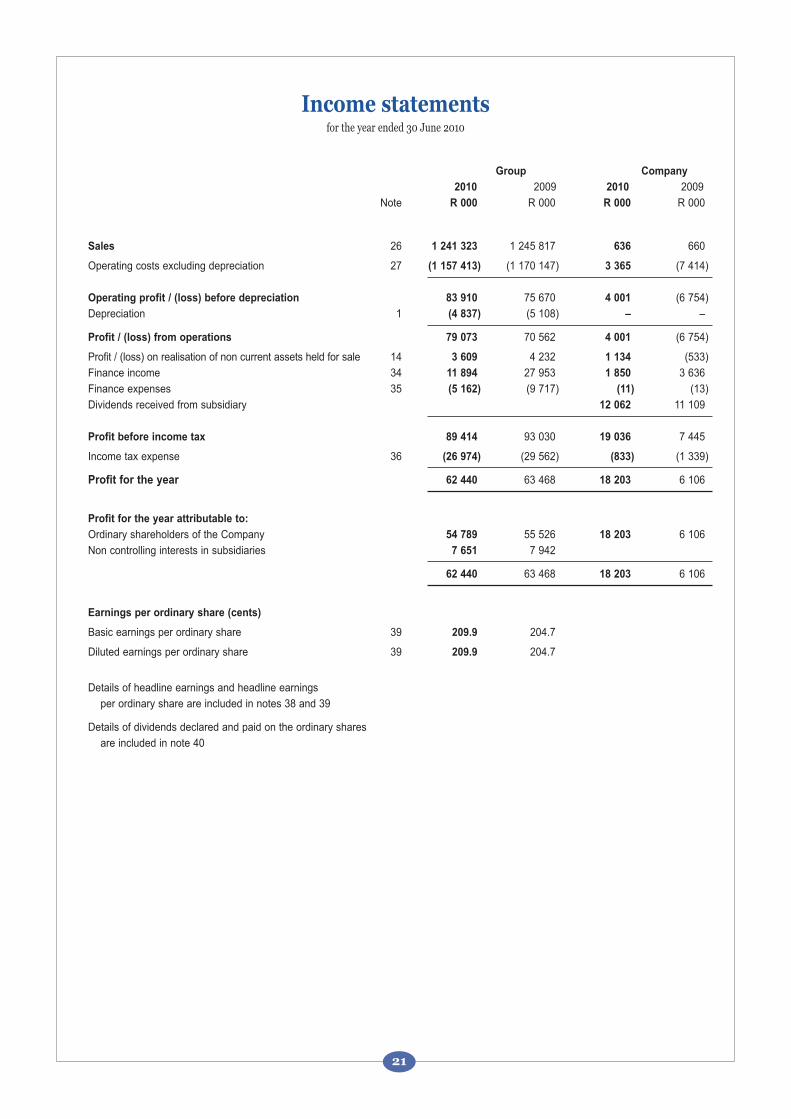
Group Company
2010 2009 2010 2009
Note R 000 R 000 R 000 R 000
Sales 26 1 241 323 1 245 817 636 660
Operating costs excluding depreciation 27 (1 157 413) (1 170 147) 3 365 (7 414)
Operating profit / (loss) before depreciation 83 910 75 670 4 001 (6 754)
Depreciation 1 (4 837) (5 108) – –
Profit / (loss) from operations 79 073 70 562 4 001 (6 754)
Profit / (loss) on realisation of non current assets held for sale 14 3 609 4 232 1 134 (533)
Finance income 34 11 894 27 953 1 850 3 636
Finance expenses 35 (5 162) (9 717) (11) (13)
Dividends received from subsidiary 12 062 11 109
Profit before income tax 89 414 93 030 19 036 7 445
Income tax expense 36 (26 974) (29 562) (833) (1 339)
Profit for the year 62 440 63 468 18 203 6 106
Profit for the year attributable to:
Ordinary shareholders of the Company 54 789 55 526 18 203 6 106
Non controlling interests in subsidiaries 7 651 7 942
62 440 63 468 18 203 6 106
Earnings per ordinary share (cents)
Basic earnings per ordinary share 39 209.9 204.7
Diluted earnings per ordinary share 39 209.9 204.7
Details of headline earnings and headline earnings
per ordinary share are included in notes 38 and 39
Details of dividends declared and paid on the ordinary shares
are included in note 40
Income statementsfor the year ended 30 June 2010
21
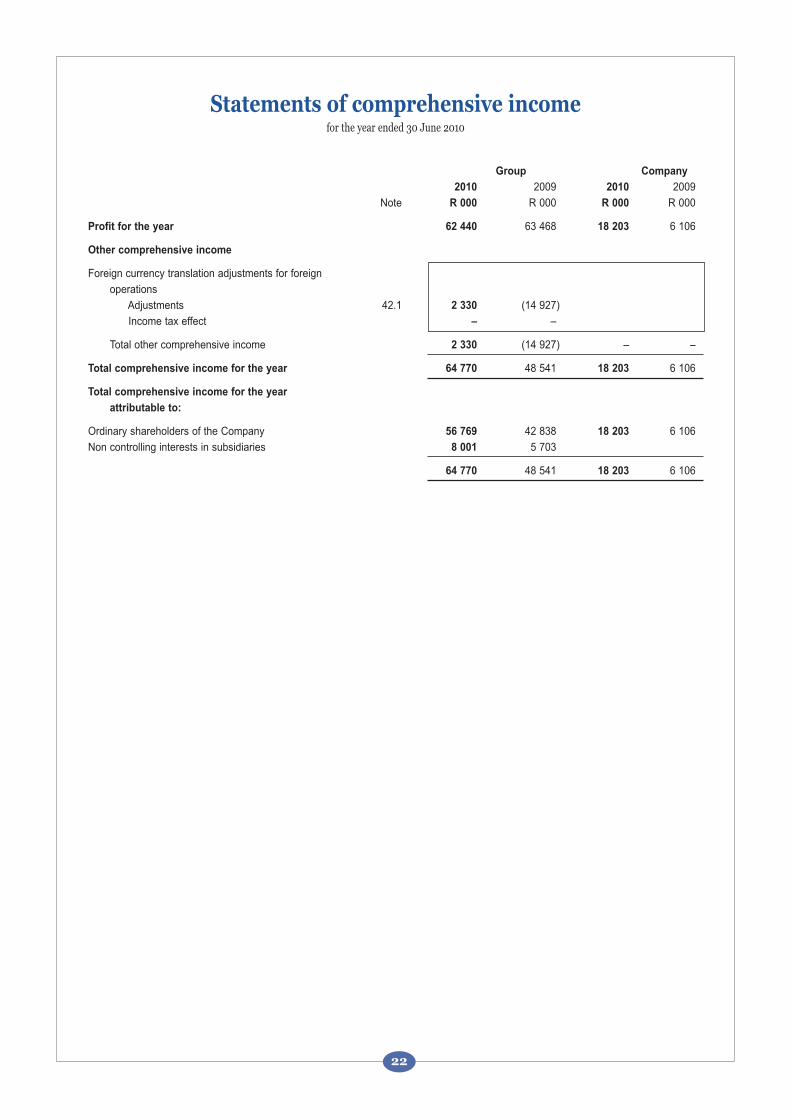
Group Company
2010 2009 2010 2009
Note R 000 R 000 R 000 R 000
Profit for the year 62 440 63 468 18 203 6 106
Other comprehensive income
Foreign currency translation adjustments for foreign
operations
Adjustments 42.1 2 330 (14 927)
Income tax effect – –
Total other comprehensive income 2 330 (14 927) – –
Total comprehensive income for the year 64 770 48 541 18 203 6 106
Total comprehensive income for the year
attributable to:
Ordinary shareholders of the Company 56 769 42 838 18 203 6 106
Non controlling interests in subsidiaries 8 001 5 703
64 770 48 541 18 203 6 106
Statements of comprehensive incomefor the year ended 30 June 2010
22
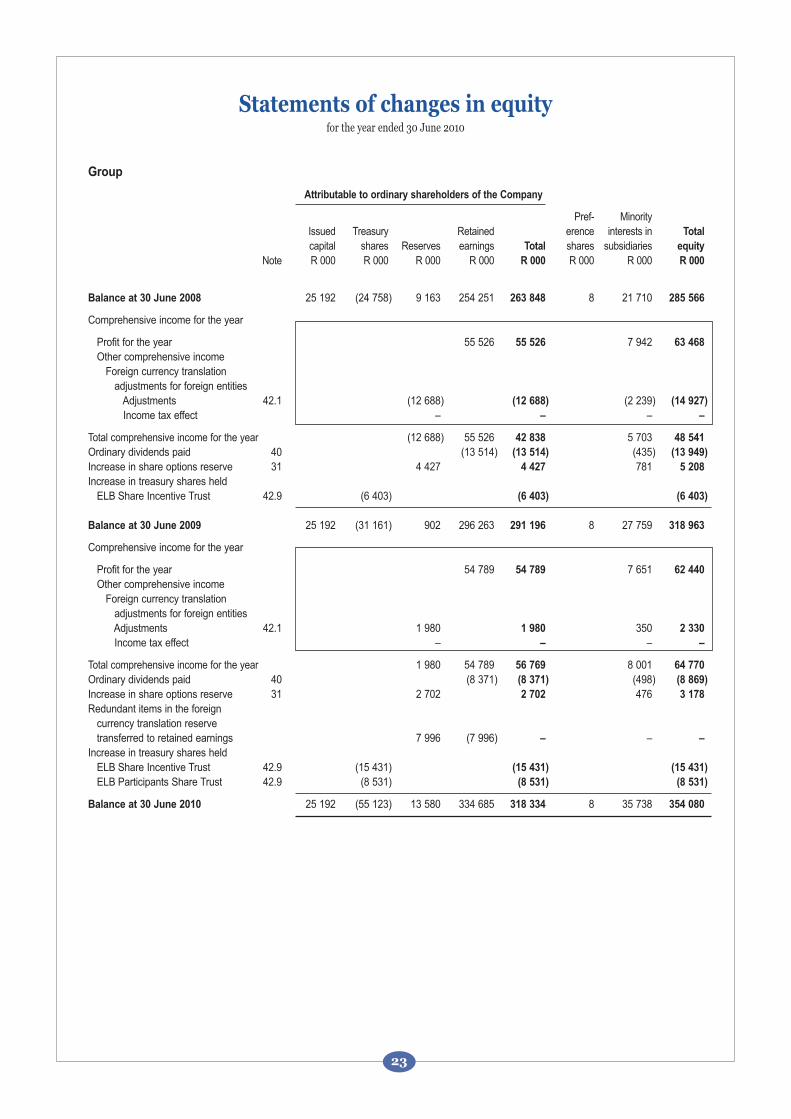
Group
Attributable to ordinary shareholders of the Company
Pref- MinorityIssued Treasury Retained erence interests in Total
capital shares Reserves earnings Total shares subsidiaries equity
Note R 000 R 000 R 000 R 000 R 000 R 000 R 000 R 000
Balance at 30 June 2008 25 192 (24 758) 9 163 254 251 263 848 8 21 710 285 566
Comprehensive income for the year
Profit for the year 55 526 55 526 7 942 63 468
Other comprehensive incomeForeign currency translation
adjustments for foreign entitiesAdjustments 42.1 (12 688) (12 688) (2 239) (14 927)
Income tax effect – – – –
Total comprehensive income for the year (12 688) 55 526 42 838 5 703 48 541
Ordinary dividends paid 40 (13 514) (13 514) (435) (13 949)
Increase in share options reserve 31 4 427 4 427 781 5 208
Increase in treasury shares heldELB Share Incentive Trust 42.9 (6 403) (6 403) (6 403)
Balance at 30 June 2009 25 192 (31 161) 902 296 263 291 196 8 27 759 318 963
Comprehensive income for the year
Profit for the year 54 789 54 789 7 651 62 440
Other comprehensive incomeForeign currency translation
adjustments for foreign entitiesAdjustments 42.1 1 980 1 980 350 2 330
Income tax effect – – – –
Total comprehensive income for the year 1 980 54 789 56 769 8 001 64 770
Ordinary dividends paid 40 (8 371) (8 371) (498) (8 869)
Increase in share options reserve 31 2 702 2 702 476 3 178
Redundant items in the foreign currency translation reservetransferred to retained earnings 7 996 (7 996) – – –
Increase in treasury shares heldELB Share Incentive Trust 42.9 (15 431) (15 431) (15 431)
ELB Participants Share Trust 42.9 (8 531) (8 531) (8 531)
Balance at 30 June 2010 25 192 (55 123) 13 580 334 685 318 334 8 35 738 354 080
Statements of changes in equityfor the year ended 30 June 2010
23
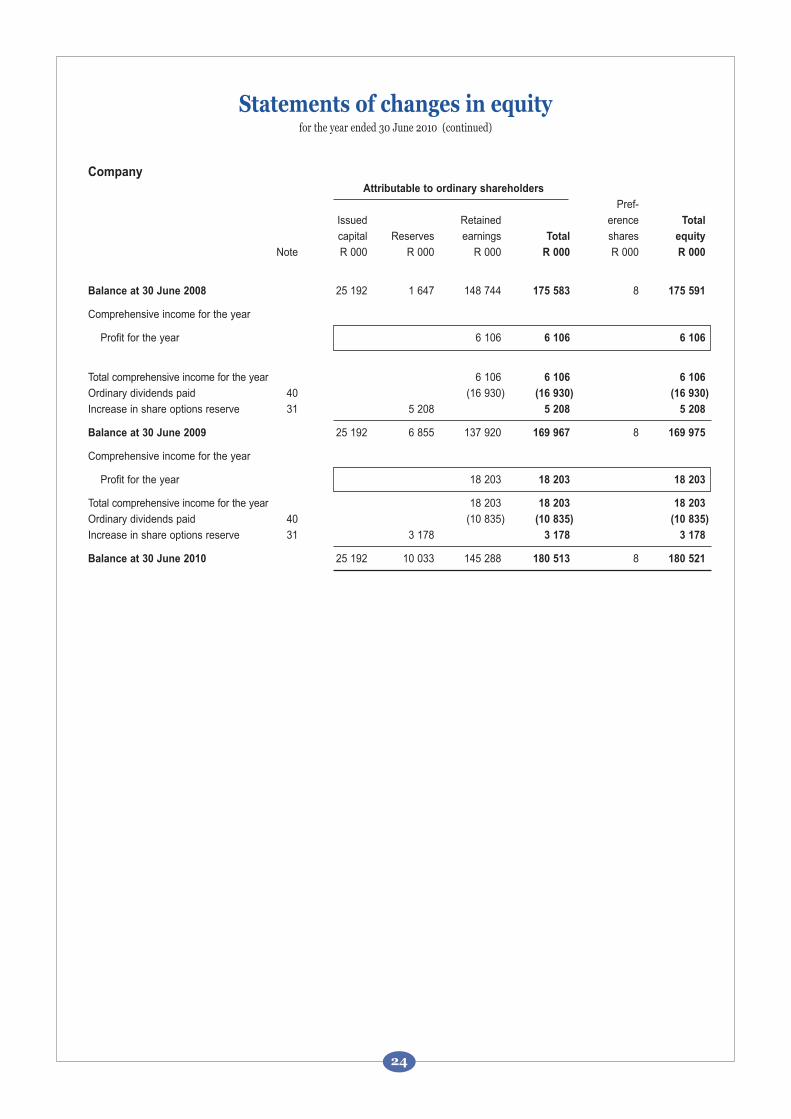
Company
Attributable to ordinary shareholders
Pref-
Issued Retained erence Total
capital Reserves earnings Total shares equity
Note R 000 R 000 R 000 R 000 R 000 R 000
Balance at 30 June 2008 25 192 1 647 148 744 175 583 8 175 591
Comprehensive income for the year
Profit for the year 6 106 6 106 6 106
Total comprehensive income for the year 6 106 6 106 6 106
Ordinary dividends paid 40 (16 930) (16 930) (16 930)
Increase in share options reserve 31 5 208 5 208 5 208
Balance at 30 June 2009 25 192 6 855 137 920 169 967 8 169 975
Comprehensive income for the year
Profit for the year 18 203 18 203 18 203
Total comprehensive income for the year 18 203 18 203 18 203
Ordinary dividends paid 40 (10 835) (10 835) (10 835)
Increase in share options reserve 31 3 178 3 178 3 178
Balance at 30 June 2010 25 192 10 033 145 288 180 513 8 180 521
Statements of changes in equityfor the year ended 30 June 2010 (continued)
24
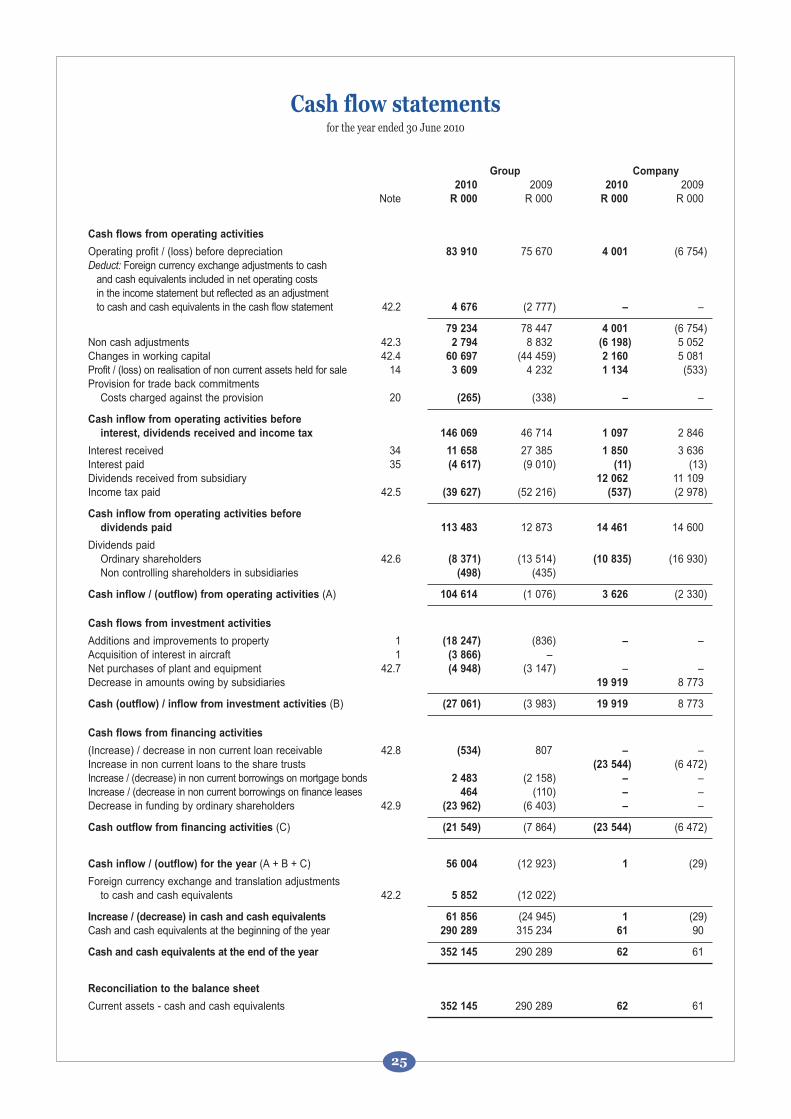
Group Company
2010 2009 2010 2009Note R 000 R 000 R 000 R 000
Cash flows from operating activities
Operating profit / (loss) before depreciation 83 910 75 670 4 001 (6 754)Deduct: Foreign currency exchange adjustments to cash
and cash equivalents included in net operating costsin the income statement but reflected as an adjustmentto cash and cash equivalents in the cash flow statement 42.2 4 676 (2 777) – –
79 234 78 447 4 001 (6 754)Non cash adjustments 42.3 2 794 8 832 (6 198) 5 052 Changes in working capital 42.4 60 697 (44 459) 2 160 5 081Profit / (loss) on realisation of non current assets held for sale 14 3 609 4 232 1 134 (533) Provision for trade back commitments
Costs charged against the provision 20 (265) (338) – –
Cash inflow from operating activities before
interest, dividends received and income tax 146 069 46 714 1 097 2 846
Interest received 34 11 658 27 385 1 850 3 636Interest paid 35 (4 617) (9 010) (11) (13)Dividends received from subsidiary 12 062 11 109Income tax paid 42.5 (39 627) (52 216) (537) (2 978)
Cash inflow from operating activities before
dividends paid 113 483 12 873 14 461 14 600
Dividends paidOrdinary shareholders 42.6 (8 371) (13 514) (10 835) (16 930) Non controlling shareholders in subsidiaries (498) (435)
Cash inflow / (outflow) from operating activities (A) 104 614 (1 076) 3 626 (2 330)
Cash flows from investment activities
Additions and improvements to property 1 (18 247) (836) – – Acquisition of interest in aircraft 1 (3 866) –Net purchases of plant and equipment 42.7 (4 948) (3 147) – –Decrease in amounts owing by subsidiaries 19 919 8 773
Cash (outflow) / inflow from investment activities (B) (27 061) (3 983) 19 919 8 773
Cash flows from financing activities
(Increase) / decrease in non current loan receivable 42.8 (534) 807 – –Increase in non current loans to the share trusts (23 544) (6 472)Increase / (decrease) in non current borrowings on mortgage bonds 2 483 (2 158) – – Increase / (decrease in non current borrowings on finance leases 464 (110) – – Decrease in funding by ordinary shareholders 42.9 (23 962) (6 403) – –
Cash outflow from financing activities (C) (21 549) (7 864) (23 544) (6 472)
Cash inflow / (outflow) for the year (A + B + C) 56 004 (12 923) 1 (29)
Foreign currency exchange and translation adjustmentsto cash and cash equivalents 42.2 5 852 (12 022)
Increase / (decrease) in cash and cash equivalents 61 856 (24 945) 1 (29)Cash and cash equivalents at the beginning of the year 290 289 315 234 61 90
Cash and cash equivalents at the end of the year 352 145 290 289 62 61
Reconciliation to the balance sheet
Current assets - cash and cash equivalents 352 145 290 289 62 61
Cash flow statementsfor the year ended 30 June 2010
25
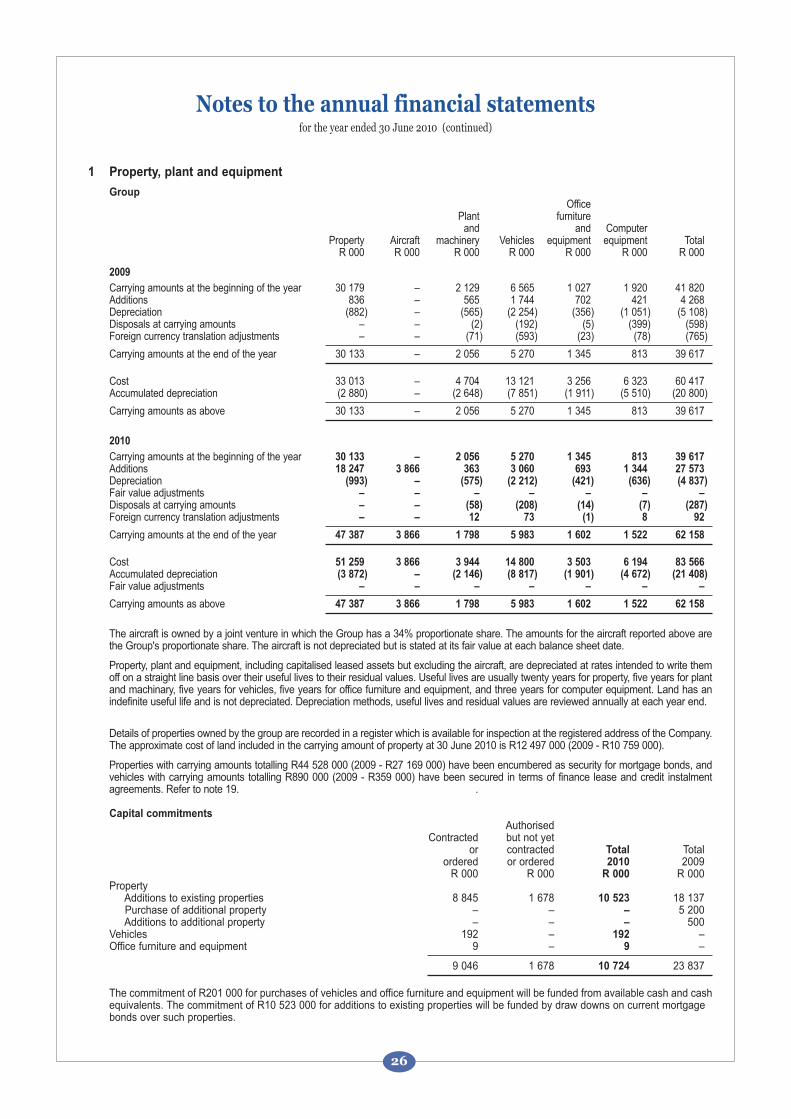
1 Property, plant and equipment
GroupOffice
Plant furnitureand and Computer
Property Aircraft machinery Vehicles equipment equipment Total R 000 R 000 R 000 R 000 R 000 R 000 R 000
2009
Carrying amounts at the beginning of the year 30 179 – 2 129 6 565 1 027 1 920 41 820Additions 836 – 565 1 744 702 421 4 268Depreciation (882) – (565) (2 254) (356) (1 051) (5 108)Disposals at carrying amounts – – (2) (192) (5) (399) (598)Foreign currency translation adjustments – – (71) (593) (23) (78) (765)
Carrying amounts at the end of the year 30 133 – 2 056 5 270 1 345 813 39 617
Cost 33 013 – 4 704 13 121 3 256 6 323 60 417Accumulated depreciation (2 880) – (2 648) (7 851) (1 911) (5 510) (20 800)
Carrying amounts as above 30 133 – 2 056 5 270 1 345 813 39 617
2010
Carrying amounts at the beginning of the year 30 133 – 2 056 5 270 1 345 813 39 617Additions 18 247 3 866 363 3 060 693 1 344 27 573Depreciation (993) – (575) (2 212) (421) (636) (4 837)Fair value adjustments – – – – – – –Disposals at carrying amounts – – (58) (208) (14) (7) (287)Foreign currency translation adjustments – – 12 73 (1) 8 92
Carrying amounts at the end of the year 47 387 3 866 1 798 5 983 1 602 1 522 62 158
Cost 51 259 3 866 3 944 14 800 3 503 6 194 83 566Accumulated depreciation (3 872) – (2 146) (8 817) (1 901) (4 672) (21 408)Fair value adjustments – – – – – – –
Carrying amounts as above 47 387 3 866 1 798 5 983 1 602 1 522 62 158
The aircraft is owned by a joint venture in which the Group has a 34% proportionate share. The amounts for the aircraft reported above arethe Group's proportionate share. The aircraft is not depreciated but is stated at its fair value at each balance sheet date.
Property, plant and equipment, including capitalised leased assets but excluding the aircraft, are depreciated at rates intended to write themoff on a straight line basis over their useful lives to their residual values. Useful lives are usually twenty years for property, five years for plantand machinary, five years for vehicles, five years for office furniture and equipment, and three years for computer equipment. Land has anindefinite useful life and is not depreciated. Depreciation methods, useful lives and residual values are reviewed annually at each year end.
Details of properties owned by the group are recorded in a register which is available for inspection at the registered address of the Company.The approximate cost of land included in the carrying amount of property at 30 June 2010 is R12 497 000 (2009 - R10 759 000).
Properties with carrying amounts totalling R44 528 000 (2009 - R27 169 000) have been encumbered as security for mortgage bonds, andvehicles with carrying amounts totalling R890 000 (2009 - R359 000) have been secured in terms of finance lease and credit instalmentagreements. Refer to note 19. .
Capital commitmentsAuthorised
Contracted but not yet or contracted Total Total
ordered or ordered 2010 2009 R 000 R 000 R 000 R 000
PropertyAdditions to existing properties 8 845 1 678 10 523 18 137Purchase of additional property – – – 5 200Additions to additional property – – – 500
Vehicles 192 – 192 –Office furniture and equipment 9 – 9 –
9 046 1 678 10 724 23 837
The commitment of R201 000 for purchases of vehicles and office furniture and equipment will be funded from available cash and cashequivalents. The commitment of R10 523 000 for additions to existing properties will be funded by draw downs on current mortgagebonds over such properties.
Notes to the annual financial statementsfor the year ended 30 June 2010 (continued)
26
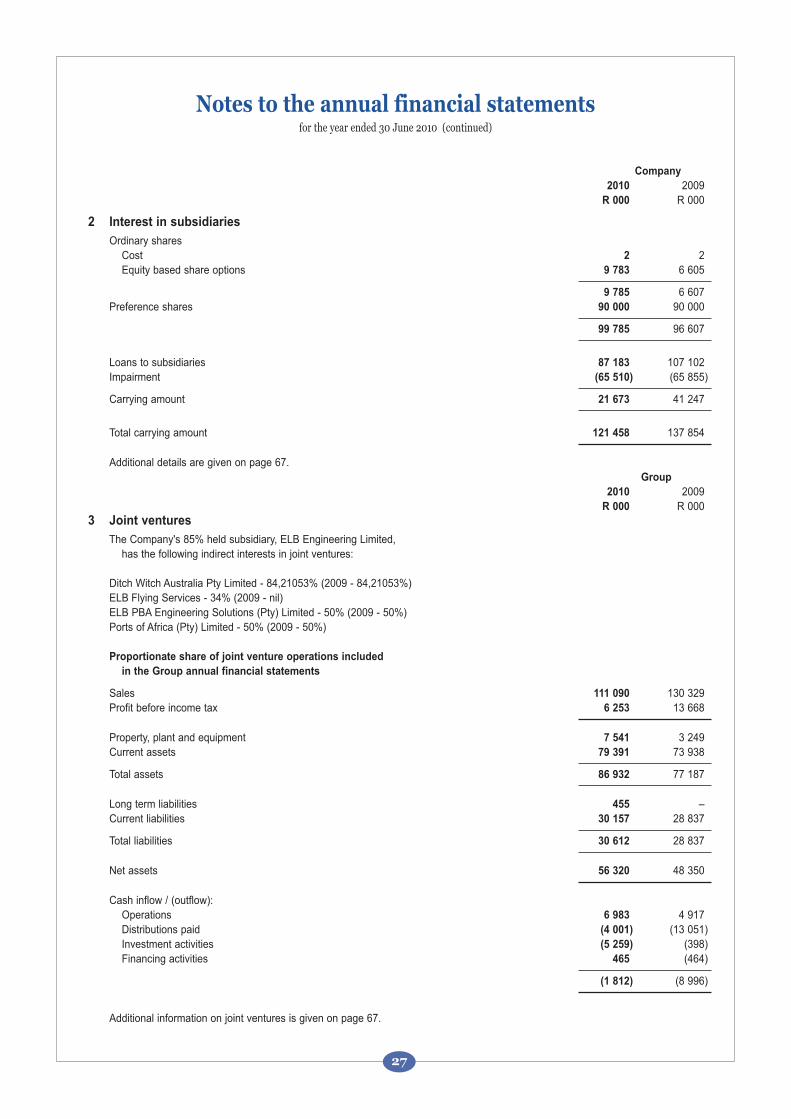
Company
2010 2009 R 000 R 000
2 Interest in subsidiaries
Ordinary sharesCost 2 2 Equity based share options 9 783 6 605
9 785 6 607Preference shares 90 000 90 000
99 785 96 607
Loans to subsidiaries 87 183 107 102Impairment (65 510) (65 855)
Carrying amount 21 673 41 247
Total carrying amount 121 458 137 854
Additional details are given on page 67.Group
2010 2009R 000 R 000
3 Joint ventures
The Company's 85% held subsidiary, ELB Engineering Limited,has the following indirect interests in joint ventures:
Ditch Witch Australia Pty Limited - 84,21053% (2009 - 84,21053%)ELB Flying Services - 34% (2009 - nil)ELB PBA Engineering Solutions (Pty) Limited - 50% (2009 - 50%)Ports of Africa (Pty) Limited - 50% (2009 - 50%)
Proportionate share of joint venture operations included
in the Group annual financial statements
Sales 111 090 130 329 Profit before income tax 6 253 13 668
Property, plant and equipment 7 541 3 249 Current assets 79 391 73 938
Total assets 86 932 77 187
Long term liabilities 455 –Current liabilities 30 157 28 837
Total liabilities 30 612 28 837
Net assets 56 320 48 350
Cash inflow / (outflow):Operations 6 983 4 917Distributions paid (4 001) (13 051) Investment activities (5 259) (398)Financing activities 465 (464)
(1 812) (8 996)
Additional information on joint ventures is given on page 67.
Notes to the annual financial statementsfor the year ended 30 June 2010 (continued)
27
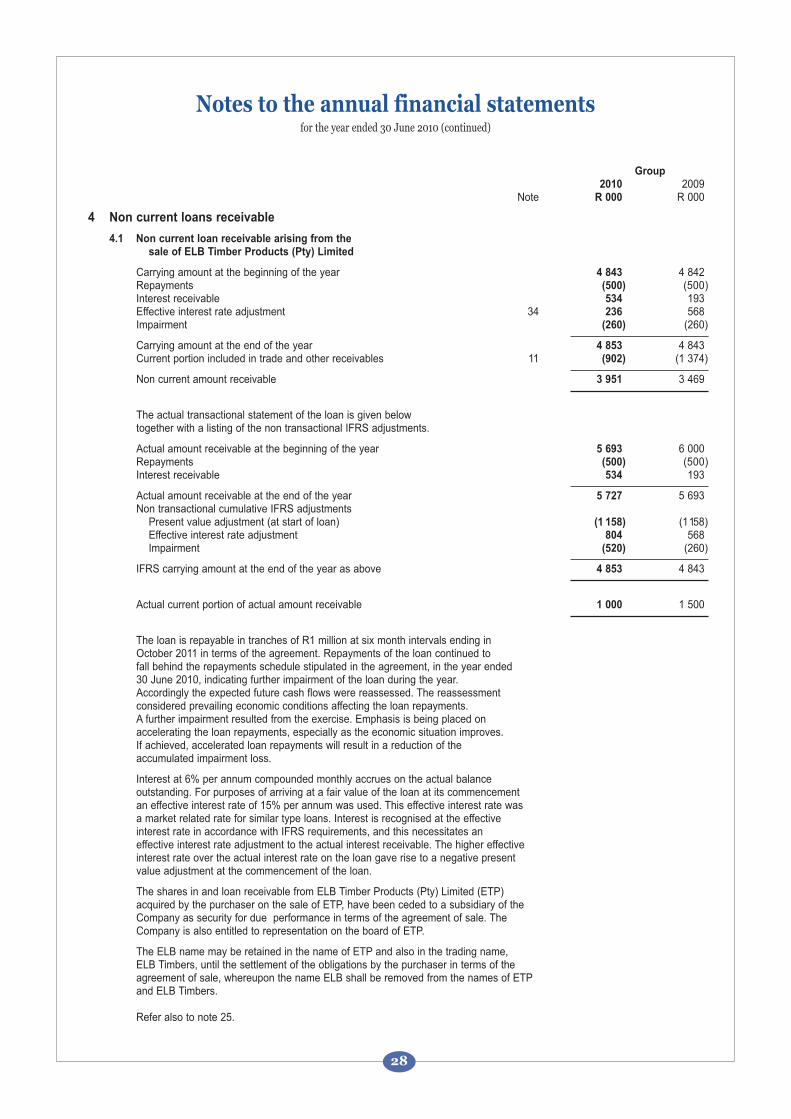
Group 2010 2009
Note R 000 R 000
4 Non current loans receivable
4.1 Non current loan receivable arising from thesale of ELB Timber Products (Pty) Limited
Carrying amount at the beginning of the year 4 843 4 842Repayments (500) (500)Interest receivable 534 193Effective interest rate adjustment 34 236 568Impairment (260) (260)
Carrying amount at the end of the year 4 853 4 843Current portion included in trade and other receivables 11 (902) (1 374)
Non current amount receivable 3 951 3 469
The actual transactional statement of the loan is given below together with a listing of the non transactional IFRS adjustments.
Actual amount receivable at the beginning of the year 5 693 6 000Repayments (500) (500)Interest receivable 534 193
Actual amount receivable at the end of the year 5 727 5 693Non transactional cumulative IFRS adjustments
Present value adjustment (at start of loan) (1 158) (1 158)Effective interest rate adjustment 804 568Impairment (520) (260)
IFRS carrying amount at the end of the year as above 4 853 4 843
Actual current portion of actual amount receivable 1 000 1 500
The loan is repayable in tranches of R1 million at six month intervals ending inOctober 2011 in terms of the agreement. Repayments of the loan continued to fall behind the repayments schedule stipulated in the agreement, in the year ended 30 June 2010, indicating further impairment of the loan during the year.Accordingly the expected future cash flows were reassessed. The reassessment considered prevailing economic conditions affecting the loan repayments. A further impairment resulted from the exercise. Emphasis is being placed on accelerating the loan repayments, especially as the economic situation improves.If achieved, accelerated loan repayments will result in a reduction of the accumulated impairment loss.
Interest at 6% per annum compounded monthly accrues on the actual balanceoutstanding. For purposes of arriving at a fair value of the loan at its commencementan effective interest rate of 15% per annum was used. This effective interest rate wasa market related rate for similar type loans. Interest is recognised at the effectiveinterest rate in accordance with IFRS requirements, and this necessitates aneffective interest rate adjustment to the actual interest receivable. The higher effectiveinterest rate over the actual interest rate on the loan gave rise to a negative presentvalue adjustment at the commencement of the loan.
The shares in and loan receivable from ELB Timber Products (Pty) Limited (ETP)acquired by the purchaser on the sale of ETP, have been ceded to a subsidiary of theCompany as security for due performance in terms of the agreement of sale. TheCompany is also entitled to representation on the board of ETP.
The ELB name may be retained in the name of ETP and also in the trading name,ELB Timbers, until the settlement of the obligations by the purchaser in terms of theagreement of sale, whereupon the name ELB shall be removed from the names of ETPand ELB Timbers.
Refer also to note 25.
Notes to the annual financial statementsfor the year ended 30 June 2010 (continued)
28
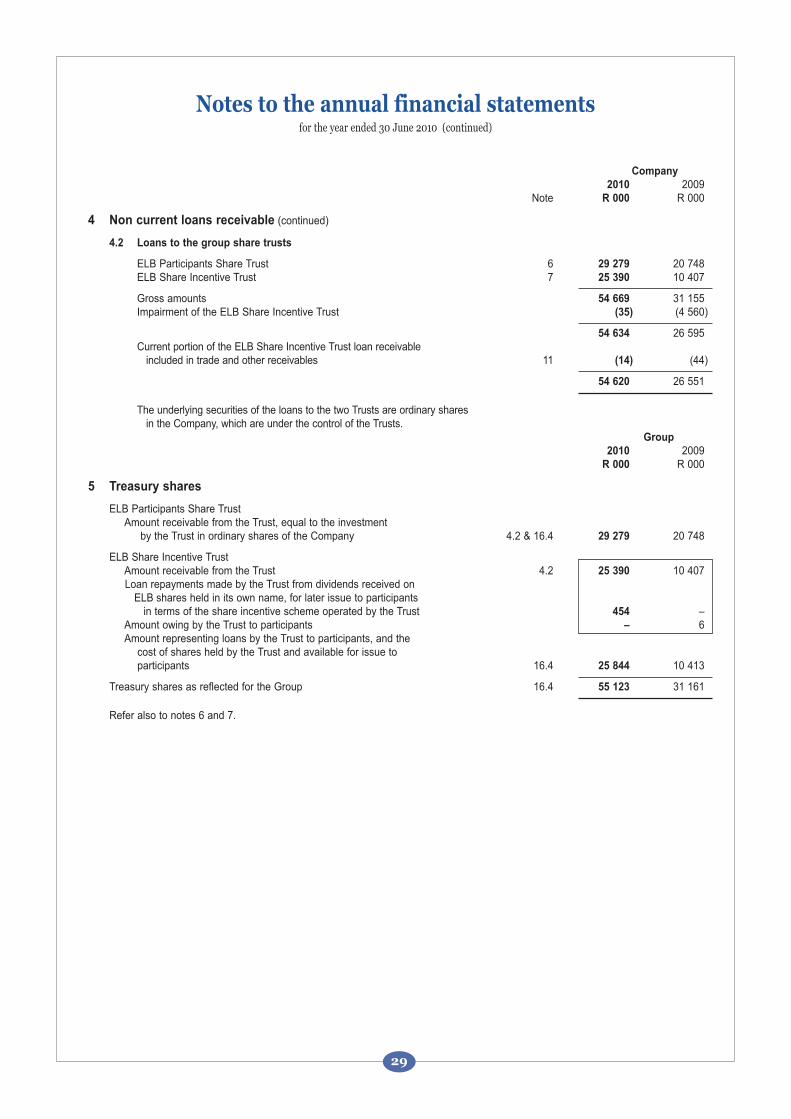
Company
2010 2009 Note R 000 R 000
4 Non current loans receivable (continued)
4.2 Loans to the group share trusts
ELB Participants Share Trust 6 29 279 20 748 ELB Share Incentive Trust 7 25 390 10 407
Gross amounts 54 669 31 155 Impairment of the ELB Share Incentive Trust (35) (4 560)
54 634 26 595Current portion of the ELB Share Incentive Trust loan receivable
included in trade and other receivables 11 (14) (44)
54 620 26 551
The underlying securities of the loans to the two Trusts are ordinary shares in the Company, which are under the control of the Trusts.
Group
2010 2009R 000 R 000
5 Treasury shares
ELB Participants Share TrustAmount receivable from the Trust, equal to the investment
by the Trust in ordinary shares of the Company 4.2 & 16.4 29 279 20 748
ELB Share Incentive TrustAmount receivable from the Trust 4.2 25 390 10 407 Loan repayments made by the Trust from dividends received on
ELB shares held in its own name, for later issue to participantsin terms of the share incentive scheme operated by the Trust 454 –
Amount owing by the Trust to participants – 6 Amount representing loans by the Trust to participants, and the
cost of shares held by the Trust and available for issue toparticipants 16.4 25 844 10 413
Treasury shares as reflected for the Group 16.4 55 123 31 161
Refer also to notes 6 and 7.
Notes to the annual financial statementsfor the year ended 30 June 2010 (continued)
29
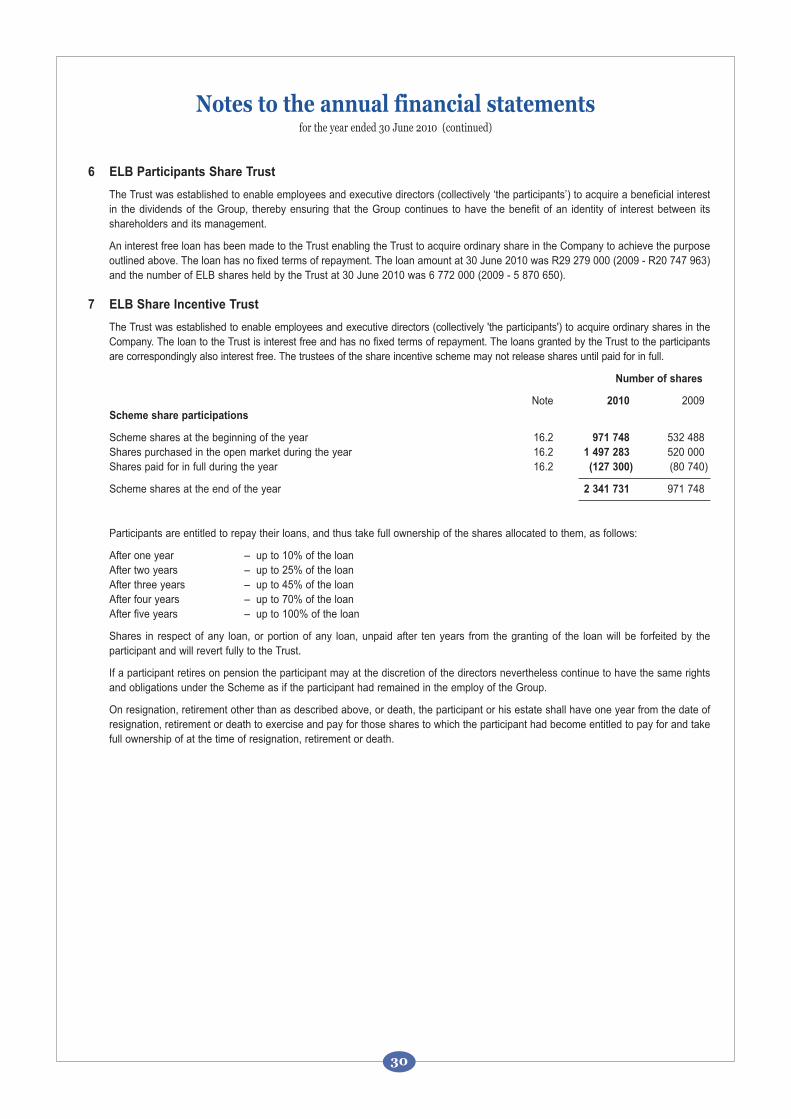
6 ELB Participants Share Trust
The Trust was established to enable employees and executive directors (collectively ‘the participants’) to acquire a beneficial interestin the dividends of the Group, thereby ensuring that the Group continues to have the benefit of an identity of interest between itsshareholders and its management.
An interest free loan has been made to the Trust enabling the Trust to acquire ordinary share in the Company to achieve the purposeoutlined above. The loan has no fixed terms of repayment. The loan amount at 30 June 2010 was R29 279 000 (2009 - R20 747 963)and the number of ELB shares held by the Trust at 30 June 2010 was 6 772 000 (2009 - 5 870 650).
7 ELB Share Incentive Trust
The Trust was established to enable employees and executive directors (collectively 'the participants') to acquire ordinary shares in theCompany. The loan to the Trust is interest free and has no fixed terms of repayment. The loans granted by the Trust to the participantsare correspondingly also interest free. The trustees of the share incentive scheme may not release shares until paid for in full.
Number of shares
Note 2010 2009 Scheme share participations
Scheme shares at the beginning of the year 16.2 971 748 532 488Shares purchased in the open market during the year 16.2 1 497 283 520 000Shares paid for in full during the year 16.2 (127 300) (80 740)
Scheme shares at the end of the year 2 341 731 971 748
Participants are entitled to repay their loans, and thus take full ownership of the shares allocated to them, as follows:
After one year – up to 10% of the loanAfter two years – up to 25% of the loanAfter three years – up to 45% of the loanAfter four years – up to 70% of the loanAfter five years – up to 100% of the loan
Shares in respect of any loan, or portion of any loan, unpaid after ten years from the granting of the loan will be forfeited by theparticipant and will revert fully to the Trust.
If a participant retires on pension the participant may at the discretion of the directors nevertheless continue to have the same rightsand obligations under the Scheme as if the participant had remained in the employ of the Group.
On resignation, retirement other than as described above, or death, the participant or his estate shall have one year from the date ofresignation, retirement or death to exercise and pay for those shares to which the participant had become entitled to pay for and takefull ownership of at the time of resignation, retirement or death.
Notes to the annual financial statementsfor the year ended 30 June 2010 (continued)
30
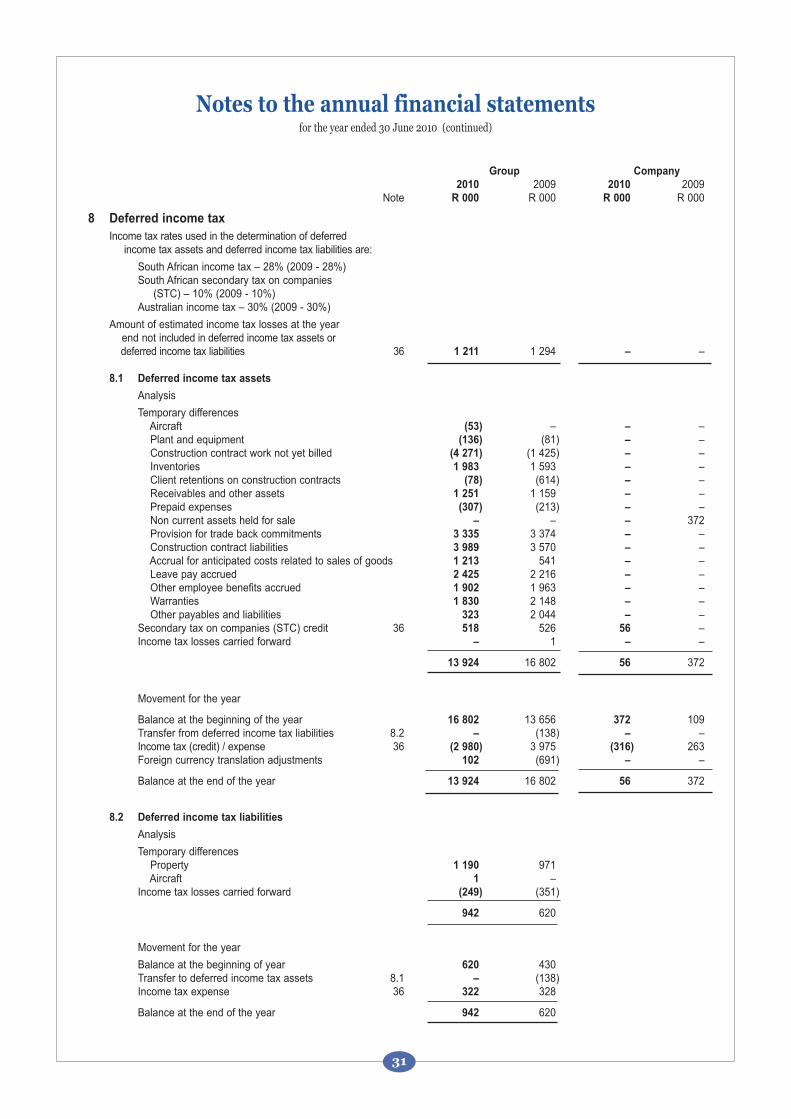
Group Company
2010 2009 2010 2009Note R 000 R 000 R 000 R 000
8 Deferred income tax
Income tax rates used in the determination of deferred income tax assets and deferred income tax liabilities are:
South African income tax – 28% (2009 - 28%)South African secondary tax on companies
(STC) – 10% (2009 - 10%)Australian income tax – 30% (2009 - 30%)
Amount of estimated income tax losses at the year end not included in deferred income tax assets or deferred income tax liabilities 36 1 211 1 294 – –
8.1 Deferred income tax assets
Analysis
Temporary differencesAircraft (53) – – –Plant and equipment (136) (81) – –Construction contract work not yet billed (4 271) (1 425) – –Inventories 1 983 1 593 – –Client retentions on construction contracts (78) (614) – –Receivables and other assets 1 251 1 159 – –Prepaid expenses (307) (213) – –Non current assets held for sale – – – 372Provision for trade back commitments 3 335 3 374 – –Construction contract liabilities 3 989 3 570 – –Accrual for anticipated costs related to sales of goods 1 213 541 – –Leave pay accrued 2 425 2 216 – –Other employee benefits accrued 1 902 1 963 – –Warranties 1 830 2 148 – –Other payables and liabilities 323 2 044 – –
Secondary tax on companies (STC) credit 36 518 526 56 –Income tax losses carried forward – 1 – –
13 924 16 802 56 372
Movement for the year
Balance at the beginning of the year 16 802 13 656 372 109Transfer from deferred income tax liabilities 8.2 – (138) – –Income tax (credit) / expense 36 (2 980) 3 975 (316) 263Foreign currency translation adjustments 102 (691) – –
Balance at the end of the year 13 924 16 802 56 372
8.2 Deferred income tax liabilities
Analysis
Temporary differencesProperty 1 190 971 Aircraft 1 –
Income tax losses carried forward (249) (351)
942 620
Movement for the year
Balance at the beginning of year 620 430 Transfer to deferred income tax assets 8.1 – (138)Income tax expense 36 322 328
Balance at the end of the year 942 620
Notes to the annual financial statementsfor the year ended 30 June 2010 (continued)
31
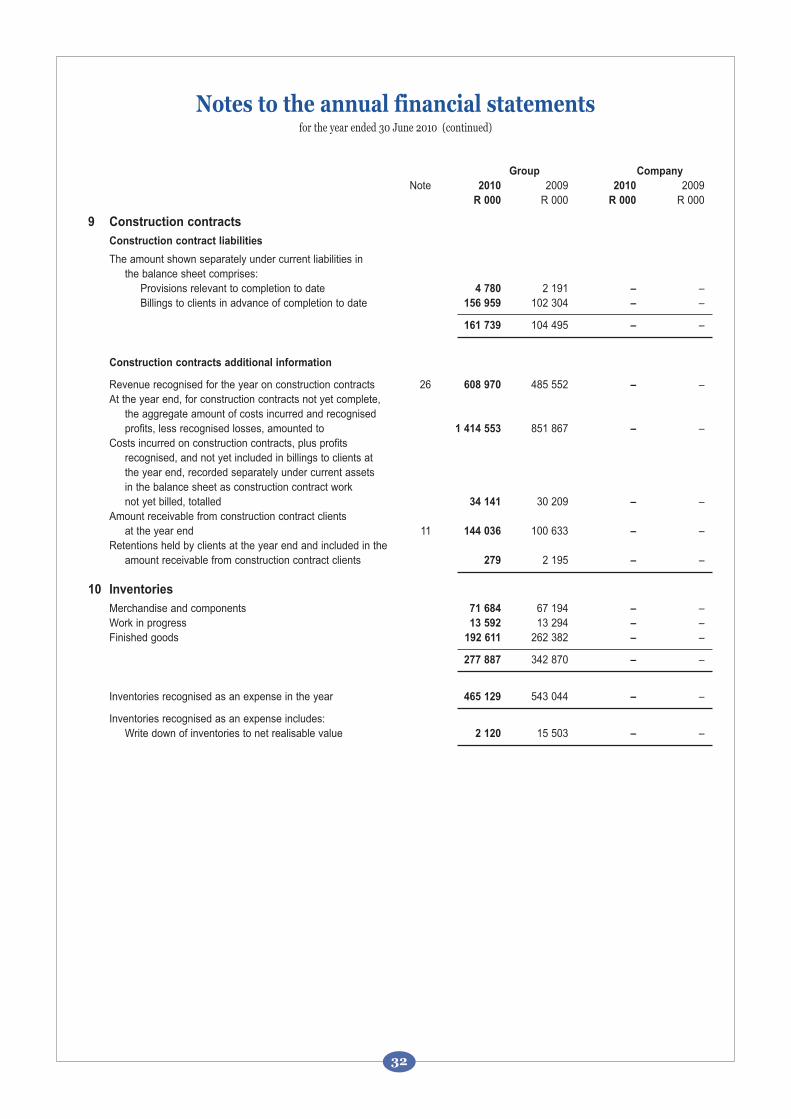
Group Company
Note 2010 2009 2010 2009 R 000 R 000 R 000 R 000
9 Construction contracts
Construction contract liabilities
The amount shown separately under current liabilities in the balance sheet comprises:
Provisions relevant to completion to date 4 780 2 191 – –Billings to clients in advance of completion to date 156 959 102 304 – –
161 739 104 495 – –
Construction contracts additional information
Revenue recognised for the year on construction contracts 26 608 970 485 552 – –At the year end, for construction contracts not yet complete,
the aggregate amount of costs incurred and recognisedprofits, less recognised losses, amounted to 1 414 553 851 867 – –
Costs incurred on construction contracts, plus profitsrecognised, and not yet included in billings to clients atthe year end, recorded separately under current assetsin the balance sheet as construction contract worknot yet billed, totalled 34 141 30 209 – –
Amount receivable from construction contract clients at the year end 11 144 036 100 633 – –
Retentions held by clients at the year end and included in theamount receivable from construction contract clients 279 2 195 – –
10 Inventories
Merchandise and components 71 684 67 194 – – Work in progress 13 592 13 294 – –Finished goods 192 611 262 382 – –
277 887 342 870 – –
Inventories recognised as an expense in the year 465 129 543 044 – –
Inventories recognised as an expense includes:Write down of inventories to net realisable value 2 120 15 503 – –
Notes to the annual financial statementsfor the year ended 30 June 2010 (continued)
32
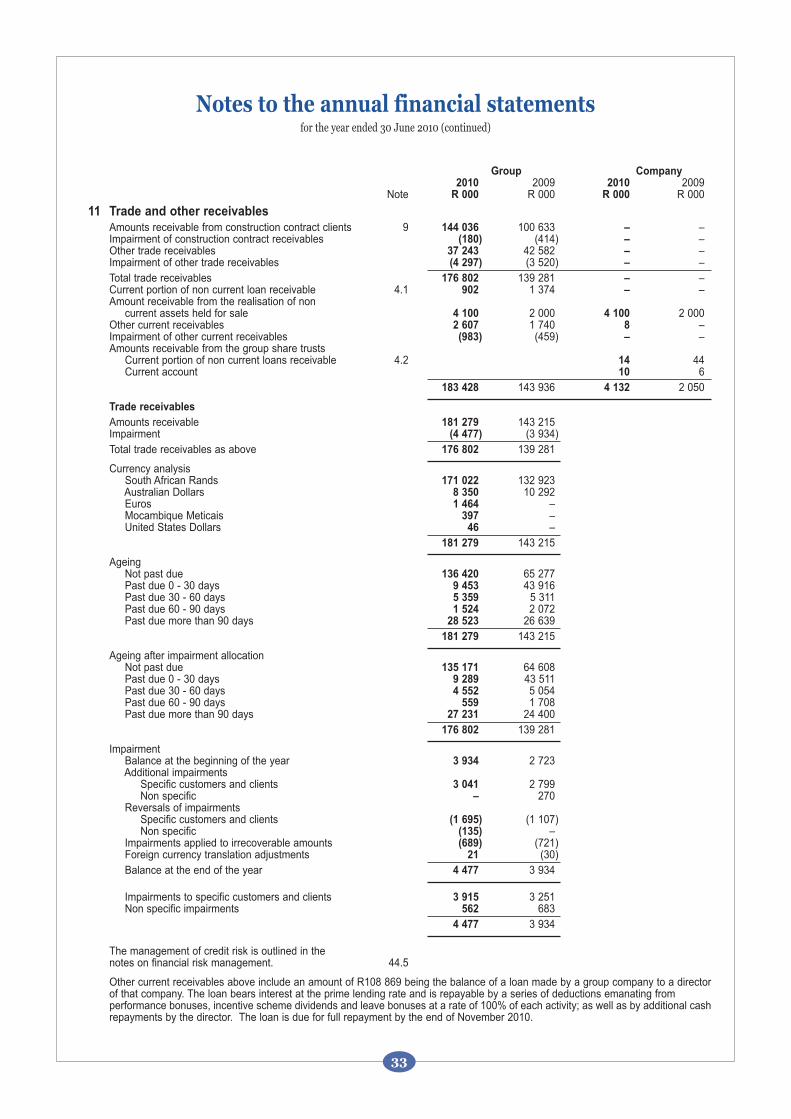
Group Company 2010 2009 2010 2009
Note R 000 R 000 R 000 R 000
11 Trade and other receivablesAmounts receivable from construction contract clients 9 144 036 100 633 – – Impairment of construction contract receivables (180) (414) – –Other trade receivables 37 243 42 582 – – Impairment of other trade receivables (4 297) (3 520) – – Total trade receivables 176 802 139 281 – –Current portion of non current loan receivable 4.1 902 1 374 – –Amount receivable from the realisation of non
current assets held for sale 4 100 2 000 4 100 2 000Other current receivables 2 607 1 740 8 – Impairment of other current receivables (983) (459) – –Amounts receivable from the group share trusts
Current portion of non current loans receivable 4.2 14 44Current account 10 6
183 428 143 936 4 132 2 050
Trade receivables
Amounts receivable 181 279 143 215 Impairment (4 477) (3 934)Total trade receivables as above 176 802 139 281
Currency analysisSouth African Rands 171 022 132 923Australian Dollars 8 350 10 292Euros 1 464 –Mocambique Meticais 397 –United States Dollars 46 –
181 279 143 215
AgeingNot past due 136 420 65 277Past due 0 - 30 days 9 453 43 916 Past due 30 - 60 days 5 359 5 311Past due 60 - 90 days 1 524 2 072 Past due more than 90 days 28 523 26 639
181 279 143 215
Ageing after impairment allocationNot past due 135 171 64 608Past due 0 - 30 days 9 289 43 511 Past due 30 - 60 days 4 552 5 054Past due 60 - 90 days 559 1 708Past due more than 90 days 27 231 24 400
176 802 139 281
ImpairmentBalance at the beginning of the year 3 934 2 723Additional impairments
Specific customers and clients 3 041 2 799Non specific – 270
Reversals of impairmentsSpecific customers and clients (1 695) (1 107) Non specific (135) –
Impairments applied to irrecoverable amounts (689) (721)Foreign currency translation adjustments 21 (30)Balance at the end of the year 4 477 3 934
Impairments to specific customers and clients 3 915 3 251Non specific impairments 562 683
4 477 3 934
The management of credit risk is outlined in thenotes on financial risk management. 44.5
Other current receivables above include an amount of R108 869 being the balance of a loan made by a group company to a directorof that company. The loan bears interest at the prime lending rate and is repayable by a series of deductions emanating from performance bonuses, incentive scheme dividends and leave bonuses at a rate of 100% of each activity; as well as by additional cashrepayments by the director. The loan is due for full repayment by the end of November 2010.
Notes to the annual financial statementsfor the year ended 30 June 2010 (continued)
33
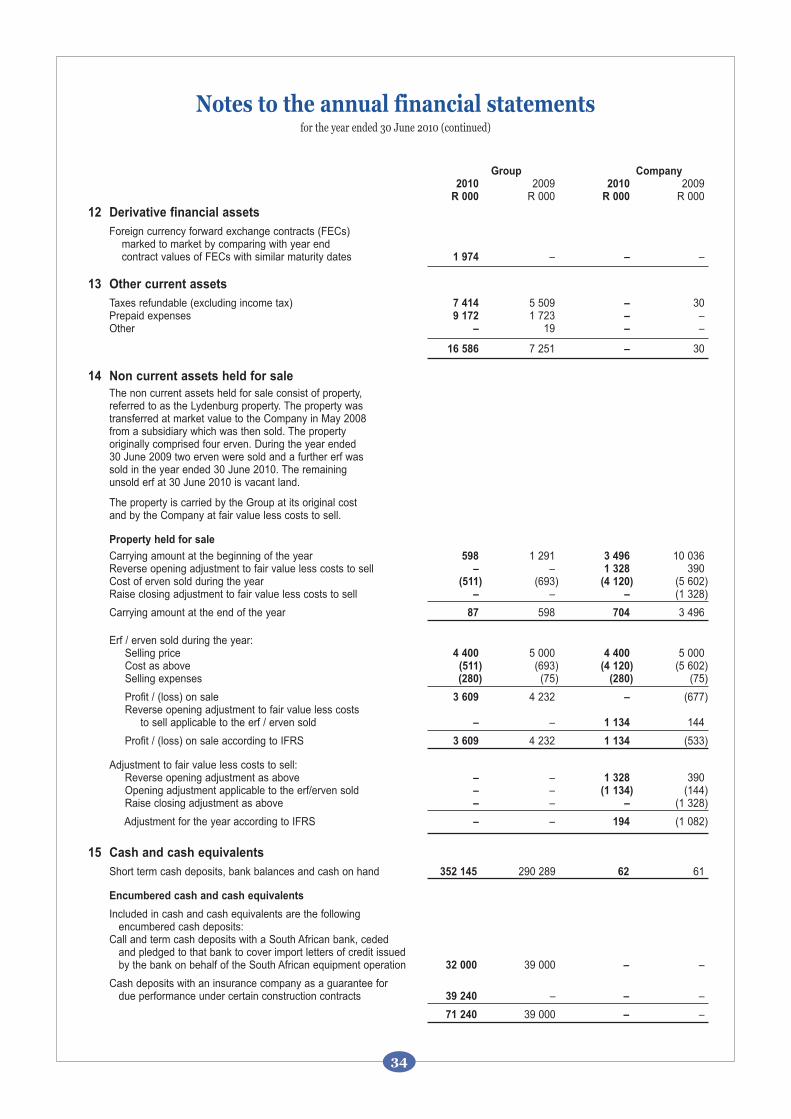
Group Company 2010 2009 2010 2009
R 000 R 000 R 000 R 000
12 Derivative financial assets
Foreign currency forward exchange contracts (FECs)marked to market by comparing with year endcontract values of FECs with similar maturity dates 1 974 – – –
13 Other current assets
Taxes refundable (excluding income tax) 7 414 5 509 – 30Prepaid expenses 9 172 1 723 – –Other – 19 – –
16 586 7 251 – 30
14 Non current assets held for sale
The non current assets held for sale consist of property,referred to as the Lydenburg property. The property wastransferred at market value to the Company in May 2008from a subsidiary which was then sold. The propertyoriginally comprised four erven. During the year ended30 June 2009 two erven were sold and a further erf wassold in the year ended 30 June 2010. The remainingunsold erf at 30 June 2010 is vacant land.
The property is carried by the Group at its original costand by the Company at fair value less costs to sell.
Property held for sale
Carrying amount at the beginning of the year 598 1 291 3 496 10 036 Reverse opening adjustment to fair value less costs to sell – – 1 328 390 Cost of erven sold during the year (511) (693) (4 120) (5 602) Raise closing adjustment to fair value less costs to sell – – – (1 328)
Carrying amount at the end of the year 87 598 704 3 496
Erf / erven sold during the year:Selling price 4 400 5 000 4 400 5 000 Cost as above (511) (693) (4 120) (5 602) Selling expenses (280) (75) (280) (75)
Profit / (loss) on sale 3 609 4 232 – (677)Reverse opening adjustment to fair value less costs
to sell applicable to the erf / erven sold – – 1 134 144
Profit / (loss) on sale according to IFRS 3 609 4 232 1 134 (533)
Adjustment to fair value less costs to sell:Reverse opening adjustment as above – – 1 328 390 Opening adjustment applicable to the erf/erven sold – – (1 134) (144) Raise closing adjustment as above – – – (1 328)
Adjustment for the year according to IFRS – – 194 (1 082)
15 Cash and cash equivalents
Short term cash deposits, bank balances and cash on hand 352 145 290 289 62 61
Encumbered cash and cash equivalents
Included in cash and cash equivalents are the followingencumbered cash deposits:
Call and term cash deposits with a South African bank, cededand pledged to that bank to cover import letters of credit issuedby the bank on behalf of the South African equipment operation 32 000 39 000 – –
Cash deposits with an insurance company as a guarantee fordue performance under certain construction contracts 39 240 – – –
71 240 39 000 – –
Notes to the annual financial statementsfor the year ended 30 June 2010 (continued)
34
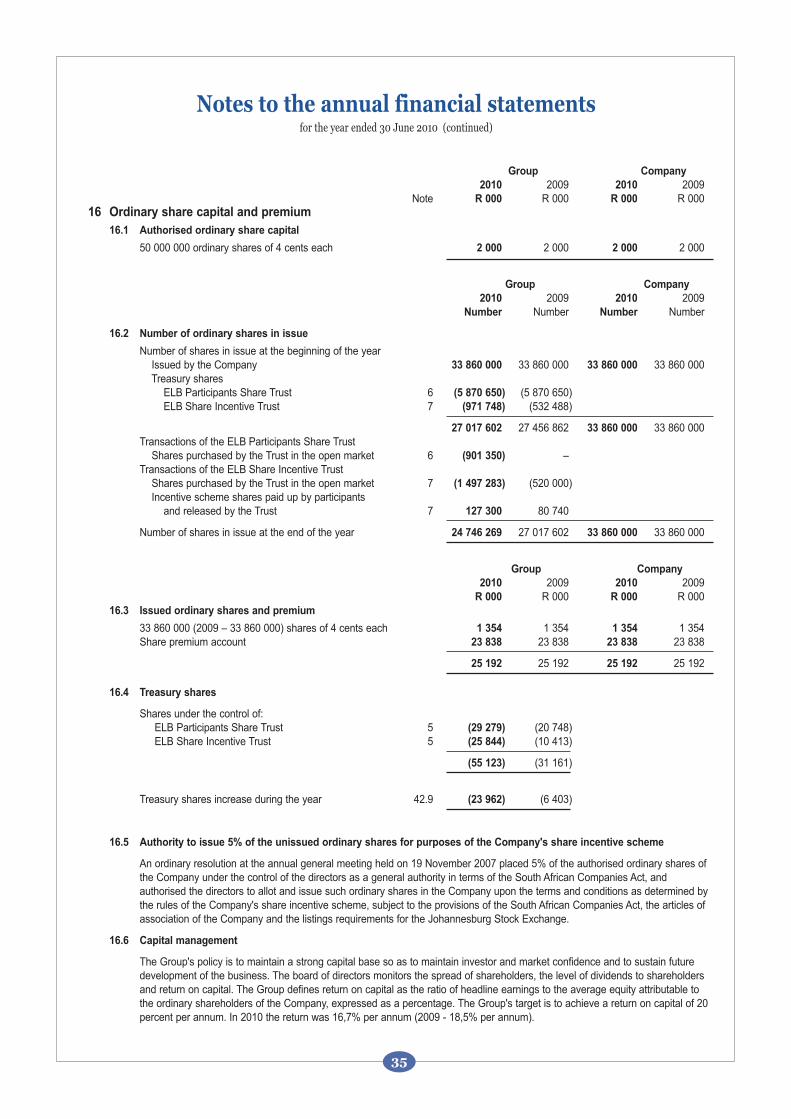
Group Company
2010 2009 2010 2009Note R 000 R 000 R 000 R 000
16 Ordinary share capital and premium
16.1 Authorised ordinary share capital
50 000 000 ordinary shares of 4 cents each 2 000 2 000 2 000 2 000
Group Company
2010 2009 2010 2009 Number Number Number Number
16.2 Number of ordinary shares in issue
Number of shares in issue at the beginning of the yearIssued by the Company 33 860 000 33 860 000 33 860 000 33 860 000Treasury shares
ELB Participants Share Trust 6 (5 870 650) (5 870 650)ELB Share Incentive Trust 7 (971 748) (532 488)
27 017 602 27 456 862 33 860 000 33 860 000Transactions of the ELB Participants Share Trust
Shares purchased by the Trust in the open market 6 (901 350) –Transactions of the ELB Share Incentive Trust
Shares purchased by the Trust in the open market 7 (1 497 283) (520 000) Incentive scheme shares paid up by participants
and released by the Trust 7 127 300 80 740
Number of shares in issue at the end of the year 24 746 269 27 017 602 33 860 000 33 860 000
Group Company
2010 2009 2010 2009 R 000 R 000 R 000 R 000
16.3 Issued ordinary shares and premium
33 860 000 (2009 – 33 860 000) shares of 4 cents each 1 354 1 354 1 354 1 354 Share premium account 23 838 23 838 23 838 23 838
25 192 25 192 25 192 25 192
16.4 Treasury shares
Shares under the control of:ELB Participants Share Trust 5 (29 279) (20 748)ELB Share Incentive Trust 5 (25 844) (10 413)
(55 123) (31 161)
Treasury shares increase during the year 42.9 (23 962) (6 403)
16.5 Authority to issue 5% of the unissued ordinary shares for purposes of the Company's share incentive scheme
An ordinary resolution at the annual general meeting held on 19 November 2007 placed 5% of the authorised ordinary shares ofthe Company under the control of the directors as a general authority in terms of the South African Companies Act, andauthorised the directors to allot and issue such ordinary shares in the Company upon the terms and conditions as determined bythe rules of the Company's share incentive scheme, subject to the provisions of the South African Companies Act, the articles ofassociation of the Company and the listings requirements for the Johannesburg Stock Exchange.
16.6 Capital management
The Group's policy is to maintain a strong capital base so as to maintain investor and market confidence and to sustain futuredevelopment of the business. The board of directors monitors the spread of shareholders, the level of dividends to shareholdersand return on capital. The Group defines return on capital as the ratio of headline earnings to the average equity attributable tothe ordinary shareholders of the Company, expressed as a percentage. The Group's target is to achieve a return on capital of 20 percent per annum. In 2010 the return was 16,7% per annum (2009 - 18,5% per annum).
Notes to the annual financial statementsfor the year ended 30 June 2010 (continued)
35
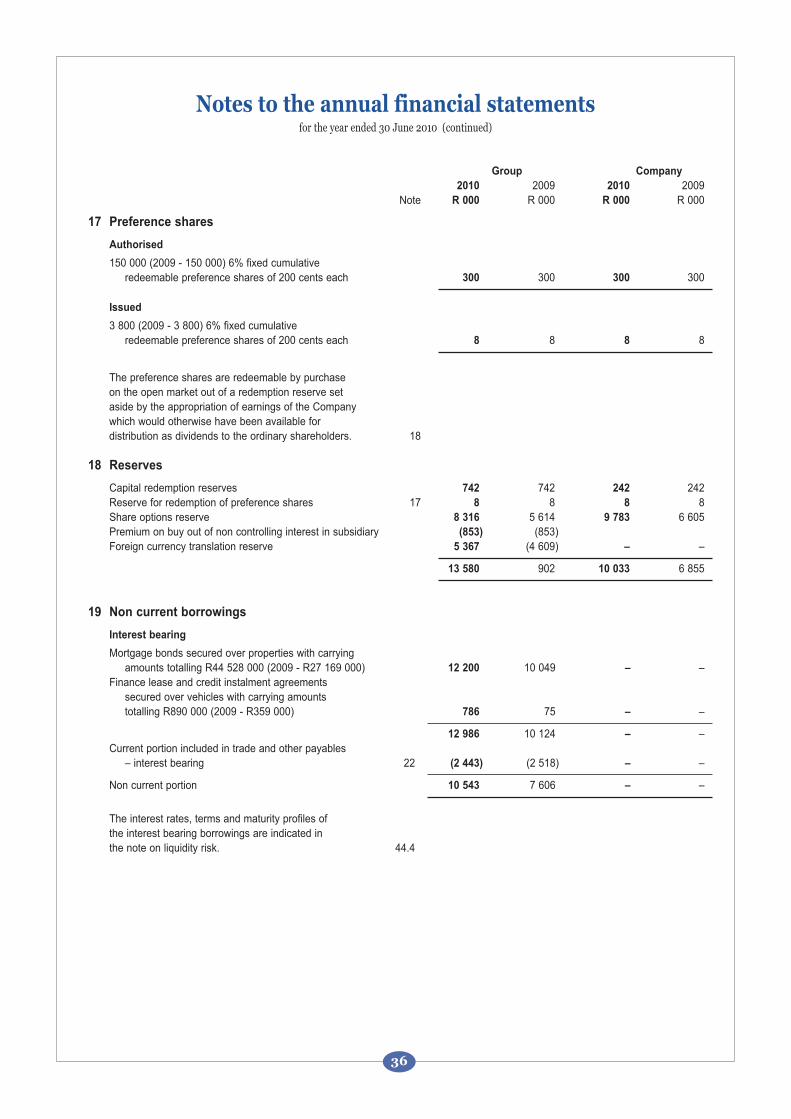
Group Company
2010 2009 2010 2009 Note R 000 R 000 R 000 R 000
17 Preference shares
Authorised
150 000 (2009 - 150 000) 6% fixed cumulativeredeemable preference shares of 200 cents each 300 300 300 300
Issued
3 800 (2009 - 3 800) 6% fixed cumulative redeemable preference shares of 200 cents each 8 8 8 8
The preference shares are redeemable by purchase on the open market out of a redemption reserve set aside by the appropriation of earnings of the Companywhich would otherwise have been available for distribution as dividends to the ordinary shareholders. 18
18 Reserves
Capital redemption reserves 742 742 242 242 Reserve for redemption of preference shares 17 8 8 8 8Share options reserve 8 316 5 614 9 783 6 605Premium on buy out of non controlling interest in subsidiary (853) (853)Foreign currency translation reserve 5 367 (4 609) – –
13 580 902 10 033 6 855
19 Non current borrowings
Interest bearing
Mortgage bonds secured over properties with carrying amounts totalling R44 528 000 (2009 - R27 169 000) 12 200 10 049 – –
Finance lease and credit instalment agreementssecured over vehicles with carrying amountstotalling R890 000 (2009 - R359 000) 786 75 – –
12 986 10 124 – –Current portion included in trade and other payables
– interest bearing 22 (2 443) (2 518) – –
Non current portion 10 543 7 606 – –
The interest rates, terms and maturity profiles ofthe interest bearing borrowings are indicated in the note on liquidity risk. 44.4
Notes to the annual financial statementsfor the year ended 30 June 2010 (continued)
36
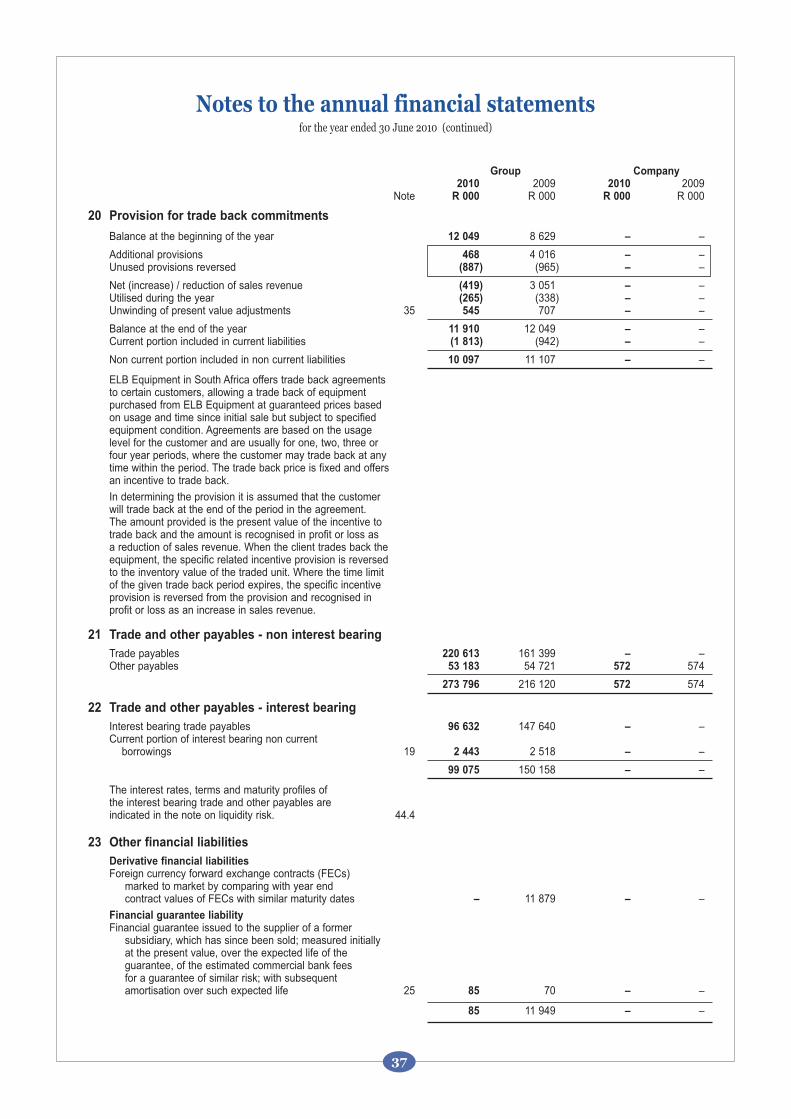
Group Company2010 2009 2010 2009
Note R 000 R 000 R 000 R 000
20 Provision for trade back commitments
Balance at the beginning of the year 12 049 8 629 – –
Additional provisions 468 4 016 – –Unused provisions reversed (887) (965) – –
Net (increase) / reduction of sales revenue (419) 3 051 – –Utilised during the year (265) (338) – –Unwinding of present value adjustments 35 545 707 – –
Balance at the end of the year 11 910 12 049 – – Current portion included in current liabilities (1 813) (942) – –
Non current portion included in non current liabilities 10 097 11 107 – –
ELB Equipment in South Africa offers trade back agreements to certain customers, allowing a trade back of equipment purchased from ELB Equipment at guaranteed prices based on usage and time since initial sale but subject to specified equipment condition. Agreements are based on the usage level for the customer and are usually for one, two, three or four year periods, where the customer may trade back at anytime within the period. The trade back price is fixed and offers an incentive to trade back.
In determining the provision it is assumed that the customer will trade back at the end of the period in the agreement. The amount provided is the present value of the incentive totrade back and the amount is recognised in profit or loss as a reduction of sales revenue. When the client trades back the equipment, the specific related incentive provision is reversed to the inventory value of the traded unit. Where the time limit of the given trade back period expires, the specific incentive provision is reversed from the provision and recognised in profit or loss as an increase in sales revenue.
21 Trade and other payables - non interest bearing
Trade payables 220 613 161 399 – –Other payables 53 183 54 721 572 574
273 796 216 120 572 574
22 Trade and other payables - interest bearing
Interest bearing trade payables 96 632 147 640 – –Current portion of interest bearing non current
borrowings 19 2 443 2 518 – –
99 075 150 158 – –
The interest rates, terms and maturity profiles of the interest bearing trade and other payables are indicated in the note on liquidity risk. 44.4
23 Other financial liabilities
Derivative financial liabilitiesForeign currency forward exchange contracts (FECs)
marked to market by comparing with year endcontract values of FECs with similar maturity dates – 11 879 – –
Financial guarantee liabilityFinancial guarantee issued to the supplier of a former
subsidiary, which has since been sold; measured initiallyat the present value, over the expected life of theguarantee, of the estimated commercial bank feesfor a guarantee of similar risk; with subsequentamortisation over such expected life 25 85 70 – –
85 11 949 – –
Notes to the annual financial statementsfor the year ended 30 June 2010 (continued)
37
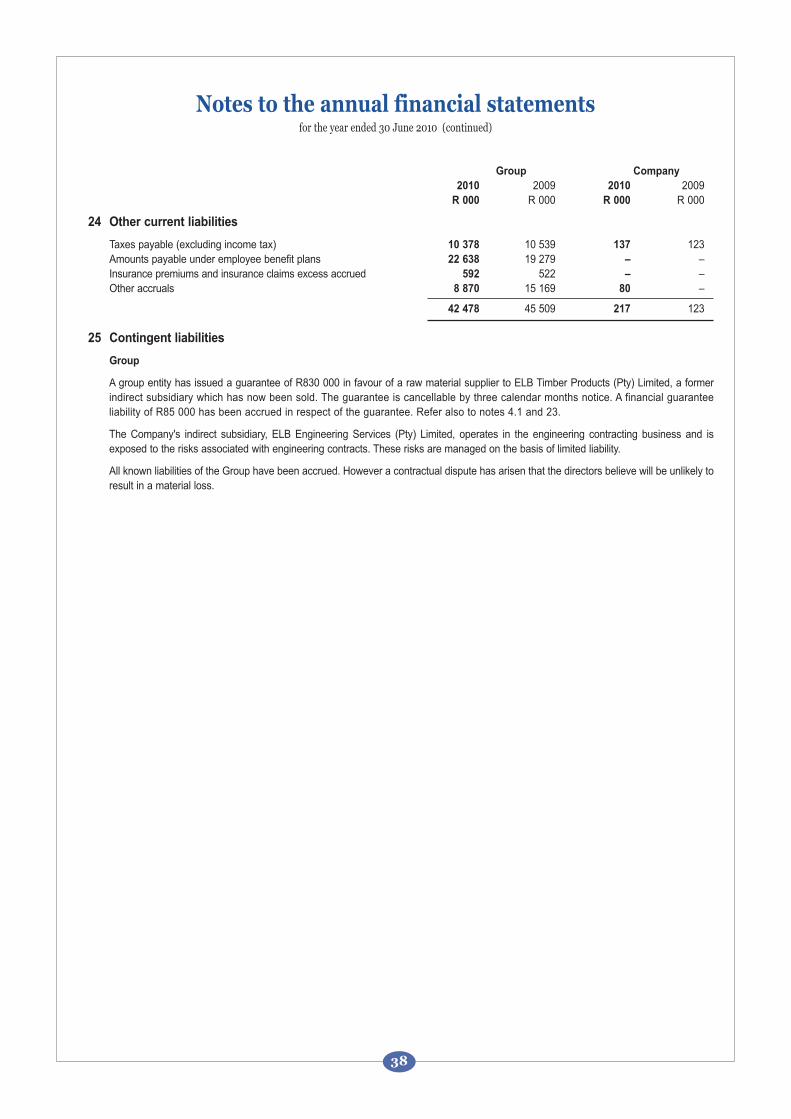
Group Company
2010 2009 2010 2009R 000 R 000 R 000 R 000
24 Other current liabilities
Taxes payable (excluding income tax) 10 378 10 539 137 123 Amounts payable under employee benefit plans 22 638 19 279 – – Insurance premiums and insurance claims excess accrued 592 522 – – Other accruals 8 870 15 169 80 –
42 478 45 509 217 123
25 Contingent liabilities
Group
A group entity has issued a guarantee of R830 000 in favour of a raw material supplier to ELB Timber Products (Pty) Limited, a formerindirect subsidiary which has now been sold. The guarantee is cancellable by three calendar months notice. A financial guaranteeliability of R85 000 has been accrued in respect of the guarantee. Refer also to notes 4.1 and 23.
The Company's indirect subsidiary, ELB Engineering Services (Pty) Limited, operates in the engineering contracting business and isexposed to the risks associated with engineering contracts. These risks are managed on the basis of limited liability.
All known liabilities of the Group have been accrued. However a contractual dispute has arisen that the directors believe will be unlikely toresult in a material loss.
Notes to the annual financial statementsfor the year ended 30 June 2010 (continued)
38
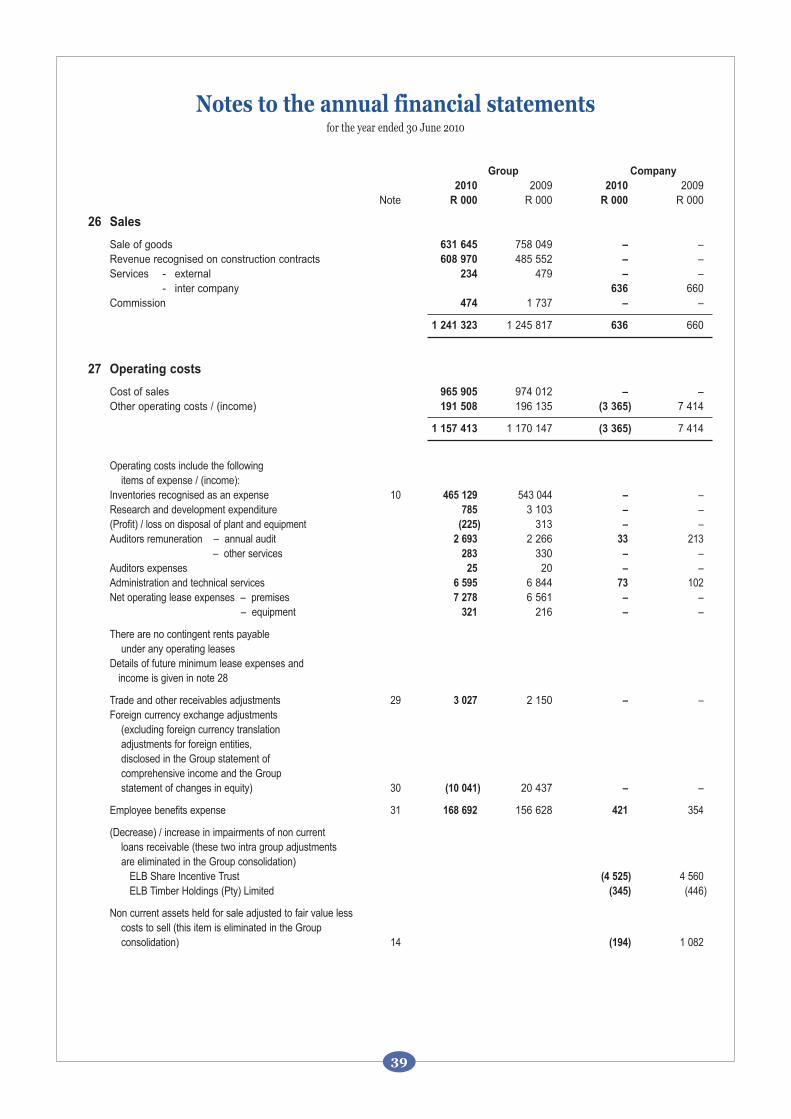
Group Company
2010 2009 2010 2009Note R 000 R 000 R 000 R 000
26 Sales
Sale of goods 631 645 758 049 – – Revenue recognised on construction contracts 608 970 485 552 – –Services - external 234 479 – –
- inter company 636 660Commission 474 1 737 – –
1 241 323 1 245 817 636 660
27 Operating costs
Cost of sales 965 905 974 012 – – Other operating costs / (income) 191 508 196 135 (3 365) 7 414
1 157 413 1 170 147 (3 365) 7 414
Operating costs include the followingitems of expense / (income):
Inventories recognised as an expense 10 465 129 543 044 – –Research and development expenditure 785 3 103 – – (Profit) / loss on disposal of plant and equipment (225) 313 – –Auditors remuneration – annual audit 2 693 2 266 33 213
– other services 283 330 – –Auditors expenses 25 20 – –Administration and technical services 6 595 6 844 73 102Net operating lease expenses – premises 7 278 6 561 – –
– equipment 321 216 – –
There are no contingent rents payable under any operating leases
Details of future minimum lease expenses and income is given in note 28
Trade and other receivables adjustments 29 3 027 2 150 – –Foreign currency exchange adjustments
(excluding foreign currency translationadjustments for foreign entities,disclosed in the Group statement of comprehensive income and the Group statement of changes in equity) 30 (10 041) 20 437 – –
Employee benefits expense 31 168 692 156 628 421 354
(Decrease) / increase in impairments of non current loans receivable (these two intra group adjustments are eliminated in the Group consolidation)
ELB Share Incentive Trust (4 525) 4 560ELB Timber Holdings (Pty) Limited (345) (446)
Non current assets held for sale adjusted to fair value lesscosts to sell (this item is eliminated in the Groupconsolidation) 14 (194) 1 082
Notes to the annual financial statementsfor the year ended 30 June 2010
39
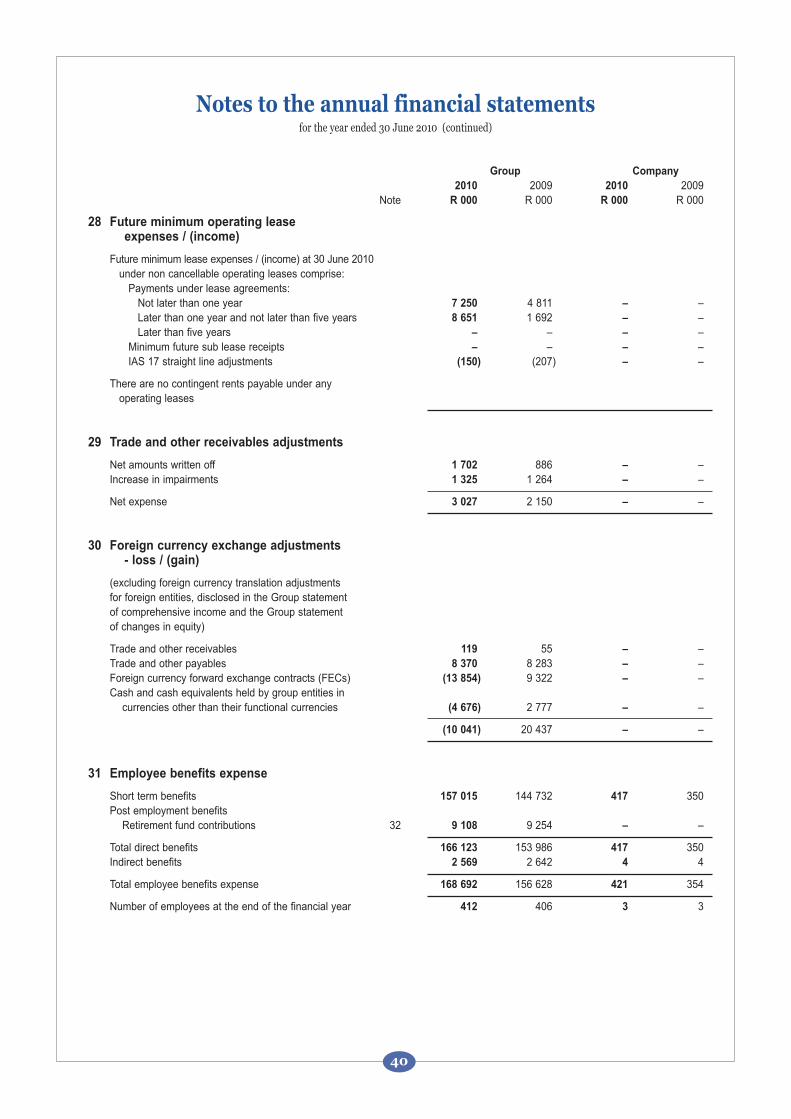
Group Company
2010 2009 2010 2009Note R 000 R 000 R 000 R 000
28 Future minimum operating lease expenses / (income)
Future minimum lease expenses / (income) at 30 June 2010under non cancellable operating leases comprise:
Payments under lease agreements:Not later than one year 7 250 4 811 – –Later than one year and not later than five years 8 651 1 692 – –Later than five years – – – –
Minimum future sub lease receipts – – – –IAS 17 straight line adjustments (150) (207) – –
There are no contingent rents payable under anyoperating leases
29 Trade and other receivables adjustments
Net amounts written off 1 702 886 – –Increase in impairments 1 325 1 264 – –
Net expense 3 027 2 150 – –
30 Foreign currency exchange adjustments- loss / (gain)
(excluding foreign currency translation adjustmentsfor foreign entities, disclosed in the Group statementof comprehensive income and the Group statementof changes in equity)
Trade and other receivables 119 55 – – Trade and other payables 8 370 8 283 – – Foreign currency forward exchange contracts (FECs) (13 854) 9 322 – – Cash and cash equivalents held by group entities in
currencies other than their functional currencies (4 676) 2 777 – –
(10 041) 20 437 – –
31 Employee benefits expense
Short term benefits 157 015 144 732 417 350Post employment benefits
Retirement fund contributions 32 9 108 9 254 – –
Total direct benefits 166 123 153 986 417 350 Indirect benefits 2 569 2 642 4 4
Total employee benefits expense 168 692 156 628 421 354
Number of employees at the end of the financial year 412 406 3 3
Notes to the annual financial statementsfor the year ended 30 June 2010 (continued)
40
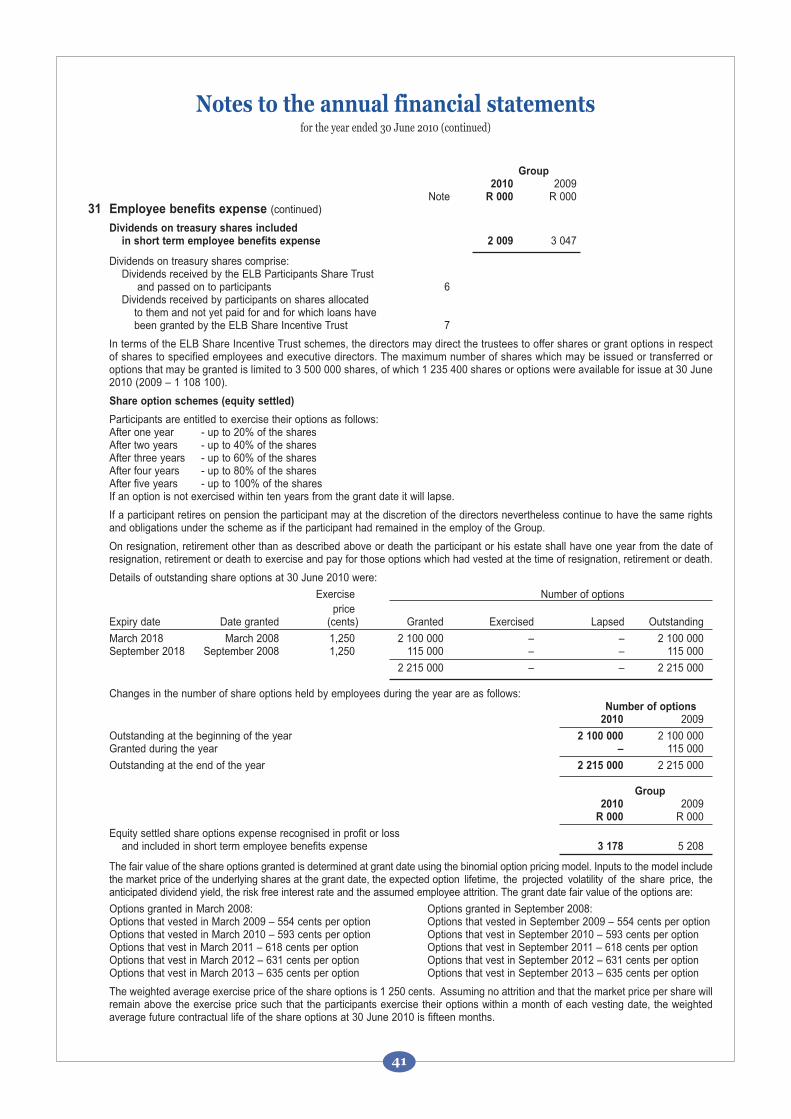
Group 2010 2009
Note R 000 R 00031 Employee benefits expense (continued)
Dividends on treasury shares includedin short term employee benefits expense 2 009 3 047
Dividends on treasury shares comprise:Dividends received by the ELB Participants Share Trust
and passed on to participants 6Dividends received by participants on shares allocated
to them and not yet paid for and for which loans have been granted by the ELB Share Incentive Trust 7
In terms of the ELB Share Incentive Trust schemes, the directors may direct the trustees to offer shares or grant options in respectof shares to specified employees and executive directors. The maximum number of shares which may be issued or transferred oroptions that may be granted is limited to 3 500 000 shares, of which 1 235 400 shares or options were available for issue at 30 June2010 (2009 – 1 108 100).
Share option schemes (equity settled)
Participants are entitled to exercise their options as follows:After one year - up to 20% of the sharesAfter two years - up to 40% of the sharesAfter three years - up to 60% of the sharesAfter four years - up to 80% of the sharesAfter five years - up to 100% of the sharesIf an option is not exercised within ten years from the grant date it will lapse.
If a participant retires on pension the participant may at the discretion of the directors nevertheless continue to have the same rightsand obligations under the scheme as if the participant had remained in the employ of the Group.
On resignation, retirement other than as described above or death the participant or his estate shall have one year from the date ofresignation, retirement or death to exercise and pay for those options which had vested at the time of resignation, retirement or death.
Details of outstanding share options at 30 June 2010 were:
Exercise Number of options price
Expiry date Date granted (cents) Granted Exercised Lapsed Outstanding
March 2018 March 2008 1,250 2 100 000 – – 2 100 000September 2018 September 2008 1,250 115 000 – – 115 000
2 215 000 – – 2 215 000
Changes in the number of share options held by employees during the year are as follows:Number of options
2010 2009
Outstanding at the beginning of the year 2 100 000 2 100 000Granted during the year – 115 000
Outstanding at the end of the year 2 215 000 2 215 000
Group 2010 2009
R 000 R 000
Equity settled share options expense recognised in profit or lossand included in short term employee benefits expense 3 178 5 208
The fair value of the share options granted is determined at grant date using the binomial option pricing model. Inputs to the model includethe market price of the underlying shares at the grant date, the expected option lifetime, the projected volatility of the share price, theanticipated dividend yield, the risk free interest rate and the assumed employee attrition. The grant date fair value of the options are:
Options granted in March 2008: Options granted in September 2008:Options that vested in March 2009 – 554 cents per option Options that vested in September 2009 – 554 cents per optionOptions that vested in March 2010 – 593 cents per option Options that vest in September 2010 – 593 cents per optionOptions that vest in March 2011 – 618 cents per option Options that vest in September 2011 – 618 cents per optionOptions that vest in March 2012 – 631 cents per option Options that vest in September 2012 – 631 cents per optionOptions that vest in March 2013 – 635 cents per option Options that vest in September 2013 – 635 cents per option
The weighted average exercise price of the share options is 1 250 cents. Assuming no attrition and that the market price per share willremain above the exercise price such that the participants exercise their options within a month of each vesting date, the weightedaverage future contractual life of the share options at 30 June 2010 is fifteen months.
Notes to the annual financial statementsfor the year ended 30 June 2010 (continued)
41
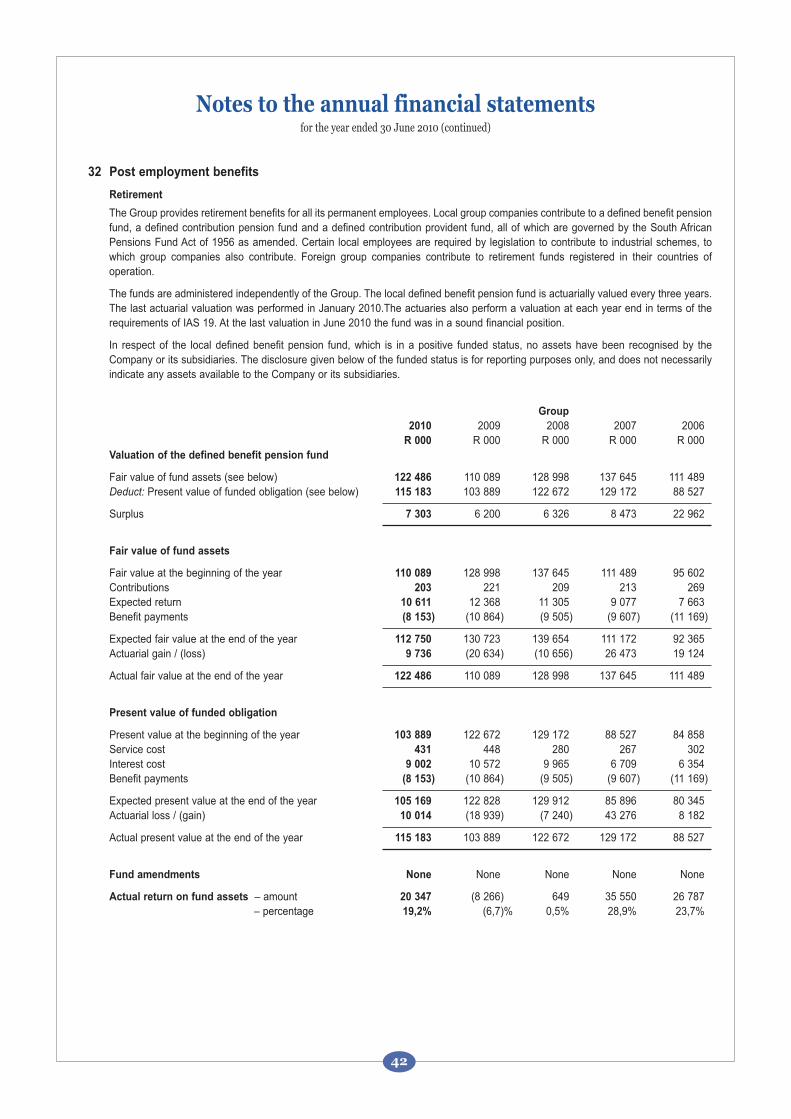
32 Post employment benefits
Retirement
The Group provides retirement benefits for all its permanent employees. Local group companies contribute to a defined benefit pensionfund, a defined contribution pension fund and a defined contribution provident fund, all of which are governed by the South AfricanPensions Fund Act of 1956 as amended. Certain local employees are required by legislation to contribute to industrial schemes, towhich group companies also contribute. Foreign group companies contribute to retirement funds registered in their countries ofoperation.
The funds are administered independently of the Group. The local defined benefit pension fund is actuarially valued every three years.The last actuarial valuation was performed in January 2010.The actuaries also perform a valuation at each year end in terms of therequirements of IAS 19. At the last valuation in June 2010 the fund was in a sound financial position.
In respect of the local defined benefit pension fund, which is in a positive funded status, no assets have been recognised by theCompany or its subsidiaries. The disclosure given below of the funded status is for reporting purposes only, and does not necessarilyindicate any assets available to the Company or its subsidiaries.
Group
2010 2009 2008 2007 2006R 000 R 000 R 000 R 000 R 000
Valuation of the defined benefit pension fund
Fair value of fund assets (see below) 122 486 110 089 128 998 137 645 111 489 Deduct: Present value of funded obligation (see below) 115 183 103 889 122 672 129 172 88 527
Surplus 7 303 6 200 6 326 8 473 22 962
Fair value of fund assets
Fair value at the beginning of the year 110 089 128 998 137 645 111 489 95 602 Contributions 203 221 209 213 269 Expected return 10 611 12 368 11 305 9 077 7 663 Benefit payments (8 153) (10 864) (9 505) (9 607) (11 169)
Expected fair value at the end of the year 112 750 130 723 139 654 111 172 92 365 Actuarial gain / (loss) 9 736 (20 634) (10 656) 26 473 19 124
Actual fair value at the end of the year 122 486 110 089 128 998 137 645 111 489
Present value of funded obligation
Present value at the beginning of the year 103 889 122 672 129 172 88 527 84 858 Service cost 431 448 280 267 302 Interest cost 9 002 10 572 9 965 6 709 6 354 Benefit payments (8 153) (10 864) (9 505) (9 607) (11 169)
Expected present value at the end of the year 105 169 122 828 129 912 85 896 80 345 Actuarial loss / (gain) 10 014 (18 939) (7 240) 43 276 8 182
Actual present value at the end of the year 115 183 103 889 122 672 129 172 88 527
Fund amendments None None None None None
Actual return on fund assets – amount 20 347 (8 266) 649 35 550 26 787 – percentage 19,2% (6,7)% 0,5% 28,9% 23,7%
Notes to the annual financial statementsfor the year ended 30 June 2010 (continued)
42
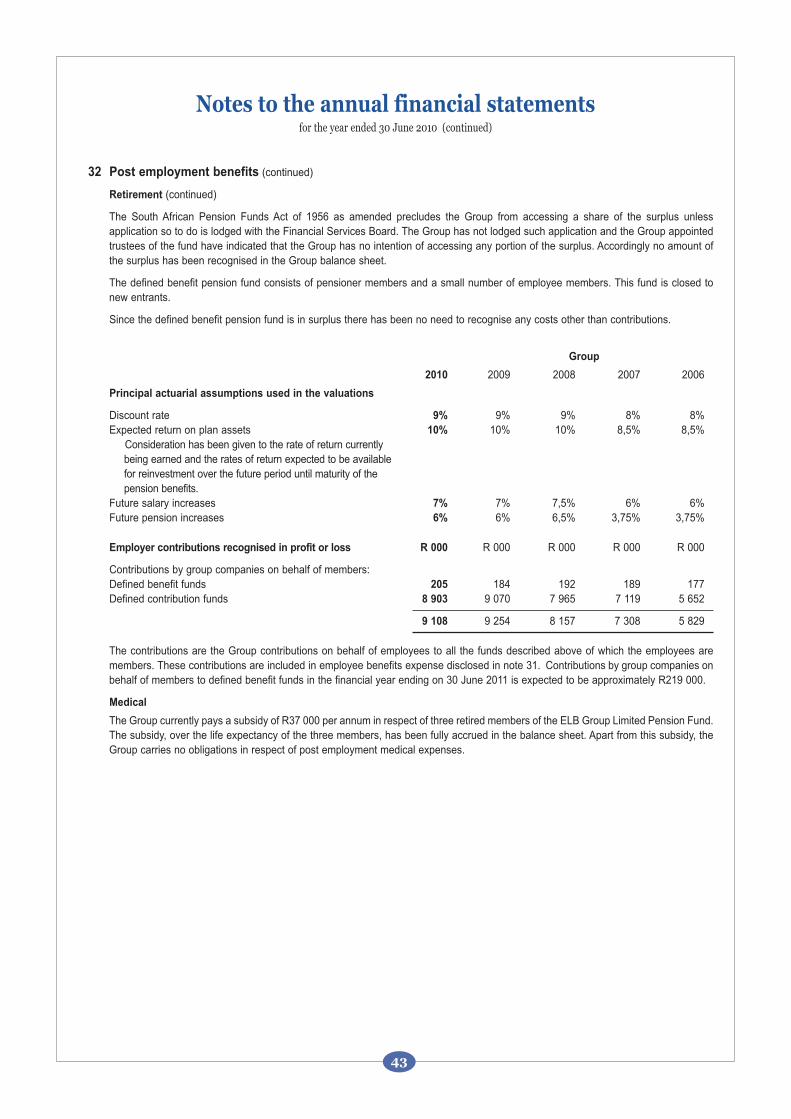
32 Post employment benefits (continued)
Retirement (continued)
The South African Pension Funds Act of 1956 as amended precludes the Group from accessing a share of the surplus unlessapplication so to do is lodged with the Financial Services Board. The Group has not lodged such application and the Group appointedtrustees of the fund have indicated that the Group has no intention of accessing any portion of the surplus. Accordingly no amount ofthe surplus has been recognised in the Group balance sheet.
The defined benefit pension fund consists of pensioner members and a small number of employee members. This fund is closed tonew entrants.
Since the defined benefit pension fund is in surplus there has been no need to recognise any costs other than contributions.
Group
2010 2009 2008 2007 2006
Principal actuarial assumptions used in the valuations
Discount rate 9% 9% 9% 8% 8%Expected return on plan assets 10% 10% 10% 8,5% 8,5%
Consideration has been given to the rate of return currentlybeing earned and the rates of return expected to be availablefor reinvestment over the future period until maturity of the pension benefits.
Future salary increases 7% 7% 7,5% 6% 6%Future pension increases 6% 6% 6,5% 3,75% 3,75%
Employer contributions recognised in profit or loss R 000 R 000 R 000 R 000 R 000
Contributions by group companies on behalf of members:Defined benefit funds 205 184 192 189 177Defined contribution funds 8 903 9 070 7 965 7 119 5 652
9 108 9 254 8 157 7 308 5 829
The contributions are the Group contributions on behalf of employees to all the funds described above of which the employees aremembers. These contributions are included in employee benefits expense disclosed in note 31. Contributions by group companies onbehalf of members to defined benefit funds in the financial year ending on 30 June 2011 is expected to be approximately R219 000.
Medical
The Group currently pays a subsidy of R37 000 per annum in respect of three retired members of the ELB Group Limited Pension Fund.The subsidy, over the life expectancy of the three members, has been fully accrued in the balance sheet. Apart from this subsidy, theGroup carries no obligations in respect of post employment medical expenses.
Notes to the annual financial statementsfor the year ended 30 June 2010 (continued)
43
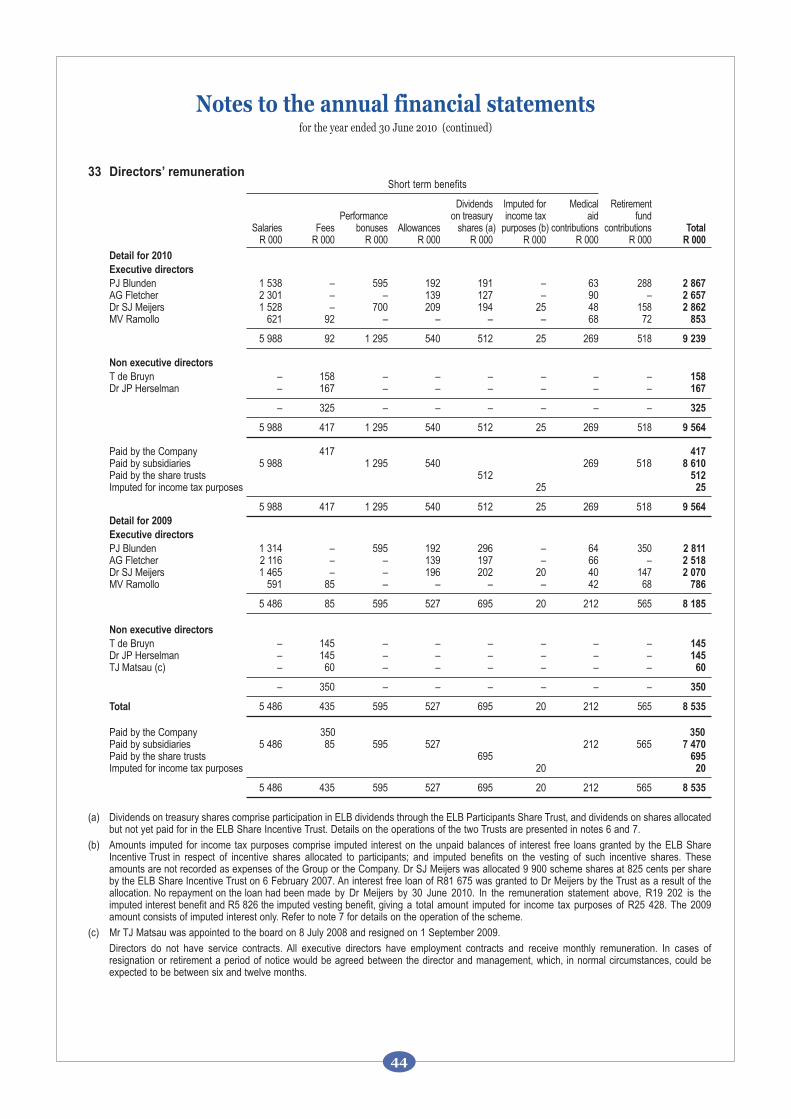
33 Directors’ remunerationShort term benefits
Dividends Imputed for Medical RetirementPerformance on treasury income tax aid fund
Salaries Fees bonuses Allowances shares (a) purposes (b) contributions contributions TotalR 000 R 000 R 000 R 000 R 000 R 000 R 000 R 000 R 000
Detail for 2010
Executive directors
PJ Blunden 1 538 – 595 192 191 – 63 288 2 867AG Fletcher 2 301 – – 139 127 – 90 – 2 657Dr SJ Meijers 1 528 – 700 209 194 25 48 158 2 862MV Ramollo 621 92 – – – – 68 72 853
5 988 92 1 295 540 512 25 269 518 9 239
Non executive directors
T de Bruyn – 158 – – – – – – 158 Dr JP Herselman – 167 – – – – – – 167
– 325 – – – – – – 325
5 988 417 1 295 540 512 25 269 518 9 564
Paid by the Company 417 417Paid by subsidiaries 5 988 1 295 540 269 518 8 610Paid by the share trusts 512 512Imputed for income tax purposes 25 25
5 988 417 1 295 540 512 25 269 518 9 564
Detail for 2009
Executive directors
PJ Blunden 1 314 – 595 192 296 – 64 350 2 811AG Fletcher 2 116 – – 139 197 – 66 – 2 518Dr SJ Meijers 1 465 – – 196 202 20 40 147 2 070MV Ramollo 591 85 – – – – 42 68 786
5 486 85 595 527 695 20 212 565 8 185
Non executive directors
T de Bruyn – 145 – – – – – – 145 Dr JP Herselman – 145 – – – – – – 145 TJ Matsau (c) – 60 – – – – – – 60
– 350 – – – – – – 350
Total 5 486 435 595 527 695 20 212 565 8 535
Paid by the Company 350 350Paid by subsidiaries 5 486 85 595 527 212 565 7 470Paid by the share trusts 695 695Imputed for income tax purposes 20 20
5 486 435 595 527 695 20 212 565 8 535
(a) Dividends on treasury shares comprise participation in ELB dividends through the ELB Participants Share Trust, and dividends on shares allocatedbut not yet paid for in the ELB Share Incentive Trust. Details on the operations of the two Trusts are presented in notes 6 and 7.
(b) Amounts imputed for income tax purposes comprise imputed interest on the unpaid balances of interest free loans granted by the ELB ShareIncentive Trust in respect of incentive shares allocated to participants; and imputed benefits on the vesting of such incentive shares. Theseamounts are not recorded as expenses of the Group or the Company. Dr SJ Meijers was allocated 9 900 scheme shares at 825 cents per shareby the ELB Share Incentive Trust on 6 February 2007. An interest free loan of R81 675 was granted to Dr Meijers by the Trust as a result of theallocation. No repayment on the loan had been made by Dr Meijers by 30 June 2010. In the remuneration statement above, R19 202 is theimputed interest benefit and R5 826 the imputed vesting benefit, giving a total amount imputed for income tax purposes of R25 428. The 2009amount consists of imputed interest only. Refer to note 7 for details on the operation of the scheme.
(c) Mr TJ Matsau was appointed to the board on 8 July 2008 and resigned on 1 September 2009.
Directors do not have service contracts. All executive directors have employment contracts and receive monthly remuneration. In cases ofresignation or retirement a period of notice would be agreed between the director and management, which, in normal circumstances, could beexpected to be between six and twelve months.
Notes to the annual financial statementsfor the year ended 30 June 2010 (continued)
44
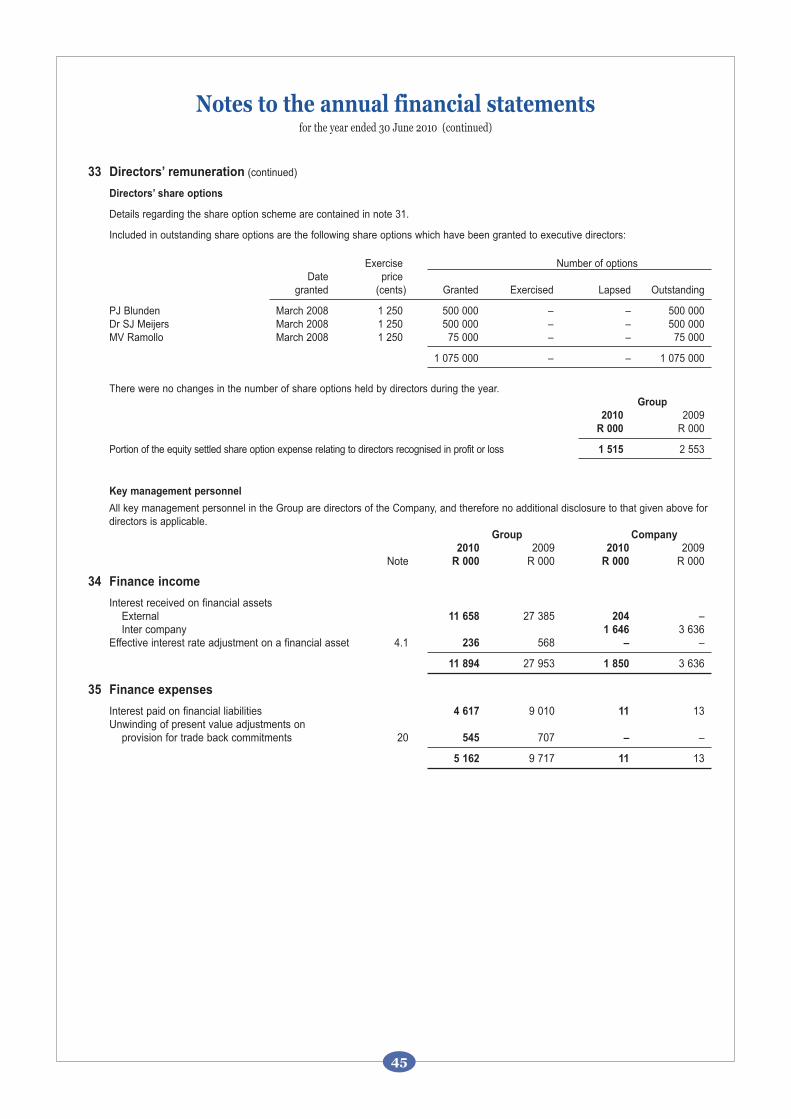
33 Directors’ remuneration (continued)
Directors’ share options
Details regarding the share option scheme are contained in note 31.
Included in outstanding share options are the following share options which have been granted to executive directors:
Exercise Number of options Date price
granted (cents) Granted Exercised Lapsed Outstanding
PJ Blunden March 2008 1 250 500 000 – – 500 000 Dr SJ Meijers March 2008 1 250 500 000 – – 500 000 MV Ramollo March 2008 1 250 75 000 – – 75 000
1 075 000 – – 1 075 000
There were no changes in the number of share options held by directors during the year.Group
2010 2009 R 000 R 000
Portion of the equity settled share option expense relating to directors recognised in profit or loss 1 515 2 553
Key management personnel
All key management personnel in the Group are directors of the Company, and therefore no additional disclosure to that given above fordirectors is applicable.
Group Company
2010 2009 2010 2009 Note R 000 R 000 R 000 R 000
34 Finance income
Interest received on financial assetsExternal 11 658 27 385 204 –Inter company 1 646 3 636
Effective interest rate adjustment on a financial asset 4.1 236 568 – –
11 894 27 953 1 850 3 636
35 Finance expenses
Interest paid on financial liabilities 4 617 9 010 11 13Unwinding of present value adjustments on
provision for trade back commitments 20 545 707 – –
5 162 9 717 11 13
Notes to the annual financial statementsfor the year ended 30 June 2010 (continued)
45
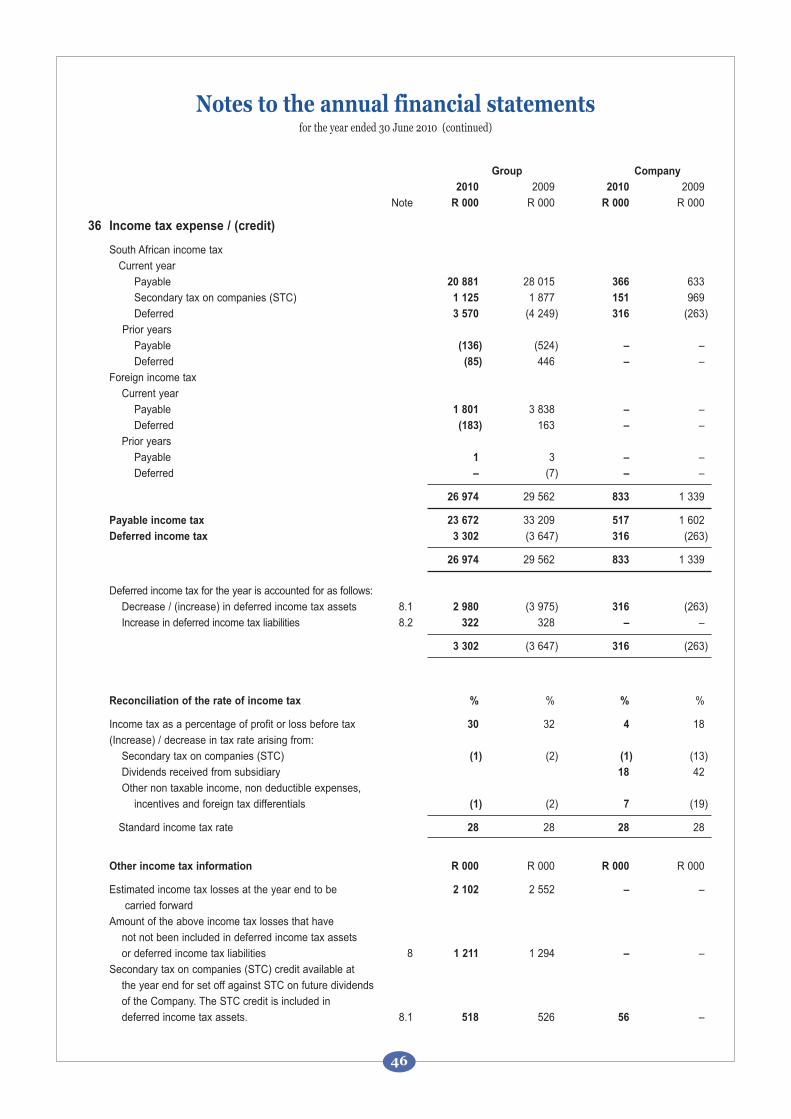
Group Company
2010 2009 2010 2009
Note R 000 R 000 R 000 R 000
36 Income tax expense / (credit)
South African income tax
Current year
Payable 20 881 28 015 366 633
Secondary tax on companies (STC) 1 125 1 877 151 969
Deferred 3 570 (4 249) 316 (263)
Prior years
Payable (136) (524) – –
Deferred (85) 446 – –
Foreign income tax
Current year
Payable 1 801 3 838 – –
Deferred (183) 163 – –
Prior years
Payable 1 3 – –
Deferred – (7) – –
26 974 29 562 833 1 339
Payable income tax 23 672 33 209 517 1 602
Deferred income tax 3 302 (3 647) 316 (263)
26 974 29 562 833 1 339
Deferred income tax for the year is accounted for as follows:
Decrease / (increase) in deferred income tax assets 8.1 2 980 (3 975) 316 (263)
Increase in deferred income tax liabilities 8.2 322 328 – –
3 302 (3 647) 316 (263)
Reconciliation of the rate of income tax % % % %
Income tax as a percentage of profit or loss before tax 30 32 4 18
(Increase) / decrease in tax rate arising from:
Secondary tax on companies (STC) (1) (2) (1) (13)
Dividends received from subsidiary 18 42
Other non taxable income, non deductible expenses,
incentives and foreign tax differentials (1) (2) 7 (19)
Standard income tax rate 28 28 28 28
Other income tax information R 000 R 000 R 000 R 000
Estimated income tax losses at the year end to be 2 102 2 552 – –
carried forward
Amount of the above income tax losses that have
not not been included in deferred income tax assets
or deferred income tax liabilities 8 1 211 1 294 – –
Secondary tax on companies (STC) credit available at
the year end for set off against STC on future dividends
of the Company. The STC credit is included in
deferred income tax assets. 8.1 518 526 56 –
Notes to the annual financial statementsfor the year ended 30 June 2010 (continued)
46
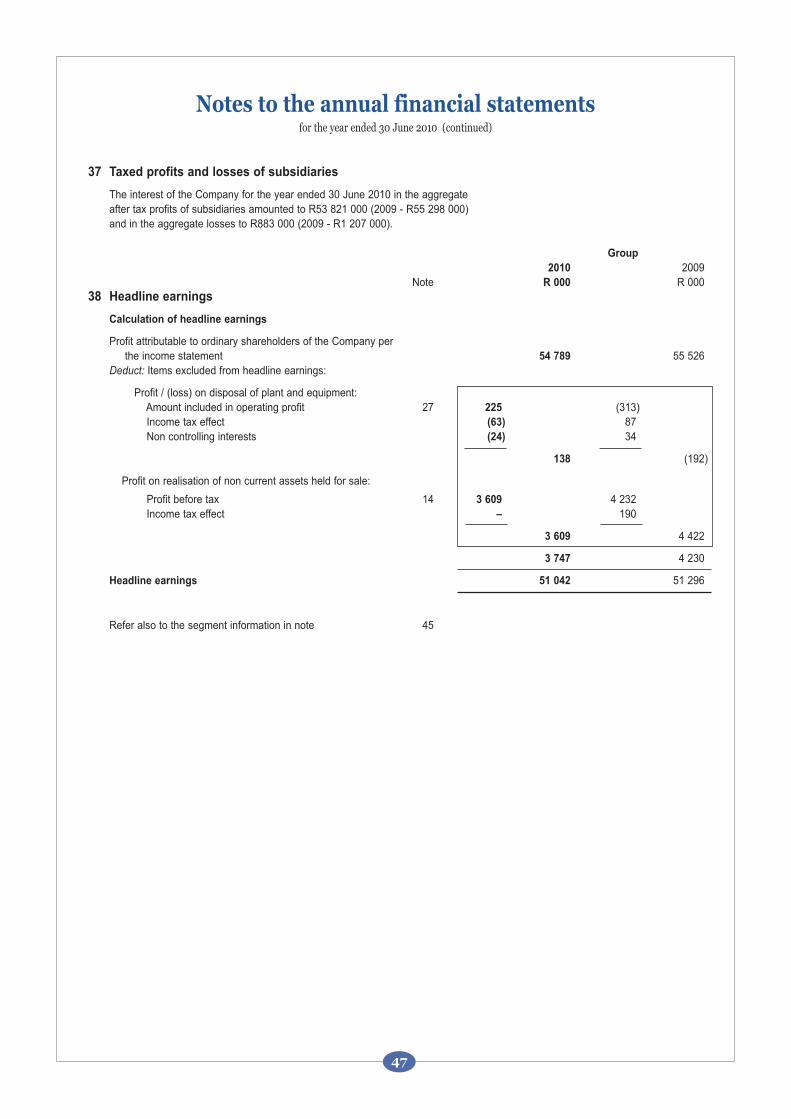
37 Taxed profits and losses of subsidiaries
The interest of the Company for the year ended 30 June 2010 in the aggregateafter tax profits of subsidiaries amounted to R53 821 000 (2009 - R55 298 000) and in the aggregate losses to R883 000 (2009 - R1 207 000).
Group
2010 2009Note R 000 R 000
38 Headline earnings
Calculation of headline earnings
Profit attributable to ordinary shareholders of the Company per the income statement 54 789 55 526
Deduct: Items excluded from headline earnings:
Profit / (loss) on disposal of plant and equipment:Amount included in operating profit 27 225 (313)Income tax effect (63) 87Non controlling interests (24) 34
138 (192)
Profit on realisation of non current assets held for sale:
Profit before tax 14 3 609 4 232Income tax effect – 190
3 609 4 422
3 747 4 230
Headline earnings 51 042 51 296
Refer also to the segment information in note 45
Notes to the annual financial statementsfor the year ended 30 June 2010 (continued)
47
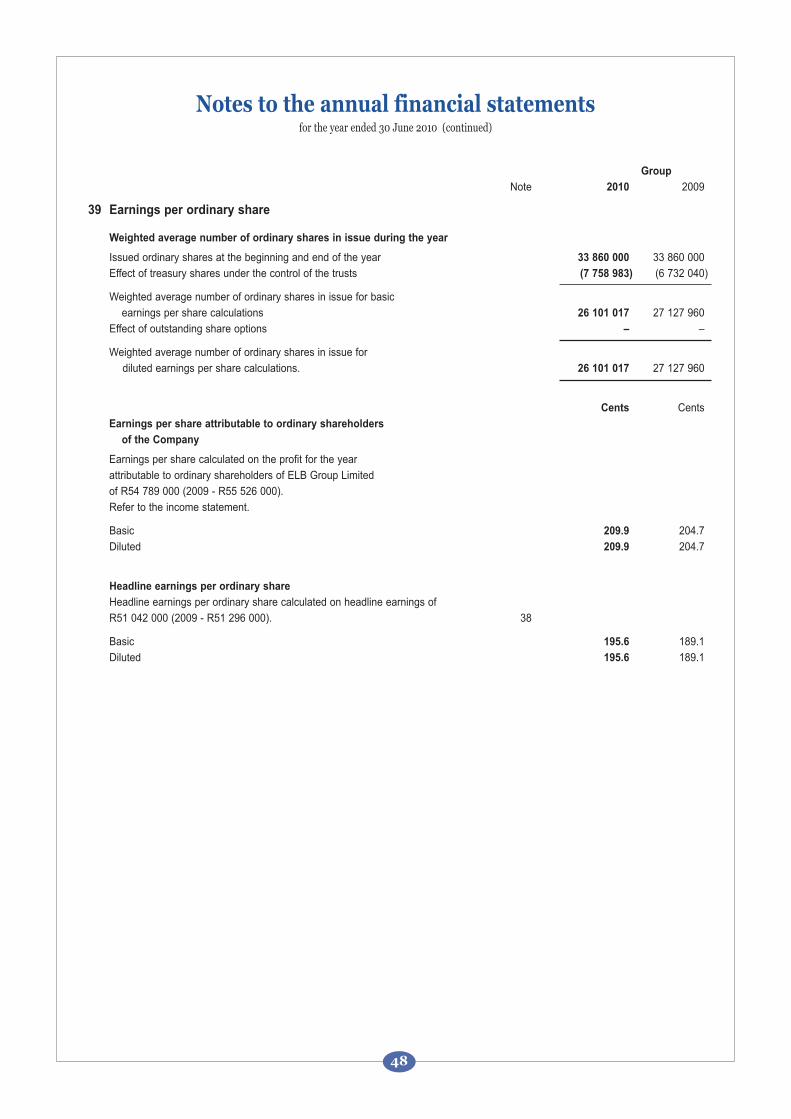
Group
Note 2010 2009
39 Earnings per ordinary share
Weighted average number of ordinary shares in issue during the year
Issued ordinary shares at the beginning and end of the year 33 860 000 33 860 000
Effect of treasury shares under the control of the trusts (7 758 983) (6 732 040)
Weighted average number of ordinary shares in issue for basic
earnings per share calculations 26 101 017 27 127 960
Effect of outstanding share options – –
Weighted average number of ordinary shares in issue for
diluted earnings per share calculations. 26 101 017 27 127 960
Cents Cents
Earnings per share attributable to ordinary shareholders
of the Company
Earnings per share calculated on the profit for the year
attributable to ordinary shareholders of ELB Group Limited
of R54 789 000 (2009 - R55 526 000).
Refer to the income statement.
Basic 209.9 204.7
Diluted 209.9 204.7
Headline earnings per ordinary share
Headline earnings per ordinary share calculated on headline earnings of
R51 042 000 (2009 - R51 296 000). 38
Basic 195.6 189.1
Diluted 195.6 189.1
Notes to the annual financial statementsfor the year ended 30 June 2010 (continued)
48
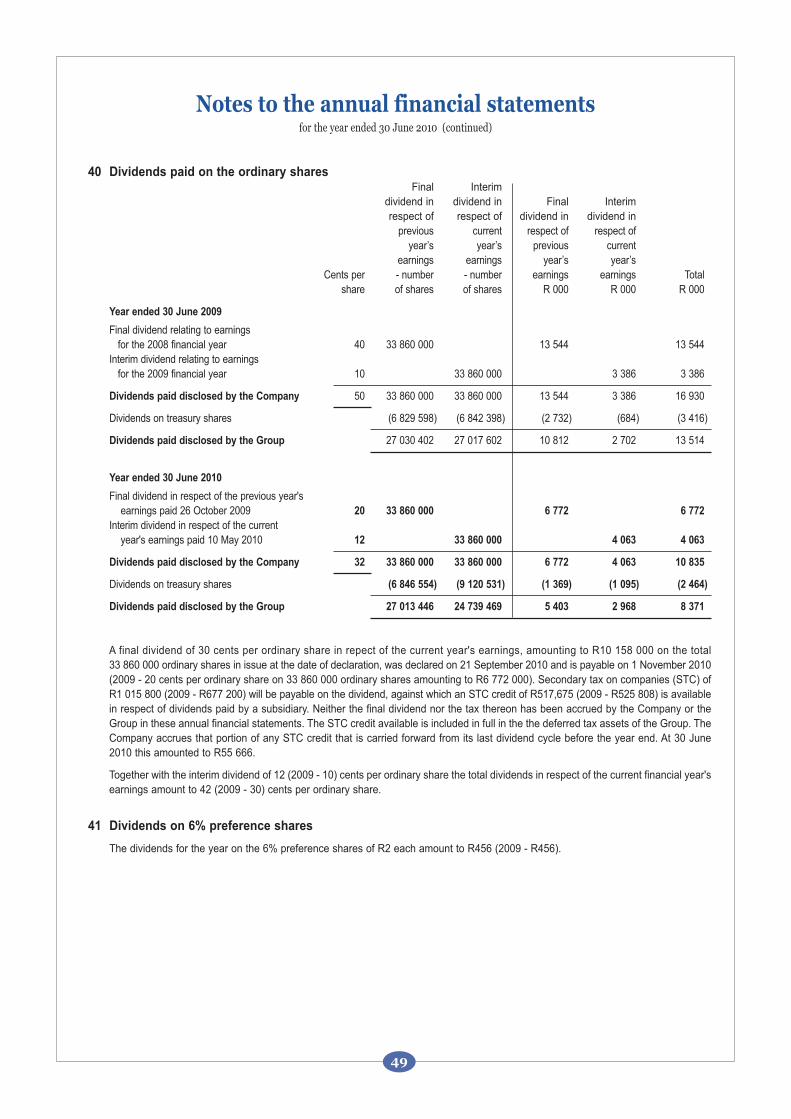
40 Dividends paid on the ordinary sharesFinal Interim
dividend in dividend in Final Interimrespect of respect of dividend in dividend in
previous current respect of respect ofyear’s year’s previous current
earnings earnings year’s year’sCents per - number - number earnings earnings Total
share of shares of shares R 000 R 000 R 000
Year ended 30 June 2009
Final dividend relating to earnings for the 2008 financial year 40 33 860 000 13 544 13 544
Interim dividend relating to earningsfor the 2009 financial year 10 33 860 000 3 386 3 386
Dividends paid disclosed by the Company 50 33 860 000 33 860 000 13 544 3 386 16 930
Dividends on treasury shares (6 829 598) (6 842 398) (2 732) (684) (3 416)
Dividends paid disclosed by the Group 27 030 402 27 017 602 10 812 2 702 13 514
Year ended 30 June 2010
Final dividend in respect of the previous year's earnings paid 26 October 2009 20 33 860 000 6 772 6 772
Interim dividend in respect of the current year's earnings paid 10 May 2010 12 33 860 000 4 063 4 063
Dividends paid disclosed by the Company 32 33 860 000 33 860 000 6 772 4 063 10 835
Dividends on treasury shares (6 846 554) (9 120 531) (1 369) (1 095) (2 464)
Dividends paid disclosed by the Group 27 013 446 24 739 469 5 403 2 968 8 371
A final dividend of 30 cents per ordinary share in repect of the current year's earnings, amounting to R10 158 000 on the total33 860 000 ordinary shares in issue at the date of declaration, was declared on 21 September 2010 and is payable on 1 November 2010(2009 - 20 cents per ordinary share on 33 860 000 ordinary shares amounting to R6 772 000). Secondary tax on companies (STC) ofR1 015 800 (2009 - R677 200) will be payable on the dividend, against which an STC credit of R517,675 (2009 - R525 808) is availablein respect of dividends paid by a subsidiary. Neither the final dividend nor the tax thereon has been accrued by the Company or theGroup in these annual financial statements. The STC credit available is included in full in the the deferred tax assets of the Group. TheCompany accrues that portion of any STC credit that is carried forward from its last dividend cycle before the year end. At 30 June2010 this amounted to R55 666.
Together with the interim dividend of 12 (2009 - 10) cents per ordinary share the total dividends in respect of the current financial year'searnings amount to 42 (2009 - 30) cents per ordinary share.
41 Dividends on 6% preference shares
The dividends for the year on the 6% preference shares of R2 each amount to R456 (2009 - R456).
Notes to the annual financial statementsfor the year ended 30 June 2010 (continued)
49
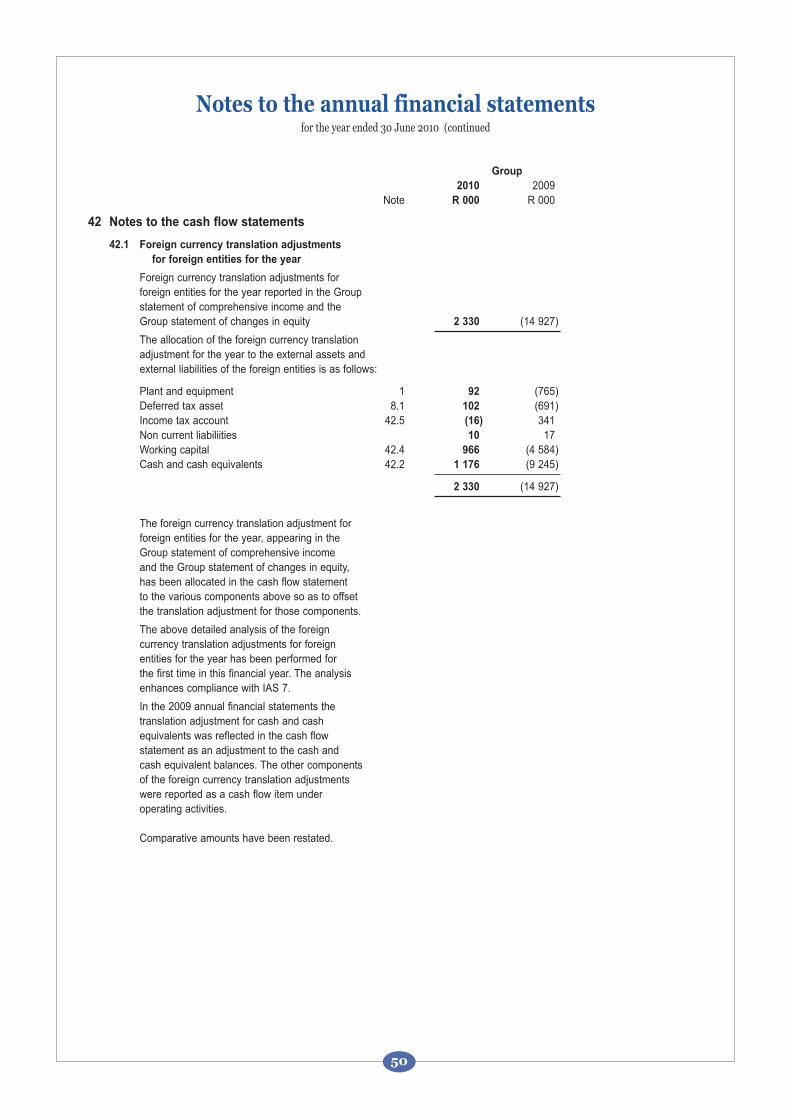
Group
2010 2009 Note R 000 R 000
42 Notes to the cash flow statements
42.1 Foreign currency translation adjustments
for foreign entities for the year
Foreign currency translation adjustments forforeign entities for the year reported in the Groupstatement of comprehensive income and theGroup statement of changes in equity 2 330 (14 927)
The allocation of the foreign currency translation adjustment for the year to the external assets andexternal liabilities of the foreign entities is as follows:
Plant and equipment 1 92 (765)Deferred tax asset 8.1 102 (691)Income tax account 42.5 (16) 341Non current liabiliities 10 17Working capital 42.4 966 (4 584)Cash and cash equivalents 42.2 1 176 (9 245)
2 330 (14 927)
The foreign currency translation adjustment forforeign entities for the year, appearing in the Group statement of comprehensive incomeand the Group statement of changes in equity,has been allocated in the cash flow statementto the various components above so as to offsetthe translation adjustment for those components.
The above detailed analysis of the foreign currency translation adjustments for foreign entities for the year has been performed forthe first time in this financial year. The analysisenhances compliance with IAS 7.
In the 2009 annual financial statements thetranslation adjustment for cash and cashequivalents was reflected in the cash flowstatement as an adjustment to the cash andcash equivalent balances. The other componentsof the foreign currency translation adjustmentswere reported as a cash flow item underoperating activities.
Comparative amounts have been restated.
Notes to the annual financial statementsfor the year ended 30 June 2010 (continued
50
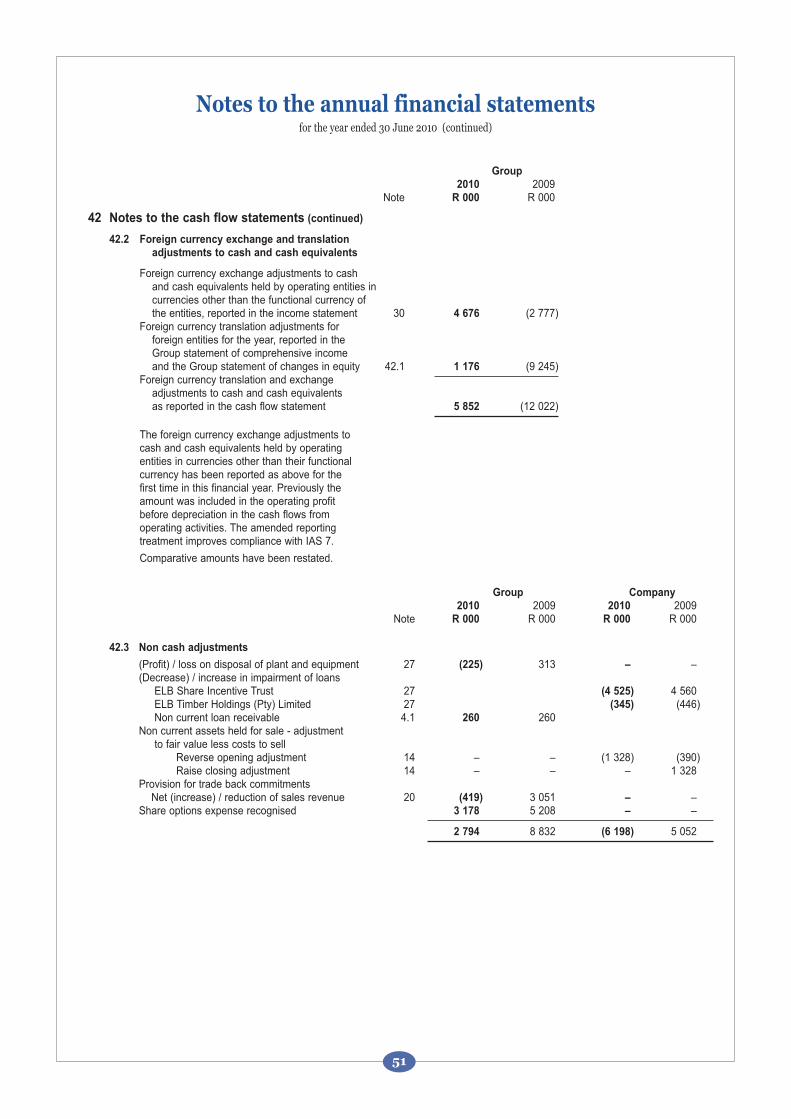
Group
2010 2009 Note R 000 R 000
42 Notes to the cash flow statements (continued)
42.2 Foreign currency exchange and translation
adjustments to cash and cash equivalents
Foreign currency exchange adjustments to cash and cash equivalents held by operating entities incurrencies other than the functional currency of the entities, reported in the income statement 30 4 676 (2 777)
Foreign currency translation adjustments for foreign entities for the year, reported in theGroup statement of comprehensive incomeand the Group statement of changes in equity 42.1 1 176 (9 245)
Foreign currency translation and exchangeadjustments to cash and cash equivalentsas reported in the cash flow statement 5 852 (12 022)
The foreign currency exchange adjustments tocash and cash equivalents held by operatingentities in currencies other than their functionalcurrency has been reported as above for thefirst time in this financial year. Previously theamount was included in the operating profitbefore depreciation in the cash flows fromoperating activities. The amended reportingtreatment improves compliance with IAS 7.
Comparative amounts have been restated.
Group Company
2010 2009 2010 2009 Note R 000 R 000 R 000 R 000
42.3 Non cash adjustments
(Profit) / loss on disposal of plant and equipment 27 (225) 313 – – (Decrease) / increase in impairment of loans
ELB Share Incentive Trust 27 (4 525) 4 560ELB Timber Holdings (Pty) Limited 27 (345) (446) Non current loan receivable 4.1 260 260
Non current assets held for sale - adjustmentto fair value less costs to sell
Reverse opening adjustment 14 – – (1 328) (390)Raise closing adjustment 14 – – – 1 328
Provision for trade back commitmentsNet (increase) / reduction of sales revenue 20 (419) 3 051 – –
Share options expense recognised 3 178 5 208 – –
2 794 8 832 (6 198) 5 052
Notes to the annual financial statementsfor the year ended 30 June 2010 (continued)
51
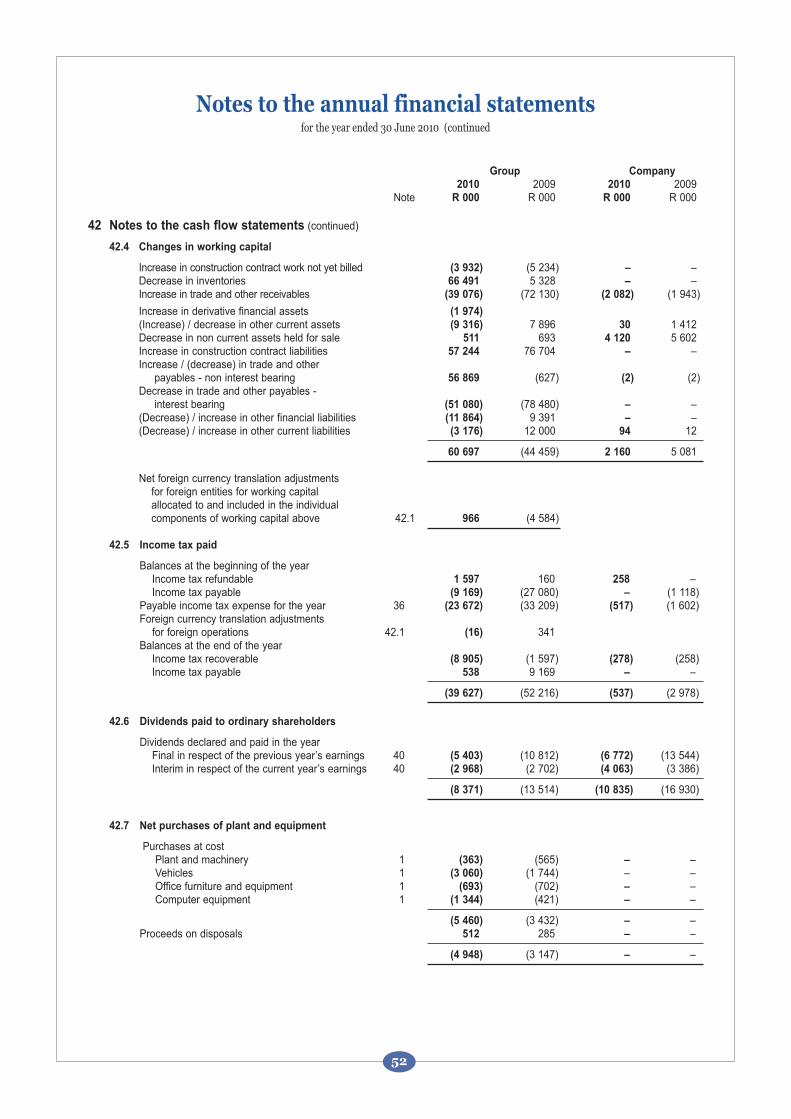
Group Company
2010 2009 2010 2009 Note R 000 R 000 R 000 R 000
42 Notes to the cash flow statements (continued)
42.4 Changes in working capital
Increase in construction contract work not yet billed (3 932) (5 234) – –Decrease in inventories 66 491 5 328 – –Increase in trade and other receivables (39 076) (72 130) (2 082) (1 943)
Increase in derivative financial assets (1 974)
(Increase) / decrease in other current assets (9 316) 7 896 30 1 412Decrease in non current assets held for sale 511 693 4 120 5 602Increase in construction contract liabilities 57 244 76 704 – –Increase / (decrease) in trade and other
payables - non interest bearing 56 869 (627) (2) (2) Decrease in trade and other payables -
interest bearing (51 080) (78 480) – –(Decrease) / increase in other financial liabilities (11 864) 9 391 – –(Decrease) / increase in other current liabilities (3 176) 12 000 94 12
60 697 (44 459) 2 160 5 081
Net foreign currency translation adjustmentsfor foreign entities for working capitalallocated to and included in the individualcomponents of working capital above 42.1 966 (4 584)
42.5 Income tax paid
Balances at the beginning of the yearIncome tax refundable 1 597 160 258 –Income tax payable (9 169) (27 080) – (1 118)
Payable income tax expense for the year 36 (23 672) (33 209) (517) (1 602)Foreign currency translation adjustments
for foreign operations 42.1 (16) 341Balances at the end of the year
Income tax recoverable (8 905) (1 597) (278) (258)Income tax payable 538 9 169 – –
(39 627) (52 216) (537) (2 978)
42.6 Dividends paid to ordinary shareholders
Dividends declared and paid in the yearFinal in respect of the previous year’s earnings 40 (5 403) (10 812) (6 772) (13 544)Interim in respect of the current year’s earnings 40 (2 968) (2 702) (4 063) (3 386)
(8 371) (13 514) (10 835) (16 930)
42.7 Net purchases of plant and equipment
Purchases at costPlant and machinery 1 (363) (565) – –Vehicles 1 (3 060) (1 744) – –Office furniture and equipment 1 (693) (702) – –Computer equipment 1 (1 344) (421) – –
(5 460) (3 432) – –Proceeds on disposals 512 285 – –
(4 948) (3 147) – –
Notes to the annual financial statementsfor the year ended 30 June 2010 (continued
52
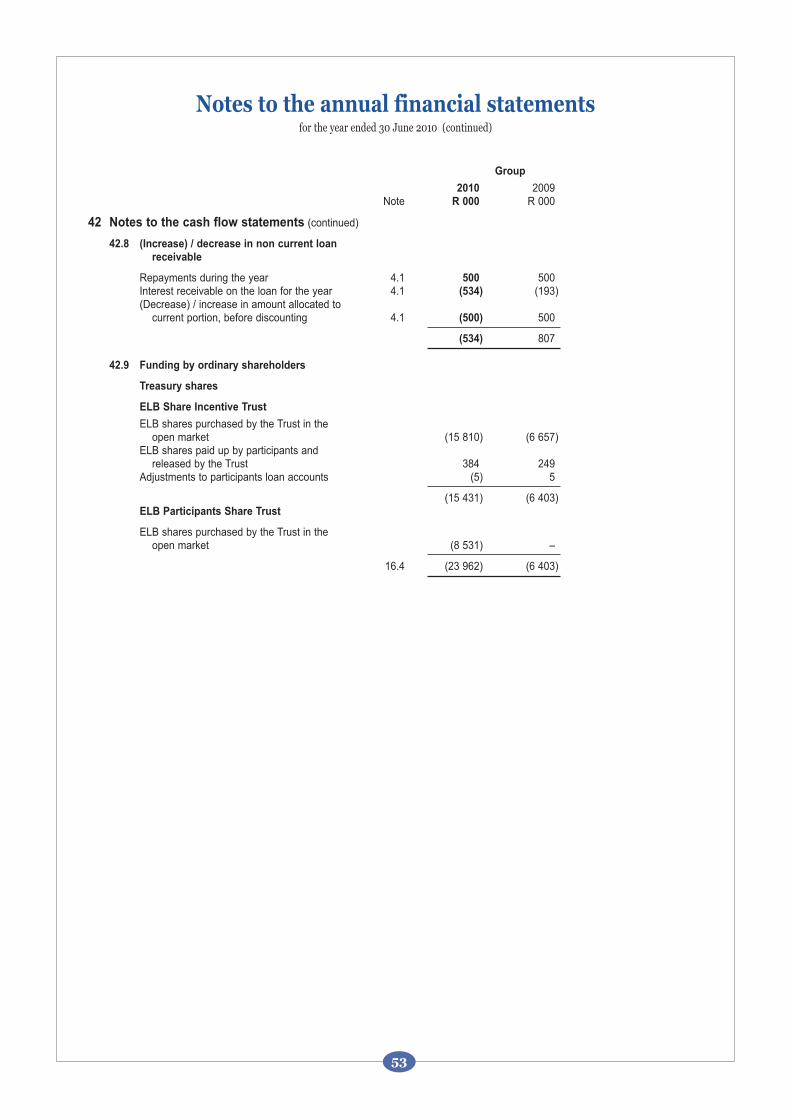
Group
2010 2009 Note R 000 R 000
42 Notes to the cash flow statements (continued)
42.8 (Increase) / decrease in non current loan
receivable
Repayments during the year 4.1 500 500 Interest receivable on the loan for the year 4.1 (534) (193)(Decrease) / increase in amount allocated to
current portion, before discounting 4.1 (500) 500
(534) 807
42.9 Funding by ordinary shareholders
Treasury shares
ELB Share Incentive Trust
ELB shares purchased by the Trust in theopen market (15 810) (6 657)
ELB shares paid up by participants andreleased by the Trust 384 249
Adjustments to participants loan accounts (5) 5
(15 431) (6 403)ELB Participants Share Trust
ELB shares purchased by the Trust in theopen market (8 531) –
16.4 (23 962) (6 403)
Notes to the annual financial statementsfor the year ended 30 June 2010 (continued)
53
43 Related party transactions
Related party relationships exist between group companies. All buying and selling transactions are concluded at arm's length and areeliminated upon consolidation.
Inter company current accounts do not bear interest. Short and long term inter company loans bear interest at market rates. The loanby the Company to its wholly owned subsidiary, ELB Timber Holdings (Pty) Limited (ETH), is interest free.
A former subsidiary of ETH, ELB Timber Products (Pty) Limited (ETP), was sold on credit to the chief executive officer of ETP witheffect from 31 May 2008.Details of the consequent loan are reported in note 4.1.
Directors remuneration is reported in note 33.
Material transactions of the Company with its subsidiaries are:Management and administration services rendered to indirect subsidiary, ELB Equipment Holdings Limited - reported in note 26.Loans to subsidiaries - reported in note 2 and on page 67.
The Group has entered into a joint venture partnership together with an executive director of the Company and another to acquire andoperate an aircraft. The Group’s interest in the joint venture is 34%. Group companies will from time to time charter the aircraft on anarm’s length basis.
Information on joint venture operations is contained in note 3, and the principal group entities are listed on page 67.
44 Financial risk management
Exposure to currency, interest rate, liquidity and credit risk arises in the normal course of the Group's business. Derivative instrumentsare used as a means of reducing exposure to fluctuations in foreign currency exchange rates. While these derivatives are subject tothe risk of market rates changing subsequent to acquisition, such changes should generally be offset by opposite effects on thehedged items.
Potential risks to which the Group might be exposed are identified, and existing risks to which the Group is exposed are monitored onan ongoing basis. Attention is given continuously to market and analysts’ forecasts for foreign currency exchange rates, interest ratesand commodity prices.
Notes to the annual financial statementsfor the year ended 30 June 2010 (continued)
54
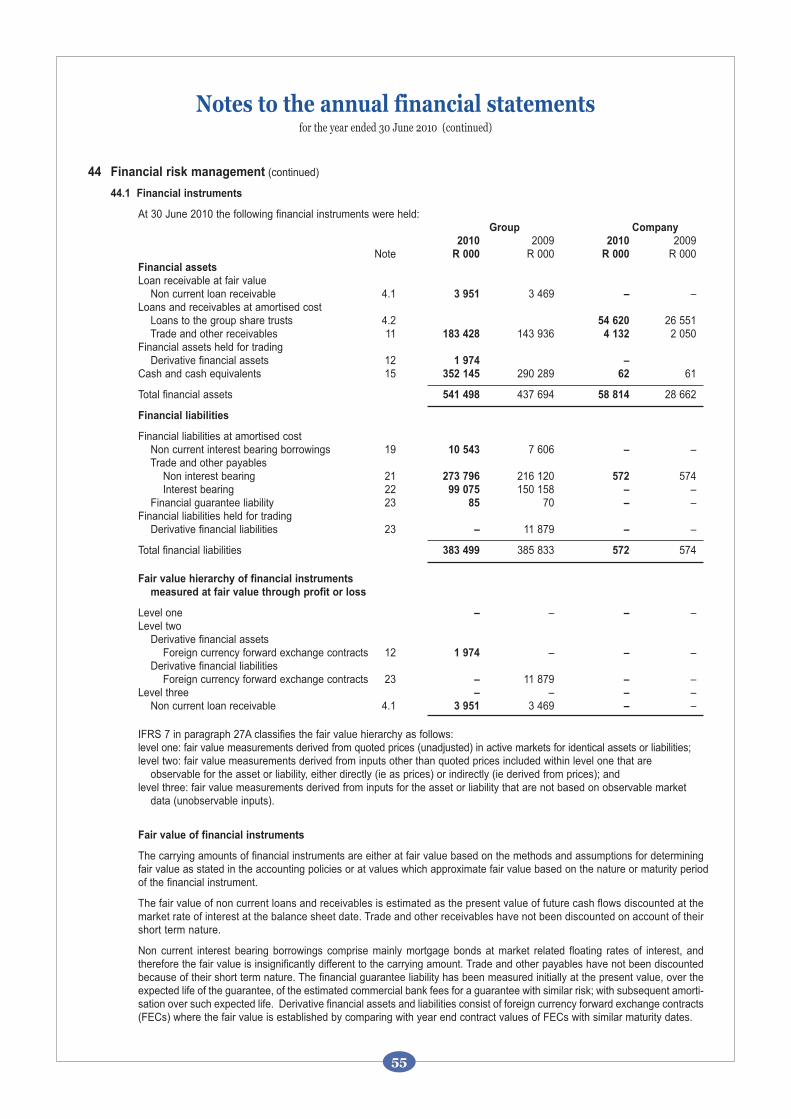
44 Financial risk management (continued)
44.1 Financial instruments
At 30 June 2010 the following financial instruments were held:Group Company
2010 2009 2010 2009 Note R 000 R 000 R 000 R 000
Financial assets
Loan receivable at fair valueNon current loan receivable 4.1 3 951 3 469 – –
Loans and receivables at amortised costLoans to the group share trusts 4.2 54 620 26 551Trade and other receivables 11 183 428 143 936 4 132 2 050
Financial assets held for tradingDerivative financial assets 12 1 974 –
Cash and cash equivalents 15 352 145 290 289 62 61
Total financial assets 541 498 437 694 58 814 28 662
Financial liabilities
Financial liabilities at amortised costNon current interest bearing borrowings 19 10 543 7 606 – –Trade and other payables
Non interest bearing 21 273 796 216 120 572 574 Interest bearing 22 99 075 150 158 – –
Financial guarantee liability 23 85 70 – –Financial liabilities held for trading
Derivative financial liabilities 23 – 11 879 – –
Total financial liabilities 383 499 385 833 572 574
Fair value hierarchy of financial instruments
measured at fair value through profit or loss
Level one – – – –Level two
Derivative financial assetsForeign currency forward exchange contracts 12 1 974 – – –
Derivative financial liabilitiesForeign currency forward exchange contracts 23 – 11 879 – –
Level three – – – –Non current loan receivable 4.1 3 951 3 469 – –
IFRS 7 in paragraph 27A classifies the fair value hierarchy as follows:level one: fair value measurements derived from quoted prices (unadjusted) in active markets for identical assets or liabilities;level two: fair value measurements derived from inputs other than quoted prices included within level one that are
observable for the asset or liability, either directly (ie as prices) or indirectly (ie derived from prices); andlevel three: fair value measurements derived from inputs for the asset or liability that are not based on observable market
data (unobservable inputs).
Fair value of financial instruments
The carrying amounts of financial instruments are either at fair value based on the methods and assumptions for determiningfair value as stated in the accounting policies or at values which approximate fair value based on the nature or maturity period of the financial instrument.
The fair value of non current loans and receivables is estimated as the present value of future cash flows discounted at themarket rate of interest at the balance sheet date. Trade and other receivables have not been discounted on account of theirshort term nature.
Non current interest bearing borrowings comprise mainly mortgage bonds at market related floating rates of interest, andtherefore the fair value is insignificantly different to the carrying amount. Trade and other payables have not been discountedbecause of their short term nature. The financial guarantee liability has been measured initially at the present value, over theexpected life of the guarantee, of the estimated commercial bank fees for a guarantee with similar risk; with subsequent amorti-sation over such expected life. Derivative financial assets and liabilities consist of foreign currency forward exchange contracts(FECs) where the fair value is established by comparing with year end contract values of FECs with similar maturity dates.
Notes to the annual financial statementsfor the year ended 30 June 2010 (continued)
55
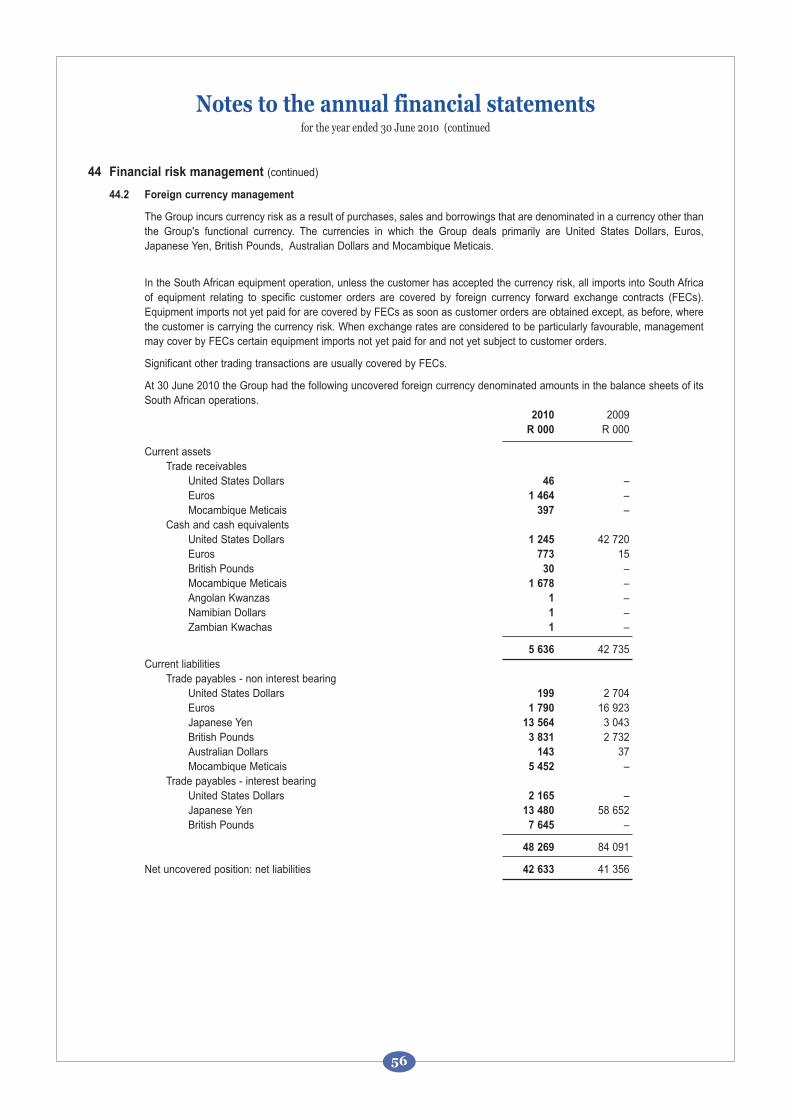
44 Financial risk management (continued)
44.2 Foreign currency management
The Group incurs currency risk as a result of purchases, sales and borrowings that are denominated in a currency other thanthe Group's functional currency. The currencies in which the Group deals primarily are United States Dollars, Euros,Japanese Yen, British Pounds, Australian Dollars and Mocambique Meticais.
In the South African equipment operation, unless the customer has accepted the currency risk, all imports into South Africaof equipment relating to specific customer orders are covered by foreign currency forward exchange contracts (FECs).Equipment imports not yet paid for are covered by FECs as soon as customer orders are obtained except, as before, wherethe customer is carrying the currency risk. When exchange rates are considered to be particularly favourable, managementmay cover by FECs certain equipment imports not yet paid for and not yet subject to customer orders.
Significant other trading transactions are usually covered by FECs.
At 30 June 2010 the Group had the following uncovered foreign currency denominated amounts in the balance sheets of itsSouth African operations.
2010 2009 R 000 R 000
Current assetsTrade receivables
United States Dollars 46 – Euros 1 464 –Mocambique Meticais 397 –
Cash and cash equivalentsUnited States Dollars 1 245 42 720Euros 773 15British Pounds 30 –Mocambique Meticais 1 678 –Angolan Kwanzas 1 –Namibian Dollars 1 –Zambian Kwachas 1 –
5 636 42 735Current liabilities
Trade payables - non interest bearingUnited States Dollars 199 2 704 Euros 1 790 16 923 Japanese Yen 13 564 3 043British Pounds 3 831 2 732 Australian Dollars 143 37 Mocambique Meticais 5 452 –
Trade payables - interest bearingUnited States Dollars 2 165 –Japanese Yen 13 480 58 652 British Pounds 7 645 –
48 269 84 091
Net uncovered position: net liabilities 42 633 41 356
Notes to the annual financial statementsfor the year ended 30 June 2010 (continued
56
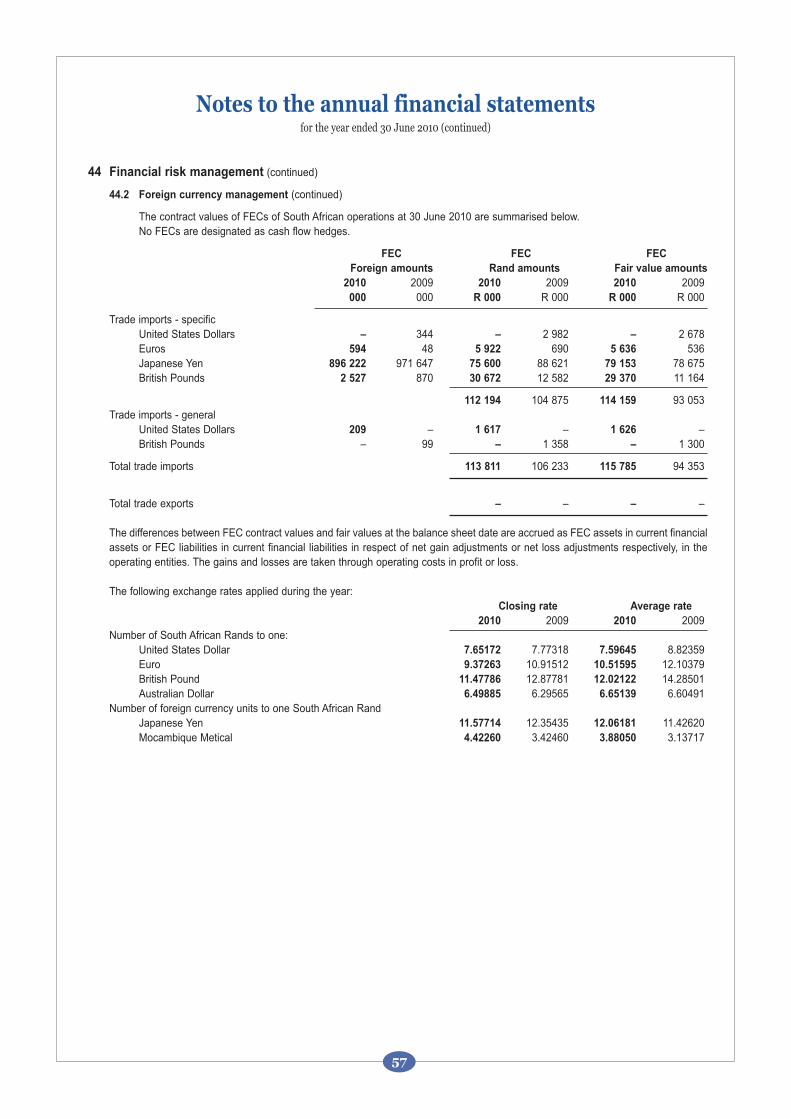
44 Financial risk management (continued)
44.2 Foreign currency management (continued)
The contract values of FECs of South African operations at 30 June 2010 are summarised below.No FECs are designated as cash flow hedges.
FEC FEC FEC
Foreign amounts Rand amounts Fair value amounts
2010 2009 2010 2009 2010 2009 000 000 R 000 R 000 R 000 R 000
Trade imports - specificUnited States Dollars – 344 – 2 982 – 2 678 Euros 594 48 5 922 690 5 636 536 Japanese Yen 896 222 971 647 75 600 88 621 79 153 78 675 British Pounds 2 527 870 30 672 12 582 29 370 11 164
112 194 104 875 114 159 93 053 Trade imports - general
United States Dollars 209 – 1 617 – 1 626 –British Pounds – 99 – 1 358 – 1 300
Total trade imports 113 811 106 233 115 785 94 353
Total trade exports – – – –
The differences between FEC contract values and fair values at the balance sheet date are accrued as FEC assets in current financialassets or FEC liabilities in current financial liabilities in respect of net gain adjustments or net loss adjustments respectively, in theoperating entities. The gains and losses are taken through operating costs in profit or loss.
The following exchange rates applied during the year:Closing rate Average rate
2010 2009 2010 2009 Number of South African Rands to one:
United States Dollar 7.65172 7.77318 7.59645 8.82359 Euro 9.37263 10.91512 10.51595 12.10379 British Pound 11.47786 12.87781 12.02122 14.28501 Australian Dollar 6.49885 6.29565 6.65139 6.60491
Number of foreign currency units to one South African Rand Japanese Yen 11.57714 12.35435 12.06181 11.42620 Mocambique Metical 4.42260 3.42460 3.88050 3.13717
Notes to the annual financial statementsfor the year ended 30 June 2010 (continued)
57
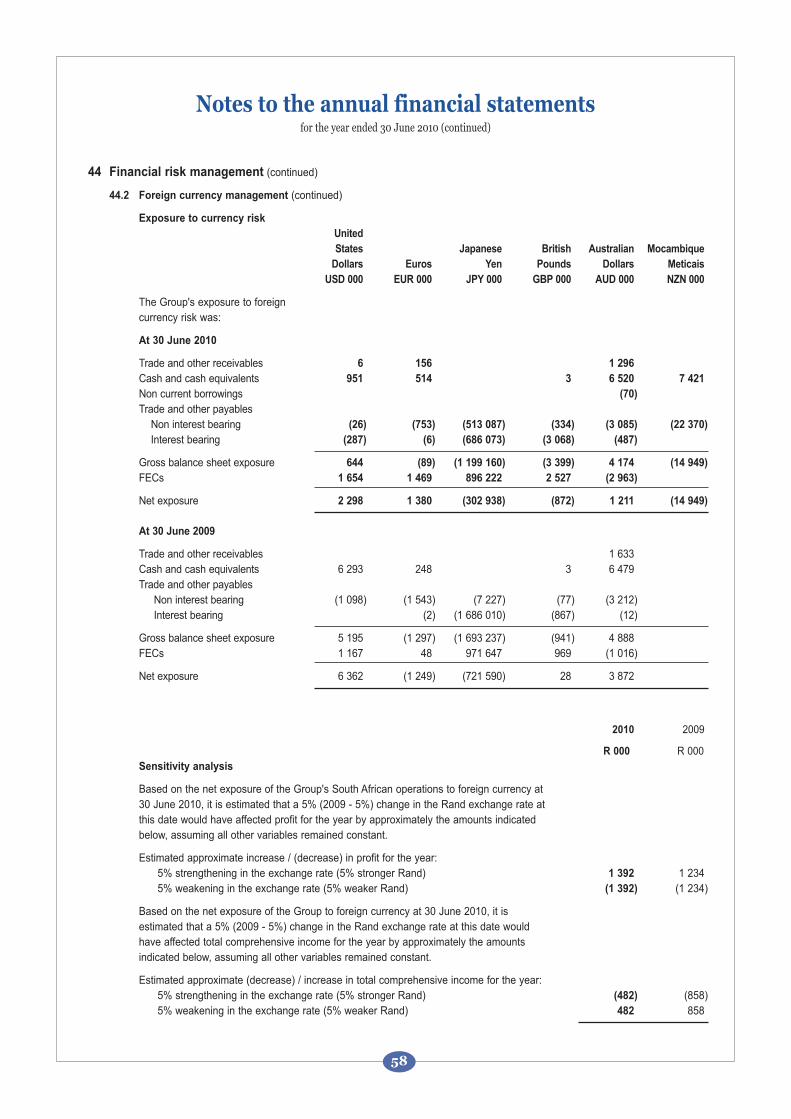
44 Financial risk management (continued)
44.2 Foreign currency management (continued)
Exposure to currency risk
United
States Japanese British Australian Mocambique
Dollars Euros Yen Pounds Dollars Meticais
USD 000 EUR 000 JPY 000 GBP 000 AUD 000 NZN 000
The Group's exposure to foreigncurrency risk was:
At 30 June 2010
Trade and other receivables 6 156 1 296
Cash and cash equivalents 951 514 3 6 520 7 421
Non current borrowings (70)
Trade and other payablesNon interest bearing (26) (753) (513 087) (334) (3 085) (22 370)
Interest bearing (287) (6) (686 073) (3 068) (487)
Gross balance sheet exposure 644 (89) (1 199 160) (3 399) 4 174 (14 949)
FECs 1 654 1 469 896 222 2 527 (2 963)
Net exposure 2 298 1 380 (302 938) (872) 1 211 (14 949)
At 30 June 2009
Trade and other receivables 1 633Cash and cash equivalents 6 293 248 3 6 479Trade and other payables
Non interest bearing (1 098) (1 543) (7 227) (77) (3 212)Interest bearing (2) (1 686 010) (867) (12)
Gross balance sheet exposure 5 195 (1 297) (1 693 237) (941) 4 888FECs 1 167 48 971 647 969 (1 016)
Net exposure 6 362 (1 249) (721 590) 28 3 872
2010 2009
R 000 R 000 Sensitivity analysis
Based on the net exposure of the Group's South African operations to foreign currency at30 June 2010, it is estimated that a 5% (2009 - 5%) change in the Rand exchange rate at this date would have affected profit for the year by approximately the amounts indicated below, assuming all other variables remained constant.
Estimated approximate increase / (decrease) in profit for the year:5% strengthening in the exchange rate (5% stronger Rand) 1 392 1 234 5% weakening in the exchange rate (5% weaker Rand) (1 392) (1 234)
Based on the net exposure of the Group to foreign currency at 30 June 2010, it isestimated that a 5% (2009 - 5%) change in the Rand exchange rate at this date would have affected total comprehensive income for the year by approximately the amounts indicated below, assuming all other variables remained constant.
Estimated approximate (decrease) / increase in total comprehensive income for the year:5% strengthening in the exchange rate (5% stronger Rand) (482) (858)5% weakening in the exchange rate (5% weaker Rand) 482 858
Notes to the annual financial statementsfor the year ended 30 June 2010 (continued)
58
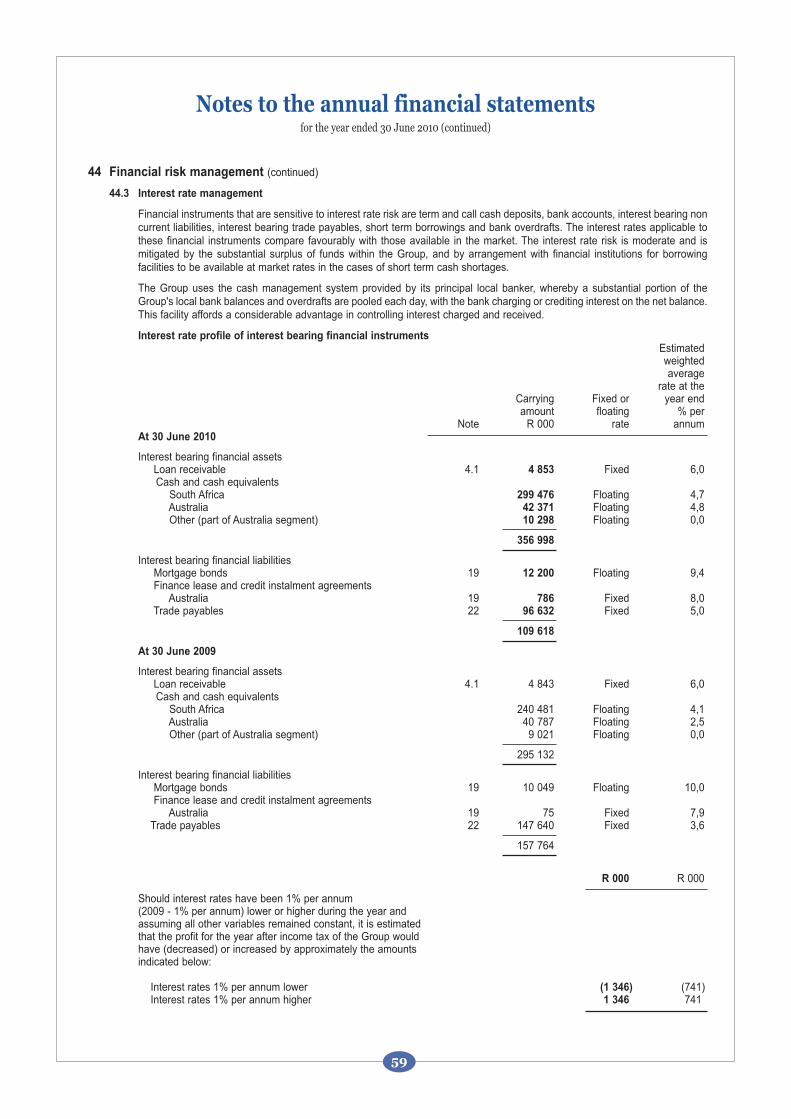
44 Financial risk management (continued)
44.3 Interest rate management
Financial instruments that are sensitive to interest rate risk are term and call cash deposits, bank accounts, interest bearing noncurrent liabilities, interest bearing trade payables, short term borrowings and bank overdrafts. The interest rates applicable tothese financial instruments compare favourably with those available in the market. The interest rate risk is moderate and ismitigated by the substantial surplus of funds within the Group, and by arrangement with financial institutions for borrowingfacilities to be available at market rates in the cases of short term cash shortages.
The Group uses the cash management system provided by its principal local banker, whereby a substantial portion of theGroup's local bank balances and overdrafts are pooled each day, with the bank charging or crediting interest on the net balance.This facility affords a considerable advantage in controlling interest charged and received.
Interest rate profile of interest bearing financial instrumentsEstimatedweightedaverage
rate at theCarrying Fixed or year endamount floating % per
Note R 000 rate annumAt 30 June 2010
Interest bearing financial assetsLoan receivable 4.1 4 853 Fixed 6,0Cash and cash equivalents
South Africa 299 476 Floating 4,7Australia 42 371 Floating 4,8Other (part of Australia segment) 10 298 Floating 0,0
356 998
Interest bearing financial liabilitiesMortgage bonds 19 12 200 Floating 9,4Finance lease and credit instalment agreements
Australia 19 786 Fixed 8,0Trade payables 22 96 632 Fixed 5,0
109 618
At 30 June 2009
Interest bearing financial assetsLoan receivable 4.1 4 843 Fixed 6,0Cash and cash equivalents
South Africa 240 481 Floating 4,1Australia 40 787 Floating 2,5Other (part of Australia segment) 9 021 Floating 0,0
295 132
Interest bearing financial liabilitiesMortgage bonds 19 10 049 Floating 10,0Finance lease and credit instalment agreements
Australia 19 75 Fixed 7,9Trade payables 22 147 640 Fixed 3,6
157 764
R 000 R 000
Should interest rates have been 1% per annum (2009 - 1% per annum) lower or higher during the year and assuming all other variables remained constant, it is estimated that the profit for the year after income tax of the Group would have (decreased) or increased by approximately the amounts indicated below:
Interest rates 1% per annum lower (1 346) (741)Interest rates 1% per annum higher 1 346 741
Notes to the annual financial statementsfor the year ended 30 June 2010 (continued)
59
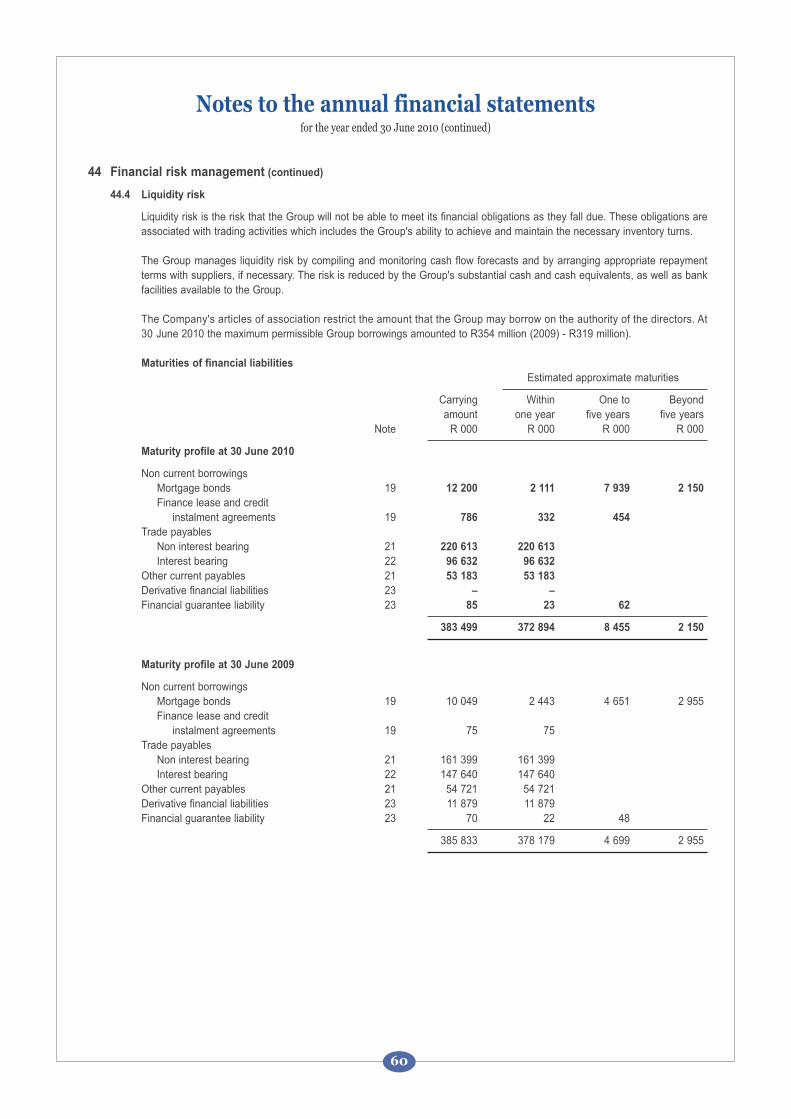
44 Financial risk management (continued)
44.4 Liquidity risk
Liquidity risk is the risk that the Group will not be able to meet its financial obligations as they fall due. These obligations areassociated with trading activities which includes the Group's ability to achieve and maintain the necessary inventory turns.
The Group manages liquidity risk by compiling and monitoring cash flow forecasts and by arranging appropriate repaymentterms with suppliers, if necessary. The risk is reduced by the Group's substantial cash and cash equivalents, as well as bankfacilities available to the Group.
The Company's articles of association restrict the amount that the Group may borrow on the authority of the directors. At30 June 2010 the maximum permissible Group borrowings amounted to R354 million (2009) - R319 million).
Maturities of financial liabilities
Estimated approximate maturities
Carrying Within One to Beyond amount one year five years five years
Note R 000 R 000 R 000 R 000
Maturity profile at 30 June 2010
Non current borrowingsMortgage bonds 19 12 200 2 111 7 939 2 150
Finance lease and credit instalment agreements 19 786 332 454
Trade payablesNon interest bearing 21 220 613 220 613
Interest bearing 22 96 632 96 632
Other current payables 21 53 183 53 183
Derivative financial liabilities 23 – –
Financial guarantee liability 23 85 23 62
383 499 372 894 8 455 2 150
Maturity profile at 30 June 2009
Non current borrowingsMortgage bonds 19 10 049 2 443 4 651 2 955 Finance lease and credit
instalment agreements 19 75 75Trade payables
Non interest bearing 21 161 399 161 399Interest bearing 22 147 640 147 640
Other current payables 21 54 721 54 721Derivative financial liabilities 23 11 879 11 879Financial guarantee liability 23 70 22 48
385 833 378 179 4 699 2 955
Notes to the annual financial statementsfor the year ended 30 June 2010 (continued)
60
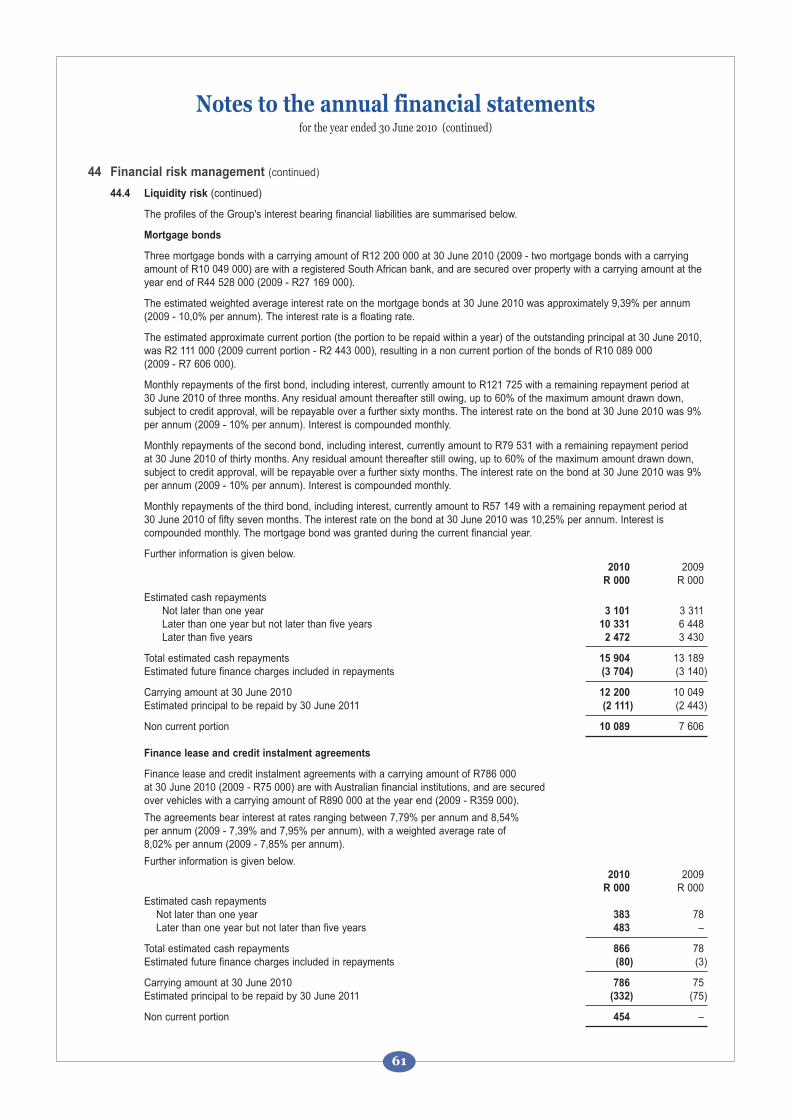
44 Financial risk management (continued)
44.4 Liquidity risk (continued)
The profiles of the Group's interest bearing financial liabilities are summarised below.
Mortgage bonds
Three mortgage bonds with a carrying amount of R12 200 000 at 30 June 2010 (2009 - two mortgage bonds with a carrying amount of R10 049 000) are with a registered South African bank, and are secured over property with a carrying amount at the year end of R44 528 000 (2009 - R27 169 000).
The estimated weighted average interest rate on the mortgage bonds at 30 June 2010 was approximately 9,39% per annum (2009 - 10,0% per annum). The interest rate is a floating rate.
The estimated approximate current portion (the portion to be repaid within a year) of the outstanding principal at 30 June 2010, was R2 111 000 (2009 current portion - R2 443 000), resulting in a non current portion of the bonds of R10 089 000 (2009 - R7 606 000).
Monthly repayments of the first bond, including interest, currently amount to R121 725 with a remaining repayment period at 30 June 2010 of three months. Any residual amount thereafter still owing, up to 60% of the maximum amount drawn down, subject to credit approval, will be repayable over a further sixty months. The interest rate on the bond at 30 June 2010 was 9% per annum (2009 - 10% per annum). Interest is compounded monthly.
Monthly repayments of the second bond, including interest, currently amount to R79 531 with a remaining repayment period at 30 June 2010 of thirty months. Any residual amount thereafter still owing, up to 60% of the maximum amount drawn down, subject to credit approval, will be repayable over a further sixty months. The interest rate on the bond at 30 June 2010 was 9% per annum (2009 - 10% per annum). Interest is compounded monthly.
Monthly repayments of the third bond, including interest, currently amount to R57 149 with a remaining repayment period at 30 June 2010 of fifty seven months. The interest rate on the bond at 30 June 2010 was 10,25% per annum. Interest is compounded monthly. The mortgage bond was granted during the current financial year.
Further information is given below.2010 2009
R 000 R 000
Estimated cash repaymentsNot later than one year 3 101 3 311 Later than one year but not later than five years 10 331 6 448 Later than five years 2 472 3 430
Total estimated cash repayments 15 904 13 189 Estimated future finance charges included in repayments (3 704) (3 140)
Carrying amount at 30 June 2010 12 200 10 049 Estimated principal to be repaid by 30 June 2011 (2 111) (2 443)
Non current portion 10 089 7 606
Finance lease and credit instalment agreements
Finance lease and credit instalment agreements with a carrying amount of R786 000 at 30 June 2010 (2009 - R75 000) are with Australian financial institutions, and are secured over vehicles with a carrying amount of R890 000 at the year end (2009 - R359 000).
The agreements bear interest at rates ranging between 7,79% per annum and 8,54%per annum (2009 - 7,39% and 7,95% per annum), with a weighted average rate of8,02% per annum (2009 - 7,85% per annum).
Further information is given below.2010 2009
R 000 R 000 Estimated cash repayments
Not later than one year 383 78 Later than one year but not later than five years 483 –
Total estimated cash repayments 866 78 Estimated future finance charges included in repayments (80) (3)
Carrying amount at 30 June 2010 786 75 Estimated principal to be repaid by 30 June 2011 (332) (75)
Non current portion 454 –
Notes to the annual financial statementsfor the year ended 30 June 2010 (continued)
61
44 Financial risk management (continued)
44.4 Liquidity risk (continued)
Trade payables - interest bearing
Use is made of the extended credit facilities offered by foreign suppliers. The carrying amount of interest bearing trade creditors of R96 632 000 at 30 June 2010 (2009 - R147 640 000) is repayable with due dates between July 2010 and March 2011. The interest rates range between 4,0% per annum and 6,8% per annum (2009 - 2,0325% per annum and 8,12% per annum), with a weighted average rate of 5,02% per annum (2009 - 3,55% per annum). The interest rates compare favourably with those for borrowings in South Africa.
44.5 Credit risk
Financial assets are tabled in note 44.1 .
Credit policies are in operation and exposure to credit risk is monitored on an ongoing basis. Credit evaluations are performedon all customers requiring credit above certain amounts. Ageing analyses are used and special credit allowances are monitored on a regular basis. Reputable financial institutions are used where necessary for effecting cash transfers. At the balance sheet date there were no significant concentrations of credit risk. The maximum exposure to credit risk is representedby the carrying amount of each financial asset in the balance sheet.
The Group has a diverse number of clients and customers. The Group also has customers in Africa and Australia. There is nosignificant exposure to any individual client or customer on a consistent basis over time. Accordingly the Group has nosignificant concentration of credit risk.
44.6 Price risk
The Group's exposure to commodity prices is minimal. Where any commodity is a significant cost in a fixed price constructioncontract undertaken by the Group, the possibility of inserting a cost escalation clause relating to such commodity, in suchcontract, would be carefully researched and assessed.
Notes to the annual financial statementsfor the year ended 30 June 2009 (continued)
62
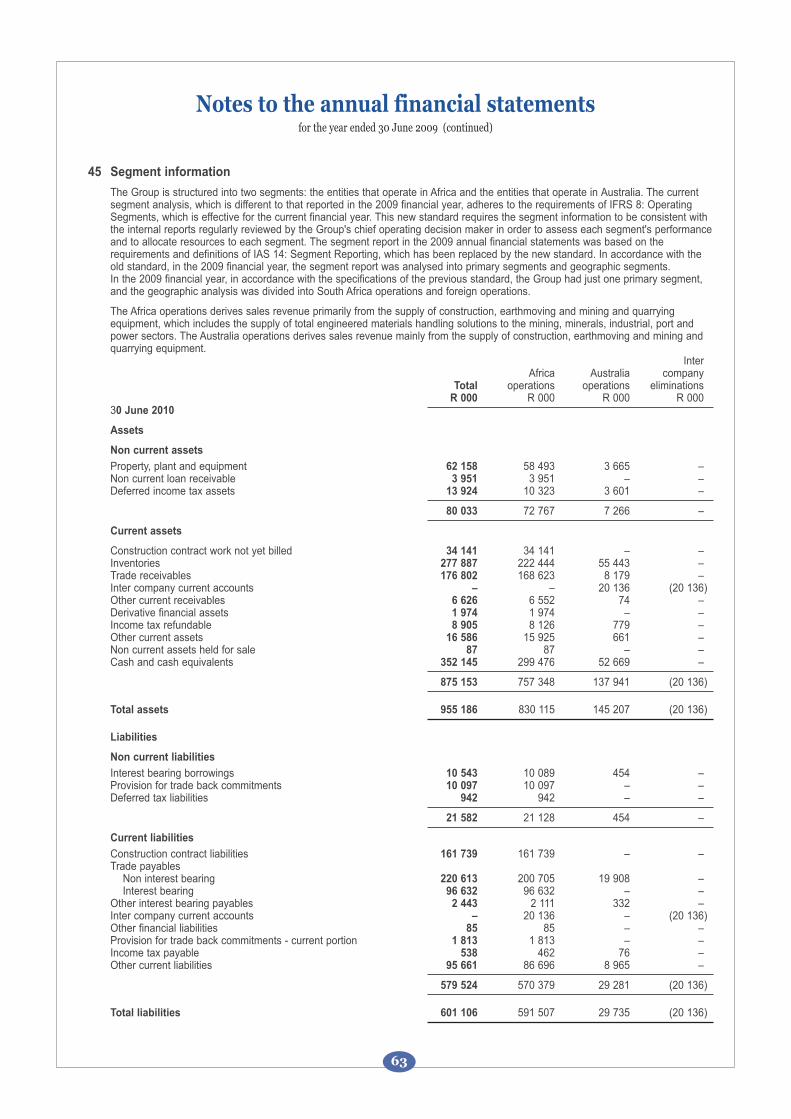
45 Segment information
The Group is structured into two segments: the entities that operate in Africa and the entities that operate in Australia. The current segment analysis, which is different to that reported in the 2009 financial year, adheres to the requirements of IFRS 8: Operating Segments, which is effective for the current financial year. This new standard requires the segment information to be consistent with the internal reports regularly reviewed by the Group's chief operating decision maker in order to assess each segment's performanceand to allocate resources to each segment. The segment report in the 2009 annual financial statements was based on the requirements and definitions of IAS 14: Segment Reporting, which has been replaced by the new standard. In accordance with the old standard, in the 2009 financial year, the segment report was analysed into primary segments and geographic segments.In the 2009 financial year, in accordance with the specifications of the previous standard, the Group had just one primary segment, and the geographic analysis was divided into South Africa operations and foreign operations.
The Africa operations derives sales revenue primarily from the supply of construction, earthmoving and mining and quarryingequipment, which includes the supply of total engineered materials handling solutions to the mining, minerals, industrial, port andpower sectors. The Australia operations derives sales revenue mainly from the supply of construction, earthmoving and mining andquarrying equipment.
Inter Africa Australia company
Total operations operations eliminations R 000 R 000 R 000 R 000
30 June 2010
Assets
Non current assets
Property, plant and equipment 62 158 58 493 3 665 –Non current loan receivable 3 951 3 951 – – Deferred income tax assets 13 924 10 323 3 601 –
80 033 72 767 7 266 –
Current assets
Construction contract work not yet billed 34 141 34 141 – –Inventories 277 887 222 444 55 443 –Trade receivables 176 802 168 623 8 179 –Inter company current accounts – – 20 136 (20 136)Other current receivables 6 626 6 552 74 –Derivative financial assets 1 974 1 974 – –Income tax refundable 8 905 8 126 779 – Other current assets 16 586 15 925 661 –Non current assets held for sale 87 87 – –Cash and cash equivalents 352 145 299 476 52 669 –
875 153 757 348 137 941 (20 136)
Total assets 955 186 830 115 145 207 (20 136)
Liabilities
Non current liabilities
Interest bearing borrowings 10 543 10 089 454 –Provision for trade back commitments 10 097 10 097 – –Deferred tax liabilities 942 942 – –
21 582 21 128 454 –
Current liabilities
Construction contract liabilities 161 739 161 739 – –Trade payables
Non interest bearing 220 613 200 705 19 908 –Interest bearing 96 632 96 632 – –
Other interest bearing payables 2 443 2 111 332 –Inter company current accounts – 20 136 – (20 136)Other financial liabilities 85 85 – –Provision for trade back commitments - current portion 1 813 1 813 – –Income tax payable 538 462 76 –Other current liabilities 95 661 86 696 8 965 –
579 524 570 379 29 281 (20 136)
Total liabilities 601 106 591 507 29 735 (20 136)
Notes to the annual financial statementsfor the year ended 30 June 2009 (continued)
63
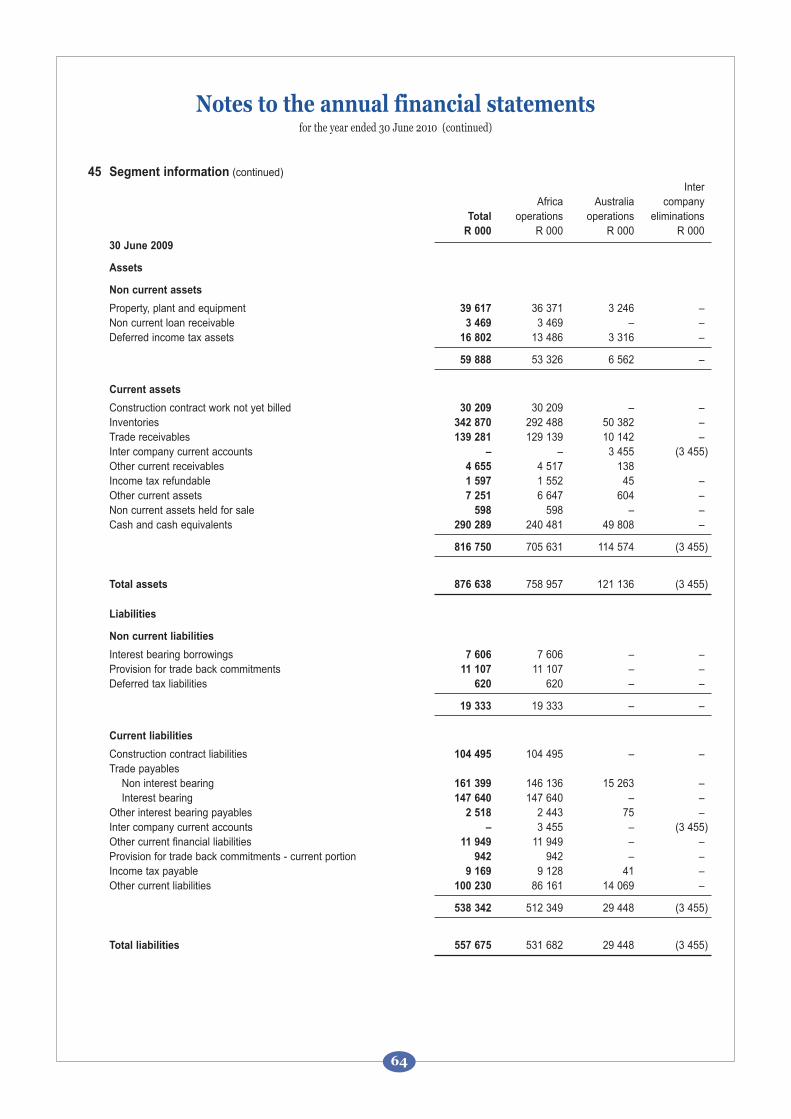
45 Segment information (continued)Inter
Africa Australia company Total operations operations eliminations
R 000 R 000 R 000 R 000 30 June 2009
Assets
Non current assets
Property, plant and equipment 39 617 36 371 3 246 –Non current loan receivable 3 469 3 469 – –Deferred income tax assets 16 802 13 486 3 316 –
59 888 53 326 6 562 –
Current assets
Construction contract work not yet billed 30 209 30 209 – –Inventories 342 870 292 488 50 382 –Trade receivables 139 281 129 139 10 142 –Inter company current accounts – – 3 455 (3 455)Other current receivables 4 655 4 517 138 Income tax refundable 1 597 1 552 45 –Other current assets 7 251 6 647 604 –Non current assets held for sale 598 598 – –Cash and cash equivalents 290 289 240 481 49 808 –
816 750 705 631 114 574 (3 455)
Total assets 876 638 758 957 121 136 (3 455)
Liabilities
Non current liabilities
Interest bearing borrowings 7 606 7 606 – –Provision for trade back commitments 11 107 11 107 – –Deferred tax liabilities 620 620 – –
19 333 19 333 – –
Current liabilities
Construction contract liabilities 104 495 104 495 – –Trade payables
Non interest bearing 161 399 146 136 15 263 –Interest bearing 147 640 147 640 – –
Other interest bearing payables 2 518 2 443 75 –Inter company current accounts – 3 455 – (3 455)Other current financial liabilities 11 949 11 949 – –Provision for trade back commitments - current portion 942 942 – –Income tax payable 9 169 9 128 41 –Other current liabilities 100 230 86 161 14 069 –
538 342 512 349 29 448 (3 455)
Total liabilities 557 675 531 682 29 448 (3 455)
Notes to the annual financial statementsfor the year ended 30 June 2010 (continued)
64
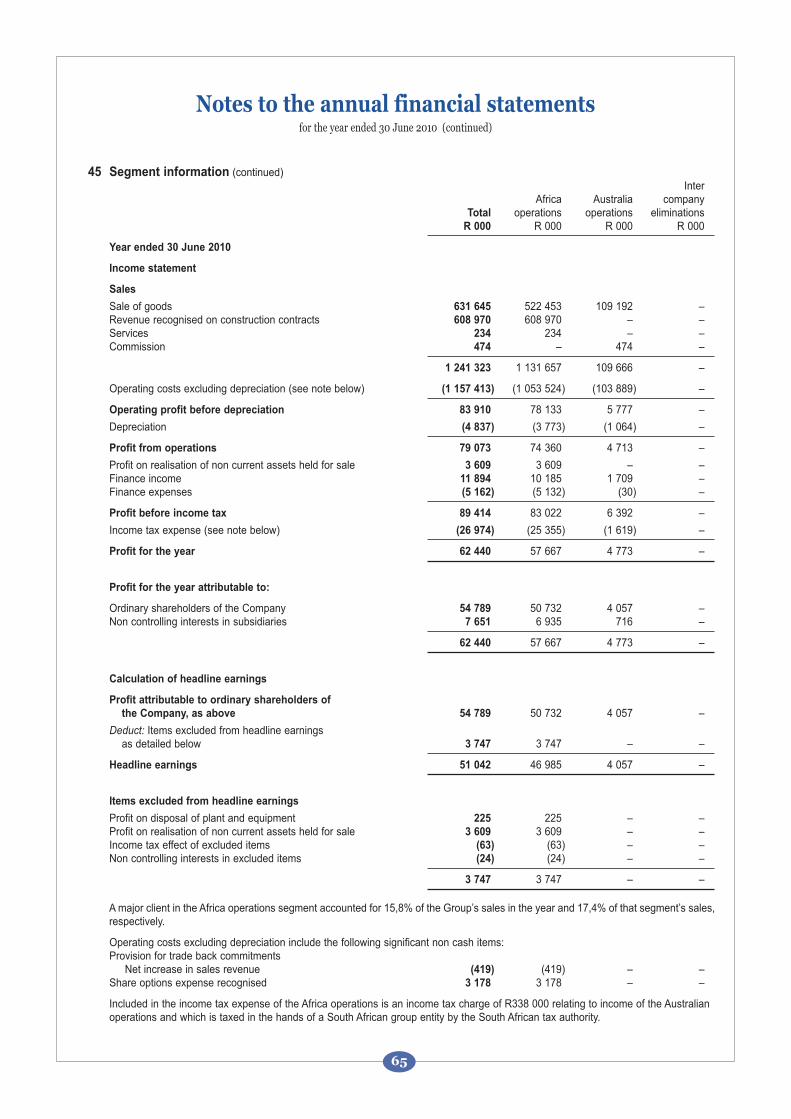
45 Segment information (continued)Inter
Africa Australia company Total operations operations eliminations
R 000 R 000 R 000 R 000
Year ended 30 June 2010
Income statement
Sales
Sale of goods 631 645 522 453 109 192 –Revenue recognised on construction contracts 608 970 608 970 – –Services 234 234 – –Commission 474 – 474 –
1 241 323 1 131 657 109 666 –
Operating costs excluding depreciation (see note below) (1 157 413) (1 053 524) (103 889) –
Operating profit before depreciation 83 910 78 133 5 777 –
Depreciation (4 837) (3 773) (1 064) –
Profit from operations 79 073 74 360 4 713 –
Profit on realisation of non current assets held for sale 3 609 3 609 – – Finance income 11 894 10 185 1 709 – Finance expenses (5 162) (5 132) (30) –
Profit before income tax 89 414 83 022 6 392 –
Income tax expense (see note below) (26 974) (25 355) (1 619) –
Profit for the year 62 440 57 667 4 773 –
Profit for the year attributable to:
Ordinary shareholders of the Company 54 789 50 732 4 057 – Non controlling interests in subsidiaries 7 651 6 935 716 –
62 440 57 667 4 773 –
Calculation of headline earnings
Profit attributable to ordinary shareholders of
the Company, as above 54 789 50 732 4 057 –
Deduct: Items excluded from headline earningsas detailed below 3 747 3 747 – –
Headline earnings 51 042 46 985 4 057 –
Items excluded from headline earnings
Profit on disposal of plant and equipment 225 225 – – Profit on realisation of non current assets held for sale 3 609 3 609 – – Income tax effect of excluded items (63) (63) – – Non controlling interests in excluded items (24) (24) – –
3 747 3 747 – –
A major client in the Africa operations segment accounted for 15,8% of the Group’s sales in the year and 17,4% of that segment’s sales,respectively.
Operating costs excluding depreciation include the following significant non cash items:Provision for trade back commitments
Net increase in sales revenue (419) (419) – –Share options expense recognised 3 178 3 178 – –
Included in the income tax expense of the Africa operations is an income tax charge of R338 000 relating to income of the Australian operations and which is taxed in the hands of a South African group entity by the South African tax authority.
Notes to the annual financial statementsfor the year ended 30 June 2010 (continued)
65
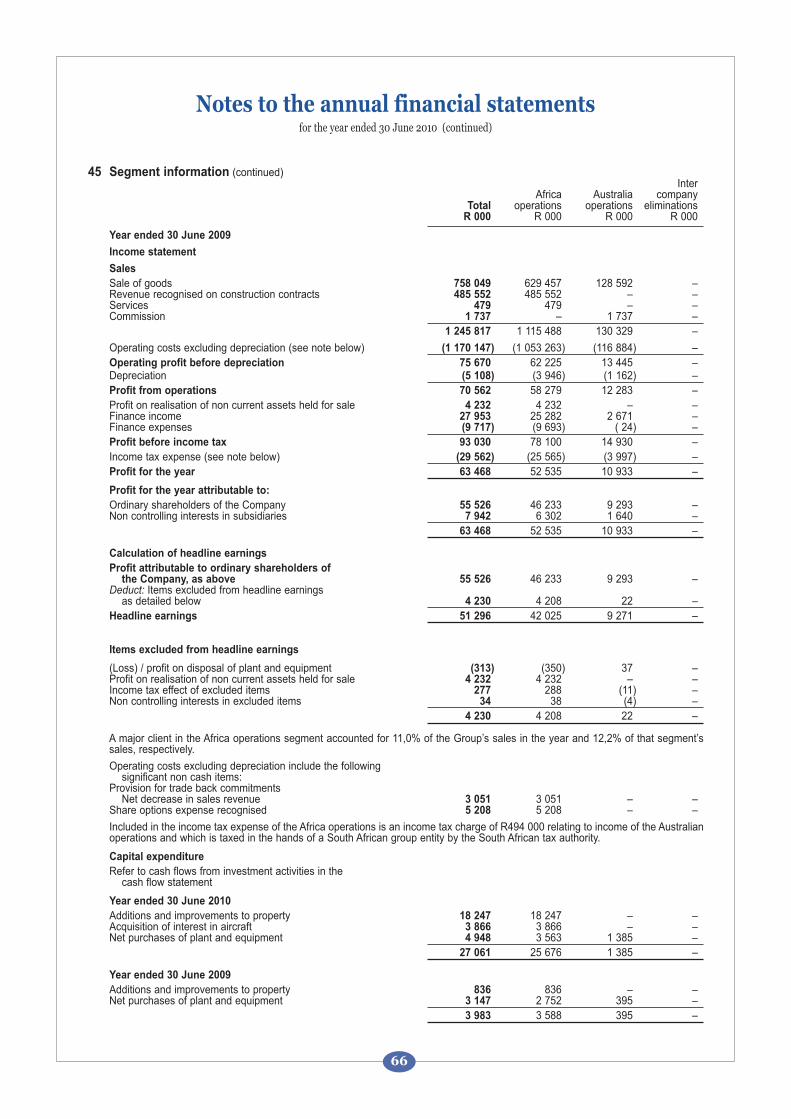
45 Segment information (continued)Inter
Africa Australia company Total operations operations eliminations
R 000 R 000 R 000 R 000
Year ended 30 June 2009
Income statement
Sales
Sale of goods 758 049 629 457 128 592 –Revenue recognised on construction contracts 485 552 485 552 – –Services 479 479 – –Commission 1 737 – 1 737 –
1 245 817 1 115 488 130 329 –
Operating costs excluding depreciation (see note below) (1 170 147) (1 053 263) (116 884) – Operating profit before depreciation 75 670 62 225 13 445 –Depreciation (5 108) (3 946) (1 162) – Profit from operations 70 562 58 279 12 283 – Profit on realisation of non current assets held for sale 4 232 4 232 – –Finance income 27 953 25 282 2 671 –Finance expenses (9 717) (9 693) ( 24) – Profit before income tax 93 030 78 100 14 930 –Income tax expense (see note below) (29 562) (25 565) (3 997) – Profit for the year 63 468 52 535 10 933 –
Profit for the year attributable to:
Ordinary shareholders of the Company 55 526 46 233 9 293 –Non controlling interests in subsidiaries 7 942 6 302 1 640 –
63 468 52 535 10 933 –
Calculation of headline earnings
Profit attributable to ordinary shareholders ofthe Company, as above 55 526 46 233 9 293 –
Deduct: Items excluded from headline earningsas detailed below 4 230 4 208 22 –
Headline earnings 51 296 42 025 9 271 –
Items excluded from headline earnings
(Loss) / profit on disposal of plant and equipment (313) (350) 37 –Profit on realisation of non current assets held for sale 4 232 4 232 – –Income tax effect of excluded items 277 288 (11) –Non controlling interests in excluded items 34 38 (4) –
4 230 4 208 22 –
A major client in the Africa operations segment accounted for 11,0% of the Group’s sales in the year and 12,2% of that segment’ssales, respectively.
Operating costs excluding depreciation include the followingsignificant non cash items:
Provision for trade back commitmentsNet decrease in sales revenue 3 051 3 051 – –
Share options expense recognised 5 208 5 208 – –
Included in the income tax expense of the Africa operations is an income tax charge of R494 000 relating to income of the Australianoperations and which is taxed in the hands of a South African group entity by the South African tax authority.
Capital expenditure
Refer to cash flows from investment activities in thecash flow statement
Year ended 30 June 2010
Additions and improvements to property 18 247 18 247 – – Acquisition of interest in aircraft 3 866 3 866 – – Net purchases of plant and equipment 4 948 3 563 1 385 –
27 061 25 676 1 385 –
Year ended 30 June 2009
Additions and improvements to property 836 836 – – Net purchases of plant and equipment 3 147 2 752 395 –
3 983 3 588 395 –
Notes to the annual financial statementsfor the year ended 30 June 2010 (continued)
66
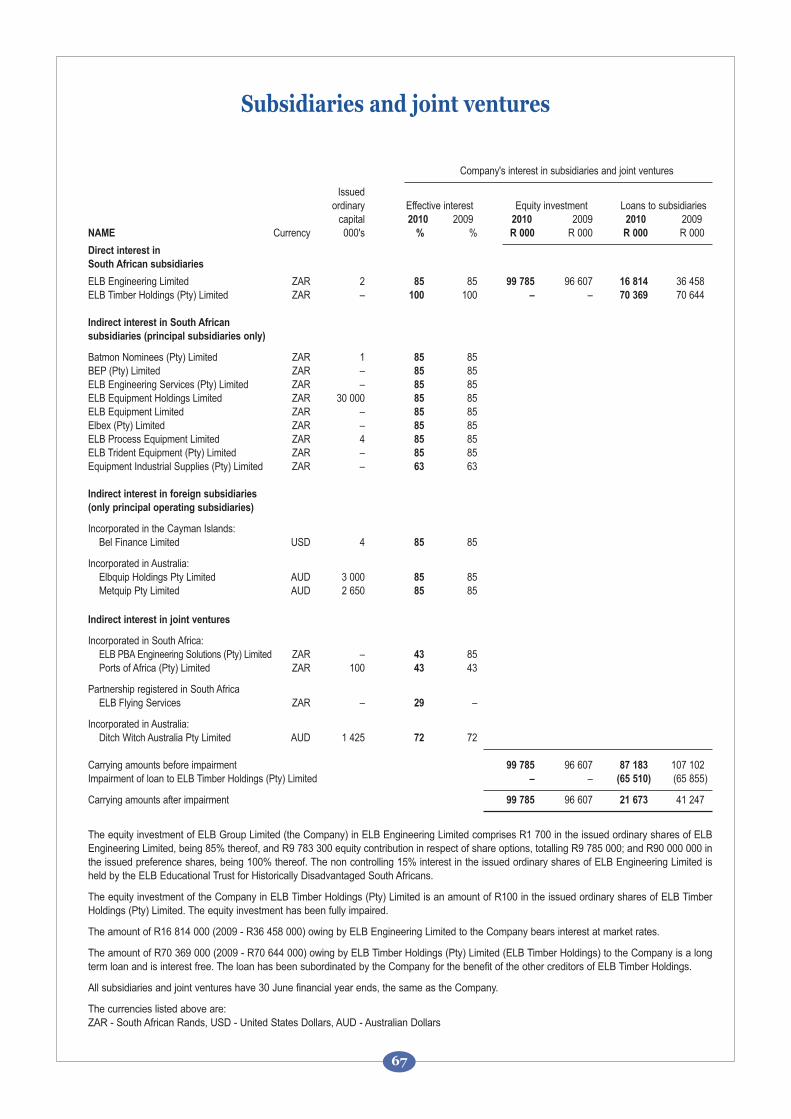
Company's interest in subsidiaries and joint ventures
Issued ordinary Effective interest Equity investment Loans to subsidiaries
capital 2010 2009 2010 2009 2010 2009 NAME Currency 000's % % R 000 R 000 R 000 R 000
Direct interest in
South African subsidiaries
ELB Engineering Limited ZAR 2 85 85 99 785 96 607 16 814 36 458ELB Timber Holdings (Pty) Limited ZAR – 100 100 – – 70 369 70 644
Indirect interest in South African
subsidiaries (principal subsidiaries only)
Batmon Nominees (Pty) Limited ZAR 1 85 85 BEP (Pty) Limited ZAR – 85 85 ELB Engineering Services (Pty) Limited ZAR – 85 85ELB Equipment Holdings Limited ZAR 30 000 85 85 ELB Equipment Limited ZAR – 85 85 Elbex (Pty) Limited ZAR – 85 85 ELB Process Equipment Limited ZAR 4 85 85ELB Trident Equipment (Pty) Limited ZAR – 85 85Equipment Industrial Supplies (Pty) Limited ZAR – 63 63
Indirect interest in foreign subsidiaries
(only principal operating subsidiaries)
Incorporated in the Cayman Islands:Bel Finance Limited USD 4 85 85
Incorporated in Australia:Elbquip Holdings Pty Limited AUD 3 000 85 85 Metquip Pty Limited AUD 2 650 85 85
Indirect interest in joint ventures
Incorporated in South Africa:ELB PBA Engineering Solutions (Pty) Limited ZAR – 43 85Ports of Africa (Pty) Limited ZAR 100 43 43
Partnership registered in South AfricaELB Flying Services ZAR – 29 –
Incorporated in Australia:Ditch Witch Australia Pty Limited AUD 1 425 72 72
Carrying amounts before impairment 99 785 96 607 87 183 107 102 Impairment of loan to ELB Timber Holdings (Pty) Limited – – (65 510) (65 855)
Carrying amounts after impairment 99 785 96 607 21 673 41 247
The equity investment of ELB Group Limited (the Company) in ELB Engineering Limited comprises R1 700 in the issued ordinary shares of ELBEngineering Limited, being 85% thereof, and R9 783 300 equity contribution in respect of share options, totalling R9 785 000; and R90 000 000 inthe issued preference shares, being 100% thereof. The non controlling 15% interest in the issued ordinary shares of ELB Engineering Limited isheld by the ELB Educational Trust for Historically Disadvantaged South Africans.
The equity investment of the Company in ELB Timber Holdings (Pty) Limited is an amount of R100 in the issued ordinary shares of ELB TimberHoldings (Pty) Limited. The equity investment has been fully impaired.
The amount of R16 814 000 (2009 - R36 458 000) owing by ELB Engineering Limited to the Company bears interest at market rates.
The amount of R70 369 000 (2009 - R70 644 000) owing by ELB Timber Holdings (Pty) Limited (ELB Timber Holdings) to the Company is a longterm loan and is interest free. The loan has been subordinated by the Company for the benefit of the other creditors of ELB Timber Holdings.
All subsidiaries and joint ventures have 30 June financial year ends, the same as the Company.
The currencies listed above are:ZAR - South African Rands, USD - United States Dollars, AUD - Australian Dollars
Subsidiaries and joint ventures
67
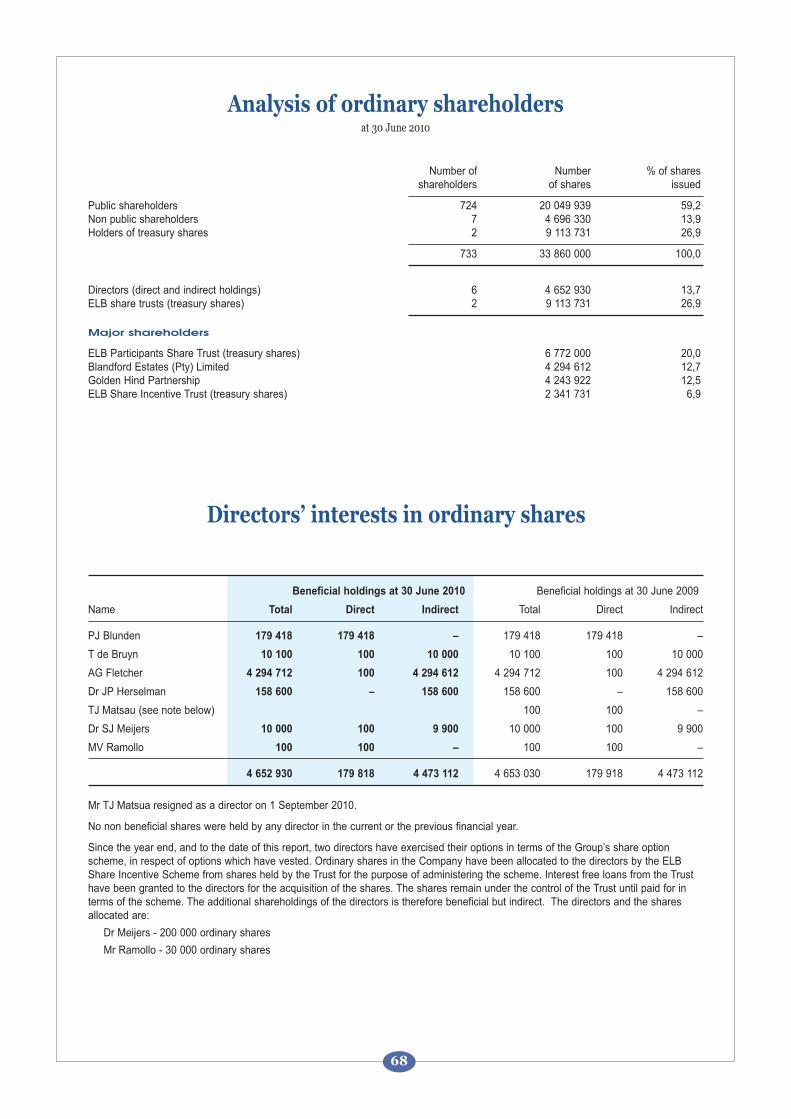
Number of Number % of sharesshareholders of shares issued
Public shareholders 724 20 049 939 59,2 Non public shareholders 7 4 696 330 13,9 Holders of treasury shares 2 9 113 731 26,9
733 33 860 000 100,0
Directors (direct and indirect holdings) 6 4 652 930 13,7 ELB share trusts (treasury shares) 2 9 113 731 26,9
Major shareholders
ELB Participants Share Trust (treasury shares) 6 772 000 20,0 Blandford Estates (Pty) Limited 4 294 612 12,7 Golden Hind Partnership 4 243 922 12,5 ELB Share Incentive Trust (treasury shares) 2 341 731 6,9
Analysis of ordinary shareholdersat 30 June 2010
Directors’ interests in ordinary shares
68
Beneficial holdings at 30 June 2010 Beneficial holdings at 30 June 2009
Name Total Direct Indirect Total Direct Indirect
PJ Blunden 179 418 179 418 – 179 418 179 418 –
T de Bruyn 10 100 100 10 000 10 100 100 10 000
AG Fletcher 4 294 712 100 4 294 612 4 294 712 100 4 294 612
Dr JP Herselman 158 600 – 158 600 158 600 – 158 600
TJ Matsau (see note below) 100 100 –
Dr SJ Meijers 10 000 100 9 900 10 000 100 9 900
MV Ramollo 100 100 – 100 100 –
4 652 930 179 818 4 473 112 4 653 030 179 918 4 473 112
Mr TJ Matsua resigned as a director on 1 September 2010.
No non beneficial shares were held by any director in the current or the previous financial year.
Since the year end, and to the date of this report, two directors have exercised their options in terms of the Group’s share optionscheme, in respect of options which have vested. Ordinary shares in the Company have been allocated to the directors by the ELBShare Incentive Scheme from shares held by the Trust for the purpose of administering the scheme. Interest free loans from the Trusthave been granted to the directors for the acquisition of the shares. The shares remain under the control of the Trust until paid for interms of the scheme. The additional shareholdings of the directors is therefore beneficial but indirect. The directors and the sharesallocated are:
Dr Meijers - 200 000 ordinary shares
Mr Ramollo - 30 000 ordinary shares
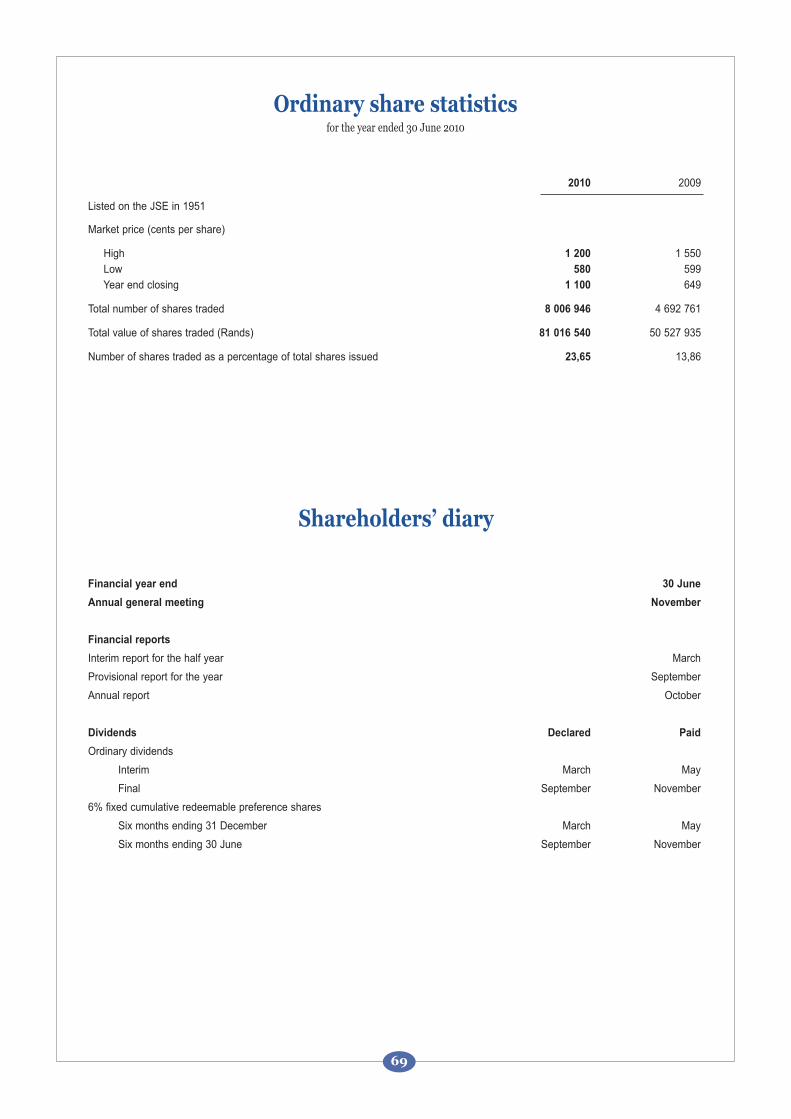
2010 2009
Listed on the JSE in 1951
Market price (cents per share)
High 1 200 1 550Low 580 599Year end closing 1 100 649
Total number of shares traded 8 006 946 4 692 761
Total value of shares traded (Rands) 81 016 540 50 527 935
Number of shares traded as a percentage of total shares issued 23,65 13,86
Ordinary share statisticsfor the year ended 30 June 2010
Shareholders’ diary
69
Financial year end 30 June
Annual general meeting November
Financial reports
Interim report for the half year March
Provisional report for the year September
Annual report October
Dividends Declared Paid
Ordinary dividends
Interim March May
Final September November
6% fixed cumulative redeemable preference shares
Six months ending 31 December March May
Six months ending 30 June September November
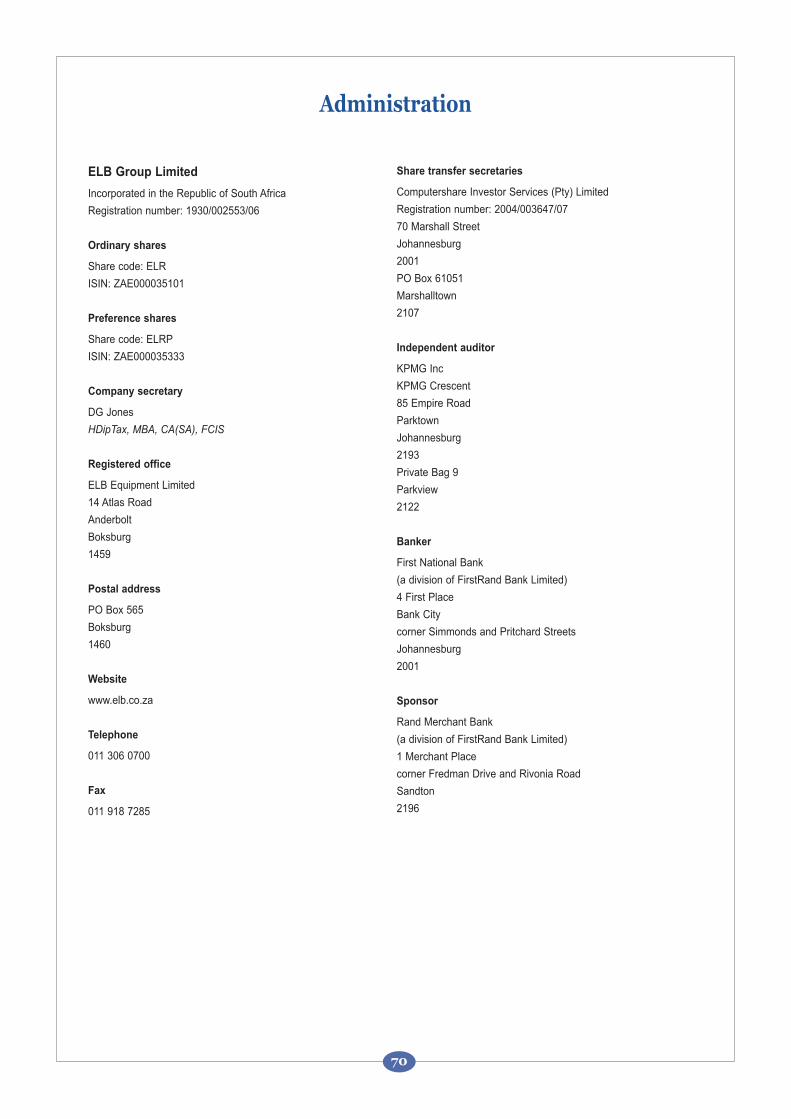
ELB Group Limited
Incorporated in the Republic of South Africa
Registration number: 1930/002553/06
Ordinary shares
Share code: ELR
ISIN: ZAE000035101
Preference shares
Share code: ELRP
ISIN: ZAE000035333
Company secretary
DG Jones
HDipTax, MBA, CA(SA), FCIS
Registered office
ELB Equipment Limited
14 Atlas Road
Anderbolt
Boksburg
1459
Postal address
PO Box 565
Boksburg
1460
Website
www.elb.co.za
Telephone
011 306 0700
Fax
011 918 7285
Administration
70
Share transfer secretaries
Computershare Investor Services (Pty) Limited
Registration number: 2004/003647/07
70 Marshall Street
Johannesburg
2001
PO Box 61051
Marshalltown
2107
Independent auditor
KPMG Inc
KPMG Crescent
85 Empire Road
Parktown
Johannesburg
2193
Private Bag 9
Parkview
2122
Banker
First National Bank
(a division of FirstRand Bank Limited)
4 First Place
Bank City
corner Simmonds and Pritchard Streets
Johannesburg
2001
Sponsor
Rand Merchant Bank
(a division of FirstRand Bank Limited)
1 Merchant Place
corner Fredman Drive and Rivonia Road
Sandton
2196
Notice is hereby given that the eightieth Annual GeneralMeeting of shareholders of ELB Group Limited (the Company)will be held in the Board Room, ELB Equipment Limited, 14Atlas Road, Anderbolt, Boksburg, on Tuesday, 23 November2010 at noon (12h00) to pass the following resolutions with orwithout amendment:
1. ORDINARY BUSINESS
1.1 To consider the annual financial statements of theCompany for the year ended 30 June 2010 together withthe reports of the directors and auditors contained therein.
1.2 To re-appoint KPMG Inc as the independent auditors ofthe Company and Mr Colin Esslemont as the individualdesignated auditor of the Company for the ensuingfinancial year.
1.3 To elect a director in place of Mr MV Ramollo who retiresin accordance with the Company’s Articles of Association,but, being eligible, offers himself for re-election.
1.4 To elect a director in place of Mr IAR Thomson who retiresin accordance with the Company’s Articles of Association,but, being eligible, offers himself for re-election.
Biographical details of all directors of the Company areset out on page 6 of the annual report.
1.5 To re-elect Mr T de Bruyn as a member of the AuditCommittee of the company.
1.6 To re-elect Dr JP Herselman as a member of the AuditCommittee of the Company.
1.7 To re-elect Mr IAR Thomson as a member of the AuditCommittee of the Company.
1.8 To ratify the non-executive directors’ fees and bonusesas set out on page 44 of the annual report.
1.9 To transact any other business that may be transactedat an annual general meeting.
2. SPECIAL BUSINESS
Shareholders will be asked to consider, and if deemed fit,pass the following resolution with or without amendments:
2.1 Special resolution
General repurchase authority:
Resolved that, as a general approval contemplated in termsof sections 85 to 89 of the Companies Act No. 61 of 1973, asamended, (the Act) the acquisitions by the Company, and/orany subsidiary of the Company, from time to time of theissued ordinary shares of the Company, upon such termsand conditions and in such amounts as the directors of theCompany may from time to time determine, be and is herebyauthorised, but subject to the Articles of Association of theCompany, the provisions of the Act and the JSE ListingsRequirements, when applicable, and provided that –
• the acquisitions or ordinary shares in the aggregate in anyone financial year do not exceed 10% (ten percent) of the
Company’s issued ordinary share capital as at thebeginning of the financial year;
• the general repurchase of securities will be effected throughthe order book operated by the JSE trading system anddone without any prior understanding or arrangementbetween the Company and the counter party (reportedtrades are prohibited);
• this general authority shall only be valid until the Company’snext annual general meeting, provided that it shall notextend beyond 15 (fifteen) months from the date of passingof this special resolution;
• general repurchases may not be made at a price greater than10% above the weighted average of the market value for thesecurities for the 5 (five) business days immediatelypreceding the date on which the transaction is effected. TheJSE should be consulted for a ruling if the applicant’ssecurities have not traded in such 5 day business day period;
• at any point in time a Company may only appoint one agentto effect any repurchases on the Company’s behalf;
• the Company or its subsidiary may not repurchase securitiesduring a prohibited period as defined in the JSE ListingsRequirements unless they have in place a repurchaseprogramme where the dates and quantities of securities to betraded during the relevant period are fixed (not subject to anyvariation) and full details of the programme have beendisclosed in an announcement over SENS prior to thecommencement of the prohibited period; and
• when the Company has cumulatively repurchased 3% of theinitial number of the relevant class of securities, and foreach 3% in aggregate of the initial number of that classacquired thereafter, an announcement will be made.
The directors undertake that they will not effect a generalrepurchase of shares as contemplated above unless thefollowing can be met:
• the Company and the Group are in a position to repay theirdebt in the ordinary course of business for a period of 12months after the date of the general repurchase;
the Company and the Group’s assets, fairly valued inaccordance with the accounting policies used in the latestaudited consolidated annual financial statements, willexceed the liabilities of the Company and the Group for aperiod of 12 months after the date of the general repurchase;
• the share capital and reserves of the Company and the Groupare adequate for ordinary business purposes for the nexttwelve months following the date of the general repurchase;
• the available working capital of the Company and the Groupwill be adequate for ordinary business purposes for a periodof 12 months after the date of the general repurchase; and
• before entering the market to proceed with the generalrepurchase, the Company’s Sponsor will confirm theadequacy of the Company’s and the Group’s workingcapital in writing to the JSE.
Notice of annual general meeting
71
Other disclosure in terms of the JSE ListingsRequirements Section 11.26
The JSE Listings Requirements require the followingdisclosure, some of which are elsewhere in the annual report,of which this notice forms part, as set out below;
• Directors – page 6;
• Major shareholders of the Company – page 68;
• Directors’ interests in securities – page 68; and
• Share capital of the Company – pages 35 and 36;
Litigation statement
In terms of section 11.26 of the Listings Requirements of theJSE, the directors, whose names are given on page 6 of theannual report of which this notice forms part, are not aware ofany legal or arbitration proceedings, including proceedings thatare pending or threatened, that may have or have had in therecent past, being at least the previous 12 months, a materialeffect on the Group’s financial position.
Directors’ responsibility statement
The directors, whose names are given on page 6 of the annualreport, collectively and individually accept full responsibility forthe accuracy of the information pertaining to this resolution andcertify that to the best of their knowledge and belief there are nofacts that have been omitted which would make any statementfalse or misleading, and that all reasonable enquiries toascertain such facts have been made and that this resolutioncontains all information required by law and the JSE ListingsRequirements.
Other than the facts and developments reported on in the annualreport, there have been no material changes in the financialposition of the Company and its subsidiaries since the date ofsignature of the audit report and the date of this notice.
Reason for and effect of the SpecialResolution
The reason for and effect of this special resolution number 2.1 isto authorise the Company and/or its subsidiary Company by wayof a general authority to acquire its own issued shares on suchterms, conditions and in such amounts as determined from timeto time by the directors of the Company subject to the limitationsset out above.
Statement of board’s intention
The directors of the Company have no specific intention to effectthe provisions of special resolution number 2.1 but will, however,continually review the Company’s position, having regard toprevailing circumstances and market conditions, in consideringwhether to effect the provisions of special resolution number 2.1.
Voting and proxies
Shareholders of the Company who have not dematerialisedtheir shares in the Company, or who have dematerialised theirshares with “own name” registration, are entitled to attend andvote at the meeting and are entitled to appoint a proxy or proxiesto attend, speak and vote in their stead at the meeting. Theperson so appointed need not be a shareholder.
Proxy forms must be forwarded, to reach the registered office ofthe Company, or the transfer secretaries, ComputershareInvestor Services (Proprietary) Limited, at the address givenbelow no later than noon (12h00) on Thursday, 18 November2010.
Proxy forms must only be completed by shareholders who havenot dematerialised their shares or who have dematerialised theirshares with “own name” registration.
On a show of hands, every shareholder of the Company presentin person or represented by proxy shall have one vote only. Ona poll, every shareholder of the Company shall have one vote forevery share held in the Company by such shareholder.
Shareholders who have dematerialised their shares, other thanthose shareholders who have dematerialised their shares with“own name” registration, should contact their CSDP or broker inthe manner and time stipulated in their agreements in order tofurnish them with their voting instructions and to obtain thenecessary authority to attend the meeting should suchshareholder wish to do so.
Shares held by a share trust or scheme will not have their votesat the annual general meeting taken into account for purposes ofresolutions proposed in terms of the JSE Listings Requirements.
Unlisted securities, if applicable and treasury shares may alsonot vote.
By order of the Board
DG Jones
Company SecretaryBoksburg 1459
Computershare Investor Services (Proprietary) Limited
70 Marshall StreetJohannesburg 2001PO Box 61051Marshalltown 2107Johannesburg
20 October 2010
Notice of annual general meeting(continued)
72

ELB GROUP LIMITED
(Incorporated in the Republic of South Africa)Registration No. 1930/002553/06
ISIN : ZAE000035101 Share Code ELR("the Company")
For completion by shareholders who have not dematerialsed their shares or who have dematerialised their shares butwith "own name" registration.
Proxy form
For use by certificated shareholders and “own name registered” dematerialised shareholders, at the annual general meeting of theCompany to be held at noon (12h00) on Tuesday, 23 November 2010, at the premises of ELB Equipment Limited which are locatedat 14 Atlas Road, Anderbolt, Boksburg.
Dematerialised shareholders (other than “own name registered” dematerialised shareholders) who wish to attend the annual generalmeeting should obtain from their CSDP or broker the necessary authorisation to attend the annual general meeting or advise theirCSDP or broker as to what action they wish to take in respect of voting at the annual general meeting.
FORM OF PROXY FOR THE EIGHTIETH ANNUAL GENERAL MEETING OF ELB GROUP LIMITED
I/We (please print) ...........................................................................................................................................................................................
of address (please print) ..................................................................................................................................................................................
being the holder/s of ................................................................................................................... shares in the Company, do hereby appoint
1. .......................................................................................................................................................................................... or failing him/her
2. .......................................................................................................................................................................................... or failing him/her
3. the chairman of the annual general meeting
as my/our proxy to act for me/us and on my/our behalf at the annual general meeting which will be held for the purposes of consideringand, if deemed fit, for the passing, with or without modification, the resolutions to be proposed thereat and at any adjournment thereof,and to vote for and/or against such resolutions and/or abstain from voting in respect of the shares registered in my/our name(s), inaccordance with the following (see note 3):
In Favour Against Abstain
1.1 Approval of annual financial statements
1.2 Re-appoint KPMG Inc as auditorsRe-appoint Mr C Esslemont as individual designated auditor
1.3 Election of director Mr MV Ramollo
1.4 Election of director Mr IAR Thomson
1.5 Election of audit committee member Mr T de Bruyn
1.6 Election of audit committee member Dr JP Herselman
1.7 Election of audit committee member Mr IAR Thomson
1.8 Ratify non-executive directors’ fees and bonuses
2.1 Approval of special resolution: general authority to repurchase shares
Signed at ................................................................................................................. on ...................................................................... 2010
Signature (see note 5) ....................................................................................................................................................................................
Assisted by me where applicable (see note 8) ...............................................................................................................................................
Please read the notes on the reverse side hereof.
1. A form of proxy is only to be completed by those
shareholders who hold shares in certificated form or are
recorded on sub-register electronic form in “own name”. All
other beneficial owners who have dematerialised their
shares through a Central Securities Depository Participant
(“CSDP”) or broker and wish to attend the meeting must
provide the CSDP or broker with their voting instructions in
terms of the relevant custody agreement entered into
between them and the CSDP or broker.
2. A shareholder may insert the name of a proxy or the names
of two alternative proxies of his/her choice in the spaces
provided, with or without deleting “the chairman of the
meeting”, but any such deletion must be initialed by the
shareholder. The person whose name is first on this form of
proxy and who is present at the meeting will be entitled to act
as proxy to the exclusion of those whose names follow.
3. Please insert an “X” in the relevant spaces indicating how
you wish your votes to be cast. However, if you wish to cast
your votes in respect of a lesser number of shares than you
own in the Company, insert the number of shares held in
respect of which you wish to vote. Failure to comply with the
above will be deemed to authorise the proxy to vote or
abstain from voting at the meeting as he/she deems fit in
respect of all the shareholders’ votes exercisable thereat. A
shareholder or his/her proxy is not obliged to use all the
votes exercisable by the shareholder or by his/her proxy, but
the total of the votes cast in respect of which abstention is
recorded may not exceed the total of the votes exercisable
by the shareholder or by his/her proxy.
4. The form of proxy appointing a proxy must reach the
registered office of the Company or the transfer secretaries,
Computershare Investor Services (Proprietary) Limited, 70
Marshall Street Johannesburg, 2001 (PO Box 61051,
Marshalltown, 2107) by not later than noon (12h00) on
Thursday, 18 November 2010.
5. The completion and lodging of this form of proxy will not
preclude the relevant shareholder from attending the
meeting and speaking and voting in person thereat to the
exclusion of any proxy appointed in terms hereof.
6. Documentary evidence establishing the authority of a person
signing this form of proxy in a representative capacity must
be attached to this form of proxy, unless recorded by the
Company or waived by the chairman of the meeting.
7. Any alteration or correction made to this form of proxy must
be initialed by the signatory/ies.
8. A minor must be assisted by his/her parents or guardian
unless the relevant documents establishing his/her capacity
are produced or have been registered by the Company.
9. The chairman of the meeting may accept any form of proxy
which is completed, other than in accordance with these
notes, if the chairman is satisfied as to the manner in which
the shareholder wishes to vote.
Notes to the form of proxy

E L B G R O U P L I M I T E DELB Equipment Limited, 14 Atlas Road, Anderbolt, Boksburg, 1459
PO Box 565, Boksburg, 1460Tel +27 11 306 0700Fax +27 11 918 7285
Website: www.elb.co.za
BR ADVERTISING


![[jaws days 2014]ELB/AutoScaling](https://img.pdfslide.us/doc/110x75/5595a4491a28ab357f8b4698/jaws-days-2014elbautoscaling.jpg)