Embed Size (px)
Citation preview

Markets in Action:Elasticity
& Individual
vs Market Demand
Dr. Stephen KinsellaEC4004 Lecture 4
Demand Functions
Income & Substitution Effects
Consumer Surplus
Market Demand
Elasticity
2
1.
Market demand: The total quantity of a good or service
demanded by all potential buyers.
Market demand: The total quantity of a good or service demanded by all potential buyers.
Market demand curve shows the relationship between the total quantity demanded of a single good or service and its price, holding all other factors constant.
Market Demand Curves
(a) Individual 1
PX
XP*
X*1
0
(a) Individual 1
PX
XP*
X*1
0
(b) Individual 2
X*2
0
PX
(a) Individual 1
PX
XP*
X*1
0
(b) Individual 2
X*2
0
(c) Market Demand
X
D
X*0
PX PX
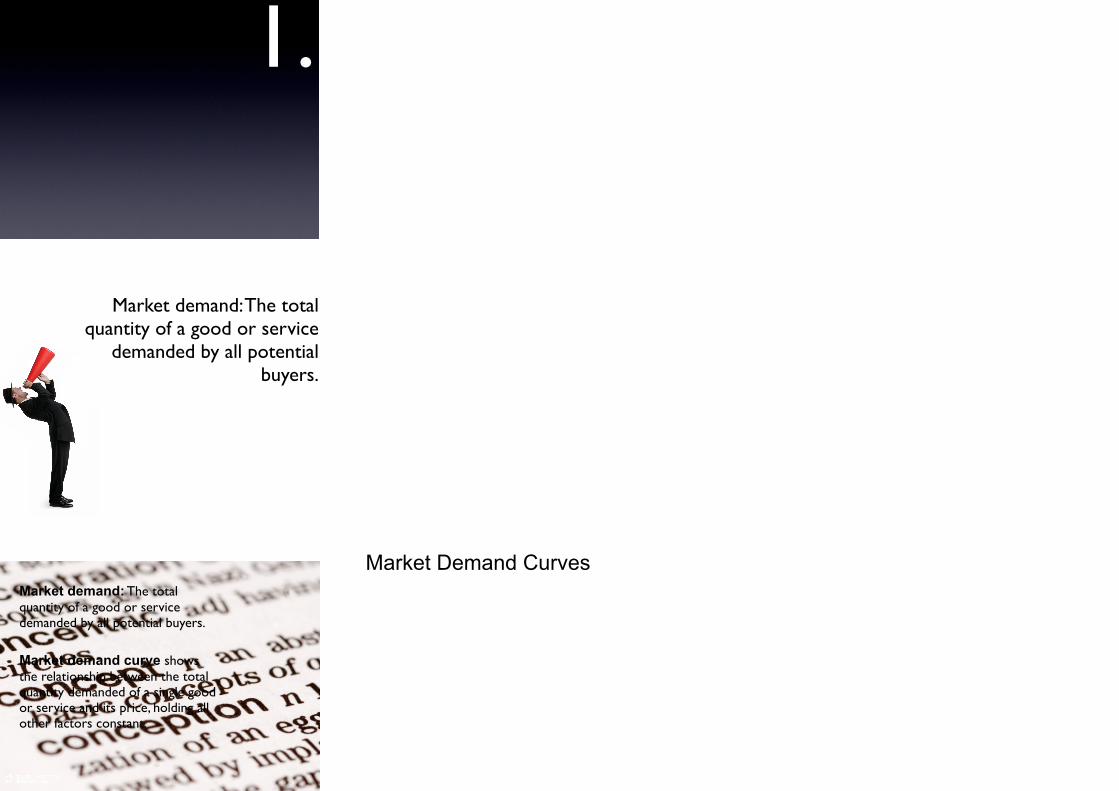
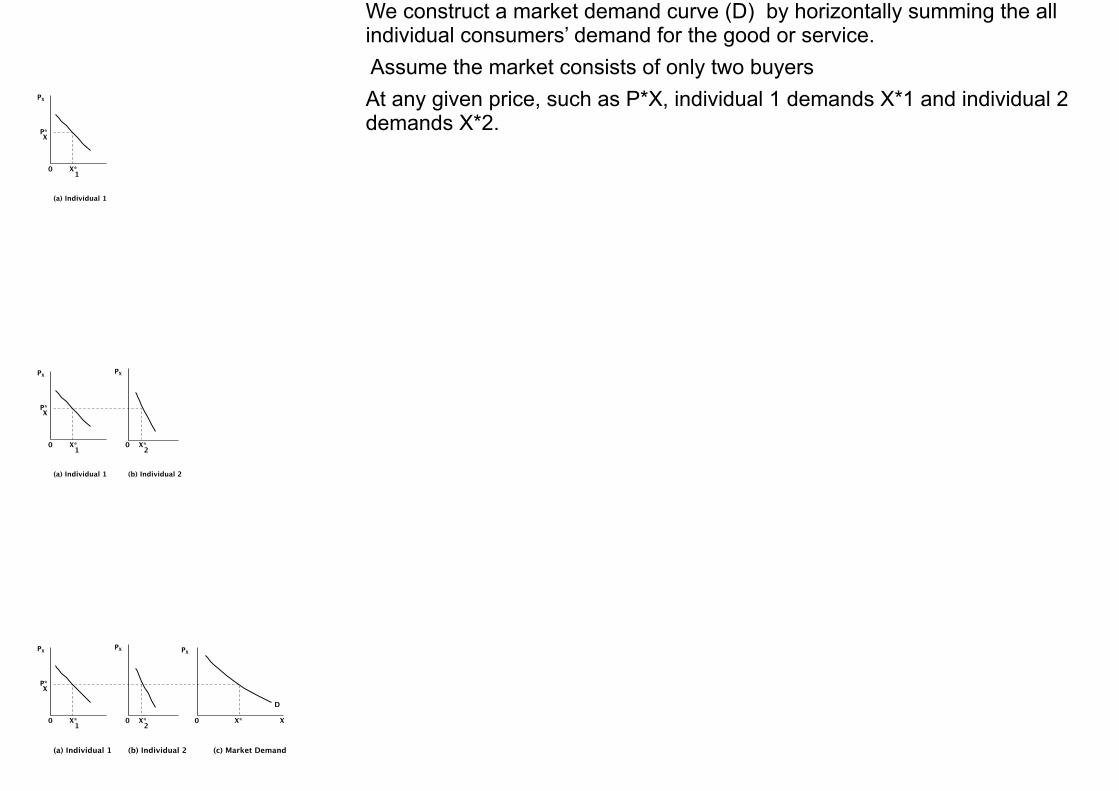
We construct a market demand curve (D) by horizontally summing the all individual consumers’ demand for the good or service. Assume the market consists of only two buyersAt any given price, such as P*X, individual 1 demands X*1 and individual 2 demands X*2.
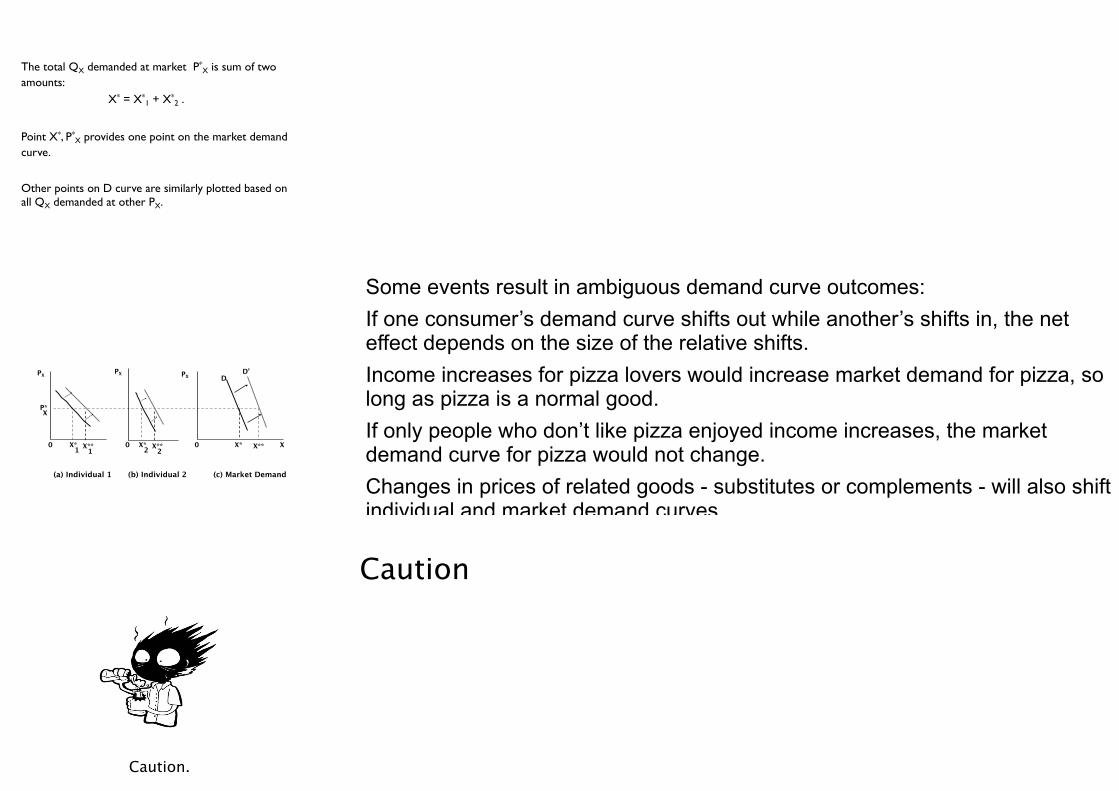
The total QX demanded at market P*X is sum of two
amounts: X* = X*
1 + X*2 .
Point X*, P*X provides one point on the market demand
curve.
Other points on D curve are similarly plotted based on all QX demanded at other PX.
(a) Individual 1
PX
XP*
X*1
0
(b) Individual 2
X*2
0
(c) Market Demand
X
D
X*0
PX PX
X** X** X**
D’
1 2
Caution.
Some events result in ambiguous demand curve outcomes:If one consumer’s demand curve shifts out while another’s shifts in, the net effect depends on the size of the relative shifts.Income increases for pizza lovers would increase market demand for pizza, so long as pizza is a normal good.If only people who don’t like pizza enjoyed income increases, the market demand curve for pizza would not change.Changes in prices of related goods - substitutes or complements - will also shift individual and market demand curves.
Caution
Related Goods
2.
Elasticity: measures the percentage change in one variable brought about by a 1 percent change in some other variable.
Because it’s measured in percentages, units cancel out - elasticity is a unit-less measure of responsiveness.
If goods X and Y are substitutes, an increase in PY will increase DX. Similarly, a decrease in PY will decrease DX.If goods X and Y are complements, an increase in PY will decrease DX. A decrease in PY will increase DX.
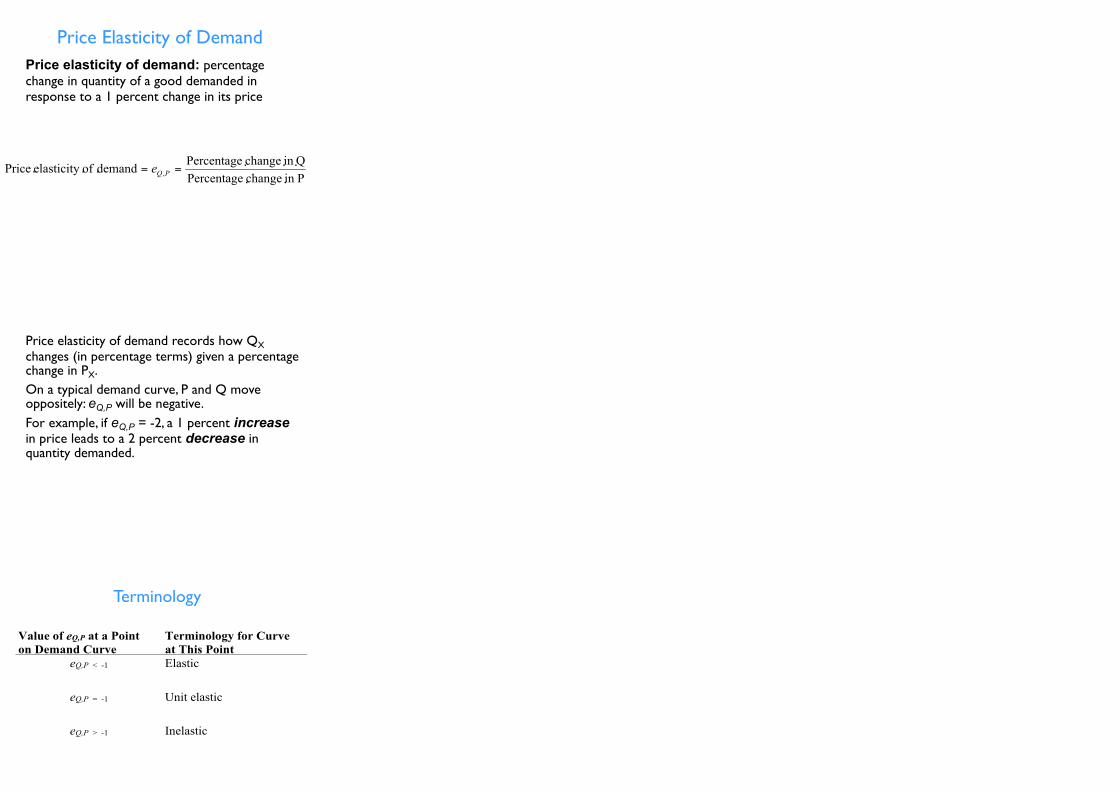
Price Elasticity of DemandPrice elasticity of demand: percentage change in quantity of a good demanded in response to a 1 percent change in its price
Price elasticity of demand records how QX changes (in percentage terms) given a percentage change in PX.On a typical demand curve, P and Q move oppositely: eQ,P will be negative.For example, if eQ,P = -2, a 1 percent increase in price leads to a 2 percent decrease in quantity demanded.
Terminology
Substitutes
Time
Total Expenditures
Classroom Experiment
MathematicaElasticity
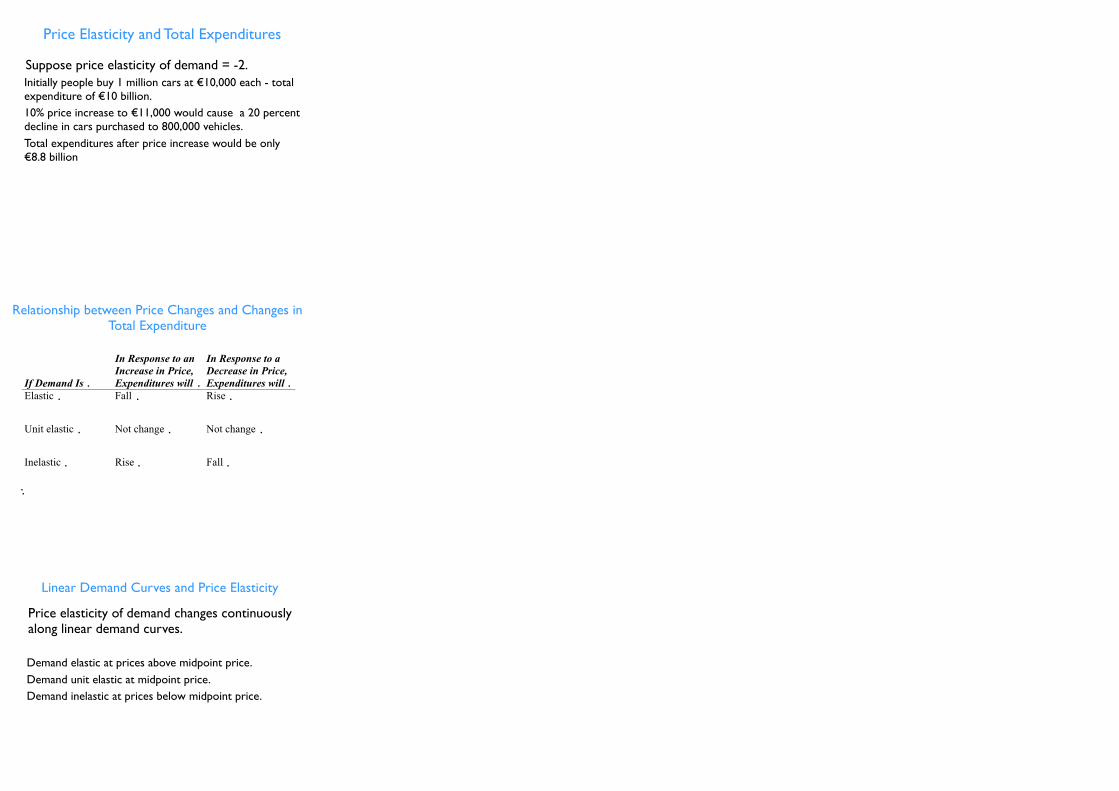
Price Elasticity and Total Expenditures
Suppose price elasticity of demand = -2.Initially people buy 1 million cars at €10,000 each - total expenditure of €10 billion.10% price increase to €11,000 would cause a 20 percent decline in cars purchased to 800,000 vehicles.Total expenditures after price increase would be only €8.8 billion
Relationship between Price Changes and Changes in Total Expenditure
Linear Demand Curves and Price Elasticity
Price elasticity of demand changes continuously along linear demand curves.
Demand elastic at prices above midpoint price.Demand unit elastic at midpoint price.Demand inelastic at prices below midpoint price.
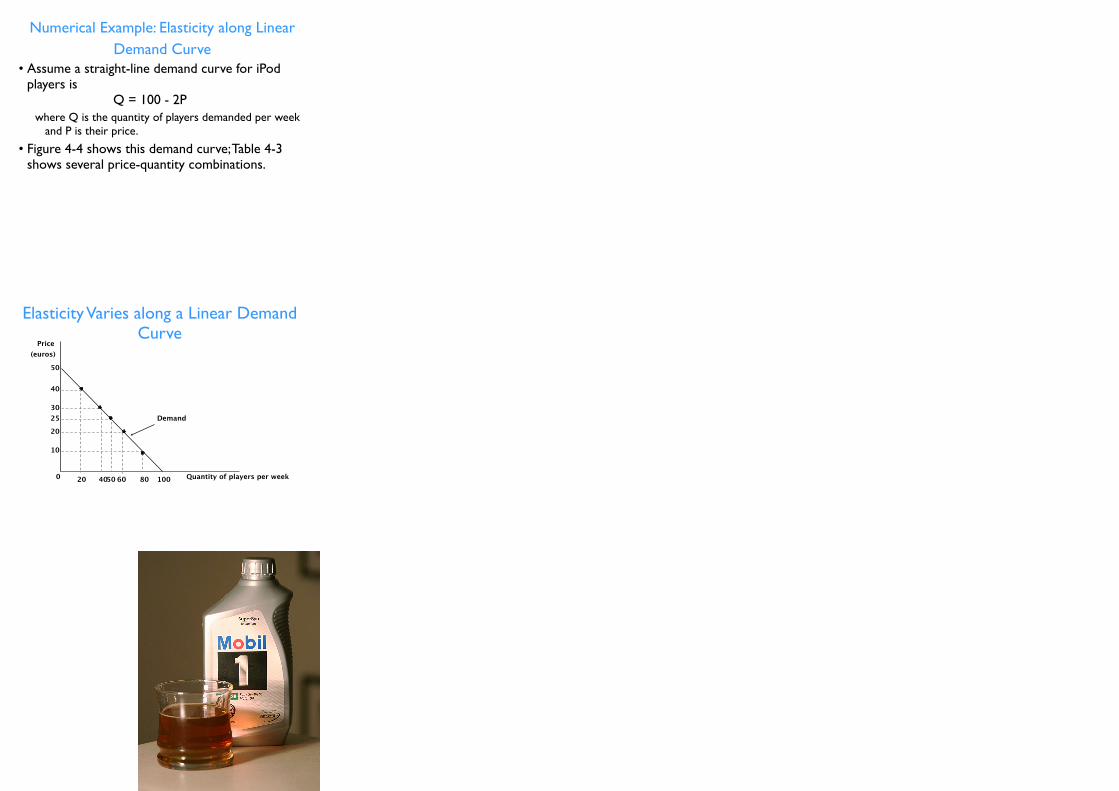
Numerical Example: Elasticity along Linear Demand Curve
• Assume a straight-line demand curve for iPod players is Q = 100 - 2P
where Q is the quantity of players demanded per week and P is their price.
• Figure 4-4 shows this demand curve; Table 4-3 shows several price-quantity combinations.
Price(euros)
10
50
40
3025
20
Quantity of players per week
Demand
20 4050 60 80 1000
Elasticity Varies along a Linear Demand Curve

As Gas Costs Soar, Buyers Flock to Small Cars
Farmers in India buy more camels
Gas Prices Send Surge of Riders to Mass Transit
Gas prices knock bicycle sales, repairs into higher gear
High gas prices drive farmer to switch to mules
Home buying practices adjust to high gas prices
As Gas Prices Climb, So Do Scooter Sales
Gas Prices Drive Students to Online Courses
...demand for new, more fuel-efficient aircraft has never been greater.
"For every 10 percent rise in gas prices, fatalities are reduced by 2.3 percent”
Fuel prices have grounded an unexpected frequent-flyer: Sean "Diddy" Combs.

Aww...
SurveyGo to stephenkinsella.net
Tell me what you think
Elasticity&
Market DemandDr. Stephen KinsellaEC4004 Lecture 4


![EC4004 LECTURE 18 - Stephen Kinsellastephenkinsella.net/WordPress/wp-content/uploads/... · over the last 12 months. 5.2 Wider implications of demographic change L`] aehY[l g^ ea_jYlagf](https://img.pdfslide.us/doc/110x75/5fcf937f1789882aae291ba7/ec4004-lecture-18-stephen-kin-over-the-last-12-months-52-wider-implications.jpg)