Embed Size (px)
Citation preview
Elasticities and the Quantitative Analysis of Supply and Demand
Elasticity is a measure of responsiveness to a stimulus.
What is the responsiveness of your grade-point average to hours of study time?
What is the responsiveness of wheat production to rain fall?
What is the responsiveness of electricity usage to the average daily temperature?
The quantity demanded by a consumer will depend upon the following factors:
The good’s own price. The consumer’s income. Prices of related goods. The consumer’s tastes and and preferences. Expectations and other special influences.
The quantity supplied will depend upon: the good’s own price prices of inputs used in producing the good. technology prices of other goods the seller could supply expectations and other factors
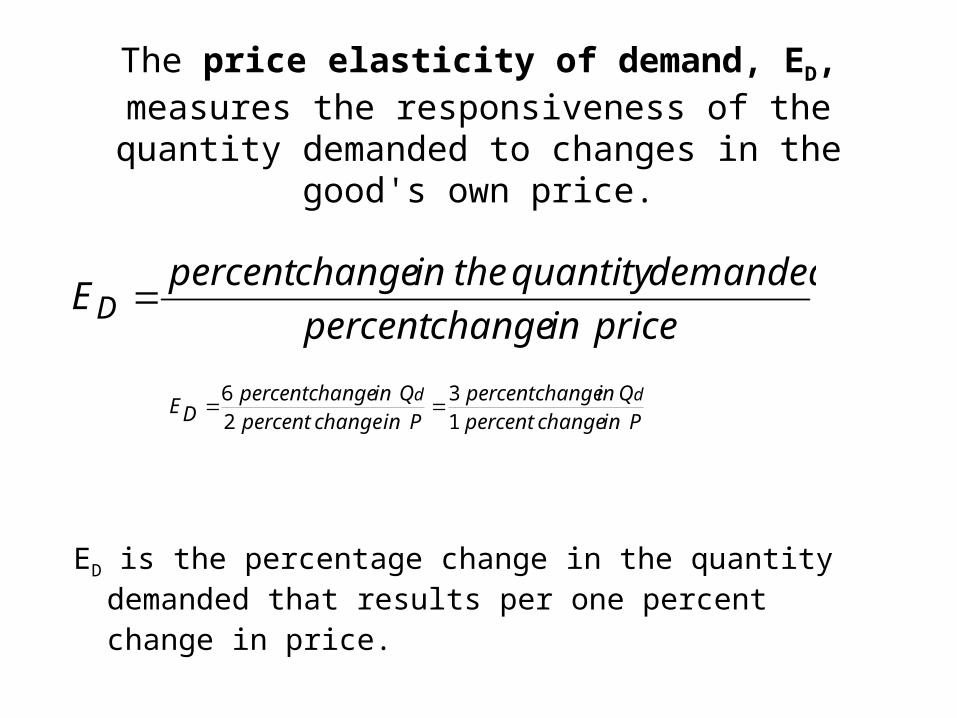
The price elasticity of demand, ED, measures the responsiveness of the quantity demanded to changes in
the good's own price.
ED is the percentage change in the quantity demanded that
results per one percent change in price.
priceinchangepercent
demandedquantitytheinchangepercentED
PinchangepercentQinchangepercent
PinchangepercentQinchangepercent
DEdd
13
26
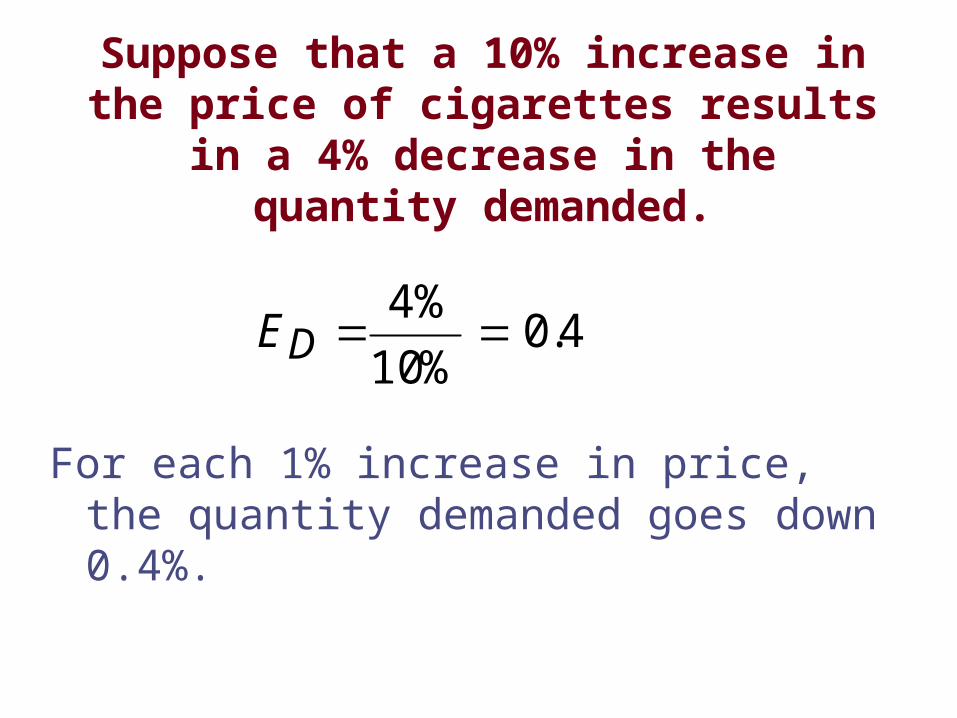
Suppose that a 10% increase in the price of cigarettes results in a 4% decrease in the
quantity demanded.
4.0%10
%4DE
For each 1% increase in price, the quantity demanded goes down 0.4%.
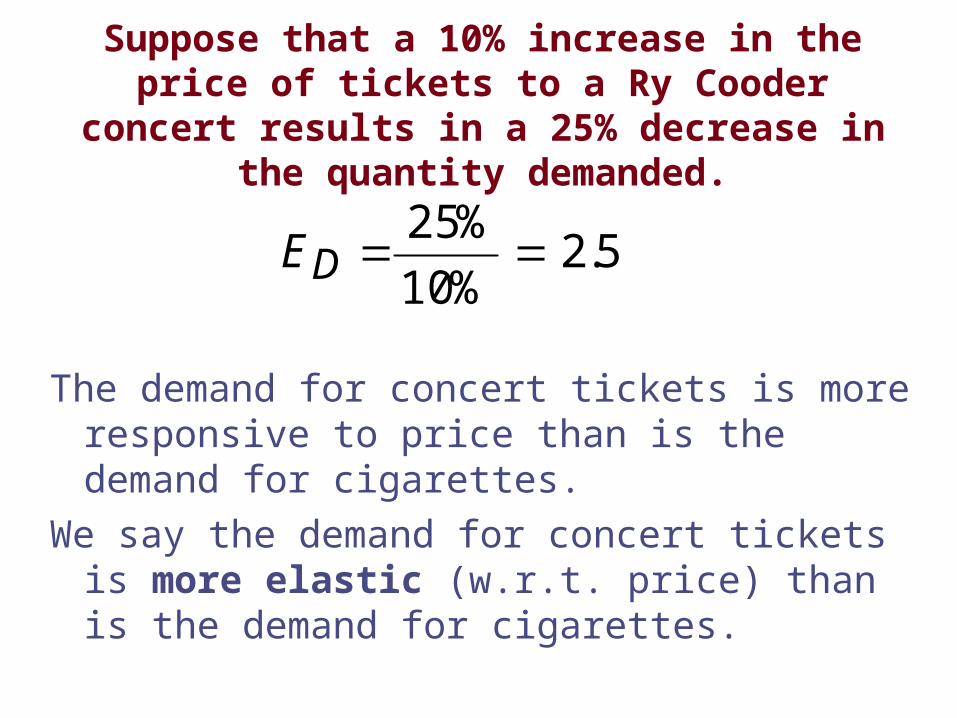
Suppose that a 10% increase in the price of tickets to a Ry Cooder concert results in a 25% decrease
in the quantity demanded.
5.2%10
%25DE
The demand for concert tickets is more responsive to price than is the demand for cigarettes.
We say the demand for concert tickets is more elastic (w.r.t. price) than is the demand for cigarettes.
P
PPQ
P
PQ
Q
P
PQ
Q
P
Q
priceinchangepercent
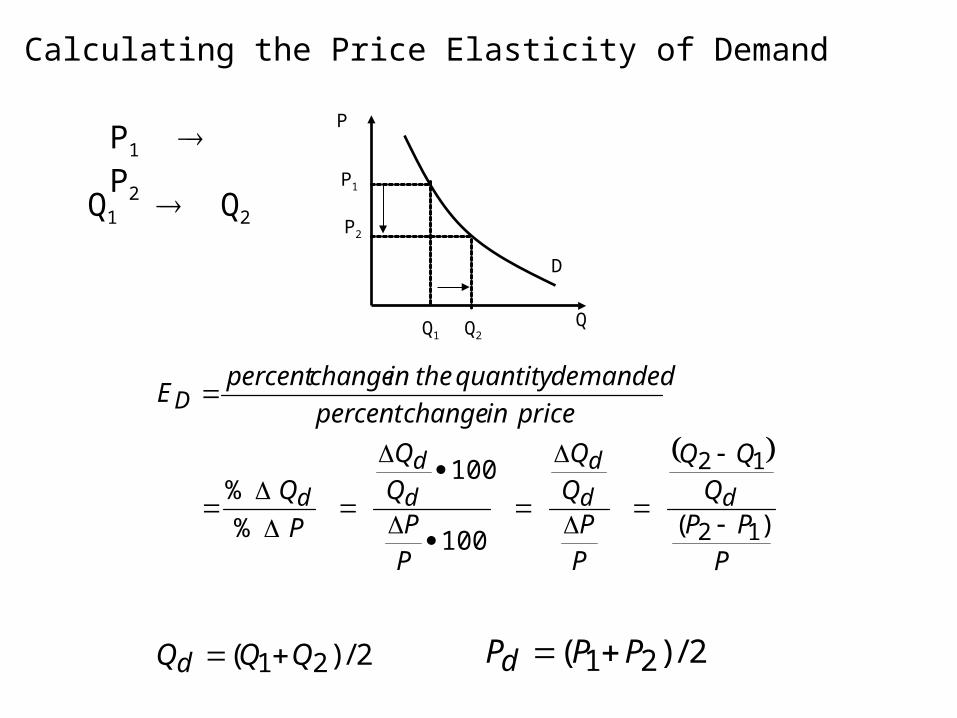
demandedquantitytheinchangepercentE
dd
d
d
d
d
D
)(100
100
%
%
12
12
P
Q
P1
P2
Q1 Q2
D
2/)( 21 QQQd 2/)( 21 PPPd
Calculating the Price Elasticity of Demand
P1 P2
Q1 Q2
33
9
1
5.4
3
2
5.41
32
5.41
7550
5.4)54(
75)50100(
PPQ
Q
Dd
d
E
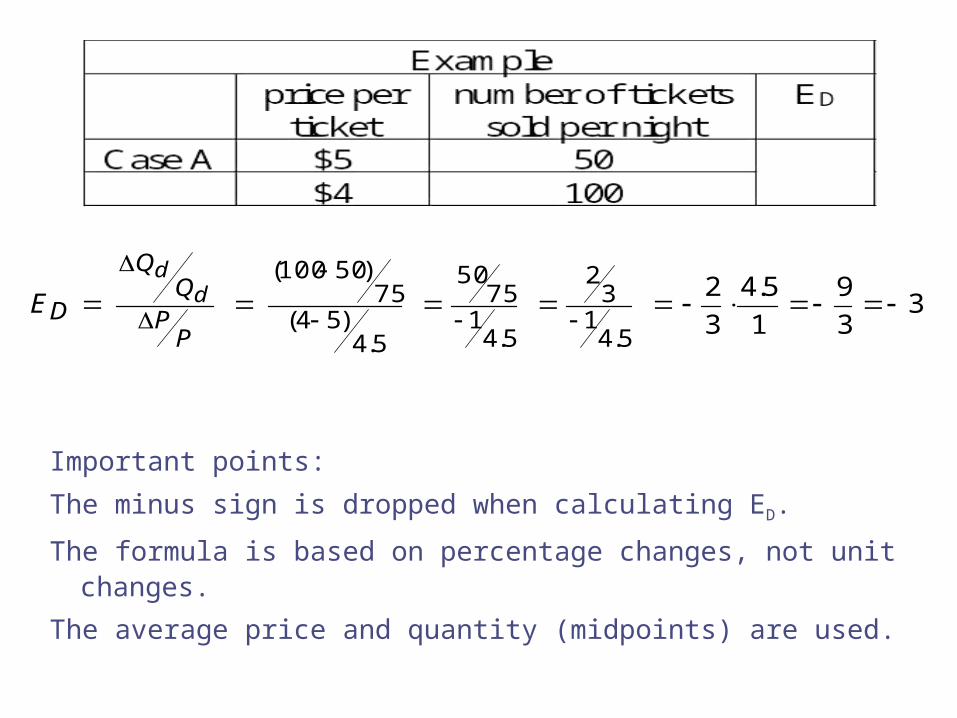
Important points:
The minus sign is dropped when calculating ED.
The formula is based on percentage changes, not unit changes.
The average price and quantity (midpoints) are used.
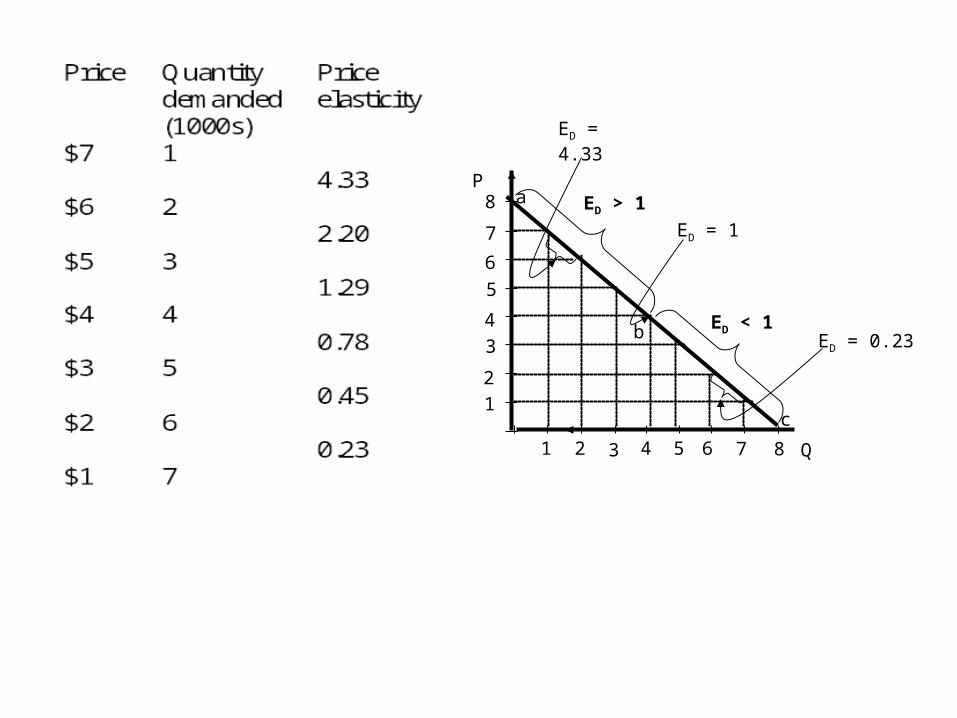
1 2 3 4 5 6 7 8
8
7
6
5
4
3
2
1
ED > 1
ED < 1
ED = 1
ED = 0.23
ED = 4.33
Q
Pa
c
b
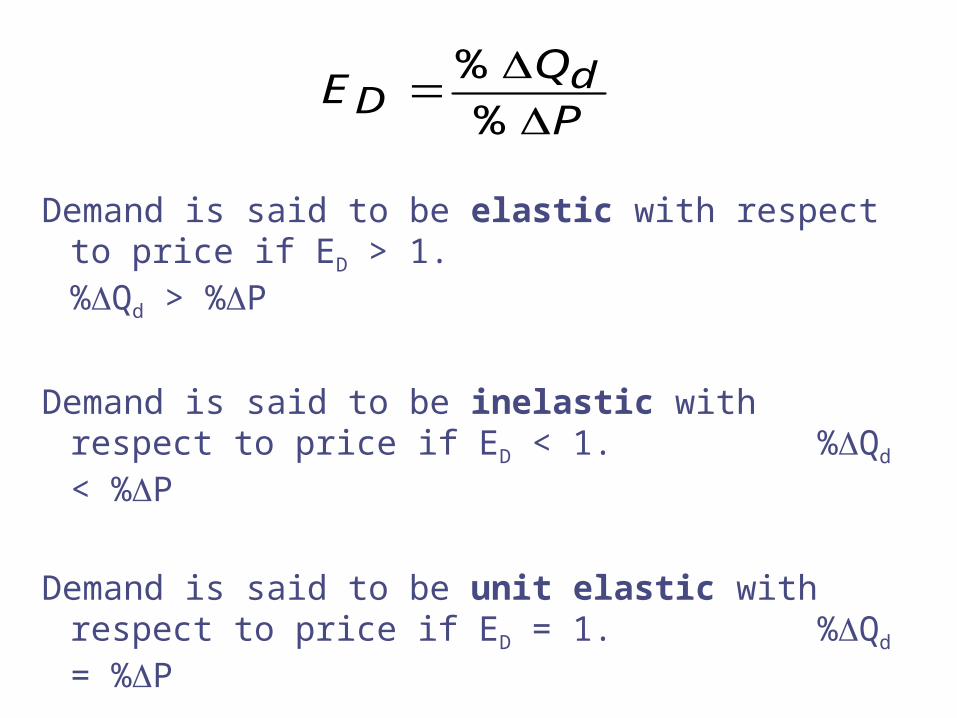
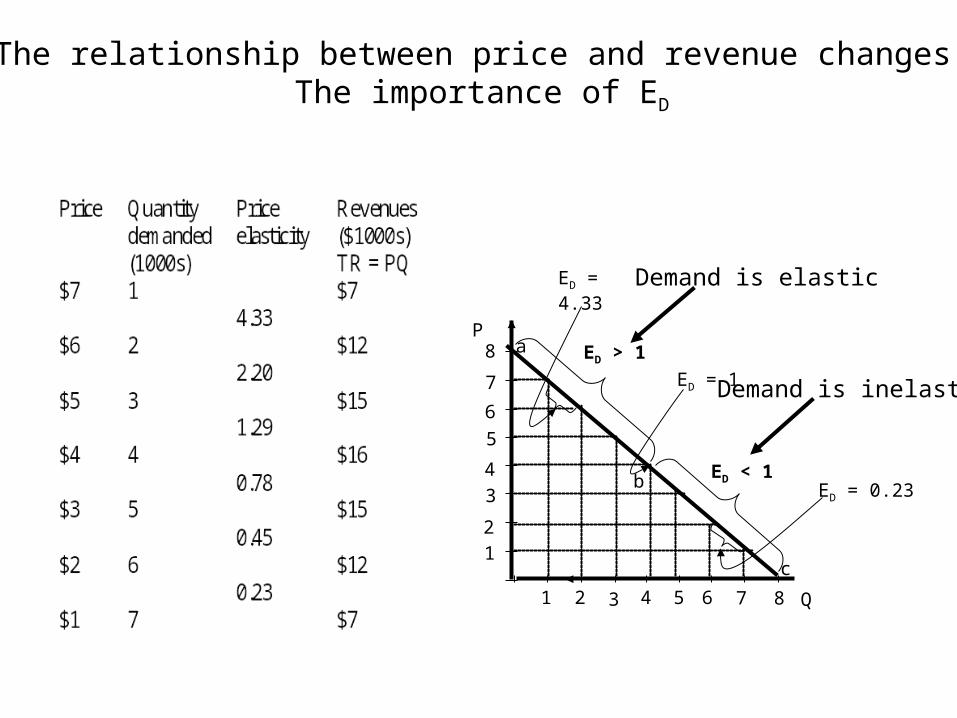
Demand is said to be elastic with respect to price if ED > 1. %Qd > %P
Demand is said to be inelastic with respect to price if ED < 1. %Qd < %P
Demand is said to be unit elastic with respect to price if ED = 1. %Qd = %P
P
QE dD
%
%
Example:
ED = 0.58 for food
ED = 1.26 for furniture.
Goods that are necessities typically have price elasticities of demand that are relatively smaller.
Example:
ED = 0.4 for gasoline
ED = 1.4 for natural gas
Goods having ready substitutes typically have higher price elasticities of demand.
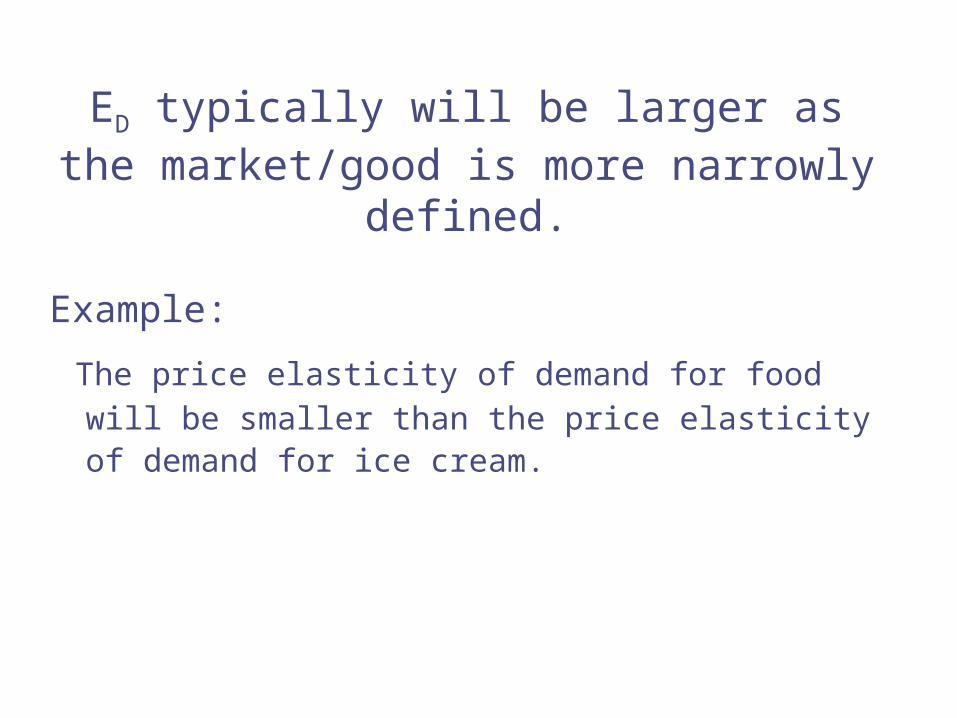
Example:
The price elasticity of demand for food will be smaller than the
price elasticity of demand for ice cream.
ED typically will be larger as the market/good is more narrowly defined.
ED typically will be larger as buyers have a longer period of time to respond to price
changes.
P
QE dD
%
%
PEQ Dd %%
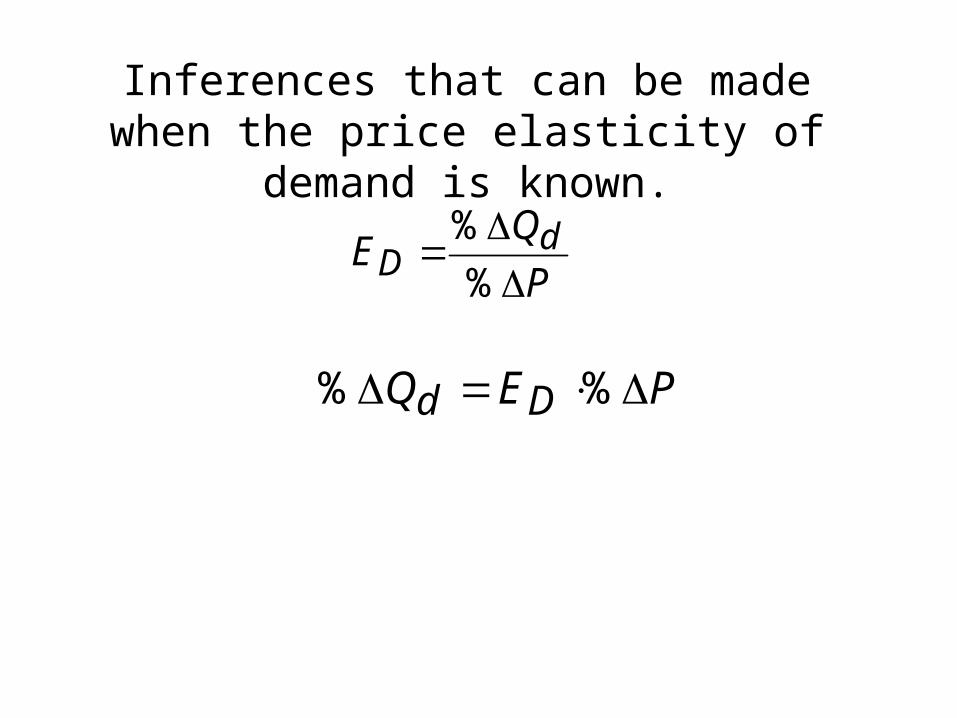
Inferences that can be made when the price elasticity of demand is known.
P
QE dD
%
%
PEQ Dd %%
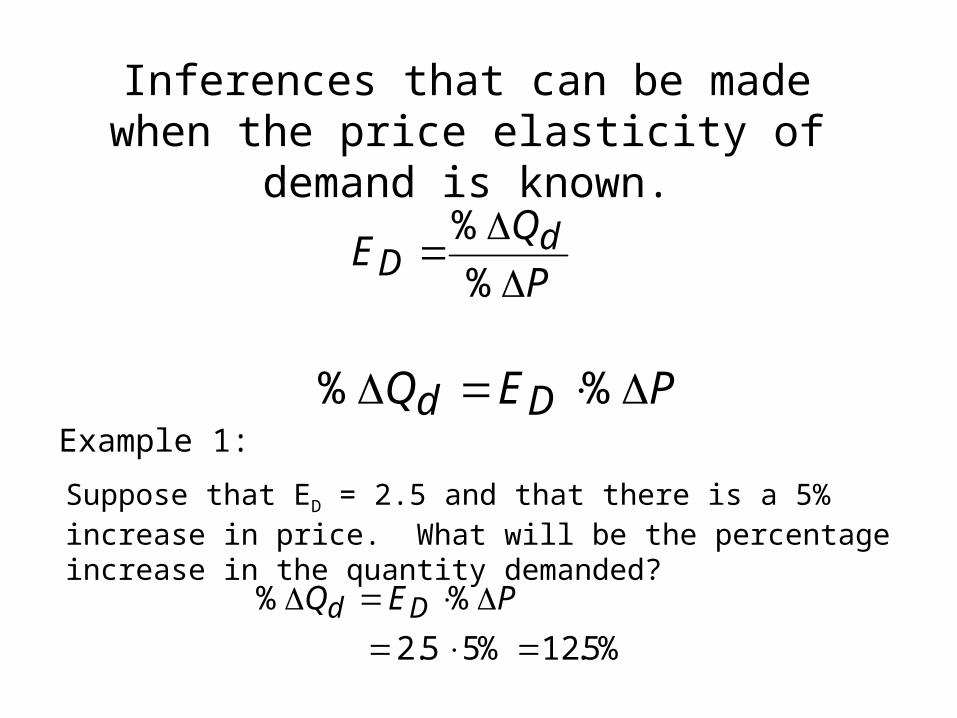
Suppose that ED = 2.5 and that there is a 5% increase in price. What will be the percentage increase in the quantity demanded?
%5.12%55.2
%%
PEQ Dd
Inferences that can be made when the price elasticity of demand is known.
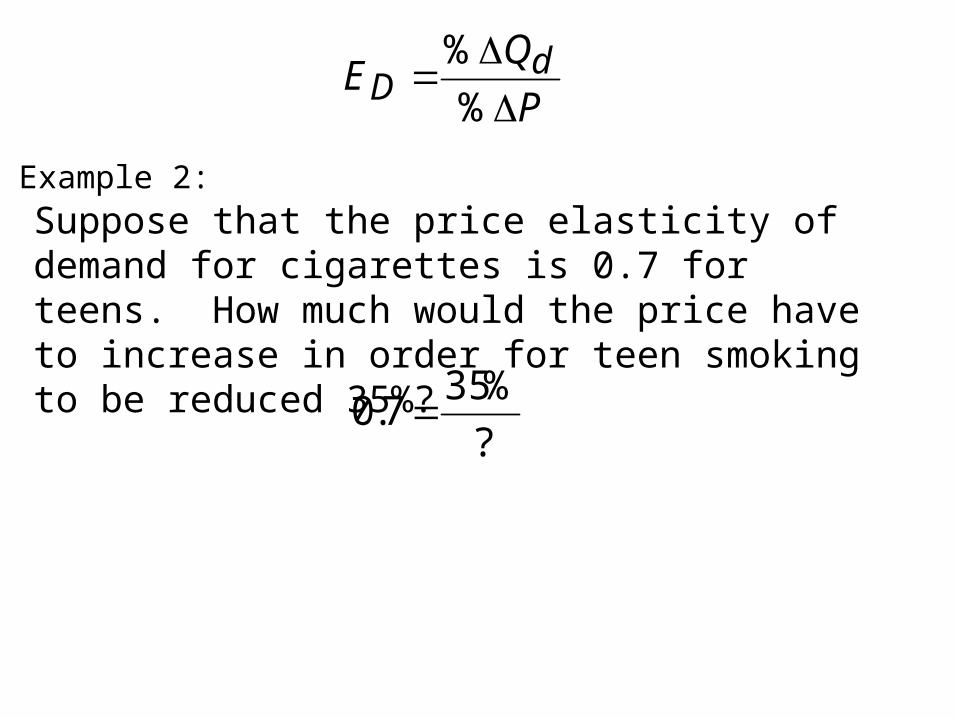
Example 1:
P
QE dD
%
%
Suppose that the price elasticity of demand for cigarettes is 0.7 for teens. How much would the price have to increase in order for teen smoking to be reduced 35%?
?
%357.0
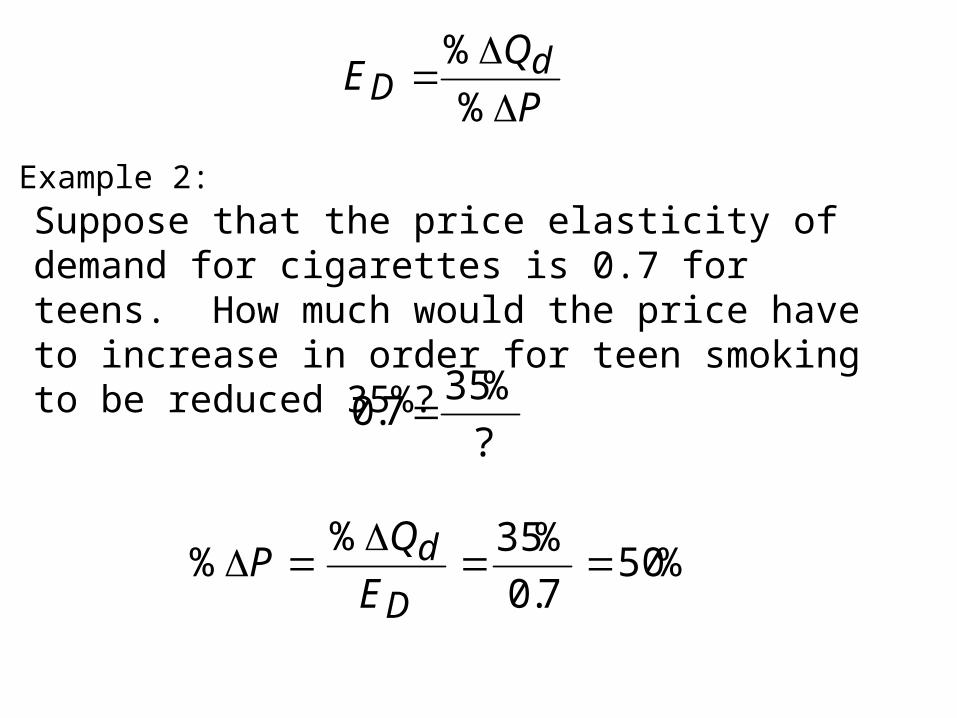
Example 2:
P
QE dD
%
%
%507.0
%35%%
D
dE
QP
Suppose that the price elasticity of demand for cigarettes is 0.7 for teens. How much would the price have to increase in order for teen smoking to be reduced 35%?
?
%357.0
Example 2:
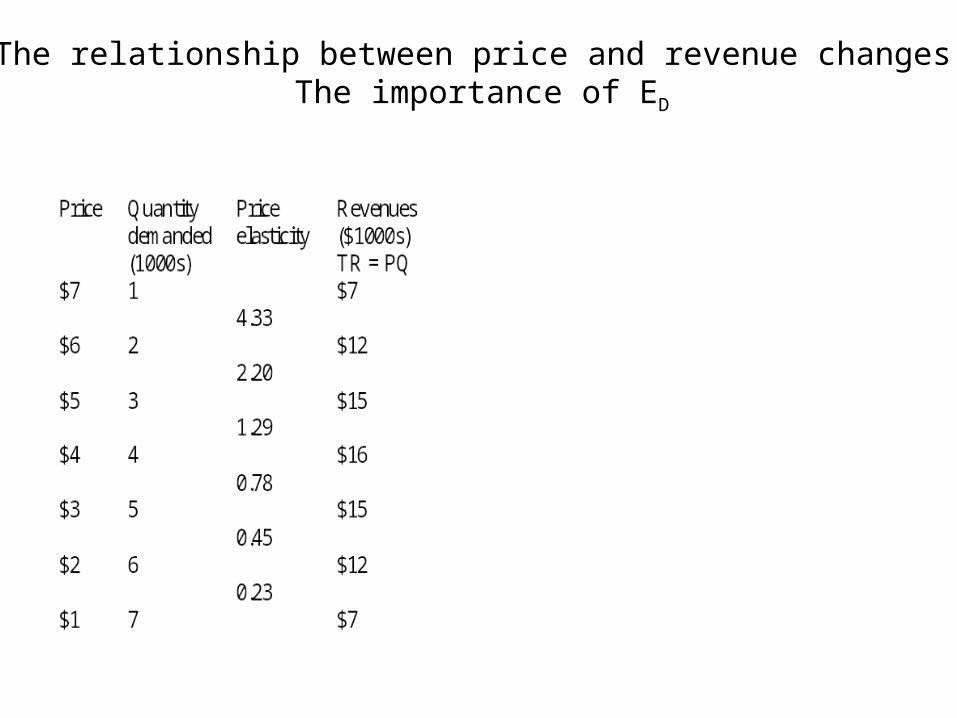
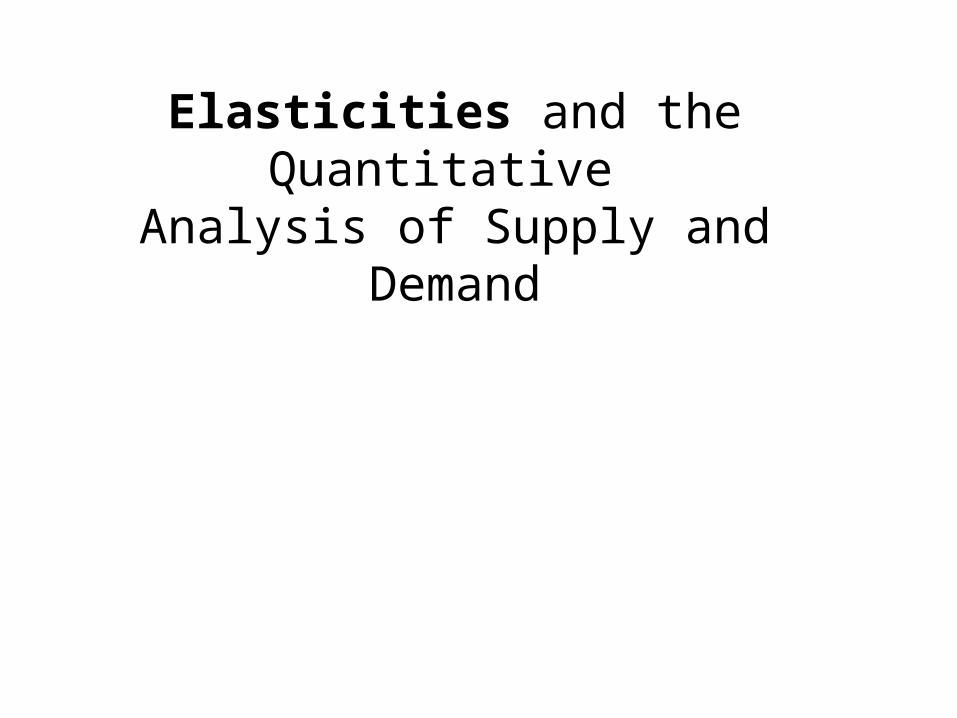
The relationship between price and revenue changes:The importance of ED
1 2 3 4 5 6 7 8
8
7
6
5
4
3
2
1
ED > 1
ED < 1
ED = 1
ED = 0.23
ED = 4.33
Q
Pa
c
b
The relationship between price and revenue changes:The importance of ED
Demand is elastic
Demand is inelastic

1 2 3 4 5 6 7 8
8
7
6
5
4
3
2
1
ED > 1
ED < 1
ED = 1
ED = 0.23
ED = 4.33
Q
Pa
c
b
Demand is elastic
Demand is inelastic
When demand is elastic (ED > 1), there is an inverse relationship between changes in price and changes in total revenue. P TR P TR
ED > 1 implies that %Qd > %P.
TR = P • Q
1 2 3 4 5 6 7 8
8
7
6
5
4
3
2
1
ED > 1
ED < 1
ED = 1
ED = 0.23
ED = 4.33
Q
Pa
c
b
Demand is elastic
Demand is inelastic
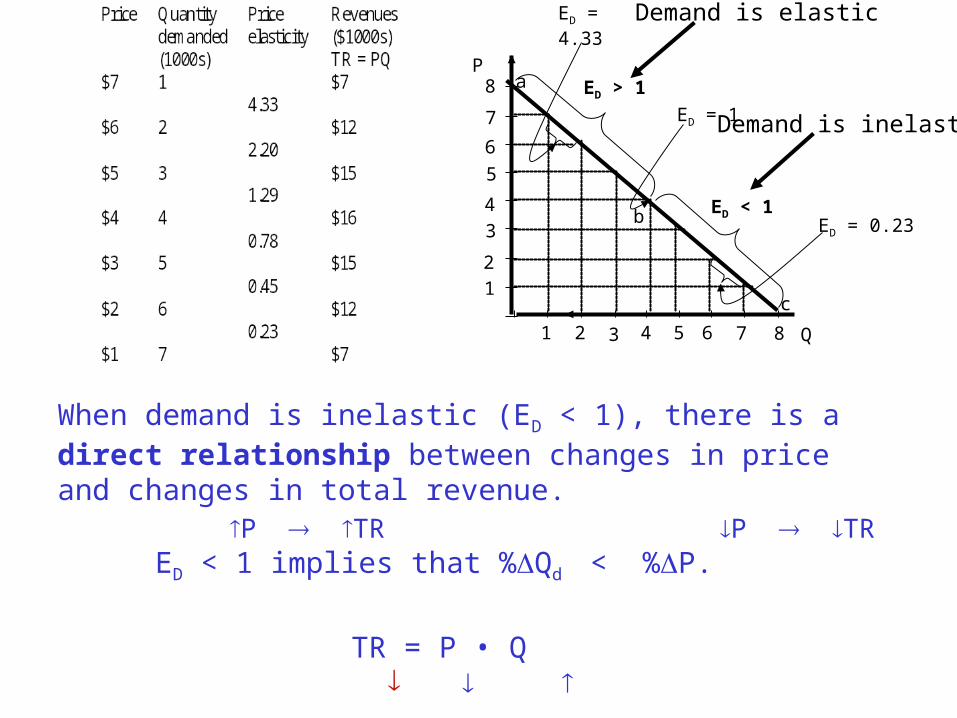
When demand is inelastic (ED < 1), there is a direct relationship between changes in price and changes in total revenue. P TR P TR
ED < 1 implies that %Qd < %P.
TR = P • Q
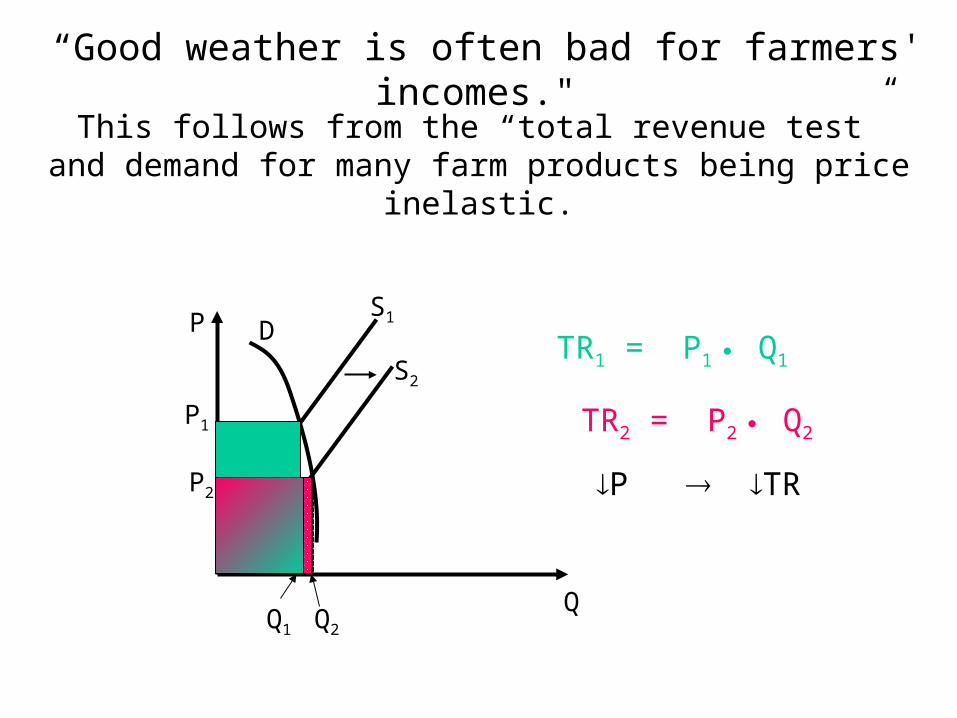
“Good weather is often bad for farmers' incomes."
S1
S2
DP
Q
P1
P2
Q1 Q2
TR1 = P1 Q1
TR2 = P2 Q2
P TR
This follows from the “total revenue test” and demand for many farm products being price inelastic.
Q Q
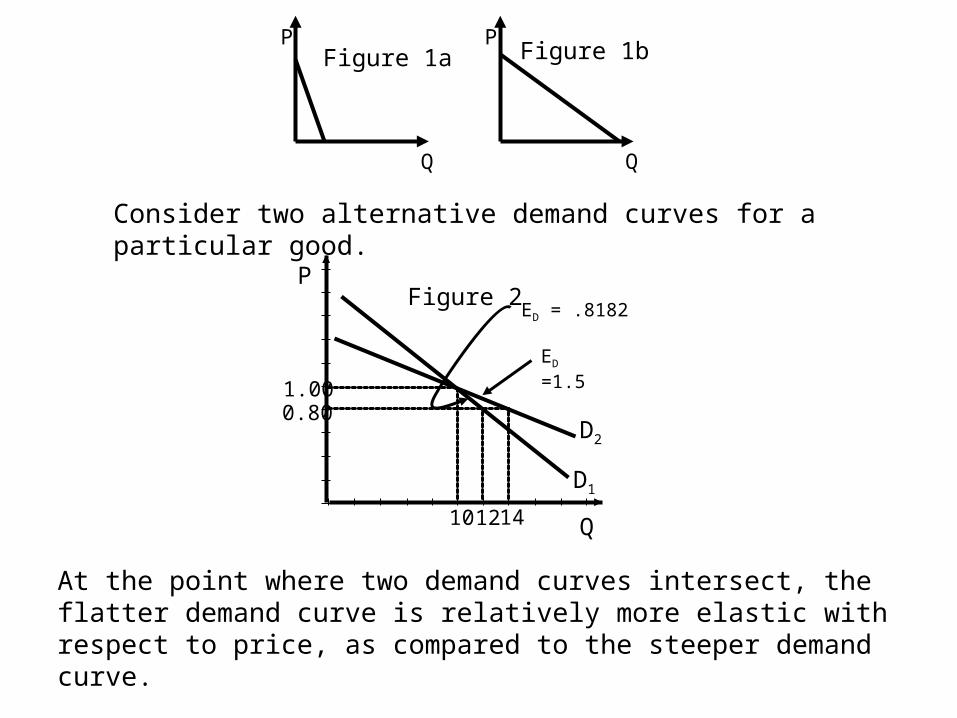
PPFigure 1a Figure 1b
10 12 14
1.000.80
D1
D2
Figure 2
Q
PED = .8182
ED =1.5
At the point where two demand curves intersect, the flatter demand curve is relatively more elastic with respect to price, as compared to the steeper demand curve.
Consider two alternative demand curves for a particular good.
D1
Q
P Sa Sb
P0
P1
Q0 Q2
D2
Q
P Sa Sb
P0
Q0 Q2
D1
D2
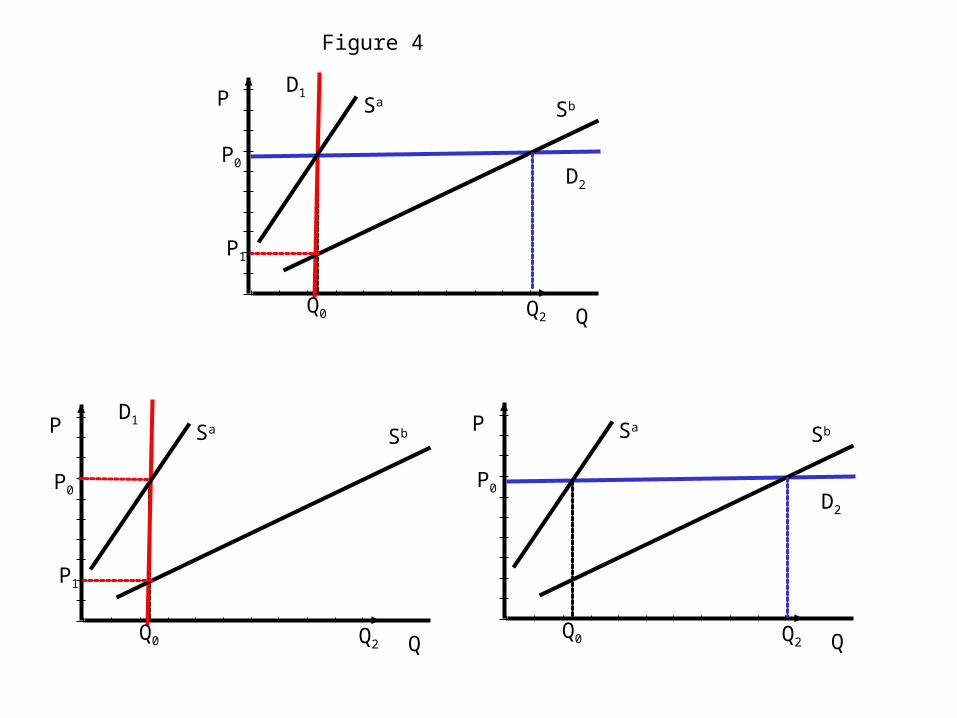
Figure 4
Q
P Sa Sb
P0
P1
Q0 Q2
D1
D2
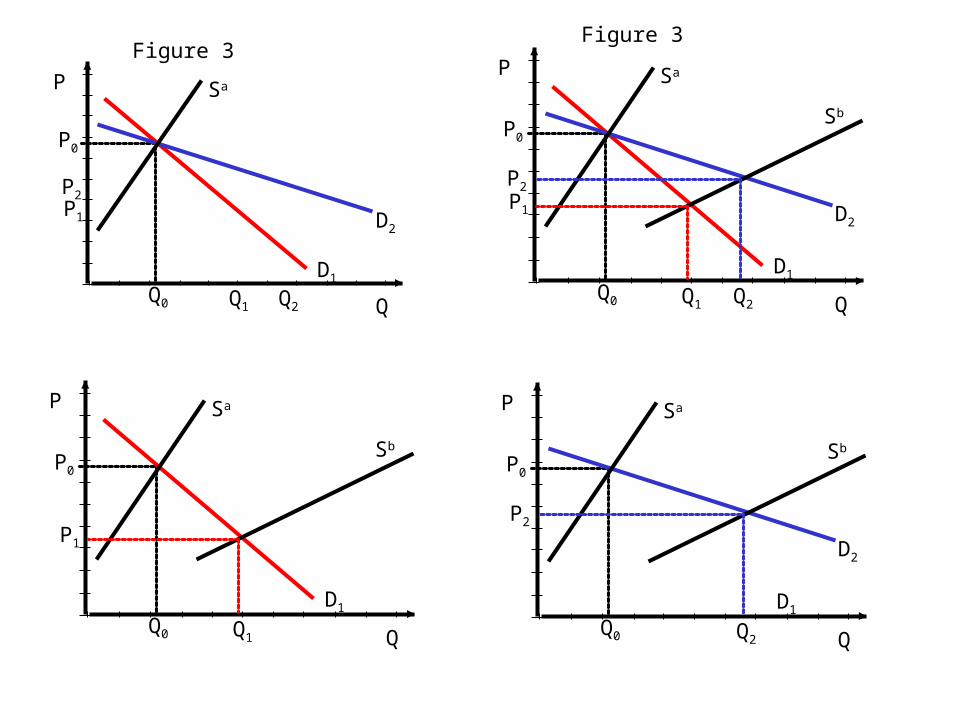
Figure 3
Q
P Sa
P0
P1
P2
Q0 Q1 Q2
D1
D2
Figure 3
Q
P Sa
Sb
P0
P1
P2
Q0 Q1 Q2
D1
Q
P Sa
Sb
P0
P1
Q0 Q1
D1
D2
Q
P Sa
Sb
P0
P2
Q0 Q2
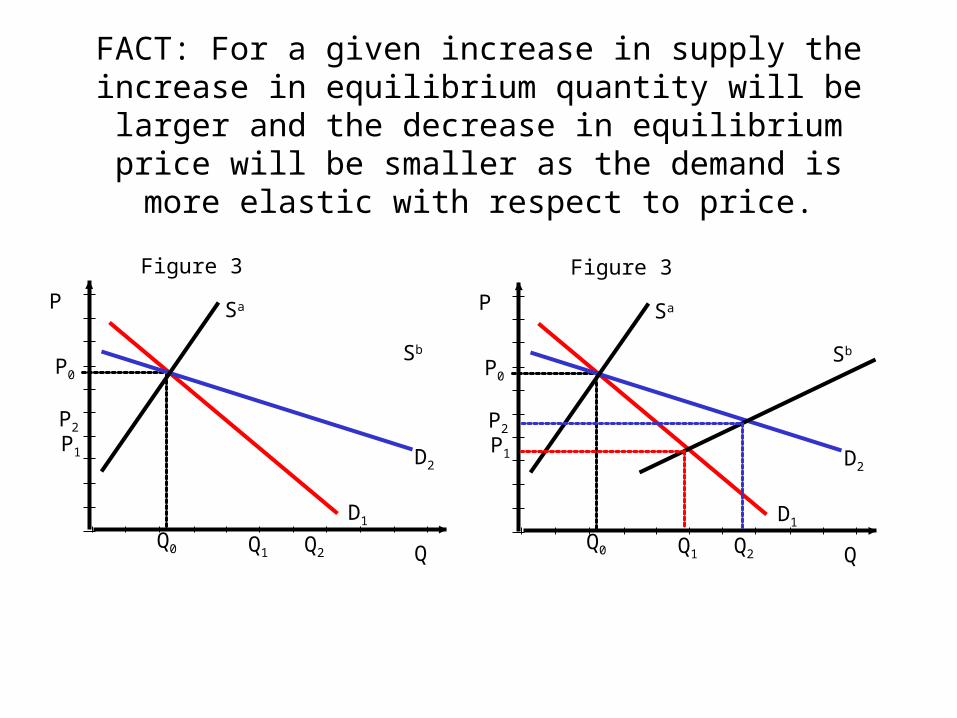
FACT: For a given increase in supply the increase in equilibrium quantity will be larger and the decrease in
equilibrium price will be smaller as the demand is more elastic with respect to price.
D1
D2
Figure 3
Q
P Sa
Sb
P0
P1
P2
Q0 Q1 Q2
D1
D2
Figure 3
Q
P Sa
Sb
P0
P1
P2
Q0 Q1 Q2
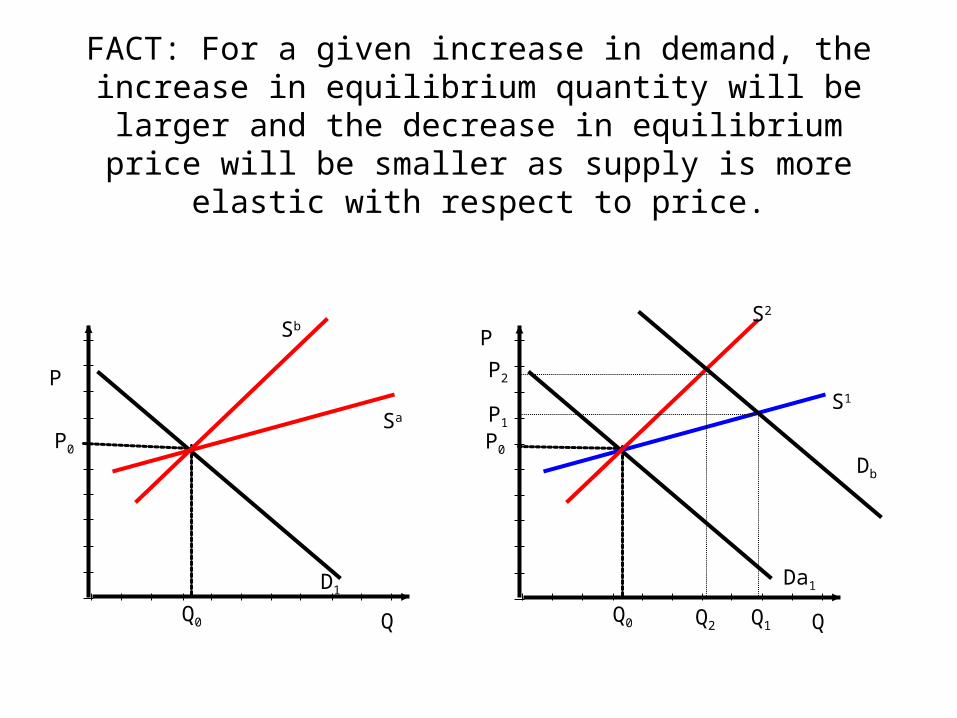
FACT: For a given increase in demand, the increase in equilibrium quantity will be larger and the decrease in
equilibrium price will be smaller as supply is more elastic with respect to price.
D1
Q
P
Sa
P0
Q0
Sb
Da1
Q
P
S1
P0
Q0
S2
Db
Q2 Q1
P1
P2