Embed Size (px)
DESCRIPTION
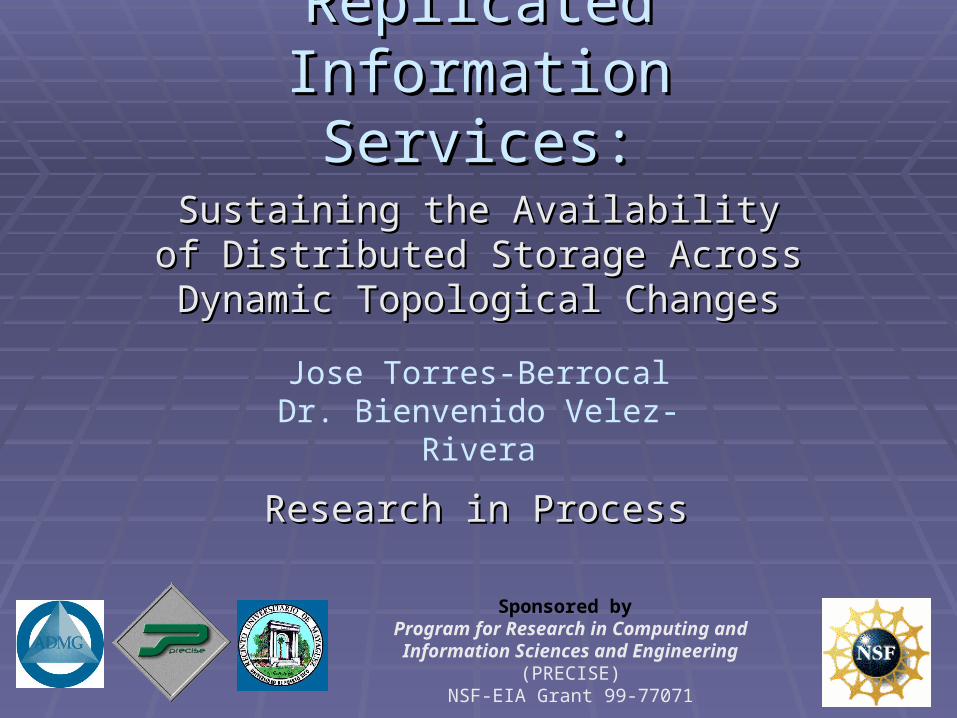
Elastically Replicated Information Services:. Jose Torres-Berrocal Dr. Bienvenido Velez-Rivera. Sustaining the Availability of Distributed Storage Across Dynamic Topological Changes. Research in Process. Sponsored by Program for Research in Computing and - PowerPoint PPT Presentation
Citation preview
11
Elastically Replicated Elastically Replicated Information Services:Information Services:
Sustaining the Availability of Distributed Sustaining the Availability of Distributed Storage Across Dynamic Topological Storage Across Dynamic Topological
ChangesChanges
Sponsored by Program for Research in Computing andInformation Sciences and Engineering
(PRECISE) NSF-EIA Grant 99-77071
Jose Torres-BerrocalDr. Bienvenido Velez-Rivera
Research in ProcessResearch in Process

22
Research ObjectiveResearch Objective
Develop a Method or Algorithm to dynamically Develop a Method or Algorithm to dynamically sustain the availability of a distributed storage sustain the availability of a distributed storage system over a desire threshold value while having system over a desire threshold value while having topology changes.topology changes.
33
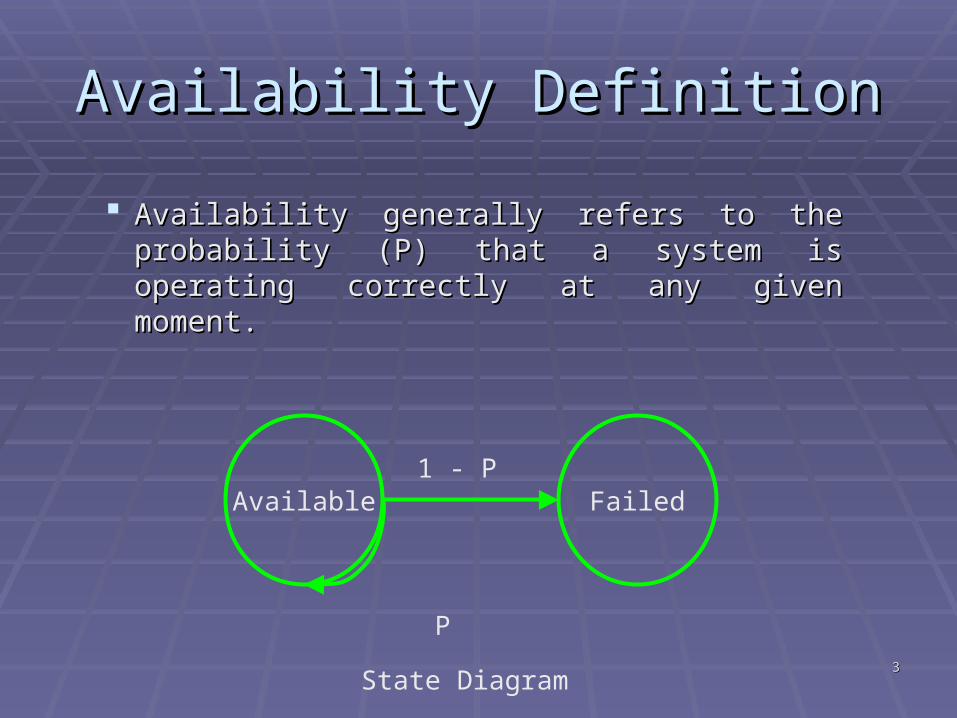
Availability DefinitionAvailability Definition
Availability generally refers to the Availability generally refers to the probability (P) that a system is operating probability (P) that a system is operating correctly at any given moment.correctly at any given moment.
Available Failed1 - P
P
State Diagram
44
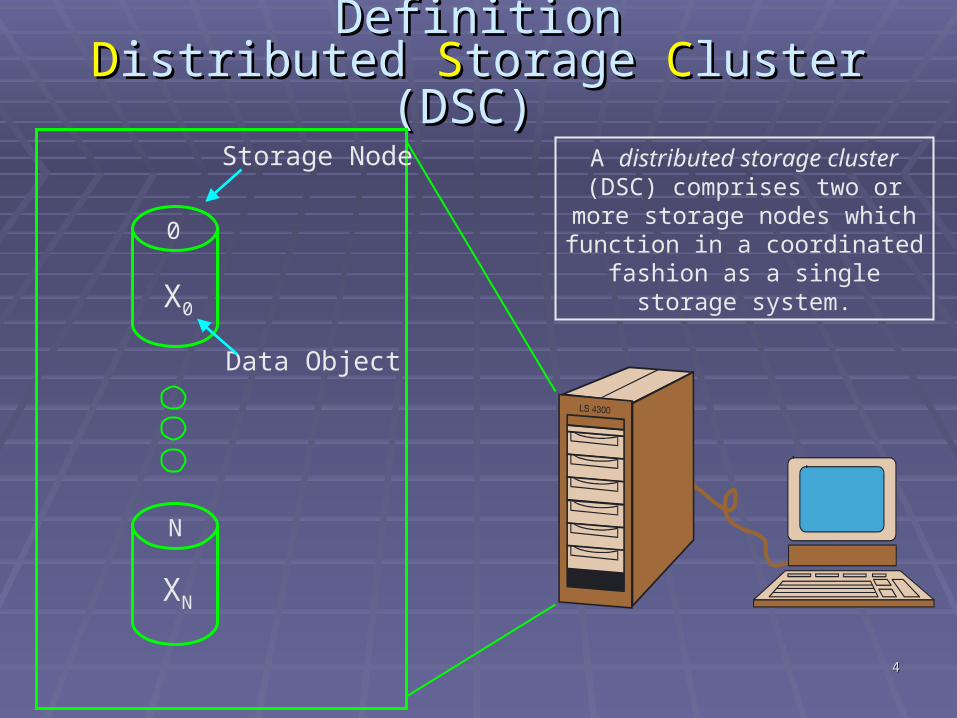
DefinitionDefinitionDDistributed istributed SStorage torage CCluster (DSC)luster (DSC)
Storage Node
X0
XN
Data Object
A distributed storage cluster (DSC) comprises two or more
storage nodes which function in a coordinated fashion as a single
storage system.
0
N
55
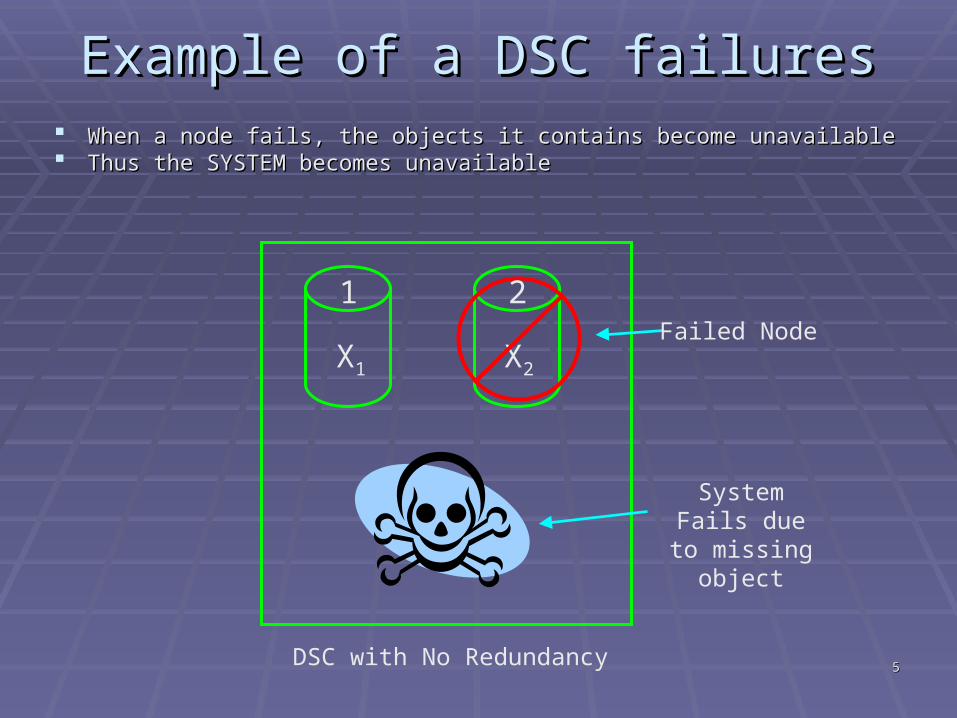
Example of a DSC failuresExample of a DSC failures When a node fails, the objects it contains become unavailableWhen a node fails, the objects it contains become unavailable Thus the SYSTEM becomes unavailableThus the SYSTEM becomes unavailable
DSC with No Redundancy
X1 X2
Failed Node
System Fails due to missing
object
1 2
6650%
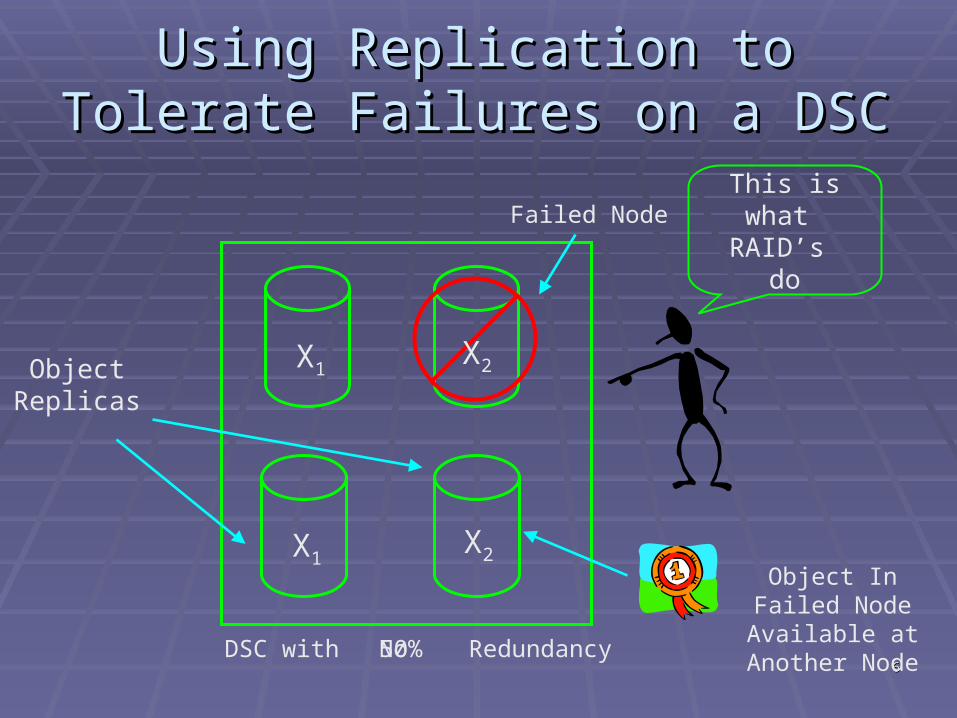
Using Replication toUsing Replication toTolerate Failures on a DSCTolerate Failures on a DSC
DSC with Redundancy
X1
X1X2
X2ObjectReplicas
Object In Failed Node Available at
Another Node
This is what RAID’s
do
Failed Node
No
77
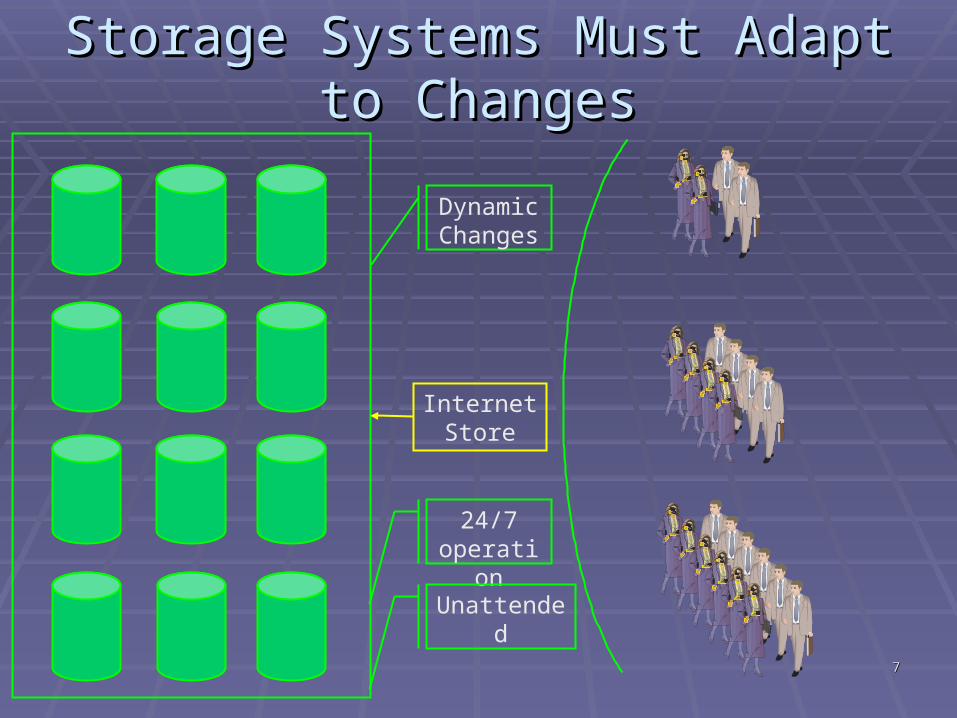
Storage Systems Must Adapt to Storage Systems Must Adapt to ChangesChanges
InternetStore
24/7 operation
Dynamic Changes
Unattended
88
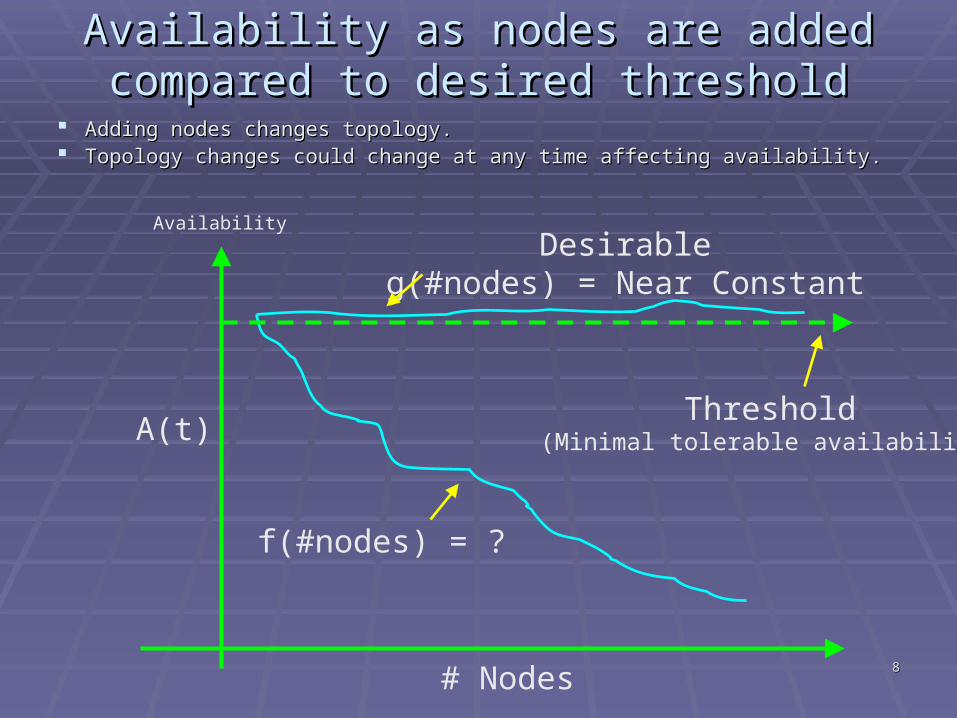
Availability as nodes are addedAvailability as nodes are addedcompared to desired thresholdcompared to desired threshold
Adding nodes changes topology.Adding nodes changes topology. Topology changes could change at any time affecting availability.Topology changes could change at any time affecting availability.
A(t)
Availability
# Nodes
f(#nodes) = ?
Desirableg(#nodes) = Near Constant
Threshold(Minimal tolerable availability)
99
Road MapRoad Map
State the problemState the problem
Solution design constraintsSolution design constraints
Ongoing research Ongoing research
Previous work compliancePrevious work compliance
Preliminary conclusionsPreliminary conclusions
1010
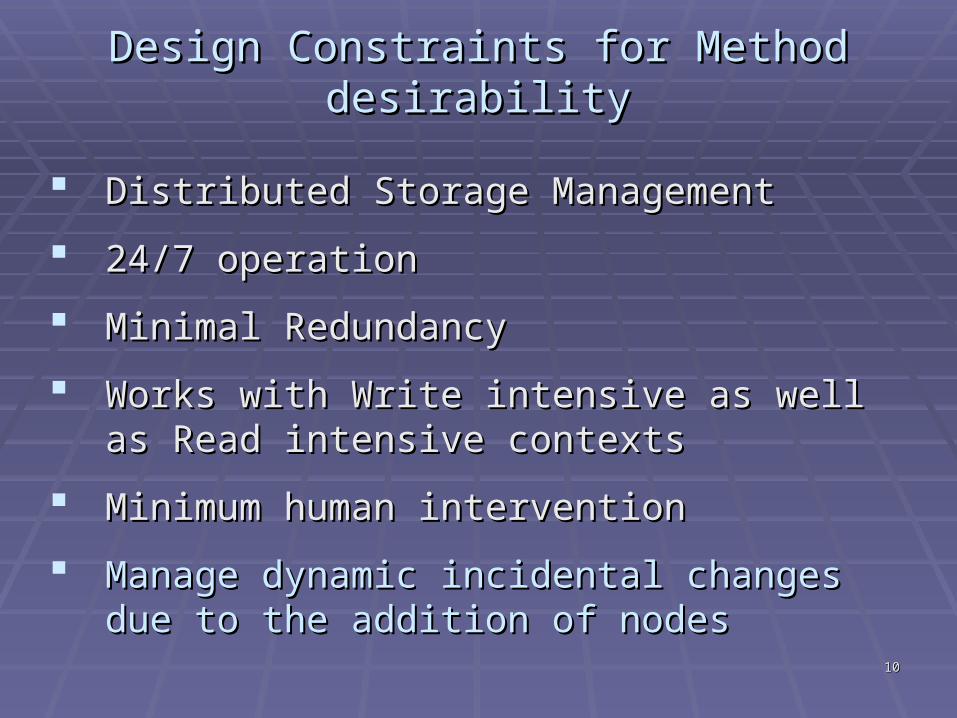
Design Constraints for Method desirabilityDesign Constraints for Method desirability
Distributed Storage ManagementDistributed Storage Management
24/7 operation24/7 operation
Minimal RedundancyMinimal Redundancy
Works with Write intensive as well as Read Works with Write intensive as well as Read intensive contextsintensive contexts
Minimum human interventionMinimum human intervention
Manage dynamic incidental changes due to the Manage dynamic incidental changes due to the addition of nodesaddition of nodes
1111
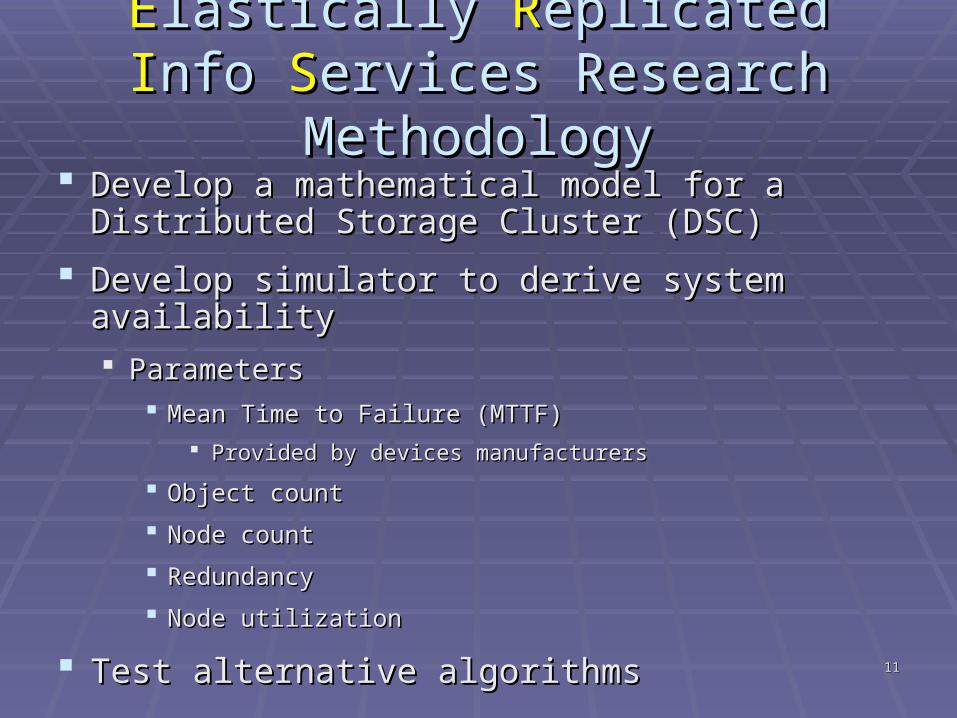
EElastically lastically RReplicated eplicated IInfo nfo SServices ervices Research MethodologyResearch Methodology
Develop a mathematical model for a Distributed Develop a mathematical model for a Distributed Storage Cluster (DSC) Storage Cluster (DSC)
Develop simulator to derive system availabilityDevelop simulator to derive system availability ParametersParameters
Mean Time to Failure (MTTF)Mean Time to Failure (MTTF)
Provided by devices manufacturersProvided by devices manufacturers
Object countObject count
Node countNode count
RedundancyRedundancy
Node utilizationNode utilization
Test alternative algorithmsTest alternative algorithms
1212
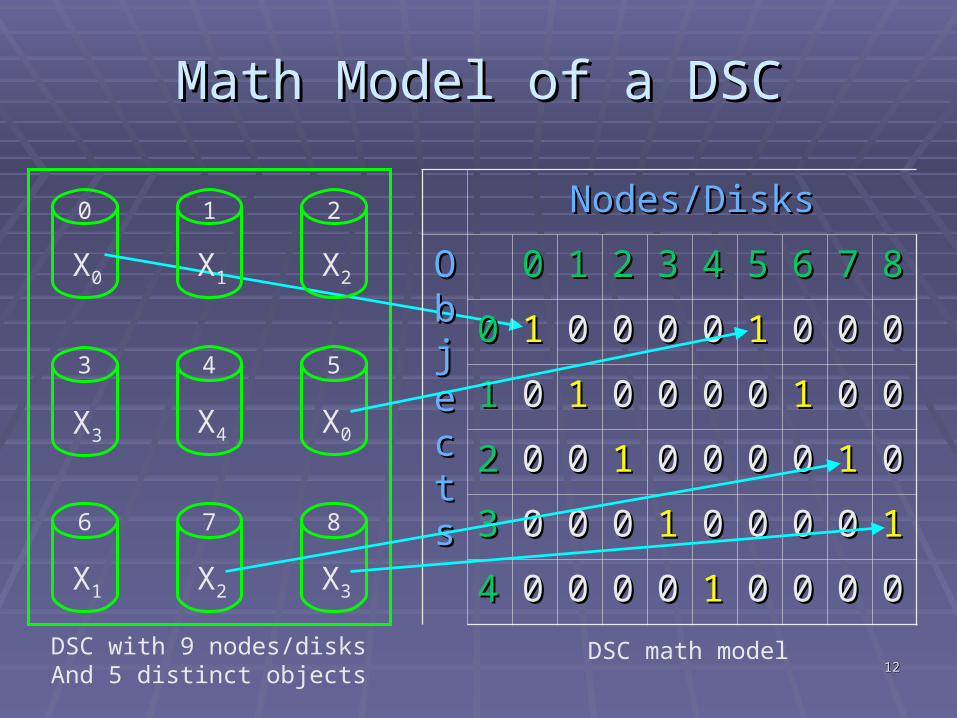
Math Model of a DSCMath Model of a DSC
DSC math model
X0
0
DSC with 9 nodes/disksAnd 5 distinct objects
X3 X4
X2
X0
X3X2X1
X1
876
53 4
21 Nodes/DisksNodes/Disks
OObbjjeeccttss
00 11 22 33 44 55 66 77 88
00 11 00 00 00 00 11 00 00 00
11 00 11 00 00 00 00 11 00 00
22 00 00 11 00 00 00 00 11 00
33 00 00 00 11 00 00 00 00 11
44 00 00 00 00 11 00 00 00 00
1313
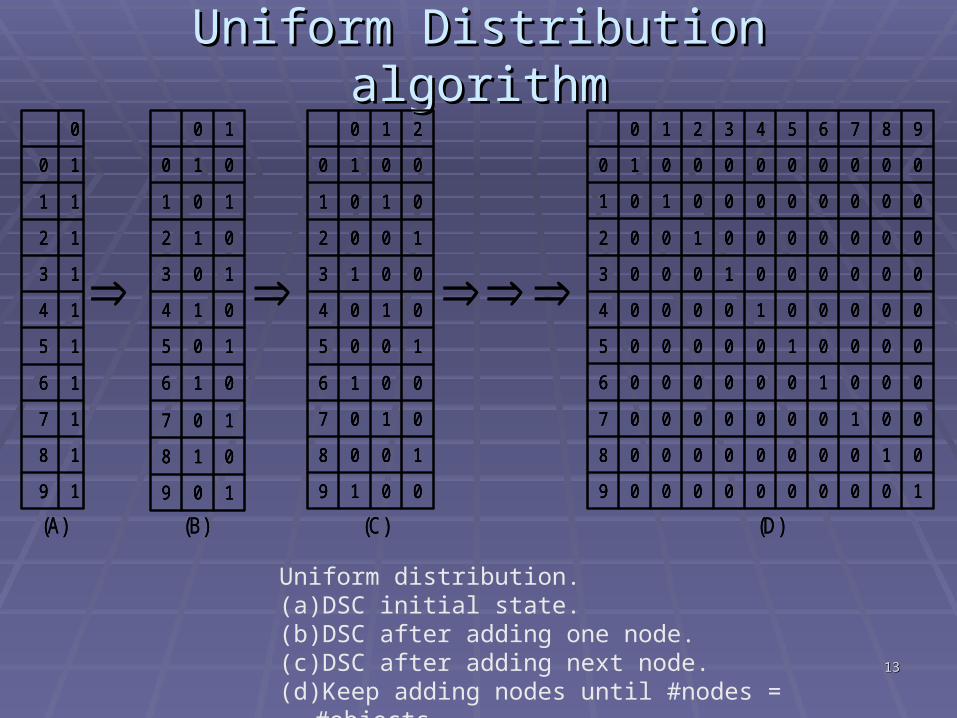
Uniform Distribution algorithmUniform Distribution algorithm
Uniform distribution. (a) DSC initial state. (b) DSC after adding one node. (c) DSC after adding next node. (d) Keep adding nodes until #nodes = #objects.
(D)
(C)(B)(A)
0019
1008
0107
0016
1005
0104
0013
1002
0101
0010
210
0019
1008
0107
0016
1005
0104
0013
1002
0101
0010
210
19
18
17
16
15
14
13
12
11
10
0
19
18
17
16
15
14
13
12
11
10
0
109
018
107
016
105
014
103
012
101
010
10
109
018
107
016
105
014
103
012
101
010
10
10000000009
01000000008
00100000007
00010000006
00001000005
00000100004
00000010003
00000001002
00000000101
00000000010
9876543210
10000000009
01000000008
00100000007
00010000006
00001000005
00000100004
00000010003
00000001002
00000000101
00000000010
9876543210
1414
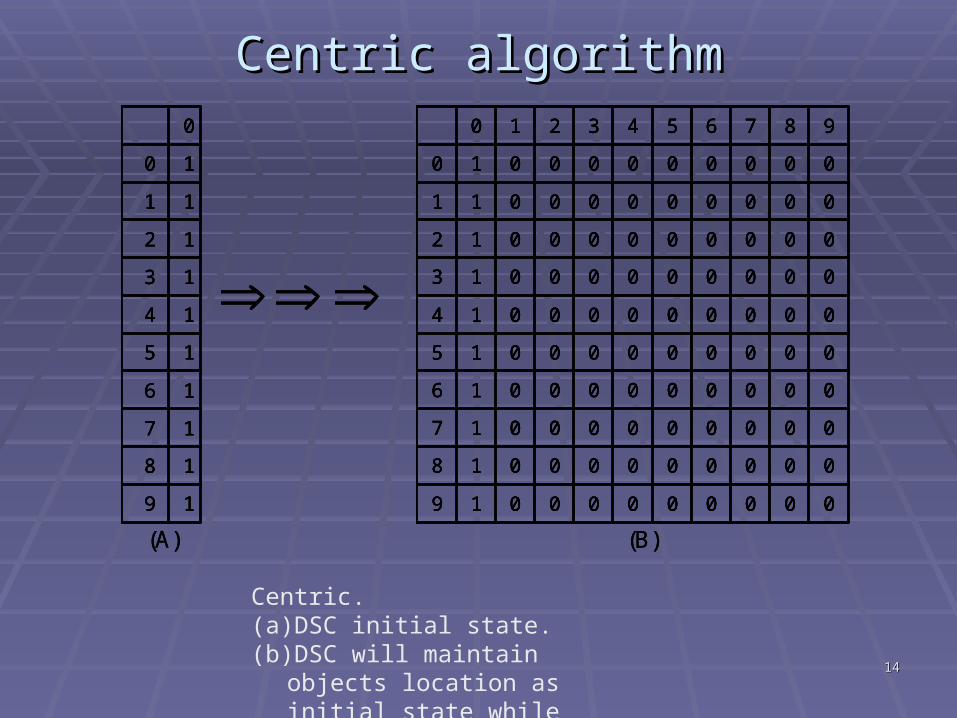
Centric algorithmCentric algorithm
Centric. (a) DSC initial state. (b) DSC will maintain objects location
as initial state while adding nodes.
(B)(A)
19
18
17
16
15
14
13
12
11
10
0
19
18
17
16
15
14
13
12
11
10
0
00000000019
00000000018
00000000017
00000000016
00000000015
00000000014
00000000013
00000000012
00000000011
00000000010
9876543210
00000000019
00000000018
00000000017
00000000016
00000000015
00000000014
00000000013
00000000012
00000000011
00000000010
9876543210
1515
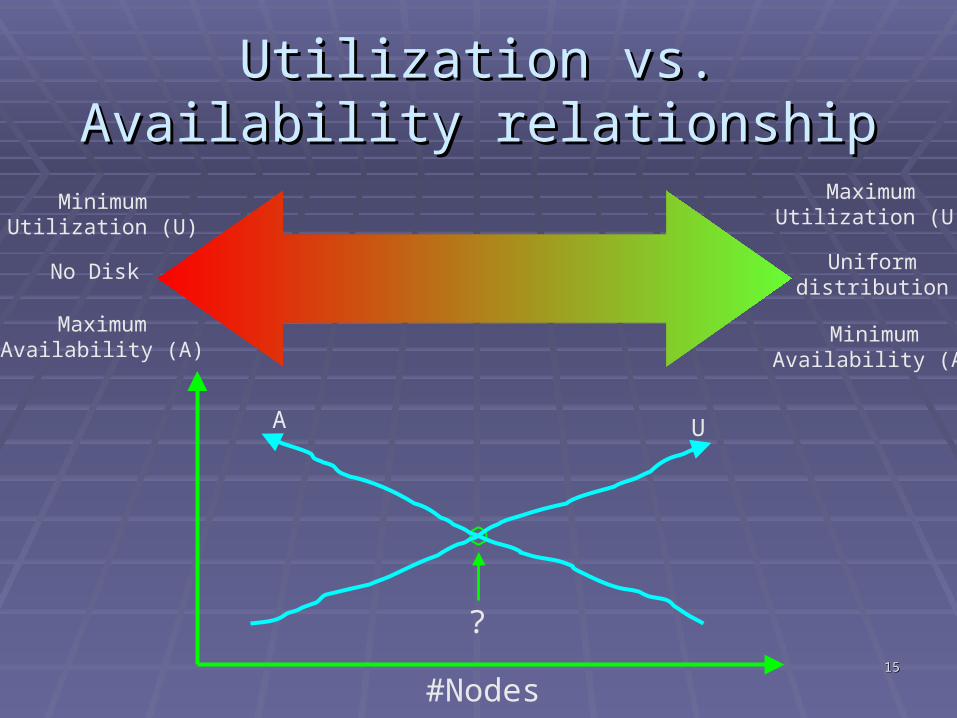
Utilization vs. Availability Utilization vs. Availability relationshiprelationship
Uniformdistribution
No Disk
MinimumAvailability (A)
MaximumUtilization (U)
MaximumAvailability (A)
MinimumUtilization (U)
A U
?
#Nodes
1616
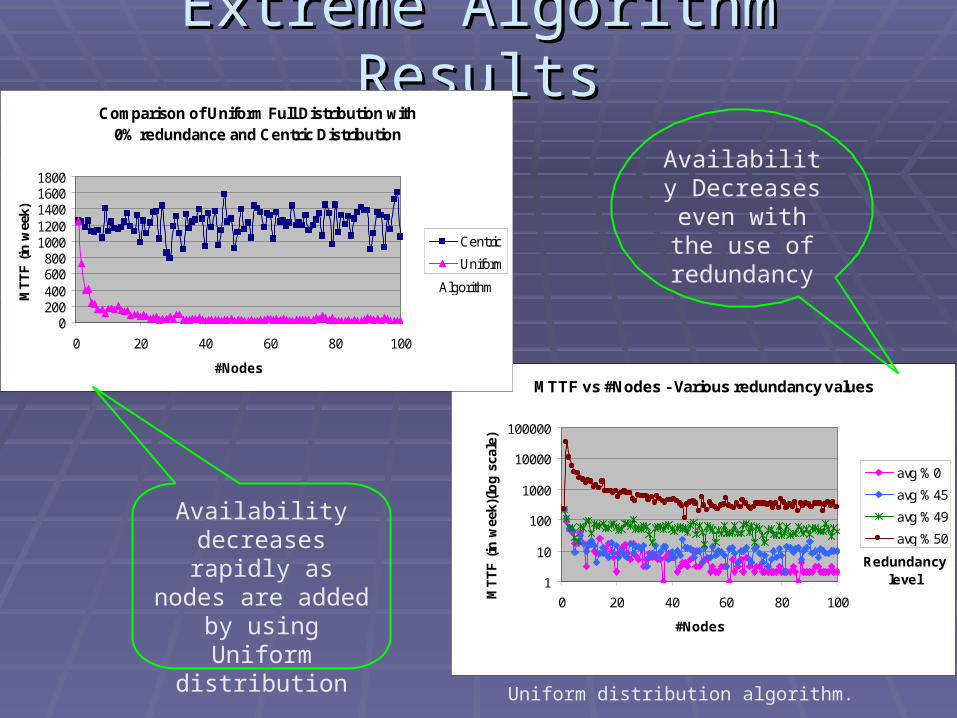
Extreme Algorithm ResultsExtreme Algorithm Results
Uniform distribution algorithm.
MTTF vs #Nodes - Various redundancy values
1
10
100
1000
10000
100000
0 20 40 60 80 100
#Nodes
MT
TF
(in
wee
k)(l
og
sca
le)
avg %0
avg %45
avg %49
avg %50
Redundancylevel
Comparison of Uniform Full Distribution with 0% redundance and Centric Distribution
0200400600800
10001200140016001800
0 20 40 60 80 100
#Nodes
MT
TF
(in
wee
k)
Centric
Uniform
Algorithm
Availability Decreases
even with the use of
redundancy
Availability decreases rapidly as nodes are added by
using Uniform distribution

1717
DSC Hybrid Model – DSC Hybrid Model –
Redundancy CalculationRedundancy Calculation
00000000109
00000000018
00000000107
Down20%00000000016
00000010105
00000001014
00000010103
00000001012
00000010101
Up40%00000001010
Redundancy60%9876543210
00000000019
00000000018
00000000017
Down10%00000000016
00000010105
00000001014
00000010103
00000001012
00000010101
Up40%00000001010
Redundancy60%9876543210
DSC Matrix visualization – hybrid distribution.
10 original objects.
6 out of 10 copies
1818
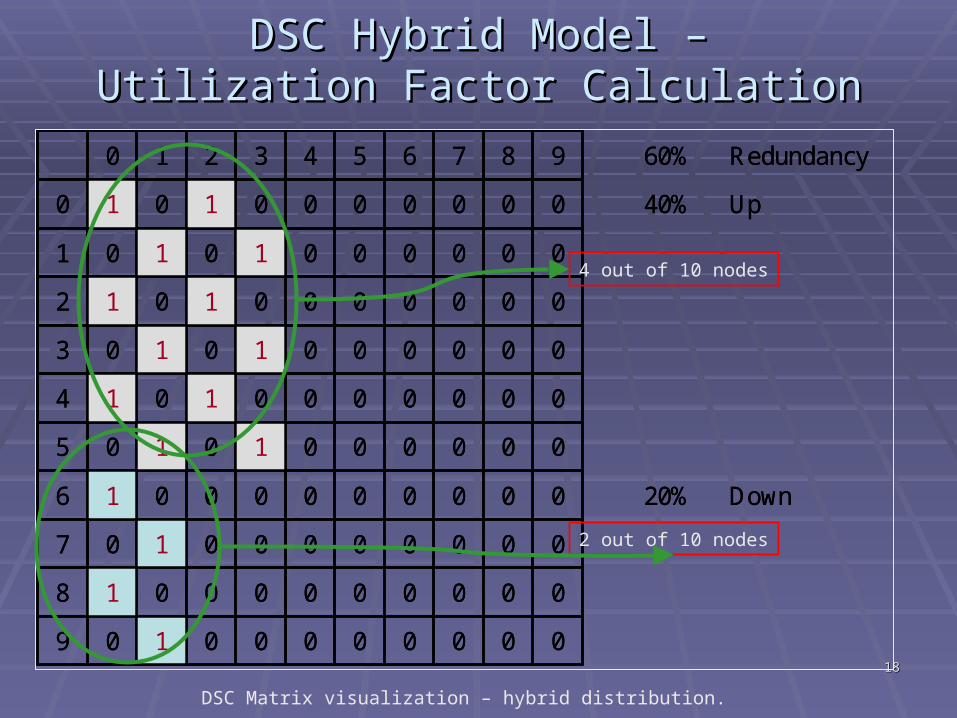
DSC Hybrid Model –DSC Hybrid Model –Utilization Factor CalculationUtilization Factor Calculation
00000000109
00000000018
00000000107
Down20%00000000016
00000010105
00000001014
00000010103
00000001012
00000010101
Up40%00000001010
Redundancy60%9876543210
00000000019
00000000018
00000000017
Down10%00000000016
00000010105
00000001014
00000010103
00000001012
00000010101
Up40%00000001010
Redundancy60%9876543210
DSC Matrix visualization – hybrid distribution.
4 out of 10 nodes
2 out of 10 nodes
1919
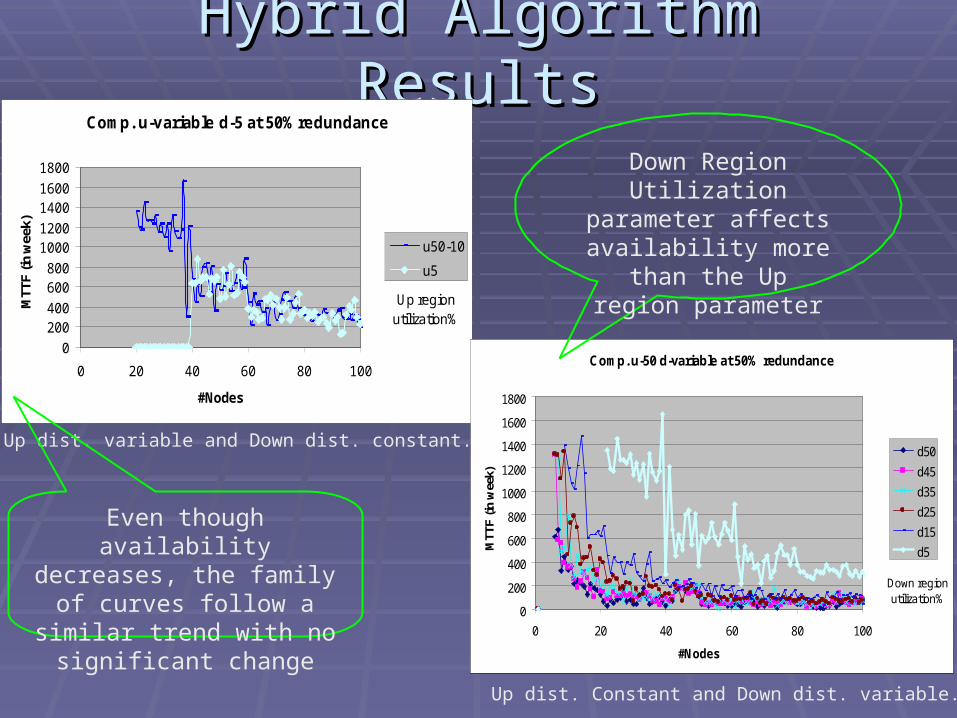
Hybrid Algorithm ResultsHybrid Algorithm Results
Up dist. variable and Down dist. constant.
Up dist. Constant and Down dist. variable.
Comp. u-variable d-5 at 50% redundance
0
200400
600800
10001200
14001600
1800
0 20 40 60 80 100
#Nodes
MTT
F (in
wee
k)
u50-10
u5
Up region utilization%
Comp. u-50 d-variable at 50% redundance
0
200
400
600
800
1000
1200
1400
1600
1800
0 20 40 60 80 100
#Nodes
MTT
F (in
wee
k)
d50
d45
d35
d25
d15
d5
Down region utilization%
Down Region Utilization parameter
affects availability more than the Up region
parameter
Even though availability decreases, the family of
curves follow a similar trend with no significant change
2020
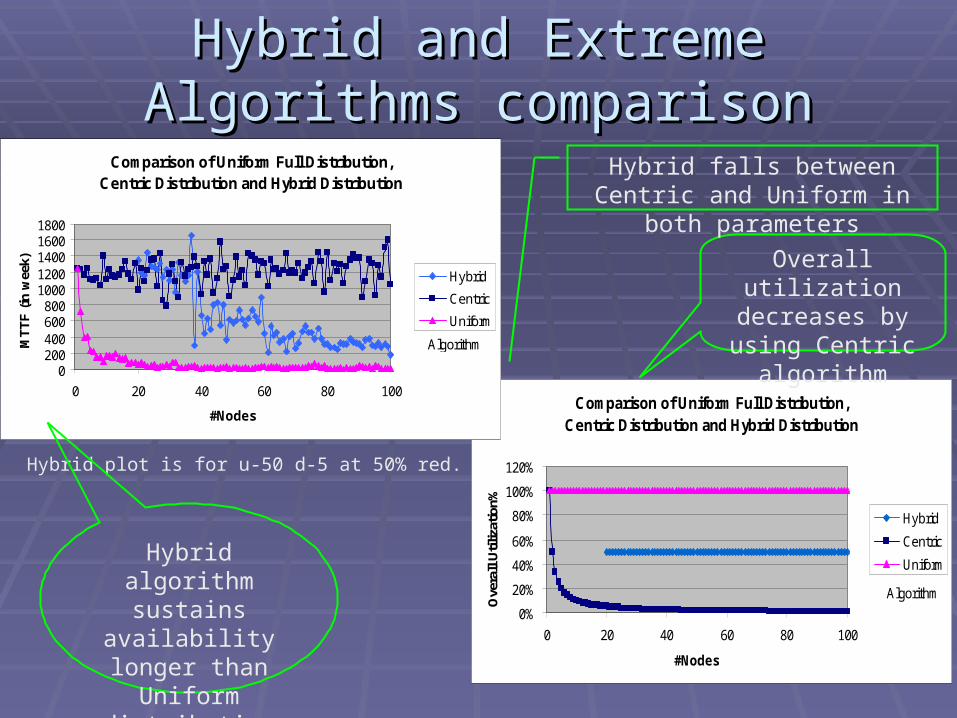
Hybrid and Extreme Algorithms Hybrid and Extreme Algorithms comparisoncomparison
Hybrid plot is for u-50 d-5 at 50% red.
Comparison of Uniform Full Distribution, Centric Distribution and Hybrid Distribution
0%
20%
40%
60%
80%
100%
120%
0 20 40 60 80 100
#Nodes
Ove
rall
Util
izat
ion%
Hybrid
Centric
Uniform
Algorithm
Comparison of Uniform Full Distribution, Centric Distribution and Hybrid Distribution
0200400600800
10001200140016001800
0 20 40 60 80 100
#Nodes
MT
TF
(in
wee
k)
Hybrid
Centric
Uniform
Algorithm
Overall utilization decreases by using Centric algorithm
Hybrid algorithm sustains
availability longer than Uniform distribution
Hybrid falls between Centric and Uniform in both parameters
2121
Current Methods to Comply With Current Methods to Comply With Design ConstraintsDesign Constraints
Consensus BasedConsensus Based CacheCache RAIDRAID Data TradingData Trading
2222
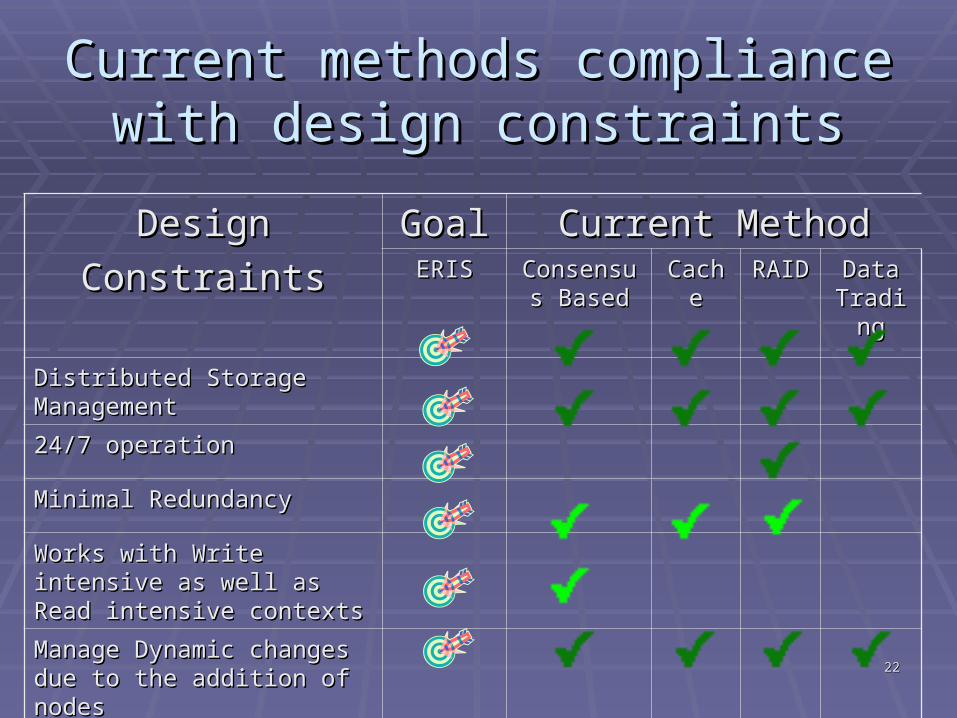
Current methods compliance with Current methods compliance with design constraintsdesign constraints
DesignDesign
ConstraintsConstraints
GoalGoal Current MethodCurrent MethodERISERIS Consensus Consensus
BasedBasedCacheCache RAIDRAID Data Data
TradingTrading
Distributed Storage Distributed Storage ManagementManagement
24/7 operation24/7 operation
Minimal RedundancyMinimal Redundancy
Works with Write intensive as Works with Write intensive as well as Read intensive contextswell as Read intensive contexts
Manage Dynamic changes due Manage Dynamic changes due to the addition of nodesto the addition of nodes
Minimum human interventionMinimum human intervention
2323
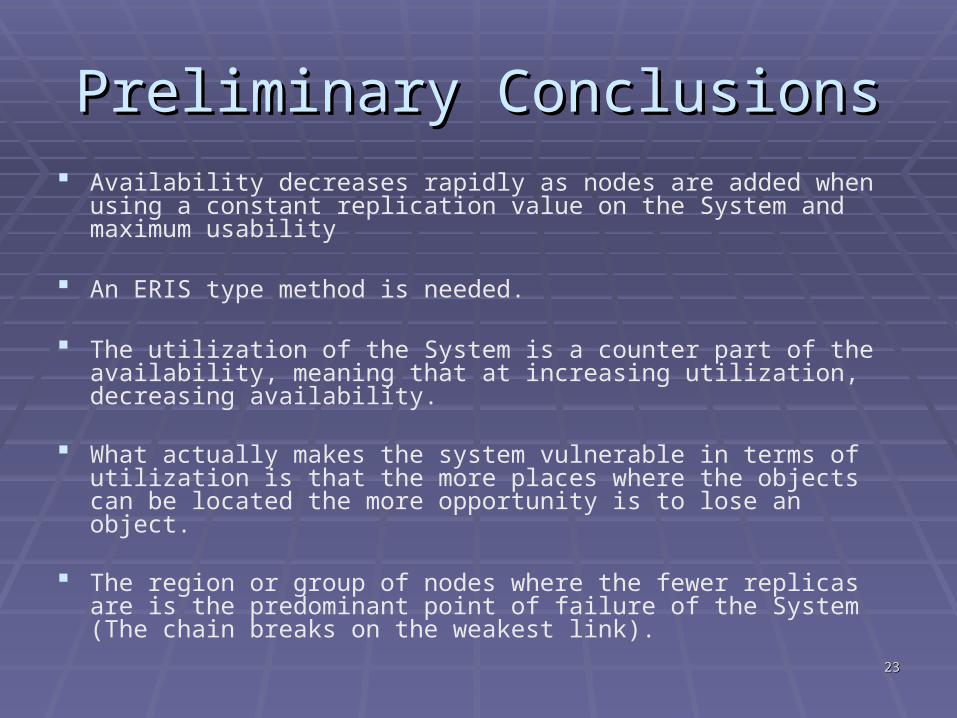
Preliminary ConclusionsPreliminary Conclusions Availability decreases rapidly as nodes are added when using a
constant replication value on the System and maximum usability
An ERIS type method is needed.
The utilization of the System is a counter part of the availability, meaning that at increasing utilization, decreasing availability.
What actually makes the system vulnerable in terms of utilization is that the more places where the objects can be located the more opportunity is to lose an object.
The region or group of nodes where the fewer replicas are is the predominant point of failure of the System (The chain breaks on the weakest link).

2424

2525
2626
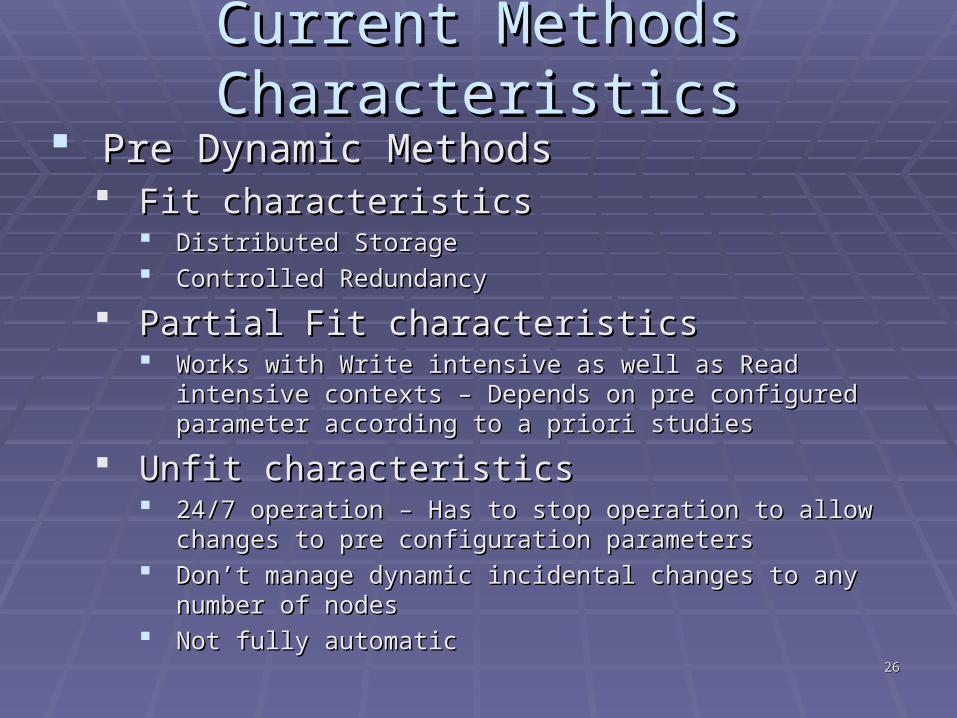
Current Methods CharacteristicsCurrent Methods Characteristics Pre Dynamic MethodsPre Dynamic Methods
Fit characteristicsFit characteristics Distributed StorageDistributed Storage Controlled RedundancyControlled Redundancy
Partial Fit characteristicsPartial Fit characteristics Works with Write intensive as well as Read intensive contexts – Works with Write intensive as well as Read intensive contexts –
Depends on pre configured parameter according to a priori Depends on pre configured parameter according to a priori studiesstudies
Unfit characteristicsUnfit characteristics 24/7 operation – Has to stop operation to allow changes to pre 24/7 operation – Has to stop operation to allow changes to pre
configuration parametersconfiguration parameters Don’t manage dynamic incidental changes to any number of Don’t manage dynamic incidental changes to any number of
nodesnodes Not fully automaticNot fully automatic

2727
Consensus Based CharacteristicsConsensus Based Characteristics
2828
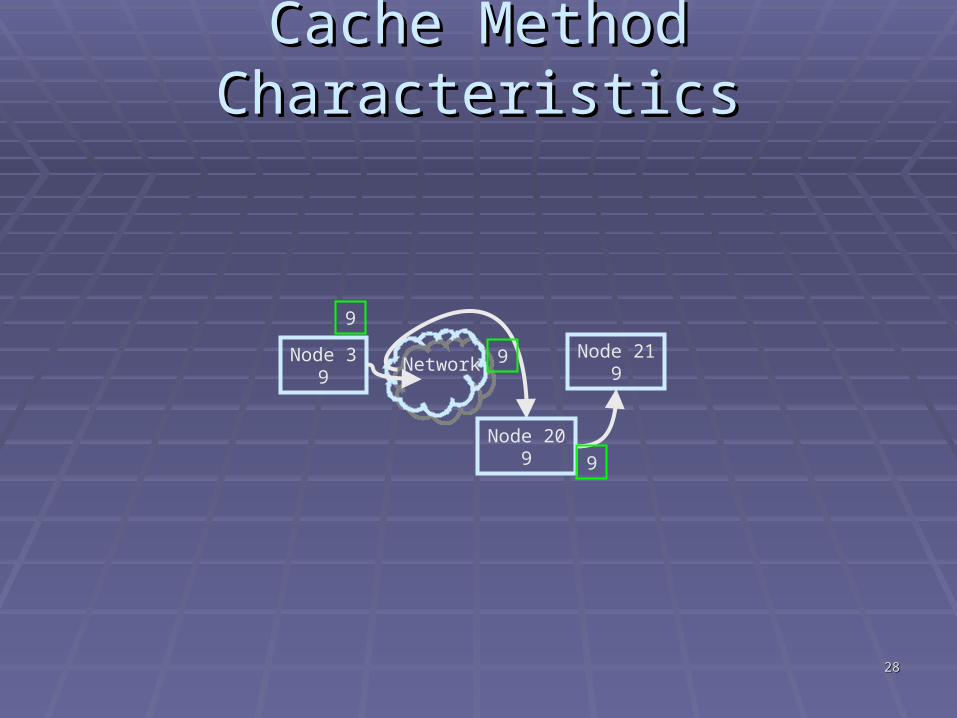
Cache Method CharacteristicsCache Method Characteristics
NetworkNode 39
Node 219
Node 209 9
9
9
2929
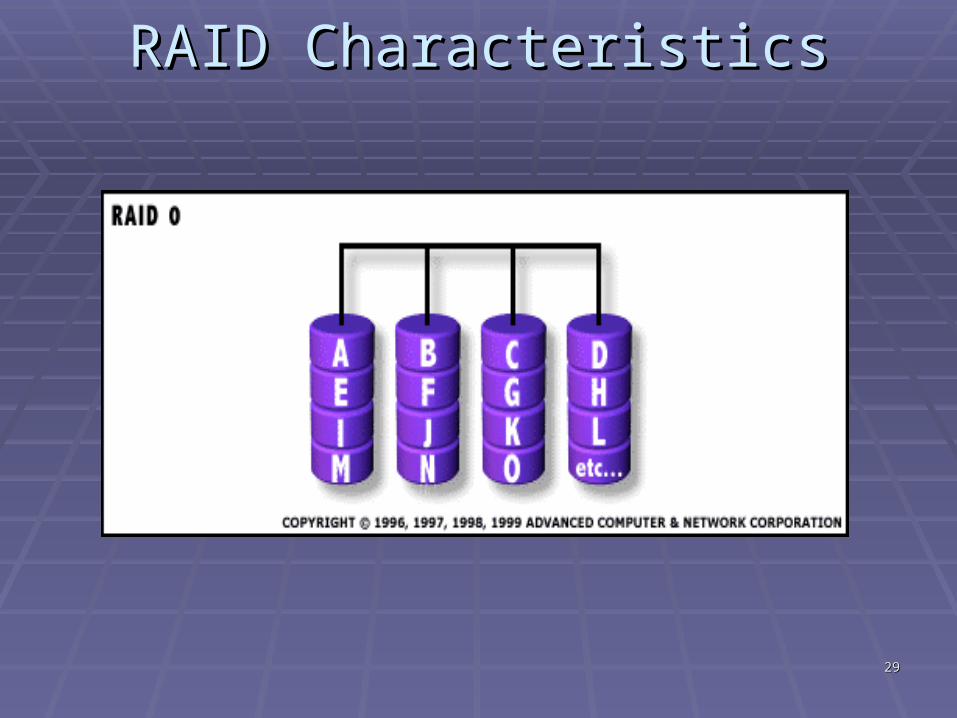
RAID CharacteristicsRAID Characteristics

3030
Node 8
Node 6Node 3A
B
C
Node 3
D
B
A C
B
Data Trading CharacteristicsData Trading Characteristics
3131
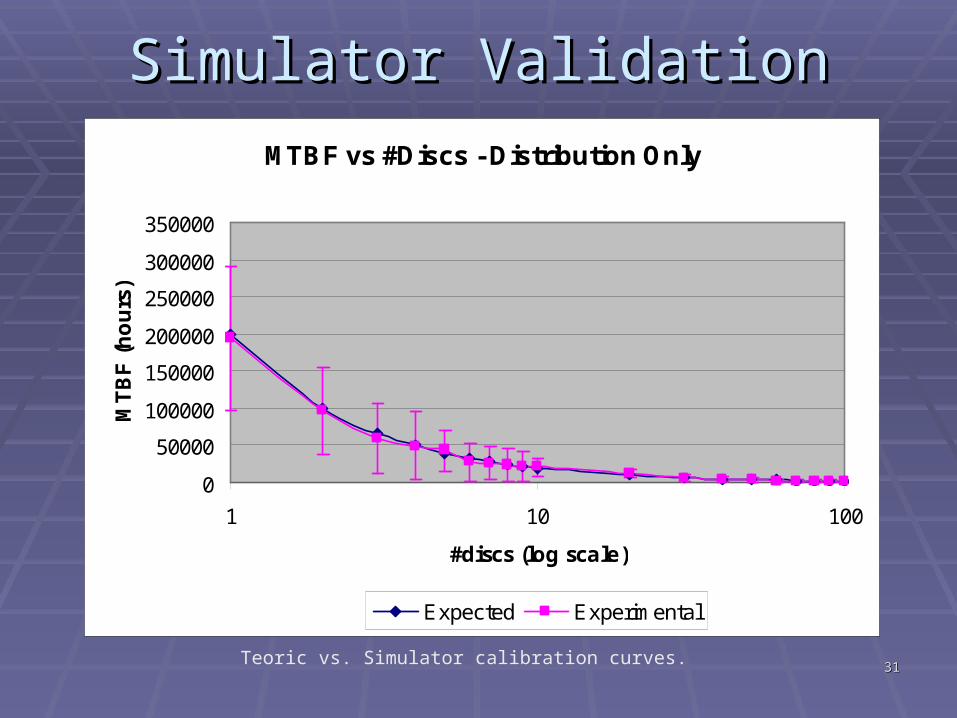
Simulator ValidationSimulator ValidationMTBF vs #Discs - Distribution Only
0
50000
100000
150000
200000
250000
300000
350000
1 10 100
#discs (log scale)
MT
BF
(h
ou
rs)
Expected Experimental
Teoric vs. Simulator calibration curves.