Embed Size (px)
Citation preview
Restricted © Siemens AG 2013 All rights reserved.
2013-04 Page 1
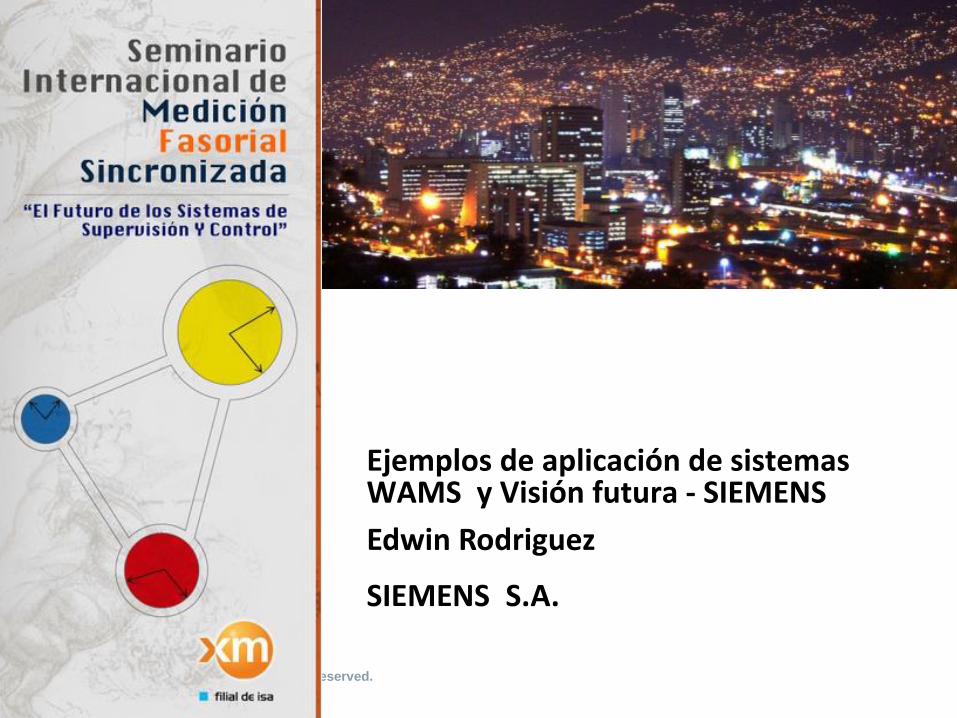
Ejemplos de aplicación de sistemas WAMS y Visión futura - SIEMENS
Edwin Rodriguez
SIEMENS S.A.
Restricted © Siemens AG 2013 All rights reserved.
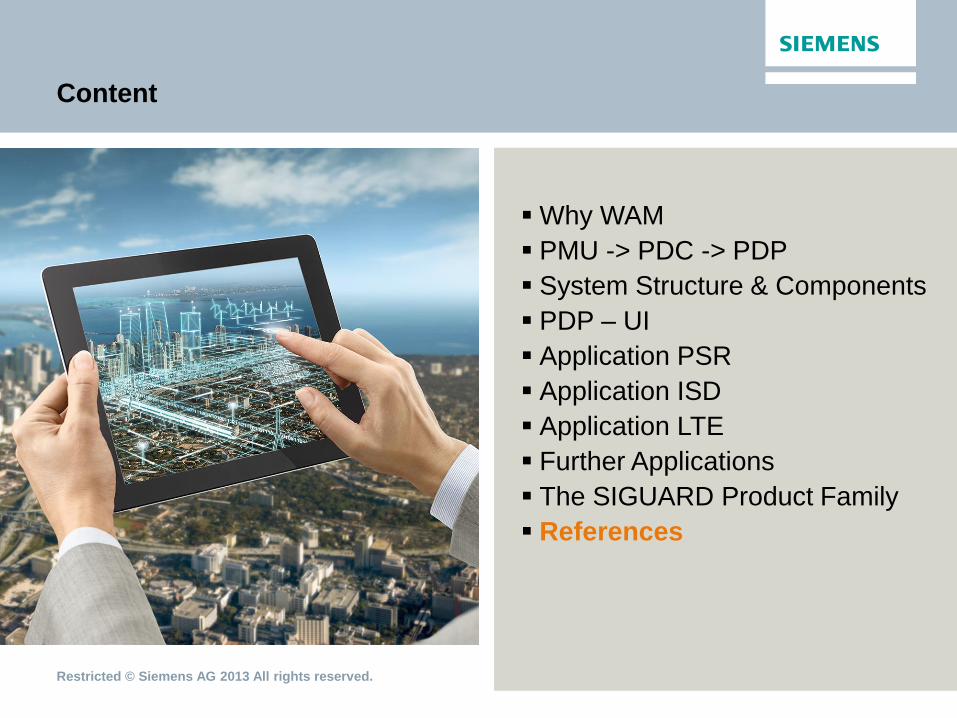
Content
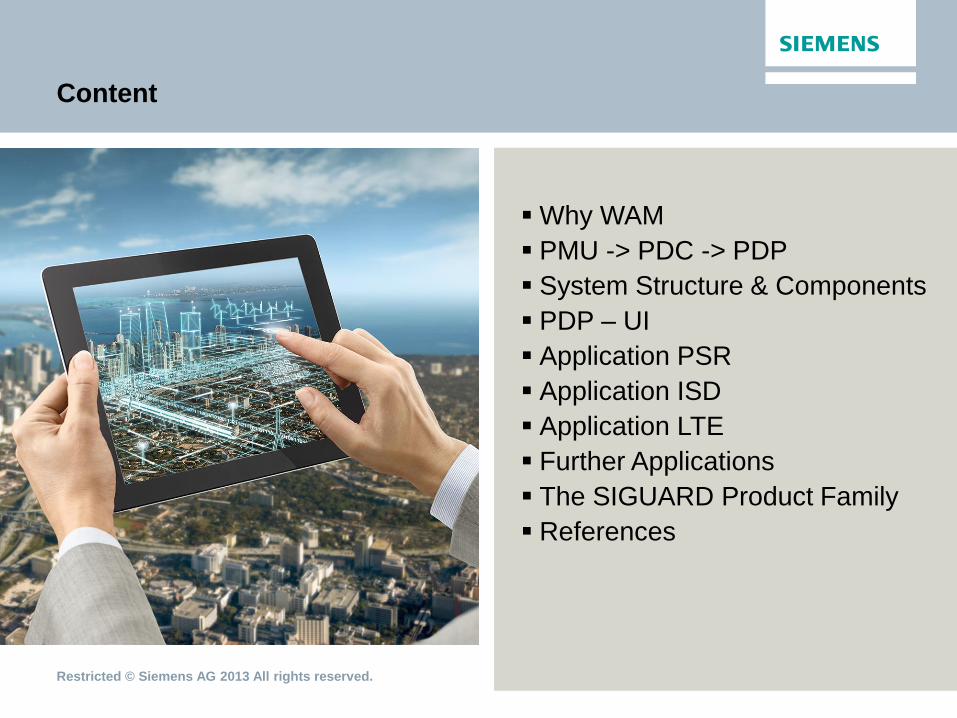
Why WAM
PMU -> PDC -> PDP
System Structure & Components
PDP – UI
Application PSR
Application ISD
Application LTE
Further Applications
The SIGUARD Product Family
References
Restricted © Siemens AG 2013 All rights reserved.
SIGUARD PDP
What is a phasor?
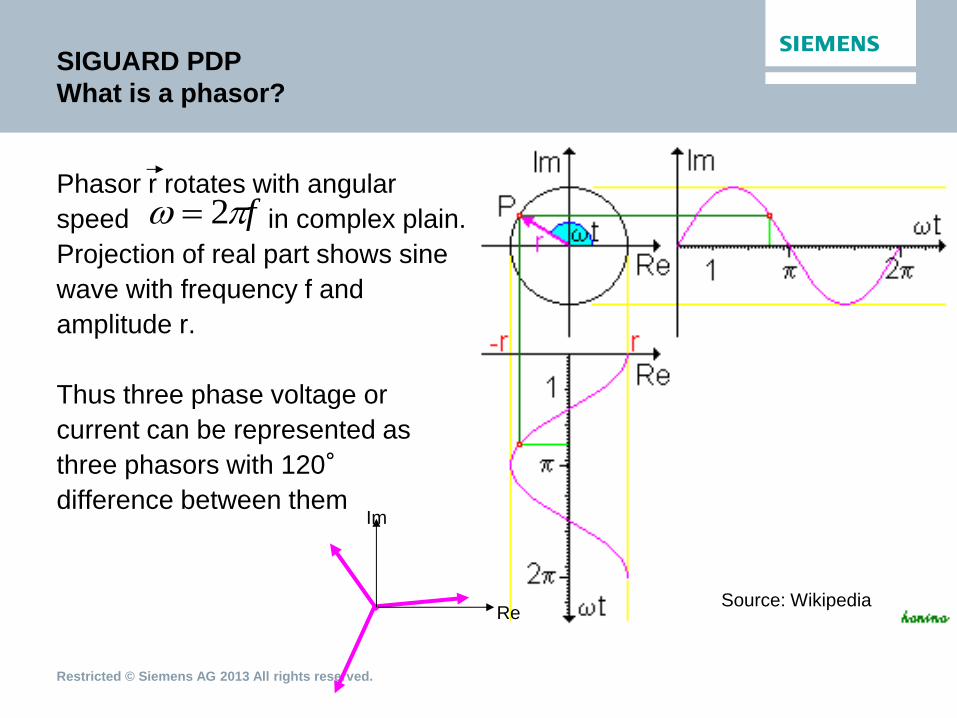
Phasor r rotates with angular
speed in complex plain.
Projection of real part shows sine
wave with frequency f and
amplitude r.
Thus three phase voltage or
current can be represented as
three phasors with 120°
difference between them
Source: Wikipedia Re
Im
f 2
Restricted © Siemens AG 2013 All rights reserved.
Introduction
Why should we measure phasors?
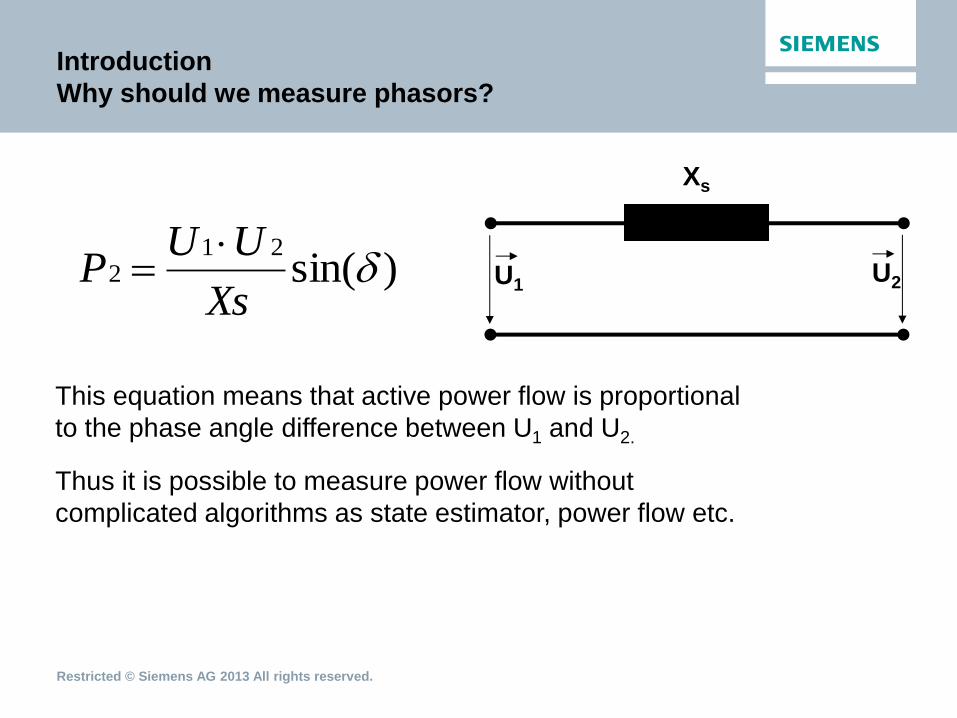
Xs
U1 U2 )sin(
212
Xs
UUP
This equation means that active power flow is proportional
to the phase angle difference between U1 and U2.
Thus it is possible to measure power flow without
complicated algorithms as state estimator, power flow etc.
Restricted © Siemens AG 2013 All rights reserved.
Comparison
RTU vs Phasor Measurement Unit
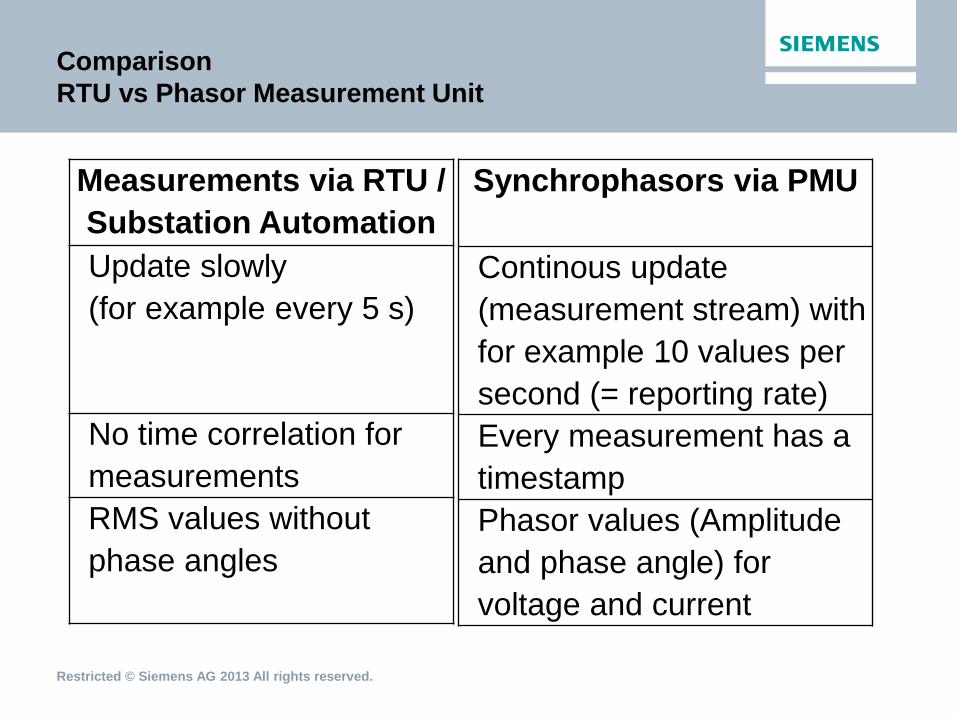
Measurements via RTU /
Substation Automation
Update slowly
(for example every 5 s)
No time correlation for
measurements
RMS values without
phase angles
Synchrophasors via PMU
Continous update
(measurement stream) with
for example 10 values per
second (= reporting rate)
Every measurement has a
timestamp
Phasor values (Amplitude
and phase angle) for
voltage and current

Restricted © Siemens AG 2013 All rights reserved.
Content
Why WAM
PMU -> PDC -> PDP
System Structure & Components
PDP – UI
Application PSR
Application ISD
Application LTE
Further Applications
The SIGUARD Product Family
References
Restricted © Siemens AG 2013 All rights reserved.
SIGUARD Phasor Data Processor
How to measure phasors
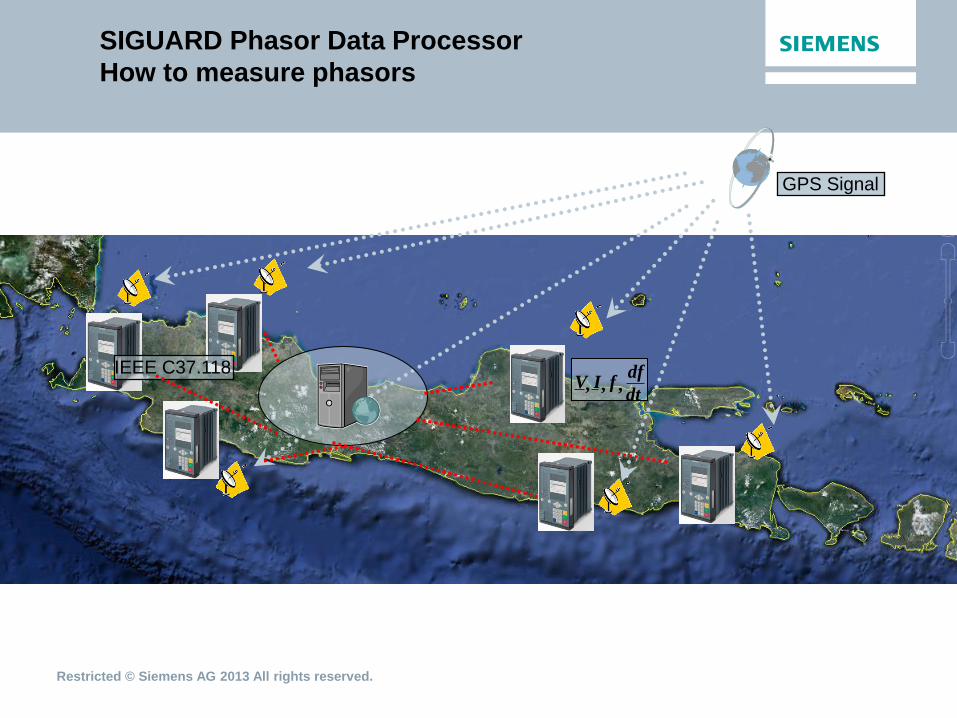
GPS Signal
V dt
df f I , , ,
IEEE C37.118
Restricted © Siemens AG 2013 All rights reserved.
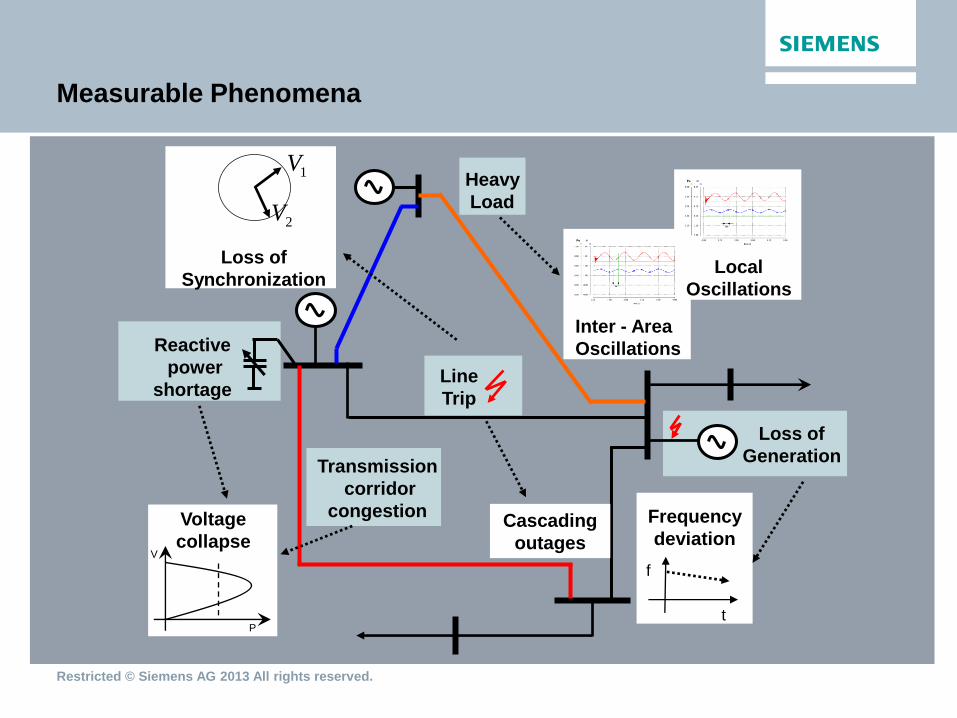
Measurable Phenomena
Inter - Area
Oscillations
1V
2V
Loss of
Synchronization
Line
Trip
f
t
Cascading
outages
P
V
Voltage
collapse
Reactive
power
shortage
Transmission
corridor
congestion
Heavy
Load
Loss of
Generation
Frequency
deviation
Local
Oscillations
Restricted © Siemens AG 2013 All rights reserved.
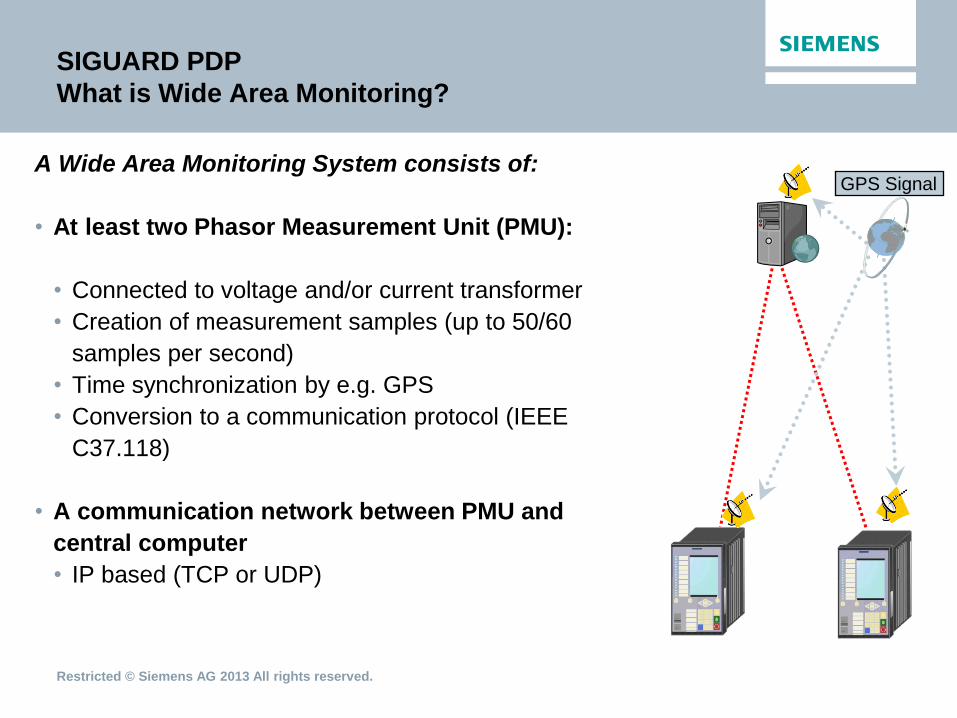
SIGUARD PDP
What is Wide Area Monitoring?
A Wide Area Monitoring System consists of:
• At least two Phasor Measurement Unit (PMU):
• Connected to voltage and/or current transformer
• Creation of measurement samples (up to 50/60
samples per second)
• Time synchronization by e.g. GPS
• Conversion to a communication protocol (IEEE
C37.118)
• A communication network between PMU and
central computer
• IP based (TCP or UDP)
GPS Signal

Restricted © Siemens AG 2013 All rights reserved.
Content
Why WAM
PMU -> PDC -> PDP
System Structure & Components
PDP – UI
Application PSR
Application ISD
Application LTE
Further Applications
The SIGUARD Product Family
References
Restricted © Siemens AG 2013 All rights reserved.
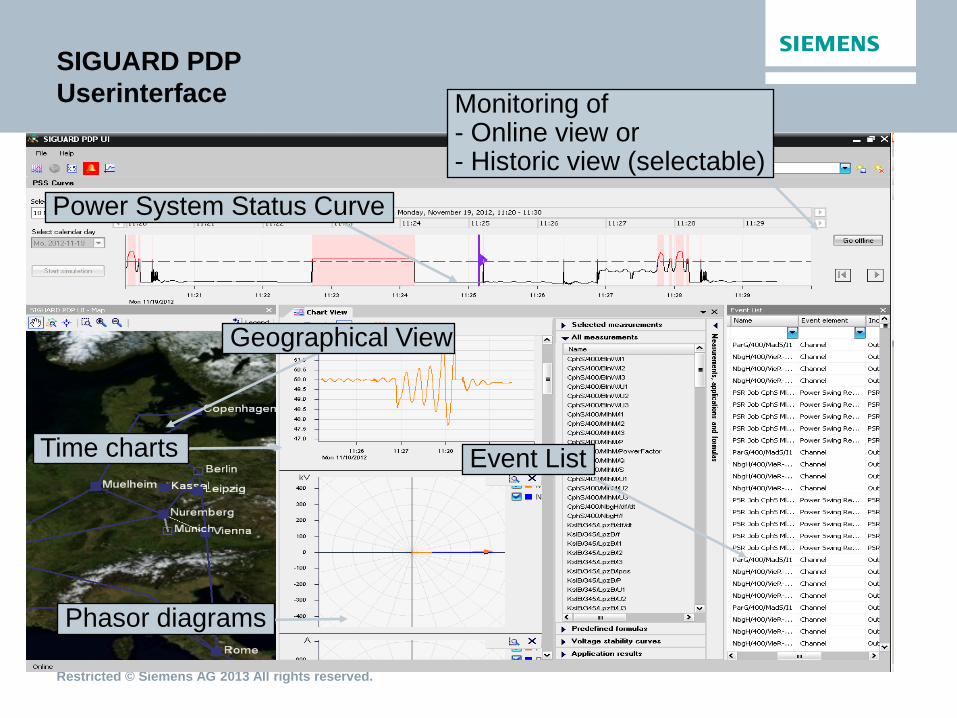
SIGUARD PDP
Userinterface
Power System Status Curve
Monitoring of - Online view or - Historic view (selectable)
Phasor diagrams
Time charts
Geographical View
Event List
Restricted © Siemens AG 2013 All rights reserved.
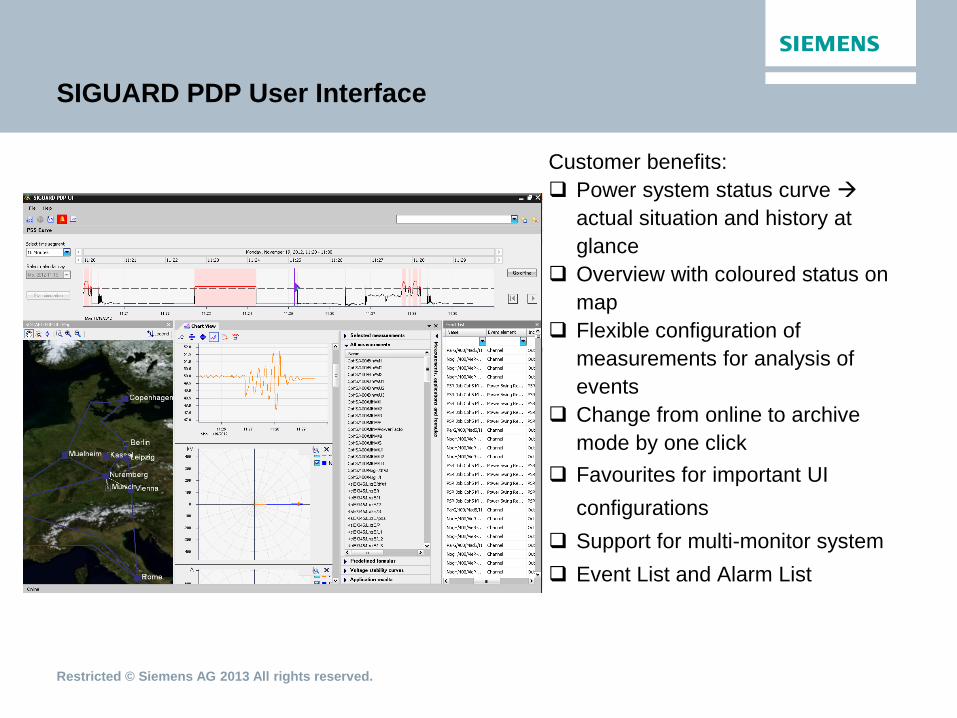
SIGUARD PDP User Interface
Customer benefits:
Power system status curve
actual situation and history at
glance
Overview with coloured status on
map
Flexible configuration of
measurements for analysis of
events
Change from online to archive
mode by one click
Favourites for important UI
configurations
Support for multi-monitor system
Event List and Alarm List
Restricted © Siemens AG 2013 All rights reserved.
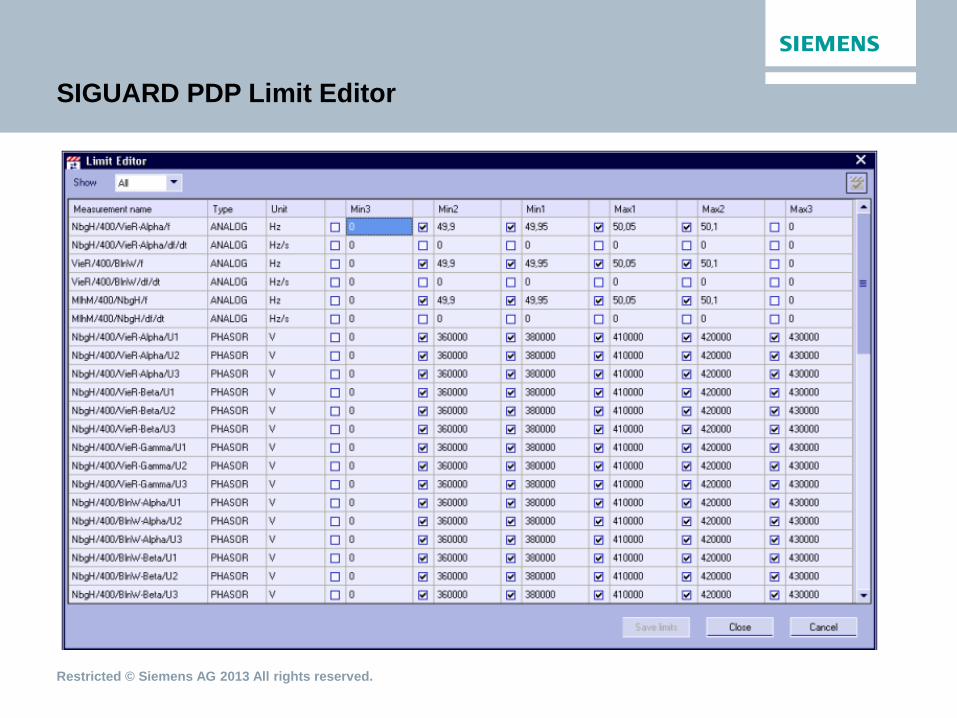
SIGUARD PDP Limit Editor
Restricted © Siemens AG 2013 All rights reserved.
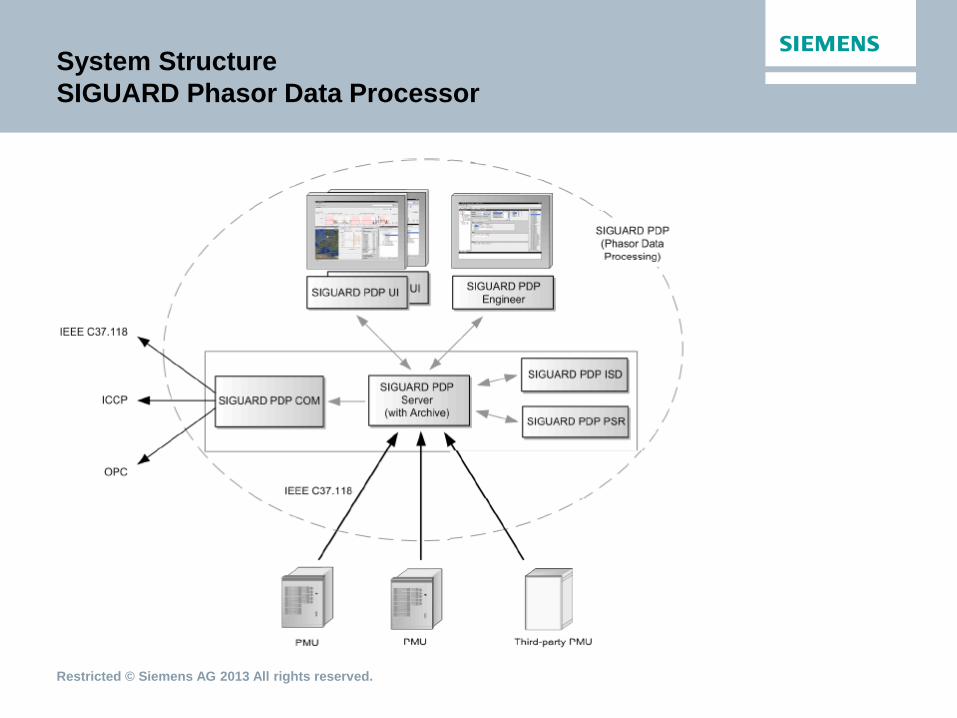
System Structure
SIGUARD Phasor Data Processor
Restricted © Siemens AG 2013 All rights reserved.
SIGUARD PDP
Components (1/2)
The SIGUARD PDP components are:
• SIGUARD PDP Server with SIGUARD PDP Archive
The SIGUARD PDP server stores the information of the PMU devices and
makes it available to the other components. The SIGUARD PDP server stores
the information (measured values, events, and alarm indications) in an archive
and makes the further processing components, for example, SIGUARD PDP UI
available. The IEEE C37.118 protocol is used for communication with the
devices or another Phasor Data Concentrator.
Restricted © Siemens AG 2013 All rights reserved.
SIGUARD PDP
Components (2/2)
• SIGUARD PDP ISD (Island State Detection)
This component evaluates frequency deviations and thereby detects the formation of an island within
the network.
• SIGUARD PDP PSR (Power Swing Recognition)
This component checks for poorly damped or undamped power swings.
• SIGUARD PDP VSC (Voltage Stability Curve)
This component shows the actual operating point on a voltage-power-curve.
• SIGUARD PDP LTE (Line Thermal Estimation)
This component calculates the Line Resistance and Temperature
• SIGUARD PDP COM (Communication)
This component conveys the data and information via a IEEE C37.118 connection to another PDP
system (for example, a second SIGUARD PDP).
• SIGUARD PDP UI (User Interface)
This component is the SIGUARD PDP user interface. You can use it to display and analyze the
information in online mode (real time) and offline mode (data from archive).
• SIGUARD PDP Engineer
This component is the SIGUARD PDP parameterizing tool.
Restricted © Siemens AG 2013 All rights reserved.
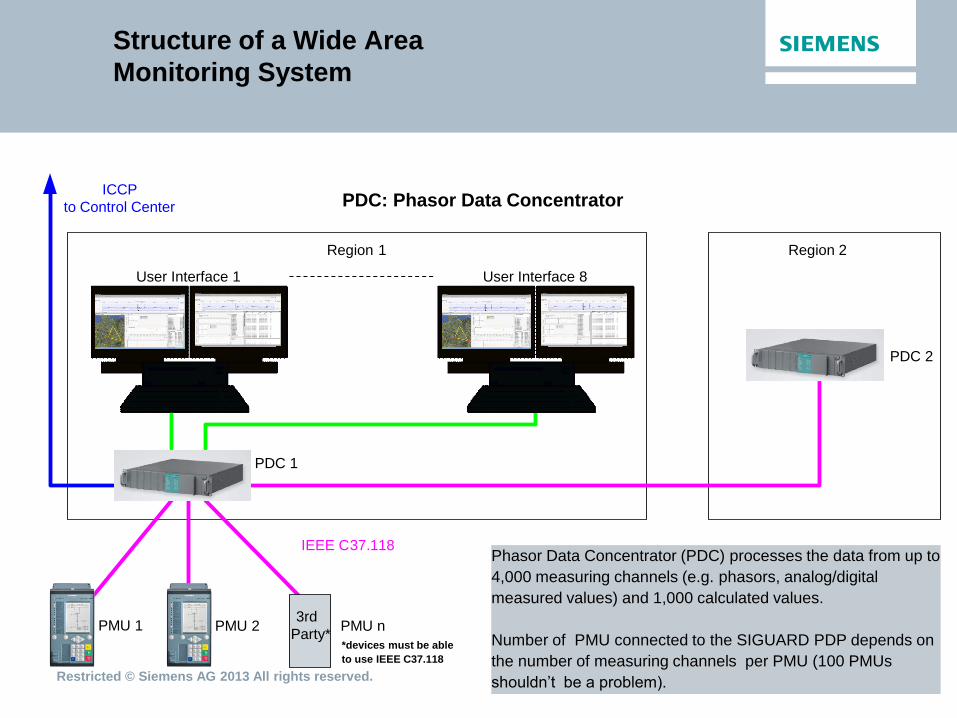
Structure of a Wide Area
Monitoring System
PDC: Phasor Data Concentrator
User Interface 1 User Interface 8
PMU 1 PMU 2 PMU n
IEEE C 37 . 118
PDC 1
PDC 2
ICCP
to Control Center
Region 1 Region 2
3rd
Party* *devices must be able
to use IEEE C37.118
Phasor Data Concentrator (PDC) processes the data from up to
4,000 measuring channels (e.g. phasors, analog/digital
measured values) and 1,000 calculated values.
Number of PMU connected to the SIGUARD PDP depends on
the number of measuring channels per PMU (100 PMUs
shouldn’t be a problem).

Restricted © Siemens AG 2013 All rights reserved.
Content
Why WAM
PMU -> PDC -> PDP
System Structure & Components
PDP – UI
Application PSR
Application ISD
Application LTE
Further Applications
The SIGUARD Product Family
References
Restricted © Siemens AG 2013 All rights reserved.
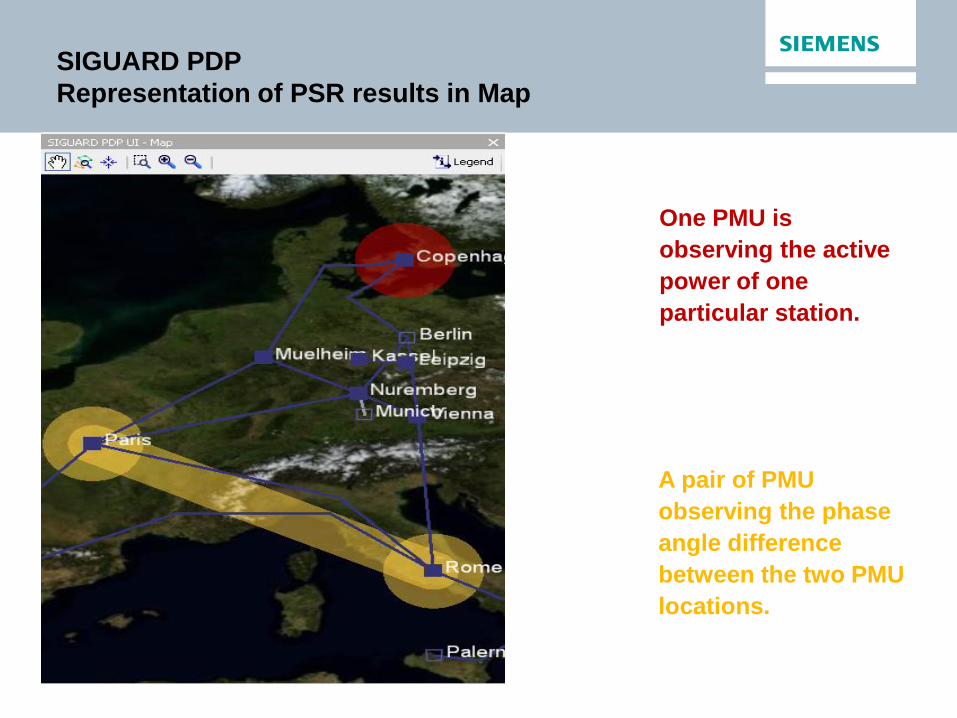
SIGUARD PDP
Representation of PSR results in Map
One PMU is
observing the active
power of one
particular station.
A pair of PMU
observing the phase
angle difference
between the two PMU
locations.
Restricted © Siemens AG 2013 All rights reserved.
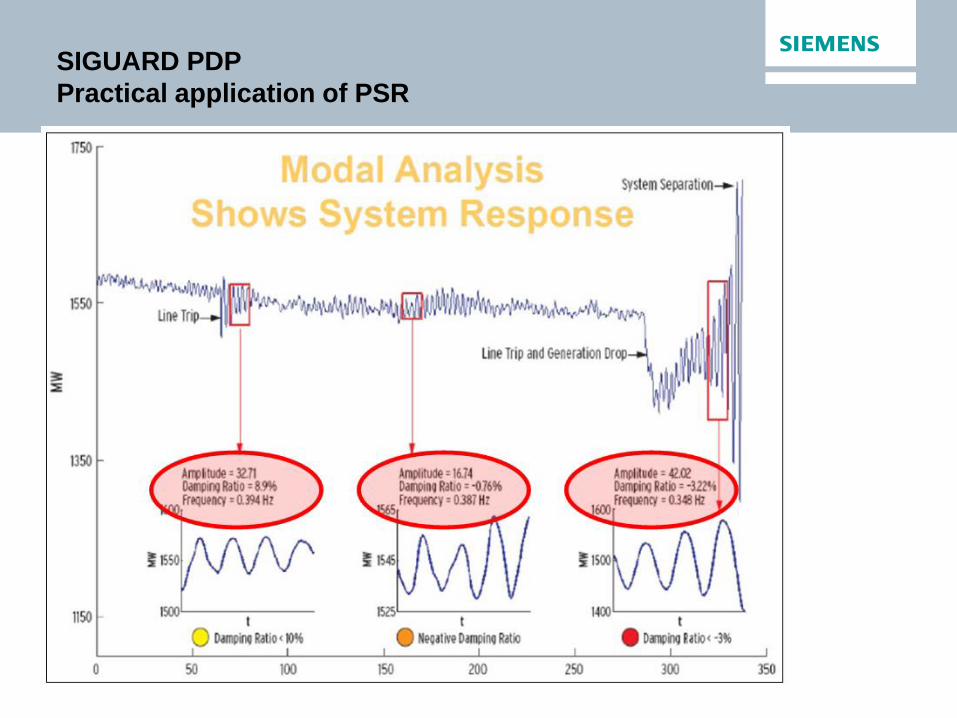
SIGUARD PDP
Practical application of PSR
Restricted © Siemens AG 2013 All rights reserved.
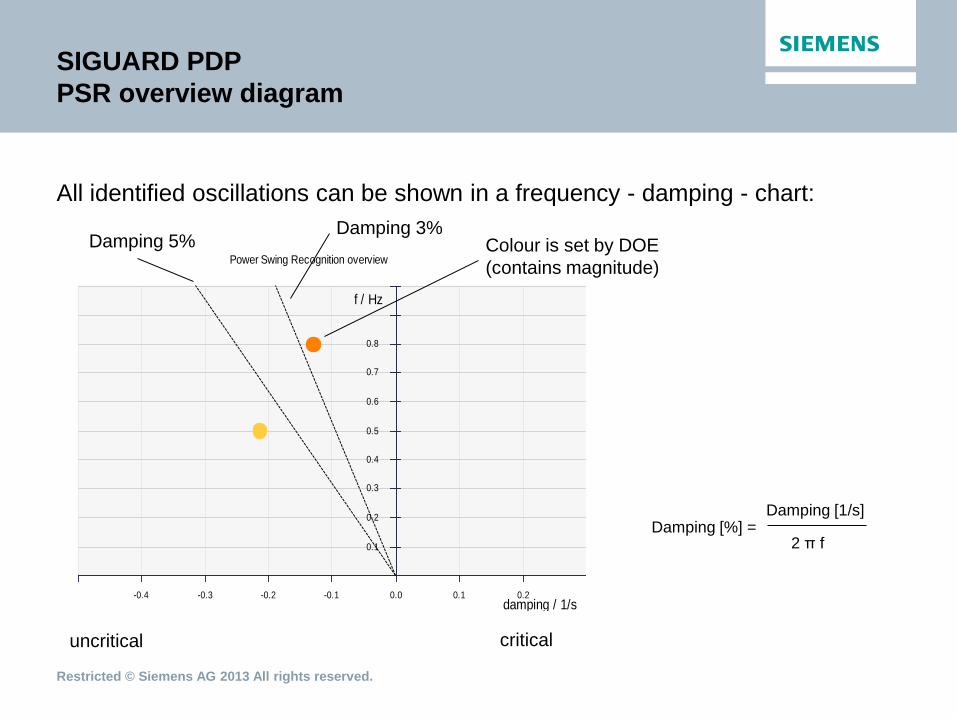
SIGUARD PDP
PSR overview diagram
All identified oscillations can be shown in a frequency - damping - chart:
Power Swing Recognition overview
damping / 1/s-0.4 -0.3 -0.2 -0.1 0.0 0.1 0.2
f / Hz
0.1
0.2
0.3
0.4
0.5
0.6
0.7
0.8
uncritical critical
Damping 5% Damping 3%
Colour is set by DOE
(contains magnitude)
Damping [%] = Damping [1/s]
2 π f
Restricted © Siemens AG 2013 All rights reserved.
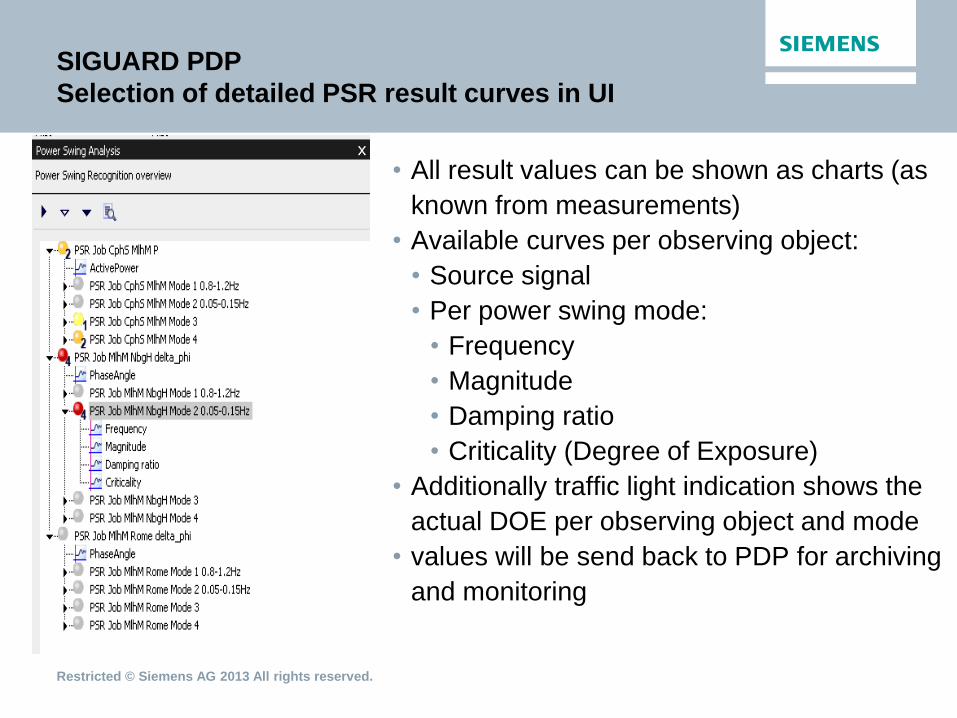
SIGUARD PDP
Selection of detailed PSR result curves in UI
• All result values can be shown as charts (as
known from measurements)
• Available curves per observing object:
• Source signal
• Per power swing mode:
• Frequency
• Magnitude
• Damping ratio
• Criticality (Degree of Exposure)
• Additionally traffic light indication shows the
actual DOE per observing object and mode
• values will be send back to PDP for archiving
and monitoring

Restricted © Siemens AG 2013 All rights reserved.
Content
Why WAM
PMU -> PDC -> PDP
System Structure & Components
PDP – UI
Application PSR
Application ISD
Application LTE
Further Applications
The SIGUARD Product Family
References
Restricted © Siemens AG 2013 All rights reserved.
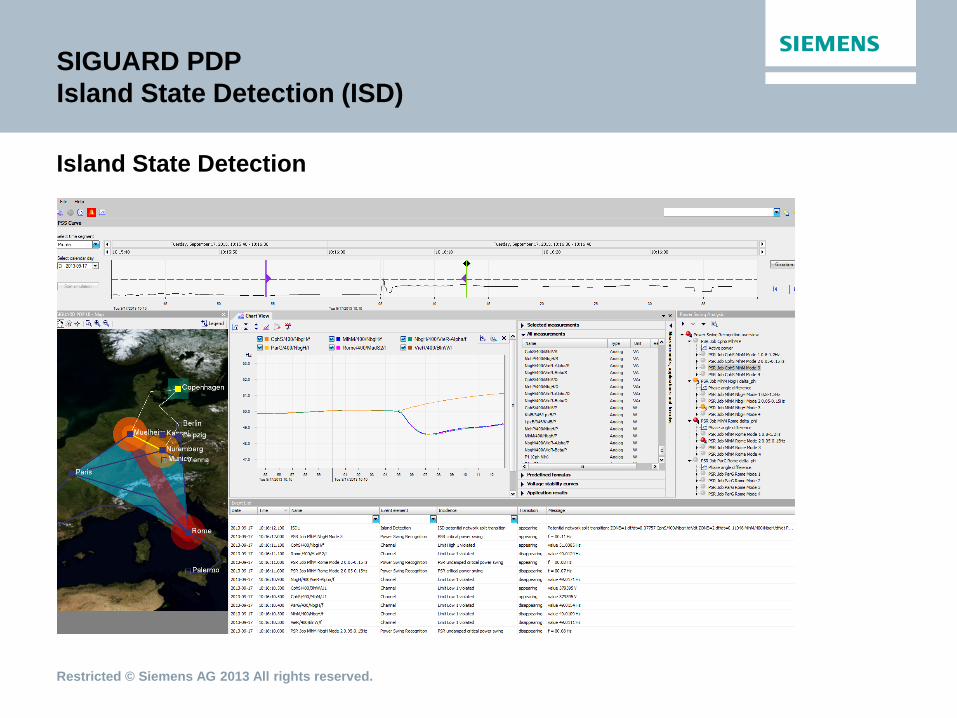
SIGUARD PDP
Island State Detection (ISD)
Island State Detection
Restricted © Siemens AG 2013 All rights reserved.
Content
Why WAM
PMU -> PDC -> PDP
System Structure & Components
PDP – UI
Application PSR
Application ISD
Application LTE
Further Applications
The SIGUARD Product Family
References
Restricted © Siemens AG 2013 All rights reserved.
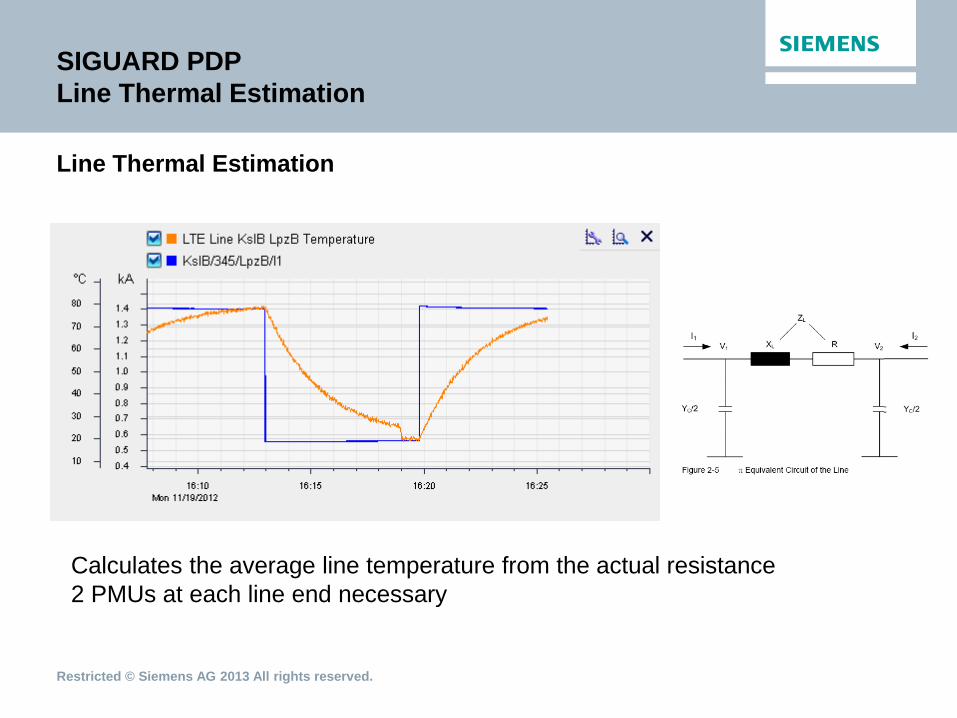
SIGUARD PDP
Line Thermal Estimation
Line Thermal Estimation
Calculates the average line temperature from the actual resistance
2 PMUs at each line end necessary

Restricted © Siemens AG 2013 All rights reserved.
Content
Why WAM
PMU -> PDC -> PDP
System Structure & Components
PDP – UI
Application PSR
Application ISD
Application LTE
Further Applications
The SIGUARD Product Family
References
Restricted © Siemens AG 2013 All rights reserved.
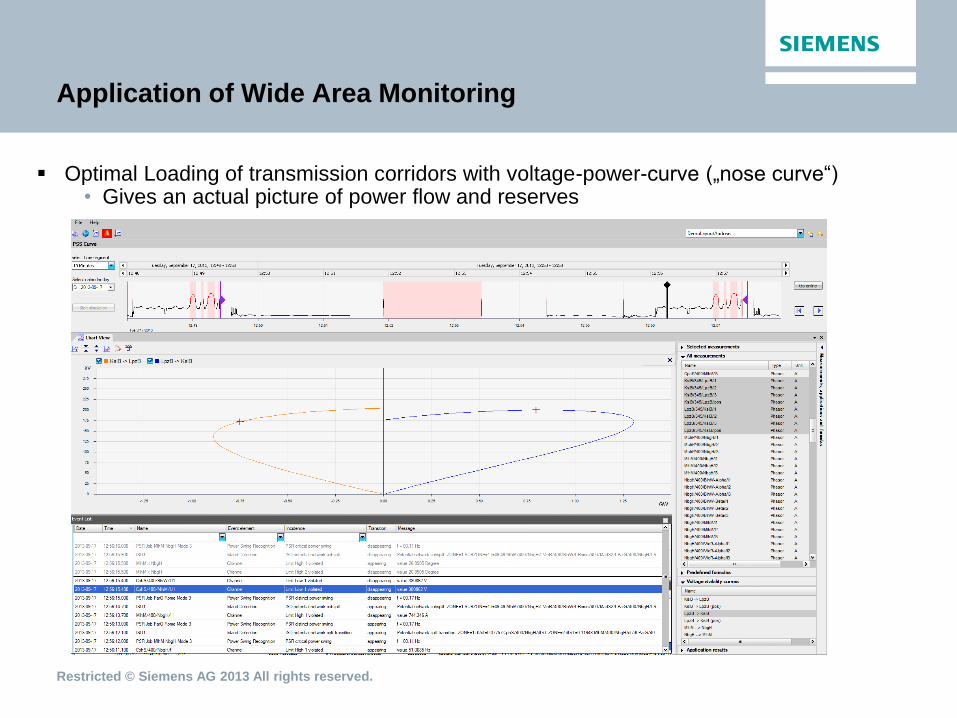
Application of Wide Area Monitoring
Optimal Loading of transmission corridors with voltage-power-curve („nose curve“)
• Gives an actual picture of power flow and reserves
Restricted © Siemens AG 2013 All rights reserved.
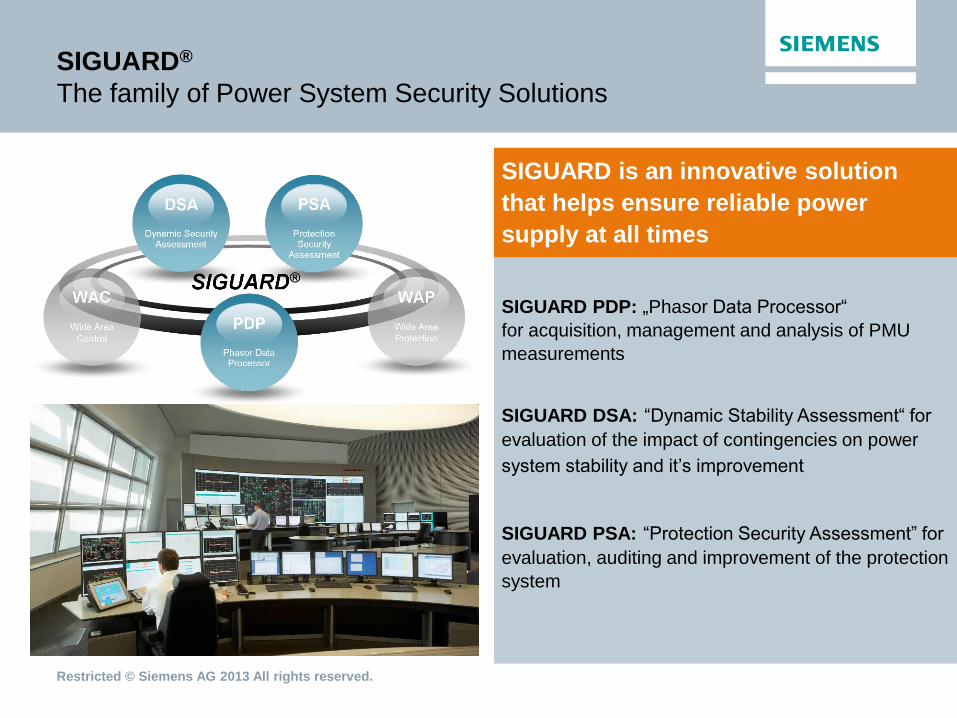
SIGUARD®
The family of Power System Security Solutions
SIGUARD is an innovative solution
that helps ensure reliable power
supply at all times
SIGUARD PDP: „Phasor Data Processor“
for acquisition, management and analysis of PMU
measurements
SIGUARD DSA: “Dynamic Stability Assessment“ for
evaluation of the impact of contingencies on power
system stability and it’s improvement
SIGUARD PSA: “Protection Security Assessment” for
evaluation, auditing and improvement of the protection
system
Restricted © Siemens AG 2013 All rights reserved.
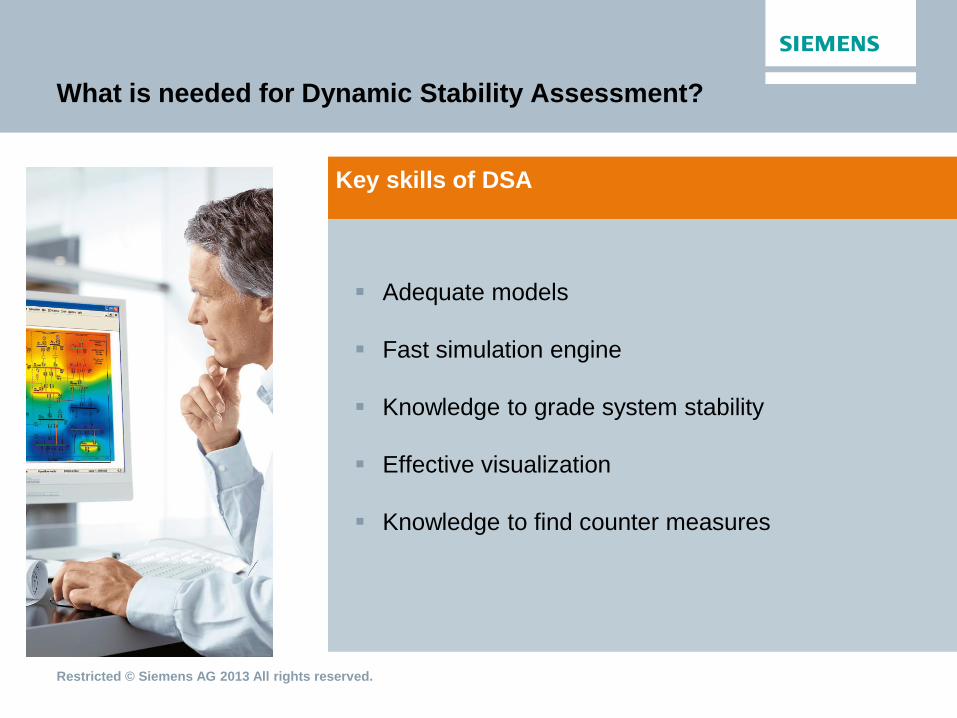
What is needed for Dynamic Stability Assessment?
Key skills of DSA
Adequate models
Fast simulation engine
Knowledge to grade system stability
Effective visualization
Knowledge to find counter measures
Restricted © Siemens AG 2013 All rights reserved.
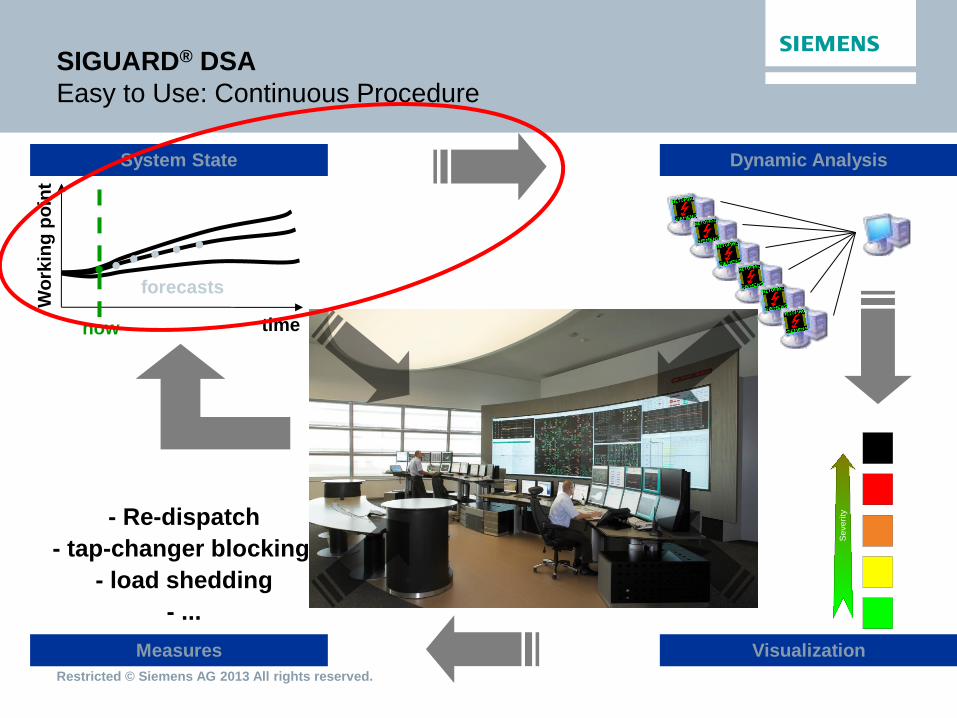
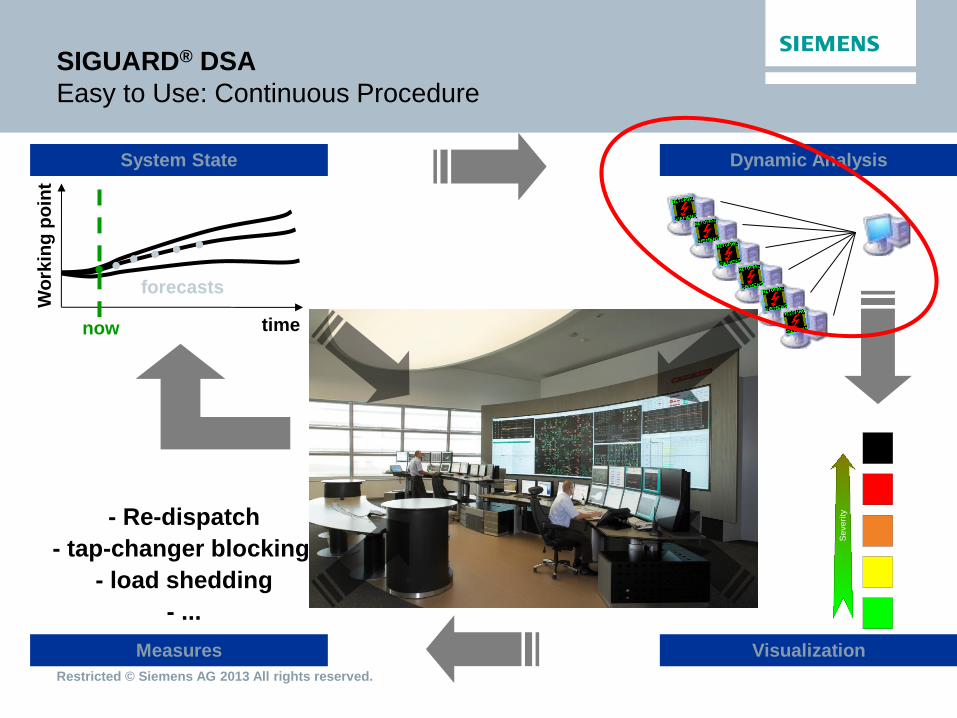
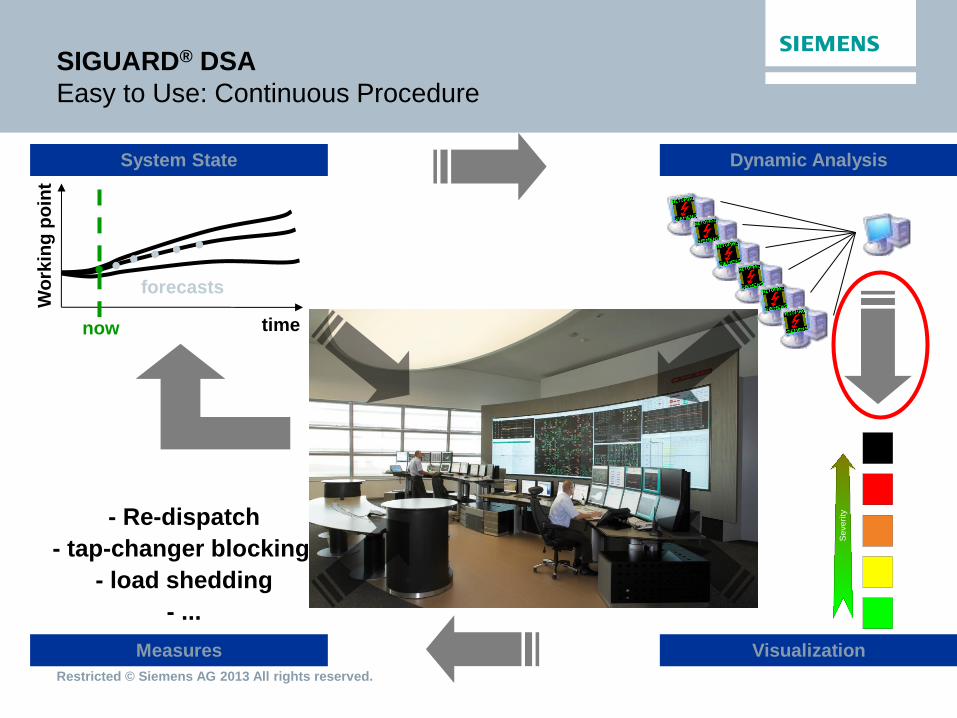
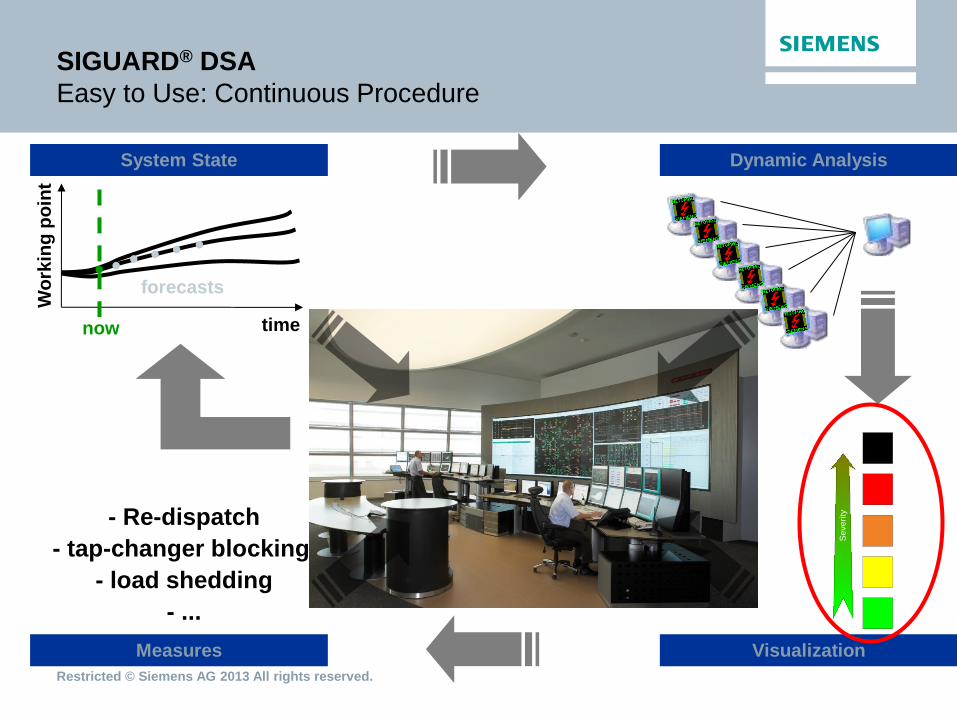
SIGUARD® DSA
Easy to Use: Continuous Procedure
time
Wo
rkin
g p
oin
t
now
forecasts
System State Dynamic Analysis
Se
ve
rity
Voltage Security
Index
1.00
.75
.50
.25
0
Colour Code
Visualization
- Re-dispatch
- tap-changer blocking
- load shedding
- ...
Measures
Restricted © Siemens AG 2013 All rights reserved.
2013-03
C. Heyde,
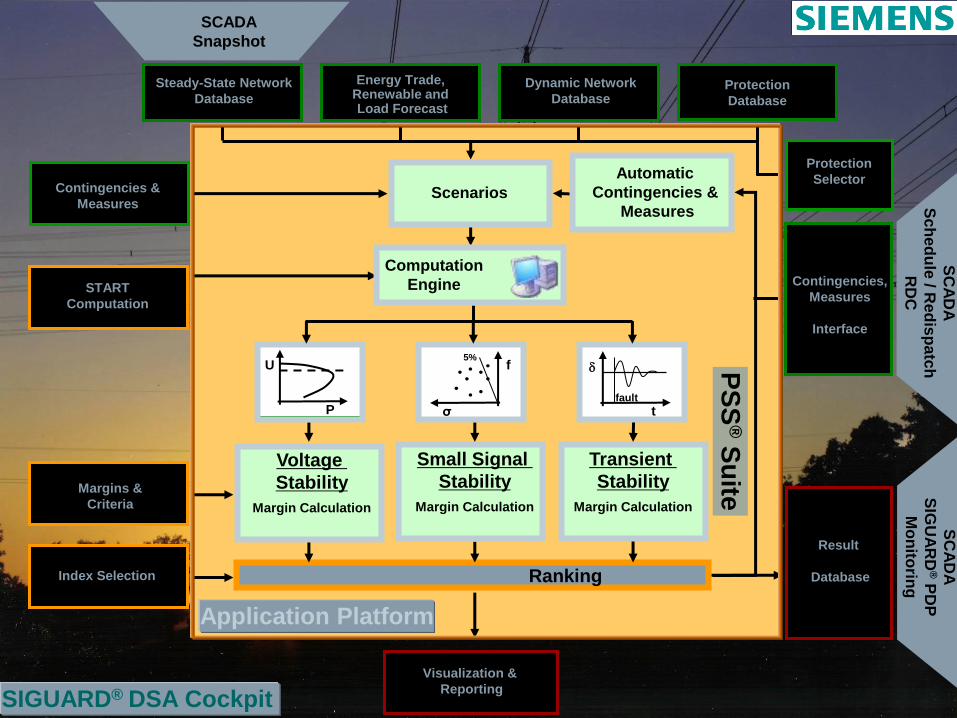
R. Krebs Page 33 SIGUARD® DSA Cockpit
Application Platform
START
Computation
Margins &
Criteria
Index Selection Ranking
Small Signal
Stability
Margin Calculation
Transient
Stability
Margin Calculation
Voltage
Stability
Margin Calculation
U
P
t fault
f
σ
5%
Visualization &
Reporting
Result
Database
SCADA
Snapshot
SC
AD
A
SIG
UA
RD
® P
DP
Mo
nito
ring
SC
AD
A
Sc
hed
ule
/ Red
isp
atc
h
RD
C
Contingencies &
Measures
Contingencies,
Measures
Interface
Protection
Selector
Protection
Database
Energy Trade, Renewable and Load Forecast
Steady-State Network
Database
Dynamic Network
Database
Automatic
Contingencies &
Measures
Scenarios
Computation
Engine
PS
S® S
uite
Restricted © Siemens AG 2013 All rights reserved.
SIGUARD® DSA
Easy to Use: Continuous Procedure
time
Wo
rkin
g p
oin
t
now
forecasts
System State Dynamic Analysis
Se
ve
rity
Voltage Security
Index
1.00
.75
.50
.25
0
Colour Code
Visualization
- Re-dispatch
- tap-changer blocking
- load shedding
- ...
Measures
Restricted © Siemens AG 2013 All rights reserved.
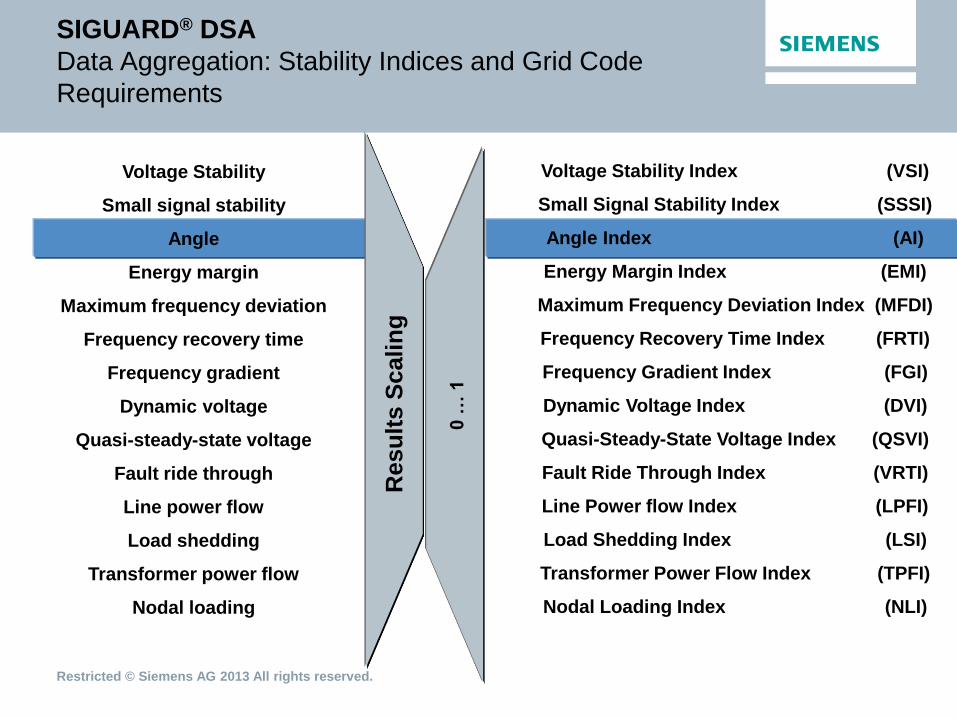
SIGUARD® DSA
Data Aggregation: Stability Indices and Grid Code
Requirements
Voltage Stability
Small signal stability
Angle
Energy margin
Maximum frequency deviation
Frequency recovery time
Frequency gradient
Dynamic voltage
Quasi-steady-state voltage
Fault ride through
Line power flow
Load shedding
Transformer power flow
Nodal loading
Resu
lts S
cali
ng
Voltage Stability Index (VSI)
Small Signal Stability Index (SSSI)
Angle Index (AI)
Energy Margin Index (EMI)
Maximum Frequency Deviation Index (MFDI)
Frequency Recovery Time Index (FRTI)
Frequency Gradient Index (FGI)
Dynamic Voltage Index (DVI)
Quasi-Steady-State Voltage Index (QSVI)
Fault Ride Through Index (VRTI)
Line Power flow Index (LPFI)
Load Shedding Index (LSI)
Transformer Power Flow Index (TPFI)
Nodal Loading Index (NLI)
0 …
1
Restricted © Siemens AG 2013 All rights reserved.
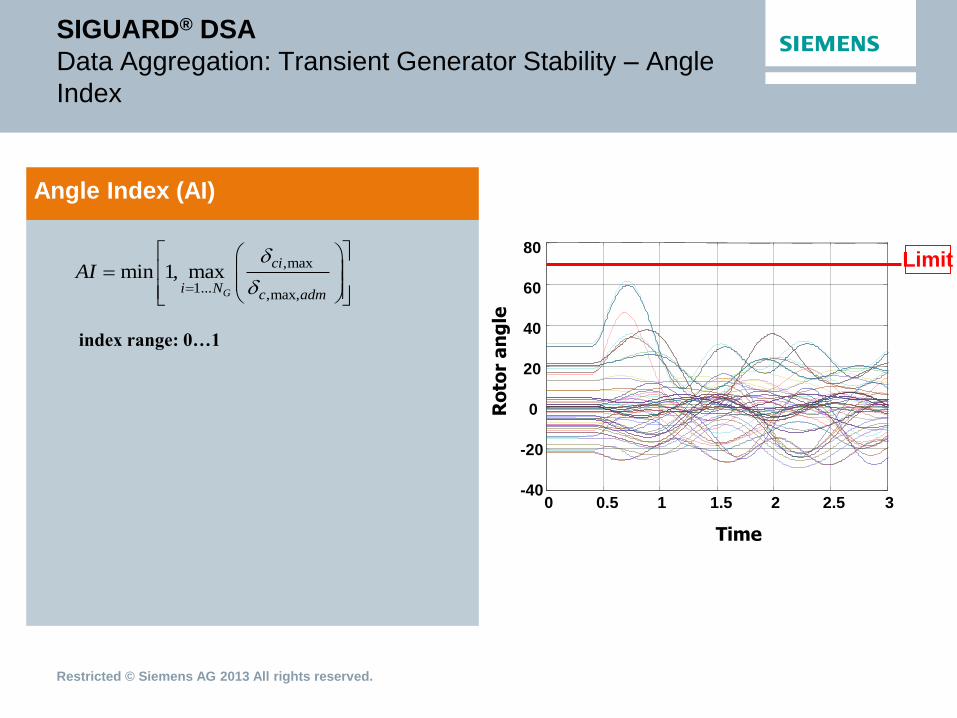
Angle Index (AI)
SIGUARD® DSA
Data Aggregation: Transient Generator Stability – Angle
Index
,max
1...,max,
min 1, maxG
ci
i Nc adm
AI
0 0.5 1 1.5 2 2.5 3 -40
-20
0
20
40
60
80
Ro
tor
an
gle
Time
index range: 0…1
Limit
Restricted © Siemens AG 2013 All rights reserved.
SIGUARD® DSA
Easy to Use: Continuous Procedure
time
Wo
rkin
g p
oin
t
now
forecasts
System State Dynamic Analysis
Se
ve
rity
Voltage Security
Index
1.00
.75
.50
.25
0
Colour Code
Visualization
- Re-dispatch
- tap-changer blocking
- load shedding
- ...
Measures
Restricted © Siemens AG 2013 All rights reserved.
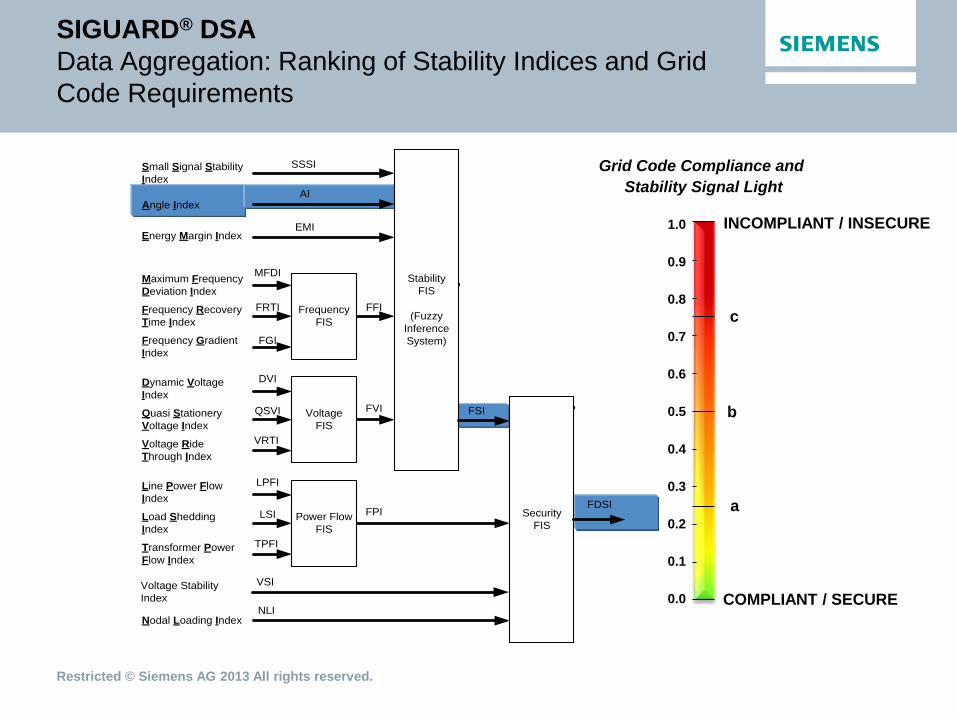
SIGUARD® DSA
Data Aggregation: Ranking of Stability Indices and Grid
Code Requirements
Grid Code Compliance and
Stability Signal Light
1.0 INCOMPLIANT / INSECURE
0.0
0.5
0.6
0.7
0.8
0.9
0.1
0.2
0.3
0.4
COMPLIANT / SECURE
b
a
c
Stability
FIS
(Fuzzy
Inference
System)
Frequency Recovery
Time Index
Maximum Frequency
Deviation Index
SSSI
AI
Frequency
FIS
Frequency Gradient
Index
FGI
FRTI
MFDI
Angle Index
Small Signal Stability
Index
Quasi Stationery
Voltage Index
Dynamic Voltage
Index
Voltage
FIS
Voltage Ride
Through Index
VRTI
QSVI
DVI
Load Shedding
Index
Line Power Flow
Index
Power Flow
FIS
Transformer Power
Flow Index
TPFI
LSI
LPFI
EMIEnergy Margin Index
Nodal Loading IndexNLI
Security
FIS
FSIFVI
FFI
FPIFDSI
Voltage Stability
Index
VSI
Restricted © Siemens AG 2013 All rights reserved.
SIGUARD® DSA
Easy to Use: Continuous Procedure
time
Wo
rkin
g p
oin
t
now
forecasts
System State Dynamic Analysis
Se
ve
rity
Voltage Security
Index
1.00
.75
.50
.25
0
Colour Code
Visualization
- Re-dispatch
- tap-changer blocking
- load shedding
- ...
Measures
Restricted © Siemens AG 2013 All rights reserved.
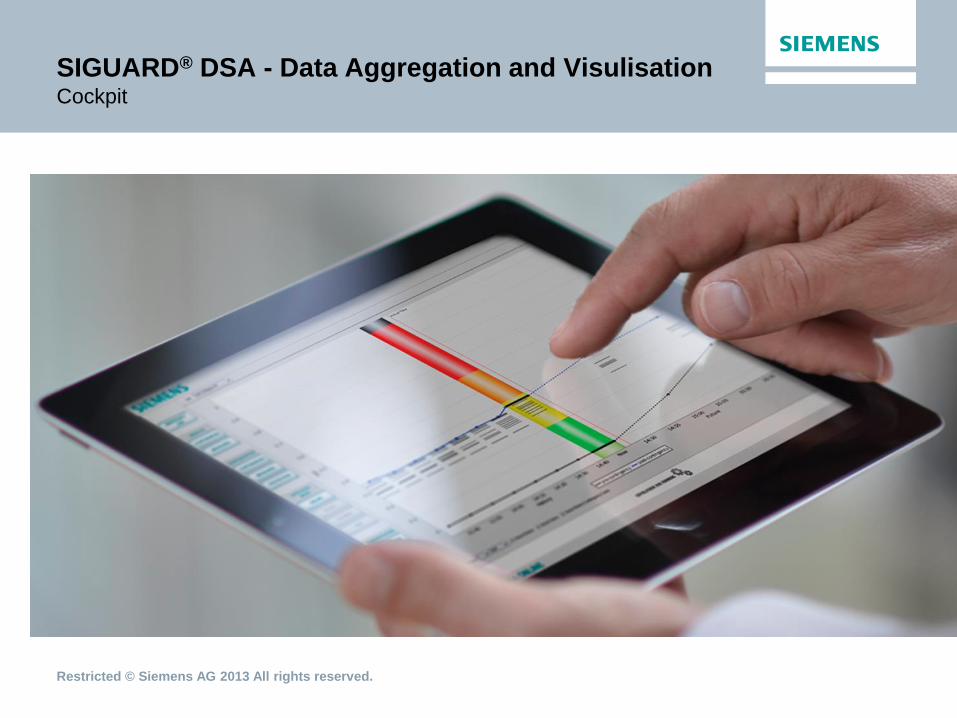
SIGUARD® DSA - Data Aggregation and Visulisation Cockpit
Restricted © Siemens AG 2013 All rights reserved.
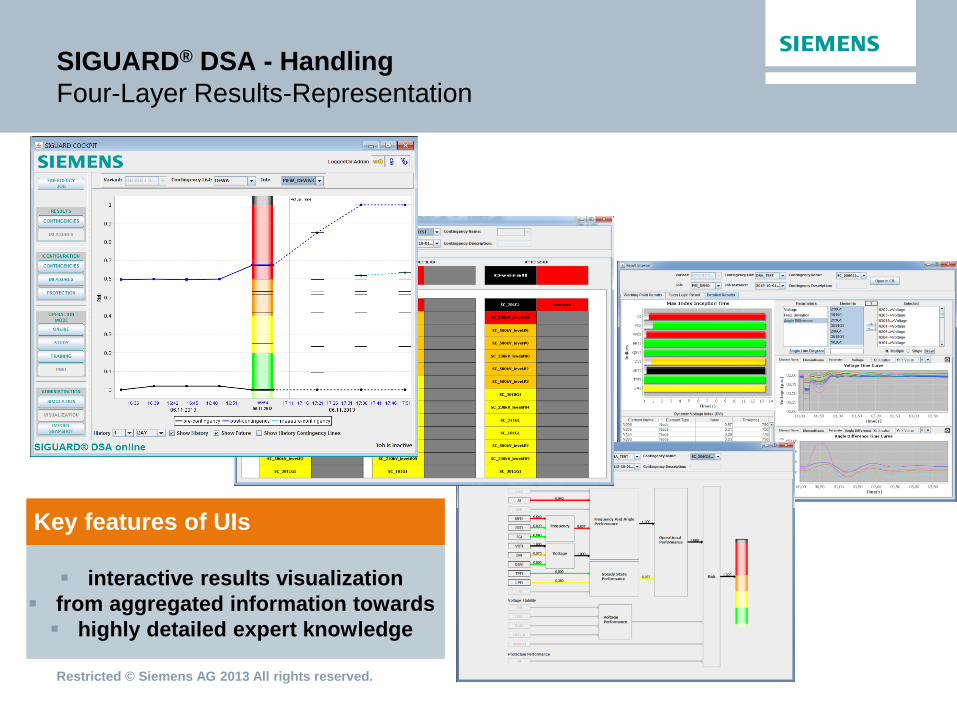
Key features of UIs
SIGUARD® DSA - Handling
Four-Layer Results-Representation
interactive results visualization
from aggregated information towards
highly detailed expert knowledge
Restricted © Siemens AG 2013 All rights reserved.
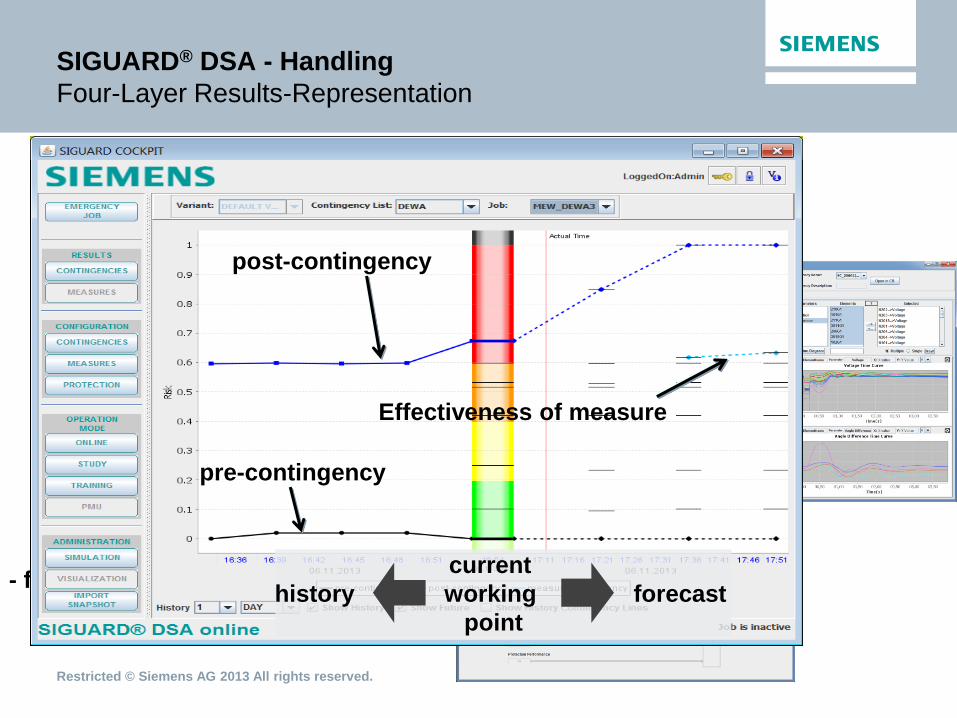
SIGUARD® DSA - Handling
Four-Layer Results-Representation
- interactive results visualization
- from aggregated information towards
highly detailed expert knowledge
pre-contingency
post-contingency
current
working
point
history forecast
Effectiveness of measure
Restricted © Siemens AG 2013 All rights reserved.
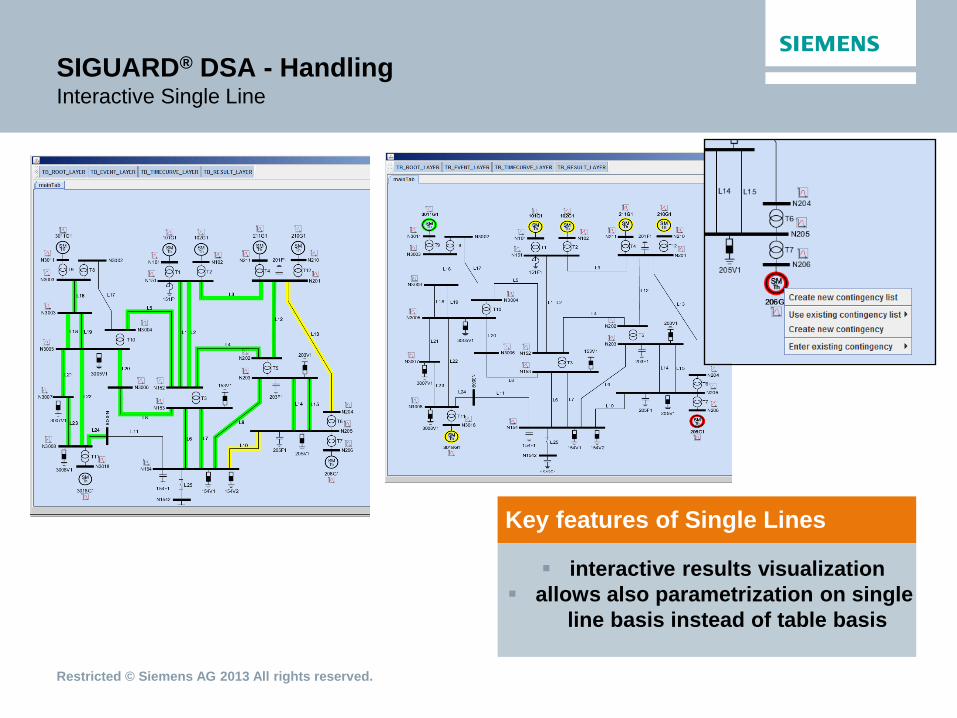
Key features of Single Lines
SIGUARD® DSA - Handling Interactive Single Line
interactive results visualization
allows also parametrization on single
line basis instead of table basis
Restricted © Siemens AG 2013 All rights reserved.
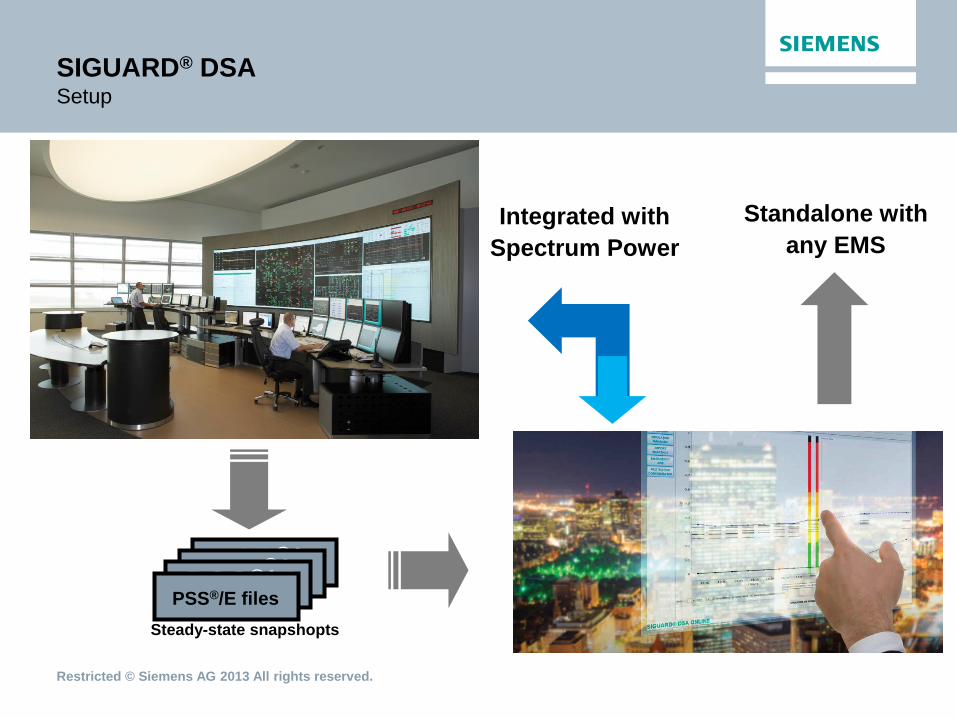
SIGUARD® DSA Setup
PSS®/E PSS®/E PSS®/E PSS®/E files
Integrated with
Spectrum Power
Standalone with
any EMS
Steady-state snapshopts
Restricted © Siemens AG 2013 All rights reserved.
Content
Why WAM
PMU -> PDC -> PDP
System Structure & Components
PDP – UI
Application PSR
Application ISD
Application LTE
Further Applications
The SIGUARD Product Family
References
Restricted © Siemens AG 2013 All rights reserved.
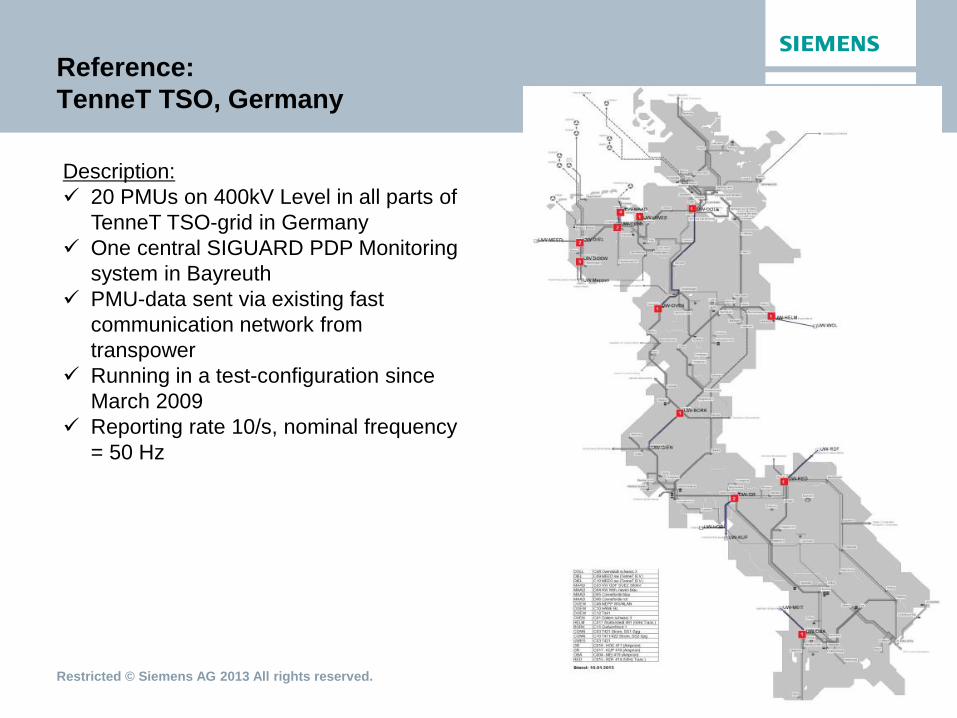
Reference:
TenneT TSO, Germany
Description:
20 PMUs on 400kV Level in all parts of
TenneT TSO-grid in Germany
One central SIGUARD PDP Monitoring
system in Bayreuth
PMU-data sent via existing fast
communication network from
transpower
Running in a test-configuration since
March 2009
Reporting rate 10/s, nominal frequency
= 50 Hz
Restricted © Siemens AG 2013 All rights reserved.
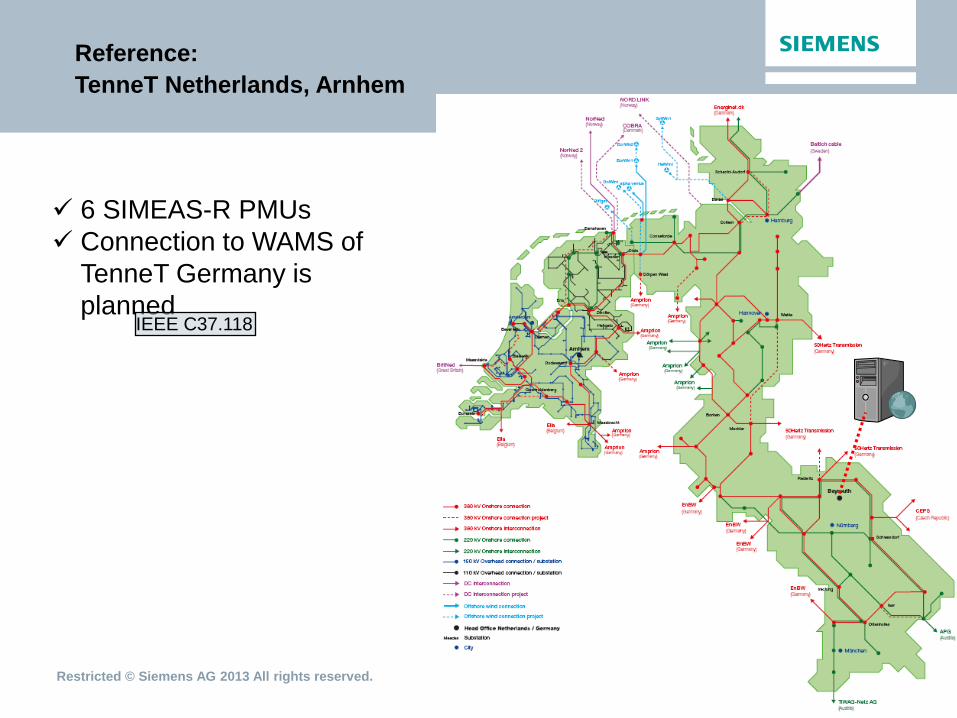
6 SIMEAS-R PMUs
Connection to WAMS of
TenneT Germany is
planned
Reference:
TenneT Netherlands, Arnhem
IEEE C37.118
Restricted © Siemens AG 2013 All rights reserved.
Reference:
ewz (city supplier of Zurich), switzerland
Description:
18 PMUs on distribution and transmission level in greater Zurich area
One central SIGUARD PDP Monitoring system in ewz office
PMU-data sent via existing fast communication network from ewz
Running since May 2009
Reporting rate 25/s, nominal frequency = 50 Hz
PDP server functionality to SAFIR (data aquisition tool)
Goals:
Fast Fault location in distribution network
Synchrophasors used as additional information source for disturbance location
Monitoring of the complete distribution network, especially at the interfaces
to transmission network
Experiences:
PDP server functionality (sending out PMU data in IEEE C37.118 protocol)
is implemented for the first time
Restricted © Siemens AG 2013 All rights reserved.
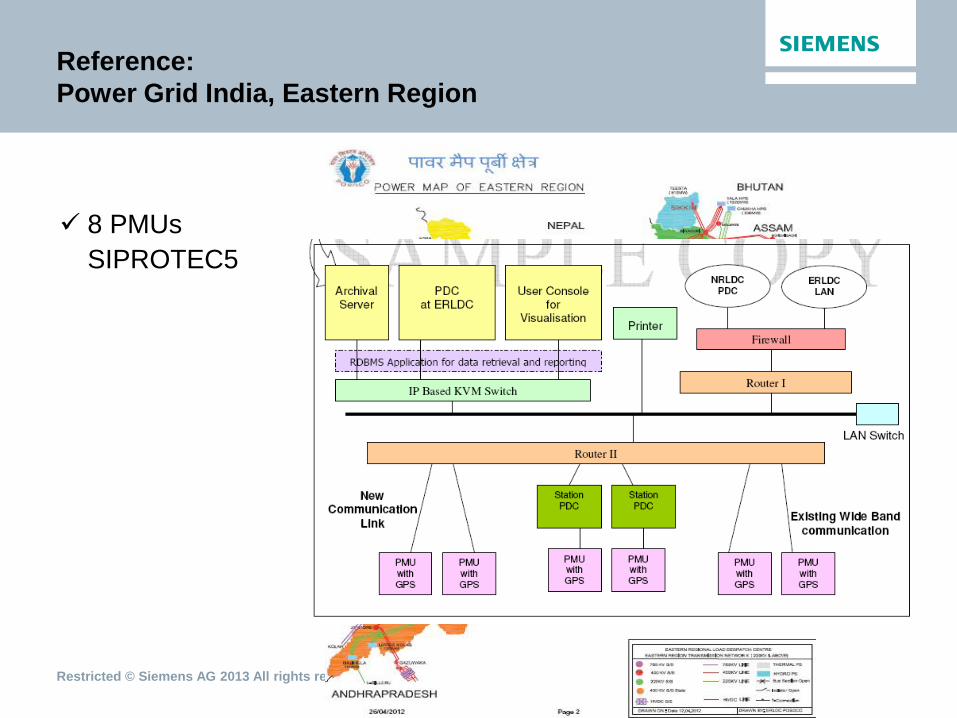
Reference:
Power Grid India, Eastern Region
8 PMUs
SIPROTEC5