Embed Size (px)
Citation preview
Equity Indexed Universal Life -A Call to Action
Suitability, Policy Design and Policy Management Considerations to Maximize the Probability of a
Favorable Outcome
E. Randolph Whitelaw, AEP® (Distinguished)
Charles M. “Mark” Whitelaw
Copyright 2015, Trust Asset Consultants, LLC
2
A Call to Action - Introduction
This presentation has been prepared to accompany our article, Equity Indexed Universal Life – A Call to Action, in the Society of Financial Service Professionals (FSP) April 2005 Risk Management newsletter, and our July 8th FSP Lunch Bunch ‘conversation with the authors’ for which over 400 members signed up. It is intended for review by FSP members, legal and tax advisors, and trustees of Irrevocable Life Insurance Trusts to assist in explaining the reason for a Call to Action recommendation and the form it should take.
EIUL marketing and illustration practices have been questioned since its introduction, and described as deceptive and misleading. In September 2014, New York State Financial Services Superintendent Benjamin Lawsky commenced an investigation of these practices. Subsequently the National Association of Insurance Commissioners (NAIC) adopted comprehensive new rules (Actuarial Guidance 49 – AG 49) governing the illustrations to be used in selling EIUL. The new rules become effective September 1, 2015.
Copyright 2015, Trust Asset Consultants, LLC
3
Sections
I. Overview – How we got to today.
II. How Consumers and Advisors Should Interpret NAIC Actuarial Guideline 49.
III. Applying FINRA and NAIC Best Practices.
IV. Action Steps for EIUL Policy Owners.
V. Prudent Evaluation of New Policy Alternatives.
Note: Issuers use the names “Equity Indexed Universal Life (EIUL) ” and “Indexed Universal Life (IUL)” to describe this product.
Copyright 2015, Trust Asset Consultants, LLC
4
I - Overview
How did we get to today?
• EIUL was introduced in the 1990s as a niche non-security product for premium finance program marketing to the high net worth market segment.
• After the March 2009 market low point, issuers repositioned EIUL as a market driven, 0% minimum interest rate, alternative for non-securities licensed agents to sell.
• Because EIUL is not a security, issuers incur restrictions in their consumer and investment disclosures concerning the implications of Indexed methodologies.
• Because EIUL sales agents typically are not securities licensed, they are not required to adhere to FINRA sales practices and comparative analysis methodologies.
The result is deceptive and misleading marketing and illustration practices, and a ‘call to action’ starting with NAIC-compliant illustrations. EIUL is an attractive life insurance product option. The problem is not the product but rather its marketing.
Our objective is to review NAIC and FINRA best practices in the context of EIUL and alternatives so that consumers, advisors and trustees can make informed and reasoned planning and risk management decisions.
Copyright 2015, Trust Asset Consultants, LLC
5
What are the Questionable Marketing Practices?
What are the ‘deceptive and misleading practices’ at issue?
• Issuing life insurance companies (issuers) choosing Look-back periods that showcase their Indexed methodology.
• Agents not disclosing the market Total Return averages resulting in the policy illustration rate.
• Agents not asking consumers about their financial planning assumptions and adjusting the policy illustration rate based on the appropriate Look-back differential.
• Agents selecting the comparative analysis methodology they want in order to showcase the proposed policy as compared to other investment structures.
• Agents describing the 0% crediting rate floor as No Downside Investment Risk.
These questionable practices conflict with financial planning and investment analysis ‘best practices’ guidance. Further, they help to explain why ‘deceptive and misleading’ terminology has been applied to illustrations and reference made to a “win the Illustration” contest.
Copyright 2015, Trust Asset Consultants, LLC
6
What Should Readers Understand?
• All EIUL policy owners should obtain a credible policy evaluation to determine if current policy values are performing as expected and, if not, what corrective action should be taken.
• EIUL is a flexible premium non-guaranteed death benefit product, meaning performance risk resides with the policy owner, not the issuer. Life insurance issuers do not offer post-sales policy risk management services. Life Insurance sales agents usually do not have contractual post-sales service duties. The purchaser is solely responsible for the policy performance monitoring and risk management functions.
Copyright 2015, Trust Asset Consultants, LLC
7
A Call to Action – Author Clarification
• Equity Indexed Universal Life is an attractive product for niche uses set out by the client typically in a Request for Proposal (RFP). Sales agents and registered reps are held to a suitability standard, as a minimum. Our objective is Full Consumer Disclosure so that consumers, existing policy owners and their advisors are aware of EIUL’s complex methodology and pricing and can reassess its suitability per the consumer’s objectives and risk tolerance. As already noted, the policy owner is solely responsible for the performance monitoring and risk management of this policy.
• AG 49 implements a uniform methodology for determining the maximum allowable policy illustration rate. This data is informational only, recognizing that the policy contract and illustration both disclaim the use of an illustration for predictive value determinations. Also, AG 49 does not address the reasonableness or prudence of using historical returns as a basis for future planning.
• Consumers and advisors should be aware that a sales agent’s licensing and market focus often limit access to other products such as Institutionally-priced policies that may be more suitable for their planning objectives.
Copyright 2015, Trust Asset Consultants, LLC
8
Life Insurance Product Suitability
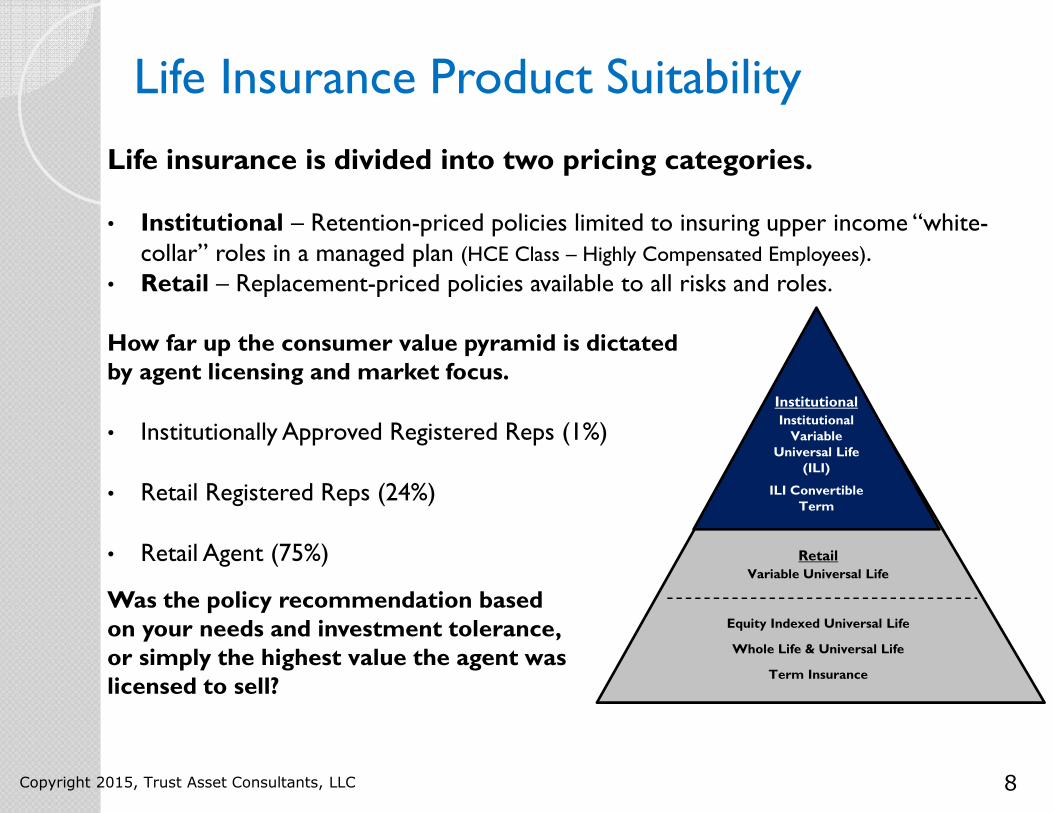
Life insurance is divided into two pricing categories.
• Institutional – Retention-priced policies limited to insuring upper income “white-collar” roles in a managed plan (HCE Class – Highly Compensated Employees).
• Retail – Replacement-priced policies available to all risks and roles.
How far up the consumer value pyramid is dictatedby agent licensing and market focus.
• Institutionally Approved Registered Reps (1%)
• Retail Registered Reps (24%)
• Retail Agent (75%)
Was the policy recommendation basedon your needs and investment tolerance, or simply the highest value the agent was licensed to sell?
Copyright 2015, Trust Asset Consultants, LLC
RetailVariable Universal Life
Equity Indexed Universal Life
Whole Life & Universal Life
Term Insurance
InstitutionalInstitutional Variable
Universal Life (ILI)
ILI Convertible Term
9
EIUL Suitability – Emphasis Added
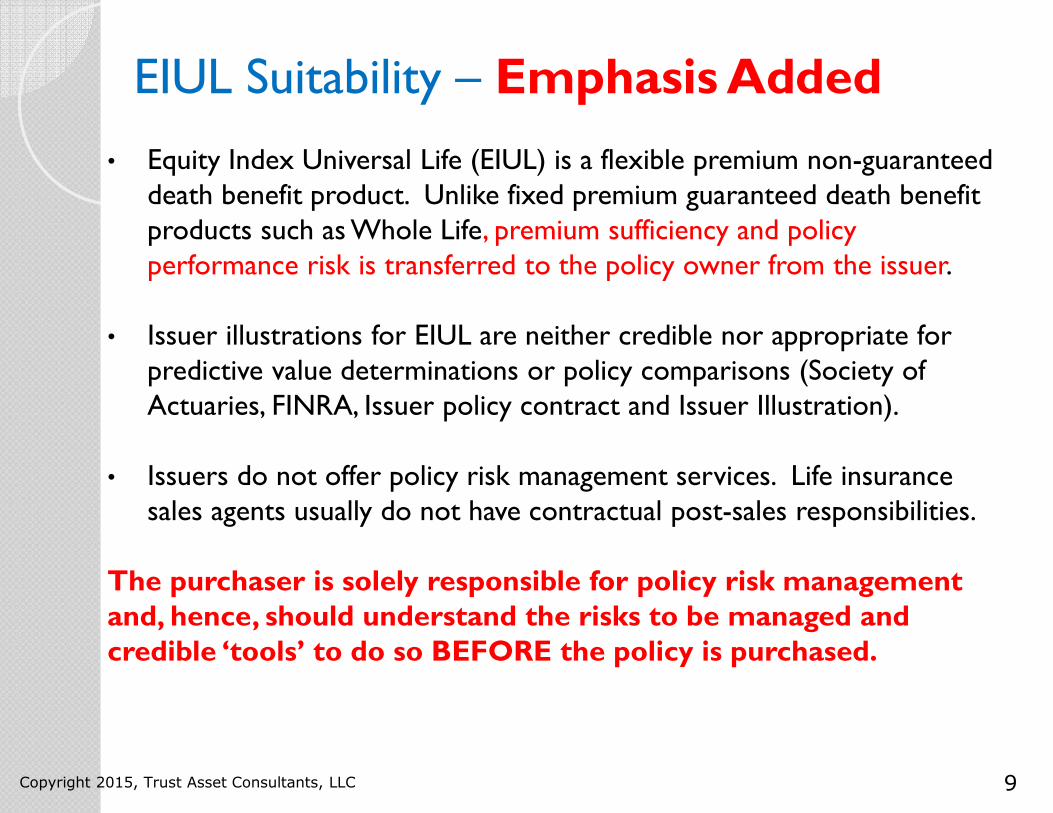
• Equity Index Universal Life (EIUL) is a flexible premium non-guaranteed death benefit product. Unlike fixed premium guaranteed death benefit products such as Whole Life, premium sufficiency and policy performance risk is transferred to the policy owner from the issuer.
• Issuer illustrations for EIUL are neither credible nor appropriate for predictive value determinations or policy comparisons (Society of Actuaries, FINRA, Issuer policy contract and Issuer Illustration).
• Issuers do not offer policy risk management services. Life insurance sales agents usually do not have contractual post-sales responsibilities.
The purchaser is solely responsible for policy risk management and, hence, should understand the risks to be managed and credible ‘tools’ to do so BEFORE the policy is purchased.
Copyright 2015, Trust Asset Consultants, LLC
10
What are the Marketing ‘Caveat Emptor’ Issues?
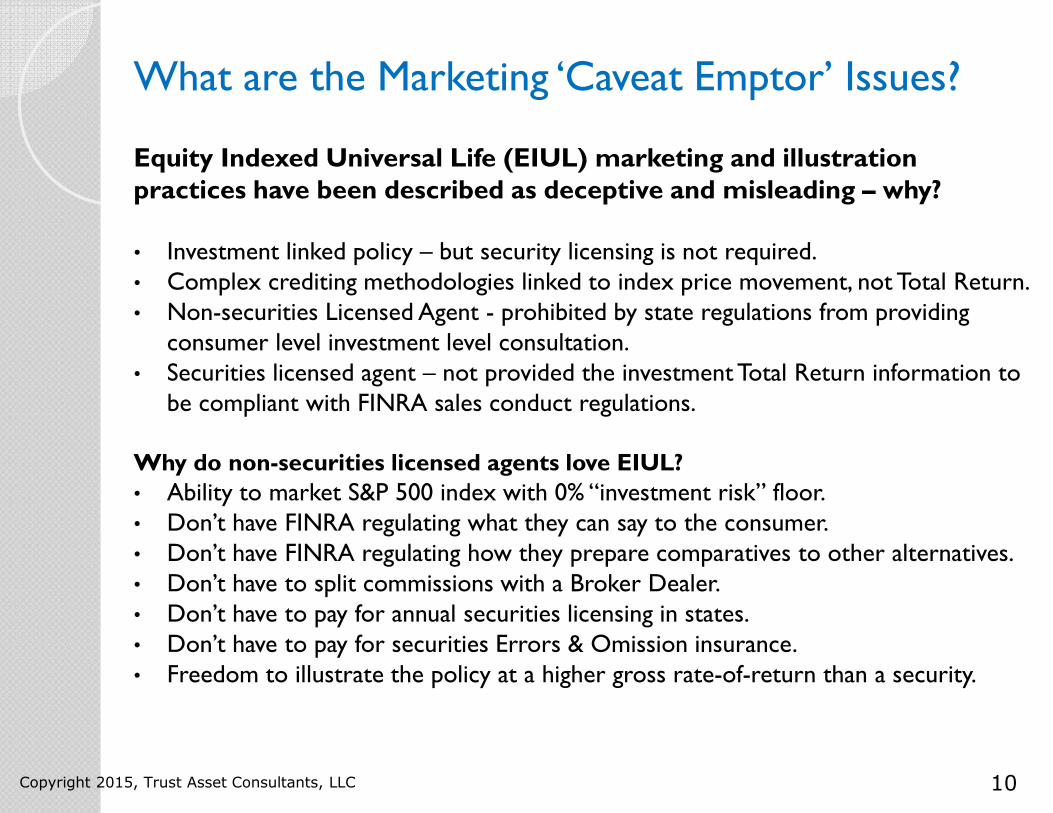
Equity Indexed Universal Life (EIUL) marketing and illustration practices have been described as deceptive and misleading – why?
• Investment linked policy – but security licensing is not required.• Complex crediting methodologies linked to index price movement, not Total Return.• Non-securities Licensed Agent - prohibited by state regulations from providing
consumer level investment level consultation.• Securities licensed agent – not provided the investment Total Return information to
be compliant with FINRA sales conduct regulations.
Why do non-securities licensed agents love EIUL?
• Ability to market S&P 500 index with 0% “investment risk” floor.• Don’t have FINRA regulating what they can say to the consumer.• Don’t have FINRA regulating how they prepare comparatives to other alternatives.• Don’t have to split commissions with a Broker Dealer.• Don’t have to pay for annual securities licensing in states.• Don’t have to pay for securities Errors & Omission insurance.• Freedom to illustrate the policy at a higher gross rate-of-return than a security.
Copyright 2015, Trust Asset Consultants, LLC
11
What are the Consumer’s Suitability Issues?
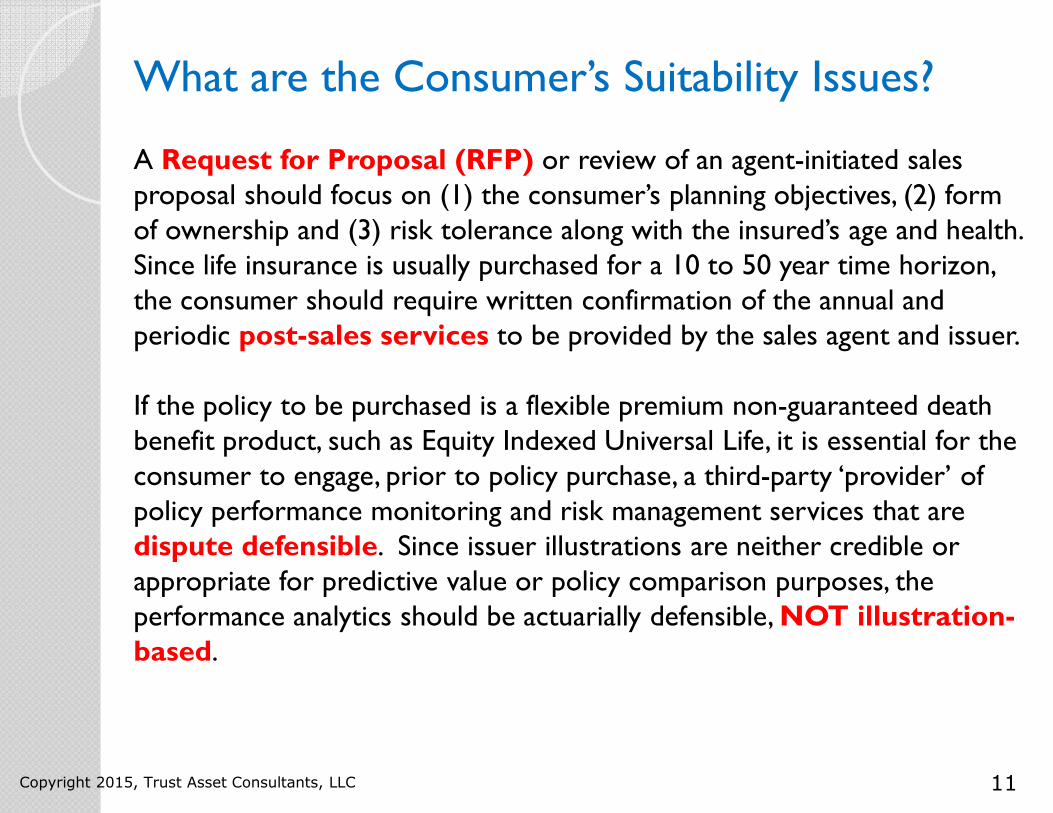
A Request for Proposal (RFP) or review of an agent-initiated sales proposal should focus on (1) the consumer’s planning objectives, (2) form of ownership and (3) risk tolerance along with the insured’s age and health. Since life insurance is usually purchased for a 10 to 50 year time horizon, the consumer should require written confirmation of the annual and periodic post-sales services to be provided by the sales agent and issuer.
If the policy to be purchased is a flexible premium non-guaranteed death benefit product, such as Equity Indexed Universal Life, it is essential for the consumer to engage, prior to policy purchase, a third-party ‘provider’ of policy performance monitoring and risk management services that are dispute defensible. Since issuer illustrations are neither credible or appropriate for predictive value or policy comparison purposes, the performance analytics should be actuarially defensible, NOT illustration-based.
Copyright 2015, Trust Asset Consultants, LLC
12
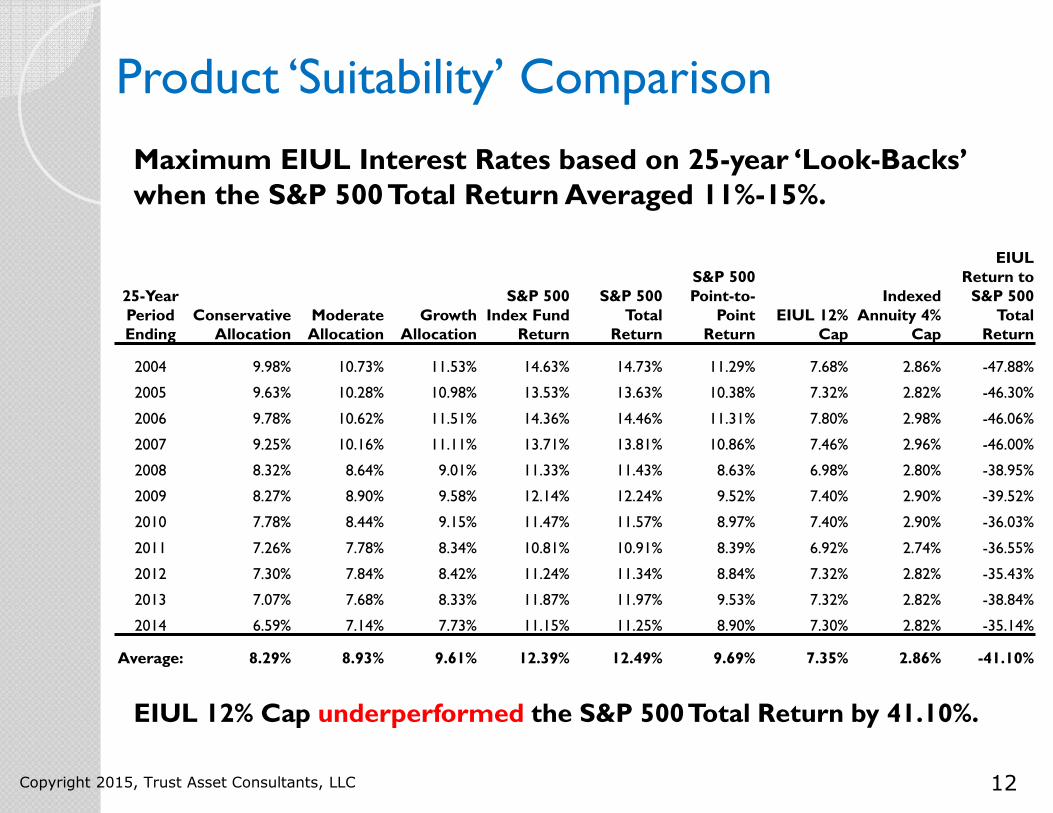
Product ‘Suitability’ Comparison
Maximum EIUL Interest Rates based on 25-year ‘Look-Backs’ when the S&P 500 Total Return Averaged 11%-15%.
EIUL 12% Cap underperformed the S&P 500 Total Return by 41.10%.
Copyright 2015, Trust Asset Consultants, LLC
25-Year Period Ending
Conservative Allocation
Moderate Allocation
Growth Allocation
S&P 500 Index Fund
Return
S&P 500 Total
Return
S&P 500 Point-to-
Point Return
EIUL 12% Cap
Indexed Annuity 4%
Cap
EIUL Return to S&P 500
Total Return
2004 9.98% 10.73% 11.53% 14.63% 14.73% 11.29% 7.68% 2.86% -47.88%
2005 9.63% 10.28% 10.98% 13.53% 13.63% 10.38% 7.32% 2.82% -46.30%
2006 9.78% 10.62% 11.51% 14.36% 14.46% 11.31% 7.80% 2.98% -46.06%
2007 9.25% 10.16% 11.11% 13.71% 13.81% 10.86% 7.46% 2.96% -46.00%
2008 8.32% 8.64% 9.01% 11.33% 11.43% 8.63% 6.98% 2.80% -38.95%
2009 8.27% 8.90% 9.58% 12.14% 12.24% 9.52% 7.40% 2.90% -39.52%
2010 7.78% 8.44% 9.15% 11.47% 11.57% 8.97% 7.40% 2.90% -36.03%
2011 7.26% 7.78% 8.34% 10.81% 10.91% 8.39% 6.92% 2.74% -36.55%
2012 7.30% 7.84% 8.42% 11.24% 11.34% 8.84% 7.32% 2.82% -35.43%
2013 7.07% 7.68% 8.33% 11.87% 11.97% 9.53% 7.32% 2.82% -38.84%
2014 6.59% 7.14% 7.73% 11.15% 11.25% 8.90% 7.30% 2.82% -35.14%
Average: 8.29% 8.93% 9.61% 12.39% 12.49% 9.69% 7.35% 2.86% -41.10%
13
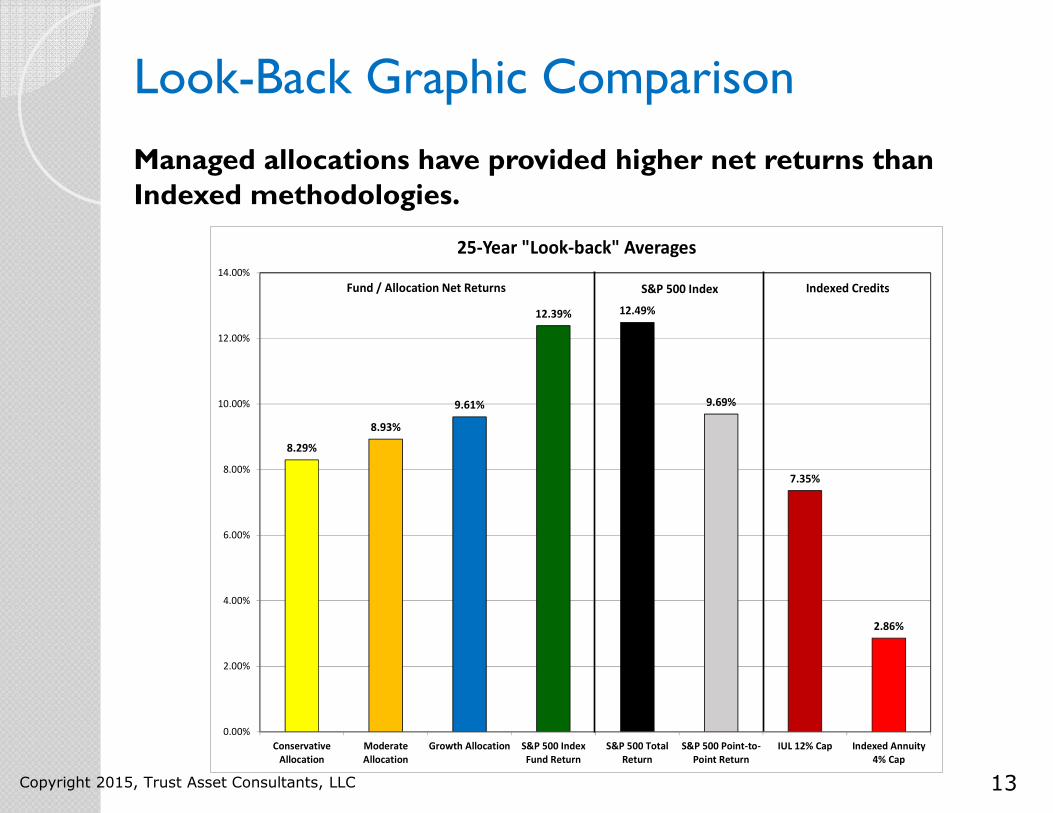
Look-Back Graphic Comparison
Managed allocations have provided higher net returns than Indexed methodologies.
Copyright 2015, Trust Asset Consultants, LLC
8.29%
8.93%
9.61%
12.39% 12.49%
9.69%
7.35%
2.86%
0.00%
2.00%
4.00%
6.00%
8.00%
10.00%
12.00%
14.00%
Conservative
Allocation
Moderate
Allocation
Growth Allocation S&P 500 Index
Fund Return
S&P 500 Total
Return
S&P 500 Point-to-
Point Return
IUL 12% Cap Indexed Annuity
4% Cap
25-Year "Look-back" Averages
Fund / Allocation Net Returns S&P 500 Index Indexed Credits
14
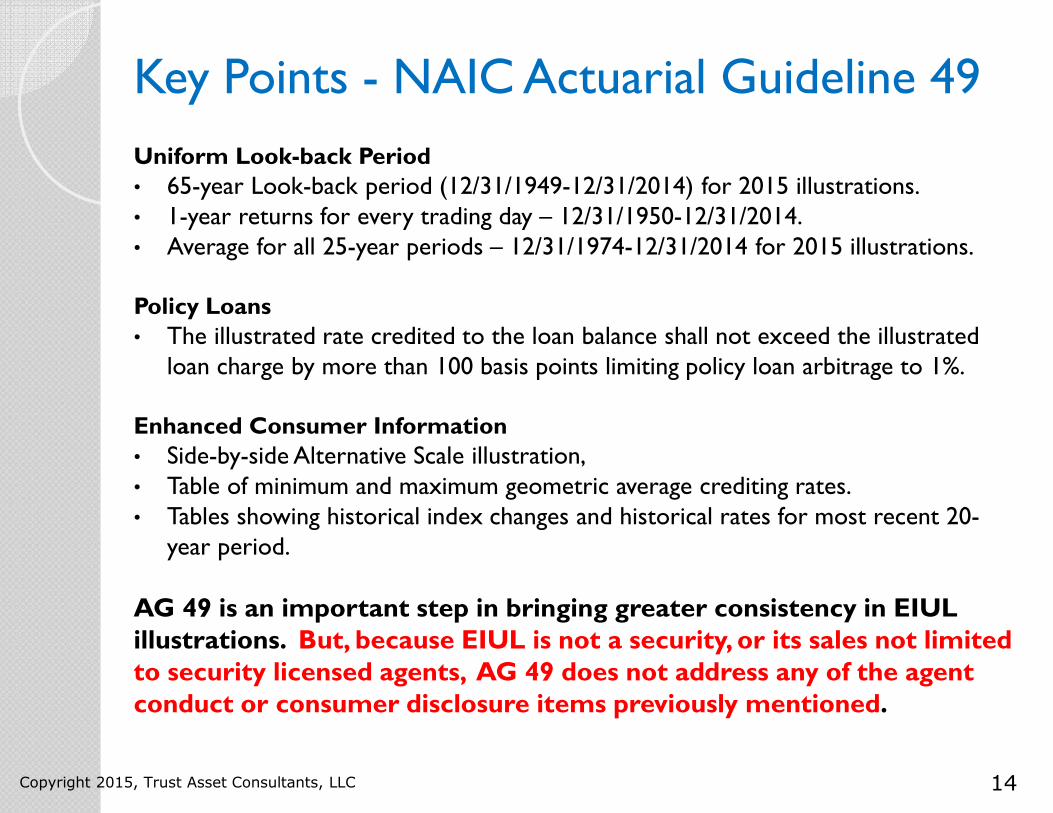
Key Points - NAIC Actuarial Guideline 49
Uniform Look-back Period
• 65-year Look-back period (12/31/1949-12/31/2014) for 2015 illustrations.• 1-year returns for every trading day – 12/31/1950-12/31/2014.• Average for all 25-year periods – 12/31/1974-12/31/2014 for 2015 illustrations.
Policy Loans
• The illustrated rate credited to the loan balance shall not exceed the illustrated loan charge by more than 100 basis points limiting policy loan arbitrage to 1%.
Enhanced Consumer Information
• Side-by-side Alternative Scale illustration, • Table of minimum and maximum geometric average crediting rates.• Tables showing historical index changes and historical rates for most recent 20-
year period.
AG 49 is an important step in bringing greater consistency in EIUL illustrations. But, because EIUL is not a security, or its sales not limited to security licensed agents, AG 49 does not address any of the agent conduct or consumer disclosure items previously mentioned.
Copyright 2015, Trust Asset Consultants, LLC
15
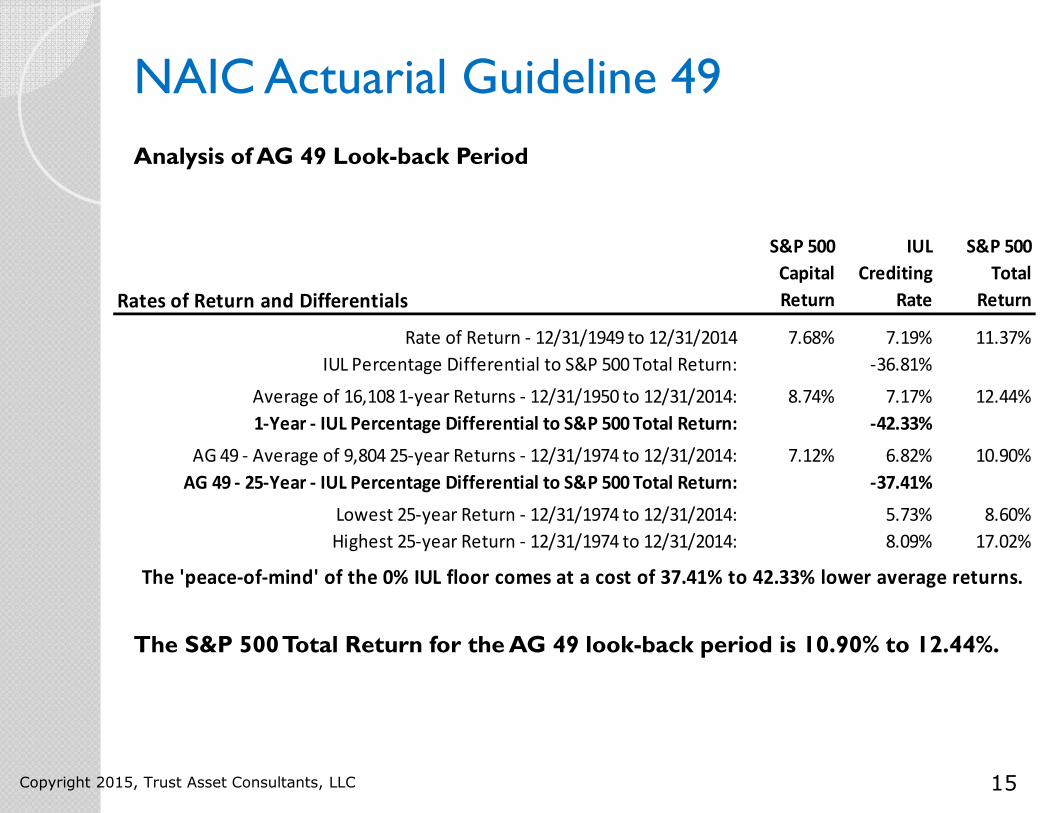
NAIC Actuarial Guideline 49
Analysis of AG 49 Look-back Period
The S&P 500 Total Return for the AG 49 look-back period is 10.90% to 12.44%.
Copyright 2015, Trust Asset Consultants, LLC
Rates of Return and Differentials
S&P 500
Capital
Return
IUL
Crediting
Rate
S&P 500
Total
Return
Rate of Return - 12/31/1949 to 12/31/2014 7.68% 7.19% 11.37%
IUL Percentage Differential to S&P 500 Total Return: -36.81%
Average of 16,108 1-year Returns - 12/31/1950 to 12/31/2014: 8.74% 7.17% 12.44%
1-Year - IUL Percentage Differential to S&P 500 Total Return: -42.33%
AG 49 - Average of 9,804 25-year Returns - 12/31/1974 to 12/31/2014: 7.12% 6.82% 10.90%
AG 49 - 25-Year - IUL Percentage Differential to S&P 500 Total Return: -37.41%
Lowest 25-year Return - 12/31/1974 to 12/31/2014: 5.73% 8.60%
Highest 25-year Return - 12/31/1974 to 12/31/2014: 8.09% 17.02%
The 'peace-of-mind' of the 0% IUL floor comes at a cost of 37.41% to 42.33% lower average returns.
16
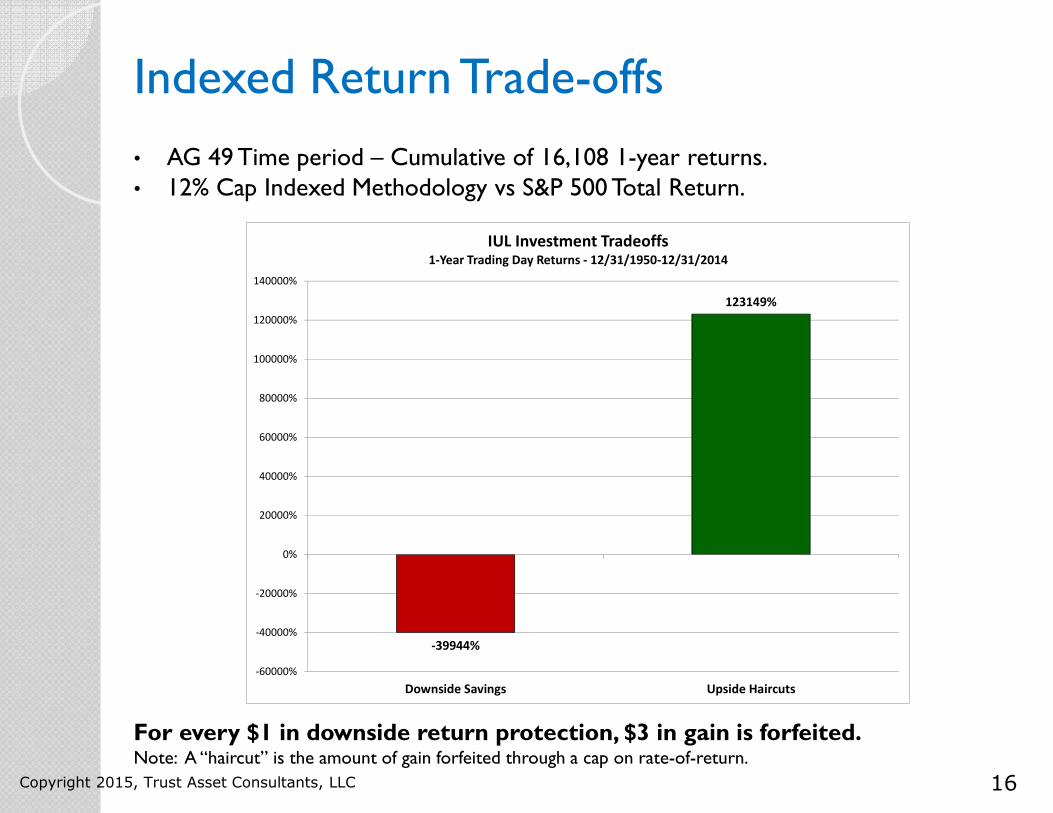
Indexed Return Trade-offs
• AG 49 Time period – Cumulative of 16,108 1-year returns.• 12% Cap Indexed Methodology vs S&P 500 Total Return.
For every $1 in downside return protection, $3 in gain is forfeited.Note: A “haircut” is the amount of gain forfeited through a cap on rate-of-return.
Copyright 2015, Trust Asset Consultants, LLC
-39944%
123149%
-60000%
-40000%
-20000%
0%
20000%
40000%
60000%
80000%
100000%
120000%
140000%
Downside Savings Upside Haircuts
IUL Investment Tradeoffs1-Year Trading Day Returns - 12/31/1950-12/31/2014
17
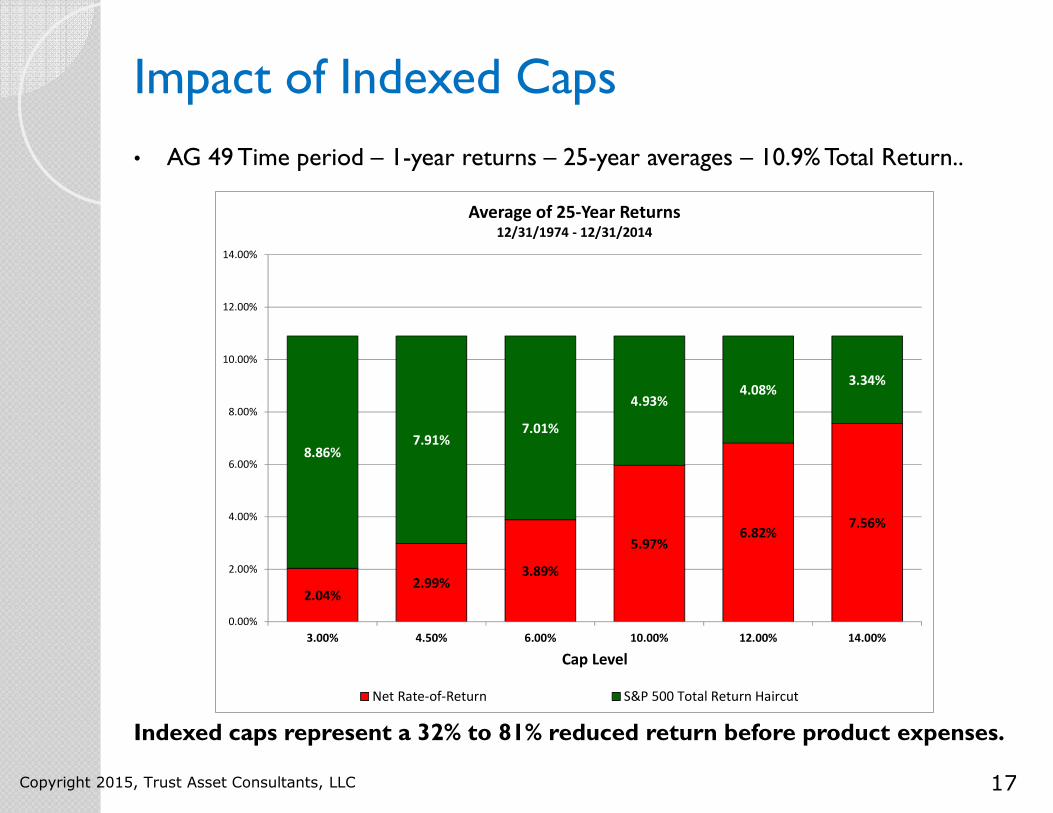
Impact of Indexed Caps
• AG 49 Time period – 1-year returns – 25-year averages – 10.9% Total Return..
Indexed caps represent a 32% to 81% reduced return before product expenses.
Copyright 2015, Trust Asset Consultants, LLC
2.04%2.99%
3.89%
5.97%6.82%
7.56%
8.86%7.91%
7.01%
4.93%4.08%
3.34%
0.00%
2.00%
4.00%
6.00%
8.00%
10.00%
12.00%
14.00%
3.00% 4.50% 6.00% 10.00% 12.00% 14.00%
Cap Level
Average of 25-Year Returns12/31/1974 - 12/31/2014
Net Rate-of-Return S&P 500 Total Return Haircut
18
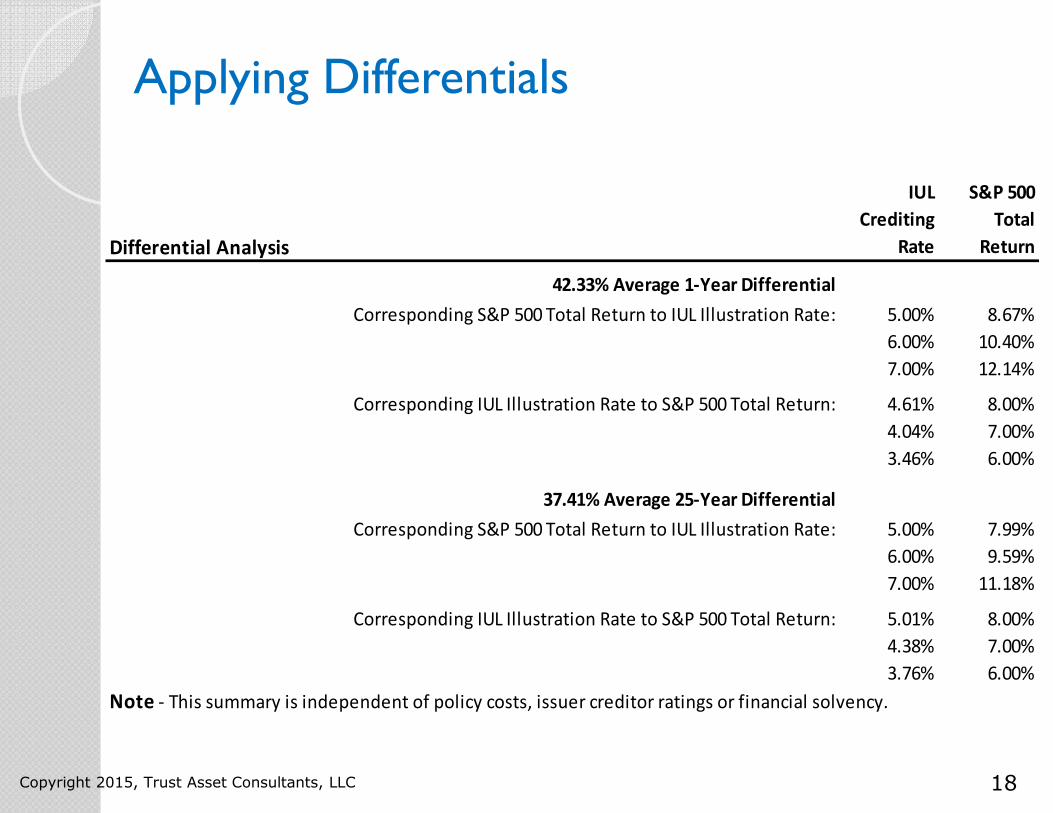
Applying Differentials
Copyright 2015, Trust Asset Consultants, LLC
Differential Analysis
IUL
Crediting
Rate
S&P 500
Total
Return
42.33% Average 1-Year Differential
Corresponding S&P 500 Total Return to IUL Illustration Rate: 5.00% 8.67%
6.00% 10.40%
7.00% 12.14%
Corresponding IUL Illustration Rate to S&P 500 Total Return: 4.61% 8.00%
4.04% 7.00%
3.46% 6.00%
37.41% Average 25-Year Differential
Corresponding S&P 500 Total Return to IUL Illustration Rate: 5.00% 7.99%
6.00% 9.59%
7.00% 11.18%
Corresponding IUL Illustration Rate to S&P 500 Total Return: 5.01% 8.00%
4.38% 7.00%
3.76% 6.00%
Note - This summary is independent of policy costs, issuer creditor ratings or financial solvency.
19
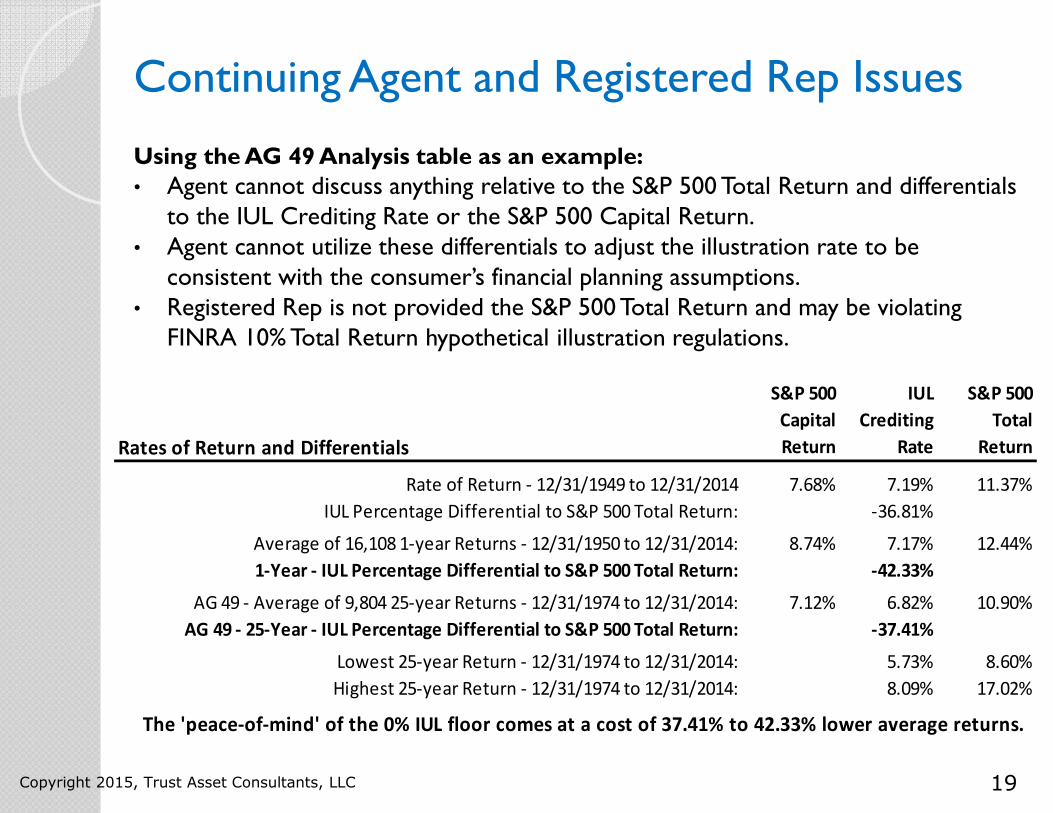
Continuing Agent and Registered Rep Issues
Using the AG 49 Analysis table as an example:
• Agent cannot discuss anything relative to the S&P 500 Total Return and differentials to the IUL Crediting Rate or the S&P 500 Capital Return.
• Agent cannot utilize these differentials to adjust the illustration rate to be consistent with the consumer’s financial planning assumptions.
• Registered Rep is not provided the S&P 500 Total Return and may be violating FINRA 10% Total Return hypothetical illustration regulations.
Copyright 2015, Trust Asset Consultants, LLC
Rates of Return and Differentials
S&P 500
Capital
Return
IUL
Crediting
Rate
S&P 500
Total
Return
Rate of Return - 12/31/1949 to 12/31/2014 7.68% 7.19% 11.37%
IUL Percentage Differential to S&P 500 Total Return: -36.81%
Average of 16,108 1-year Returns - 12/31/1950 to 12/31/2014: 8.74% 7.17% 12.44%
1-Year - IUL Percentage Differential to S&P 500 Total Return: -42.33%
AG 49 - Average of 9,804 25-year Returns - 12/31/1974 to 12/31/2014: 7.12% 6.82% 10.90%
AG 49 - 25-Year - IUL Percentage Differential to S&P 500 Total Return: -37.41%
Lowest 25-year Return - 12/31/1974 to 12/31/2014: 5.73% 8.60%
Highest 25-year Return - 12/31/1974 to 12/31/2014: 8.09% 17.02%
The 'peace-of-mind' of the 0% IUL floor comes at a cost of 37.41% to 42.33% lower average returns.
20
EIUL Terminology
• Point-to-Point –The rate-of-return measured by the index price between the Crediting Block starting and ending period. Typically 1 to 5 years.
• Crediting Block – Each premium payment creates a Point-to-Point return period.• Participation Rate –The percent of the point-to-point return credited.• Cap –The maximum point-to-point return allowed.• Threshold –The minimum point-to-point return for crediting of the excess.
How IUL Operates
• Cash values allocated to an Indexed Crediting Block are credited with interest at the end of period.
• Those cash values may earn 0% during the period.• If the policy is surrendered, or cash values withdrawn or borrowed, associated
potential crediting may be forfeited.• As an example, someone paying monthly and using 5-year point-to-point
methodologies could have 60 crediting blocks in play at all times with 59 of them subject to forfeiture.
Copyright 2015, Trust Asset Consultants, LLC
21
Suitability Issues
Crediting
• Indexed insurance products (Annuity or Universal Life) do not change the underlying volatility of the index – they merely limit the range-of-return.
• Historically, this means most of the time the consumer received 0% or the maximum per the methodology.
• Non-participation in dividends means reduced point-to-point returns compared to the indexes Total Return.
Policy Costs
• Indexed Universal Life policy charges typically are higher than other Universal Life based alternatives.
• 20%-35% lower priced Institutionally-priced Variable Universal Life is now available to affluent individuals performing “white-collar” roles in the workplace.
Note: An informed, reasoned and prudent product suitability determination requires access to objective and unbiased information upon which such a determination can be made. Our review of product feature trade-offs is intended only to provide the information requisite to an informed determination.
Copyright 2015, Trust Asset Consultants, LLC
22
Annual Policy Service and Management
• IUL requires ongoing investment management decisions – ongoing determinations of when to invest in the indexed or the fixed account alternatives.
• Has there been a change in long-term market expectations requiring policy re-illustration at a different crediting rate?
• Has there been a change in the insured’s health that could impact premiums or death benefit options?
• Was the policy ‘sold’ (or purchased) as a retirement income supplement requiring ongoing death benefit and death benefit option management?
• Is the agent licensed to provide requisite input on market conditions to policy expectations?
• What ‘form’ does this annual review take? Was a Life Insurance ‘Investment Policy Statement’ formalized at the time of policy purchase that sets out the issues to be monitored and reviewed, and the parties involved in this process?
Copyright 2015, Trust Asset Consultants, LLC
23
Take Aways
• Both our FSP Article and this presentation are not intended to diminish the importance of the IUL policy.
• Our objective is Full Consumer Disclosure so individuals and their advisor can make fully informed decisions about IUL’s complex methodology and pricing.
• AG 49 implements a uniform methodology for determining the maximum allowable policy illustration rate. AG 49 does not address the reasonableness or prudence of using historical returns as a basis for future planning.
• Individuals / advisors should be aware that agent licensing and agent market focus prohibits access to Institutionally-priced policies that may be more suitable for affluent “white-collar” individuals.
Copyright 2015, Trust Asset Consultants, LLC
24
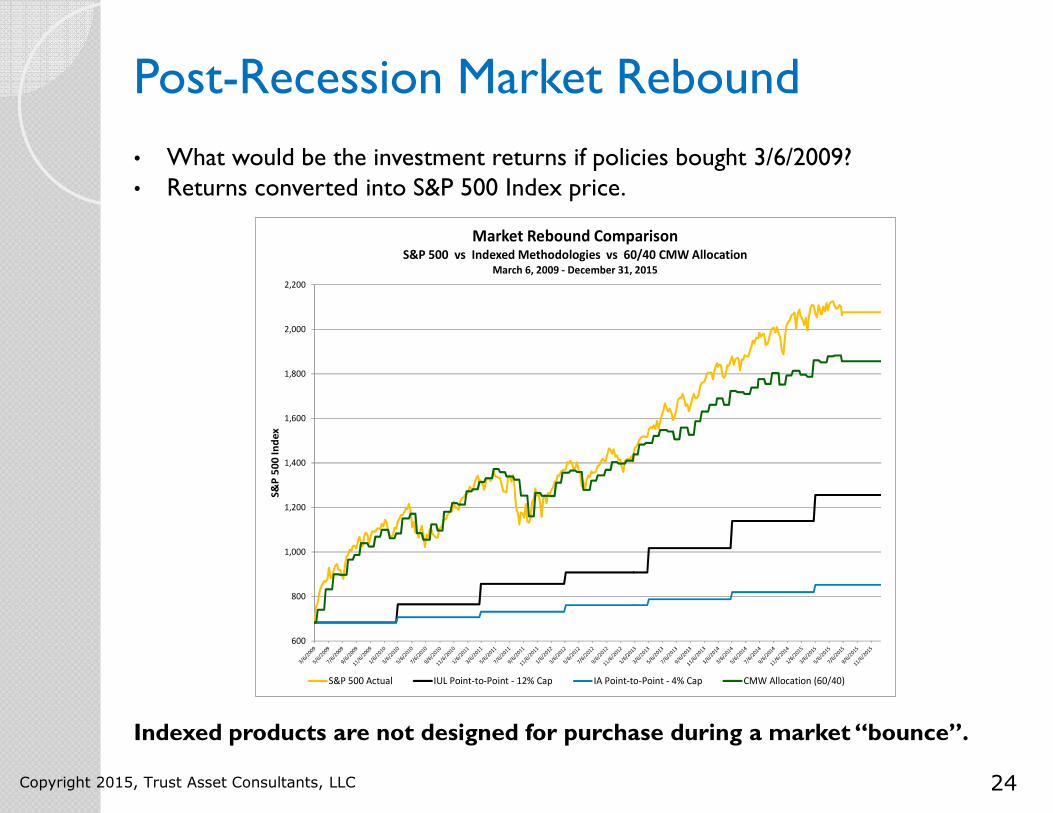
Post-Recession Market Rebound
• What would be the investment returns if policies bought 3/6/2009?• Returns converted into S&P 500 Index price.
Indexed products are not designed for purchase during a market “bounce”.
Copyright 2015, Trust Asset Consultants, LLC
600
800
1,000
1,200
1,400
1,600
1,800
2,000
2,200S
&P
50
0 I
nd
ex
Market Rebound ComparisonS&P 500 vs Indexed Methodologies vs 60/40 CMW Allocation
March 6, 2009 - December 31, 2015
S&P 500 Actual IUL Point-to-Point - 12% Cap IA Point-to-Point - 4% Cap CMW Allocation (60/40)
25
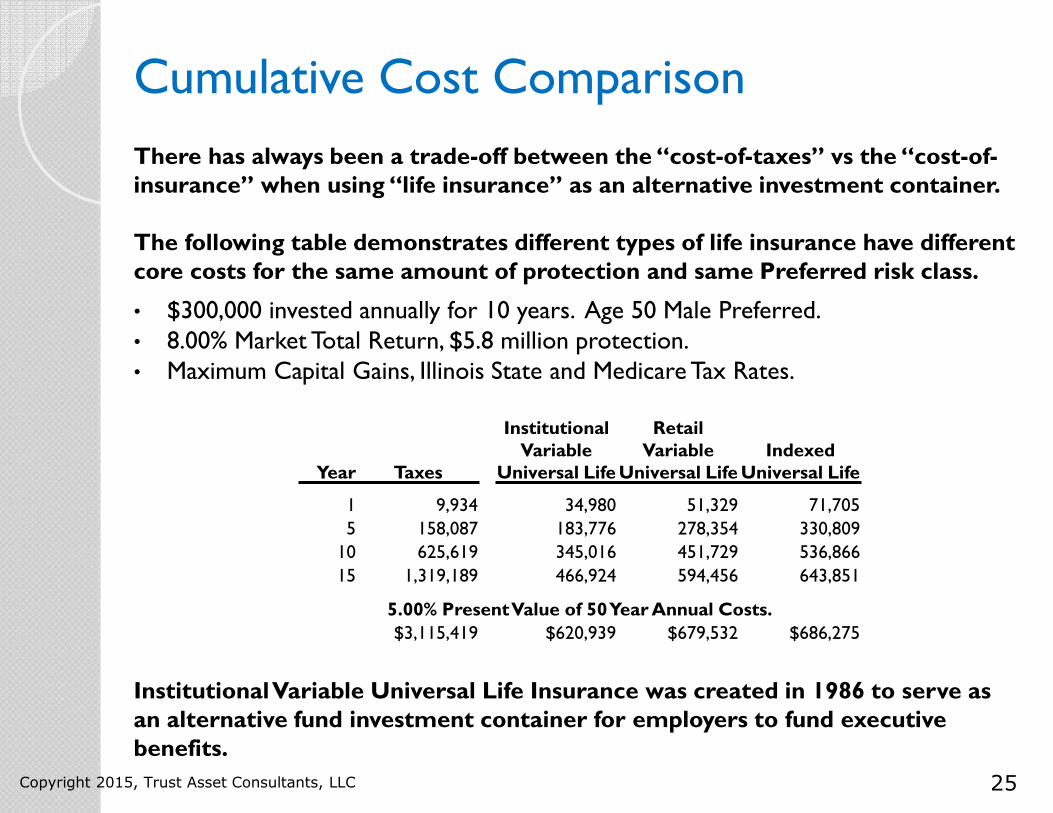
Cumulative Cost Comparison
There has always been a trade-off between the “cost-of-taxes” vs the “cost-of-insurance” when using “life insurance” as an alternative investment container.
The following table demonstrates different types of life insurance have different core costs for the same amount of protection and same Preferred risk class.
• $300,000 invested annually for 10 years. Age 50 Male Preferred. • 8.00% Market Total Return, $5.8 million protection. • Maximum Capital Gains, Illinois State and Medicare Tax Rates.
Institutional Variable Universal Life Insurance was created in 1986 to serve as an alternative fund investment container for employers to fund executive benefits.
Copyright 2015, Trust Asset Consultants, LLC
Year Taxes
Institutional Variable
Universal Life
Retail Variable
Universal LifeIndexed
Universal Life
1 9,934 34,980 51,329 71,705
5 158,087 183,776 278,354 330,809
10 625,619 345,016 451,729 536,866
15 1,319,189 466,924 594,456 643,851
5.00% Present Value of 50 Year Annual Costs.
$3,115,419 $620,939 $679,532 $686,275
26
II - How Consumers and Advisors Should Interpret NAIC Actuarial Guideline 49.
• AG 49 provides the methodology and time period for analyzing historical returns.
• By extension – AG 49 provides the prescribed annual differential for Personal Financial Planning and FINRA compliant “hypothetical illustrations of mathematical principles”.
AG 49 represents NAIC best practices for (1) preparing illustrations consistent with a consumers planning objectives and (2) comparisons to other insurance products and financial alternatives.
Copyright 2015, Trust Asset Consultants, LLC
27
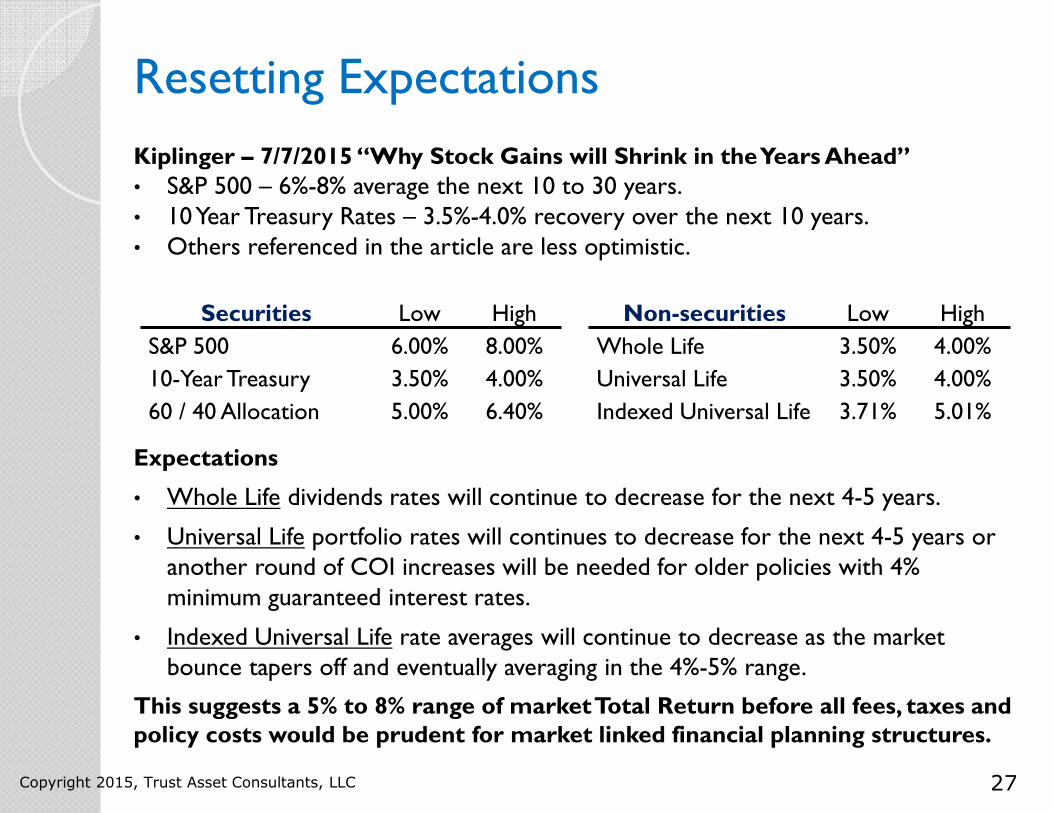
Resetting Expectations
Kiplinger – 7/7/2015 “Why Stock Gains will Shrink in the Years Ahead”
• S&P 500 – 6%-8% average the next 10 to 30 years.• 10 Year Treasury Rates – 3.5%-4.0% recovery over the next 10 years.• Others referenced in the article are less optimistic.
Expectations
• Whole Life dividends rates will continue to decrease for the next 4-5 years.
• Universal Life portfolio rates will continues to decrease for the next 4-5 years or another round of COI increases will be needed for older policies with 4% minimum guaranteed interest rates.
• Indexed Universal Life rate averages will continue to decrease as the market bounce tapers off and eventually averaging in the 4%-5% range.
This suggests a 5% to 8% range of market Total Return before all fees, taxes and policy costs would be prudent for market linked financial planning structures.
Copyright 2015, Trust Asset Consultants, LLC
Securities Low High Non-securities Low High
S&P 500 6.00% 8.00% Whole Life 3.50% 4.00%
10-Year Treasury 3.50% 4.00% Universal Life 3.50% 4.00%
60 / 40 Allocation 5.00% 6.40% Indexed Universal Life 3.71% 5.01%
28
III - Applying FINRA and NAIC Best Practices.
• FINRA (Financial Industry Regulatory Authority) implemented in 2/2013 Rule 2210(d)(4)(C) regulating how a registered rep. prepares “hypothetical illustrations of mathematical principles” – ie 401(k) vs Roth IRA vs Taxable Investing vs Annuity vs Life Insurance vs 409A based Executive Benefits , etc.
• NAIC AG 49 provides the differential for use in FINRA compliant hypothetical illustrations.
Combining FINRA and NAIC best practices results in an objective mathematical comparison of planning alternatives.
Copyright 2015, Trust Asset Consultants, LLC
29
FINRA Best Practices
A FINRA Rule 2210(d)(4)(C) compatible methodology:
• Starts with a common market Total Return assumption, 10% maximum – i.e. 8.00%.
• Factors contributions for different federal and state taxes – i.e. $10,000 after-tax equivalent contribution.
• Recognizes different structures have different average fund fees or crediting methodology differentials on Total Return.
• Factors distributions for different federal and state taxes, early distribution penalties or cash access limitations.
The result is an “All things being equal” comparison of the “net cash off the table today” and “net cash back on the table tomorrow” of using these different investment management containers should the individual live, get sick or die.
Regardless of whether the life insurance policy is technically a “security” or not, this is the best practices methodology that should be used to compare hypothetical illustrations of different financial structures.
Copyright 2015, Trust Asset Consultants, LLC
30
IV - Action Steps for EIUL Policy Owners.
• Define a range of S&P 500 Total Return assumptions. ie. 5.00% to 8.00%
• Apply the AG 49 differential for the Cap most consistent with your policy.
• Request re-illustration of your policy at these rates.
• Request comparable illustrations of Retail or Institutional alternatives.
• Obtain Monte Carlo simulations of alternatives to ascertain implications of Standard Deviation and variable rates-of-return on Indexed methodologies and asset allocation alternatives.
• Evaluate Retention, Asset Diversification and 1035 Exchange alternatives.
• Ascertain more suitable options assuming (1) fluctuating market returns and (2) possibility / probability that medical science with continue to let members of your economic and risk profile live longer than they do today.
Re-illustration based on your planning assumptions will have significant impact on premium contributions and / or long-term policy values.
These Action Steps provide the information needed to ascertain the EIUL policy’s true “fit” in our Personal Financial Plan or Estate Plan.
Copyright 2015, Trust Asset Consultants, LLC
31
Resetting Expectations
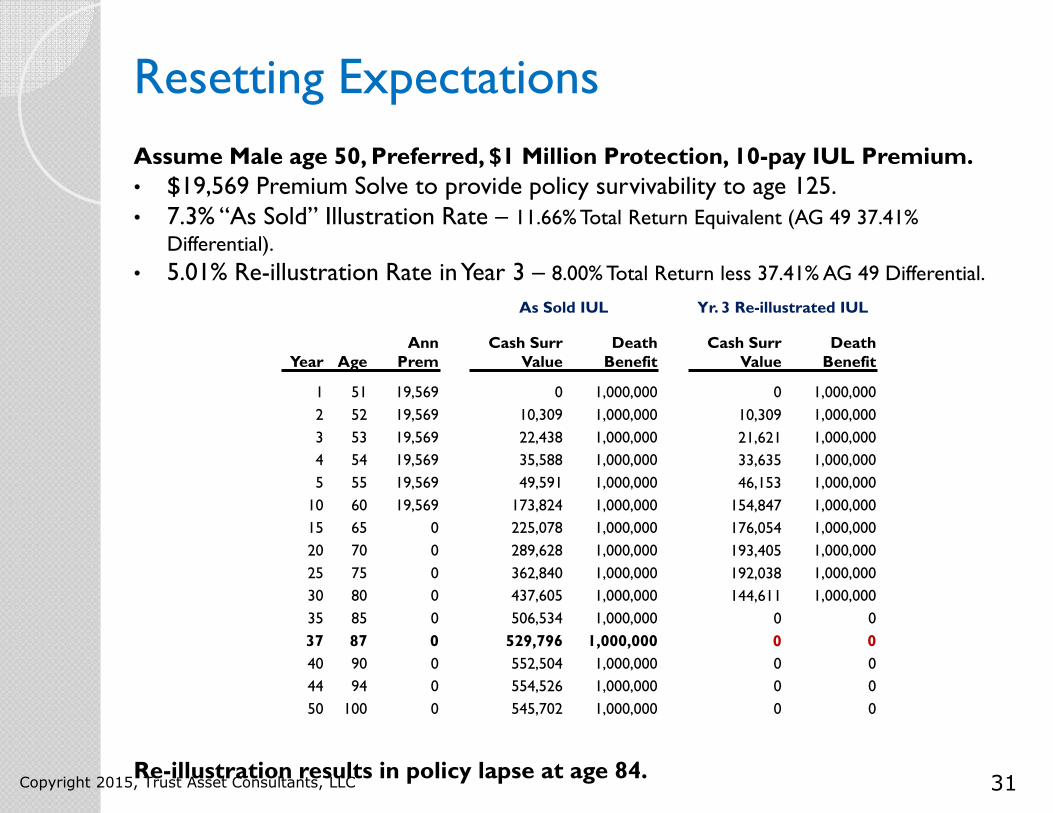
Assume Male age 50, Preferred, $1 Million Protection, 10-pay IUL Premium.
• $19,569 Premium Solve to provide policy survivability to age 125.• 7.3% “As Sold” Illustration Rate – 11.66% Total Return Equivalent (AG 49 37.41%
Differential).
• 5.01% Re-illustration Rate in Year 3 – 8.00% Total Return less 37.41% AG 49 Differential.
Re-illustration results in policy lapse at age 84.Copyright 2015, Trust Asset Consultants, LLC
As Sold IUL Yr. 3 Re-illustrated IUL
Year AgeAnn
PremCash Surr
ValueDeath Benefit
Cash SurrValue
Death Benefit
1 51 19,569 0 1,000,000 0 1,000,000
2 52 19,569 10,309 1,000,000 10,309 1,000,000
3 53 19,569 22,438 1,000,000 21,621 1,000,000
4 54 19,569 35,588 1,000,000 33,635 1,000,000
5 55 19,569 49,591 1,000,000 46,153 1,000,000
10 60 19,569 173,824 1,000,000 154,847 1,000,000
15 65 0 225,078 1,000,000 176,054 1,000,000
20 70 0 289,628 1,000,000 193,405 1,000,000
25 75 0 362,840 1,000,000 192,038 1,000,000
30 80 0 437,605 1,000,000 144,611 1,000,000
35 85 0 506,534 1,000,000 0 0
37 87 0 529,796 1,000,000 0 0
40 90 0 552,504 1,000,000 0 0
44 94 0 554,526 1,000,000 0 0
50 100 0 545,702 1,000,000 0 0
32
Restructuring With ILI
Institutional Life Insurance (ILI) is the subject of our June 2015 article in FSP’s Financial Planning Newsletter – Institutional Life Insurance – A More Suitable Investment Management Container for Affluent Individuals and ILIT Trustees. Hence, comparison is made to ILI for discussion purposes.
This comparison maintains the 8.00% S&P 500 Total Return planning assumption before (1) ILI S&P 500 Index Fund fee (.27%) and 5.01% IUL illustration rate net of AG 49 37.41% differential. All planning and market assumptions are the same.
The illustrated value differences are the result of:
• Retail vs Institutional policy pricing methodologies.• Retail vs Institutional “Preferred” risk rates – different risk pools.• Investing policy cash values in an S&P 500 Index fund vs IUL Indexed methodology.
Note: These illustrations do not factor potential increases in life expectancy resulting from ongoing medical advancements and potential reductions in the ILI mortality risk rates.
The following hypothetical illustrations are for educational purposes only.
Copyright 2015, Trust Asset Consultants, LLC
33
Restructuring With ILI
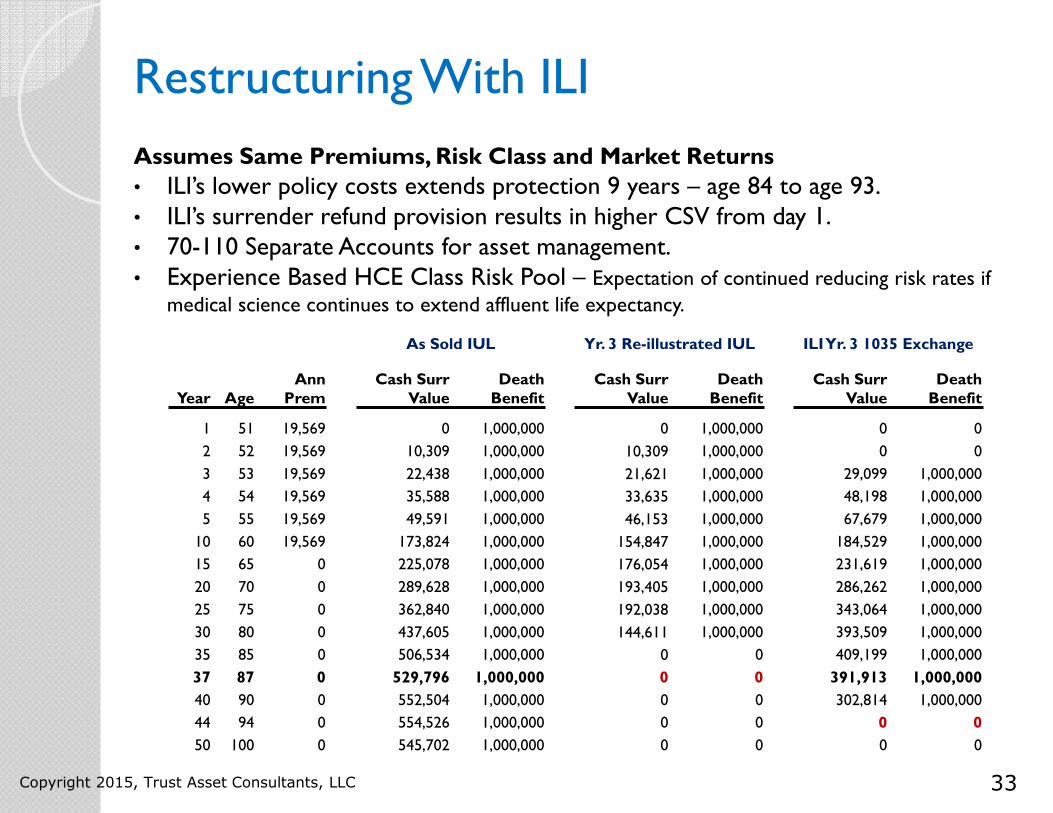
Assumes Same Premiums, Risk Class and Market Returns
• ILI’s lower policy costs extends protection 9 years – age 84 to age 93.• ILI’s surrender refund provision results in higher CSV from day 1.• 70-110 Separate Accounts for asset management.• Experience Based HCE Class Risk Pool – Expectation of continued reducing risk rates if
medical science continues to extend affluent life expectancy.
Copyright 2015, Trust Asset Consultants, LLC
As Sold IUL Yr. 3 Re-illustrated IUL ILI Yr. 3 1035 Exchange
Year AgeAnn
PremCash Surr
ValueDeath Benefit
Cash SurrValue
Death Benefit
Cash SurrValue
Death Benefit
1 51 19,569 0 1,000,000 0 1,000,000 0 0
2 52 19,569 10,309 1,000,000 10,309 1,000,000 0 0
3 53 19,569 22,438 1,000,000 21,621 1,000,000 29,099 1,000,000
4 54 19,569 35,588 1,000,000 33,635 1,000,000 48,198 1,000,000
5 55 19,569 49,591 1,000,000 46,153 1,000,000 67,679 1,000,000
10 60 19,569 173,824 1,000,000 154,847 1,000,000 184,529 1,000,000
15 65 0 225,078 1,000,000 176,054 1,000,000 231,619 1,000,000
20 70 0 289,628 1,000,000 193,405 1,000,000 286,262 1,000,000
25 75 0 362,840 1,000,000 192,038 1,000,000 343,064 1,000,000
30 80 0 437,605 1,000,000 144,611 1,000,000 393,509 1,000,000
35 85 0 506,534 1,000,000 0 0 409,199 1,000,000
37 87 0 529,796 1,000,000 0 0 391,913 1,000,000
40 90 0 552,504 1,000,000 0 0 302,814 1,000,000
44 94 0 554,526 1,000,000 0 0 0 0
50 100 0 545,702 1,000,000 0 0 0 0
34
Restructuring With ILI
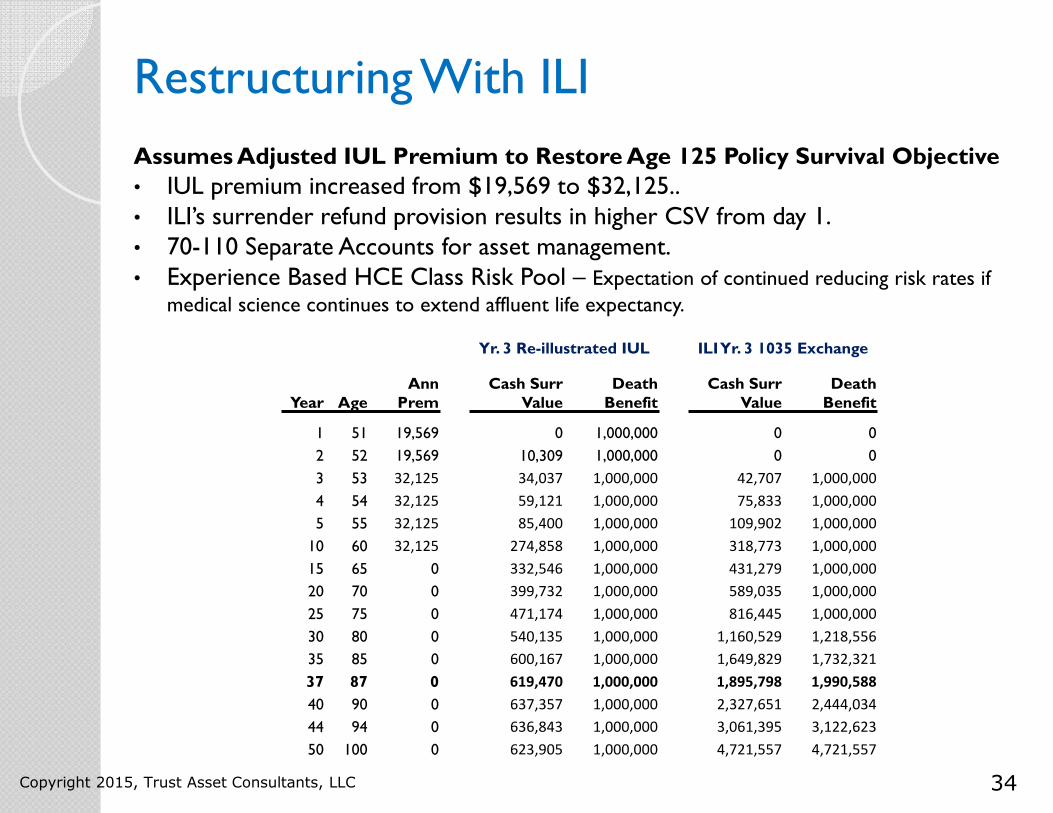
Assumes Adjusted IUL Premium to Restore Age 125 Policy Survival Objective
• IUL premium increased from $19,569 to $32,125..• ILI’s surrender refund provision results in higher CSV from day 1.• 70-110 Separate Accounts for asset management.• Experience Based HCE Class Risk Pool – Expectation of continued reducing risk rates if
medical science continues to extend affluent life expectancy.
Copyright 2015, Trust Asset Consultants, LLC
Yr. 3 Re-illustrated IUL ILI Yr. 3 1035 Exchange
Year AgeAnn
PremCash Surr
ValueDeath Benefit
Cash SurrValue
Death Benefit
1 51 19,569 0 1,000,000 0 0
2 52 19,569 10,309 1,000,000 0 0
3 53 32,125 34,037 1,000,000 42,707 1,000,000
4 54 32,125 59,121 1,000,000 75,833 1,000,000
5 55 32,125 85,400 1,000,000 109,902 1,000,000
10 60 32,125 274,858 1,000,000 318,773 1,000,000
15 65 0 332,546 1,000,000 431,279 1,000,000
20 70 0 399,732 1,000,000 589,035 1,000,000
25 75 0 471,174 1,000,000 816,445 1,000,000
30 80 0 540,135 1,000,000 1,160,529 1,218,556
35 85 0 600,167 1,000,000 1,649,829 1,732,321
37 87 0 619,470 1,000,000 1,895,798 1,990,588
40 90 0 637,357 1,000,000 2,327,651 2,444,034
44 94 0 636,843 1,000,000 3,061,395 3,122,623
50 100 0 623,905 1,000,000 4,721,557 4,721,557
35
V - Prudent Evaluation of New Policy Alternatives.
• Define a range of S&P 500 Total Return assumptions. ie. 5.00% to 8.00%
• Ascertain the AG 49 differential for the Cap most consistent with EIUL alternatives.
• Request comparable illustrations of Retail and Institutional alternatives.
• Obtain Monte Carlo simulations of alternatives to ascertain implications of Standard Deviation and variable rates-of-return on Indexed methodologies and asset allocation alternatives.
• Evaluate Single Policy or Asset Diversification alternatives.
• Ascertain more suitable options assuming (1) fluctuating market returns and (2) possibility / probability that medical science with continue to let members of your economic and risk profile live longer than they do today.
These steps provide the information needed to ascertain the range of opportunity for a consumer’s Personal Financial Plan or Estate Plan.
Copyright 2015, Trust Asset Consultants, LLC
36
Affluent Individual New Policy Alternatives
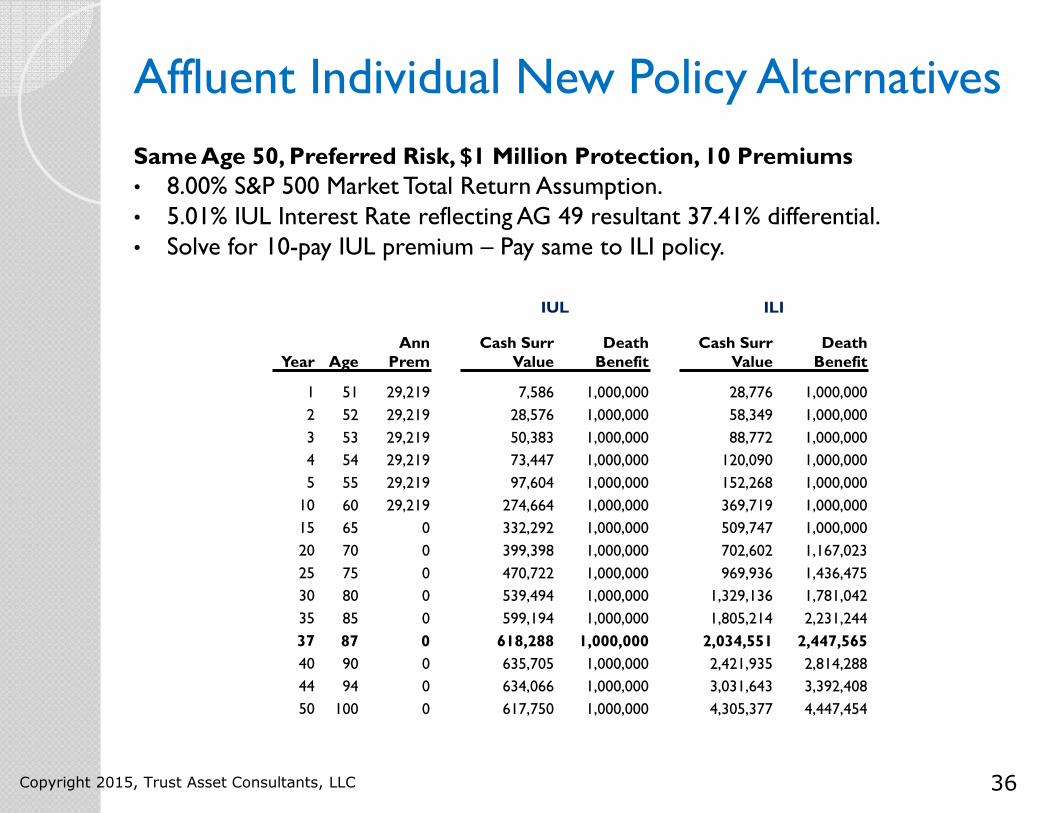
Same Age 50, Preferred Risk, $1 Million Protection, 10 Premiums
• 8.00% S&P 500 Market Total Return Assumption.• 5.01% IUL Interest Rate reflecting AG 49 resultant 37.41% differential.• Solve for 10-pay IUL premium – Pay same to ILI policy.
Copyright 2015, Trust Asset Consultants, LLC
IUL ILI
Year AgeAnn
PremCash Surr
ValueDeath Benefit
Cash Surr Value
Death Benefit
1 51 29,219 7,586 1,000,000 28,776 1,000,000
2 52 29,219 28,576 1,000,000 58,349 1,000,000
3 53 29,219 50,383 1,000,000 88,772 1,000,000
4 54 29,219 73,447 1,000,000 120,090 1,000,000
5 55 29,219 97,604 1,000,000 152,268 1,000,000
10 60 29,219 274,664 1,000,000 369,719 1,000,000
15 65 0 332,292 1,000,000 509,747 1,000,000
20 70 0 399,398 1,000,000 702,602 1,167,023
25 75 0 470,722 1,000,000 969,936 1,436,475
30 80 0 539,494 1,000,000 1,329,136 1,781,042
35 85 0 599,194 1,000,000 1,805,214 2,231,244
37 87 0 618,288 1,000,000 2,034,551 2,447,565
40 90 0 635,705 1,000,000 2,421,935 2,814,288
44 94 0 634,066 1,000,000 3,031,643 3,392,408
50 100 0 617,750 1,000,000 4,305,377 4,447,454
37
Applying Monte Carlo Simulation
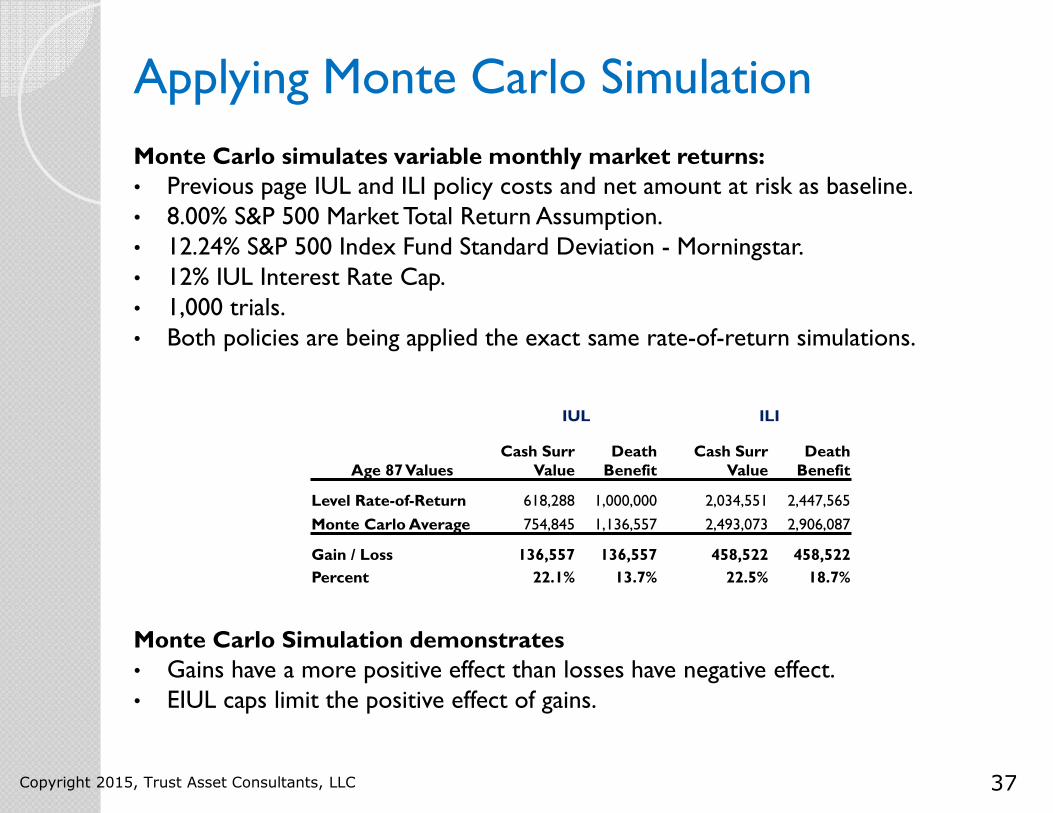
Monte Carlo simulates variable monthly market returns:
• Previous page IUL and ILI policy costs and net amount at risk as baseline.• 8.00% S&P 500 Market Total Return Assumption.• 12.24% S&P 500 Index Fund Standard Deviation - Morningstar.• 12% IUL Interest Rate Cap. • 1,000 trials.• Both policies are being applied the exact same rate-of-return simulations.
Monte Carlo Simulation demonstrates
• Gains have a more positive effect than losses have negative effect.• EIUL caps limit the positive effect of gains.
Copyright 2015, Trust Asset Consultants, LLC
IUL ILI
Age 87 ValuesCash Surr
ValueDeath Benefit
Cash SurrValue
Death Benefit
Level Rate-of-Return 618,288 1,000,000 2,034,551 2,447,565
Monte Carlo Average 754,845 1,136,557 2,493,073 2,906,087
Gain / Loss 136,557 136,557 458,522 458,522
Percent 22.1% 13.7% 22.5% 18.7%
38
Conclusions
Equity Index Universal Life is a non-security alternative for investing cash value in the S&P 500.
• The non-security nature of EIUL exposes the product to deceptive marketing, agent abuses and inaccurate financial comparisons to other financial structures.
• The marketing focus on EIUL’s Indexed methodology has deflective consumer attention on its policy pricing.
• Adult affluent “white-collar” individuals / family members qualify to access Institutional Life Insurance (ILI) pricing and risk pool.
• Access to ILI presents multiple opportunities for individuals / advisors to restore planning objectives on an integrated investment and policy administration basis.
• Adhering to FINRA and NAIC best practices allows consumers and advisor to properly evaluate EIUL’s “fit” in the spectrum of life insurance and non-insurance financial structures.
• Analytical analysis integrating Monte Carlo simulations provide better predictive value of hypothetical illustrations than level rate-of-return assumptions.
Individuals and Advisor have analysis options to make prudent planning decisions based on FINRA and NAIC best practices.
Copyright 2015, Trust Asset Consultants, LLC
39
Institutional Life Insurance (ILI)
Institutional Life Insurance - A More Suitable Investment Management Container for Affluent Individuals and ILIT Trustees
E. Randolph Whitelaw, AEP (Distinguished) and Charles M. “Mark”Whitelaw
June 2015 - Society of Financial Service Professionals - Financial Planning
A review of the fund investment and risk management alternative used by CFO's since 1986 and now available for affluent individuals and
trustees.
Please contact us if you would like a reprint of our article.
Copyright 2015, Trust Asset Consultants, LLC
About the Authors
Following is brief information concerning each co-author.
E. Randolph Whitelaw can be contacted at [email protected]
Mark Whitelaw can be contacted at [email protected]
Copyright 2014, Trust Asset Consultants, LLC
41
E. Randolph Whitelaw, AEP® (Distinguished)
• Managing Director – Trust asset Consultants, LLC.
• Co-Managing Director – The TOLI Center, LLC.
• Managing Director – Life Settlement Partners, LLC.
• ILIT Administration and Trust-Owned Life Insurance (TOLI) experience.
o Banking and Trust executive management.
o 20+ years consulting to skilled and unskilled ILIT trustees, legal and tax advisors, family offices, affluent family groups and ILIT beneficiaries.
o Active Dispute Resolution and Expert Opinion/Witness consulting practice, including Cochran v. Key Bank matter.
o Lecturer at Heckerling Institute January 2014
Copyright 2015, Trust Asset Consultants, LLC
42
Charles M. “Mark” Whitelaw
• Founder and President –Valley View Consultants, Inc.
• 30+ Years Life Insurance Technical Support.
• 25+ Years Executive Benefits Design and Plan Administration.
• 20+ Years ILIT Administration and Trust-Owned Life Insurance (TOLI) experience.
• 2002 – Creator, Sponsor and Administrator of The STAR Plan featuring ILI.
o Individual / Trustee access to Institutionally-priced Life Insurance.
o Professionally administered IRC §7702 based cash, tax, investment and risk management strategy.
o The STAR Plan brings the Institutional Life Insurance (ILI) value proposition utilized by corporations (COLI) and banks (BOLI) to the individuals whose career and life achievements make ILI’s superior value proposition possible for their personal investment, retirement and estate planning.
Copyright 2015, Trust Asset Consultants, LLC