Embed Size (px)
Citation preview

Eindhoven University of Technology
MASTER
The role of innovation ecosystems for orchestrating technological change
the case of smart dairy farming
Mutsaers, T.C.H.
Award date:2015
DisclaimerThis document contains a student thesis (bachelor's or master's), as authored by a student at Eindhoven University of Technology. Studenttheses are made available in the TU/e repository upon obtaining the required degree. The grade received is not published on the documentas presented in the repository. The required complexity or quality of research of student theses may vary by program, and the requiredminimum study period may vary in duration.
General rightsCopyright and moral rights for the publications made accessible in the public portal are retained by the authors and/or other copyright ownersand it is a condition of accessing publications that users recognise and abide by the legal requirements associated with these rights.
• Users may download and print one copy of any publication from the public portal for the purpose of private study or research. • You may not further distribute the material or use it for any profit-making activity or commercial gain
Take down policyIf you believe that this document breaches copyright please contact us providing details, and we will remove access to the work immediatelyand investigate your claim.
Download date: 09. May. 2018

THE ROLE OF INNOVATION ECOSYSTEMS FOR
ORCHESTRATING TECHNOLOGICAL CHANGE
THE CASE OF SMART DAIRY FARMING
BY TIM MUTSAERS, BSC STUDENT ID: 0675341
DATE: 2015, OCTOBER 29
IN PARTIAL FULFILMENT OF THE REQUIREMENTS FOR THE DEGREE OF
MASTER OF SCIENCE
IN INNOVATION SCIENCES
SUPERVISORS
EINDHOVEN UNIVERSITY OF TECHNOLOGY
FACULTY OF INDUSTRIAL ENGINEERING & INNOVATION SCIENCES DR. BERT M. SADOWSKI
PROF. DR. FLOOR ALKEMADE
TNO
DEPARTMENT OF STRATEGIC BUSINESS ANALYSIS FRANK BERKERS

PREFACE
This research would not be possible without the great support from
at TNO and The department of Industrial Engineering and Innovation Sciences a
Technology. Special acknowledgements go to Bert and Frank for their
ecosystem thinking and the relevance
master thesis project I enjoyed the most
study association Intermate, and colleagues from TNO for their time and effort to share their
my work; it is their feedback that motivated me to
This research would remain in its theoretical constructs without the help from Matthijs Vonder and Bart Jan
Wulfse. Their extensive network within the dairy sector was crucial to obtain data and
relevant interview participants. Furthermore, I would like to thank
answering my questions and sharing their insights
II
This research would not be possible without the great support from the department of Strategic Business Analysis
TNO and The department of Industrial Engineering and Innovation Sciences at Eindhoven University of
Technology. Special acknowledgements go to Bert and Frank for their supervision. The discussions
relevance for the field of innovation policy and business management during my
I enjoyed the most. Secondly, I would like to thank Floor Alkemade, fellow students from
and colleagues from TNO for their time and effort to share their
motivated me to continuously improve my research.
This research would remain in its theoretical constructs without the help from Matthijs Vonder and Bart Jan
extensive network within the dairy sector was crucial to obtain data and to be able
interview participants. Furthermore, I would like to thank all the participants for their time and effort
their insights on the Smart Dairy Farming project.
the department of Strategic Business Analysis
t Eindhoven University of
discussions on the notion of
policy and business management during my
fellow students from
and colleagues from TNO for their time and effort to share their critical reflection on
This research would remain in its theoretical constructs without the help from Matthijs Vonder and Bart Jan
to be able to connect with
all the participants for their time and effort for

III
FINDINGS SUMMARY
The goal of this master thesis was to examine the usefulness of the notion of ecosystem thinking for orchestrating innovations
in multi-stakeholder projects. Challenging the usefulness of ecosystem theory in strategy and policy making is relevant, since
the field of ecosystem theory is fragmented (Fransman, 2014; Letaifa et. al., 2013). This thesis aimed to contribute in this field
by formulating clear boundaries and definitions for the ecosystem concepts. We have tested our defined concepts via an
empirical study into the innovation project of Smart Dairy Farming (SDF). By examining this ongoing innovation project in the
dairy sector, the application usefulness for managers and policymakers is illustrated. We contributed on two fronts, namely in
ecosystem theory building and the empirical testing of ecosystem concepts by shaping them into a practical tool for conducting
ecosystem analysis. The main findings are presented in the two sections below.
KEY THEORETICAL CONSTRUCTS DEVELOPED IN THIS THESIS
From among the works of Adner & Kapoor (2014), Autio & Thomas (2013), Adner (2012), Iansiti & Levien (2004), and Moore
(1993) we evaluated the theoretical concepts of ecosystem theory. Two main concepts were identified, namely the business
ecosystem and the innovation ecosystem. From our literature study, we linked these two concepts to each other. This resulted
in the positioning of the innovation ecosystem as a sub set of the business ecosystem. The innovation ecosystem elements
work to develop a new value proposition that challenges the existing business ecosystem structure. The extent to which
incumbent elements and relationships are challenged depends on the disruptive or sustained character of the innovation
ecosystem. In order to assess a disruptive of sustained character of innovation ecosystems we introduced properties based on
how innovations emerge in ecosystem for each lever of value creation (Amit & Zott, 2001).
From these theoretical insights we concluded that business scientist should focus on drivers that stimulate or hinder the growth
of innovation ecosystems. This can be done by examining how opportunities or bottlenecks emerge that hinder the expansion
of an innovation ecosystem. We propose that ecosystem orchestrators can assess this by looking at business ecosystem
elements explorative or exploitative perception towards the innovation ecosystems’ new value proposition.
KEY EMPIRICAL FINDINGS
Analysis on the case of Smart Dairy farming presented the following main findings. First, our adapted MOBENA methodology
provided us with the ecosystem model, a value chain configuration describing its economic structure, and identification of
ecosystem control points suitable for the application of management. These insights showed that the value chain configuration
offers new business development opportunities for all involved players, but that the struggle for dominance between large
players is hindering consensus on the data hub design specifications and appropriate business models. Functional levels with
ecosystems control points are: ‘data generation’, ‘storage & authorization’, and ‘services & terminals’. Two main ecosystem
evolution scenarios have been identified that reflect the struggle for dominance. Applying the right management on the
functional levels for the ecosystem control points will enable directed innovation towards a desired future end state if the SDF
innovation ecosystem. The main contributions in developing a practical ecosystem analysis tool are described below.
The MOBENA methodology of Battistella et. al. (2013) focuses on overall industries as a level of analysis via the usage of
network tools. We however, adapted the MOBENA methodology into a qualitative methodology, focused on the innovation
ecosystem level (project level) by studying individual behavior characteristics of firms. In order to link project level findings with
macro level developments, we introduced a fifth step for the MOBENA methodology in which we aim to form a link between
explorative and exploitative properties at the project level with the formation of opportunities and bottlenecks.
Findings for the identified bottlenecks are standardization issues around data quality and sensor design specifications and
existing industry structures that hinder the roll out of new services based on the Smart Dairy Farming Infobroker. Opportunities
observed were new value creation possibilities in collaboration with other ecosystem players and the reinforcement of existing
firm activities via participation in the Smart Dairy Farming project. From these findings, ecosystem management guidelines can
be developed and a suggestion has been proposed in the case study conclusion section.
IV
TABLE OF CONTENTS 1. Introduction .......................................................................................................................................................... 7
1.1 Orchestrating innovations ............................................................................................................................ 8
1.2 Research questions .................................................................................................................................... 10
1.3 Thesis Outline ............................................................................................................................................. 11
1 Theory ................................................................................................................................................................. 12
2.1 The notion of ecosystem thinking .............................................................................................................. 13
2.2 Why use the notion of ecosystem thinking in business? ........................................................................... 14
2.2 Existing business ecosystem definitions and their characteristics ............................................................. 15
2.4 Introducing the innovation ecosystem concept in business ecosystems .................................................. 16
2.4 Definitions ecosystem concepts ................................................................................................................. 18
2.5 How business and innovation ecosystems deal with innovation ............................................................... 20
2.6 Research aim for the ecosystem concepts ................................................................................................. 21
2.7 The role of innovation ecosystems ............................................................................................................ 22
2.8 Orchestration for innovation ecosystems .................................................................................................. 25
2.9 Conclusion .................................................................................................................................................. 28
3. Methodology....................................................................................................................................................... 29
3.1 Unit of analysis ........................................................................................................................................... 30
3.2 Case selection............................................................................................................................................. 30
3.3 Data collection ........................................................................................................................................... 31
3.4 Data analysis: Introducing the Adapted MOBENA methodology phases ................................................... 31
3.5 Coding protocol .......................................................................................................................................... 33
3.6 Research quality ......................................................................................................................................... 34
4. Results SDF ecosystem analysis .......................................................................................................................... 35
4.1 Phase I – Identification of innovation ecosystem ...................................................................................... 36
4.2 Phase II – Modeling the innovation ecosystem elements .......................................................................... 39
4.3 Phase III – Innovation ecosystem analysis ................................................................................................. 41
4.4 Phase IV – Innovation ecosystem evolution scenarios .............................................................................. 43
4.5 Phase V – Innovation ecosystem classification .......................................................................................... 46
4.6 Case study conclusions and suggestions for ecosystem orchestration...................................................... 49
5. Summary and conclusions .................................................................................................................................. 51
5.1 Summary .................................................................................................................................................... 52
5.2 Conclusion .................................................................................................................................................. 53
6. Discussion .......................................................................................................................................................... 55

V
6.1 Theoretical implications ............................................................................................................................. 56
6.2 Practical implications ................................................................................................................................. 56
6.3 Limitations .................................................................................................................................................. 56
6.4 Suggestions for future research ................................................................................................................. 57
7. References .......................................................................................................................................................... 58
7.1 Overview data sources case study ............................................................................................................. 59
7.2 References.................................................................................................................................................. 60
8. Appendix ............................................................................................................................................................. 65
Appendix I: Business ecosystem view of Moore ..................................................................................................... 66
Appendix II: Business ecosystem view of Iansiti & Levien ...................................................................................... 66
Appendix III: Five levers for reconfiguration developed by Adner (2012) .............................................................. 67
Appendix IV: MOBENA methodology from Battistella et.al. ................................................................................... 68
Appendix V: Architectural design for the Infobroker .............................................................................................. 69
Appendix VI: Timeline with overview of SDF development .................................................................................... 70
Appendix VII: Actors and their core business .......................................................................................................... 71
Appendix VIII: Reasons to participate ..................................................................................................................... 73
Appendix IX: Additional information on coding process of ‘platformization’ ......................................................... 74
Appendix X: Results power analysis SDF project from alter-ego perceptions ........................................................ 76
Appendix XI: Examples data results on ‘oefening 1’and ‘oefening 2’...................................................................... 78
Appendix XII: Interview protocol ............................................................................................................................. 79

VI
LIST OF FIGURES
Figure 1.1: Schematic overview of research approach 10
Figure 2.1: An extended web-based structure commonly used to describe ‘ecosystems’ 12
Figure 2.2: Representation of how the three evolutionary characteristics of business ecosystem concept relate 13 Figure 2.3: Graphical representation of the business ecosystem as proposed in this thesis 18
Figure 2.4: The growth of a business ecosystem core and its expanding ecosystem boundaries 20
Figure 2.5: Positioning innovation ecosystems within their business ecosystem 21
Figure 2.6: Disruptive innovation ecosystem; creating challenges to overcome for the innovation ecosystem 23
Figure 2.7: Sustained innovation ecosystem; creating opportunities for the innovation ecosystem to utilize 23
Figure 2.8: Conceptual model 26
Figure 4.1: Schematic overview of the target structure for the Infobroker as a data hub function 38
Figure 4.2: Overview of three fundamental levels of operation and the positioning of the control points 41
Figure 4.3: Visualization of two different ‘dairy data sharing ’ecosystem evolution scenarios 44
LIST OF TABLES
Table 2.1: Overview of different business ecosystem definitions by their main authors 15
Table 2.2: Overview of different business and innovation ecosystem definitions 16
Table 2.3: Four sources of value creation and the two types of innovation ecosystems 24
Table 2.4: Exploration and exploitation properties for developing Innovation ecosystem expectations 25
Table 3.1: Innovation ecosystem analysis tool proposed for this thesis. 31
Table 4.1: Classification of Players 37
Table 4.2: Additional players’ information 37
Table 4.3: Interaction matrix old structure 39
Table 4.4: Interaction matrix for targeted structure for the Infobroker 39
Table 4.5: Configuration of value chain: overview for SDF 40
Table 4.6: Ecosystem problems reported by actors 46
Table 4.7: Ecosystem benefits reported by actors 46
Table 4.6: Relating the innovation ecosystem properties with our findings 47
Table 7.1: Overview of data sources 58

1. INTRODUCTION

8
1.1 ORCHESTRATING INNOVATIONS
In the twentieth century, incumbent firms such as Philips, IBM, and AT&T coped with technological change by establishing
internal research and development facilities in almost every field of science and technology to ensure they were on top of any
possible innovation (Iansiti & Levien, 2004b, p. 211). Nowadays, the number of firms focusing on the introduction of state-of-
the-art technologies has exploded, making the management of capabilities dispersed within the broad network of actors rather
difficult. For instance, strategic management literature stresses that the ability of focal firms to successfully leverage ecosystem
assets is crucial to create new technological innovations. This breaking trend of isolated large individual research and
technology firms towards cooperation via coalitions introduces the importance of innovating in an ecosystem context for
solving complex societal problems (Kania & Kramer, 2011). In addition, current technological developments in Information and
Communication Technologies initiate rapid changes in industries. As EU parliamentarian Pilar del Castillo Vera states: ‘IT is
connecting everything with everything, leading to infinite new possibilities’ (VIEUWS, 2015). Therefore, a new approach towards
analyzing industries and economic interdependencies is needed due to the radical change in industrial contexts as we know
them today.
A sticking example of an industry implementing Information Technologies to generate new innovations is the dairy sector in the
Netherlands. The project of Smart Dairy Farming (SDF) entails the usage of sensory data to enhance efficiency and animal
welfare (SmartDairyFarming, 2012). In order for this innovation project to succeed, involved stakeholders need to be brought
into alignment so that they can leverage their internal processes for value creation on the complementarities available via
others. Managing this complex innovation project requires an understanding of the broader context in which the Smart Dairy
Farming innovation is embedded. By introducing the notion of ecosystem thinking for analyzing this complex, multi-stakeholder
innovation, we expect to gain insights on how the innovation ecosystem of Smart Dairy Farming can be orchestrated. In order
to analyze the innovation of Smart Dairy Farming, available concepts from ecosystem theory are needed.
Moore (1993) was the first to introduce the field of ecosystem theory when he introduced the metaphor of ‘ecosystems’ in the
context of business. His so called concept of a ‘business ecosystem’ tries to explain how firms should behave in an
interconnected industry environment that is intertwined with other broader institutes such as governments, knowledge
institutes and other, sometimes completely different industries, by focusing on the dynamics of the industry environment. He
sees the industrial environment in analogy with a biological ecosystem. By using this concept from biological ecosystems,
Moore (1993) sheds new light on the sources of innovation by emphasizing that the business ecosystem environment is, just as
in nature, in a state of constant flux. Within this ecosystem environment, complementarities for firms exist. Being innovative in
the ‘ecosystem’ sense means that: firms are able to leverage on complementarities which are present in the ecosystem. By
doing so, firms co-evolve, co-create and co-specialize by leveraging on each others’ assets and skills.
Via these biological concepts, ecosystem theory has introduced a new view on dealing with strategic alliances, competition, and
innovation by placing the focus on the interdependencies between organizations. For instance, Iansiti & Levien (2004b)
formulated strategic roles that classify actors in a business ecosystem as a dominator, landlord, keystone, or niche player. By
focusing on these roles, Iansiti & Levien (2004b) have developed indicators, such as niche creation, robustness, and sustained
productivity, for scientists to analyze the successfulness of certain business ecosystems to deal with change and for innovation
managers to operate in this interconnected industrial context.
While the field of business ecosystems and even the notion of ecosystem thinking itself is fragmented and sometimes even
immature (Fransman, 2014, Autio & Thomas, 2013), contemporary literature does indeed provide new insights for innovation
management. A crucial understanding that is gained from ecosystem thinking is that the industrial environment is in a constant
state of flux, where incumbent firms and organizations are depending on their evolving networks of interconnected actors.
However, disagreement on how the ecosystem is orchestrated exists (Leten et, al., 2013). The first opinion places the organizing
power of the ecosystem around a specific focal firm or platform, to deal with this changing industrial environment (Iansiti &
Levien, 2004a,b). The second view emphasizes that the orchestration power of the ecosystem can be self-organizing, without
the presence of a focal firm or central actor (Leten et. al., 2013).
Although the concepts of ecosystem theory are promising to explain industry dynamics, practical tools for obtaining these
insights are missing (Battistella et. al., 2013). Managers and policy developers are confronted with the question of ‘how’ to deal

9
with the notion of business and innovation ecosystems for examining economic change. This research aims to define the
ecosystem concepts and illustrate their usefulness by applying them on the case of Smart Dairy Farming. In the project of SDF,
IT technologies, societal factors, and the cooperative nature of the agricultural sector come together. The aim of this project is
to introduce an IT infrastructure that enables data sharing between different stakeholders. The potential of this innovation is
that it introduces new business development based on big data analysis. The problem is that different stakeholders foresee
different ways in which data is generated, shared and analyzed. In order to deliver the value proposition of SDF, namely
successful data sharing via the Infobroker, different stakeholders must agree on technological standards and certain roles for
institutions and firms. Managing all these different stakeholders in the complex environment of the dairy sector requires a keen
analysis tool to uncover the dynamics that hinder or stimulate the development of this innovation. Therefore, this case study of
Smart Dairy Farming is the perfect innovation project to test the usefulness of ecosystem concepts in developing a role for
ecosystem orchestration.
Developing the role of ecosystem orchestration will help to guide multi-stakeholder innovation projects that are able to
challenge existing industry structures. However, existing tools for developing ecosystem orchestration are missing because they
miss a connection between the macro level and the micro level. For instance, the business ecosystem analysis methodology,
known as the MOBENA methodology (Battistella et. al., 2013) examines entire business ecosystems via network analysis, but
lacks the identification of specific new value propositions that can challenge exiting configurations in business ecosystems. On
the other hand, innovation analysis tools developed by Adner (2012) in his book ‘the wide lens’ focus on the innovation
ecosystem level, and therefore miss a link with the broader scope of the business ecosystem.
To offer structure and insights in the above stated dilemmas, this thesis aims to contribute on two fronts. First, we will describe
the theoretical constructs that dominate the field of ecosystem thinking and present the reader with an overarching view of
them. Our goal here is to clarify the different ecosystem terminology used by various authors and position them. From this, the
relevant concepts for analyzing innovation in an ecosystem context will be defined. The second contribution of this thesis is to
illustrate the usefulness of the ecosystem lens in obtaining ecosystem orchestration insights. To form a narrow structure on the
deliverables on an ecosystem analysis, we follow the work from Battistella et. al. (2013). They have formulated a business
ecosystem analysis tool, known as the MOBENA methodology for analyzing business ecosystems and formulated a four phased
analysis plan which includes deliverables for each step. We examine these deliverables and adapt them for our concepts. As a
result, the second aim of this thesis is to provide a practical analysis tool for managers to obtain innovation ecosystem
orchestration information.
This research is conducted in collaboration with the Dutch organization TNO. The organization of TNO strives to bridge the gap
between academic research and practical industrial needs. The goal of this organization is to shift technologies and innovation
projects from exploration towards exploitation in order to stimulate economic growth and innovation within the Dutch
industry. The department of Strategic Business Analysis of TNO aims to guide multi-stakeholder innovation projects towards
successful exploitation by providing insights into joint future business ecosystem scenarios and their implications. This thesis
specifically contributes for this department by adapting the MOBENA methodology into a practical tool which consultants and
research scientists can use to analyze innovation ecosystems. By doing so they can develop business ecosystem scenarios and
identify appropriate orchestration roles to guide certain innovation ecosystem into, for society desired, outcomes. Our research
objectives are translated into the following overall research question: ‘How can the notion of ecosystem thinking be used to
define the role of ecosystem orchestration for SDF?’. The next section will highlight our sub-research questions that help
answering the main research question.
10
1.2 RESEARCH QUESTIONS
To answer our main research question, we have derived sub questions that form a link between the ecosystem concepts and
our case of Smart Dairy Farming. The sub research questions are aimed at specifying which ecosystem concepts can be defined
and how they are relevant for developing a role for ecosystem orchestration.
Main research question:
“How can the notion of ecosystem thinking be used to define the role of ecosystem orchestration for SDF?”
Sub research questions:
1. Why is the notion of ecosystem thinking relevant for the field of business and innovation? (Chapter 2)
2. How can the concepts of business ecosystem and innovation ecosystem be defined? (Chapter 2)
3. How can the ecosystem concepts be used to develop a role for ecosystem orchestration? (Chapter 2)
4. What practical ecosystem analysis tool for determining ecosystem orchestration is defined? (Chapter 3)
5. Which ecosystem orchestration dynamics for the case of SDF can be defined? (Chapter 4)
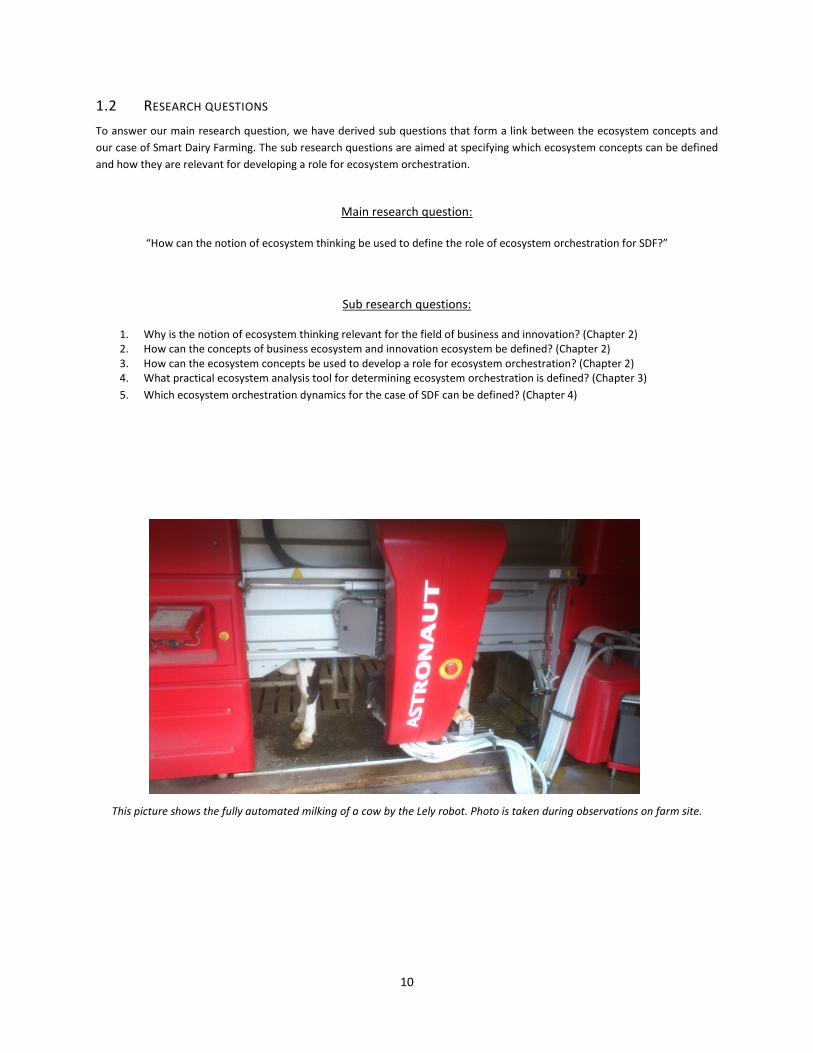
This picture shows the fully automated milking of a cow by the Lely robot. Photo is taken during observations on farm site.

11
1.3 THESIS OUTLINE
Chapter 2 will introduce the notion of ecosystems and demonstrates its relevance in the field of business. Afterwards an
overview of existing definitions on the ecosystem concept is provided and we will end by defining our own concepts.
Chapter 3 describes how we develop a practical tool for conducting an ecosystem analysis. We will highlight how it differs from
the approach of Battistella et. al (2013) and why we choose to do it differently. The core focus of this chapter is the data
analysis section where we discuss how we measure our defined concepts and what deliverables this will offer for our results.
Chapter 4 presents the results from applying our methodology onto the Smart Dairy Farming case. The chapter discusses the
results in accordance with the deliverables discussed in chapter 3. This chapter ends by identifying which orchestration
dynamics can be identified and a suggestion for managing them.
Chapters 5 and 6 will conclude the thesis with the overall summary and conclusions and a reflection of our work by highlighting
its limitations. Figure 1.1 shows the flow of our research and the accompanied layout for this thesis.
Figure 1.1: Schematic overview of research approach
Formulation of concepts
Data collection & results
Analysis Reflection theory
Reflection and deriving implications for ecosystem
orchestration
Literature research
Chapter 2: Theory & Conceptual model
Chapter 3: Data collection & research methodology
Chapter 4: Results from case study
Chapter 5: Thesis conclusion
Chapter 6: Discussion

12
1 THEORY

13
INTRODUCTION This chapter starts by investigating the widespread application of ecosystem terminologies. The notion of ecosystem thinking is
(ab)used in many different contexts and therefore the concepts we want to use should be made explicit before they can be of
added value in orchestrating innovations. Insights gained from this study will help ecosystem managers, policy makers, public
research institutes, and other involved stakeholders to orchestrate the right innovation ecosystems that lead to certain
preferable future business ecosystems.
2.1 THE NOTION OF ECOSYSTEM THINKING
In order to clarify our position in the field of ecosystem thinking and the related concepts, we will begin by introducing the
notion of ‘ecosystem’ thinking. In this introduction we will discuss the research focus for this thesis by highlighting the specific
field of ecosystem thinking commonly used within business and innovation. After this, we will discuss the relevant
characteristics used in this field and link them to the business ecosystem and innovation ecosystem concepts. Let us now first
introduce the overall notion of ecosystem thinking.
The notion of ecosystems stretches over many different fields, each adapted for its own use. Peltoniemi & Vuori (2004) have
provided an illustration of the theoretical background for the use of ‘ecosystems’. For example, in a biological sense,
ecosystems refer to different communities or habitats which are tightly knit into a global continuum of energy, nutrients and
organisms, the so called biosphere (Mercan & Göktas, 2010; Peltoniemi & Vuori, 2004). In this biosphere, species interact with a
subset of the total number of other species. From this natural ecosystem approach, different fields have used the term
‘ecosystem’. These fields are quite diverse, examples are: ‘industrial ecosystem’, ‘economic ecosystem’, ‘digital business
ecosystem’, ‘social ecosystem’, ‘socio-economic ecosystem’, and ‘business ecosystem’ (Peltoniemi & Vuori, 2004).
Figure 2.1: an extended web-based structure commonly used to describe ‘ecosystems’.
Source: elaborated by the author
The question of what constitutes as part of a certain ecosystem is difficult to answer since the ecosystem boundaries are
unclear (Autio & Thomas, 2013). This is making the concepts in ecosystem theory ambiguous to use as a level of analysis due to
their wide boundary definitions, which is to be expected when suggesting the usage of the biosphere analogy. One way of
dealing with wide ecosystem boundary definitions is to assume that the notion of ecosystem thinking implies the existence of a
common base of understanding among the ecosystem elements (Peltoniemi & Vuori, 2004). An example of this common base
of understanding is an extended web-based structure, consisting of field-specific actors or entities that are tightly structured
around a certain focal firm (figure 2.1 shows a graphical example).
To clear any misunderstandings of the concepts we use, we limit ourselves within a specific field of ecosystem thinking. We are
interested in the orchestration of innovation ecosystems in an industry context; therefore, we limit our focus on the business
ecosystem and innovation ecosystem concepts. The upcoming section will shortly illustrate how in management and business
literature the notion of ecosystem thinking can be recognized. From this section, a better understanding in using an ecosystems
lens for studying innovation is gained. Afterwards, the chapter continues into the works of various authors who have
contributed in developing ecosystem concepts for business and innovation purposes.
14
2.2 WHY USE THE NOTION OF ECOSYSTEM THINKING IN BUSINESS?
Implications for using an ecosystem perspective for analyzing innovation and business can be found in the literature study from
Li (2009), the summarized results show why an ecosystem perspective is relevant in the field strategy and management. In this
study, three characteristics of business ecosystems from the work of Adner (2012), Iansiti & Levien (2004) and Moore (1993)
are summarized to help analyze a case of an IT infrastructure ecosystem. Li (2009) showed in his analysis of the Cisco’s business
ecosystem how a business ecosystem perspective identifies three evolutionary characteristics. First, it transfers strategies from
a single co-work to synergic and systematic cooperation (first characteristic), from product competition to platform competition
(second characteristic), and finally from single growth to co-evolution (third characteristic). For all three characteristics,
interdependency between actors is central, but with a clear focus on one specific firm that has the orchestration power. The
advantage is that these three ecosystem evolutionary characteristics explain business concepts in use today in the field of
strategic management. To illustrate our argument we will provide two examples that illustrate this claim.
Our first example is the concept of co-opetition (Gueguen & Isckia, 2011; Nalebuff & Brandenburger, 1996). Co-opetition means
that firms engage in collaboration and competition with other firms at the same time. Looking at the three evolutionary
characteristics of business ecosystems, we can explain how firms within a business ecosystem context compete with each other
to increase the performance of the overall business ecosystem. In our example it relates to the third characteristic, where firms
both compete and collaborate to grow and evolve together. A second example is co-specialization. In co-specialization,
complementary assets are the basis for joint use by different actors (Pitelis & Teece, 2010). Co-specialization is most beneficial
when there is a ‘thin’ market for particular assets. Key understanding from this concept is that it requires intensive integrated
operations between different actors and that value appropriation is open for third parties that want to use these
complementary assets.
From these three evolutionary characteristics of ecosystems, three central ecosystem dynamics are identified for analyzing
innovation in business ecosystems; co-creation, co-evolution and co-specialization (Li, 2009; Carayannis, 2008). These ideas
illustrate how business ecosystems work and how strategies and management implications should be derived from them.
Relating these three evolutionary characteristics with micro level firm activities will demonstrate why phenomena observed in
strategy and management are connected when using an ecosystem perspective. Relating these activities will illustrate our point
that all firm activities can be analyzed in an ecosystem manner by looking at the three ecosystem dynamics, just as in natural
ecosystems where variation, selection, and retention apply. Examples of firm activities (at the micro/meso level) relating to
these three business ecosystem dynamics are: the leveraging on complementarities available within the ecosystem (Adner,
2012), platform management (Moore, 1993; Iansiti & Levien, 2004a,b) and niche creation (Iansiti & Levien, 2004a,b). Together,
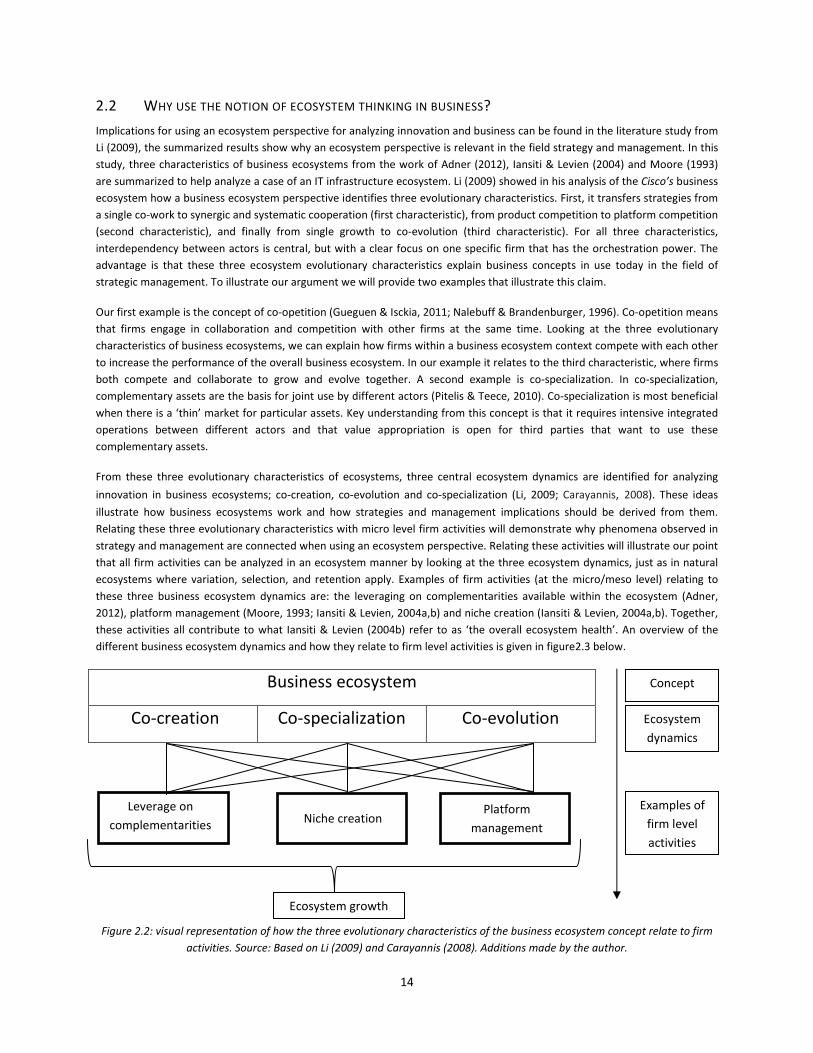
these activities all contribute to what Iansiti & Levien (2004b) refer to as ‘the overall ecosystem health’. An overview of the
different business ecosystem dynamics and how they relate to firm level activities is given in figure2.3 below.
Business ecosystem
Co-creation Co-specialization Co-evolution
Figure 2.2: visual representation of how the three evolutionary characteristics of the business ecosystem concept relate to firm
activities. Source: Based on Li (2009) and Carayannis (2008). Additions made by the author.
Leverage on
complementarities Niche creation
Platform
management
Ecosystem growth
Concept
Ecosystem
dynamics
Examples of
firm level
activities

15
The main understanding from this section is that we have illustrated why it is relevant to use the notion of ecosystems thinking
for studying innovation in business. In addition, it also shows how in a broad industry context different industry (ecosystem)
dynamics can be studied to investigate why and how innovations emerge. The next section investigates various views for the
overall business ecosystem and innovation ecosystem concepts. From this overview, we will identify our level of analysis to
develop innovation ecosystem orchestration dynamics.
2.2 EXISTING BUSINESS ECOSYSTEM DEFINITIONS AND THEIR CHARACTERISTICS
Using the notion of ecosystems in a business context was first introduced by James Moore (1993). By looking at firm behavior
with the ecosystem lens, Moore (1993) suggested a link between the challenges of innovation and the behavior of species in
natural ecosystems. Since the field of business ecosystems reaches into virtually all areas of both management and strategy,
confusion and disagreement on its definitions have emerged (Fransman 2014; Letaifa et. al., 2013; Autio & Thomas, 2013;
Fransman 2010; Peltoniemi & Vuori, 2004). For this reason, we first reviewed the major works concerning business ecosystem
literature from Moore (1993), Iansiti & Levien (2004a,b), and Autio & Thomas (2013), as well as several review articles and
books that have contributed in the attempts of defining the business ecosystem concept. The results are discussed below and
the results are summarized in table 2.1.
Moore (1993) introduced the notion of business ecosystems initially as a replacement for using the term ‘industries’. He
described business ecosystems as a structured economic community that is being shaped by a wide range of factors that go
beyond the network of mere business relationships. He extends the view of a business strategy from mere suppliers and
customers to the inclusion of other agents, such as governments, stakeholders and competing organizations (Moore, 1993). In
this view “business ecosystems condense out of the original swirl of capital, customer input, and talent generated by new
innovations” (Moore, 1993, p. 76). It is a broad perspective on business ecosystems where non-commercial organizations such
as government agencies and involved stakeholders are also included. Secondly, Moore (1993) argues that innovation emerges
from within the business ecosystem itself, since it is in a constant state of flux. Appendix I shows a visual representation of
Moore’s view on business ecosystems. This broader perspective on incorporating governmental agencies, stakeholders and
competing organizations is also supported in the work of other authors such as Dittrich et. Al.(2014) Jackson (2011), and Adner
(2006).
A second, slightly different view, on business ecosystems can be characterized by the previously mentioned extended web-
based structure where the level of orchestration power lies with a single company, also referred to as the focal firm (Iansiti &
Levien, 2004a,b; Nambisan & Baron, 2012, Autio & Thomas, 2013). This, so called networked industrial environment, links the
performance of participants within the network with the characteristics and structure of the network (Iansiti & Levien, 2004b).
As a result, rapid parallel advances in many areas occur since each development is stimulated by highly focused domain-specific
innovation activities, leading to the expansion of the business ecosystem into many different domains (Gueguen & Isckia, 2011).
An example of a thriving ecosystem is that of Microsoft, with its many different software developers and system integrators
who are all leveraging on Microsoft’s platform technology of the .net operating system. A visual example of the Microsoft
business ecosystem is provided in appendix II. Secondly, Iansiti & Levien (2004) argue that innovation emerges at the edge of
the business ecosystem by attracting sufficient new niche firms that develop domain specific innovations that address new
markets.
In line with the vision of network centered ecosystems, Autio & Thomas (2013) have defined a business ecosystem as “a
network of interconnected organizations, connected to a focal firm or a platform, which incorporates both production and use
side participants and creates and appropriates new value through innovation”. This definition also stresses that the ecosystem
is organized around a specific shared focal point or asset, just as Iansiti & Levien (2004a,b) do. The interesting point here is that
by incorporating production and side participants, the notion of two-sided markets is made explicit in the concept of business
ecosystems (Hearn, 2006; Autio & Thomas, 2013).
So far we have illustrated that there are two fundamental ways to look at the business ecosystem concept. The first view takes
a broader perspective by incorporating broad stakeholders and organizations which are not necessarily linked to a part of the
business ecosystem network. The second view limits the inclusion of organizations and stakeholders by only focusing on
participants that are part of the network via a direct link. Nevertheless, all authors emphasize the importance of business

16
ecosystem relationships for the creation of new innovations, even though they do not explicitly state how this works. Finally,
we see that there is disagreement about the orchestration dynamics in business ecosystems, either via a strong focal firm or by
a self-regulating system. An overview of the main differences is provided in table 2.1 below.
Table 2.1: Overview of different business ecosystem definitions by their main authors
Main authors
characteristics
Inclusion of non-
commercial
entities
Connection
with the B.E.
core
Orchestration
power
Two-sided
market
dynamics
How
innovation
emerges
Level of
analysis
Moore(1993) Yes Strong ties
and indirect
ties
dispersed No From within
B.E.
B.E.
Iansiti &Levien
(2004)
No Direct ties Focal firm No Domain
specific at
edge of a B.E.
B.E.
Autio & Thomas
(2013)
No Direct ties Focal firm Yes Between users
and producers
B.E.
Source: Elaborated by the author
Concluding our findings of what constitutes a business ecosystem we can state the following. There is a debate on what the
boundaries of a business ecosystem are, should it include broader elements such as government agencies and research
institutions, or should it be focused on direct relationships between a focal firm and its surrounding firms? Secondly, we found
that the role of ecosystem orchestration changes when different definitions are used. Finally, the issue of how innovation
emerges within a business ecosystem is unclear and open for debate. For this reason we propose to redefine the concept of a
business ecosystem in order to shape clarity for its boundaries and secondly, we propose to relate the sources of innovation
within business ecosystems with the concept of innovation ecosystems. Thirdly, we aim to offer ecosystem orchestration
guidelines by using these redefined ecosystem concepts.
2.4 INTRODUCING THE INNOVATION ECOSYSTEM CONCEPT IN BUSINESS ECOSYSTEMS
The previous section provided an overview of the existing definitions for the concept ‘business ecosystem’. This section aims to
show our vision of what constitutes as a business ecosystem by combing the different views from Moore (1993), Iansiti &
Levien (2004a,b) and Autio & Thomas (2013). However, making the business ecosystem concept applicable for analysis, we
need to identify all relevant elements and relationships influencing the emergence of innovations. To achieve this, we start by
addressing the missing links in the business ecosystem definitions that were identified in the previous section by
complementing them with the dynamics of the innovation ecosystem concept.
The first obstacle identified for finding an overarching business ecosystem definition were the different views on which
elements and processes are to be included in the business ecosystem concept. To offer a solution, we first need to define what
entails our scope for the business ecosystem. The MOBENA methodology from Battistella et. al. (2013) offers a convenient
guideline for this. Battistella et. al. (2013) identify the business ecosystem perimeter by identifying all elements and
relationships that are linked to the meaning of the business ecosystem (Battistella et. al. 2013, p. 4). The meaning of the
business ecosystem has been referred to as the common base on which value creation processes occur. It is the seed that
attracts all actors and is the basis for the leverage of all business. Therefore, we suggest a definition that includes all actors that
leverage on the business ecosystem common base directly and indirectly.
The second obstacle addresses the issue of how innovations emerge within business ecosystems. To answer this question, the
work of Amit & Zott (2001) offers insights. They have identified four sources of value creation for the business model on which
the ecosystem elements leverage all business. These value creation sources are novelty, complementarities, efficiency, and
lock-in (Amit & Zott, 2001). These four sources of value creation are good to use as a reference for examining the common base
that is being shared between all the business ecosystem actors and how this common base adapts to cope with change in the

17
ecosystem environment. Unfortunately, it does leave one question unanswered, namely, where do innovations emerge in the
business ecosystem?
This is the last obstacle to be tackled, where do innovations emerge in business ecosystems and how do they help industries to
cope with change? Different opinions exist on this subject, Iansiti & Levien (2004a,b) stress the importance of attracting new
niche firms as a source of innovation. Moore emphasizes the importance of a flexible business ecosystem core so that new
configurations can generate new innovations. To settle this debate, work by authors such as Dittrich et. al. (2015), Adner &
Kapoor (2014), Leten et. al. (2013), Adner (2012), and Van der Borg et, al (2012) can offer interesting insights. They have used
the concept of innovation ecosystems to explain how innovations emerge by taking the innovation ecosystem concept for
explaining the creation of a new value proposition. Similar to the various views on business ecosystem definitions, many
variations on describing the innovation ecosystem concept exist, therefore the main differences between the authors are
summarized in table 2.2 below. The main understanding necessary here is that the innovation ecosystem concept is used to
analyze how certain ecosystem elements generate new innovations. The next section will discuss the definitions that can be
derived from the above literature review for both the business ecosystem and innovation ecosystem concepts. These
definitions will then be applied for our ecosystem analysis of Smart Dairy Farming.
Table 2.2: Overview of different business and innovation ecosystem definitions.
Main authors
Characteristics
Inclusion of
non-
commercial
entities
Connection
with the B.E.
core
Orchestration
power
Two-sided
market
dynamics
How innovation
emerges
Level of
analysis
Moore(1993) Yes Direct ties and
indirect ties
dispersed No From within B.E. B.E.
Iansiti &Levien
(2004)
No Direct ties Focal firm No At edge of a B.E.
via niche firms
B.E.
Autio & Thomas
(2013)
No Direct ties Focal firm Yes Between users
and producers
B.E.
Adner (2012) Yes N.a. Not specified No Via new
configurations
I.E.
Van der Borg et.
al. (2012) / Leten
et. al. (2013)
No N.a. Focal actor No Attracting
relevant
Actors
I.E.
Battistella (2013) No Direct ties Focal firm No Via ‘seed’
technology
B.E.
Source: Elaborated by the author, additional information can be found in Appendix XIII.
This section provided an overview of how the existing ecosystem concepts can be characterized. Form this
overview we develop our own ecosystem concept definitions to describe how we believe the ecosystem
perspective should be used to examine innovation. The next section will point out the main differences and
describes how we define the two concepts of business ecosystem and innovation ecosystem in relation with these
characteristics.

18
2.4 DEFINITIONS ECOSYSTEM CONCEPTS
In the previous section we have described the position we take within the notion of ecosystem thinking with respect to the two
concepts of business ecosystems and innovation ecosystems. This section will show how we have transformed the above
identified ecosystem characteristics in our own description of how we perceive a business ecosystem and innovation
ecosystem. The results are graphically displayed in figure 2.3 and will now be discussed below.
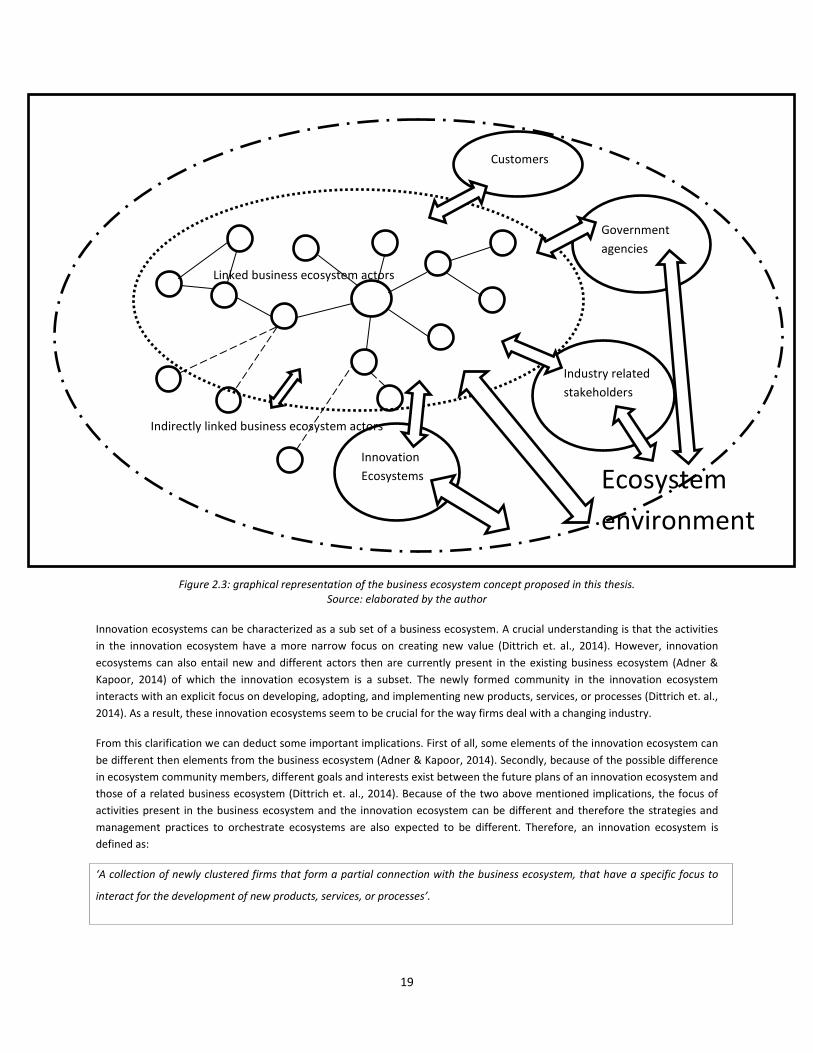
Figure 2.3 illustrates our definition of what constitutes a business ecosystem, illustrating the existence of a community
comprised of linked business ecosystem actors at the center. This center consists of elements, such as players, technologies,
products, and services, which share a common value creation goal. They become a linked community via the exchange of
goods, knowledge, and capital, making the relationships between the players tangible. This configuration shapes a certain
economic configuration for all the ecosystem elements.
A second understanding is visualizing our first ecosystem characteristic from the previous section, the inclusion of commercial
as well as non-commercial entities. These non-commercial players are related to the developments within the business
ecosystem core. This relationship is shaped by the pressures coming from the surrounding ecosystem environment. Examples
of this relationship are pressures from public opinions, regulations, and the influence of industry stakeholders that change due
to changing ecosystem environments.
A third understanding from this business ecosystem view is that there are also elements that are part of the business
ecosystem, but are not directly linked to its value creation goal. These are the previously mentioned industry stakeholders and
government agencies, but also unlinked business actors. These unlinked business actors can be new business entrants for
example. They can build upon the value creation of the B.E. center by leveraging on the existing common base of the business
ecosystem, such as shared assets and infrastructure.
Finally, figure 2.3 shows how the business ecosystem environment places pressure on all these relationships, players, and
technologies. By placing the business ecosystem environment outside the scope of the linked center and unlinked elements,
such as institutions and governments, we imply that the business ecosystem environment can endanger the relationships
between elements without the direct actions taken by individual elements. This means that the B.E. itself needs to be able to
cope with external shocks that cannot be predicted in advance. Combining these characteristics of a business ecosystem, we
can define it as:
‘a collection of linked firms that form a community via the exchange of goods, capital, and knowledge, leading to a specific
business ecosystem structure, which operates in an interactive, open system, that is in constant flux, from which the existing
common base is challenged by both incumbent and new firms and institutions that operate in the ecosystem environment’.
The advantage of using this definition over the definition of others is that is specifies that there is a common base that connects
a community. This is important because other definitions such as from Moore (1993) do not specify where to draw a boundary
between elements that are inside the business ecosystem and elements that are outside the business ecosystem. Secondly,
this definition emphasizes that the common goals and existing links are in constant flux and are constantly being challenged by
some of the elements (technology, players or products/services) that want to develop a different value proposition. As a result,
we imply that the existing industry structure forms the basis for new innovations. The upcoming paragraphs will illustrate how
ecosystem elements generate new innovations via the formation of innovation ecosystems. As shown in figure 2.3, innovation
ecosystems are also part of a business ecosystem. Our answer in identifying where innovations emerge began by positioning
the concept of an innovation ecosystem in relation with a business ecosystem.
19
Figure 2.3: graphical representation of the business ecosystem concept proposed in this thesis.
Source: elaborated by the author
Innovation ecosystems can be characterized as a sub set of a business ecosystem. A crucial understanding is that the activities
in the innovation ecosystem have a more narrow focus on creating new value (Dittrich et. al., 2014). However, innovation
ecosystems can also entail new and different actors then are currently present in the existing business ecosystem (Adner &
Kapoor, 2014) of which the innovation ecosystem is a subset. The newly formed community in the innovation ecosystem
interacts with an explicit focus on developing, adopting, and implementing new products, services, or processes (Dittrich et. al.,
2014). As a result, these innovation ecosystems seem to be crucial for the way firms deal with a changing industry.
From this clarification we can deduct some important implications. First of all, some elements of the innovation ecosystem can
be different then elements from the business ecosystem (Adner & Kapoor, 2014). Secondly, because of the possible difference
in ecosystem community members, different goals and interests exist between the future plans of an innovation ecosystem and
those of a related business ecosystem (Dittrich et. al., 2014). Because of the two above mentioned implications, the focus of
activities present in the business ecosystem and the innovation ecosystem can be different and therefore the strategies and
management practices to orchestrate ecosystems are also expected to be different. Therefore, an innovation ecosystem is
defined as:
‘A collection of newly clustered firms that form a partial connection with the business ecosystem, that have a specific focus to
interact for the development of new products, services, or processes’.
Government
agencies
Industry related
stakeholders
Ecosystem
environment
Indirectly linked business ecosystem actors
Linked business ecosystem actors
Customers
Innovation
Ecosystems
20
2.5 HOW BUSINESS AND INNOVATION ECOSYSTEMS DEAL WITH INNOVATION
Business ecosystems need to be able to adapt to external pressures coming from the ecosystem environment (Moore, 1993).
The way business ecosystems are organized relates to the structure of the business ecosystem (Autio & Thomas, 2013). So, for
business ecosystems to deal with changing ecosystem environments due to technological change, the structure of the business
ecosystem needs to be flexible so that it can adapt. On the other hand, adaptation in innovation ecosystems is needed too, so
that a new value proposition can be developed. These adaptation processes for ecosystems were first mentioned by Adner
(2012) when he used the process of reconfiguration. Reconfiguration in Adner’s view is ‘the changing pattern of interaction
among elements in the system’. Elements in the ecosystem can refer to clusters of firms (Gawer & Cusumano, 2002), and
different clusters of firms can form new industry domains (Iansiti & Levien, 2004b). Reconfiguration of elements inside the
business ecosystem enables them to adapt themselves to changing industry contexts by seeking new value proposition
pathways. The goal of this section is to define what reconfiguration entails to show how ecosystems deal with innovations.
First, the ability of an ecosystem to handle shocks, such as technological change, is determined by the degree of ecosystem
health (Iansiti & Levien, 2004a). The ecosystem health metrics for business ecosystems are robustness, niche creation and
productivity (Iansiti & Levien, 2004a,b). Each metric focuses on a specific ecosystem aspect that is a crucial contributing factor
to the overall performance of an ecosystem. Taken together, these success factors evaluate if the elements in the business
ecosystem are connected in the correct manner in order to deal with external shocks that are coming from outside the business
ecosystem. So how do these three factors determine ecosystem reconfiguration?
Iansti & levien (2004a,b) have shown that the way (tight or loose connected) niche firms are coupled to the business ecosystem
center (in their vision a focal firm or a platform) influences the mobility of niche firms surrounding it. Because niche firms make
up the majority of the business ecosystem (Iansiti & Levien, 2004a), platforms and focal firms within the business ecosystem
compete for these niche firms with other business ecosystems. Due to this competition, the existing ecosystem core adjusts its
technologies or assets on which the niche firms leverage their activities. This is crucial because it ensures that niche firms are
provided with the right incentives to ‘stay locked-in’ into their current platforms. Figure 2.4 visualizes this process of feedback
provided from the niche firms that lead to adjustments within the business ecosystem center.
Secondly, other authors too concluded that the ability of a business ecosystem to renew itself is the motor that drives change
within industries (Moore, 1993). Key understanding from this is that a business ecosystem, which has triumphed over rival
ecosystems or where rival ecosystems have reached a semi-stable state of growth, becomes prey to other innovations that are
not compatible with all its internal business ecosystem elements (Moore, 1993). For this reason it is important for the
ecosystem structure, which links all the actors in a specific way and controls the flow of capital, goods, and information and
forms the mechanism that controls these flows (Cusomano & Gawer, 2002; Iansti & levien, 2004b; Mercan & Göktas, 2011; Li,
2009), to be flexible.
In sum, reconfiguration entails shifting ecosystem elements in order to form alternative value chains to deliver new or better
propositions to the business ecosystems’ end customers. It is therefore essential for ecosystem orchestrators to focus on
achieving flexible ecosystem structures. However, Adner & Kapoor (2014) showed that different technology adoption patterns
are to be expected depending on the willingness of ecosystem elements to reconfigure.
As a result, incorporating new ecosystem elements into existing business ecosystems can lead to bottlenecks as well as new
opportunities for incumbent ecosystem elements. Bottlenecks arise when incumbent ecosystem elements become obsolete
due to new innovations (leading to a value chain configuration without these elements) (Adner & Kapoor, 2014). Then the
innovation ecosystem value proposition and the existing business ecosystem value proposition become competitors. On the
other hand, opportunities emerge when innovation ecosystem elements can enhance the business ecosystem value
proposition, and thus co-create new value with the existing business ecosystem members, complementing on new and existing
assets.
In order to enable proper ecosystem orchestration that will address constraining issues in the business or innovation ecosystem
to deal with innovation, five levers for reconfiguration can be identified. These five levers of reconfiguration described by Adner
(2012) show how certain elements can be subtracted, added, separated, combined or relocated within an innovation
ecosystem to overcome certain bottlenecks or to utilize opportunities. An overview of the five levers of reconfiguration is

21
provided in Appendix III. The next section will aim to explain why certain innovation ecosystems face different reconfiguration
challenges towards their business ecosystem.
Figure 2.4: The growth of a business ecosystem core and its expanding ecosystem boundaries.
Source: Elaborated by the author.
2.6 RESEARCH AIM FOR THE ECOSYSTEM CONCEPTS
With the help of the restructured concepts in the previous sections, we are able to discuss ecosystem orchestration for coping
with technological change. Current literature that is in the direction of this thesis is the work of Adner & Kapoor (2014) and
Jackson (2011). However, they fail to address the conceptual positioning of innovation ecosystems within business ecosystems
in the way we have proposed in this thesis. Jackson (2011) introduces the notion of innovation ecosystems for overcoming the
‘valley of death’ (Murphy & Edwards, 2003) between basic research activities towards economic activities by postulating that
the resources in the research economy are coupled to the resources generated by the commercial economy’(Jackson, 2011,
p.3). As a result, Jackson (2011) recognizes that the existing industry is a source for new innovation for the next industry,
highlighting the link between innovation ecosystems and their function for developing innovations. Studies that do suggest a
link between innovation ecosystems and business ecosystems such as from Dittrich et. al. (2015) forgo any clarification of how
this interaction takes place.
The notion of ecosystem thinking has, from its beginning, tried to answer the question on ‘how to manage a business
ecosystem?, if possible at all.’ (Adner & Kapoor, 2014; Autio et. Al., 2000; Peltoniemi & Vuori, 2004; Moore, 1993). We do not
postulate to have a straight forward answer to this question, but we do hope to provide a basis for a new debate by focusing on
a classification of innovation ecosystems and how these innovation ecosystems relate to the way business ecosystems deal with
22
change. The contribution that ecosystem thinking has to offer here is that it helps explaining innovation challenges faced by
interconnected actors. It offers insights in the emergence of misalignments between strategic insights of individual actors
within the business ecosystems and the business ecosystem community as a whole. At the same time, by using the ecosystem
lens we recognize that some elements of the ‘existing’ business ecosystem are in fact crucial for the birth and growth of new
innovations, while others constitute their barriers. This conclusion is leading us into the debate by proposing that the notion of
ecosystem thinking for analyzing technological change contributes by providing a framework in which the incumbent industry
communities form the source of both disruptive as sustained, radical and incremental innovations. And that all the ecosystem
participants together determine how the business ecosystem as a whole deals with technological change via the formation of
different innovation ecosystems.
Therefore, this theory chapter ends by formulating orchestration dynamics for different types of innovation ecosystems. The
classification of different types of innovation ecosystem depends on the reconfiguration bottlenecks they encounter. How we
identify different types of innovation ecosystems and how they should be orchestrated will be the topic of the upcoming
sections.
2.7 THE ROLE OF INNOVATION ECOSYSTEMS
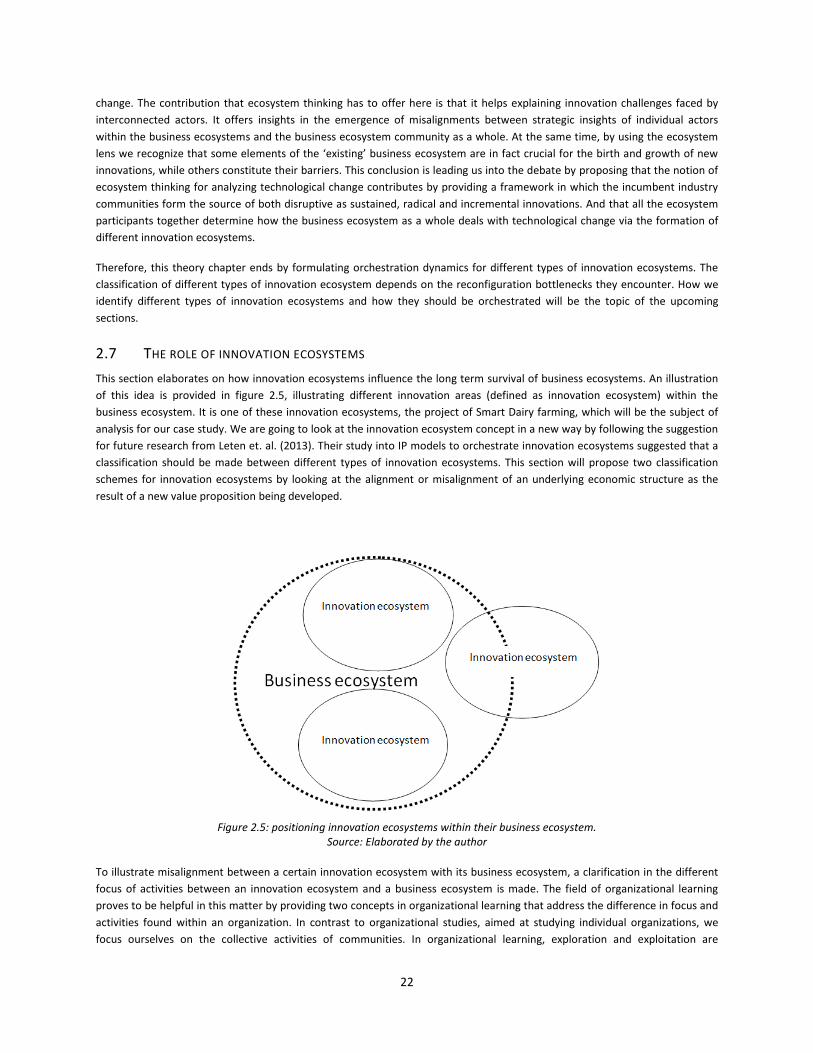
This section elaborates on how innovation ecosystems influence the long term survival of business ecosystems. An illustration
of this idea is provided in figure 2.5, illustrating different innovation areas (defined as innovation ecosystem) within the
business ecosystem. It is one of these innovation ecosystems, the project of Smart Dairy farming, which will be the subject of
analysis for our case study. We are going to look at the innovation ecosystem concept in a new way by following the suggestion
for future research from Leten et. al. (2013). Their study into IP models to orchestrate innovation ecosystems suggested that a
classification should be made between different types of innovation ecosystems. This section will propose two classification
schemes for innovation ecosystems by looking at the alignment or misalignment of an underlying economic structure as the
result of a new value proposition being developed.
Figure 2.5: positioning innovation ecosystems within their business ecosystem.
Source: Elaborated by the author
To illustrate misalignment between a certain innovation ecosystem with its business ecosystem, a clarification in the different
focus of activities between an innovation ecosystem and a business ecosystem is made. The field of organizational learning
proves to be helpful in this matter by providing two concepts in organizational learning that address the difference in focus and
activities found within an organization. In contrast to organizational studies, aimed at studying individual organizations, we
focus ourselves on the collective activities of communities. In organizational learning, exploration and exploitation are
23
interesting concepts to explain how individual firms should cope with a changing business contexts (March, 1991). Exploration
focuses on the creation of new markets and the creation of new value by seeking out new partners. On the other hand,
exploitation focuses on increasing the profits and performance of an existing technology platform. Now we relate these insights
with our content.
For business ecosystems to cope with change, they need to do exploration and exploitation at the same time, just as individual
firms must do in order to keep up with the developments within the ecosystem itself. We have postulated that innovations in
business ecosystems emerge via the creation of innovation ecosystems. We suggest that innovation ecosystems should be
classified in accordance to their overlapping scope with the business ecosystem. For example, an innovation ecosystem with
many incumbent players, aimed to develop a new value proposition that has the potential to enhance the performance of the
existing common base of the business ecosystem, is close in alignment. Therefore we suggest distinguishing between two types
of innovation ecosystems. The first type is focused around activities that lead to an increase in performance for the existing
common base, and thus has a sustained character (Christensen, 1997). The second type of innovation ecosystem is focused on
activities that force the formation of a new economic structure, leading to a disruptive (Christensen, 1997) character for the
existing common base of the business ecosystem elements.
This issue on evaluating performance in an ecosystem context is addressed by the work of Adner & Kapoor (2014) when they
speak of ecosystem challenges and ecosystem opportunities to explain the pace of substitution for technology generations.
Adner & Kapoor (2014) use ecosystem challenges for describing bottlenecks that arise as other ecosystem elements, unrelated
to the innovation ecosystem but part of the business ecosystem, confront the rising new technology and thereby constrain its
competitiveness. On the other hand, ecosystem opportunities are innovations for ecosystems which are based on matured
technologies and processes. As a result, the ecosystem opportunities enhance the common base underlying the current
business ecosystem by increasing its performance of the existing linked communities.
This new classification of innovation ecosystems asks for the following addition to the definition of an innovation ecosystem:
‘‘a collection of newly clustered firms that form a partly connection with the business ecosystem, that have a specific focus to
interact for the development of new products, services, or processes that can have a disruptive or sustained character towards
the existing business ecosystem underlying technologies”
The advantage of using this definition is that ecosystem managers can identify which innovation ecosystems are confronted
with resistance from within the business ecosystem. Furthermore, this distinction between, what we call a disruptive
innovation ecosystem and a sustained innovation ecosystem, can help to identify what kind of innovations and innovation
ecosystems should be orchestrated with interventions from governments or mediators, such as TNO. By doing so, ecosystem
management should be aimed at enabling or disabling opportunities or bottlenecks via reconfigurations within the business
ecosystem and innovation ecosystems. It is important to note that these institutions are usually also part of an existing business
ecosystem themselves, including all of its vested interests. As a result, they too can form the bottleneck for certain new
technological innovations within innovation ecosystems.
In sum, we propose to distinguish between types of innovation ecosystems within business ecosystems. A graphical
representation of how these two types of innovation ecosystems are related to the business ecosystems’ scope is shown in
figures 2.6 and 2.7. The next section will describe how the value creation source for each type of innovation ecosystem differs
and shows how this leads to the formation of either bottlenecks or opportunities that hinder or stimulate the value proposition.

24
Figure 2.6: disruptive innovation
ecosystem; creating challenges
to overcome for the innovation
ecosystem
Figure 2.7: sustained innovation
ecosystem; creating
opportunities for the innovation
ecosystem to utilize.
Source: Elaborated by the author

25
2.8 ORCHESTRATION FOR INNOVATION ECOSYSTEMS
In the previous section we hypothesized that in the disruptive innovation ecosystem some elements of the existing business
ecosystem have conflicting interests with the growth and development efforts of the disruptive innovation ecosystem. Adner &
Kapoor (2014) demonstrated that elements in the existing business ecosystem start to challenge emerging technologies by
improving the current, mature technologies. However, their study focused on the rate of technology substitution by
investigating the rate of adoption for innovations. We on the other hand, focus more on aligning different technologies and
assets between existing business ecosystem elements and new innovations from innovation ecosystem elements. This
misalignment of adoption interests leads to the formation of bottlenecks raised by incumbent industry actors. This section
illustrates the need for orchestration by non-commercial agents to direct certain business ecosystems into, for society, desired
outcomes. We will do so by demonstrating how different orchestration dynamics emerge in each type of innovation ecosystem
by analyzing how bottlenecks and opportunities emerge.
The work of Amit & Zott (2001) shows how value is created within an ecosystem context on the basis of four value creation
sources. The work of Adner & Kapoor (2014) showed that the formation of bottlenecks or opportunities determine adoption of
value propositions by business ecosystem elements. To form a link between these two studies, we first define how ecosystem
elements use the value creation levers within each type of innovation ecosystem. These levers are efficiency,
complementarities, lock-in, and novelty (Amit & zott, 2001). To explain why these levers lead to different types of innovation
ecosystems we distinguish different ways in which business ecosystem elements use the four levers of value creation. Table 2.3
shows the sustained or disruptive way each lever of value creation is used by the ecosystem elements. This distinction between
disruptive or sustained use of value creation levers will help us develop properties to identify bottlenecks or opportunities for
innovations.
Table 2.3: Description of how the ecosystem elements use the four levers of value creation in each type of innovation ecosystem.
Four sources of value
creation
Disruptive innovation ecosystem Sustained innovation ecosystem
Efficiency
Actors outside the innovation ecosystem, but inside
the business ecosystem seek to improve existing
processes and assets (Ander & Kapoor, 2014).
Actors outside the innovation ecosystem, but
inside the business ecosystem do not
actively undertake actions to improve
existing assets (Adner & Kapoor, 2014).
Complementarities New complementarities are coming from outside the
existing industry scope.
New complementarities are coming from
within the existing industry scope.
Lock-in Lock-in hinders innovation ecosystem growth.
High switching costs (Amit & Zott, 2001)
Lock-in stimulates innovation ecosystem
growth.
Dominant design profits from network
externalities (Amit & Zott, 2001).
Novelty Exploration of new relationships, processes,
transactions and ideas is stimulated in the innovation
activities of the business ecosystem actors (Amit &
Zott, 2001).
Exploitation of maximizing existing gains
from existing assets is central focus of
innovation endeavors by the business
ecosystem actors (Amit & Zott, 2001).
Source: Elaborated by the author
The following paragraphs will demonstrate how the two classifications for innovation ecosystems help us orchestrate
incumbent business ecosystems. In the previous sections the importance of flexibility for the ecosystem structure was
addressed to enable reconfiguration. The added value of our work is that we recognized that the successfulness of business
ecosystems can therefore be measured in other parameters than ecosystem expansion (Moore, 1993) or the creation of
ecosystem niche firms (Iansiti & Levien, 2004b). The four sources of value creation proposed by Amit & Zott (2001) are a good
basis for assessing this flexibility of ecosystem structures because it helps us identify how innovation emerges and therefore
helps us assess where orchestration of the ecosystem elements is necessary.

26
The way a business ecosystem engages into exploration or exploitation activities will lead to different value creation
propositions in innovation ecosystems. The main difference of this innovation ecosystem concept with the works from Leten et.
al. (2013) and Van der Borgh (2012), is that we do not follow a theoretical concept of an innovation ecosystem that has a
continuous existence. An example of such theoretical concept is a science park. Instead, we postulate that innovation
ecosystems are experimental areas that have the potential to grow via a ‘specific focus to interact for the development of new
products, services, or processes’. As a result of this growth, the innovation ecosystem value proposition becomes the new
common base for the business ecosystem.
Developing orchestration expectations for the two types of innovation ecosystems consists of developing a conceptual model.
In this conceptual model we formulate properties that explain why bottlenecks or opportunities emerge that hinder or
stimulate a value proposition development. Focusing on why certain bottlenecks or opportunities emerge will help us
understand how to orchestrate sustained or disruptive innovation ecosystems towards a desired end state. Figure 2.8 presents
the proposed conceptual model to analyze acceptation or rejection of certain innovations by the business ecosystem players’.
The derived properties are also summarized in table 2.4 below. These properties will help us assess the disruptive or sustained
character an innovation ecosystem has towards its business ecosystem.
Table 2.4: Exploration and exploitation properties for developing Innovation ecosystem expectations
Four sources of
value creation
Exploitation properties Exploration properties
Efficiency Actors have protective attitude, rejecting the goals of the
new value proposition.
Actors work on common efforts to deliver
the new value proposition.
Complementarities Actors maximize capitalization of existing knowledge.
Actors generate/create new knowledge
with other partners to address new
markets.
Lock-in Actors start investments in old value proposition to resist.
Actors adapt existing skills and
infrastructure.
Novelty Actors seek solutions within current firm structure to deal
with external forces.
Actors connect with new entrants outside
existing firm scope.
Source: Elaborated by the author
This section described how to use the two classifications for innovation ecosystems by examining the formation of bottlenecks
and opportunities. We add to the work of Adner & kapoor (2014) by positioning innovation ecosystems in relation to their
business ecosystems. This section end below by identifying different orchestration plans on the basis of different innovation
ecosystem characteristics.
In our conceptual model, we hypothesize that the formation of opportunities or bottlenecks are related to actors’ motivation to
operate in a certain innovation ecosystem. And that these motivations are either exploratively or exploitatively related.
Therefore we expect that active resistance or adoption by actors outside the innovation ecosystem will depend on the
explorative or exploitative character of the new value proposition in relation to the existing processes, technologies and
products. The issue is to examine whether actors who are in the scope of the innovation ecosystem will start to resist or join
delivery of the new value proposition.
For each type of innovation ecosystem we conclude the following orchestration guidelines. An exploitative perception of the
incumbent business ecosystem players towards the new value proposition will encounter less resistance by the business
ecosystem elements. The orchestrator needs to address adoption by the industry incumbents by examining which players and
elements can increase the value proposition the most, while ensuring the least efforts to reconfigure. On the other hand, a
more explorative perception of the new value proposition will encounter more resistance by individual business ecosystem
elements, especially when it is replacing existing processes, roles, technologies, and assets.
In sum, our ecosystem concepts help ecosystem orchestrators to locate opportunities and bottlenecks for the innovation
ecosystems’ new value proposition. Identifying innovation ecosystems as disruptive or sustained creates insights in long term

27
development scenarios for the desired future end state of a business ecosystem. As a result, the business ecosystem
orchestrator can evaluate if the business ecosystems’ structure is flexible enough to reconfigure into the desired economic
structure. Or the innovation ecosystem orchestrator can determine a different development path for the innovation ecosystem,
by reconfiguring out of the business ecosystems’ scope.
Figure 2.8: Conceptual model that shows how exploration and exploitation properties of individual firms are leading to either the
formation of bottlenecks or opportunities.
Threat of discontinuity of business
models due to new value creation in
I.E. by the data sharing platform
Properties:
• Actors have protective attitude, rejecting the goals
of the new value proposition
• Actors maximize capitalization of existing
knowledge
• Actors resist investments in new value proposition
• Actors seek solutions within current firm structure
to deal with external forces.
Properties:
• Actors work on common efforts to deliver the
new value proposition
• Actors generate/create new knowledge with
other partners to address new markets
• Actors adapt existing skills and needed
infrastructure
• Actors connect with new entrants outside
existing firm scope.
Exploitation in business
ecosystem
Exploration in innovation
ecosystem
Actors in the business ecosystem
either resist a new value proposition
or join to invest in ways to capitalize
on it Formation of innovation
ecosystem opportunities Formation of innovation
ecosystem bottlenecks
Possible Reconfiguration:
consolidation of innovation
ecosystem’s new value proposition
with the existing business ecosystem

28
2.9 CONCLUSION
In the previous sections of our theory chapter we have strived to provide a roadmap through the widely used ecosystem
terminology. We have first illustrated how the notion of ecosystem emerged and what the implications are for using an
ecosystem perspective in analyzing business. We showed how previous work with evolutionary concepts such as co-opetition
and co-specialization fits into the notion of ecosystem thinking. However, to analyze a set of actors, interrelated technologies
and innovation dynamics we need ecosystem concepts that take broader elements and processes into account, hence our
reason to focus on the both the business ecosystem and innovation ecosystem concepts.
Authors that have used these concepts for analyzing the emergence of innovations in an empirical study are Battistella et. al
(2013) and Adner (2012). The main difference between these two author approaches towards analyzing innovations in
ecosystem contexts is that Battistella et. al (2013) focuses on the business ecosystem as a level of analysis and Adner (2012)
focuses more on a micro level, identifying specific value propositions. We illustrated how both visions should be combined for
achieving successful orchestration of innovations in an ecosystem context by placing the concept of innovation ecosystems in
relation to a business ecosystem. We did this by highlighting the different characteristics of the ecosystem concepts described
by the various authors such as Moore (1993), Iansiti & Levien (2004a,b), Adner (2012), Autio & Thomas (2013), Leten et. al.
(2013). Secondly, we classified innovation ecosystems into disruptive or sustained, depending on how the value proposition is
related to the business ecosystem.
Using the redefined ecosystem concepts we can conclude the following orchestration advantages. First, for ecosystem players’
making a distinction between disruptive and sustained innovation ecosystems can help them position themselves better within
the business ecosystem. Repositioning can be done via the engagement into new connections. A crucial factor for achieving
this, known as reconfiguration, is that the business ecosystem has a flexible structure. Following this guideline will result in a
better strategic positioning than Iansiti & Levien (2004a, 2004b) have done by identifying three ecosystem roles for individual
actors. Instead, we moved forward by aiming to identify if actors are entangled into the ‘new’ or the ‘existing’ ecosystem value
proposition. This will help companies and stakeholders to better define future configuration scenarios for developing long-run
innovation strategy.
From our current literature understanding, a conceptual framework was proposed in the previous section. The framework
analyses individual actor behavior and then illustrates how this will influence the characterization of the innovation ecosystem
into disruptive or sustained (Christensen, 1997) by investigating how bottlenecks and opportunities (Adner & Kapoor, 2014)
emerge for new value creation activities (Amit & Zott, 2001). In addition, making a distinction between sustained and disruptive
innovation ecosystems has advantages for non-commercial agents, such as governments, universities and intermediaries. By
making this distinction, actors have a better view on the developments that occur inside an industry scope and the
developments that occur outside or at the edge of an industry scope.
The project of Smart Dairy Farming combines both existing partners from the dairy industry, as well as new entrants from the IT
sector to develop a platform based on new IT technologies. With this new collaboration, we expected that certain existing
relationships and value propositions are challenged within the existing business ecosystem structure. The question of ‘‘how’
and ‘why’, is the role of ecosystem orchestration different in the innovation ecosystem of SDF?’ can now be investigated by
looking at how this innovation ecosystem relates to its business ecosystem and what kind of opportunities and bottlenecks can
be identified that hinder or stimulate the developments of the new SDF value proposition.

29
3. METHODOLOGY

30
INTRODUCTION The goal of this research is to illustrate the use of the ecosystem concepts as a practical tool for managers to help them guide
the emergence of new innovations. To achieve this goal, different orchestration guidelines are to be developed to help
distinguishing between disruptive or sustained innovation ecosystems. To do this we used the MOBENA methodology
Battistella et. al. (2013), and transformed it into a practical tool. The MOBENA methodology is introduced by Battistella et. al.
(2013) and offers a systematic approach for analyzing business ecosystems. This approach consists of five steps. The first step
entails the identification of the ecosystem perimeter, elements and relationships. Then, this information is shaped into an
ecosystem model representation. As a third step, this model is validated via consultation with experts and the use of
documentation. Fourth, an ecosystem analysis is conducted to evaluate the ecosystem behavior and relevant key indicators via
a value analysis and ecosystem control point analysis. The final step entails the exploration into the different ecosystem
evolution possibilities. This chapter discusses how the ecosystem concepts from our previous chapter fit into this methodology
and how we suggest alterations in the MOBENA methodology to measure our ecosystem concept of innovation ecosystem and
business ecosystem that enable managers to orchestrate innovations in an ecosystem context.
3.1 UNIT OF ANALYSIS
The theory section introduced ecosystem concepts for analyzing innovation in ecosystems. As a result, the questions for the
case study relate to these concepts and already form a narrow focus on the case. This narrow focus consists of placing our focus
onto the innovation ecosystem, also known as the project of Smart Dairy Farming. This ecosystem consists of the elements:
players, technologies, products, and services. These elements constitute as our unit of analysis. By studying these elements, we
try to grasp how the problems and opportunities relate to their business ecosystem.
This is a different strategy than Battistella et. al. (2013) have used. They conducted an analysis on the business ecosystem level.
We however, focus on the level of the innovation ecosystem. Reason for choosing the innovation ecosystem instead of the
business ecosystem as an entity for analysis is that the boundaries and elements of an innovation ecosystem are easier to
identify. We follow here implicitly the guidelines from Adner (2012) when he discusses ‘winning the game’ strategies for an
innovation ecosystem. Adner (2012) too recognizes that the innovation ecosystem level is a better concept to choose for
identifying its elements and complementarities. In addition, using the smaller scope of the innovation ecosystem, we can
tangibly demonstrate how ecosystem orchestration can help to overcome challenges or to utilize opportunities (Adner &
Kapoor, 2014).
3.2 CASE SELECTION
Our case is selected from a specific innovation agenda initiated by FME, TNO, VNO-NCW, Chamber of Commerce, Nederland
ICT, and the Dutch Ministry of Economic Affairs, called ‘Smart Industry’ (Smart Industry.nl, 2015a). The smart industry agenda
falls within the Dutch innovation policy of ‘top sectoren’ and is recognized by all the above mentioned institutions as an
important agenda to stimulate innovations in the Dutch industry. These innovations are mainly facilitated via the adoption and
implementation of new ICT technologies (Smart Industry, 2015a; G3, 2015).
The potential for innovation orchestration in the dairy sector via new ICT innovations were reasons to choose a project within
the program of smart industry. Projects within the smart industry agenda are referred to as Field labs. These are practical
environments where companies and institutions develop specific innovations for applying ICT solutions to stimulate cross-
sectorial initiatives (Smart Industry, 2015b). A small inventory was conducted to gain insights into the different dynamics of
each Field lab. This resulted in three interviews with project leaders and Smart Industry experts, complemented by an internet
and documentation survey of reports from TNO and the Smart Industry agenda.
From this inventory, Field labs were ranked in accordance to their level of advancement. Cases ranged from initiation phase to
follow-up phase. Since the unit of analysis is focused on the players, relationships, technologies, and services, we needed a case
that was already in action and had some documentation, results and concrete collaboration activities. Additional features of the
case such as public and private actors involved, presence of subsidies, regulation pressures, and a link with societal impact were
a bonus because they have our interest.
31
After speaking with several project leaders within different field labs, our attention was drawn to the field lab of Smart Dairy
Farming (SDF). The field lab of SDF aims to innovate in a private-public consortium to improve animal health, fertility and
nutrition (SmartDairyFarming.nl). By applying ICT and sensor technology, new business models and services can be developed
to improve the overall productivity of the Dutch dairy sector. As a result, we have found a case that is characterized as
followed:
• Private-public collaboration in SDF due to participation by government entities and an RTO.
• External pressure on existing industry via regulatory changes and society. The dairy sector is faced with stricter
environmental regulations and animal welfare measures combined with the trend of consumers to know how and where
their food is produced.
• Two-sided market dynamics. Since farmers provide both the (partial) input for data gathering and are also potential
customers for new services based on analysis from this data.
• Potential to examine the process of how the Innovation ecosystem of SDF is or is not likely to be developed into a new
business ecosystem. This will offer us the opportunity for studying the evolution of the innovation ecosystem.
3.3 DATA COLLECTION
A hallmark of case study research is the use of multiple data sources (Baxter & Jack, 2008). Multiple data sources enhance data
credibility (Yin, 2003; Patton, 1990), which makes it a good research strategy to follow. Furthermore, a case study research also
offers the unique opportunity to compare data that is obtained qualitative, via for instance interviews and observations, with
data that is quantitative such as statistic and survey data (Baxter & Jack, 2008). The upcoming sections will describe our various
data sources, a complete overview can be found in the reference chapter. In the reference chapter, an overview of all used data
sources is provided in table 3.1.
3.3.1 Documentation
Documents from the SDF project were studied in preparation for the interviews and for validation of the interview results.
Documents were used to gain an understanding of the ecosystem structure and relationships and the ecosystem environment
of SDF. In addition, it offered insights into the registered problems from different stakeholders and descriptions of how they
were addressed in the past. Additional data was gathered via newspapers and the internet to gain insights into actors that were
not directly a part of the private-public consortium that made up the innovation ecosystem.
3.3.2 Interviews
Interviewees were selected via references in documents and reports. Mainly key players and a wide variety of different types of
actors were contacted. Because of this wide variety of actors, many different views and perspectives were obtained. Access to
new information was found by asking respondents which other interviewees could be interesting to contact. After achieving
saturation, a point where no significant new data was obtained, the search for new interview respondents was terminated.
3.3.3 Other data sources
In addition to documentation, internet findings and interview results, the researcher engaged in numerous congress and event
visits to gain a better understanding of the industry dynamics and ‘hot topics’. It was also a good opportunity to ‘get a feeling’
on the impact and importance of the SDF project for the dairy sector.
3.4 DATA ANALYSIS: INTRODUCING THE ADAPTED MOBENA METHODOLOGY PHASES
Our ecosystem analysis is based on the guidelines of the ‘methodology of business ecosystem network analysis’ (MOBENA),
developed by Battistella et. Al. (2013). The MOBENA methodology consists of four phases, starting from ecosystem perimeter
definitions till ecosystem evolution scenarios. A complete overview of the four phases, including a description is given in
appendix VI. For our practice and research goals we adopted the MOBENA methodology into a more qualitative research
approach. Reasons for shifting our focus towards a more in depth analysis is that we want to examine individual actor
perspectives and their dependent complementarities in order to discover opportunities and bottlenecks. A second reason for
altering the MOBENA methodology from a quantitative focus towards a more qualitative is that we are limited by time and
resource constraints. The application of the MOBENA methodology by Battistella et. Al. (2013), showed that a group of four
scientists and two years of research were needed to complete their ecosystem analysis. Therefore we have strived to develop a

32
way in which the MOBENA methodology could be transformed towards a more practical tool for conducting ecosystem analysis
so that the ecosystem methodology, and its concepts, leaves the academic sphere into practical application. Finally, by shifting
the level of analysis to the innovation ecosystem level, micro-level data on ecosystem elements and their relationships can be
identified. As a result, a qualitative approach offers the potential for richer data to conduct our analysis on. The proposed
adapted five phased MOBENA methodology is summarized in table 3.1 below and will be discussed thereafter.
Table 3.1: Innovation ecosystem analysis tool proposed for this thesis.
Source: Elaborated by the author
First, we identified the ecosystem perimeter. This was done on the basis of project participation in Smart Dairy Farming. From
here we identified the elements; this included the identification of possible focal actors and key technologies. The first aspect,
identifying key players was done via alter-ego perceptions. By asking actors for their direct relationships and then asking them
what that relationship entailed (knowledge creation or exchange, exchange of goods, financing etc.). In addition, we asked each
participant to give an indication of the importance of their relationships on a scale from one to seven. To gain more information
and context on who can be classified as the focal firm or key players, we also asked two additional questions. First, participants
were asked which actors were the most influential in the dairy sector and second, which actors contributed the most in the SDF
project. This deliverable is similar to a players’ information and connection matrix. But instead of a quantitative matrix, we have
gained more in-depth information, leading to a list of key players and their core business as well as their contributing efforts in
the SDF project (see appendix VII). In addition, we also obtained information on the ecosystem power play (see appendix X) to
help identifying key players.
The second aspect, characterizing the ecosystem environment and key technologies was done via documentation review and by
asking participants for their reasons to participate. In addition, we identified crucial assets of each ecosystem player and we
phase content Deliverable
Identification of innovation ecosystem
(I.E.)
• Define I.E. value proposition
• Gather relevant information that
influence the I.E. developments and
elements.
• Identify the new value proposition of the I.E.
• Identify I.E. elements, such as key technologies, players,
and processes/products/services.
• Chart relationships between the elements, linking key
players with enabling technologies.
• Classify players as incumbent or new entrants
• Identify I.E. environmental factors such as regulations,
external pressures or new technologies.
• List of I.E. elements with the major
players and enabling technologies.
• List of I.E. trends that hinder or
stimulate its new value
proposition.
Representation of I.E. model
• Model shows necessary relationships
between the elements to offer its new
value proposition.
• Configuration of I.E. relationships. Identify possible hub
position(s).
• Show where flows of goods, capital, or knowledge are
located.
• Model on desirable configuration
that will deliver the new value
proposition. Graphical represent
the interdependencies of the
ecosystem players.
Innovation ecosystem analysis
• Ecosystem value chain analysis: Investigate underlying economic structure. Ask the
elements for their experienced benefits and costs.
• Ecosystem control point analysis Identify crucial point where management can be applied.
Look for key positions within the value chain and related
enabling technologies. Locate crucial business activities.
• Ecosystem value chain
• Ecosystem control points
Innovation ecosystem evolution • Discover different configuration possibilities by
performing an ‘as is’ exercise with crucial players within
the I.E.
• I.E. development scenarios
Innovation ecosystem classification
• Position the I.E. in relation with the B.E.
• Identify opportunities and bottlenecks for the innovation
ecosystem by looking at the problems and benefits the
ecosystem players have or expect to gain. • Link findings with explorative or exploitative properties. • Develop ecosystem orchestration guidelines. Determine if
innovation ecosystem value proposition is desired end
state for the business ecosystem.
• Classification of I.E. into disruptive
or sustained. • Determine desired future end state
and develop a plan for ecosystem
orchestration.

33
listed characteristics of players such as firm size, industry scope, core business, and contributions in SDF. This deliverable would
be similar to Battistella’s technology workbook, although we made it more explicit by identifying specific actors who own key
assets and we gained a rich understanding of the relationships between the ecosystem elements towards the new value
proposition that SDF aims to deliver.
The second phase consisted of representing this information into an ecosystem model. A clarification for this phase is in order
since our theoretical construct of what constitutes a business ecosystem and an innovation ecosystem differs from those used
by Battistella et. Al. (2013). They define a business ecosystem as ‘all the agents that directly and indirectly contribute to the
development of a business, product or process influencing its success in a short or longer time’ (p. 1). We will highlight the major
difference here by illustrating that ‘success in a short or longer time’ is not applicable in our definition. In chapter 2, we
postulated that the business ecosystem develops experimental spaces (which we call innovation ecosystems), where actors
work together in new configurations and with new ecosystem elements to create new value propositions. They do this in order
to achieve long term survival for the business ecosystem. Therefore, in line with our concepts, we charted the innovation
ecosystem of SDF, since it constitutes the future business, products and processes of the long term business ecosystem. The
deliverable here is the ecosystem for the SDF innovation ecosystem. In addition, we used this phase to validate our ecosystem
model with several experts in the field and engaged in open discussion with our participants.
The third phase entailed the analysis of our SDF innovation ecosystem model. We combined our insights from phase one with
our SDF innovation ecosystem model. From this analysis we were able to identify crucial points where orchestration can be
applied. We identified these points by distinguishing between three fundamental levels within the SDF ecosystem. These three
levels were chosen because they have the potential for management applications. Hence, the outcomes of managing these
ecosystem control points will determine the reconfiguration characteristics for the innovation ecosystem to grow.
As a fourth step, an analysis into the viability of this ideal SDF innovation ecosystem was conducted by investigating different
ecosystem evolution scenarios. These ecosystem evolution scenarios were identified via an analysis known as the ‘as is’
methodology. By asking how each actor in the innovation ecosystem would prefer to see the SDF value proposition
development in five years time, we were able to identify two different views on how the SDF innovation ecosystem could grow
and be absorbed into the business ecosystem.
The final and fifth step consists of classifying the innovation ecosystem into disruptive or sustained in order to develop proper
orchestration plans. By looking at the benefits and opportunities that the ecosystem players experienced and relating these to
an explorative or exploitative scope, we can assess if the formulated properties are of a disruptive or sustained innovation
ecosystem. These previous paragraphs conclude our methodology for the measurements of our ecosystem concepts. This
section ends with a few notions on how data was collected, recorded and analyzed.
3.5 CODING PROTOCOL
Following the guidelines for qualitative research analysis by Creswell (1994), we constructed the layout of certain tables and
matrices during interviews taking in accordance with our five phased adapted MOBENA methodology. As a result, data analysis
was conducted simultaneously with data collection, data interpretation, and narrative reporting writing (Creswell, 1994). This
helped to de-contextualize and re-contextualize information into useful drawings that show accurate relationships and
interdependencies between ecosystem elements.
Data obtained during the interviews was recorded and later transcribed for our analysis. Transcripts from interviews were
processed with QDA mining software. First, all interview transcripts where uploaded into the program. Following the semi-
structured layout of the interview protocol, sentences and phrases where given labels. These labels consisted out of categories,
such as ‘problems’ or ‘opportunities’. These categories were filled with information by assigning them with codes. This formed
the initiate segmentation the ‘information bulk’. Then, the analysis continued. After initial labeling, generic coding commenced.
This meant screening out overlap between the given labels. Eventually, this resulted in value chain charts, technology
workbooks, players’ information matrices, ecosystem representation models, opportunities, and bottlenecks.
For our fourth phase, charting the ecosystem evolution scenarios, actors participated in an interactive exercise. We used a
method, formally known by ‘as is’ methodology for visualizing relationships that actors had within the SDF project. More

34
details can be found in appendix VI in the sections ‘Oefening 1’ and ‘Oefening 2’ and an example of obtained data can be found
in appendix XI. The bottom line is that this approach offered an interactive session with the participant. As a result, the
interviewee’s perceptions were better captured and less likely be influenced by the researchers ‘own interpretation of events
and relationships.
3.6 RESEARCH QUALITY
This last section of the methodology chapter will end by showing how we have tried to solidify our findings on the aspect of
validation and reliability.
3.6.1 Validity
The issue of internal validity was tackled by following the guidelines for data triangulation summarized by Creswell (1994). This
resulted in the following steps: First, our research results have been presented to leading consultants and experts within the
industry. Secondly, in each case, we discussed our findings with our participants and incidental with outside experts. As a result,
we have prevented unfounded conclusions and secured validity of our findings. Finally, our interview results have been
triangulated with other data sources such as documentation from press releases, company records, policy documents, and
congress proceedings.
3.6.2 Reliability
The issue of reliability was specifically addressed since this theses aims to investigate to usefulness of the ecosystem lens for
orchestrating innovations. Creswell summarizes reliability as “the issue of generalizability, the uniqueness of a study within a
specific context”. Our methodology has been carefully described and recorded, and evaluated, as recommended by Yin (1989).
Therefore, we hope that this approach will be easily reproducible for other cases. Concerning our findings regarding
orchestration guidelines for SDF, we believe our analysis cannot be translated to different industries, since the dairy sector,
with its cooperation structures, is not representative for other sectors. By transforming an academic tool for analyzing business
ecosystems, the previously mentioned MOBENA methodology, we offer a practical tool for managers and researchers.
The methodology of our adapted five staged MOBENA methodology was tested by undertaking a case study approach. The
pitfall of our research strategy is that we have limited ourselves to one case study, making our assumptions for general
orchestration guidelines less reliable. However, by concentrating on a single case study, we obtained rich data and a detailed
understanding of the context in which we applied our redefined ecosystem concepts. Therefore, we had the advantage of
testing and evaluating our formulated concepts and methodology in great detail, resulting in continuous improvements for
both. It is therefore our conclusion that the work of this research provides a good fundament for using our concepts in the field
of ecosystem theory and our methodology as a practical tool for managers.
35
4. RESULTS SDF
ECOSYSTEM ANALYSIS

36
INTRODUCTION The theory chapter introduced the needed ecosystem concepts for defining the role of ecosystem orchestration in the
innovation ecosystem of Smart Dairy Farming. The methodology chapter discussed how we can measure our defined ecosystem
concepts and presented a five phased methodology to achieve our two research goals. This chapter presents our findings in
accordance with the five phased adapted MOBENA methodology. The results will illustrate how the SDF innovation ecosystem
value proposition is developed and how it relates to its business ecosystem. All the results from our five phased approach
contribute to our understanding of the SDF innovation ecosystem orchestration dynamics. Therefore this chapter will end with
our case study conclusions in which our suggestions for ecosystem orchestration are discussed.
4.1 PHASE I – IDENTIFICATION OF INNOVATION ECOSYSTEM
4.1.1 Relevant characteristics of business ecosystem
The Netherlands are the fourth largest supplier of dairy products in the world, next to New Zealand, The United States, and
Australia (Rabobank, 2015). Global challenges in food security and the need for safe dairy products stimulates continuous
growth for the dairy sector. In addition, the Dutch dairy sector is one of the most successful agricultural sectors in the
Netherlands, characterized by a high level of specialization, horizontal integration and vertical integration, and of global
importance for supplying dairy products (Productschap Zuivel, 2014). Besides the fact that the dairy sector in the Netherlands is
well organized, producing dairy at the farms and processing it into dairy products is also a highly automated and technology
driven process (Ham, 2015). With the development of IT infrastructure and new sensor technologies, farmers and dairy
partners are able to acquire huge amounts of data from various sources (SmartDairyFarming, 2015). However, using data and
making sure data flows to various actors within the chain and beyond requires innovation in an ecosystem context.
4.1.2 Developments in the ecosystem environment
As of April 1st
2015, farmers are no longer restricted to a production quota. Instead, the ‘melkveewet’ replaces the European
production quota restrictions to allow further growth of the dairy sector but with restrictions on phosphate levels to prevent
environmental damage (LTO Nederland, 2015). One of the interview respondents explained the consequences of this change
regulation as followed:
‘’After 30 years of having a production quota for the farmers to produce a certain amount of milk, farmers have had the
comfortable situation of stable milk prices and limited competition (A2, 2015)”.
As a result, many farmers will face difficulty in facing a transition to a more dynamic dairy market with alternating milk prices
and will be forced to innovate in order to achieve growth within the boundaries phosphate restrictions.
The second trend identified in the ecosystem environment is related to the topic of animal wellbeing and food security. Recent
scandals in food production, specifically in 2008 for the dairy sector in China (Elsevier, 2008) and overuse of antibiotics have
made consumers more aware of the question where food is coming from. As a result, retailers need information to show where
their food is coming from and how it is produced (Rabobank, 2015). In addition to the quality of food, more and more societal
discussions on animal welfare are emerging, with organized groups in the Netherlands such as ‘Wakkerdier’ and political party
‘Partij voor de dieren’. The result of these discussions is more awareness for animal welfare and regulation on ensuring animal
welfare via labels on food products that inform the consumers about the quality of life an animal has had (Wakkerdier, 2015).
4.1.3 Identification of the innovation seed
The above mentioned developments have led to the initiation of the project Smart Dairy Farming 1.0 (SDF 1.0). The project is
aimed to provide farmers individual working instructions on cow management. This is the innovative aspect of SDF: instead of
group or herd management, which is the current practice in the sector (G1, 2015), farmers manage individual cow needs. The
Smart Dairy Farming project consists of two sides. It is the cross-over between developments in the dairy industry and the IT
sector. The dairy industry is characterized by its continuous strive for efficiency and automation. This industry is now
increasingly complemented by developments in the IT sector, providing access to new applications and big data analysis tools.
The Smart Dairy Farming 1.0 project laid the foundation for developing a vision and IT architecture for enabling chain
collaboration. These IT architectural developments created the possibility for data to flow across the dairy industry chain.
Moreover, the introduction of this IT infrastructure, called the Infobroker, reduces the overall costs of connecting databases

37
between different farms and partners within the dairy industry due to standardization efforts. This standardization is
specifically aimed at streamlining the connect ability of sensor equipment with different databases from (other) dairy chain
partners and operational data. To illustrate the advantage of this IT architecture, figure 4.1 and figure 4.2 in appendix V show
the different ways in which streams of data flow between different actors. Figure 4.1 illustrates the old situation, where each
database from every actor needs to connect individually with each farm. Figure 4.2 shows the role and location of the
Infobroker, were all the interfaces are standardized. To clarify the abstract construct of the Infobroker, a schematic overview of
its IT architecture is provided in appendix V.
This innovation has several key advantages for the dairy sector. First, when this IT infrastructure is in place, existing costs of
connecting individual databases with partners, suppliers or customers are reduced significantly. As one of our participants
described it:
“Connecting all the loose actors with our existing applications is already a huge strain on our resources. We need the new data
from sensors to improve our services, but connecting to each new (sensor) supplier for its data is a pain we are already starting
to feel” (C1, 2015).
Moreover, making all these connections is something that many actors need to do. Therefore, developing an IT infrastructure
that standardizes data sharing is beneficial for all actors that want data. Reasons for actors to gain access to this data are that
they can improve their data richness, which allows them to fine tune their own applications for farmers. The assumption is that
this will benefit the entire sector, making it more competitive. In addition, having a standard platform on which data can be
easily obtained offers the possibility for new companies to enter the dairy industry. In sum, we can state that there are several
key enabling technologies for the innovation of the Infobroker. These are: sensors, broadband internet connections, cloud
databases, visualization tools, and terminals and machinery.
4.1.4 Players’ identification innovation ecosystem
Within the SDF project we identified various actors on the basis of their participation. We identified the main type of actors as
follows; hardware suppliers, service providers, farm suppliers, dairy processing actors, and knowledge institutions. Three key
players within the innovation ecosystem are identified on the basis of influence and financial contribution, these three players
are: Friesland Campina, Agrifirm, and CRV.
Another interesting observation is that three of the fifteen players are participating on a contribution that is different than their
current core business (more information can be found in appendix VII). Our third observation is that the SDF innovation
ecosystem players are almost all large, and often multinational, companies. In addition, by examining players’ contributions and
asking for their visions in how the SDF innovation is of relevance for internal business developments, we scaled players’ into
three different classifications. The different ‘innovation time spans’ are: short (0 – 5 years), medium (5 – 10 years), and long
term (10-20 years). The results are summarized in tables 4.1 and 4.2.
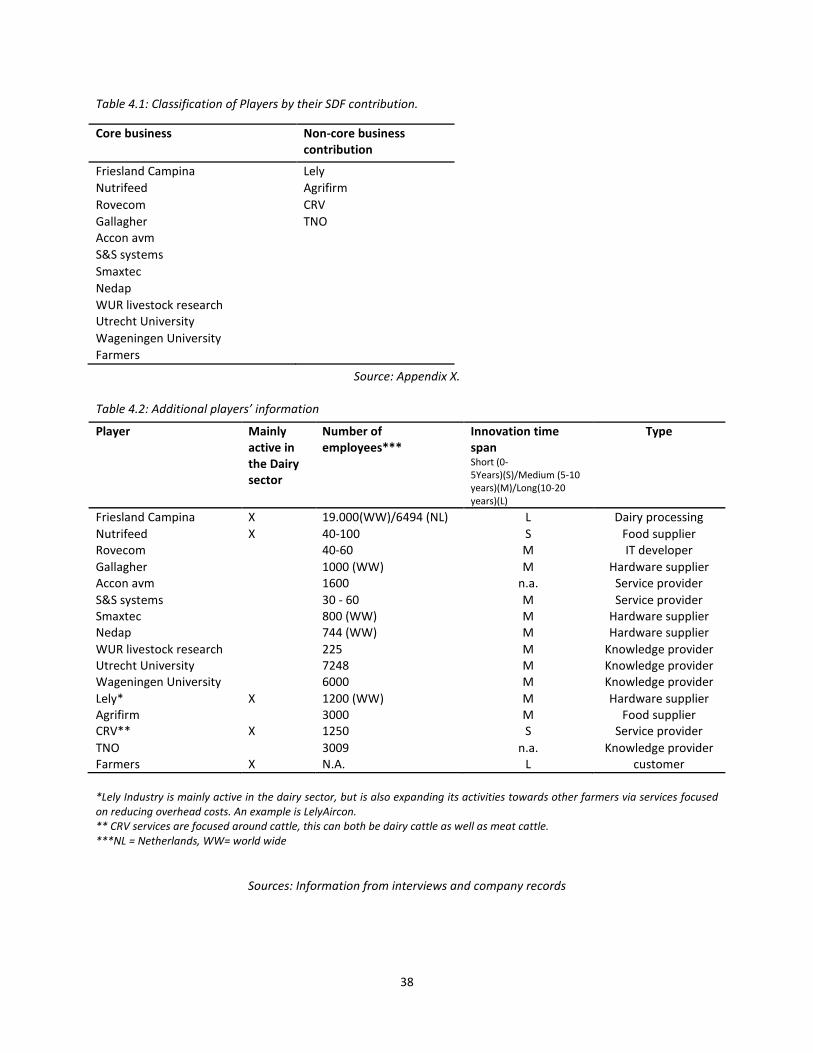
38
Table 4.1: Classification of Players by their SDF contribution.
Source: Appendix X.
Table 4.2: Additional players’ information
*Lely Industry is mainly active in the dairy sector, but is also expanding its activities towards other farmers via services focused
on reducing overhead costs. An example is LelyAircon.
** CRV services are focused around cattle, this can both be dairy cattle as well as meat cattle.
***NL = Netherlands, WW= world wide
Sources: Information from interviews and company records
Core business Non-core business
contribution
Friesland Campina Lely
Nutrifeed Agrifirm
Rovecom CRV
Gallagher TNO
Accon avm
S&S systems
Smaxtec
Nedap
WUR livestock research
Utrecht University
Wageningen University
Farmers
Player Mainly
active in
the Dairy
sector
Number of
employees***
Innovation time
span Short (0-
5Years)(S)/Medium (5-10
years)(M)/Long(10-20
years)(L)
Type
Friesland Campina X 19.000(WW)/6494 (NL) L Dairy processing
Nutrifeed X 40-100 S Food supplier
Rovecom 40-60 M IT developer
Gallagher 1000 (WW) M Hardware supplier
Accon avm 1600 n.a. Service provider
S&S systems 30 - 60 M Service provider
Smaxtec 800 (WW) M Hardware supplier
Nedap 744 (WW) M Hardware supplier
WUR livestock research 225 M Knowledge provider
Utrecht University 7248 M Knowledge provider
Wageningen University 6000 M Knowledge provider
Lely* X 1200 (WW) M Hardware supplier
Agrifirm 3000 M Food supplier
CRV** X 1250 S Service provider
TNO 3009 n.a. Knowledge provider
Farmers X N.A. L customer

39
4.2 PHASE II – MODELING THE INNOVATION ECOSYSTEM ELEMENTS
This step visually connects all the data obtained by investigating the needed relationships between ecosystem elements to
deliver the value proposition. We used the input of our connection matrices from our interview survey (see appendix) to
identify all the connections and relationships needed for achieving the flow of data streams between different actors in the
chain. These flows are the core business proposition of the innovation ecosystem for SDF, without them, no new value
proposition is created. Figure 4.1 presents our results in a graphical manner.
Figure 4.1: schematic overview of the target structure for the Infobroker as a data hub function. Within the figure, the needed
flow channels for data are depicted. Source: elaborated by the author.

40
Table 4.3: Interaction matrix old structure
Old
structure
Hardware
Providers
Genetic
suppliers
Knowledge
providers
Food
services
Management
services
Dairy
processing
farm
Hardware
providers
- 0 0 0 0 3 2
Genetic
suppliers
0 - 3 2 2 0 2
Knowledge
providers
0 3 - 0 0 0 1
Food
services
0 2 0 - 2 0 2
Management
services
0 2 0 2 - 3 2
Dairy
processing
3 0 0 0 3 - 2
Farm
2 2 1 2 2 2 -
Source: TNO value chain analysis on interactions around farm.
Table 4.4: Interaction matrix for targeted structure for the Infobroker
new
structure
Hardware
Providers
Genetic
suppliers
Knowledge
providers
Food
services
Management
services
Dairy
processing
farm Infobroker
Hardware
providers
- 0 0 2 2 3 2 1
Genetic
suppliers
0 - 2 0 0 0 2 1
Knowledge
providers
0 0 - 2 2 0 0 1
Food services 2 0 2 - 0 0 2 1
Management
services
2 0 2 0 - 0 2 2
Dairy
processing
0 0 0 0 0 - 2 1
Farm
2 2 0 2 2 2 - 1
Infobroker
1 1 1 1 1 1 2 -
Source: Elaborated by author, input gained from interaction matrix during interview sessions
The graphical representation of ecosystem relationships is based on table 4.4. To offer a better understanding of what the
Infobrokers’ economic structure entails we also included table 4.3 depicting the relationships for the existing dairy industry. The
tables represent relationships, which are coded into numbers ranging from 0 till 3. The code 0 means that there is no direct
relationship, code 1 means that there is an exchange of operational information. Code 2 means that there is a direct
relationship where information, services & products, and payments are being exchanged. And finally, code 3 is given when
there is no direct tangible relationship, but there is some indirect exchange of information regarding product specifications.
From tables 4.3 and 4.4 we can see a significant difference in terms of information flows. In the new structure, the Infobroker
has a direct tie with each actor in the ecosystem. As a result, it will occupy a hub position within the ecosystem. Secondly, the
new structure for the Infobroker will result in a change of business relationships between the different players. For example, in
the old situation, hardware providers only had a direct relationship with the farm entrepreneur. This relationship would entail
the supply of milking robots or sensory systems. Now, with the Infobroker in place, service providers can collaborate with

41
hardware providers to construct new sensors that they need to develop new services, leading to new products and services in
the value chain.
A crucial understanding from this Infobroker ecosystem is that it is centered on data generation, access, and process. In the old
situation, each player had to make its own connections with individual farms in order to collect data. Moreover, the systems
that collected data were custom made for each player and the data generated was exclusively sent to its developer. In the
targeted ecosystem structure, connections between data generators are standardized and availability of certain datasets can be
obtained by third parties. To illustrate which players have a crucial role in data generation, we depicted with black arrow
information streams that are the input of the Infobroker. The following sections will analyze the underlying economic structure
for the Infobroker.
4.3 PHASE III – INNOVATION ECOSYSTEM ANALYSIS
This section discusses our findings regarding the innovation ecosystem’s economic structure. The findings are presented in a
value chain analysis and an overview for the ecosystem control points. The value chain specifies players’ locations and related
activities, the results are shown in table 4.5. Secondly, ecosystem control points are derived on which ecosystem orchestration
can be applied; these results are summarized in figure 4.2.
Table 4.5: Configuration of value chain: overview for SDF
Source: Elaborated by the author, insights obtained from interviews and documentation review.
From table 4.5 we will highlight one interesting ecosystem configuration dynamic. Some players occupy more than one position
within the value chain. This is the case for Lely industries. They manufacture milking robots and acquire huge amounts of data
at the same moment. As a result, Lely industries is able to analyse data that allows them to diversify business into service
offerings. Lely in this example is both a hardware supplier as well as a service provider to the farm entrepreneur.
activities Raw data input
Static data on cow
genetics,
Sensor data from
farm
Infobroker’s IT
infrastructure
Connect
individual
company
databases,
Structure
information flows
and storage
protocols
Infobroker’s
management
Manage
authorization for
data access,
Payments for
platform use,
Platform
advertising
Data modelers
Big data analysis,
Business
development,
Decision support
for farmer
Devices
Machinery
development for
automation and
control systems,
Interface
visualizations for
farm management
information.
actors Data managers on
Genetic profiling
of cows,
Sensor suppliers,
Machinery
suppliers,
CRV,
Gallagher,
Lely,
Deleval,
Farmer
Architectural
designers,
TNO
Rovecom
S&S systems
Stichting Smart
Dairy Farming,
Consortium,
Farmer
Consultants,
Agrifirm,
CRV,
Friesland
Campina,
Rovecom,
Governments,
Sectorial
associations,
Lely,
Deleval,
Gea
Hardware
developers,
Lely,
Deleval,
Gea,
Gallagher,
Enterprise
resource planning
(ERP)system
developers

42
The second part of this section will discuss different levels that have been identified where ecosystem orchestration can be
applied. We have identified three functional levels present in the innovation ecosystem of SDF, presented in figure 4.2. These
functional levels are data generation, storage & authorization mechanisms, and services & terminals. Together these functional
levels enable the total value proposition of the Infobroker. It is therefore crucial that all the elements within these three levels
are in alignment. However, as we have shown in the value chain analysis, these functional levels are occupied by different
players and technologies. As a result, orchestration between these functional levels is crucial in order to ensure coherent hub
functionality for the Infobroker. We will now briefly discuss each functional level.
Figure 4.2: Overview of three fundamental levels of operation and the positioning of the control points.
Source: Elaborated by the author
The functional level of data generation entails two processes. First, the creation of real-time data from sensors and robotics
that operates on the farm. And secondly, the addition of static genetic cow profile data. A crucial point to understand is that
this information needs to be generated at the individual cow level. Devices that control this level are milking robots and sensors
(examples of sensors are infra-red cameras, scales and pedometers). Data from these devices is created directly by the sensor
or within the process conducted by a milking robot. Transmission of this information occurs by sending the information to an
external cloud database or by sending it to the database of its manufacturer. The control points are standardization agreements
with sensor suppliers and other hardware suppliers to ensure data availability and data quality. Management should be aimed
at standardization agreements between hardware suppliers to ensure hardware devices from different producers can
communicate with the Infobroker. Secondly, management should focus on the stimulation of more data sources. By seeking out
collaboration with sensor manufactures to develop new sensors, more data is generated, resulting in a higher value proposition
of the Infobroker for data modelers to join the innovation ecosystem.
The functional level of storage & authorization mechanisms addresses management for both the first and second connection
levels, as shown in figure 4.6. The functional level of storage and authorization concern all activities that manage the storage
and access of data by all the participants in the SDF innovation ecosystem. The devices are cloud databases with machine to
machine connections via the internet, establishing a connection with the farm or with the internal firm databases of various

43
players. The second connection concerns the access to web services that will enable activities by players that develop services
based on the data availability of the Infobroker. Control points are the business model for the Infobroker’s platform and cloud
databases with their machine to machine connectivity and internet access. Management should aim at ensuring data access for
third party access. This is especially the case when data is being stored in external (cloud) databases. Suggestion to ensure this
data availability is that historic datasets are copied to internal databases and that there are clear policies in place when firms
want access to data from their competitors. Secondly, as the increase of sensor data offered to the Infobroker creates added
value for the Infobroker, problems for data retrieval arise. Therefore, management should focus on developing a system to
easily store and recognize certain datasets, for instance via the creation of categories (fertility, nutrition, breeding), this will also
offer the opportunity to create diverse ‘Infobroker accounts’ and ensures a user friendly interface for data retrieval by the
customers.
The last functional level concerns the development of adequate services and terminals that make use of the newly available
data. Whereas the hardware suppliers are managed via the first connection, service developers are managed via the second
connection. It is the modality to web access that will ensure a healthy growth of Infobroker users. Differentiation in web access
accounts will enable new entrants to enter service development for the Dairy sector. In addition, players who are not directly
linked to a specific actor, such as governments or animal health organizations, can also enter the web access, leading to
efficiency gains in operations throughout the broader ecosystem of the Dairy sector. Control points are applications and web
tool modularity and differentiation. Management for these control points should focus on attracting a strong consumer base
that generates various applications. In addition, seeking out collaboration with users of the platform will provide better insights
into their needs and provide the managers of the Infobroker with new insights. These insights are knowledge on which datasets
are in demand and knowledge for investigating which datasets are still missing.
In sum, this analysis of the control point constellations has had the aim to highlight the relationships and the logical sequence
of the different (functional) elements within the innovation ecosystem of SDF. It is at these three levels that ecosystem
orchestration is needed to ensure a complete value proposition. Different visions on how to manage these control points will
lead to different configurations of the innovation ecosystem. Therefore it is interesting to investigate the different possibilities
for reconfiguration to uncover the different ecosystem evolution scenarios. The exploration of these scenarios will be the topic
of the final aspect of our innovation ecosystem analysis, presented in the upcoming section.
4.4 PHASE IV – INNOVATION ECOSYSTEM EVOLUTION SCENARIOS
This forth section of our innovation ecosystem analysis will be devoted to the outcomes of our ‘as is’ analysis conducted with
each player type within the SDF consortium. An example of the obtained data can be found in appendix IX and X. The results
have been cross-referenced with input from external consultants and the interview participants themselves. From the visual
documentations of each actor’s ecosystem perception we found two significantly different scenarios for the ecosystem
evolution. These two views are visualized in figure 4.3. Now, a short description to illustrate our conclusions is given.
The two identified ecosystem evolution scenarios relate to our observations regarding the SDF governance. First of all, all actors
recognize that there is indeed need for a data hub in the dairy sector. This finding is consistent with our conclusions on ‘reasons
to participate’ (see appendix VIII for results) and filled project proposals for subsidiaries (SmartDairyFraming, 2014; Bekkum &
Verhoosel, 2015). As mentioned before, combining different databases with real-time sensory information has the potential to
offer new services and proves great potential for efficiency gains for each actor. However, the needed data streams to achieve
these goals ask for a certain broker position and related infrastructure. The issue at hand is that there are different actors who
would like to apply for this ‘data broker’ vacancy.
“It is all about power, who has data and who can do something with it” (A3, 2015)
“Everyone is busy determining its position in the chain, do I have data and if not, where can I get it? Key players in this game are
the hardware suppliers, they have the data. Therefore, making the Infobroker big in this power play is difficult” (A3, 2015)
From our analysis we saw that three key actors in the consortium of Smart Dairy Farming have consolidated together in order
to form a position of power that they can use as leverage. This leverage is strengthened by the cooperative nature of these
companies, meaning that they represent all the 19.000 dairy farmers in the Netherlands.

44
“If we are going to wait until companies such as Geo, Deleval, and Lely are going to install their systems, without us
understanding why… that feeling… no, there is more behind that, a whole science in big data analysis etc. We want to include
our farmers’ story in these developments” (A2, 2015)
On the other hand, hardware companies are looking at these developments with their own agenda. They already have more
expertise and experience in managing large datasets due to constant data input from their automation systems such as milking
robots. As a result, data quality and data modeling are competitive assets for these firms, which they use to leverage new
business.
“There are doubts if this is the right platform for us and eventually easier for the farmer, should it be a player who is closer to
the farmer and who has already a large part of the infrastructure, or should that it be someone else” (B2, 2015)
Our final observation relates to the few SME companies that participated in the SDF project. These actors are not widely
represented in the project; as a result they have limited influence on the governance of this project. However, from an internal
business perception, they are more depending on a successful outcome of this project due to their firm size and limited
resources.
“In our perception, we are participating in this project significantly…. We are a small company so if you look at the FTE’s we
contribute in relation to our total firm capacity, than that is quite significant. When looking at the participation equivalence of
the larger firms, the results from this project are impacting us a great deal more. (C1, 2015)
The described observations above are descriptions of the different ecosystem dynamics that the elements within the
innovation ecosystem experience. From these discussions and with our ‘as is’ exercise we can conclude the following two
ecosystem evolution scenarios. The first scenario concerns a widespread use of the targeted Infobroker configuration. This
means that the number of platform users for the Infobroker will increase and that the issues surrounding the previously
mentioned control points are managed in favor of the Infobroker configuration. However, there are players which occupy a
crucial position in the value chain and have a huge influence on the developments of enabling technologies such as terminals,
sensors and modeling tools. These players can therefore decide to fulfill the ‘vacancy’ for data hub themselves. As a result, this
would lead to a different innovation ecosystem configuration for the elements in the dairy sector. Our expectations regarding
these two different ecosystem evolution scenarios are summarized in figure 4.3 on the next page.

45
Scenario I: Infobroker as an ‘independent’
broker in data hub position.
Scenario II: Large hardware/automation
companies in data hub position.
Figure 4.3: visualization of two different ‘dairy data sharing ’ecosystem evolution scenarios.
Source: Elaborated by the author
Observations:
• More application development
opportunities independently from data
sources.
• Potential for new entrants
• Need for compatibility between systems
from different hardware suppliers
• No clear IT ecosystem leader
Observations:
• Application development depending on
collaboration with hardware supplier
• Difficult market for new entrants
• Danger of incompatibility between systems
from different hardware suppliers, leading
to lock-in.
• Clear IT ecosystem leader(s)

46
4.5 PHASE V – INNOVATION ECOSYSTEM CLASSIFICATION
This section presents our findings for classifying the innovation ecosystem of SDF towards its business ecosystem. We do this by
first identifying bottlenecks and opportunities that hinder reconfiguration into the targeted ecosystem structure for SDF.
Secondly, we link the identified bottleneck and opportunities with explorative or exploitative properties for the players’ in the
innovation ecosystem of SDF.
4.5.1 Bottlenecks and opportunities
In the previous phases, the economic structure of the Infobrokers’ value proposition was charted. We investigated the
experienced benefits and problems experienced by the actors during the project span of SDF. The responses from our
participants gave us an in-depth view on their internal firm processes that can indicate acceptation or rejection of the
Infobrokers’ economic structure. The results are summarized in tables 4.6 and 4.7. First we will discuss the problems
experienced and then we will discuss the benefits.
The problems experienced by the actors were related to the existing dairy industry structure. This economic structure is partly
incompatible with the new intended economic structure of the Infobroker. We found that the new value proposition of the
Infobroker is somewhat challenging existing market dynamics of the current industry. For instance, the development of new
services enabled by the availability of large datasets requires that there is a large consumer group who is going to use these
services. If this large consumer base is not homogenous in terms of demand for services via applications, economic investments
will not be worth undertaking. The industry is characterized by 19.000 individual farmers, each with their own vision on how to
(efficiently) produce milk and manage cattle. As a result, offering the new value proposition to the existing business ecosystem
end consumers, namely the 19.000 farmers, is identified as a bottleneck to deliver the Infobrokers’ value proposition.
Moreover, the average farmer in the Netherlands manages its farm with 80 cows (Productschapzuivel, 2013). Therefore, a
strong demand from large farms with hundreds of livestock animals in need of individual cow management is lacking.
Secondly, we found that the ecosystem governance was experienced as a problem. These governance problems were related to
platformization issues such as complying with standards and conforming to shared ownership of certain assets such as
databases. For example, we found that the users of datasets in the SDF project tried to standardize the way cow-centric
information is exchanged. This issue of ensuring data quality data storage was tackled in different ways. For instance, several
Players tried to develop their own standard interface because it was more compatible with their internal business processes. In
sum, agreeing on common standards for gathering cow centric information is classified as a bottleneck.
In terms of benefits experienced, actors were interested in participation in the SDF innovation ecosystem because it offered
them the possibility to explore new value creation opportunities with other players. This entailed learning new skills, and
establishing new firm connections. As a result, players are able to develop new services and products based on access to
complementarities from others. For example, a service provider can leverage its knowledge on feeding ration protocols with
the skills to develop feeding systems from machinery suppliers. As a result, a whole new product is being developed increasing
the Infobrokers’ overall value proposition.
The second benefit reported was that participation in the SDF innovation ecosystem led to the expansion of existing business
activities. Examples of this are access to new markets for existing services and products. To illustrate, hardware suppliers, such
as sensor developers, gained access to new markets for existing products due to demands from a previously unknown customer
base.

47
Table 4.6: Ecosystem problems reported by actors
Reported bottlenecks in SDF Indicator Example quotes
Dairy industry structure
Issues with existing small scale family
farms, current farm management
processes, and relatively old farmers
with no computer skills, resulting in
lock-in preference for current practices.
A2: “de emotie van het vakmanschap, dat die
boer ook echt gaat meten en er iets mee
gaat doen, dat is echt een mind set die
aangeleerd moet worden. Het gebruik van
data om het vakmanschap nog verder op een
hoger plan te gaan krijgen. Dat is een
barrière en een challenge. Net als dat de
marketing een uitdaging is. Van gras tot glas.
Dat is een term die er 6 of 7 jaar is en dringt
nu pas door dat het ook complicaties heeft
voor hun bedrijfsleven”
B2: “het is de manier waarom men denkt om
aan de protocollen te werken. Men houdt te
veel vast aan het standaard Nederlandse
familie bedrijf”
ecosystem governance
Platformization Issues: problems on
coordination, standardization, and
ownership within the SDF project (see
appendix VIII for more details). Issues
commonly reported are, access to data,
ownership of data and the quality of
data.
G4: “Onze partners willen exclusiviteit, maar
ook gebruikers moeten uitwisselbaar zijn,
dus ook de concurrent kan toetreden. Deze
visie levert wel wat uitdagingen op”.
A3: “naast het hebben van een data Hub,
moeten er standaarden ontwikkeld worden
waaraan sensoren aan moeten voldoen. Als
die er zouden zijn dan wordt het
makkelijker”
Source: Elaborated by author, analysis conducted in QDA miner.
Table 4.7: Ecosystem benefits reported by actors
Reported opportunities for SDF Indicator Example quotes
New value creation opportunities
Establishing new firm connections,
Conducting business development into
new fields,
And learning new skills and markets
based on large data availability.
A2: “Je gaat in een wereld komen waarvan
we wel wisten dat die er was, maar waar we
geen betrokkenheid bij hadden. We komen
nu in de wereld van de Google's en de IBM's.
en dat gaat ongelofelijk veel nieuwe ideeën
opleveren. Waardoor je de industrie waarin
we inzitten, dat die daar ontzettend veel
beter van gaat worden”
A3: “dit project heeft ook een transformatie
teweeg gebracht in ons bedrijf. We
realiseren ons dat dit heel veel gaat
betekenen en dat we ons moeten beraden
op wat de toekomst ons brengt”
Strengthen existing firm activities
Access to new markets for existing
products, via exposure through
participation in the SDF project.
B1: “één van de redenen dat we meegegaan
zijn in dat melkvee continue wegen is dat we
gelijkenis zagen in wat er in de vleesvee
sector gebeurd”
C1: “een voordeel is dat we een aantal direct
gerelateerde projecten erbij hebben kunnen
doen waar we wel gewoon geld voor konden
vragen”
Source: Elaborated by author, analysis conducted in QDA miner.

48
4.5.2 Linking SDF innovation ecosystem results with conceptual properties
Now the relevant explorative or exploitative properties for the innovation ecosystem of Smart Dairy Farming can be charted. In
table 4.8 below, the reported properties recognized throughout our discussed results are listed. The indicators for assessing
these properties have been included as well. The implications will be discussed thereafter.
Table 4.6: Relating the innovation ecosystem properties with our findings
properties Explorative/
exploitative
Bottleneck/
opportunity in SDF
Identified
Yes/No
Indicator
Actors work on common
efforts to deliver the new
value proposition.
Explorative Opportunity Yes Ecosystem governance: ensuring data
quality standards and sensor design
specifications.
Actors generate/create new
knowledge with other
partners to address new
markets.
Explorative Bottleneck Yes New value creation opportunities:
presence of RTO’s and knowledge
institutions, ecosystem players connect
create new relationships. But new
markets are not created.
Actors adapt existing skills
and infrastructure.
Explorative Opportunity Yes New value creation opportunities: Actors
engaged in learning to use cow-centric
information and develop modeling tools
to develop new services. Data sharing
infrastructure is being developed.
Actors connect with new
entrants outside existing firm
scope.
Explorative Bottleneck No Players were identified as a dairy actor.
Nevertheless, the innovation ecosystem
players made new relationships with
each other, searching for a new
configuration to deliver the SDF value
proposition.
Actors have protective
attitude, rejecting the goals of
the new value proposition.
Exploitative Bottleneck No Firms join SDF developments, although a
difference in innovation time span
hinders sometimes active participation.
Actors maximize
capitalization of existing
knowledge.
Exploitative Opportunity Yes Existing products and service platforms
are upgraded by the Infobrokers’
innovation.
Actors start investments in
old value proposition to
resist.
Exploitative Bottleneck No No active resistance from incumbent
industry stakeholders was identified
towards the new value proposition of the
SDF innovation ecosystem.
Actors seek solutions within
current firm structure to deal
with external forces.
Exploitative Bottleneck No External forces identified (stricter
environmental requisitions and free
market price regulation) are tackled by
incumbent players with the ‘Infobroker
innovation’.
Source: elaborated by the author
From our analysis we conclude that the innovation ecosystem of Smart Dairy Farming has a sustained character towards its
business ecosystem. An explanation for the basis of this conclusion will now follow. First, the related exploration properties that
indicate the formation of opportunities towards the SDF value proposition development have been identified. Our properties to
illustrate the formation of opportunities illustrate the willingness of players in the SDF ecosystem to work on developments
that enable the creation of the Infobrokers’ value proposition. To illustrate, when we examined the contributions each actor
has made into the SDF innovation ecosystem we saw that there was no indication that the technological developments of the

49
Infobroker are disruptive for any players’ core business. Even though there are two different ecosystem evolution scenarios
discovered in the previous chapter, we do not observe a discontinuity in the business ecosystem as a whole, merely a struggle
for dominance. Furthermore, properties that lead to bottlenecks are not identified in the case of SDF. The only notation that we
wish to make is that for the second property, a possible bottleneck may form. Linking this back to the ecosystem control points,
we can state that it is crucial for the managers of the Infobroker that they manage the development of applications. One way of
doing this is to address different market segments with different applications. However, these new market segments have not
been observed and are therefore a possible bottleneck for the future developments of the SDF Infobroker. A final remark for on
discussing the formation of bottlenecks is related to the identification of the two different ecosystem evolution scenarios.
These two scenarios are unlikely to form simultaneously; therefore the ecosystem orchestrator has to find a way to reconcile
these different views or to make sure one scenario becomes dominant.
In sum, our analysis on the formation of bottlenecks and opportunities in relation to the emergence of the SDF innovation we
can state the following. First, existing roles around the farm are not in danger of elimination. Even with the technological
infrastructure of the Infobroker in place, the existing roles such as food supply, robotics, dairy transport, and animal
management services remain. However, the way actors in the dairy sector deliver these services and products changes as a
result of the infrastructure linking different databases together. As a result of this change in delivery, some positions in the
value chain are challenged by different business actors. The main issues for orchestration are ‘‘which player will fulfill the role
of a data hub?’’, is this going to be the Infobroker, if yes then which players govern the IT innovation? And secondly, how are
the opportunities that are dispersed throughout the business ecosystem utilized in order for the innovation ecosystem of SDF
to expand? Our recommendations for ecosystem orchestration for the SDF innovation ecosystem will be discussed in the next
section and will conclude this chapter.
4.6 CASE STUDY CONCLUSIONS AND SUGGESTIONS FOR ECOSYSTEM ORCHESTRATION
Previous work conducted into ecosystem orchestration has been conducted by Leten et. al. (2013) and Van der Borgh et. al.
(2012). Results from these studies showed that the business model on which players’ are attracted is crucial for the innovation
ecosystems’ success. For instance, Leten et. al. (2013) emphasizes the importance of an attractive IP model for the innovation
ecosystem that ensures a valuable contribution from the ecosystem players’. Van der Borgh et. al. (2012) showed that
misalignments between individual firm level interests and the innovation ecosystem level interest lead to the necessity of an
innovation ecosystem to attract new, relevant players onto its platform. These studies concluded that a sound IP model at the
innovation ecosystems’ core in combination of managing the entrance of new, relevant players onto your platform is crucial.
The orchestrator of the innovation ecosystem both manages these two fundamental health requirements (Iansiti & Levien,
2004) of the innovation ecosystem. But, as Leten et. al. (2013) concludes in their recommendations for future research, it is
interesting to investigate how innovation ecosystems, that do not have a clear orchestrator at its center, are managed. Our
theoretical construct and case study into Smart Dairy Farming partially follow up on this suggestion.
Orchestration activities that can be derived from our proposed ecosystem concepts entail a broader scope than creating the
right IP model or attracting sufficient relevant players. It is focused on addressing bottlenecks and opportunities that are
present inside the business ecosystem that hinder or stimulate the growth of the innovation ecosystem. In contrast to previous
work from Van der Borgh et. al. (2012) and Leten et. al. (2013) our innovation ecosystem concept is based on a specific value
proposition that was created by ecosystem elements that used the four sources of value creation to address changes in the
ecosystem environment. At the core of this innovation ecosystems’ value proposition lays a technological innovation that can
inflict disruption or enhancement of a certain incumbent industry. To formulate ecosystem orchestration dynamics we Link our
conclusion of the sustained innovation ecosystem character of with the ecosystem control points and evolution scenarios. The
suggestions are based on the desired future end state that favors the outcome of the Infobroker as the data broker for the
dairy sector.
First of all, the outcome of our assessment for identifying key players and the ecosystem leader showed that a strong
ecosystem orchestrator is missing in the innovation ecosystem of SDF. The three consortium partners CRV, Agrifirm, and
Friesland Campina now fulfill this role. They determine long term strategies and architectural design specifications. In addition,
they also manage the project teams that address specific activities such as developing business models, applications, and
sensor data. We suggest that the ecosystem orchestrator role is assigned to a player that has direct interest in the successful

50
development of the Infobroker platform and has more experience in dealing with data generation, storage, and modulation. By
doing so, the innovation time span of the Infobroker is shortened and the value proposition that the Infobroker aims to deliver
has a higher incentive to shift more towards exploitation by expanding the consumer base.
Secondly, we recommend that the value proposition of the Infobroker is more directed towards a specific consumer group. The
ecosystem control point of data generation is appropriate for this. The infrastructure of the Infobroker is now aimed at enabling
the development for applications that can deliver complex services to farmers (for instance in the field of fertility or nutrition).
This requires a huge amount of data and numerous sensors and robotic devices. As a consequence, not all farmers recognize
the usefulness in joining the Infobroker platform, since they miss these devices. Instead, we suggest a minimum value footprint
strategy (Adner 2012). This strategy would consist of collecting cow-centric information via sensors and machinery that is
helpful for performing administrative and operational tasks. For instance, collecting cow centric information on production and
food usage, offers farmers more insights in their costs and individual animal value. By doing so, the Infobroker becomes a data
hub by attracting many farmers that want to offer their information to the Infobroker. In return for this information, farmers
already gain statistic overviews into their operations. A practical example is an accountancy firm such as Accon avm that would
make an interesting partner to deliver applications via the Infobroker. The advantage is that the relevance for connecting with
the Infobroker is instantly demonstrated to the farmers. This is not the case for complex applications since they require many
(historic) datasets before the applications can actually assist farmers in real-time cattle management.
Then, the orchestrator needs to decide a staged expansion plan for data generation. This can be done in combination with the
third ecosystem control point of services and terminals. By forming strategic alliances with data modelers, a priority ranking can
be made for needed sensors that generate desired information sets to develop more complex applications. Examples are
applications that assist the farmer in topics such as nutrition and fertility at the individual cow level. An alternative plan to this
would be to decide on an open platform, but then the second ecosystem control point of storage and authorizations needs to
address specific business demands from application developers. Creating an open platform is difficult because the ecosystem
players capable of modeling cow centric datasets are large multinational firms. As a result, attracting new SME’s or startups is
difficult and could even endanger the future data generation sources because dominant hardware suppliers might not want to
share their information.
This chapter concludes by stating that the above suggested orchestration plan is one of many different orchestration
possibilities. We suggest that the managers involved in the SDF innovation ecosystem decide which control point they can
influence. By exploring different management applications for the ecosystem control points, alternative reconfiguration
schemes will present themselves. If managers link ecosystem elements correctly to optimize the inclusion of the existing
opportunities for the Infobrokers’, the SDF innovation ecosystem will expand successfully into the business ecosystem.

51
5. SUMMARY AND
CONCLUSIONS

52
INTRODUCTION This section provides an overview of the work we have done though out this thesis. We begin by summarizing our findings for
the sub research questions. After this, the overall research question will be answered by using the input from our sub research
questions.
5.1 SUMMARY
Why is the notion of ecosystem thinking relevant for the field of business and innovation? (Chapter 2)
Why the notion of ecosystem thinking relevant is for examining innovation in business relates to the way companies, industries
and governments are interconnected with each other. For example, literature on modular design specifications and
platformization (Gawer & Cusumano, 2014) illustrates the dependency of individual players on access to external resources,
such as technologies and skills, which are available via a certain common platform for their own core business. Therefore,
orchestrating innovations via the notion of ecosystem thinking means that all the elements and relationships that constitute a
certain value proposition need to be taken into account. Hence, the scope in which relevant items, players, and developments
need to be orchestrated is vast. To deal with this complexity the notion of ecosystem thinking is useful.
In sum, ‘why’ the notion of ecosystem thinking is useful addresses the clarification for combining the two terms of ‘eco’ and
‘system’. The ‘eco’ part of the terminology ‘ecosystem’ refers to the similarities found in making a comparison with the
biological analog of the term natural ecosystem. In Chapter 2 we showed that this implies that the processes found in a
biological ecosystem, namely variation, selection, and retention. These processes are also found in the way firms and other
actors cooperate. The observed processes in the business ecosystem are co-evolution, co-creation, and co-specialization (Li,
2009). The ‘system’ part of the term refers to the use of system thinking, mostly related to top down policy management and
investigating the role of institutions and firms. Therefore, combining ‘eco’ and ‘system’ offers the use of evolutionary processes
within industry context in combination with the right level for analyzing it to enable the identification of ‘species’ such as firms
and institutions in a manner familiar to economists and policy makers.
How can the concepts of business ecosystem and innovation ecosystem be defined? (Chapter 2)
From among the works of Moore (1993), Iansiti & Levien (2004a,b), Autio & Thomas (2013), and Dittrich et. al. (2014) we
identified different views on business ecosystem definitions in terms of; orchestration power, their boundaries, and how
innovation emerges. By highlighting the main differences we took our own position for defining the concept of a business
ecosystem. By doing so we defined the business ecosystem concept as ‘a collection of linked firms that form a community via
the exchange of goods, capital, and knowledge, leading to a specific business ecosystem structure, which operates in an
interactive, open system, that is in constant flux, from which the existing common base is challenged by both incumbent and
new firms and institutions that operate in the ecosystem environment’.
The second step entailed a clarification of the innovation ecosystem concept and the positioning of this concept within the
scope of the business ecosystem concept. The work from Leten et al.(2013), Adner (2012) and Van der Borg et al. (2012) formed
the basis of our conceptual definition of innovation ecosystems. The business ecosystem concept emphasizes that the existing
common base is being challenged by both incumbent and new firms and institutions which are also operating in the ecosystem
environment. Our concept of what constitutes as an innovation ecosystem addresses this aspect. By doing so, we created a
connection between the business ecosystem concept and the innovation ecosystem concept. We conceptualize the innovation
ecosystem as experimental areas that elements from both within as well as outside the industry scope use to cope with a
changing ecosystem environment. As a result we defined the innovation ecosystem concept as: ‘‘a collection of newly clustered
firms that form a partial connection with the business ecosystem, that have a specific focus to interact for the development of
new products, services, or processes”.
How can the ecosystem concepts be used to develop a role for ecosystem orchestration? (Chapter 2)
From our defined ecosystem concepts we investigated how business ecosystems use innovation ecosystems to create
innovations. By using the four sources of value creation (Amit & Zott, 2001) of novelty, lock-in, complementarities, and
efficiency, we showed that elements within the business ecosystem use these levers of value creation to deal with change in
the ecosystem environment. From the work of Adner & Kapoor (2014) we linked these four sources of value creation to two
types of innovation ecosystems. These two types of innovation ecosystems have either a disruptive or a sustained character

53
towards the incumbent industry. As a result, different ecosystem orchestration dynamics are needed. To incorporate the
different orchestration implications for the two different types of innovation ecosystems we added the following to our
innovation ecosystem definition: ‘‘a collection of newly clustered firms that form a partial connection with the business
ecosystem, that have a specific focus to interact for the development of new products, services, or processes that can have a
disruptive or sustained character towards the existing business ecosystem underlying technologies”.
For each type of innovation ecosystem we concluded the following orchestration guidelines. An exploitative perception of the
incumbent business ecosystem players towards the new value proposition will encounter less resistance by the business
ecosystem elements. The orchestrator needs to address adoption by the industry incumbents by examining which players and
elements can increase the value proposition the most, while ensuring the least efforts to reconfigure. On the other hand, a
more explorative perception of the new value proposition will encounter more resistance by individual business ecosystem
elements, especially when it is replacing existing processes, roles, technologies, and assets. As a result, the orchestrator should
focus on eliminating the bottlenecks by increasing the willingness of element to reconfigure.
What practical ecosystem analysis tool for determining ecosystem orchestration is defined? (Chapter 3)
The main advantage of using the redefined ecosystem concepts is that we are able to combine micro level firm observations
and strategies (in the innovation ecosystem) with macro level implications (future development of the business ecosystem). As
a result, a method of analyzing drivers and disablers to orchestrate certain industries into desired states could be defined.
Chapter 3 provides an overview of the used phases to analyze the innovation ecosystem of SDF. The main take away points
from our methodology are listed here.
Using the research phases of the MOBENA methodology (battistella et. al., 2013) offered the advantage of a roadmap for
identifying relevant deliverables needed to generate ecosystem specific insights. Adapting this methodology included the
following key decisions. First, placing our level of analysis on the innovation ecosystem offered detailed insights into elements
and their relationships. As a result, the data collected was done in a qualitative manner instead of quantitative. The advantage
of this decision was that we were able to identify specific ecosystem control points on which management can be applied and
that we identified two ecosystem evolution scenarios with consequences for each specific element. Finally, we linked our
results with the identification of bottlenecks and opportunities to assess the relationship between the potential scope for
innovation ecosystem and the scope of the existing business ecosystem. This final step led to the introduction of a fifth research
phase to the MOBENA methodology and provides managers with practical information needed for developing an orchestration
plan.
Which ecosystem orchestration dynamics for the case of SDF can be defined? (Chapter 4)
From applying our practical ecosystem tool on the case of SDF revealed several ecosystem orchestration dynamics. First, three
fundamental levels for orchestration were identified namely, data generation, storage & authorization, and services &
terminals. Management applications for the control points that influence the development of these three functional levels
influence the SDF future developments. Secondly, strategies for the development of the future innovation ecosystem should
aim to eliminate bottlenecks and utilize opportunities. From assessing the number of opportunities and bottlenecks, we
concluded that the innovation ecosystem of SDF has a sustained impact on the overall business ecosystem. As a result,
ecosystem orchestration should focus on the widespread usage of this innovation by creating a large consumer base as a first
step. Finally, the orchestrator should focus on developing a strategy that utilizes the existing opportunities that are close in the
direct exploitation scope of the SDF innovation ecosystem.
5.2 CONCLUSION
This section answers the main research question with the insights obtained by answering our sub-questions. At the beginning of
this thesis we formulated two goals. The first aim was to define and position the ecosystem concepts relevant for analyzing
innovation within the ecosystem context of Smart Dairy Farming. We started from the works of Moore (1993), Iansiti & Levien
(2004), Adner (2012), Battistella et. al. (2013), Autio & Thomas (2013), Dittrich et. al (2015) to define the business and
innovation ecosystem concepts. In doing so, we positioned ourselves in a unique way within the field of ecosystem theory. Our
second objective was to apply the theoretical ecosystem concepts on the Smart Dairy Farming case. For this, we adapted the

54
academically centered MOBENA methodology from Battistella et. al (2013) by shifting its level of analysis from the business
ecosystem level towards the innovation ecosystem level. The advantage is that the complexity in using the notion of ecosystem
thinking is decreased by placing the research scope onto the innovation ecosystem level. The two goals are represented in the
overall research question of this thesis below and will now be answered.
“How can the notion of ecosystem thinking be used to define the role of ecosystem orchestration for SDF?”
The notion of ecosystem thinking in business and innovation needed a clarification of how and where innovations in the
ecosystem concepts emerge before we could understand how to orchestrate innovations ecosystems. From our literature
understanding we identified and redefined two theoretical concepts: the business ecosystem and the innovation ecosystem.
Bringing these two concepts in relation was a crucial step in understanding how innovations emerge and how they can grow
into new industries. We then focused on the role of innovation ecosystems for business ecosystems to cope with changes in the
ecosystem environment. In order to be able to formulate ecosystem orchestration guidelines we investigated how innovation
ecosystems can differ following the research suggestion from Leten et. al. (2013). By using the work of Adner & Kapoor (2014)
and Amit & Zott (2001) we were able to classify innovation ecosystems into disruptive or sustained by looking at exploitation
and exploration properties. Linking the conceptual steps from above with the practical research steps concludes our answer on
the ‘how’ aspect of the main research question.
The first practical research step entailed the identification of the innovation ecosystem, the project of SDF. Then the new value
proposition in relation to the existing industry structure was examined. The innovation ecosystem can differ in its scope from
the business ecosystem depending on many different aspects. For instance in our case we noticed that the threat of
discontinuity for individual firms was low because many firms participating in SDF are also industry incumbents. In addition, we
also observed that the value proposition developed in the innovation ecosystem strengthens existing assets and services from
incumbents, leading to numerous opportunities for the innovation ecosystem to utilize. Our understanding of the SDF
innovation ecosystem dynamics was further analyzed by investigating the innovation ecosystems’ economic structure. This
entailed a detailed analysis on the value chain configuration, the identification of ecosystem control points, and ecosystem
development scenarios. The final step constituted of identifying bottlenecks and opportunities that emerge when the
innovation ecosystem seeks to expand into a wider industry setting.
From all these steps we illustrated the usefulness of the notion of ecosystem thinking in determining the role of innovation
ecosystem orchestration for SDF. By linking the ecosystem control points with the identified opportunities and bottlenecks we
showed how the innovation ecosystem of SDF should be managed to maximize the present opportunities in the business
ecosystem. By charting and locating the opportunities and bottlenecks that stimulate or hinder the future growth of the SDF
innovation ecosystem, we allow mangers to develop a strategy to circumvent or utilize certain lock-in states located within the
business ecosystem. It is this role of the ecosystem orchestrator that can be fulfilled by public research institutions such as TNO
to enable certain societal preferable innovations. The role of the ecosystem orchestrator should therefore be aimed at finding
the drivers and disablers for reconfiguration of the SDF innovation ecosystem into a desired end state.
Concluding our overall thesis research, the following can be stated. The notion of ecosystem thinking is useful since business
becomes increasingly more modularized, centered around a certain common platform where new innovations emerge. Using
the notion of ecosystem thinking helps analyzing the complex relationships, interdependencies, enabling technologies, and
relevant environmental factors. Therefore, a practical tool for analyzing ecosystems help managers and policy makers
orchestrate multi-stakeholder projects in changing business environments. By using the two ecosystem concepts business
ecosystem and innovation ecosystem, tools from ecosystem theory can add to the understanding and characterization of
business processes, decisions, market dynamics to develop adequate orchestration plans by mangers and policy makers.

55
6. DISCUSSION

56
INTRODUCTION This chapter provides a reflection on the research conducted in this thesis. Since our work has both theoretical as well as
practical implications we will discuss them separately. Afterwards the limitations of our research will be highlighted and
suggestions for future research are offered.
6.1 THEORETICAL IMPLICATIONS
The main theoretical implication for research is that researchers should carefully choose their level of analysis. The business
ecosystem level is more suitable for network analysis and evaluating industry structures over a certain time span. On the other
hand, the innovation ecosystem level is focused on specific elements and relationships, and therefore requires a deeper
understanding of the ecosystem players. This study used the latter approach and illustrated how this deeper understanding can
help to identify how elements should be reconfigured.
Secondly, as we have illustrated in our theory chapter, research on ecosystem thinking is missing a clear clarification on the
classification of different ecosystem concepts. Currently there are two dominant concepts in use namely, business ecosystem
and innovation ecosystem. However, a clear consensus on relating the different concepts is lacking. This thesis has aimed to
provide a first direction to this goal. However, testing our conceptual understanding of the ecosystem concepts should be
challenged by others and should be further investigated with empirical research.
6.2 PRACTICAL IMPLICATIONS
Using the ecosystem lens to analyze innovation success creates new insights for policy makers and managers. Policy agendas
should clarify on which level they are contributing, either the business ecosystem level, where the emergence of innovations is
stimulated. Or in the innovation ecosystem level, where a specific value proposition is already identified and ready to be
orchestrated.
Policy makers should focus on managing and monitoring business ecosystem health. By monitoring the costs to reconfigure,
renewal at the business ecosystem level can be analyzed to develop orchestration of industries. If we take the Dutch ‘top
sectoren’ policy and the Smart Industry agenda as an example, we see that policy measures are aimed at reinforcing the
existing industry structures by highlighting the incumbent industry strengths. This is done by giving incumbent firms tax
advantages on conducting research and development. Taking an ecosystem perspective, this policy hinders diversification and
thus the emergence of new, completely different innovations. The Smart Industry agenda focuses on ‘Field labs’, and thereby
relating to our concept of innovation ecosystem, placing the formation of experimental areas central. Unfortunately, the
agenda foregoes an explanation of why certain Field labs should be stimulated. For instance, are certain Field labs in need of
ecosystem orchestration because they have a sustained or a disruptive character towards the existing industry structure?
Answering this question can help policy makers both to reflect certain innovation policies and their goals as well as developing
new and better measures to orchestrate innovations.
For managers, the recognition that firms leverage on each other complementarities for the creation of new business and
innovations is crucial. As a result, practical management implications should be focused on achieving the most attractive hub or
platform so that other players join. This thinking requires a broad view on how relationships influence different business
activities and value creation efforts that can sometimes lead to conflicting individual firm interests. Therefore, developing an
ecosystem orchestrator role to guide certain innovation project can help to overcome individual conflict.
6.3 LIMITATIONS
The project of SDF was already a sector wide innovation project; therefore the potential of disruption for key industry players
was limited. This favored the outcome of a sustained innovation ecosystem classification. In addition, since we only investigated
a single case our conclusions to classify innovation ecosystems is questionable. The theoretical foundations for making a
distinction between disruptive or sustained innovation ecosystems requires a broader study into more cases with a more over
arching research scope for different innovation projects (innovation ecosystems) within different industries. For instance, we
propose to develop practical orchestration plan by examining individual actor behaviors and linking these with explorative or

57
exploitative propositions. These propositions are derived from our different expectations for disruptive or sustained innovation
ecosystems. However, testing and challenging these propositions should be done by others to test their validity.
Secondly, by using the adapted MOBENA methodology, we tested both the phenomenon as well as the methodology.
Therefore, it is important that the methodology used in this thesis is applied on multiple cases for validation. In addition,
combining both network analysis tools with our more qualitative approach may provide new interesting ways to cross
reference findings on the micro level with network characteristics on the macro level. Therefore, a new case study with a more
quantitative approach should be conducted to validate if we can state that the adapted MOBENA methodology is truly of added
value for managers and policy makers and that our definitions for the ecosystem concepts are appropriate.
A second methodological limitation is that our case study has several specific characteristics related to the dairy sector. As a
result, findings on ecosystem governance or the identified opportunities and bottlenecks cannot be generalized into other
industry sectors. Conducting more case studies into different industry sectors will create more general guidelines for ecosystem
orchestration.
Finally, our ecosystem analysis on the SDF innovation ecosystem did not reveal a clear focal player. As a result, different
interpretations on opportunities or bottlenecks are possible. Therefore, taking the perspective of a strong focal player for the
ecosystem analysis might have presented different insights into how opportunities and bottlenecks emerged in the SDF project.
6.4 SUGGESTIONS FOR FUTURE RESEARCH
The reflection on our research by highlighting its limitations already revealed sufficient suggestions for future research. First of
all, a literature review by others should be conducted onto the ecosystem concepts to validate our assumptions on how the
business ecosystem and innovation ecosystem concepts are related to each other. In addition, our classification into sustained
or disruptive innovation ecosystems should be both theoretically and empirically investigated in more detail.
More empirical evidence is needed to test the concepts of ecosystem theory in real-time business activities. The evolutionary
aspect of using the notion of ecosystem thinking is lacking due to insufficient forecasting tools. Conducting more real-time
cases can also prove the added value of this lens for managers and can add to the future development of the adapted MOBENA
tool into a practical instrument for managers and policy makers.
Finally, we would like to suggest that future research focuses on achieving a flexible business ecosystem structure. Research
questions that are related to this issue are numerous. For instance, what are the limitations of a business ecosystems’ ability to
renew itself? When business ecosystems gradually adapted over time, will they then be able to deal with radical change in the
ecosystem environment? And how do the orchestration dynamics differ between directed innovation ecosystems and self-
organizing innovation ecosystems? It is these orchestration dynamics that are of most interest to ecosystem managers.
Therefore different innovation projects based on common value creation should be investigated to examine different ways in
which ecosystems can be orchestrated. Suggested variables on which orchestration dynamics can be compared are: business
model, IP management, skills management, assets, open innovation, diversity of ecosystem players.

58
7. REFERENCES

59
7.1 OVERVIEW DATA SOURCES CASE STUDY
Table 7.1: Overview of data sources
actors SDF source Technique: Interviews/documents Interview
length (min)
A SDF agency
A1 consortium director Semi-structured 63
A2 Consortium director Semi-structured 61
A3 Consortium director Semi-structured 65
A4 Farmer representative Semi-structured 80
B Sensor suppliers
B1 Project leader Semi-structured 56
B2 manager R&D department Semi-structured 65
C IT system providers
C1 Project leader Unstructured/documents 70
C2 Project business developer Unstructured/documents 45
D Users
D1 Farmer Semi-structured 90
D2 Farmer Semi-structured 80
E Consultants -
E1 accountant Semi-structured / results consultation 56
E2 Bank Documents -
F Universities
F1 Wageningen University Semi-structured/documents 57
G RTO
G1 Project leader Unstructured/documents 60
C1 Business developer Semi-structured/documents 45
G2 Consultant Smart Industry unstructured 50
G3 Director networked information systems Semi-structured 57
H Government -
H1 Ministry of economic affairs Documents -
H2 NZO documents -
H3 Smart industry Documents/congress visit -
H4 LTO Documents -
I Dairy
I1 Project leader Semi-structured 59
I2 R&D director Semi-structured 61
I3 Branch organization Documents/congress visit -
60
7.2 REFERENCES
Adner, R. (2012). The wide lens: A new strategy for innovation. United Kingdom: Penguin UK.
Adner, R., & Kapoor, R. (2010). Value creation in innovation ecosystems: how the structure of
technological interdependence affects firm performance in new technology generations.
Strategic management journal, 31(3), 306-333.
Adner, R., & Kapoor, R. (2014). Innovation Ecosystems and the Pace of Substitution:
Re-examining Technology S-curves. Strategic Management Journal.
Amit, R., & Zott, C. (2001). Value creation in e-business. Strategic management journal, 22(6-7),
493-520.
Anfara, V. A., Brown, K. M., & Mangione, T. L. (2002). Qualitative analysis on stage: Making the
research process more public. Educational researcher, 31(7), 28-38.
Anggraeni, E., Den Hartigh, E., & Zegveld, M. (2007, October). Business ecosystem as a
perspective for studying the relations between firms and their business networks. In ECCON
2007 Annual meeting.
Autio, E., & Thomas, L. D. W. (2013). Innovation ecosystems: Implications for innovation
management. The oxford Handbook of Innovation Management, Oxford University Press,
Oxford.
Battistella, C., Colucci, K., De Toni, A. F., & Nonino, F. (2013). Methodology of business
ecosystems network analysis: A case study in Telecom Italia Future Centre. Technological
Forecasting and Social Change, 80(6), 1194-1210.
Baxter, P., & Jack, S. (2008). Qualitative case study methodology: Study design and
implementation for novice researchers. The qualitative report, 13(4), 544-559.
Beek, B van de (2014, July 11). Delen van data vermenigvuldigt (markt)inzichten.
AgroConnector.
Bekkum, van M., & Verhoosel, J. (2015). Linked open data. AgroConnect-zomerseminar.
Wageningen, 22 mei 2015
Borgh, M., Cloodt, M., & Romme, A. G. L. (2012). Value creation by knowledge-based
ecosystems: evidence from a field study. R&D Management, 42(2), 150-169.

61
Carayannis, E. G., & Campbell, D. F. (2009). 'Mode 3'and'Quadruple Helix': toward a 21st
century fractal innovation ecosystem. International Journal of Technology Management, 46(3),
201-234.
Christensen, C. M. (1997). The Innovator’s Dilemma, Harvard Business School Press. Boston,
MA.
Creswell, J. W. (1994). Qualitative and quantitative approaches. New York: Sage Publications
Gawer, A., & Cusumano, M. A. (2002). Platform leadership: How Intel, Microsoft, and Cisco drive
industry innovation (pp. 29-30). Boston: Harvard Business School Press.
Den Hartigh, E., Tol, M., & Visscher, W. (2006, October). The health measurement of a business
ecosystem. In Proceedings of the European Network on Chaos and Complexity Research and
Management Practice Meeting (pp. 1-39).
Dittrich, K., Koning, de N., Langley, D., Ortt, R. (2014) Overcoming barriers to IT adoption by
SME: an innovation ecosystem approach. TNO: Working paper
Elsevier (2008). Schandaal babyvoeding China blijft groeien. Autheur: Luc van Kemenade. 19
september 2008. (http://www.elsevier.nl/Buitenland/nieuws/2008/9/Schandaal-babyvoeding-
China-blijft-groeien-ELSEVIER204096W/)
Fransman, M. (2010). The new ICT ecosystem: Implications for policy and regulation. Cambridge
University Press.
Fransman, M. (2014) Models of Innovation in Global ICT Firms: The Emerging Global Innovation
Ecosystems. JRC Scientific and Policy Reports – EUR 26774 EN. Seville: JRC-IPTS
Carayannis, E. G. (2008). Knowledge-driven creative destruction, or leveraging knowledge for
competitive advantage Strategic knowledge arbitrage and serendipity as real options drivers
triggered by co-opetition, co-evolution and co-specialization. Industry and Higher
Education, 22(6), 343-353.
Gawer, A., & Cusumano, M. A. (2002). Platform leadership: How Intel, Microsoft, and Cisco drive
industry innovation (pp. 29-30). Boston: Harvard Business School Press.
Gawer, A., & Cusumano, M. A. (2014). Industry platforms and ecosystem innovation. Journal of
Product Innovation Management, 31(3), 417-433.
Gueguen, G., & Isckia, T. (2011). The borders of mobile handset ecosystems: Is coopetition
inevitable?. Telematics and Informatics, 28(1), 5-11.

62
Ham, T van der (director) (2015). Zembla : De topsporters van de melkindustrie deel 1. 2015,
May 27. Broadcast : 35 minutes. http://zembla.vara.nl/seizoenen/2015/afleveringen/27-05-
2015
Ham, T van der (director) (2015). Zembla : De topsporters van de melkindustrie deel 2. 2015,
June 17. Broadcast : 35 minutes. http://www.npo.nl/zembla/17-06-2015/VARA_101374314
Hearn, G., & Pace, C. (2006). Value-creating ecologies: understanding next generation business
systems. Foresight, 8(1), 55-65.
Iansiti, M., & Levien, R. (2004a). Keystones and dominators: Framing operating and technology
strategy in a business ecosystem. Harvard Business School, Boston.
Iansiti, M., & Levien, R. (2004b). The keystone advantage: what the new dynamics of business
ecosystems mean for strategy, innovation, and sustainability. Harvard Business Press.
Jackson, D. J. (2011). What is an innovation ecosystem. Arlington, VA: National Science
Foundation. http://www. erc-assoc. org/docs/innovation_ecosystem. pdf.
Kania, J., & Kramer, M. (2011). Collective impact. Stanford social innovation review, Winter
2011, 36-41
Letaifa, S. B (2013). Understanding business ecosystems: how firms succeed in the new world of
convergence?. De Boeck Supérieur s.a. Bruxelles
Leten, B., Vanhaverbeke, W., Roijakkers, N., Clerix, A., & Van Helleputte, J. (2013). IP models to
orchestrate innovation ecosystems: IMEC, a public research institute in nano-
electronics. California management review, (55), 51-64.
Li, Y. R. (2009). The technological roadmap of Cisco's business ecosystem. Technovation, 29(5),
379-386.
LTO Nederland (2015). De Melkveewet. 19 januari 2015 (http://lto.nl/dossiers/Melkveewet-De)
Mercan, B., & Goktas, D. (2011). Components of innovation ecosystems: A cross-country
study. International Research Journal of Finance and Economics, 76, 102-112.
Moore, J. F. (1993). Predators and prey: a new ecology of competition. Harvard business review,
71(3), 75-83.
Moore, J. F. (2006). Business ecosystems and the view from the firm. Antitrust Bull., 51, 31.
Murphy, L. M., & Edwards, P. L. (2003). Bridging the valley of death: Transitioning from public to
private sector financing. Golden, CO: National Renewable Energy Laboratory.

63
Nalebuff, B., Brandenburger, A., & Maulana, A. (1996). Co-opetition. London:
HarperCollinsBusiness.
Nambisan, S., & Baron, R. A. (2013). Entrepreneurship in Innovation Ecosystems: Entrepreneurs'
Self-Regulatory Processes and Their Implications for New Venture Success. Entrepreneurship
Theory and Practice, 37(5), 1071-1097.
Patton, M. Q. (1990). Qualitative evaluation and research methods . SAGE Publications, inc.
Peltoniemi, M., & Vuori, E. (2004, February). Business ecosystem as the new approach to
complex adaptive business environments. In Proceedings of eBusiness Research Forum (pp. 267-
281).
Pitelis, C. N., & Teece, D. J. (2010). Cross-border market co-creation, dynamic capabilities and
the entrepreneurial theory of the multinational enterprise.Industrial and Corporate
Change, 19(4), 1247-1270.
Plan Bureau voor de Leefomgeving. (2015, april 1). Quick scan gevolgen van afschaffing
melkquotum: achtergronddocument bij nieuwsbericht 1 april 2015. Den Haag. Netherlands
Productschap Zuivel (2013). Nederland zuivelland brochure. Uitgave door Basement Graphics,
mei 2013.
Productschap Zuivel (2014). Productschap Zuivel Jaarverslag 2014, issn: 0922-6153.
Fred Phillips: Innovation ecosystems: big idea or business propaganda?
(http://www.researchresearch.com/index.php?option=com_news&template=rr_2col&view=art
icle&articleId=1351580)
Rabobank (2015) Rabobank cijfers & trends, Melkveehouderij. 39e jaargang editie 2014/2015
https://www.rabobankcijfersentrends.nl/index.cfm?action=branche&branche=Melkveehouderij
Ritala, P., Agouridas, V., Assimakopoulos, D., & Gies, O. (2013). Value creation and capture
mechanisms in innovation ecosystems: a comparative case study. International Journal of
Technology Management, 63(3), 244-267.
SmartDairyFarming. (2015). (http://smartdairyfarming.nl/nl/verslag-symposium-
smartdairyfarming/)
SmartDairyFarming. (2012). Doelen. http://www.smartdairyfarming.nl/nl/doelen/
Smart Industry. (2015a). (http://www.smartindustry.nl/over-smart-industry/initiatief/)

64
Smart Industry. (2015b). (http://www.smartindustry.nl/fieldlabs/)
Spätjens, L. (2014, December 12). Data uitwisseling tussen BMSen en trekkers/werktuigen.
AgroConnector.
Stuart A. Kauffman. (1993). The origins of order: Self-organization and selection in evolution.
Oxford university press.
Symposium ‘Perspectief van SmartDairyFarming, Veemanagement 2.0.’ On Wednesday April 1st
2015 at Hogeschool Van Hal Larenstein in Leeuwarden.
VIEUS. (2015). How to connect the dots to a digital single market?. Tuesday 22 September at 2
pm CET. Panel list: Roberto Viola, Pilar del Castillo Vera, and Steven Tas.
http://www.vieuws.eu/live-panel-debate/digital-single-market-22-september-2015-live-panel-
debate/
Wakkerdier (2015). Pas op: kaas met stalmelk. 24 juli 2015. http://www.wakkerdier.nl/kaas-
met-stalmelk
Yin, R. K. (2003). Case study research design and methods third edition. Applied social research
methods series, 5.
Zhang, J., & Liang, X. J. (2011). Business ecosystem strategies of mobile network operators in
the 3G era: The case of China Mobile. Telecommunications policy, 35(2), 156-171.

65
8. APPENDIX

66
APPENDIX I: BUSINESS ECOSYSTEM VIEW OF MOORE
Moore’s view on business ecosystem (Moore, 1993)
Source: Figure taken from a case study into the mobile telecommunication sector of China (Zhang & Liang, 2011)
APPENDIX II: BUSINESS ECOSYSTEM VIEW OF IANSITI & LEVIEN
Example of Microsoft’s business ecosystem with its domains (Iansiti & Levien, 2004b, p. 45)

67
APPENDIX III: FIVE LEVERS FOR RECONFIGURATION DEVELOPED BY ADNER (2012)
Figure 2.5: Presenting the five levers for reconfiguration.
Source: Adner (2012)

68
APPENDIX IV: MOBENA METHODOLOGY FROM BATTISTELLA ET.AL.
The four phases of the MOBENA methodology (Battistella et. Al., 2013)

69
APPENDIX V: ARCHITECTURAL DESIGN FOR THE INFOBROKER
Architectural design for the Infobroker. Source: TNO
Figure 4.1: existing situation for enabling data sharing between dairy actors. Source: TNO
Figure 4.2: New situation when the Infobroker is in place, operating as a broker for access to data. Source: TNO

70
Figure 4.3: Schematic overview of the Infobroker IT architecture.Source: TNO
APPENDIX VI: TIMELINE WITH OVERVIEW OF SDF DEVELOPMENT
Source: Elaborated by the author.

71
APPENDIX VII: ACTORS AND THEIR CORE BUSINESS
Table A.1: The relation between the actor’s core business and their contribution in SDF.
Actor Core business Supporting quotes Role in SDF Supporting quotes
Lely Develop and
selling of milking
robots
“Binnen de sector als geheel zijn wij
bekend om onze robots en de
automatisering”
Contributing in R&D
on sensor
technologies.
“met name R&D en dan de sensor
techniek is een grote component van
onze bijdrage”
“En het meedenken en de data stroom
op gang brengen richting de TNO server,
daar hadden we al veel ervaring mee”
Friesland
Campina
Processing milk
into dairy
products &
market these
products
“wij hebben als enige in de wereld de
verantwoordelijkheid van het
moment dat de kalf geboren is tot
het pak melk uit de supermarkt met
ons merk erop geconsumeerd wordt”
“dat verhaal van gras tot glas is onze
business”
Financing the project “150000 euro per jaar en in kind nog veel
meer”daarnaast hebben we Nutrifeed en
daar doen zij bij kalveren ook nog hun
bijdrage”.
Rovecom Modeling data
and software
development
“onze mensen zijn het belangrijkst,
die vertalen wetenschappelijke
modellen naar software en het
programmeer werk, dat zijn echte
techneuten daar zit wel de waarde
voor ons”
“maar onze focus ligt nu nog bij
projecten in plaats van bij producten”
Application
development and
software support
“we zijn een service provider, dat is onze
business, we zijn er om software te
maken, maar daarnaast hebben we ook
een aantal productlijnen, één daarvan is
bijvoorbeeld voerexpert”
Gallagher Sensor devices
and rail off
systems for
animals
“in eerste instantie zouden we
meerdoen vanwege de Gallagher
weidegang subgraze, bij het
concreter worden van het project
bleek dat dit niet in eerste instantie
opgenomen en ging het meer over
het wegen van dieren”
“dit gaf bij ons ook wel
mogelijkheden, omdat we al dieren
wegen buiten de MVH”
Sensor supply “beschikking stellen van onze producten
tegen speciale prijzen, installatie,
overleg”
“we hebben toen een stuk hardware
ontwikkeling gedaan om de gegevens
makkelijker ter beschikking te stellen aan
de infobroker, dus een fysische
controller, een bakje die in contact staat
met de weegschaal en het meetsysteem
en ook een internet connectie heeft en
die dan de gegevens zoekt en kan
doorsturen naar internet”
Agrifirm Animal food
supplier, food
creation
“als je kijkt naar onze kern
activiteiten dan hebben we veel
productie locaties en opslag locaties
voor voer. Dit in combinatie met de
vele werknemers die als service weer
verbonden zijn aan ons product, dus
onze assets zitten echt in de fysieke
gebouwen, producten en faciliteiten
en de kennis hierover bij onze
mensen”
Financing the project,
Knowledge animal
food management
“de specifieke kennis gericht op het
voeren van beesten gericht op de
specifieke transitie periode, jonvee
opfok”
“onze investeringen zijn gaan zitten in
projecten die moesten leiden tot nieuwe
modellen en applicaties die iets doen om
die SDF doelstellingen te bereiken”
CRV Data gathering
and analyzing to
deliver services
and genetic
products.
“drie takken van sport, genetische
kant (ontwikkeling van stieren en
productie van sperma), het geheim
daarachter is onze data om dat
mogelijk te maken. Dienstverlenend,
advies over insemineren van de
koeien aan de boer en het afnemen
van melk monsters en het geven van
advies over het opfokken van de
koeien. Het draait hierbij dus om de
kwaliteit van de mensen. En als
Financing the project,
Knowledge cow
fertility management
“samen met de ketenpartijen hebben we
een behoorlijke cash bijdrage geleverd”
“Daarnaast hebben we personeel ingezet
om de ontwikkeling van die modellen te
bevorderen en die data dus te
interpreteren, met name op het gebied
van vruchtbaarheid”

72
laatste, informatieverwerking richting
veehouder. Hier gaat het om het
kunnen verzamelen van data, het
verwerken ervan en vervolgens het
presenteren van dat richting de
veehouder in hap klare brokken”
ACCON
AVM
Accounting
services in agro
sector
“we zijn begonnen in 1918 wanneer
Nederland nog een agrarische
economie was, vandaar onze roots in
de agro sector en hier zijn we by far
de marktleider”
Translating needs
from farmers into
design requirements
“we brengen kennis en ervaring in en
vertalen dat naar waardes, daarnaast
brengen wij een groot network in van al
onze boeren alszijnde onze klant”
TNO Knowledge
development and
distribution into
society
“TNO verbindt mensen en kennis om
innovaties te creëren die de
concurrentiekracht van bedrijven en
het welzijn van de samenleving
duurzaam versterken. Dat is onze
missie en daar werken wij, de 3000
professionals van TNO, dagelijks aan”
Source: TNO.nl
Architectural IT design “het concept voor delen van data bij
dijken hebben we ook ingebracht in de
MVH sector”
WUR/UU Knowledge
generation
F1: “we doen vele onderzoeken die
leiden tot nieuwe inzichten voor de
agro sector”
Knowledge and skills
on data modeling
F1: “we hebben al ervaring met grote
data ‘dump’ en data mining, hierdoor
kunnen we daadwerkelijk iets gaan doen
met al die data”

73
APPENDIX VIII: REASONS TO PARTICIPATE
Table 4.1: reasons to participate
factors Indicator Example quotes
Changing industry
environment
The extent to which the dairy sector is
being restricted in growth due to new
environmental regulations and animal
welfare and the emergence of new
technologies such as the use of sensor
hardware and big data analysis tools.
A3: “a new generation farmers is on the
rise, one educated with computers,
therefore I believe innovations
regarding data sharing and digitalization
will go very fast”.
A2: “we have every interest to innovate
via data sharing and due to the new
guidelines from Brussels on limiting
phosphate pollution, we have no other
choice”.
B2: “because the consortium of SDF
wanted to introduce cow weight
measuring, we saw new opportunities
for us to introduce our product, used to
measure other animals in different
agricultural sectors, to dairy farmers”.
Access to new data
sources
The extent to which actors in the sector
gain access to data that is not primarily
being produced by themselves but also
by other parties, and is different in
nature then existing data sources
currently available to individual actors.
B2: “data mining, grasduining, and that
short of activities are becoming more
and more our core business, but
unfortunately we do not have all the
data by ourselves”.
C1: “The emergence of sensor hardware
(and thus new data) provides new data
sources which we can use to improve
our existing and future applications”.
Gaining experience The extent to which actors in the dairy
industry experiment with new chain
configurations and learn to use new
skills and insights for new business
opportunities.
Gaining experience in:
• New forms of collaborating
• Using new tools and data sharing.
D1: “if you ask me how the project has
turned out, than I believe the SDF
project has mainly been used as an
experimental environment for all actors
around it to find a way to get the
needed collaboration started, that is I
believe has been the most important
effect”.
A2: “It is all about a piece of education
towards the farmers, giving them the
right tools for their job”.
Expected efficiency gains The extent to which actors in the dairy
industry are able to achieve efficiency
gains by using big data analysis and
sensor technologies.
A2: “We as firm ‘x’ vest a great interest
in the welfare of our members (which
are the shareholders), therefore SDF is a
great tool for them to reduce their cost
price for milk”.
G1: “The expectation is that the
livestock increases from approximate 70
cows per farm to a 100 to 200 cows per
farm, without the need for extra staff”.
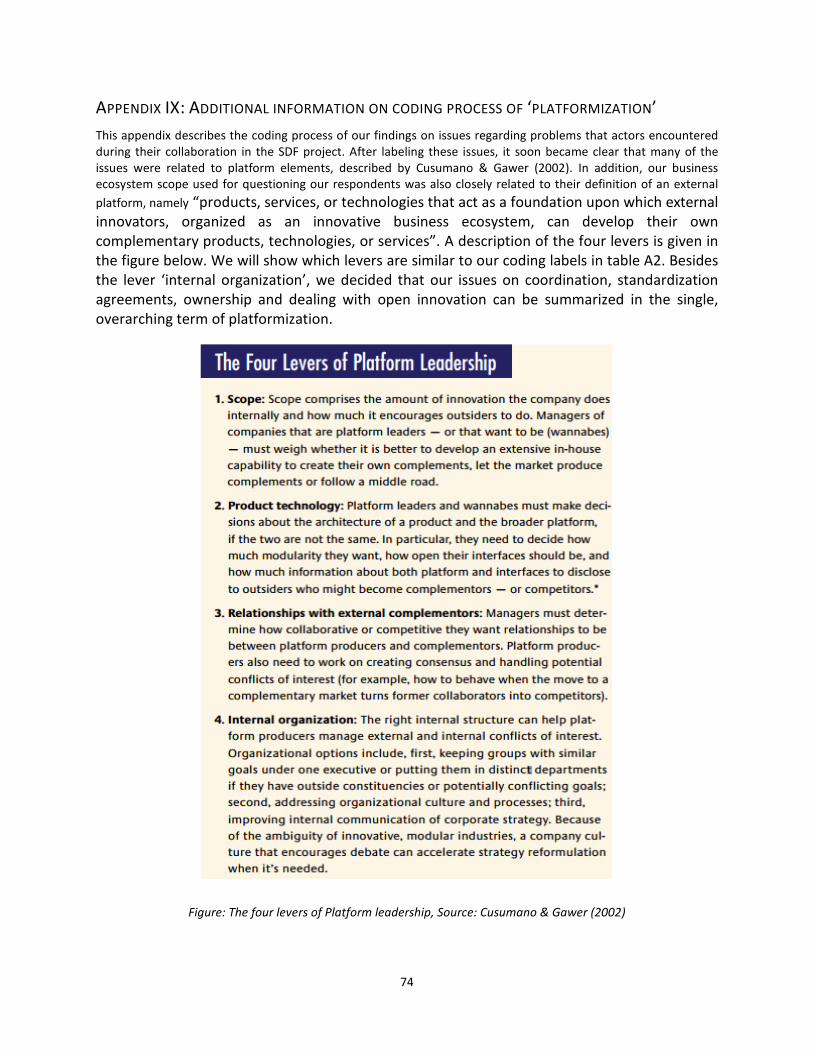
74
APPENDIX IX: ADDITIONAL INFORMATION ON CODING PROCESS OF ‘PLATFORMIZATION’
This appendix describes the coding process of our findings on issues regarding problems that actors encountered
during their collaboration in the SDF project. After labeling these issues, it soon became clear that many of the
issues were related to platform elements, described by Cusumano & Gawer (2002). In addition, our business
ecosystem scope used for questioning our respondents was also closely related to their definition of an external
platform, namely “products, services, or technologies that act as a foundation upon which external
innovators, organized as an innovative business ecosystem, can develop their own
complementary products, technologies, or services”. A description of the four levers is given in
the figure below. We will show which levers are similar to our coding labels in table A2. Besides
the lever ‘internal organization’, we decided that our issues on coordination, standardization
agreements, ownership and dealing with open innovation can be summarized in the single,
overarching term of platformization.
Figure: The four levers of Platform leadership, Source: Cusumano & Gawer (2002)

75
Table A2: Issues on SDF problems
issue Platform lever
(Cusumano &
Gawer, 2002)
Indicators Example quotes
Platformization
Relationships with
external
complementors.
Coordination
A3: en wie is nu de key speler? A: dat is wel duidelijk dat zijn
hardware bedrijven, die hebben de gegevens. , dus die infobroker
groot krijgen is best wel lastig in zo'n krachten veld.
A3: in eerste instantie kwamen deze problemen omdat er in de
eerste fase gewoon te veel partijen betrokken waren. Waar we
met partijen bespraken wat gaan we doen? Hier kwamen we niet
uit omdat er gewoon teveel partijen en dus ook te veel ideeën
waren om het eens te worden.
Product
technology
Standardization
agreements
B2: nadeel van dit systeem is dat we een wereldwijde speler zijn,
dus het is heel moeilijk om het systeem pasmaat voor Nederland
te maken terwijl je nog 65 andere landen hebt.
F1: “Het was moeilijk om die data te krijgen, vooral het technische
aspect, bijvoorbeeld de Gallagher weegschaal. Daar is een ID
koppeling nodig met een koe, ik kan die data anders niet goed
opslaan, de vraag was telkens hoe we dat weer gingen vertalen”
T: bedoel je die data door de keten heen uitwisselen? I2: Ja als je
die data toegang niet goed kunt automatiseren en data
betrouwbaar maken dan heb je een probleem voor je applicatie
ontwikkeling. naast het hebben van een data hub, moeten er
standaarden ontwikkeld worden waaraan sensoren aan moeten
voldoen. Als die er zouden zijn dan wordt het makkelijker.
Scope Ownership
G1: De samenwerking was gelijkwaardig. Dit was een nadeel
omdat iedereen toegang had tot de data. En de grotere bedrijven
hadden daar problemen mee met hun IPR.
A1: het belangrijkste is de onduidelijkheid weg te nemen over het
onderwerp: van wie is die data? En als die data niet van de
veehouder is, eh, als die wel van de veehouder is, wat is dan een
redelijke vergoeding die lely mag vragen om die data via de
infobroker beschikbaar te stellen?
Change in core
business scope
A3: “dat betekend dat alle partijen in de markt nu bezig zijn met
hun positie te bepalen, heb ik data en zo niet hoe kom ik er dan
aan?”
B2: “een aantal zijn er al mee bezig. Maar sommige zullen dat
gewoon niet aan kunnen, een concreet voorbeeld, ik denk dat CRV
het straks lastig heeft om nog door te gaan. met monsters
afnemen etc., dat is ook nog een gedoe en het kost nog geld ook,
af en toe hoor je ook wel boeren zeggen; ik zou het wel kwijt
willen, als ik die informatiestromen ook ergens anders vandaan
kan halen”
Relationships with
external
complementaries.
Open innovation B2: ik denk dat daar de patentenwereld in de weg staat. Wij zijn
daarin heel conservatief. R: we willen niet te veel weten wat een
ander doet om te voorkomen dat een ander denk dat we de
ideeën van andere stelen. R: dat kun je één keer doen en dan is je
relatie goed naar de knoppen. R: dus we zijn daar wat
conservatiever en terughoudender in. T: en dan heb je het met
name over de applicaties ontwikkelen? R: ja hetgeen wat
openbaar is, is openbaar, daar luisteren we naar, graag zelfs. R:
maar als een idee nog in de conceptuele fase zit, blijf dan maar
weg.
G3: “Onze partners willen exclusiviteit, maar ook gebruikers
moeten uitwisselbaar zijn, dus ook de concurrent kan toetreden.
Deze visie leverde wel wat uitdagingen op”.

76
APPENDIX X: RESULTS POWER ANALYSIS SDF PROJECT FROM ALTER-EGO PERCEPTIONS
Farm entrepreneur

77
actors Position 1 given by Position 2 given by position 3 given by
Farmer
Stichting SDF Agrifirm
Gallagher, Stichting SDF,
CRV
Agrifirm Gallagher, CRV
Lely, farmer, Rovecom,
Gallagher, CRV
Stichting SDF
Lely, Rovecom Rovecom
Lely
Agrifirm
Source: interview results of ‘oefening 1’ en ‘oefening 2’
Farm entrepreneur

78
APPENDIX XI: EXAMPLES DATA RESULTS ON ‘OEFENING 1’AND ‘OEFENING 2’
Current relationship configuration in SDF
project as reported by actor
Preferred future relationship
configuration in SDF project as reported
by actor

79
APPENDIX XII: INTERVIEW PROTOCOL
Interview vragen
Inleiding SDF:
Anonimiteit garanderen
1. Kunt u uw functie omschrijven en uw rol binnen SDF?
2. Wat is in uw optiek het SDF project?
3. Wat was voor u redenen om aan SDF deel te nemen?
o Welke beoogde exploitatie mogelijkheden zag u aan het begin van deelname?
4. Wat heeft u ingebracht (middelen/kennis) voor het project SDF?
o Wat is de relatie van deze inbreng in SDF door u met uw huidige business model?
o Wat zijn de overeenkomsten en waar zitten eventueel verschillen in?
5. Wat zijn op dit moment uw meest kapitaal intensieve assets/bezittingen?
6. Wat voor voordelen heeft het u gebracht? � zitten daar toegang tot nieuwe middelen en kennis bij die u
voorheen niet tot u beschikking had? (top 3)
7. Welke uitdagingen heeft u ondervonden? � Hebben deze te maken met het omgaan met nieuwe
middelen of kennis? (top 3)
8. Hoe zou u de impact van de SDF infobroker(gemeenschappelijk IT platform om databases te linken en
applicaties op te ontwikkelen) beschrijven op uw eigen(interne) bedrijfsvoering? 1. als een
innovatie die uw manier van werken versterkt/ondersteund? 2. als een innovatie die uw manier
van werken verstoord/onderbreekt?
(En waarom � Wat voor veranderingen/verbeteringen heeft u zelf binnen uw organisatie ondervonden
ten gevolge van de infobroker en deelname aan het SDF project?)
9. Hoe zou u de mogelijke impact van SDF infobroker op de gehele MVH sector beschrijven:
1. als een innovatie die de huidige manier van werken versterkt/ondersteund? 2. als
een innovatie die de huidige manier van werken verstoord/onderbreekt?
(En waarom � Op wat voor manier zou de SDF infobroker de MVH sector kunnen versterken of verstoren
denkt u?)
Oefening 1: Teken het ecosysteem voor SDF t=NU (oefening bestaat uit kaartjes met de naam van de betrokken
actoren erop, deze plakt de respondent op een groot vel papier. Indien nodig vult hij actoren aan die hij nog
mist).
1. Op tafel/matrix: Geef aan met welke SDF partners u in dit project samenwerkt (extra kaartjes voor
wanneer er partners missen).
o Zijn er nog partijen die nu niet betrokken zijn, maar die u er wel graag betrokken had gezien bij
SDF op dit moment? (waarom nog niet gebeurd?)
2. In matrix: Geef aan met welke SDF partners u voorheen niet of minder samenwerkte.
3. In matrix: Geef aan hoe u samenwerkt, we gaan de ‘link’ kwantificeren op twee aspecten: uitwisseling van
kennis (absorberen van kennis/samen leren/ zenden van kennis � Vraag naar concrete voorbeelden) en
het gebruik van bepaalde middelen (complemtarities � welke?).
4. In matrix: Geef aan welke partijen volgens u het meeste inbrengen in SDF
o Geef aan in matrix welk cijfer u de relatie zou geven.

80
5. Geef aan welke partij(en) (indien veel, kies top 5) (zowel binnen als buiten SDF mogelijk) een cruciale rol
hebben voor het slagen van het concept van de infobroker. Waarom heeft u deze partij(en) gekozen?
6. Geef aan welke partijen (top 5) in het algemeen het meeste invloed hebben op algemene ontwikkelingen
binnen de MVH sector.
o Zit er verschil in deze actoren? Zo ja, Waarom denkt u dat?
ACTIE: MAAK FOTO VAN RESULTAAT VOOR ANALYSE
Oefening 2: teken het ecosysteem voor SDF t= TOEKOMST (Gebruik resultaat van oefening 1 als input voor
oefening 2. Herschik het huidige plaatje tot een verwachte/gewenste eindsituatie (op een nieuw vel zodat de
twee situaties bediscussieerd kunnen worden)
1. Wat is in uw optiek de gewenste eindstaat voor het gebruik van de infobroker?
2. In matrix: geef aan met welke partners u meer verwacht te gaan samenwerken. (Waarom, wat zal die
samenwerking dan gaan inhouden?)
3. In matrix: geef aan met welke partijen u denkt juist minder te gaan samenwerken (Waarom?)
4. Op tafel: verschuif de actoren kaartjes met hun nieuwe relaties.
5. Geef aan wat voor middelen (ICT systemen/kapitaal/kennis) u graag verder ontwikkeld ziet worden. �
vervolg vraag: wie zou deze volgens u moeten ontwikkelen?
6. Welke partijen hebben volgens u in de toekomst de meeste invloed in de MVH sector wanneer de
infobroker een succes is geworden?
o Geef aan welke cijfer u deze partners in de toekomst situatie zou geven
7. Zijn deze partijen al genoemd? Zo nee: Waarom niet? Zo ja, bedenkt of deze nu ook de meeste inbreng
hebben.
8. Verwacht u dat er ook relaties van u verdwijnen? (Waarom)
ACTIE: MAAK FOTO VAN RESULTAAT VOOR ANALYSE
Nu deze gewenst eindsituatie van uw visie voor ons ligt:
10. Wat mist er volgens u nog binnen SDF? (bepaalde functies in het systeem, rollen of partijen?)
11. Zijn dit middelen die binnen de MVH sector gevonden/ontwikkeld kunnen worden?
o Zo ja, wie zou dat moeten doen?
o Zo nee, waar zouden die dan volgens u vandaan moeten komen?
Afsluitende vragen:
• Heeft u na aanleiding van dit interview nog aanbevelingen voor nieuwe interview kandidaten?
• Heeft u nog opmerkingen over dit interview of ideeën/zaken die u graag naar voren wil brengen?

81
Actor SDF situatie NU /Toekomst
actoren
Middelen (IT, koe
modellen, kapitaal,
koppeling,
menskracht)
Kennis (invoer, uitvoer,
ontwikkelen) – is deze
kennis makkelijk over te
dragen?
Relatie Schaal
1 - 7

82
Boeren
Bedrijven

83