Embed Size (px)
Citation preview
Eindhoven University of Technology
MASTER
Fire behavior of sandwich panel core materials in the pre-flashover phase
Giunta d'Albani, A.W.
Award date:2014
Link to publication
DisclaimerThis document contains a student thesis (bachelor's or master's), as authored by a student at Eindhoven University of Technology. Studenttheses are made available in the TU/e repository upon obtaining the required degree. The grade received is not published on the documentas presented in the repository. The required complexity or quality of research of student theses may vary by program, and the requiredminimum study period may vary in duration.
General rightsCopyright and moral rights for the publications made accessible in the public portal are retained by the authors and/or other copyright ownersand it is a condition of accessing publications that users recognise and abide by the legal requirements associated with these rights.
• Users may download and print one copy of any publication from the public portal for the purpose of private study or research. • You may not further distribute the material or use it for any profit-making activity or commercial gain

COLOPHONFire Behavior Of Sandwich Panel Core Materials In The Pre-flashover Phase
A study into sandwich panels and their fire safety properties, based on a literature study resulting in experiments. To gain further insight in possible hazards of steel insulated sandwich panels in the pre-flashover phase.
For the graduation of the master track Building technology, of the department Architecture, Building and Planning at the Eindhoven University of Technology.
By:Ing. A.W. Giunta d’Albani 0773711
Tutored by:Prof. Dr. Ir. H.J.H. Brouwers TU/eIr. R.A.P. van Herpen FIFireEIr. A.C.J. de Korte, TU/eDr. Ir. R. Weewer (Brandweer Nederland)
In cooperation with:Nederlands Instituut voor Fysieke Veiligheid (IFV)Brandweer NederlandTechnische Universiteit Eindhoven(TU/e)
Edition: DefinitiefVersion 1
4-11-2014

4 Ing. A.W. Giunta d’Albani
5Ing. A.W. Giunta d’Albani
At the start of this graduation project, my knowledge about fire safety and insulation materials was limited.Since my study has its main focus on building technology, material science is a new direction, nevertheless a challenging one. The knowledge about these new subjects has been gained by reading literature, attending a Fire safety engineering course, a National Fire safety engineering congress organized by the IFV, and the National Fire safety congress organized by SBRCUnet. Besides the congresses we have visited two production plants (Isobouw at Someren and Kingspan at Tiel), where meetings and presentations gave insight in the world of synthetic insulation materials. Conversations with different consultants from the company’s, Peutz an DGMR have helped to gain knowledge on the field fire safety tests.
This indicative research has been done under the supervision of Prof. Dr. Ir. H.J.H Brouwers (TU/e), Ir. R.A.P van Herpen FIFireE, Dr. Ir. R. Weewer (Brandweer Nederland), and Ir. A.C.J. de Korte of the Technical University Eindhoven. I would like to thank them for their time and knowledge. And I would like to thank the entire scientific Board of Brandweer Nederland for their enthusiasm and input.
Besides the support of the supervisors I would like to give our special thanks to several experts in the field of fire safety, materials and fire tests to start with Roy Weghorst, and Benedikt van Roosmalen for their continuous input, useful remarks and pleasant and helpful meetings. I also like to thank Peter van de Leur (DGMR) for his comments on the literature study, and a refreshing view of the test setup and the instruments to measure these experiments. As well as Jacques Mertens (Peutz) who helped to design the small experimental setup.
Preface
Abstract
This research is commissioned by the Dutch fire department and the Eindhoven University of Technology (TU/e). The Dutch fire department is increasing their scientific knowledge of events that are happening during a fire. They suspect sandwich panels with a combustible core to be a potential hazard, after several serious events in buildings constructed with these panels. This research contains a summary of the literature study and an indicative research. The literature study done together with L.L de Kluiver gives a short overview of the available literature about fire hazards regarding sandwich panels in an objective way. The research made use of different journals in the field of fire safety engineering and building materials, case study reports made by different companies, as well as information from manufacturers and Euro codes. Topics involved in this research are: sandwich panel, thin metal sheets, combustible insulation, polyurethane, polyisocyanurate, pyrolysis, and steel facings. The indicative research mainly contains experiments and simulations in order to create insight in the total amount of pyrolysis products in a smoke layer.
Both parts of the research are to check the validity of the concern from the Dutch fire department. The results from the literature study show that the concern of the Dutch fire department might be correct although most of the literatures focuses on fully developed fires. The indicative research is designed to create more insight in the actual behavior in the pre-flashover phase. In order to determine if the sandwich panels, which are mainly applied on Dutch buildings pose, threats for fire fighters
The literature study has focused on the hazards of the sandwich panel as a building product. The fire hazards of combustible cored sandwich panels are not clear yet. Fire fighters see things happening which are not supposed to happen according to official fire tests. Literature describes delamination and falling down of the metal facings, which are a potential hazards for fire fighters. Official fire tests do not describe this event. Besides that, cores can be exposed earlier in real fires than fire test show, due to a greater influence of the buckling effect. The mixture of smoke gases and pyrolysis gases can become a potential mix for smoke-gas explosions.
The results of the indicative research show: that delamination does occur in the pre-flashover phase, all tested samples show signs of delamination or loss of structural strength at the upper range of the
6 Ing. A.W. Giunta d’Albani
pre-flashover phase. Panels are normally mounted on purlins, so the chance of panels falling down is minimal. Some deformation of panels has been seen, but this test has been to small to make any statement about the buckling effect. Surprisingly the actual mass-loss by pyrolysis of synthetic cores and mineral wool based cores does not differ much up to 300 degrees Celsius. The mass-loss of PUR panels is exponential and PUR starts losing a significant amount of mass around 300 degrees Celcius, whereas the PIR and stone wool panels have a lower pyrolysis temperature and show a more linear trend. The radiation flux of the smokelayer is an important factor by which the maximum temperature can be calculated. The fire fighting tenability limits has been suggested as a maximum radiation flux of 4,5 Kw/m² at 1.5 m above the floor and a minimum height to the bottom of the smoke layer of 2 m” [19]. A temperature of 350 °C would give a heat flux of 8 Kw/m², this radiation level marks the upper limit for a fire fighters to apply an offensive fire repression within the fire compartment. Since the radiation level can be reduced by a factor 0.5 when working close to the sides of the compartments.
When results of the experimental test are used in the Spreadsheet calculations. The simulations show that even in the most extreme situations the limit of the 39% mass of flammable gases of the total smoke layer will not be reached. The poultry farms (long and low buildings) show with 22.6% the highest amount of flammable gasses of the total smoke layer. Most buildings do not generate more than 5% pyrolysis gases of the total smoke layer at temperatures up to 270 degrees Celsius ( 4,5 Kw/m²), and 11% at temperatures up to 350 degrees Celcius ( 8 Kw/m²) During these simulations completely closed buildings where calculated. The outlet of pyrolysis gases has not been taken in account. All results generated in these calculations are project specific, and dot not contain compartment larger than 1600m².
To conclude, sandwich panels with synthetic and mineral wool cores both emit pyrolysis gases when exposed to heat. The potential hazard of a flammable mixture occurring in the smoke layer lies above the temperature range to which fire fighter can safely be exposed. Sandwich panels in any form are not dangerous as a building material, and do not pose any threat during normal use of the building. However, during a fire the presence of combustible additives in sandwich panels may in some cases, and mainly after pre-flashover increase the intensity of the fire.
7Ing. A.W. Giunta d’Albani
beschrijft de delaminatie van de stalen bekleding en zelfs het vallen van deze bekleding, en het vervroegd blootstellen van kernen door vervorming en of het doorbuigen van panelen. En daarnaast het mogelijk ontstaan van rooklaag explosies door het uitgassen van de panelen
De resultaten van het indicatieve onderzoek laten vet volgende zien: delamimantie dan wel verlies van draagkracht treed op in de pre-flashoverfase, dit wordt waargenomen aan de bovengrens waaraan brandweerlieden blootgesteld kunnen worden. Daarnaast worden sandwichpanelen gewoonlijk ondersteund door gordingen. Het vallen van de stalen bekleding van staal sandwichpanelen als dak bekleding is dan ook hoogst onwaarschijnlijk. Lichtelijke vervorming van de proefstukken is waargenomen tijdens de uitgevoerde testen, maar de test is te kleinschalig om hier betrouwbare conclusies uit te trekken. In geen enkele situatie wordt de grens van 39 % brandbare gassen in de rooklaag overschreden. De meeste gebouwen generenen niet meer dan 5% pyrolise gassen, bij een rooklaag temperatuur tot 270 graden Celsius ( 4.5 Kw/m²), en 11% bij 350 graden Celcius (8 Kw/m²). De maximum temperatuur waaraan een brandweerman/vrouw blootgesteld kan worden, wordt mede bepaald door de stralingsflux. Als limiet wordt een straling van 4.5 Kw/m² op een hoogte van 1. 5 meter boven vloer niveau met een rookvrije hoogte van 2 meter gesuggereerd [19].Er zijn geen openingen in de simulaties mee genomen waardoor er geen afvoer van rook plaatsvind, men kan hier dus spreken van een worst-case scenario. Een ander verrassend resultaat van dit onderzoek is dat het massaverlies van synthetische kernen en mineralewolkernen niet ver uiteenlopen tot een temperatuur van 300 graden.
Concluderend: sandwichpanelen met synthetische- en mineralewolkernen stoten beide gassen uit wanneer deze blootgesteld worden aan hitte. Het mogelijke gevaar van een brandbaar mengsel in de rooklaag, veroorzaakt door alleen de sandwich panelen ligt boven de temperatuurgrens waaraan brandweerlieden blootgesteld kunnen worden. Sandwichpanelen in welke vorm dan ook vormen geen gevaar voor personen bij normaal gebruik van het gebouw. De aanwezigheid van brandbare toevoegingen in de sandwichpanelen kan in sommige gevallen, en met name na de pre-flashoverfase bijdragen aan de intensiteit van de brand.
Dit onderzoek is uitgevoerd in opdracht van Brandweer Nederland en de Technische Universiteit Eindhoven (TU/e). Brandweer Nederland is bezig met het vergroten van hun wetenschappelijke kennis over fenomenen die optreden ten tijde van brand. Brandweer Nederland vermoedt dat sandwichpanelen met een synthetische kern mogelijk gevaarlijke situatie s opleveren ten tijde van een brand. Dat vermoeden is aangewakkerd naar aanleiding van enkele ernstige branden in gebouwen waarin vermoed word dat synthetische isolatie en rol speelt bij het ontstaan van een brandbaar mengsel in de rooklaag, en de intensiteit van de brand.
Dit onderzoek bevat een samenvatting van het literatuuronderzoek, aangevuld met een indicatief onderzoek. Het literatuuronderzoek gedaan in samenwerking met L.L. de Kluiver geeft een kort overzicht van de beschikbare literatuur over de gevaren van sandwichpanelen. Door gebruik te maken van verschillende wetenschappelijk tijdschriften op het gebied van fire safety engineering en materiaal wetenschappen, en informatie verkregen van producenten. Aandachtsgebieden van het onderzoek zijn: sandwichpanelen, dunne staalplaten, brandbare isolatie, polyurethaan, polyisocyanuraat, pyrolyse, stalen bekleding.
Het indicatieve onderzoek bevat de resultaten van de uitgevoerde experimenten, simulaties, en berekeningen om de mogelijke risico’s van het ontstaan van een brandbaar rookgas mengsel in de rooklaag te benaderen. Beide onderdelen van het onderzoek zijn gedaan om het vermoeden van Brandweer Nederland te bevestigen dan wel te ontkrachten. Het resultaat van het literatuuronderzoek wijst erop dat het vermoeden van Brandweer Nederland correct is. De gebruikte literatuur focust zich op volledig ontwikkelde branden.
Het indicatieve onderzoek is opgezet om meer inzicht te creëren in het gedrag van de sandwichpanelen in de pre-flashoverfase. Om te kunnen concluderen of de meest gangbare sandwichpanelen toegepast in Nederland mogelijk risico’s vormen voor brandweerlieden ten tijde van een offensieve binnen-inzet.
Het literatuuronderzoek heeft zich gericht op de gevaren van sandwichpanelen als bouwproduct. De gevaren van de panelen ten tijde van een brand zijn nog niet duidelijk vastgelegd. Brandweerlieden zien dingen gebeuren welke volgens officiële brandtesten niet zouden moeten gebeuren. De gevonden literatuur
Samenvatting
InhoudCOLOPHON 3
Preface 5
Abstract 6
Samenvatting 7
Glossary 10
1. Introduction 13 1.1 General introduction 13 1.2 Reading guide 13 1.3 Sandwich panels in Literature 14 1.3.1 The sandwich panel 14 1.3.2 Polyurethane foam (PUR) 14 1.3.3 Polyisocyanurate foam (PIR) 14 1.3.4 Mineral wool 14 1.3.5 Ignition temperatures and char 15 1.3.6 Fire test and objections 15 1.4 Aim and scope 17 1.5 Research questions 17 1.6 Limitations 18
2. Experimental Test Setup 20 2.1Test-procedure 20 2.2 Test setup 21 2.3 Used instruments 22 2.4 Future possibilities test setup 23 2.5 Validation test setup 24 2.5.1Test-runs 24 2.5.2 Sample placing procedure 25 2.5.3. Behaviour in outside conditions 25
3. Results Experiments 26 3.1 Test evaluation 26 3.2 Test results PUR 26 3.3 Test results PIR 28 3.4 Test results stone wool roof (SWR) 29 3.5 Test results stone wool wall (SWW) 30 3.6 Overall analysis 31 3.7 Comparing to the literature 33 3.8 Conclusion mass-loss experiments 34
4. Simulations 36 4.1 Indication by Comsol Multiphysics® 36 4.1.2 Results Comsol Multiphysics® 36 4.1.3 Validation Comsol Multiphysics® 38 4.2 Indication Voltra 39 4.2.1 Results Voltra 40 4.2.2 Validation Voltra 40 4.3 Conclusion 41 4.4 Ozone/ spreadsheet calculations 41 4.4.1 Ozone 41 4.4.2 Excel 41 4.4.3 Types of buildings 42 4.4.4 Results mass-loss spreadsheet calculations 44 4.4.5 Analysis spreadsheet calculations 46 4.5 Radiation flux 47
5. Conclusion, discussion and advise 48 5.1 Conclusion 48 5.2 Possible solutions to reduce the risks of flammable mixtures 49 5.3 Limitations/discussion 49
References 50Figure index 51
Appendix A: Temperature validation 56Appendix B: Voltra simulation report PIR 61Appendix C: Voltra simulation report PIR 68Appendix D: Voltra simulation report SWR 75Appendix E: Excel simulations summary 82Appendix F: Sample pictures 90Appendix G: Sample weight 94
10 Ing. A.W. Giunta d’Albani
Glossary
Buckling: The event that happens due to thermal stress and loss of load bearing capacity.
Delamination: Separation of different layers applied in sandwich panels. Caused by loss of strength of the adhesives that connect the facings to the cores.
EN:European standards, valid for all European country’s.
EN-ISO:ISO Standard accepted by the standardization institute for the European union. Valid in Europe.
Explosion:An exothermic chemical process which, when it happens at a constant volume, generates a sudden and significant increase in pressure.
Facings: Thin metal sheets or other materials applied on the insulation cores of the sandwich panels. As protection of the core, with hygienic and aesthetic meaning.
Flammability range:This is the range within which gas/air mixtures can ignite.
Flash ignition: The temperature, on which a material can be ignited with a flame or spark.
Flashover:A flashover is a transition period from when the fire is burning locally until the whole room is involved in the fire. A flashover occurs when the room conditions exceeds a particular critical level. Factors contributing to the increase in the fire’s heat release rate, include flame spread over combustible surfaces and reradiation from the hot smoke gas layer. A flashover marks the transition from the early fire development stage to a fully developed compartment fire.
Flame spread:The speed in which the fire travels on and trough the material.
Fuel controlled fire: After ignition and at the start of a fire’s development, the fire is described as fuel controlled as there is sufficient air for combustion and the fire’s development is controlled entirely by the fuel’s properties and arrangement. A fire can also be fuel controlled at a later stage in its development.
Heat release rate:When a material combusts it releases heat. This released heat is measured in watts (J/s).
Influenced surface:The area of sandwich panels that has been exposed to the smoke layer.
Intruding depth:The depth on which the thermal degradation is visually reconcilable after exposing the samples to the heat source.
ISO:International organization for standardization. This organization manages, and develops standards on a lot of different fields and products, on a world wide base. Only valid when accepted by a country or European union.
LCA-score:Life Cycle Assessment of Building Assemblies and Materials.
LFL:Lower flammability limit, the lowest ratio of gases and air that can be ignited.
LPCB:Loss prevention certificate board. An organization that tests materials on their fire safety properties, and attach these to a certificate.
Mass-loss:The difference in total mass before and after testing the sample.
Mass-loss rate:The mass-loss rate is the speed at which pyrolysis occurs from a material, sometimes also known as the rate of pyrolysis. This is measured in g/m2s.

11Ing. A.W. Giunta d’Albani
NEN:NEderlandse Norm, Manages The Dutch standardization process, comparable with ISO but on a national level. Valid in the Netherlands.
NEN-ISO:ISO standard accepted in The Netherlands by the dutch standardization institute (NEN). Also valid in The Netherlands.
NEN-EN-ISO:A code for a standard accepted by The Dutch Standardization Institute and the European institute for standardization. Valid in the European Union.
PIR:Polyisocyanurate (insulation material).
Pre-flashover:The fase in which the fire develops, from the very beginning of the fire till it reaches flashover.
PUR:Polyurethane (insulation material).
Pyrolysis: Pyrolysis is a chemical decomposition process or other chemical conversion from complex to simpler constituents, caused by the effect of heat.
Pyrolysis material smoke layer ratio:This ratio shows the amount of pyrolysis gas as a percentage of the total smoke layer ratio.
Self-ignition: The moment on which a material has reached such a high temperature that it will ignite by itself.
Sandwich panel:A triple layered self-supporting building insulation element, mainly used for fast construction. And available in different types and materials. Often existing out of a non-combustible core and facings.
Sample temperature:The temperature as measured in the sample while exposing it to the heat source.
Smoke gas explosion:When unburned smoke gases leak into an area adjacent to the fire room, they can mix very well with air to produce a combustible mixture. If there is an ignition source available or one becomes available some other way, the smoke gases can ignite with an extremely devastating effect. As a rule, this phenomenon occurs seldom.
Surface temperature:The temperature of the inner steel facing while being exposed to the heat source.
UFL:Upper flammability limit, the limit where the ratio of flammable gases is so high that when exceeded this mixture can not be ignited.
Ventilation controlled fire: As the fire grows it may become ventilation controlled when there is no longer sufficient oxygen to combust the pyrolysis gases formed. The fire’s heat release rate is then controlled completely by the amount of air which is available, in which case the fire is described as being ventilation controlled.
XPS:Extruded polystyrene (insulation material).

12 Ing. A.W. Giunta d’Albani
13 Ing. A.W. Giunta d’Albani
1 Introduction
1.1 General introduction
In contemporary buildings in which we live and work, higher and higher insulation standards are to be achieved in order to save energy. This aim for higher insulation levels has introduced widespread of synthetic and wool based insulation materials. The five most commonly used insulation materials are the polyurethane foams, polyisocyanurate foams, expanded/extruded polystyrene, stone wool and glass wool based products. Generally called synthetic insulation materials or combustible insulation materials and mineral wool based insulation materials or non-combustible insulation materials. Since the emergence of the synthetic insulation materials, their behavior in case of a fire has been questioned. Although synthetic insulation manufacturers market their products as fire safe, without extra health risk when in a fire situation. It is commonly known and proved that mineral wool are supposed to have Excellent fire safety properties. Manufacturers of mineral wool based insulation guarantee a fire safe product with a high insulation level. This division of all insulation materials into synthetic and mineral wool based insulation materials, may cause a troubled overview of the actual fire behavior of the individual products. Since there is a lot of diversity in the properties of the insulation materials, an indicative research into those materials to determine the actual behavior in the event of a fire is needed.
This research is initiated by the Dutch fire department to determine the possible risk that fire fighters are exposed to, during their offensive fire repression in buildings on which steel insulated sandwich panels are applied. The Dutch fire brigade has seen some serious events in buildings on which synthetic insulation materials are applied. They suspect that these materials increase the intensity of the fire, and might possibly cause smoke layer explosions in the pre-flashover phase. Producers of synthetic insulation materials claim otherwise. This shows the urgency and need for an objective and indicative research into the synthetic and mineral wool based insulation materials.
1.2 Reading guide
This study is an experimental follow-up on the study, Fire behavior of synthetic insulation materials in sandwich panels, by L.L. de Kluiver and A.W. Giunta d’ Albani. In this research, the first part contains the aim of the mass-loss experiments, and their experimental testsetup. Followed by the explanation of the spreadsheet calculations, which will be used to answer the question wether steel insulated sandwich panels pose any threats to fire fighters active in offensive fire repression inside a building, regarding flammable mixtures in smoke layers
The second chapter of this report contains the technical explanation of the setup followed by the validation of the test setup. On the field of temperature behavior within the furnace.
The third chapter contains the analysis of the results of the experimental setup (mass-loss) with detailed information about relative mass-loss and degradation of each sample type.
Chapter four includes the result of all the simulations. Temperature prediction through the core materials as well as smoke layer calculations in large building compartments.
Final chapter five will end with a conclusion about the fire safety issues of steel insulated sandwich panels in the pre-flashover phase.
14 Ing. A.W. Giunta d’Albani
1.3 Sandwich panels in Literature
This chapter contains some basic information about sandwich panels and the different types of cores applied in sandwich panels. For every type,the relevant fire properties are stated. Finally, the standard fire tests and associated fire class system will be explained. Not every available type of sandwich panel is discussed, only the most common types are elaborated.
1.3.1 The sandwich panel
Sandwich panels are a popular building product due to: their weight, the thermal insulation capacity, span, dimensions, and a fast assembly process during construction. Combined with the large diversity of the aesthetic variety, high LCA-score, and the relatively low impact on the environment during the production process. These properties make combustible-cored sandwich panels not only financially attractive, but also attractive on the field of sustainability. Therefore, sandwich panels are used in many different building envelopes. At first they where applied in low life-risk building, such as storages or factories. “Due to the improvement of their aesthetic and hygienic properties, and the increase of variety, nowadays sandwich panels are applied in schools, hospitals, prisons, retails outlets, and other public buildings.”[1] Since the field in which sandwich panels are applied has grown, the chance of them being exposed to a fire has increased automatically.
A steel insulated sandwich panel exists of a core that has a high insulation capacity, wrapped in thin steel or aluminium facings, but other materials like wood, plastics or paper are also possible. This research will only focus on the panels with metal facings. The facings are attached to the core by adhesives. There are two main categories of sandwich panels cores, the non-combustible core panels, such as glass-wool and stone-wool and the combustible core (EPS, XPS, PUR, PIR) panels. In order of frequency of use, sandwich panels for external roof and wall applications are: PUR, PIR, LPCB approved PIR, mineral wool (rock fibre), EPS, and mineral wool (glass fibre).[2]. One can conclude that the most common cores in sandwich panels applied in The Netherlands are made out of the combustible cores: PIR and PUR.
PIR/PUR steel sandwich panels, also known as ruggedized foam panels, are produced according the Rigid Faced Double Belt Lamination (RF-DBL) process. Here the foam will be connected to the
steel facings during the expansion process of the foam in order to create one solid element. Since this is a continuous process the element can be cut to the desired length. This production process is only applied on panels with thin metal facings. When the right materials are applied, sandwich panels can reach Excellent fire resistance. Each core has its own properties as described below.
1.3.2 Polyurethane foam (PUR)
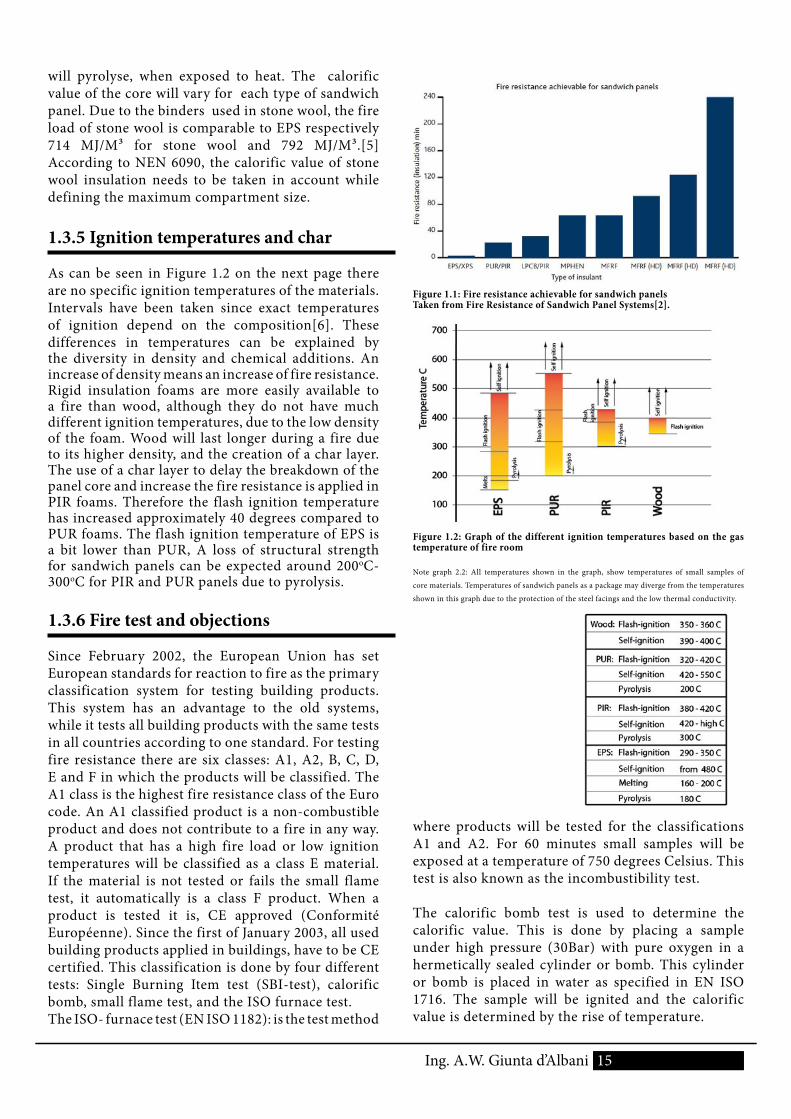
Polyurethane is an organic insulation material made from a reactive mixture of two principal liquid components and a number of additives to produce a foam with a closed cell structure. The foam produced will not normally be ignited by a small heat source but a larger flame will cause ignition and flame spread, resulting in abundant toxic smoke production. Since PUR is a thermoset it will not melt but it will pyrolyse. The pyrolysis temperature is 200oC. The flash ignition temperature is 320oC-420oC. The self ignition is 420oC-550oC with a calorific value of approximately 26 MJ/Kg [3][4]. The achievable fire resistance, according to the LPS 1208 for PUR is approximately 30 minutes[2]. This is shown in Figure 2.1.
1.3.3 Polyisocyanurate foam (PIR)
PIR is also a thermoset and is produced in the same way as PUR, but the ratio between the components and types of additives is usually different, to produce a polymer with a crosslinked closed cell structure, and higher fire resistance. The process control factors are of higher importance compared to PUR. Decomposion while being exposed to heat is slowed down due to the formation of a char layer. The higher fire resistance is mainly obtained by the production of char, which creates a thin layer of protection. This process can be compared to the char forming, on for example wood. PIR has a calorific value of approximately 24 MJ/Kg [3]. The achievable fire resistance according to the LPS 1208 for PIR is approximately 30 minutes except LPCB approved PIR which is fire resistance till 35 minutes, as shown in Figure 1.1[2].
1.3.4 Mineral wool
Mineral wool products, such as glass wool and stone wool, are inorganic products. The amount of binders used in low density stone wool is negligible. Although the binders are used to improve the density and strength. Meaning that a higher density stone wool panel will contain more binders, these binders and the glue used to make stone wool sandwich panels
15Ing. A.W. Giunta d’Albani 15
will pyrolyse, when exposed to heat. The calorific value of the core will vary for each type of sandwich panel. Due to the binders used in stone wool, the fire load of stone wool is comparable to EPS respectively 714 MJ/M³ for stone wool and 792 MJ/M³.[5] According to NEN 6090, the calorific value of stone wool insulation needs to be taken in account while defining the maximum compartment size.
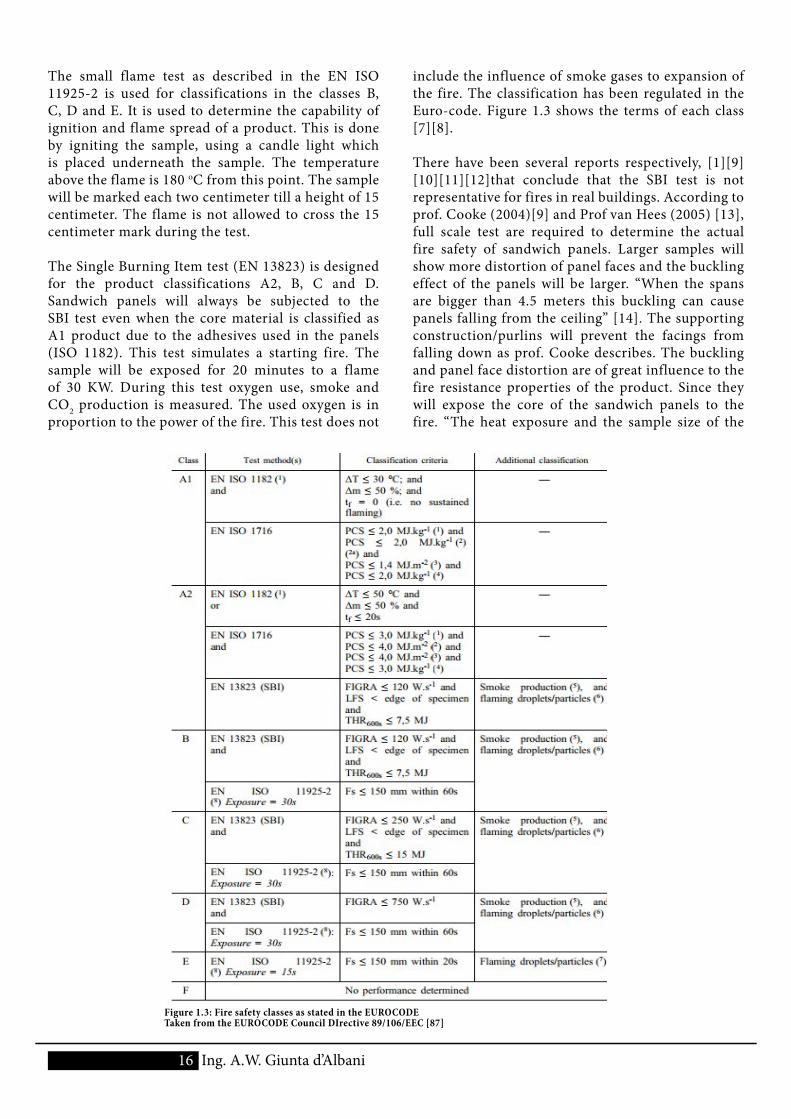
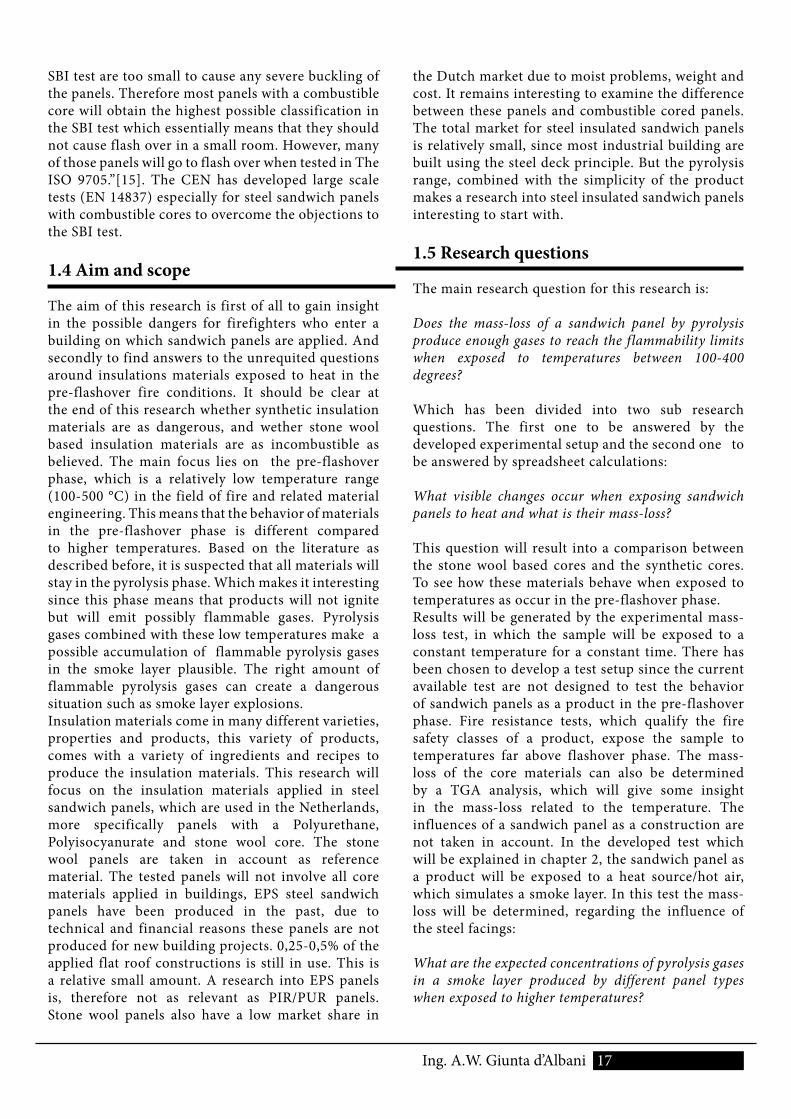
1.3.5 Ignition temperatures and char
As can be seen in Figure 1.2 on the next page there are no specific ignition temperatures of the materials. Intervals have been taken since exact temperatures of ignition depend on the composition[6]. These differences in temperatures can be explained by the diversity in density and chemical additions. An increase of density means an increase of fire resistance. Rigid insulation foams are more easily available to a fire than wood, although they do not have much different ignition temperatures, due to the low density of the foam. Wood will last longer during a fire due to its higher density, and the creation of a char layer. The use of a char layer to delay the breakdown of the panel core and increase the fire resistance is applied in PIR foams. Therefore the flash ignition temperature has increased approximately 40 degrees compared to PUR foams. The flash ignition temperature of EPS is a bit lower than PUR, A loss of structural strength for sandwich panels can be expected around 200oC-300oC for PIR and PUR panels due to pyrolysis.
1.3.6 Fire test and objections
Since February 2002, the European Union has set European standards for reaction to fire as the primary classification system for testing building products. This system has an advantage to the old systems, while it tests all building products with the same tests in all countries according to one standard. For testing fire resistance there are six classes: A1, A2, B, C, D, E and F in which the products will be classified. The A1 class is the highest fire resistance class of the Euro code. An A1 classified product is a non-combustible product and does not contribute to a fire in any way. A product that has a high fire load or low ignition temperatures will be classified as a class E material. If the material is not tested or fails the small flame test, it automatically is a class F product. When a product is tested it is, CE approved (Conformité Européenne). Since the first of January 2003, all used building products applied in buildings, have to be CE certified. This classification is done by four different tests: Single Burning Item test (SBI-test), calorific bomb, small flame test, and the ISO furnace test.The ISO- furnace test (EN ISO 1182): is the test method
where products will be tested for the classifications A1 and A2. For 60 minutes small samples will be exposed at a temperature of 750 degrees Celsius. This test is also known as the incombustibility test.
The calorific bomb test is used to determine the calorific value. This is done by placing a sample under high pressure (30Bar) with pure oxygen in a hermetically sealed cylinder or bomb. This cylinder or bomb is placed in water as specified in EN ISO 1716. The sample will be ignited and the calorific value is determined by the rise of temperature.
Figure 1.1: Fire resistance achievable for sandwich panelsTaken from Fire Resistance of Sandwich Panel Systems[2].
Figure 1.2: Graph of the different ignition temperatures based on the gas temperature of fire room
Note graph 2.2: All temperatures shown in the graph, show temperatures of small samples of
core materials. Temperatures of sandwich panels as a package may diverge from the temperatures
shown in this graph due to the protection of the steel facings and the low thermal conductivity.
16 Ing. A.W. Giunta d’Albani
The small flame test as described in the EN ISO 11925-2 is used for classifications in the classes B, C, D and E. It is used to determine the capability of ignition and flame spread of a product. This is done by igniting the sample, using a candle light which is placed underneath the sample. The temperature above the flame is 180 oC from this point. The sample will be marked each two centimeter till a height of 15 centimeter. The flame is not allowed to cross the 15 centimeter mark during the test.
The Single Burning Item test (EN 13823) is designed for the product classifications A2, B, C and D. Sandwich panels will always be subjected to the SBI test even when the core material is classified as A1 product due to the adhesives used in the panels (ISO 1182). This test simulates a starting fire. The sample will be exposed for 20 minutes to a flame of 30 KW. During this test oxygen use, smoke and CO2 production is measured. The used oxygen is in proportion to the power of the fire. This test does not
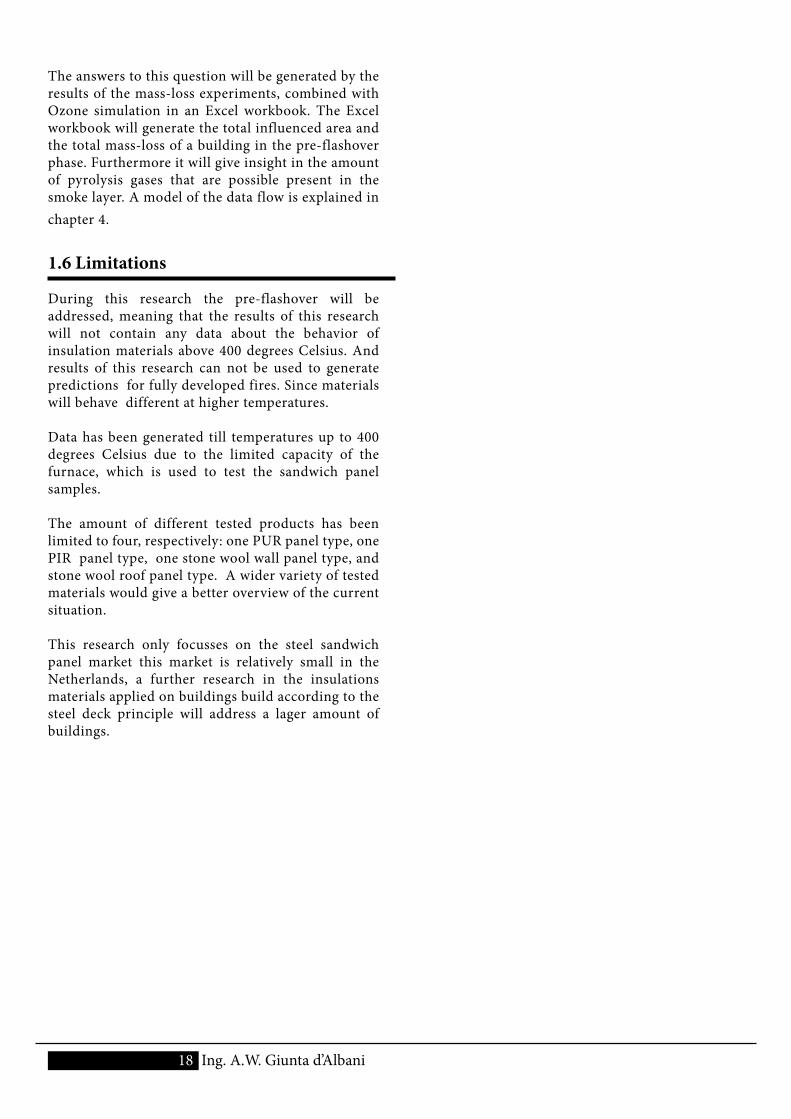
Figure 1.3: Fire safety classes as stated in the EUROCODETaken from the EUROCODE Council DIrective 89/106/EEC [87]
include the influence of smoke gases to expansion of the fire. The classification has been regulated in the Euro-code. Figure 1.3 shows the terms of each class [7][8].
There have been several reports respectively, [1][9][10][11][12]that conclude that the SBI test is not representative for fires in real buildings. According to prof. Cooke (2004)[9] and Prof van Hees (2005) [13], full scale test are required to determine the actual fire safety of sandwich panels. Larger samples will show more distortion of panel faces and the buckling effect of the panels will be larger. “When the spans are bigger than 4.5 meters this buckling can cause panels falling from the ceiling” [14]. The supporting construction/purlins will prevent the facings from falling down as prof. Cooke describes. The buckling and panel face distortion are of great influence to the fire resistance properties of the product. Since they will expose the core of the sandwich panels to the fire. “The heat exposure and the sample size of the
17 Ing. A.W. Giunta d’Albani
SBI test are too small to cause any severe buckling of the panels. Therefore most panels with a combustible core will obtain the highest possible classification in the SBI test which essentially means that they should not cause flash over in a small room. However, many of those panels will go to flash over when tested in The ISO 9705.”[15]. The CEN has developed large scale tests (EN 14837) especially for steel sandwich panels with combustible cores to overcome the objections to the SBI test.
1.4 Aim and scope
The aim of this research is first of all to gain insight in the possible dangers for firefighters who enter a building on which sandwich panels are applied. And secondly to find answers to the unrequited questions around insulations materials exposed to heat in the pre-flashover fire conditions. It should be clear at the end of this research whether synthetic insulation materials are as dangerous, and wether stone wool based insulation materials are as incombustible as believed. The main focus lies on the pre-flashover phase, which is a relatively low temperature range (100-500 °C) in the field of fire and related material engineering. This means that the behavior of materials in the pre-flashover phase is different compared to higher temperatures. Based on the literature as described before, it is suspected that all materials will stay in the pyrolysis phase. Which makes it interesting since this phase means that products will not ignite but will emit possibly flammable gases. Pyrolysis gases combined with these low temperatures make a possible accumulation of flammable pyrolysis gases in the smoke layer plausible. The right amount of flammable pyrolysis gases can create a dangerous situation such as smoke layer explosions.Insulation materials come in many different varieties, properties and products, this variety of products, comes with a variety of ingredients and recipes to produce the insulation materials. This research will focus on the insulation materials applied in steel sandwich panels, which are used in the Netherlands, more specifically panels with a Polyurethane, Polyisocyanurate and stone wool core. The stone wool panels are taken in account as reference material. The tested panels will not involve all core materials applied in buildings, EPS steel sandwich panels have been produced in the past, due to technical and financial reasons these panels are not produced for new building projects. 0,25-0,5% of the applied flat roof constructions is still in use. This is a relative small amount. A research into EPS panels is, therefore not as relevant as PIR/PUR panels. Stone wool panels also have a low market share in
the Dutch market due to moist problems, weight and cost. It remains interesting to examine the difference between these panels and combustible cored panels. The total market for steel insulated sandwich panels is relatively small, since most industrial building are built using the steel deck principle. But the pyrolysis range, combined with the simplicity of the product makes a research into steel insulated sandwich panels interesting to start with.
1.5 Research questions
The main research question for this research is:
Does the mass-loss of a sandwich panel by pyrolysis produce enough gases to reach the flammability limits when exposed to temperatures between 100-400 degrees?
Which has been divided into two sub research questions. The first one to be answered by the developed experimental setup and the second one to be answered by spreadsheet calculations:
What visible changes occur when exposing sandwich panels to heat and what is their mass-loss?
This question will result into a comparison between the stone wool based cores and the synthetic cores. To see how these materials behave when exposed to temperatures as occur in the pre-flashover phase.Results will be generated by the experimental mass-loss test, in which the sample will be exposed to a constant temperature for a constant time. There has been chosen to develop a test setup since the current available test are not designed to test the behavior of sandwich panels as a product in the pre-flashover phase. Fire resistance tests, which qualify the fire safety classes of a product, expose the sample to temperatures far above flashover phase. The mass-loss of the core materials can also be determined by a TGA analysis, which will give some insight in the mass-loss related to the temperature. The influences of a sandwich panel as a construction are not taken in account. In the developed test which will be explained in chapter 2, the sandwich panel as a product will be exposed to a heat source/hot air, which simulates a smoke layer. In this test the mass-loss will be determined, regarding the influence of the steel facings:
What are the expected concentrations of pyrolysis gases in a smoke layer produced by different panel types when exposed to higher temperatures?
18 Ing. A.W. Giunta d’Albani
The answers to this question will be generated by the results of the mass-loss experiments, combined with Ozone simulation in an Excel workbook. The Excel workbook will generate the total influenced area and the total mass-loss of a building in the pre-flashover phase. Furthermore it will give insight in the amount of pyrolysis gases that are possible present in the smoke layer. A model of the data flow is explained in chapter 4.
1.6 Limitations
During this research the pre-flashover will be addressed, meaning that the results of this research will not contain any data about the behavior of insulation materials above 400 degrees Celsius. And results of this research can not be used to generate predictions for fully developed fires. Since materials will behave different at higher temperatures.
Data has been generated till temperatures up to 400 degrees Celsius due to the limited capacity of the furnace, which is used to test the sandwich panel samples.
The amount of different tested products has been limited to four, respectively: one PUR panel type, one PIR panel type, one stone wool wall panel type, and stone wool roof panel type. A wider variety of tested materials would give a better overview of the current situation.
This research only focusses on the steel sandwich panel market this market is relatively small in the Netherlands, a further research in the insulations materials applied on buildings build according to the steel deck principle will address a lager amount of buildings.

19Ing. A.W. Giunta d’Albani
20 Ing. A.W. Giunta d’Albani
2 Experimental Test Setup
The aim of this experiment is to determine the mass-loss of the sandwich panels, constructed on standard buildings. This means that during this test the sandwich panels will be heated on one side, to simulate the influence of a hot gass-layer during a fire. This test setup has been discussed before in the M3 report.
2.1Test-procedure
The purpose of this test, in which samples of the panels will be tested, is to create an overview of the thermal behavior of the total sandwich construction, by simulating the thermal load of a hot smoke layer. In this test setup the samples of the panels will be exposed on one side only to approach a situation as realistic as possible. Decreasing the exposed surface area, by exposing only one side of the sample instead of all four sides, can result in a lower mass-loss, in relation to the exposed time.
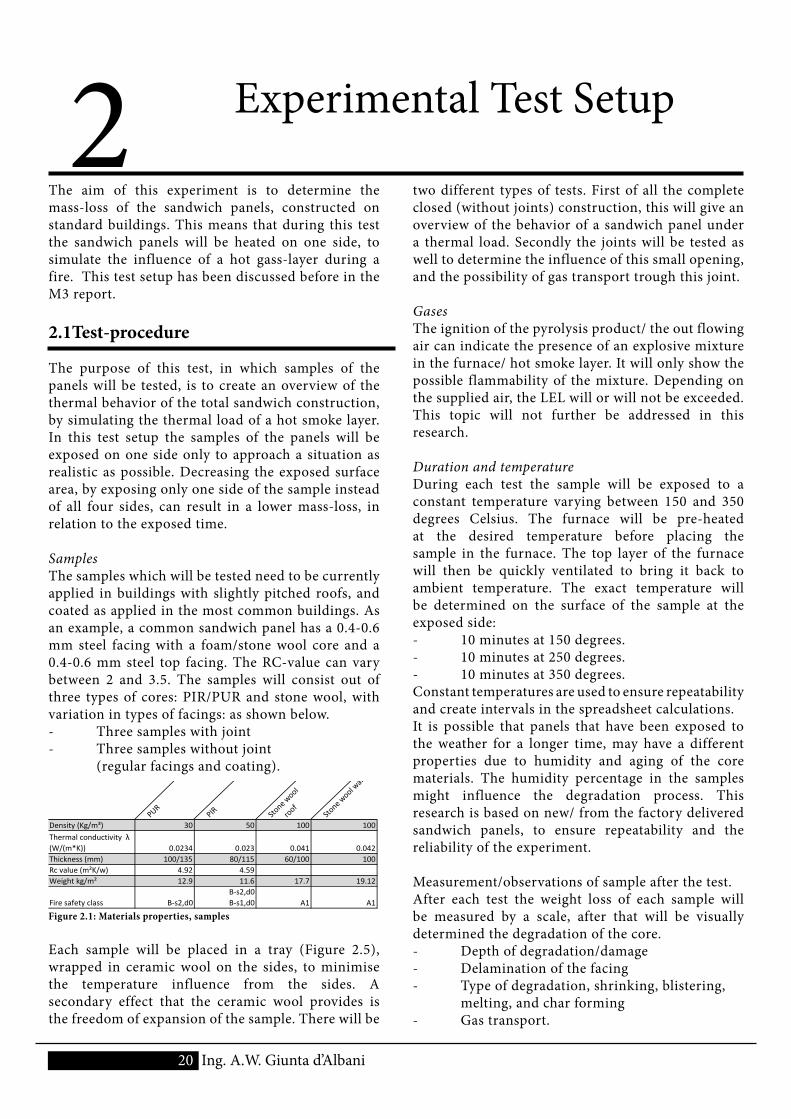
SamplesThe samples which will be tested need to be currently applied in buildings with slightly pitched roofs, and coated as applied in the most common buildings. As an example, a common sandwich panel has a 0.4-0.6 mm steel facing with a foam/stone wool core and a 0.4-0.6 mm steel top facing. The RC-value can vary between 2 and 3.5. The samples will consist out of three types of cores: PIR/PUR and stone wool, with variation in types of facings: as shown below.- Three samples with joint- Three samples without joint (regular facings and coating).
PUR
PIR Stone wool
roof
Stone wool wall
Density (Kg/m³) 30 50 100 100Thermal conductivity λ (W/(m*K)) 0.0234 0.023 0.041 0.042Thickness (mm) 100/135 80/115 60/100 100Rc value (m²K/w) 4.92 4.59Weight kg/m² 12.9 11.6 17.7 19.12
Fire safety class B‐s2,d0 B‐s2,d0 B‐s1,d0 A1 A1
Figure 2.1: Materials properties, samples
Each sample will be placed in a tray (Figure 2.5), wrapped in ceramic wool on the sides, to minimise the temperature influence from the sides. A secondary effect that the ceramic wool provides is the freedom of expansion of the sample. There will be
two different types of tests. First of all the complete closed (without joints) construction, this will give an overview of the behavior of a sandwich panel under a thermal load. Secondly the joints will be tested as well to determine the influence of this small opening, and the possibility of gas transport trough this joint.
GasesThe ignition of the pyrolysis product/ the out flowing air can indicate the presence of an explosive mixture in the furnace/ hot smoke layer. It will only show the possible flammability of the mixture. Depending on the supplied air, the LEL will or will not be exceeded. This topic will not further be addressed in this research.
Duration and temperatureDuring each test the sample will be exposed to a constant temperature varying between 150 and 350 degrees Celsius. The furnace will be pre-heated at the desired temperature before placing the sample in the furnace. The top layer of the furnace will then be quickly ventilated to bring it back to ambient temperature. The exact temperature will be determined on the surface of the sample at the exposed side:- 10 minutes at 150 degrees.- 10 minutes at 250 degrees.- 10 minutes at 350 degrees.Constant temperatures are used to ensure repeatability and create intervals in the spreadsheet calculations. It is possible that panels that have been exposed to the weather for a longer time, may have a different properties due to humidity and aging of the core materials. The humidity percentage in the samples might influence the degradation process. This research is based on new/ from the factory delivered sandwich panels, to ensure repeatability and the reliability of the experiment.
Measurement/observations of sample after the test.After each test the weight loss of each sample will be measured by a scale, after that will be visually determined the degradation of the core.- Depth of degradation/damage- Delamination of the facing- Type of degradation, shrinking, blistering, melting, and char forming- Gas transport.
21Ing. A.W. Giunta d’Albani
2.2 Test setup
IntroductionIn this paragraph the setup is described in which the samples of both experiments will be tested. Starting with the furnace and heating element, further on the applied monitoring/ measuring instruments.
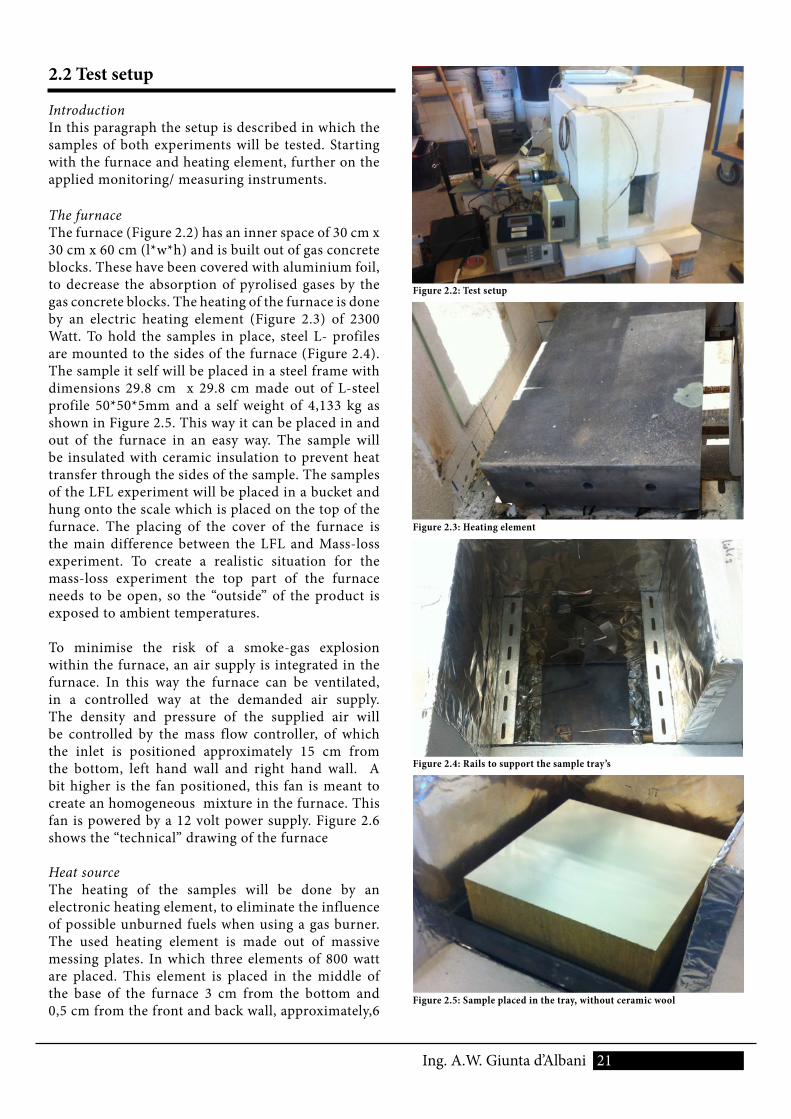
The furnaceThe furnace (Figure 2.2) has an inner space of 30 cm x 30 cm x 60 cm (l*w*h) and is built out of gas concrete blocks. These have been covered with aluminium foil, to decrease the absorption of pyrolised gases by the gas concrete blocks. The heating of the furnace is done by an electric heating element (Figure 2.3) of 2300 Watt. To hold the samples in place, steel L- profiles are mounted to the sides of the furnace (Figure 2.4). The sample it self will be placed in a steel frame with dimensions 29.8 cm x 29.8 cm made out of L-steel profile 50*50*5mm and a self weight of 4,133 kg as shown in Figure 2.5. This way it can be placed in and out of the furnace in an easy way. The sample will be insulated with ceramic insulation to prevent heat transfer through the sides of the sample. The samples of the LFL experiment will be placed in a bucket and hung onto the scale which is placed on the top of the furnace. The placing of the cover of the furnace is the main difference between the LFL and Mass-loss experiment. To create a realistic situation for the mass-loss experiment the top part of the furnace needs to be open, so the “outside” of the product is exposed to ambient temperatures.
To minimise the risk of a smoke-gas explosion within the furnace, an air supply is integrated in the furnace. In this way the furnace can be ventilated, in a controlled way at the demanded air supply. The density and pressure of the supplied air will be controlled by the mass flow controller, of which the inlet is positioned approximately 15 cm from the bottom, left hand wall and right hand wall. A bit higher is the fan positioned, this fan is meant to create an homogeneous mixture in the furnace. This fan is powered by a 12 volt power supply. Figure 2.6 shows the “technical” drawing of the furnace
Heat sourceThe heating of the samples will be done by an electronic heating element, to eliminate the influence of possible unburned fuels when using a gas burner. The used heating element is made out of massive messing plates. In which three elements of 800 watt are placed. This element is placed in the middle of the base of the furnace 3 cm from the bottom and 0,5 cm from the front and back wall, approximately,6
Figure 2.2: Test setup
Figure 2.3: Heating element
Figure 2.4: Rails to support the sample tray’s
Figure 2.5: Sample placed in the tray, without ceramic wool
22 Ing. A.W. Giunta d’Albani
- Thermocouple K4: Standard thermocouple type K, positioned the middle of the core material of the tested sample, at 3 cm from the exposed surface. This thermocouple will monitor rise in temperature of the core material which can be compared with the simulations as shown in paragraph 3.1.4
- Thermocouple K5: Plate-thermocouple type K brazed on a thin metal sheet (3*3 cm), which is positioned at an height of 30 cm, 12 cm off set from the right-hand wall and 1 cm from the front wall.
The distance between the heating element and the thermocouple is 24 cm. This thermocouple is not logged, but used as a thermostat. Due to the fact that using the logger for both situations might disturb the signal. The standard deviation between K3 and K5 is 3 °C, this deviation might have been caused by the settings of the thermostat.
Both plate-thermocouples have not been covered at the non exposed surface, meaning that they look both ways, and therefore follow a more realistic pattern of the actual temperature of the exposed steel facing.
Scale The scale, that will be used for determining the weight of the sample as well in the mass-loss experiment as in the LFL experiment, is a Mettler Toledo PB3001 produced in 1997. This device has an accuracy of 0.1 gram. Starting at 5 grams and a maximum weight of 3100 grams.
Heat transfer analyzerThe Isomet Heat Transfer Analyzer, will be used to determine the actual thermal conductivity of the insulation materials. Samples exposed to 350 degrees Celsius will also be analyzed on the area that is visibly influenced by the heats source after the test, regarding the 1,5 cm offset from the sides of the sample.
Vernier caliperThis device has been used to measure the intruding depth of the samples. An exact part of 400 cm² has been exposed directly to the heat source (20*20 cm).The sample needs to be cut in half, the measurement with the vernier caliper will start on the left hands side at the first position that has been exposed. The depth is measured by the stem of the caliper, each 5 cm, till the depth that the core material is deformed and/or discolored.
cm from the right and left had wall. By placing the heating element on this position the sample will be equally exposed to the radiation. The heating element will be connected to a plate-thermocouple that has been placed at the front side of the furnace, just below the surface of the frame in which the sample is placed. This way the temperature at the height of the sample is determined without blocking a part of the sample. This method will improve the speed of switching samples, and the temperature will be measured at the exact same spot during all the tests. The heat element will be controlled through the sheet thermocouple which is attached to the self adjusting temperature controller type West 6100. To calibrate this setup a baseline measurement is necessary. This is done by heating the furnace when it is empty, for the LFL test and when a sample of the tested product is placed. For the Mass-loss test, if a similar RC-value is used to calibrate the furnace. The best result will be achieved.
2.3 Used instruments
In this setup five thermocouples are used of, two different types. Thermocouple K1, K2, and K4 are all standard thermocouples. Thermocouple K3 and K5 are both modified to a plate thermocouple, so they can monitor the surface temperature of the sample, which is expected to diver from the air temperature, due to the chosen heat source. Besides differences in temperature, the plate-thermocouples are expected to have a longer reaction time and they will therefore give a more stable temperature reproduction.
All thermocouples (K1, K2, K3, K4) except for K5 are linked to a data logger (squirrel data logger Grant 2010 series). Thermocouple K5 is linked to the temperature controller (West 6001) together with the dimmer pack dmx152X.
Thermocouples: - Thermocouple K1: Standard thermocouple type K, positioned at a height of 25 cm, 3.5 cm off set from (right-hand wall) and 10 cm entering the furnace.
- Thermocouple K2: Standard thermocouple type K, positioned at a height of 49 cm, 15 cm off set from the right- had wall and 4 cm entering the furnace.
- Thermocouple K3: Plate-thermocouple type K brazed on a thin metal sheet (3*3 cm). Positioned at the height of 30 cm, 15 cm off set from the right-hand wall and 1 cm from the front wall. The distance between the heating element and the thermocouple is 24 cm.
23Ing. A.W. Giunta d’Albani
250
490
110
600
100
35
100 150 150 100600100 100
350
490
110
600
100
100 285 100600100 100
K3
K2
K1
K2
K1
350
600
100
100 500600100 100
250
K3
100 150 150 100
K425
0
K3
K1
K2
300100 100
260100 10040100 150 150 100
300
100
100
265
100
100
3510
020
010
010
0
A
B
C
D
Side A
Side C
Section 1-1
1
1
K2
K1
350
600
100
250
250
490
110
260100 10040100 150 150 100
300100 100
2 2
Section 2-2
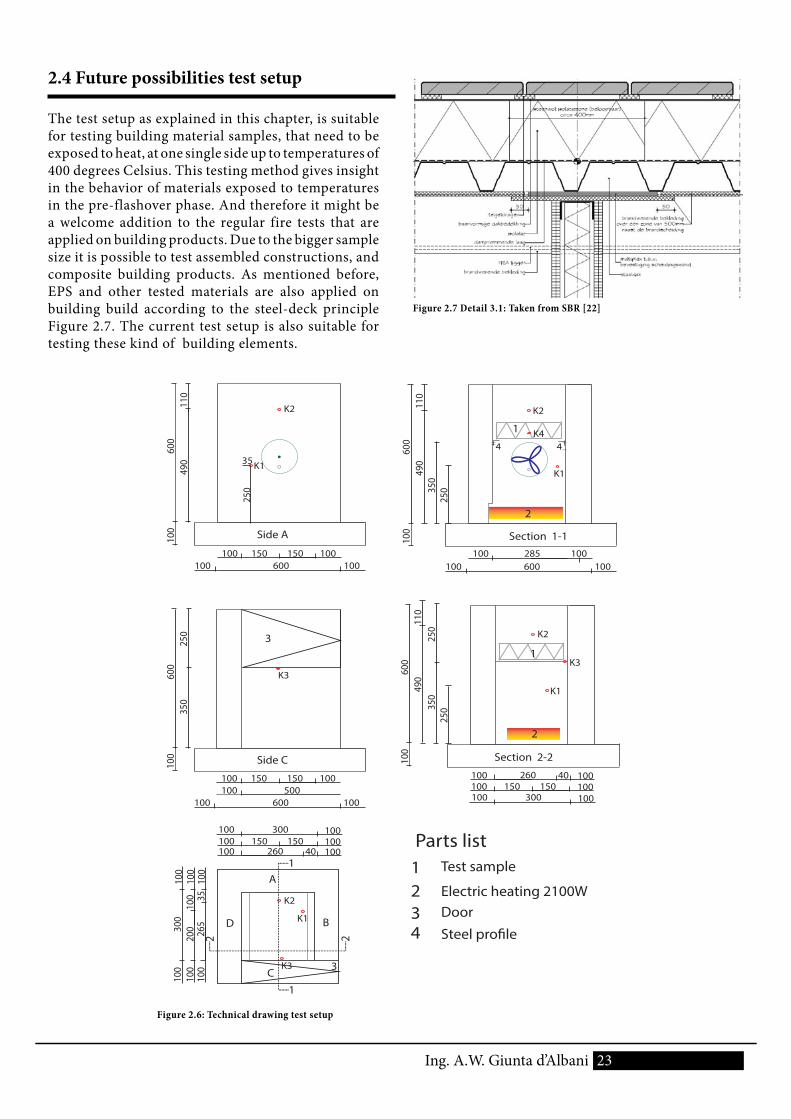
Test sample
Electric heating 2100W
1234
Door
Steel profile
Parts list
2
2
3
3
4 4
1
1
Figure 2.6: Technical drawing test setup
2.4 Future possibilities test setup
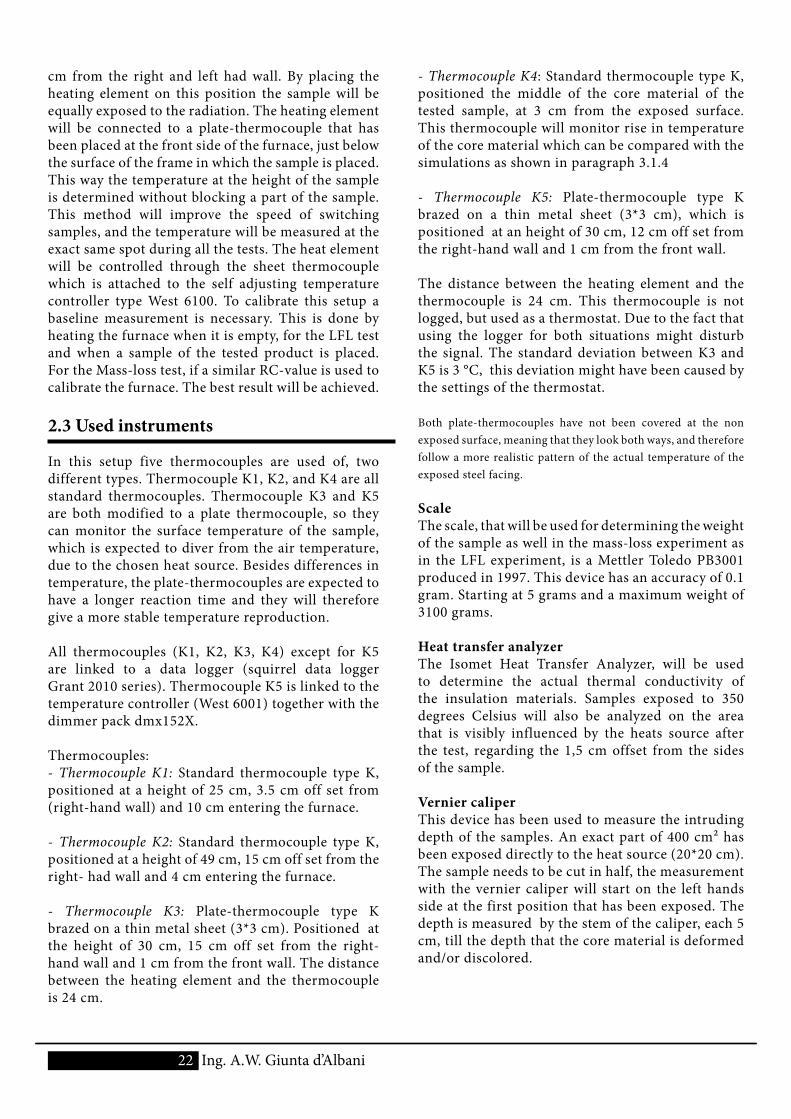
The test setup as explained in this chapter, is suitable for testing building material samples, that need to be exposed to heat, at one single side up to temperatures of 400 degrees Celsius. This testing method gives insight in the behavior of materials exposed to temperatures in the pre-flashover phase. And therefore it might be a welcome addition to the regular fire tests that are applied on building products. Due to the bigger sample size it is possible to test assembled constructions, and composite building products. As mentioned before, EPS and other tested materials are also applied on building build according to the steel-deck principle Figure 2.7. The current test setup is also suitable for testing these kind of building elements.
Figure 2.7 Detail 3.1: Taken from SBR [22]
24 Ing. A.W. Giunta d’Albani
2.5 Validation test setup
This section will describe the behavior of the thermocouples of the test setup. During the experiments there will be four thermocouples monitoring temperature. Three different kinds of tests have been done to create insight in the behavior of the test setup, regarding the maximum temperature regulation, and self-regulating functions. All test-runs have been done without sample materials.
2.5.1Test-runs
The first test-run was used to determine the maximum temperature of the furnace, with the current heating element which has a maximum power of 2400 watt. The total running time 2 hours and 23 minutes, with a time interval of 10 sec. during this test the fan has been running a few rotations a minute. The rise of temperature has been examined on the different time intervals while using the full power of the heating element. The time interval from ambient temperature to 150 °C shows an increase of temperature of 3.6 °C each minute. The of 3.1 °C each minute The time interval 250 to 360 has a temperature increase of 1.5 °C. Concluding that the heating process when the heat element is on full power will decrease as the temperature rises.
The heating process as shown belongs to a calibrated temperature controller but in a controlled environment, and a set point of 150°C. The reaction of the plate thermocouples is a bit slower but more stable than the normal thermocouples, as expected. During test run 8 the heating process from ambient temperature to a stable temperature of 250 °C was logged this stable temperature is reached after 80 minutes. During this test the same response of the thermocouples and the self-controlling thermostat has been noticed.Using this self-controlling thermostat it is possible to create very stable temperatures on the exact desired temperatures.
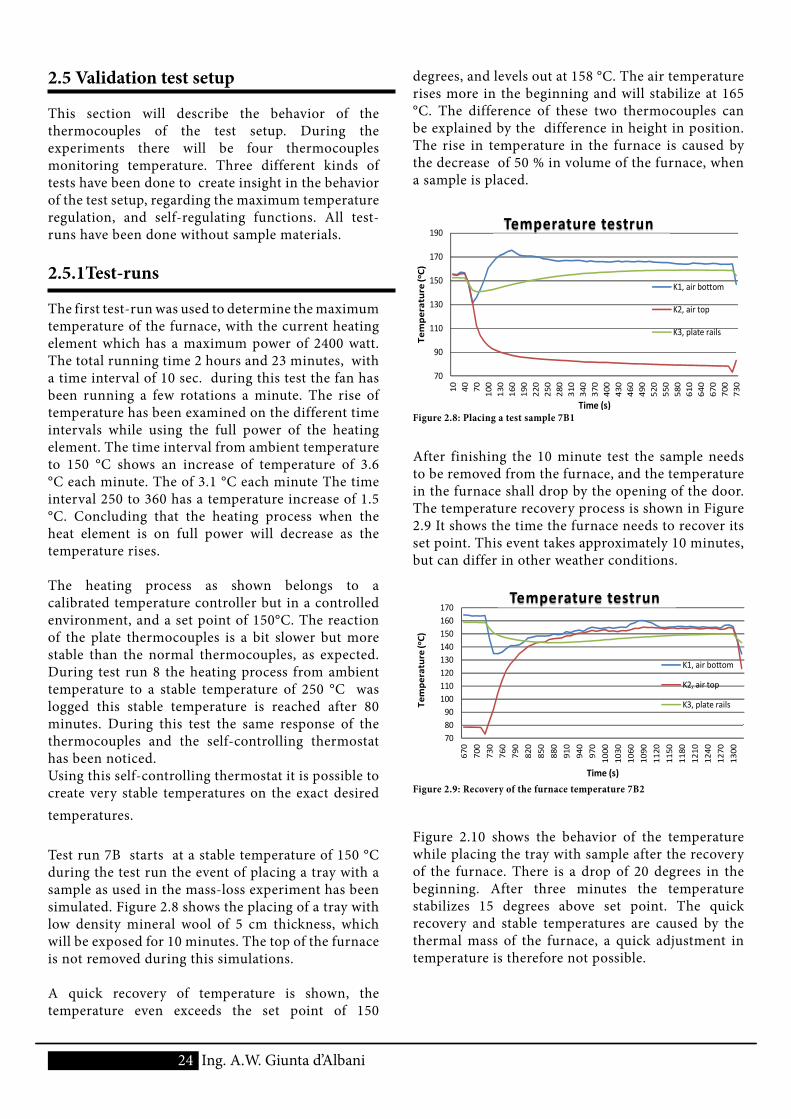
Test run 7B starts at a stable temperature of 150 °C during the test run the event of placing a tray with a sample as used in the mass-loss experiment has been simulated. Figure 2.8 shows the placing of a tray with low density mineral wool of 5 cm thickness, which will be exposed for 10 minutes. The top of the furnace is not removed during this simulations.
A quick recovery of temperature is shown, the temperature even exceeds the set point of 150
degrees, and levels out at 158 °C. The air temperature rises more in the beginning and will stabilize at 165 °C. The difference of these two thermocouples can be explained by the difference in height in position. The rise in temperature in the furnace is caused by the decrease of 50 % in volume of the furnace, when a sample is placed.
70
90
110
130
150
170
190
10 40 70 100
130
160
190
220
250
280
310
340
370
400
430
460
490
520
550
580
610
640
670
700
730
Tempe
rature (oC)
Time (s)
Temperature testrun
K1, air bottom
K2, air top
K3, plate rails
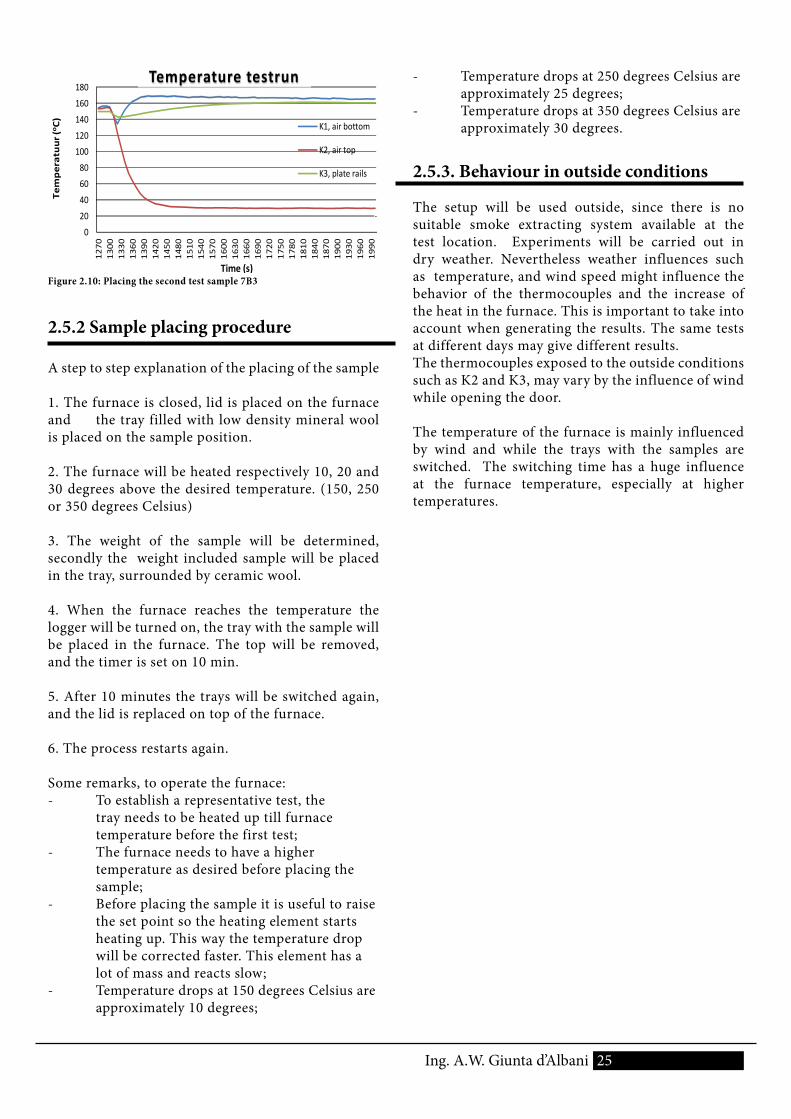
After finishing the 10 minute test the sample needs to be removed from the furnace, and the temperature in the furnace shall drop by the opening of the door. The temperature recovery process is shown in Figure 2.9 It shows the time the furnace needs to recover its set point. This event takes approximately 10 minutes, but can differ in other weather conditions.
708090
100110120130140150160170
670
700
730
760
790
820
850
880
910
940
970
1000
1030
1060
1090
1120
1150
1180
1210
1240
1270
1300
Tempe
rature (oC)
Time (s)
Temperature testrun
K1, air bottom
K2, air top
K3, plate rails
Figure 2.10 shows the behavior of the temperature while placing the tray with sample after the recovery of the furnace. There is a drop of 20 degrees in the beginning. After three minutes the temperature stabilizes 15 degrees above set point. The quick recovery and stable temperatures are caused by the thermal mass of the furnace, a quick adjustment in temperature is therefore not possible.
Figure 2.8: Placing a test sample 7B1
Figure 2.9: Recovery of the furnace temperature 7B2
25Ing. A.W. Giunta d’Albani
020406080
100120140160180
1270
1300
1330
1360
1390
1420
1450
1480
1510
1540
1570
1600
1630
1660
1690
1720
1750
1780
1810
1840
1870
1900
1930
1960
1990
Temperatuur (oC)
Time (s)
Temperature testrun
K1, air bottom
K2, air top
K3, plate rails
2.5.2 Sample placing procedure
A step to step explanation of the placing of the sample
1. The furnace is closed, lid is placed on the furnace and the tray filled with low density mineral wool is placed on the sample position.
2. The furnace will be heated respectively 10, 20 and 30 degrees above the desired temperature. (150, 250 or 350 degrees Celsius)
3. The weight of the sample will be determined, secondly the weight included sample will be placed in the tray, surrounded by ceramic wool.
4. When the furnace reaches the temperature the logger will be turned on, the tray with the sample will be placed in the furnace. The top will be removed, and the timer is set on 10 min.
5. After 10 minutes the trays will be switched again, and the lid is replaced on top of the furnace.
6. The process restarts again.
Some remarks, to operate the furnace:- To establish a representative test, the tray needs to be heated up till furnace temperature before the first test;- The furnace needs to have a higher temperature as desired before placing the sample;- Before placing the sample it is useful to raise the set point so the heating element starts heating up. This way the temperature drop will be corrected faster. This element has a lot of mass and reacts slow;- Temperature drops at 150 degrees Celsius are approximately 10 degrees;
- Temperature drops at 250 degrees Celsius are approximately 25 degrees;- Temperature drops at 350 degrees Celsius are approximately 30 degrees.
2.5.3. Behaviour in outside conditions
The setup will be used outside, since there is no suitable smoke extracting system available at the test location. Experiments will be carried out in dry weather. Nevertheless weather influences such as temperature, and wind speed might influence the behavior of the thermocouples and the increase of the heat in the furnace. This is important to take into account when generating the results. The same tests at different days may give different results.The thermocouples exposed to the outside conditions such as K2 and K3, may vary by the influence of wind while opening the door.
The temperature of the furnace is mainly influenced by wind and while the trays with the samples are switched. The switching time has a huge influence at the furnace temperature, especially at higher temperatures.
Figure 2.10: Placing the second test sample 7B3
26 Ing. A.W. Giunta d’Albani
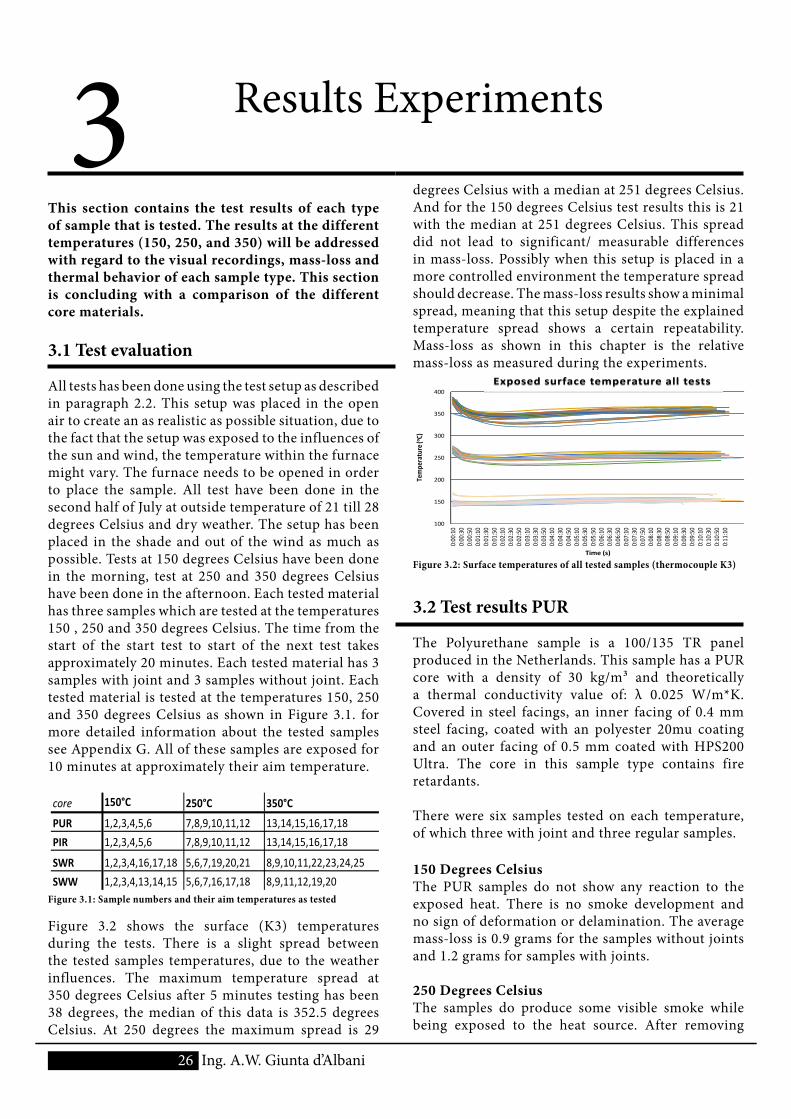
degrees Celsius with a median at 251 degrees Celsius. And for the 150 degrees Celsius test results this is 21 with the median at 251 degrees Celsius. This spread did not lead to significant/ measurable differences in mass-loss. Possibly when this setup is placed in a more controlled environment the temperature spread should decrease. The mass-loss results show a minimal spread, meaning that this setup despite the explained temperature spread shows a certain repeatability. Mass-loss as shown in this chapter is the relative mass-loss as measured during the experiments.
100
150
200
250
300
350
400
0:00
:10
0:00
:30
0:00
:50
0:01
:10
0:01
:30
0:01
:50
0:02
:10
0:02
:30
0:02
:50
0:03
:10
0:03
:30
0:03
:50
0:04
:10
0:04
:30
0:04
:50
0:05
:10
0:05
:30
0:05
:50
0:06
:10
0:06
:30
0:06
:50
0:07
:10
0:07
:30
0:07
:50
0:08
:10
0:08
:30
0:08
:50
0:09
:10
0:09
:30
0:09
:50
0:10
:10
0:10
:30
0:10
:50
0:11
:10
Tempe
rature (oC)
Time (s)
Exposed surface temperature all tests
Figure 3.2: Surface temperatures of all tested samples (thermocouple K3)
3.2 Test results PUR
The Polyurethane sample is a 100/135 TR panel produced in the Netherlands. This sample has a PUR core with a density of 30 kg/m³ and theoretically a thermal conductivity value of: λ 0.025 W/m*K. Covered in steel facings, an inner facing of 0.4 mm steel facing, coated with an polyester 20mu coating and an outer facing of 0.5 mm coated with HPS200 Ultra. The core in this sample type contains fire retardants.
There were six samples tested on each temperature, of which three with joint and three regular samples.
150 Degrees CelsiusThe PUR samples do not show any reaction to the exposed heat. There is no smoke development and no sign of deformation or delamination. The average mass-loss is 0.9 grams for the samples without joints and 1.2 grams for samples with joints.
250 Degrees CelsiusThe samples do produce some visible smoke while being exposed to the heat source. After removing
3 Results Experiments
This section contains the test results of each type of sample that is tested. The results at the different temperatures (150, 250, and 350) will be addressed with regard to the visual recordings, mass-loss and thermal behavior of each sample type. This section is concluding with a comparison of the different core materials.
3.1 Test evaluation
All tests has been done using the test setup as described in paragraph 2.2. This setup was placed in the open air to create an as realistic as possible situation, due to the fact that the setup was exposed to the influences of the sun and wind, the temperature within the furnace might vary. The furnace needs to be opened in order to place the sample. All test have been done in the second half of July at outside temperature of 21 till 28 degrees Celsius and dry weather. The setup has been placed in the shade and out of the wind as much as possible. Tests at 150 degrees Celsius have been done in the morning, test at 250 and 350 degrees Celsius have been done in the afternoon. Each tested material has three samples which are tested at the temperatures 150 , 250 and 350 degrees Celsius. The time from the start of the start test to start of the next test takes approximately 20 minutes. Each tested material has 3 samples with joint and 3 samples without joint. Each tested material is tested at the temperatures 150, 250 and 350 degrees Celsius as shown in Figure 3.1. for more detailed information about the tested samples see Appendix G. All of these samples are exposed for 10 minutes at approximately their aim temperature.
core 150°C 250°C 350°C
PUR 1,2,3,4,5,6 7,8,9,10,11,12 13,14,15,16,17,18PIR 1,2,3,4,5,6 7,8,9,10,11,12 13,14,15,16,17,18
SWR 1,2,3,4,16,17,18 5,6,7,19,20,21 8,9,10,11,22,23,24,25SWW 1,2,3,4,13,14,15 5,6,7,16,17,18 8,9,11,12,19,20
Figure 3.1: Sample numbers and their aim temperatures as tested
Figure 3.2 shows the surface (K3) temperatures during the tests. There is a slight spread between the tested samples temperatures, due to the weather influences. The maximum temperature spread at 350 degrees Celsius after 5 minutes testing has been 38 degrees, the median of this data is 352.5 degrees Celsius. At 250 degrees the maximum spread is 29
27Ing. A.W. Giunta d’Albani
AnalysisFigure 3.5 shows the mass-loss related to the average temperature to which the sample has been exposed during the 10 minutes. The mass-loss of PUR sandwich panels can be seen as an exponential process.
0
5
10
15
20
25
100 150 200 250 300 350 400
Mas
s-lo
ss (g
)
Temperature(OC)
Mass-loss PUR panels
PUR 350PUR 350 with jointPUR 250PUR 250 with jointPUR 150PUR 150 with joint
Figure 3.5: Mass-loss graph PUR samples
The depth on which the material is degraded by exposure to the heat source, is measured for the samples tested on 250 and 350 degrees. All samples follow a similar profile after been exposed as shown in Figure 3.6 The first 2,5 cm from the sides of the sample have not been exposed to the heat source. The intrusion depth has been measured over the 20 cm of exposed surface on five points with a 5 cm distance.
Figure 3.6: Exposure pattern PUR sample
The samples with joints show further intrusion of the temperature into the core material, this is caused by the steel facings that are bent back into the core. Resulting in more conductive heat into the sample at the joints.
0,0
0,5
1,0
1,5
2,0
2,5
3,0
100 150 200 250 300 350 400
Dept
h (cm
)
Temperature (OC)
Depth of exposed PUR material
PUR 250 with joint
PUR 250
PUR 350 with joint
PUR 350
Pur 150
Figure 3.7: Depth of exposed material graph PUR
The thermal conductivity of an untested sample has been measured by the Isomet heat transfer analyzer and is 0.0328 W/m*k. The thermal conductivity of the samples tested at 150 and 250 degrees Celsius is similar to the untested sample, since the core material
the sample from the tray there is a small amount of smoke visible. There is delamination on the sides visible. The sample clearly shows the influence of the temperature on the core material (Figure 3.3). There is a clear discoloration of the foam. The paint used on the inside facings has lost its gloss but it is still white. The average mass-loss of the samples without joints is 3 grams and 3.3 grams for samples with joints.
Figure 3.3: Surface temperatures of all tested samples
285 Degrees CelsiusTwo tests are performed at 285 degrees Celsius, after been exposed to this temperature for 10 minutes the inner facing has been removed. The core material showed signs of thermoplastic behavior, and the mass-loss of both panels is (5.9 and 6.1 gram)
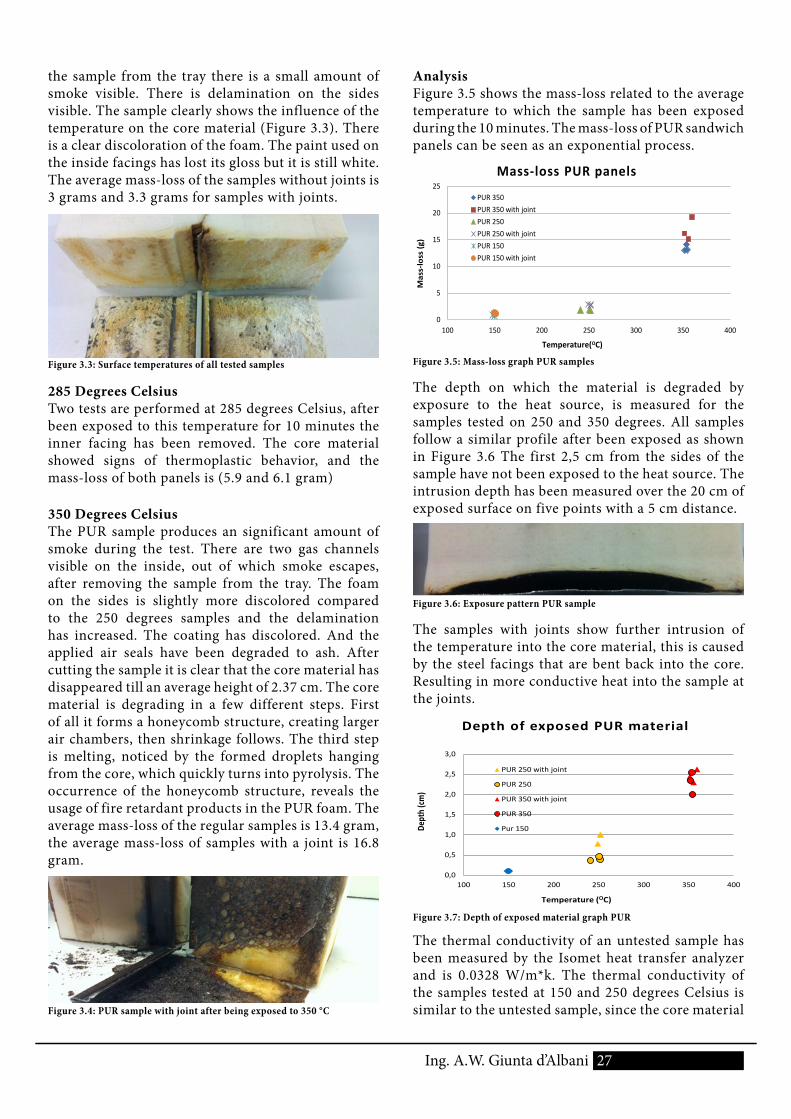
350 Degrees CelsiusThe PUR sample produces an significant amount of smoke during the test. There are two gas channels visible on the inside, out of which smoke escapes, after removing the sample from the tray. The foam on the sides is slightly more discolored compared to the 250 degrees samples and the delamination has increased. The coating has discolored. And the applied air seals have been degraded to ash. After cutting the sample it is clear that the core material has disappeared till an average height of 2.37 cm. The core material is degrading in a few different steps. First of all it forms a honeycomb structure, creating larger air chambers, then shrinkage follows. The third step is melting, noticed by the formed droplets hanging from the core, which quickly turns into pyrolysis. The occurrence of the honeycomb structure, reveals the usage of fire retardant products in the PUR foam. The average mass-loss of the regular samples is 13.4 gram, the average mass-loss of samples with a joint is 16.8 gram.
Figure 3.4: PUR sample with joint after being exposed to 350 °C
28 Ing. A.W. Giunta d’Albani
did not react to the exposed heat. Samples tested at 350 degrees Celsius cannot be measured since the influenced core material has pyrolysed.
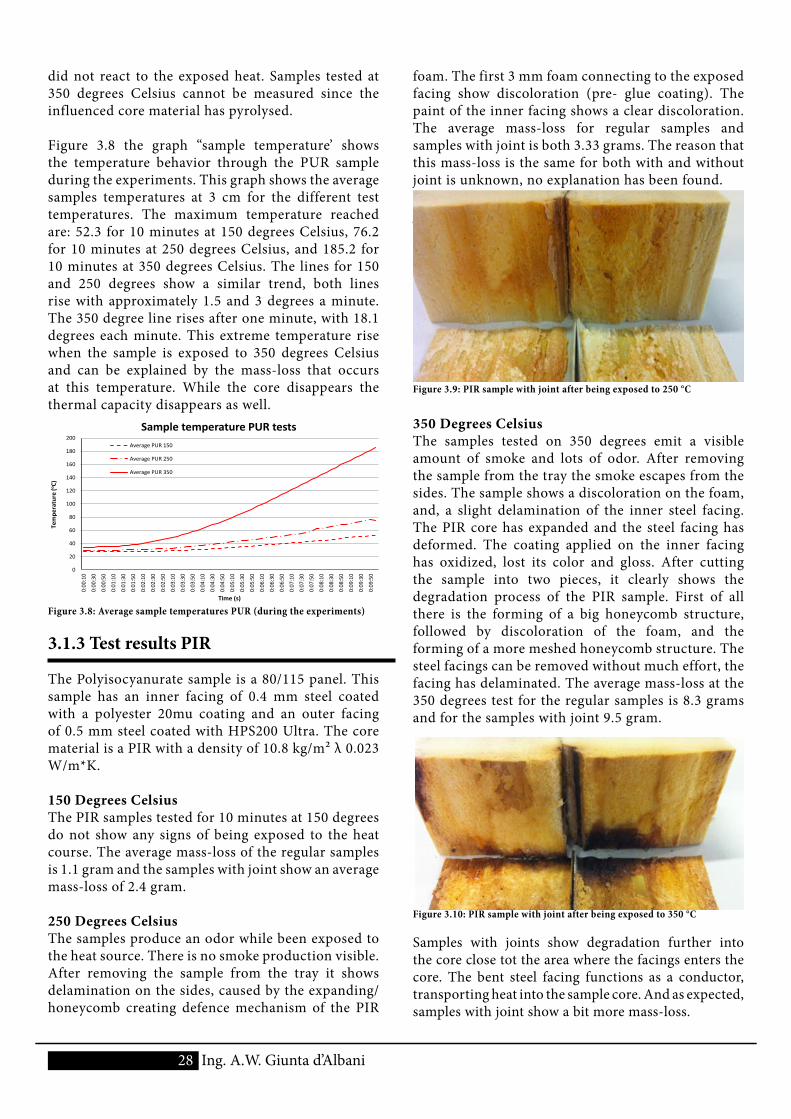
Figure 3.8 the graph “sample temperature’ shows the temperature behavior through the PUR sample during the experiments. This graph shows the average samples temperatures at 3 cm for the different test temperatures. The maximum temperature reached are: 52.3 for 10 minutes at 150 degrees Celsius, 76.2 for 10 minutes at 250 degrees Celsius, and 185.2 for 10 minutes at 350 degrees Celsius. The lines for 150 and 250 degrees show a similar trend, both lines rise with approximately 1.5 and 3 degrees a minute. The 350 degree line rises after one minute, with 18.1 degrees each minute. This extreme temperature rise when the sample is exposed to 350 degrees Celsius and can be explained by the mass-loss that occurs at this temperature. While the core disappears the thermal capacity disappears as well.
0
20
40
60
80
100
120
140
160
180
200
0:00
:10
0:00
:30
0:00
:50
0:01
:10
0:01
:30
0:01
:50
0:02
:10
0:02
:30
0:02
:50
0:03
:10
0:03
:30
0:03
:50
0:04
:10
0:04
:30
0:04
:50
0:05
:10
0:05
:30
0:05
:50
0:06
:10
0:06
:30
0:06
:50
0:07
:10
0:07
:30
0:07
:50
0:08
:10
0:08
:30
0:08
:50
0:09
:10
0:09
:30
0:09
:50
Tem
pera
ture
(o C)
Time (s)
Sample temperature PUR tests Average PUR 150
Average PUR 250
Average PUR 350
Figure 3.8: Average sample temperatures PUR (during the experiments)
3.1.3 Test results PIR
The Polyisocyanurate sample is a 80/115 panel. This sample has an inner facing of 0.4 mm steel coated with a polyester 20mu coating and an outer facing of 0.5 mm steel coated with HPS200 Ultra. The core material is a PIR with a density of 10.8 kg/m² λ 0.023 W/m*K.
150 Degrees CelsiusThe PIR samples tested for 10 minutes at 150 degrees do not show any signs of being exposed to the heat course. The average mass-loss of the regular samples is 1.1 gram and the samples with joint show an average mass-loss of 2.4 gram.
250 Degrees CelsiusThe samples produce an odor while been exposed to the heat source. There is no smoke production visible. After removing the sample from the tray it shows delamination on the sides, caused by the expanding/ honeycomb creating defence mechanism of the PIR
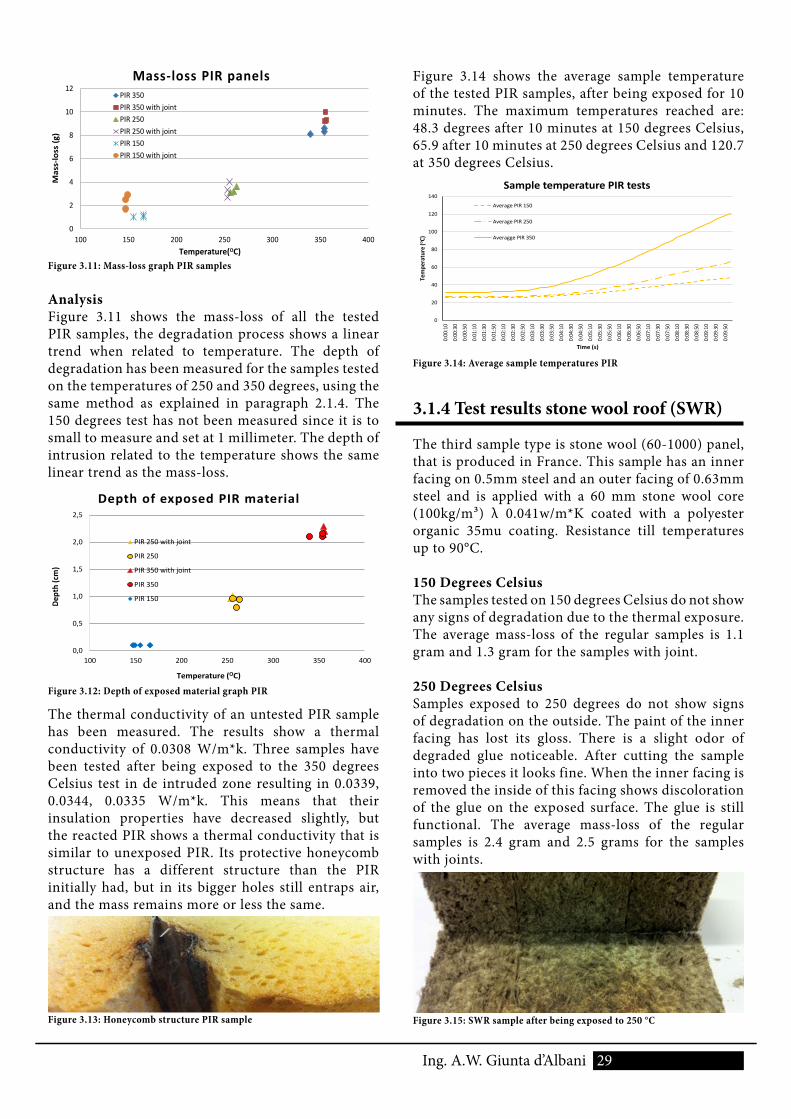
foam. The first 3 mm foam connecting to the exposed facing show discoloration (pre- glue coating). The paint of the inner facing shows a clear discoloration. The average mass-loss for regular samples and samples with joint is both 3.33 grams. The reason that this mass-loss is the same for both with and without joint is unknown, no explanation has been found.average mass-loss of the regular and samples with joint is both 3.3 grams
Figure 3.9: PIR sample with joint after being exposed to 250 °C
350 Degrees CelsiusThe samples tested on 350 degrees emit a visible amount of smoke and lots of odor. After removing the sample from the tray the smoke escapes from the sides. The sample shows a discoloration on the foam, and, a slight delamination of the inner steel facing. The PIR core has expanded and the steel facing has deformed. The coating applied on the inner facing has oxidized, lost its color and gloss. After cutting the sample into two pieces, it clearly shows the degradation process of the PIR sample. First of all there is the forming of a big honeycomb structure, followed by discoloration of the foam, and the forming of a more meshed honeycomb structure. The steel facings can be removed without much effort, the facing has delaminated. The average mass-loss at the 350 degrees test for the regular samples is 8.3 grams and for the samples with joint 9.5 gram.
Figure 3.10: PIR sample with joint after being exposed to 350 °C
Samples with joints show degradation further into the core close tot the area where the facings enters the core. The bent steel facing functions as a conductor, transporting heat into the sample core. And as expected, samples with joint show a bit more mass-loss.
29Ing. A.W. Giunta d’Albani
Figure 3.14 shows the average sample temperature of the tested PIR samples, after being exposed for 10 minutes. The maximum temperatures reached are: 48.3 degrees after 10 minutes at 150 degrees Celsius, 65.9 after 10 minutes at 250 degrees Celsius and 120.7 at 350 degrees Celsius.
0
20
40
60
80
100
120
140
0:00
:10
0:00
:30
0:00
:50
0:01
:10
0:01
:30
0:01
:50
0:02
:10
0:02
:30
0:02
:50
0:03
:10
0:03
:30
0:03
:50
0:04
:10
0:04
:30
0:04
:50
0:05
:10
0:05
:30
0:05
:50
0:06
:10
0:06
:30
0:06
:50
0:07
:10
0:07
:30
0:07
:50
0:08
:10
0:08
:30
0:08
:50
0:09
:10
0:09
:30
0:09
:50
Tem
pera
ture
(o C)
Time (s)
Sample temperature PIR tests
Average PIR 150
Average PIR 250
Averagge PIR 350
Figure 3.14: Average sample temperatures PIR
3.1.4 Test results stone wool roof (SWR)
The third sample type is stone wool (60-1000) panel, that is produced in France. This sample has an inner facing on 0.5mm steel and an outer facing of 0.63mm steel and is applied with a 60 mm stone wool core (100kg/m³) λ 0.041w/m*K coated with a polyester organic 35mu coating. Resistance till temperatures up to 90°C.
150 Degrees CelsiusThe samples tested on 150 degrees Celsius do not show any signs of degradation due to the thermal exposure. The average mass-loss of the regular samples is 1.1 gram and 1.3 gram for the samples with joint.
250 Degrees CelsiusSamples exposed to 250 degrees do not show signs of degradation on the outside. The paint of the inner facing has lost its gloss. There is a slight odor of degraded glue noticeable. After cutting the sample into two pieces it looks fine. When the inner facing is removed the inside of this facing shows discoloration of the glue on the exposed surface. The glue is still functional. The average mass-loss of the regular samples is 2.4 gram and 2.5 grams for the samples with joints.
Figure 3.15: SWR sample after being exposed to 250 °C
0
2
4
6
8
10
12
100 150 200 250 300 350 400
Mas
s-lo
ss (g
)
Temperature(OC)
Mass-loss PIR panels PIR 350PIR 350 with jointPIR 250PIR 250 with jointPIR 150PIR 150 with joint
Figure 3.11: Mass-loss graph PIR samples
AnalysisFigure 3.11 shows the mass-loss of all the tested PIR samples, the degradation process shows a linear trend when related to temperature. The depth of degradation has been measured for the samples tested on the temperatures of 250 and 350 degrees, using the same method as explained in paragraph 2.1.4. The 150 degrees test has not been measured since it is to small to measure and set at 1 millimeter. The depth of intrusion related to the temperature shows the same linear trend as the mass-loss.
0,0
0,5
1,0
1,5
2,0
2,5
100 150 200 250 300 350 400
Dept
h (c
m)
Temperature (OC)
Depth of exposed PIR material
PIR 250 with joint
PIR 250
PIR 350 with joint
PIR 350
PIR 150
Figure 3.12: Depth of exposed material graph PIR
The thermal conductivity of an untested PIR sample has been measured. The results show a thermal conductivity of 0.0308 W/m*k. Three samples have been tested after being exposed to the 350 degrees Celsius test in de intruded zone resulting in 0.0339, 0.0344, 0.0335 W/m*k. This means that their insulation properties have decreased slightly, but the reacted PIR shows a thermal conductivity that is similar to unexposed PIR. Its protective honeycomb structure has a different structure than the PIR initially had, but in its bigger holes still entraps air, and the mass remains more or less the same.
Figure 3.13: Honeycomb structure PIR sample
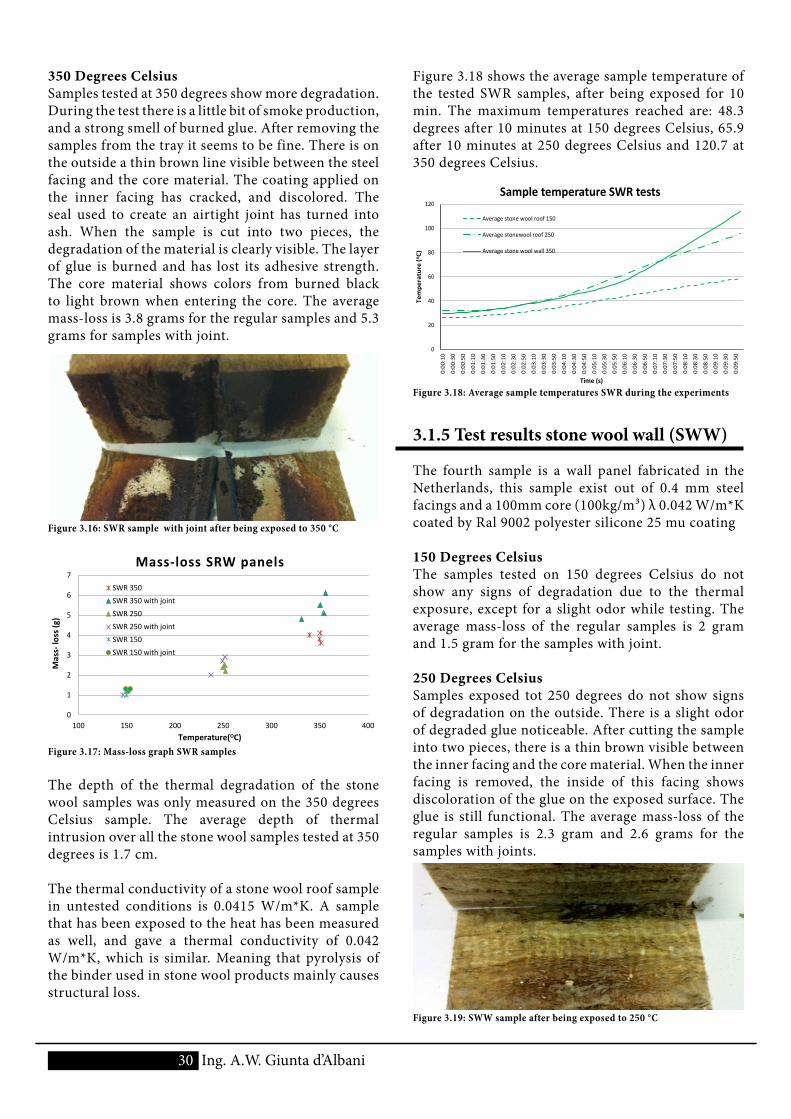
30 Ing. A.W. Giunta d’Albani
350 Degrees Celsius Samples tested at 350 degrees show more degradation. During the test there is a little bit of smoke production, and a strong smell of burned glue. After removing the samples from the tray it seems to be fine. There is on the outside a thin brown line visible between the steel facing and the core material. The coating applied on the inner facing has cracked, and discolored. The seal used to create an airtight joint has turned into ash. When the sample is cut into two pieces, the degradation of the material is clearly visible. The layer of glue is burned and has lost its adhesive strength. The core material shows colors from burned black to light brown when entering the core. The average mass-loss is 3.8 grams for the regular samples and 5.3 grams for samples with joint.
Figure 3.16: SWR sample with joint after being exposed to 350 °C
0
1
2
3
4
5
6
7
100 150 200 250 300 350 400
Mas
s- lo
ss (g
)
Temperature(OC)
Mass-loss SRW panels
SWR 350SWR 350 with jointSWR 250SWR 250 with jointSWR 150SWR 150 with joint
Figure 3.17: Mass-loss graph SWR samples
The depth of the thermal degradation of the stone wool samples was only measured on the 350 degrees Celsius sample. The average depth of thermal intrusion over all the stone wool samples tested at 350 degrees is 1.7 cm.
The thermal conductivity of a stone wool roof sample in untested conditions is 0.0415 W/m*K. A sample that has been exposed to the heat has been measured as well, and gave a thermal conductivity of 0.042 W/m*K, which is similar. Meaning that pyrolysis of the binder used in stone wool products mainly causes structural loss.
Figure 3.18 shows the average sample temperature of the tested SWR samples, after being exposed for 10 min. The maximum temperatures reached are: 48.3 degrees after 10 minutes at 150 degrees Celsius, 65.9 after 10 minutes at 250 degrees Celsius and 120.7 at 350 degrees Celsius.
0
20
40
60
80
100
120
0:00
:10
0:00
:30
0:00
:50
0:01
:10
0:01
:30
0:01
:50
0:02
:10
0:02
:30
0:02
:50
0:03
:10
0:03
:30
0:03
:50
0:04
:10
0:04
:30
0:04
:50
0:05
:10
0:05
:30
0:05
:50
0:06
:10
0:06
:30
0:06
:50
0:07
:10
0:07
:30
0:07
:50
0:08
:10
0:08
:30
0:08
:50
0:09
:10
0:09
:30
0:09
:50
Tem
pera
ture
(o C)
Time (s)
Sample temperature SWR tests
Average stone wool roof 150
Average stonewool roof 250
Average stone wool wall 350
Figure 3.18: Average sample temperatures SWR during the experiments
3.1.5 Test results stone wool wall (SWW)
The fourth sample is a wall panel fabricated in the Netherlands, this sample exist out of 0.4 mm steel facings and a 100mm core (100kg/m³) λ 0.042 W/m*K coated by Ral 9002 polyester silicone 25 mu coating
150 Degrees CelsiusThe samples tested on 150 degrees Celsius do not show any signs of degradation due to the thermal exposure, except for a slight odor while testing. The average mass-loss of the regular samples is 2 gram and 1.5 gram for the samples with joint.
250 Degrees CelsiusSamples exposed tot 250 degrees do not show signs of degradation on the outside. There is a slight odor of degraded glue noticeable. After cutting the sample into two pieces, there is a thin brown visible between the inner facing and the core material. When the inner facing is removed, the inside of this facing shows discoloration of the glue on the exposed surface. The glue is still functional. The average mass-loss of the regular samples is 2.3 gram and 2.6 grams for the samples with joints.
Figure 3.19: SWW sample after being exposed to 250 °C
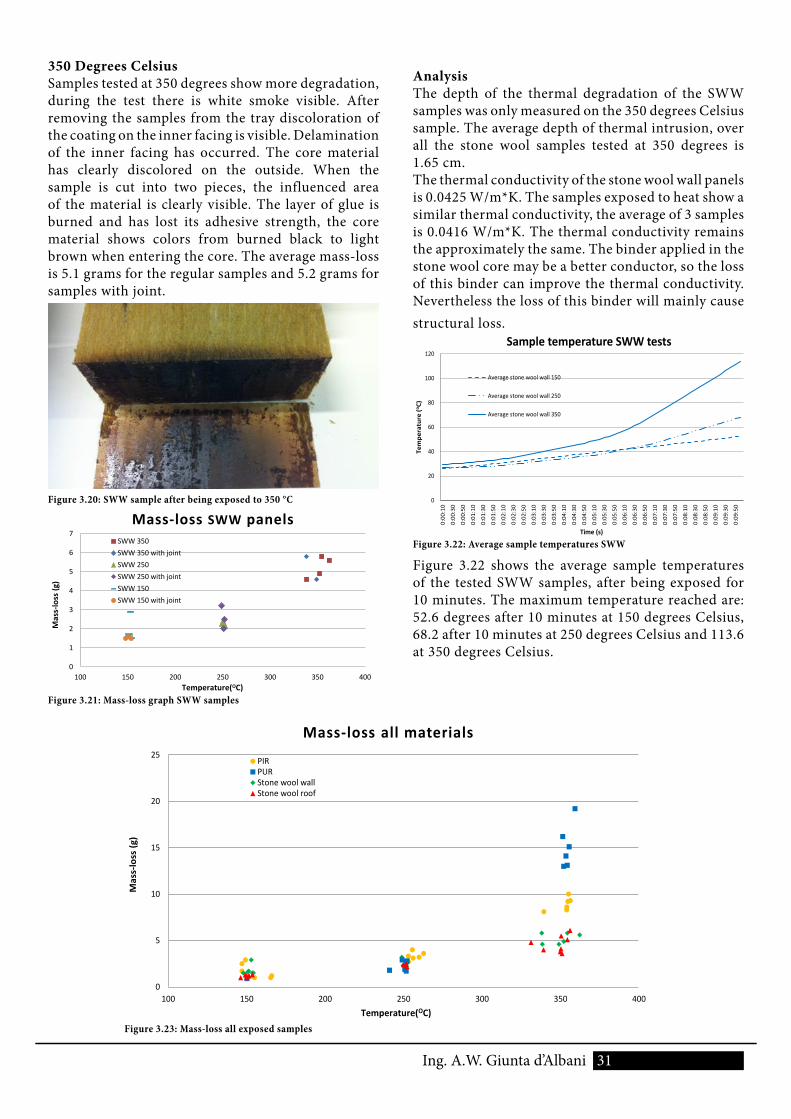
31Ing. A.W. Giunta d’Albani
AnalysisThe depth of the thermal degradation of the SWW samples was only measured on the 350 degrees Celsius sample. The average depth of thermal intrusion, over all the stone wool samples tested at 350 degrees is 1.65 cm.The thermal conductivity of the stone wool wall panels is 0.0425 W/m*K. The samples exposed to heat show a similar thermal conductivity, the average of 3 samples is 0.0416 W/m*K. The thermal conductivity remains the approximately the same. The binder applied in the stone wool core may be a better conductor, so the loss of this binder can improve the thermal conductivity. Nevertheless the loss of this binder will mainly cause structural loss.
0
20
40
60
80
100
120
0:00
:10
0:00
:30
0:00
:50
0:01
:10
0:01
:30
0:01
:50
0:02
:10
0:02
:30
0:02
:50
0:03
:10
0:03
:30
0:03
:50
0:04
:10
0:04
:30
0:04
:50
0:05
:10
0:05
:30
0:05
:50
0:06
:10
0:06
:30
0:06
:50
0:07
:10
0:07
:30
0:07
:50
0:08
:10
0:08
:30
0:08
:50
0:09
:10
0:09
:30
0:09
:50
Tem
pera
ture
(o C)
Time (s)
Sample temperature SWW tests
Average stone wool wall 150
Average stone wool wall 250
Average stone wool wall 350
Figure 3.22: Average sample temperatures SWW
Figure 3.22 shows the average sample temperatures of the tested SWW samples, after being exposed for 10 minutes. The maximum temperature reached are: 52.6 degrees after 10 minutes at 150 degrees Celsius, 68.2 after 10 minutes at 250 degrees Celsius and 113.6 at 350 degrees Celsius.
350 Degrees CelsiusSamples tested at 350 degrees show more degradation, during the test there is white smoke visible. After removing the samples from the tray discoloration of the coating on the inner facing is visible. Delamination of the inner facing has occurred. The core material has clearly discolored on the outside. When the sample is cut into two pieces, the influenced area of the material is clearly visible. The layer of glue is burned and has lost its adhesive strength, the core material shows colors from burned black to light brown when entering the core. The average mass-loss is 5.1 grams for the regular samples and 5.2 grams for samples with joint.
Figure 3.20: SWW sample after being exposed to 350 °C
0
1
2
3
4
5
6
7
100 150 200 250 300 350 400
Mas
s-lo
ss (g
)
Temperature(OC)
Mass-loss SWW panels SWW 350SWW 350 with jointSWW 250SWW 250 with jointSWW 150SWW 150 with joint
Figure 3.21: Mass-loss graph SWW samples
0
5
10
15
20
25
100 150 200 250 300 350 400
Mas
s-lo
ss (g
)
Temperature(OC)
Mass-loss all materials PIRPURStone wool wallStone wool roof
Figure 3.23: Mass-loss all exposed samples
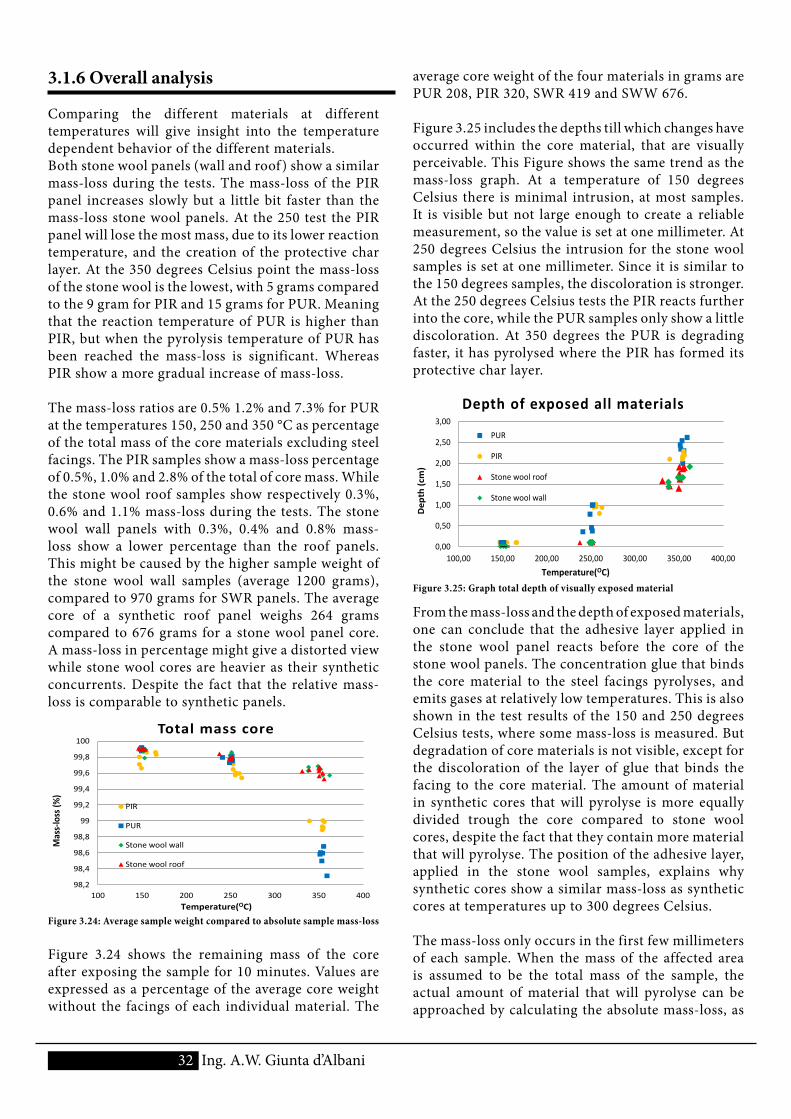
32 Ing. A.W. Giunta d’Albani
average core weight of the four materials in grams are PUR 208, PIR 320, SWR 419 and SWW 676.
Figure 3.25 includes the depths till which changes have occurred within the core material, that are visually perceivable. This Figure shows the same trend as the mass-loss graph. At a temperature of 150 degrees Celsius there is minimal intrusion, at most samples. It is visible but not large enough to create a reliable measurement, so the value is set at one millimeter. At 250 degrees Celsius the intrusion for the stone wool samples is set at one millimeter. Since it is similar to the 150 degrees samples, the discoloration is stronger. At the 250 degrees Celsius tests the PIR reacts further into the core, while the PUR samples only show a little discoloration. At 350 degrees the PUR is degrading faster, it has pyrolysed where the PIR has formed its protective char layer.
0,00
0,50
1,00
1,50
2,00
2,50
3,00
100,00 150,00 200,00 250,00 300,00 350,00 400,00
Dep
th (c
m)
Temperature(OC)
Depth of exposed all materials
PUR
PIR
Stone wool roof
Stone wool wall
Figure 3.25: Graph total depth of visually exposed material
From the mass-loss and the depth of exposed materials, one can conclude that the adhesive layer applied in the stone wool panel reacts before the core of the stone wool panels. The concentration glue that binds the core material to the steel facings pyrolyses, and emits gases at relatively low temperatures. This is also shown in the test results of the 150 and 250 degrees Celsius tests, where some mass-loss is measured. But degradation of core materials is not visible, except for the discoloration of the layer of glue that binds the facing to the core material. The amount of material in synthetic cores that will pyrolyse is more equally divided trough the core compared to stone wool cores, despite the fact that they contain more material that will pyrolyse. The position of the adhesive layer, applied in the stone wool samples, explains why synthetic cores show a similar mass-loss as synthetic cores at temperatures up to 300 degrees Celsius.
The mass-loss only occurs in the first few millimeters of each sample. When the mass of the affected area is assumed to be the total mass of the sample, the actual amount of material that will pyrolyse can be approached by calculating the absolute mass-loss, as
3.1.6 Overall analysis
Comparing the different materials at different temperatures will give insight into the temperature dependent behavior of the different materials.Both stone wool panels (wall and roof) show a similar mass-loss during the tests. The mass-loss of the PIR panel increases slowly but a little bit faster than the mass-loss stone wool panels. At the 250 test the PIR panel will lose the most mass, due to its lower reaction temperature, and the creation of the protective char layer. At the 350 degrees Celsius point the mass-loss of the stone wool is the lowest, with 5 grams compared to the 9 gram for PIR and 15 grams for PUR. Meaning that the reaction temperature of PUR is higher than PIR, but when the pyrolysis temperature of PUR has been reached the mass-loss is significant. Whereas PIR show a more gradual increase of mass-loss.
The mass-loss ratios are 0.5% 1.2% and 7.3% for PUR at the temperatures 150, 250 and 350 °C as percentage of the total mass of the core materials excluding steel facings. The PIR samples show a mass-loss percentage of 0.5%, 1.0% and 2.8% of the total of core mass. While the stone wool roof samples show respectively 0.3%, 0.6% and 1.1% mass-loss during the tests. The stone wool wall panels with 0.3%, 0.4% and 0.8% mass-loss show a lower percentage than the roof panels. This might be caused by the higher sample weight of the stone wool wall samples (average 1200 grams), compared to 970 grams for SWR panels. The average core of a synthetic roof panel weighs 264 grams compared to 676 grams for a stone wool panel core. A mass-loss in percentage might give a distorted view while stone wool cores are heavier as their synthetic concurrents. Despite the fact that the relative mass-loss is comparable to synthetic panels.
98,2
98,4
98,6
98,8
99
99,2
99,4
99,6
99,8
100
100 150 200 250 300 350 400
Mas
s-lo
ss (%
)
Temperature(OC)
Total mass core
PIR
PUR
Stone wool wall
Stone wool roof
Figure 3.24: Average sample weight compared to absolute sample mass-loss
Figure 3.24 shows the remaining mass of the core after exposing the sample for 10 minutes. Values are expressed as a percentage of the average core weight without the facings of each individual material. The
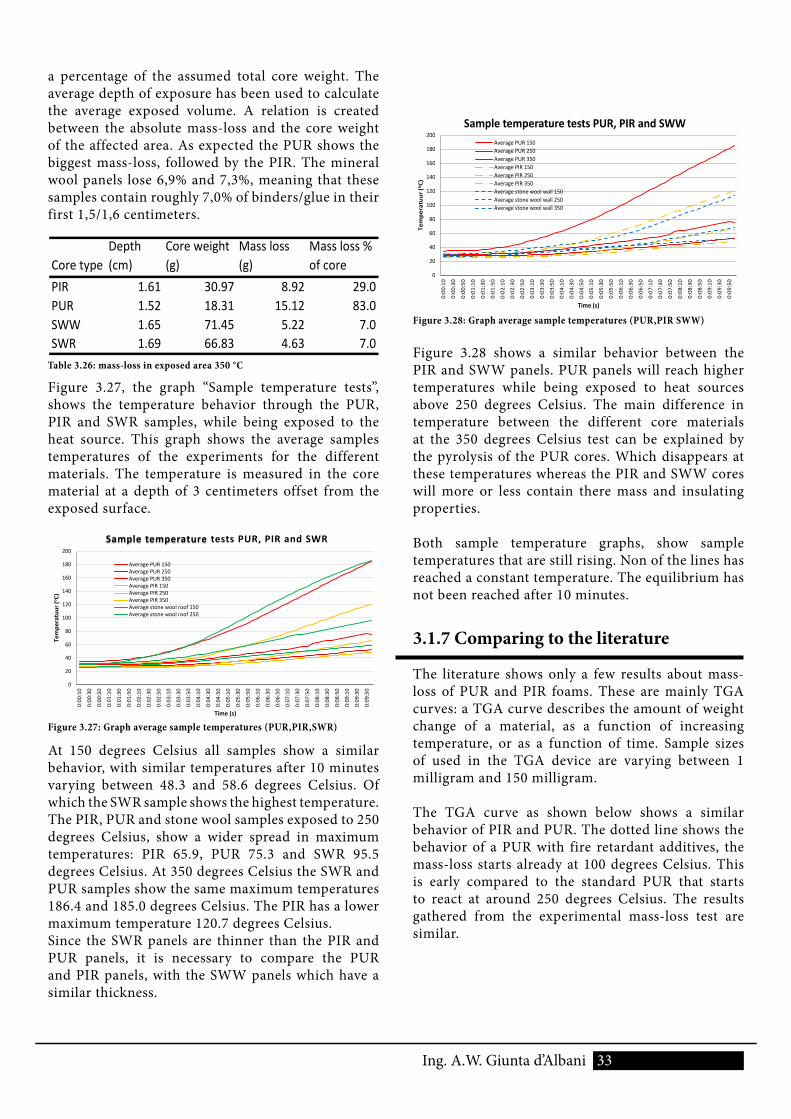
33 Ing. A.W. Giunta d’Albani
a percentage of the assumed total core weight. The average depth of exposure has been used to calculate the average exposed volume. A relation is created between the absolute mass-loss and the core weight of the affected area. As expected the PUR shows the biggest mass-loss, followed by the PIR. The mineral wool panels lose 6,9% and 7,3%, meaning that these samples contain roughly 7,0% of binders/glue in their first 1,5/1,6 centimeters.
Core typeDepth (cm)
Core weight (g)
Mass loss (g)
Mass loss % of core
PIR 1.61 30.97 8.92 29.0PUR 1.52 18.31 15.12 83.0SWW 1.65 71.45 5.22 7.0SWR 1.69 66.83 4.63 7.0
Table 3.26: mass-loss in exposed area 350 °C
Figure 3.27, the graph “Sample temperature tests”, shows the temperature behavior through the PUR, PIR and SWR samples, while being exposed to the heat source. This graph shows the average samples temperatures of the experiments for the different materials. The temperature is measured in the core material at a depth of 3 centimeters offset from the exposed surface.
0
20
40
60
80
100
120
140
160
180
200
0:00
:10
0:00
:30
0:00
:50
0:01
:10
0:01
:30
0:01
:50
0:02
:10
0:02
:30
0:02
:50
0:03
:10
0:03
:30
0:03
:50
0:04
:10
0:04
:30
0:04
:50
0:05
:10
0:05
:30
0:05
:50
0:06
:10
0:06
:30
0:06
:50
0:07
:10
0:07
:30
0:07
:50
0:08
:10
0:08
:30
0:08
:50
0:09
:10
0:09
:30
0:09
:50
Tem
pera
tuur
(o C)
Time (s)
Sample temperature tests PUR, PIR and SWR
Average PUR 150Average PUR 250Average PUR 350Average PIR 150Average PIR 250Average PIR 350Average stone wool roof 150Average stone wool roof 250
Figure 3.27: Graph average sample temperatures (PUR,PIR,SWR)
At 150 degrees Celsius all samples show a similar behavior, with similar temperatures after 10 minutes varying between 48.3 and 58.6 degrees Celsius. Of which the SWR sample shows the highest temperature. The PIR, PUR and stone wool samples exposed to 250 degrees Celsius, show a wider spread in maximum temperatures: PIR 65.9, PUR 75.3 and SWR 95.5 degrees Celsius. At 350 degrees Celsius the SWR and PUR samples show the same maximum temperatures 186.4 and 185.0 degrees Celsius. The PIR has a lower maximum temperature 120.7 degrees Celsius.Since the SWR panels are thinner than the PIR and PUR panels, it is necessary to compare the PUR and PIR panels, with the SWW panels which have a similar thickness.
0
20
40
60
80
100
120
140
160
180
200
0:00
:10
0:00
:30
0:00
:50
0:01
:10
0:01
:30
0:01
:50
0:02
:10
0:02
:30
0:02
:50
0:03
:10
0:03
:30
0:03
:50
0:04
:10
0:04
:30
0:04
:50
0:05
:10
0:05
:30
0:05
:50
0:06
:10
0:06
:30
0:06
:50
0:07
:10
0:07
:30
0:07
:50
0:08
:10
0:08
:30
0:08
:50
0:09
:10
0:09
:30
0:09
:50
Tem
pera
tuur
(o C)
Time (s)
Sample temperature tests PUR, PIR and SWW Average PUR 150Average PUR 250Average PUR 350Average PIR 150Average PIR 250Average PIR 350Average stone wool wall 150Average stone wool wall 250Average stone wool wall 350
Figure 3.28: Graph average sample temperatures (PUR,PIR SWW)
Figure 3.28 shows a similar behavior between the PIR and SWW panels. PUR panels will reach higher temperatures while being exposed to heat sources above 250 degrees Celsius. The main difference in temperature between the different core materials at the 350 degrees Celsius test can be explained by the pyrolysis of the PUR cores. Which disappears at these temperatures whereas the PIR and SWW cores will more or less contain there mass and insulating properties.
Both sample temperature graphs, show sample temperatures that are still rising. Non of the lines has reached a constant temperature. The equilibrium has not been reached after 10 minutes.
3.1.7 Comparing to the literature
The literature shows only a few results about mass-loss of PUR and PIR foams. These are mainly TGA curves: a TGA curve describes the amount of weight change of a material, as a function of increasing temperature, or as a function of time. Sample sizes of used in the TGA device are varying between 1 milligram and 150 milligram.
The TGA curve as shown below shows a similar behavior of PIR and PUR. The dotted line shows the behavior of a PUR with fire retardant additives, the mass-loss starts already at 100 degrees Celsius. This is early compared to the standard PUR that starts to react at around 250 degrees Celsius. The results gathered from the experimental mass-loss test are similar.
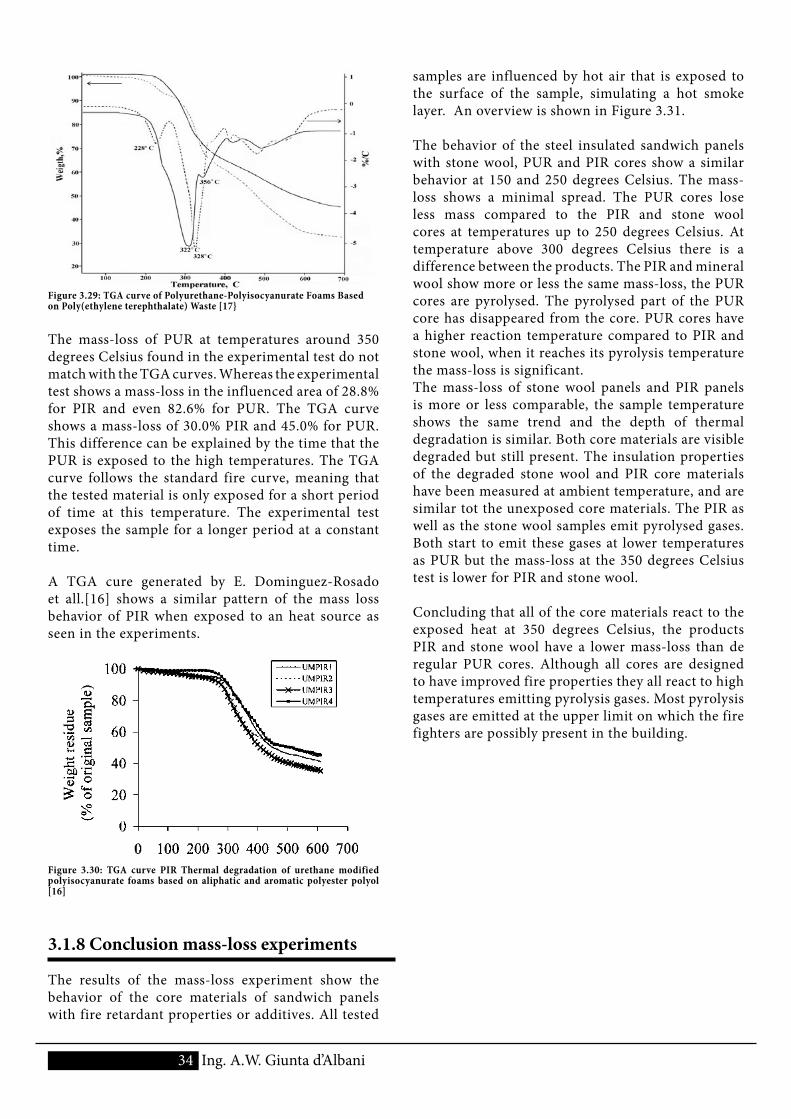
34 Ing. A.W. Giunta d’Albani
samples are influenced by hot air that is exposed to the surface of the sample, simulating a hot smoke layer. An overview is shown in Figure 3.31.
The behavior of the steel insulated sandwich panels with stone wool, PUR and PIR cores show a similar behavior at 150 and 250 degrees Celsius. The mass-loss shows a minimal spread. The PUR cores lose less mass compared to the PIR and stone wool cores at temperatures up to 250 degrees Celsius. At temperature above 300 degrees Celsius there is a difference between the products. The PIR and mineral wool show more or less the same mass-loss, the PUR cores are pyrolysed. The pyrolysed part of the PUR core has disappeared from the core. PUR cores have a higher reaction temperature compared to PIR and stone wool, when it reaches its pyrolysis temperature the mass-loss is significant.The mass-loss of stone wool panels and PIR panels is more or less comparable, the sample temperature shows the same trend and the depth of thermal degradation is similar. Both core materials are visible degraded but still present. The insulation properties of the degraded stone wool and PIR core materials have been measured at ambient temperature, and are similar tot the unexposed core materials. The PIR as well as the stone wool samples emit pyrolysed gases. Both start to emit these gases at lower temperatures as PUR but the mass-loss at the 350 degrees Celsius test is lower for PIR and stone wool.
Concluding that all of the core materials react to the exposed heat at 350 degrees Celsius, the products PIR and stone wool have a lower mass-loss than de regular PUR cores. Although all cores are designed to have improved fire properties they all react to high temperatures emitting pyrolysis gases. Most pyrolysis gases are emitted at the upper limit on which the fire fighters are possibly present in the building.
251
Fig. 1. Structural formula of PU-PIR foams obtained from PET-waste-derived APP containing fragments of glycerol and adipic acid.
Subscripts m, n and p are whole number (1, 2, 3, …) and denote degree of polymerization of the structural units
isocyanate index [16].
PU-PIR foams prepared using PET-waste-derived
APP were characterized by high closed cell content (more
than 94 %) and apparent density varying from 37 kg/m3
to
87 kg/m3
.
Typical TGA and DTG curves of PU-PIR foam
prepared using PET-waste-derived APP are presented in
Fig. 2. An analysis of TGA and DTG curves enabled to
determine several characteristics important for elucidation
of thermal stability of PU-PIR foams: the temperature of
the beginning of the weight loss, the temperature of the
beginning of thermal degradation, the temperature of the
highest rate of the weight loss, the weight loss during the
most intense degradation, the weight residue at 610 °C, and
others.
Fig. 2. TGA/DTG curves of PU-PIR foam prepared using APP
LP-4 (-----) and LPT (—); no flame retardant was added
to the formulation of LPT
The formulation of LPT was without flame retardant,
while the formulation of LP-4 contained TCPP (Fig. 2).
The difference between TGA profiles of these two foams
is the absence of weight loss at 190 °C
–
240
°C for the PU-
PIR foam prepared from LPT. Apparently, the first step of
the weight loss (about 8 % –
10 % of the weight) during
thermogravimetric analysis of the PU-PIR foams is related
to evaporation of the flame retardant TCPP, whose flash
point is at 218 °C and the decomposition temperature at
244 °C [10, 19, 20]. During the most intense degradation
step with the DTG peak maximum at 320 °C
–
340
°C, the
weight loss was in the range from 27 % to 46 %. The
weight residues at 610 °C for PU-PIR foams from different
polyols varied between 30 % and 51 % (Table 2); the larg-
est weight residue was characteristic for the foam prepared
from the branched polyol LPT. Usually, polyurethane
structure decomposes at around 200 °C giving a char yield
about 20 % [4]. The obtained foams containing iso-
cyanurate rings are much more thermostable and
decompose at about 320 °C, with a char yield of around
30 % –
50 %. Dominguez-Rosado et. all [9] reported
similar thermal profiles of polyisocyanurate foams based
on APP with similar weight residue at around 44 %.
Thermal resistance of a compound is related to the
breakdown of the weakest bonds at a certain temperature.
This phenomenon involves degradation of a polymer that
is manifested by reduction of molecular weight. Thermal
resistance of the PU-PIR foams is related to the tempera-
ture of the thermal dissociation of the bonds present in the
rigid structure of the foams. Urethane bonds formed under
the reaction of aromatic diisocyanates with polyols are
characterized by the temperature of thermal dissociation of
about 200 °C [1]. The temperature of thermal dissociation
of ether and ester bonds is about 350 °C and 260
°C,
respectively. It is known that the major rigid polyurethane
foams based on polyester polyols are characterized by
three-step TGA curves: the first one at 120 °C
–
140
°C is
assigned to the moisture absorbed by the foam and
evaporation of a foaming agent and low molecular weight
compounds; the second one at 270 °C
–
280
°C is due to
thermolysis processes disrupting the weakest bonds; at the
third stage occurring at 300 °C
–
350
°C, destruction of
isocyanurate and diphenylmethane structures of the foam
takes place [14, 21]. The weight loss at 270 °C
–
280
°C is
absent during degradation of PU-PIR foams prepared from
PET-waste-derived APP which can be explained by high
isocyanurate yield.
Beyond a doubt, thermal stability and char yield
depend on polyol structure. The PU-PIR foams prepared
from APP containing fragments of glycerol and/or adipic
acid, had higher thermal stability and lower weight loss at
330 °C (Table 2). Thermal stability of PU-PIR foams based
on Lup and APP containing fragments of hexandiol or
poly(propylene glycol) was lower than that of the foams
based on the branched polyols containing fragments of
both adipic acid and glycerol (LP-4, LPT).
The temperature characterizing the highest
decomposition rate of the PU-PIR foams (the main peak of
Figure 3.29: TGA curve of Polyurethane-Polyisocyanurate Foams Basedon Poly(ethylene terephthalate) Waste [17}
The mass-loss of PUR at temperatures around 350 degrees Celsius found in the experimental test do not match with the TGA curves. Whereas the experimental test shows a mass-loss in the influenced area of 28.8% for PIR and even 82.6% for PUR. The TGA curve shows a mass-loss of 30.0% PIR and 45.0% for PUR. This difference can be explained by the time that the PUR is exposed to the high temperatures. The TGA curve follows the standard fire curve, meaning that the tested material is only exposed for a short period of time at this temperature. The experimental test exposes the sample for a longer period at a constant time.
A TGA cure generated by E. Dominguez-Rosado et all.[16] shows a similar pattern of the mass loss behavior of PIR when exposed to an heat source as seen in the experiments.
360 to 610 �CUMPIR2 appears to be more stable, havinga higher content of char residue (44%) than UMPIR3(35%) and UMPIR1 (41%) (Table 2). The UMPIR3apparently possesses the lowest thermal stability.Weight loss for both UMPIR1 and UMPIR2 foams
under nitrogen follows similar trends (Fig. 2). Weightloss occurs in one step—the onset of degradation beginsat 258 �C, followed by an increase in degradation rate,which levels above 456 �C. The aromatic polyester con-tent in UMPIR2 resulted in a slightly greater weight lossbelow 420 �C. Above this temperature, however, theUMPIR2 showed greater stability.From 107 to 280 �C, UMPIR4 shows greater stability
than UMPIR1 and 2. From 280 to 370 �C weight lossfrom UMPIR4 coincides with that of UMPIR1. In thisregion, UMPIR2 is the least stable of the three UMPIRfoams. Conversely, from 440 to 610 �C, UMPIR2 and 4show similar trends, with a char residue of 44 and 45%,respectively.Table 2 summarizes the residue content at 610 �C
from TGA analysis. The foam based on the lowest mol-ecular mass of polyether polyol, UMPIR3, was the mostflammable of the four foams. This result is consistent withLOI data. UMPIR1, 2 and 4 show similar flammability,despite UMPIR2 and 4 having almost the same percen-tage of weight residue at 610 �C. The foam based on high
molecular mass of polyether polyol, UMPIR4, exhibited awide range of stability (from 107 to 440 �C).
3.2. Differential scanning calorimetry
In DSC analysis more differences in flammabilitybehavior are evident between UMPIR1 and 2 (Fig. 3).The UMPIR2 foam experienced a greater endothermicdip at 320 �C, indicating lower thermal stability than forUMPIR1, which had no significant endothermic dips.The exothermic effect begins at 330 �C for bothUMPIR1 and 2, reaching the exothermic peak at 380 �Cfor UMPIR1 and 350 �C for UMPIR2. In UMPIR1 theexothermic effect increases at a slower rate than inUMPIR2. However, both tend to stabilize at about thesame value, i.e. 450 �C. The foam containing aliphaticpolyester polyol (UMPIR1) apparently imparts lessflammability than the foam containing aromatic poly-ester polyol (UMPIR2).UMPIR2 experiences a sharp endothermic dip at
320 �C, approximating the temperature at whichUMPIR3 experiences a dip (314 �C). The exothermiceffect of UMPIR3 starts at 330 �C and reaches its peak
Fig. 2. TGA profiles of the four UMPIR foams.
Table 2
LOI values and percentage of char residue left at 610 �C from TGA analysis
Polyol type UMPIR
foams
LOI TGA (% weight residue
at 610 �C)
Aliphatic polyester polyol 1 22.6 41
Aromatic polyester polyol 2 22.4 44
Polyether polyol 3 20.4 35
Polyether polyol 4 22.0 45
Fig. 3. Comparison of DSC trends for the four UMPIR foams.
4 E. Dominguez-Rosado et al. / Polymer Degradation and Stability 78 (2002) 1–5
Figure 3.30: TGA curve PIR Thermal degradation of urethane modified polyisocyanurate foams based on aliphatic and aromatic polyester polyol [16]
3.1.8 Conclusion mass-loss experiments
The results of the mass-loss experiment show the behavior of the core materials of sandwich panels with fire retardant properties or additives. All tested
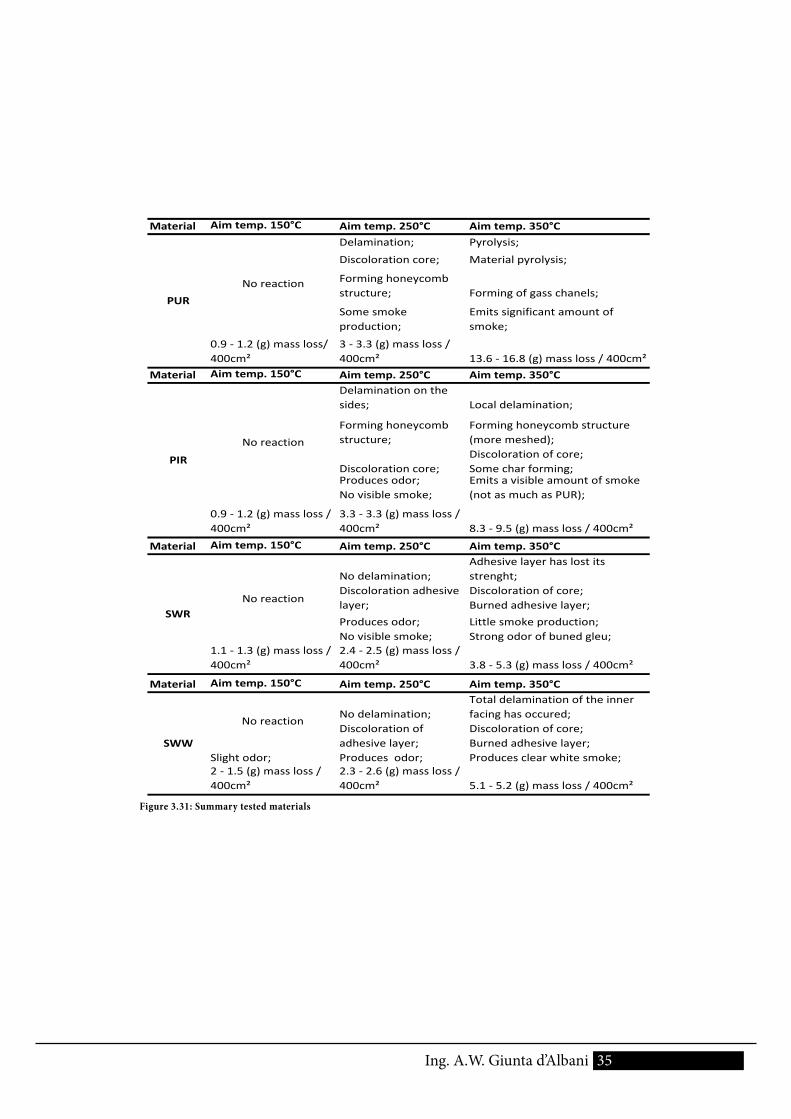
35Ing. A.W. Giunta d’Albani
Material Aim temp. 150°C Aim temp. 250°C Aim temp. 350°CDelamination; Pyrolysis;Discoloration core; Material pyrolysis;
Forming honeycomb structure; Forming of gass chanels;
Some smoke production;
Emits significant amount of smoke;
0.9 - 1.2 (g) mass loss/ 400cm²
3 - 3.3 (g) mass loss / 400cm² 13.6 - 16.8 (g) mass loss / 400cm²
Material Aim temp. 150°C Aim temp. 250°C Aim temp. 350°CDelamination on the sides; Local delamination;
Forming honeycomb structure;
Forming honeycomb structure (more meshed);
Discoloration core;Discoloration of core; Some char forming;
Produces odor; No visible smoke;
Emits a visible amount of smoke (not as much as PUR);
0.9 - 1.2 (g) mass loss / 400cm²
3.3 - 3.3 (g) mass loss / 400cm² 8.3 - 9.5 (g) mass loss / 400cm²
Material Aim temp. 150°C Aim temp. 250°C Aim temp. 350°C
No delamination;Adhesive layer has lost its strenght;
Discoloration adhesive layer;
Discoloration of core; Burned adhesive layer;
Produces odor; No visible smoke;
Little smoke production; Strong odor of buned gleu;
1.1 - 1.3 (g) mass loss / 400cm²
2.4 - 2.5 (g) mass loss / 400cm² 3.8 - 5.3 (g) mass loss / 400cm²
Material Aim temp. 150°C Aim temp. 250°C Aim temp. 350°C
No delamination;Total delamination of the inner facing has occured;
Discoloration of adhesive layer;
Discoloration of core; Burned adhesive layer;
Slight odor; Produces odor; Produces clear white smoke;2 - 1.5 (g) mass loss / 400cm²
2.3 - 2.6 (g) mass loss / 400cm² 5.1 - 5.2 (g) mass loss / 400cm²
No reaction
SWW
PIR
No reactionPUR
No reaction
SWRNo reaction
Figure 3.31: Summary tested materials
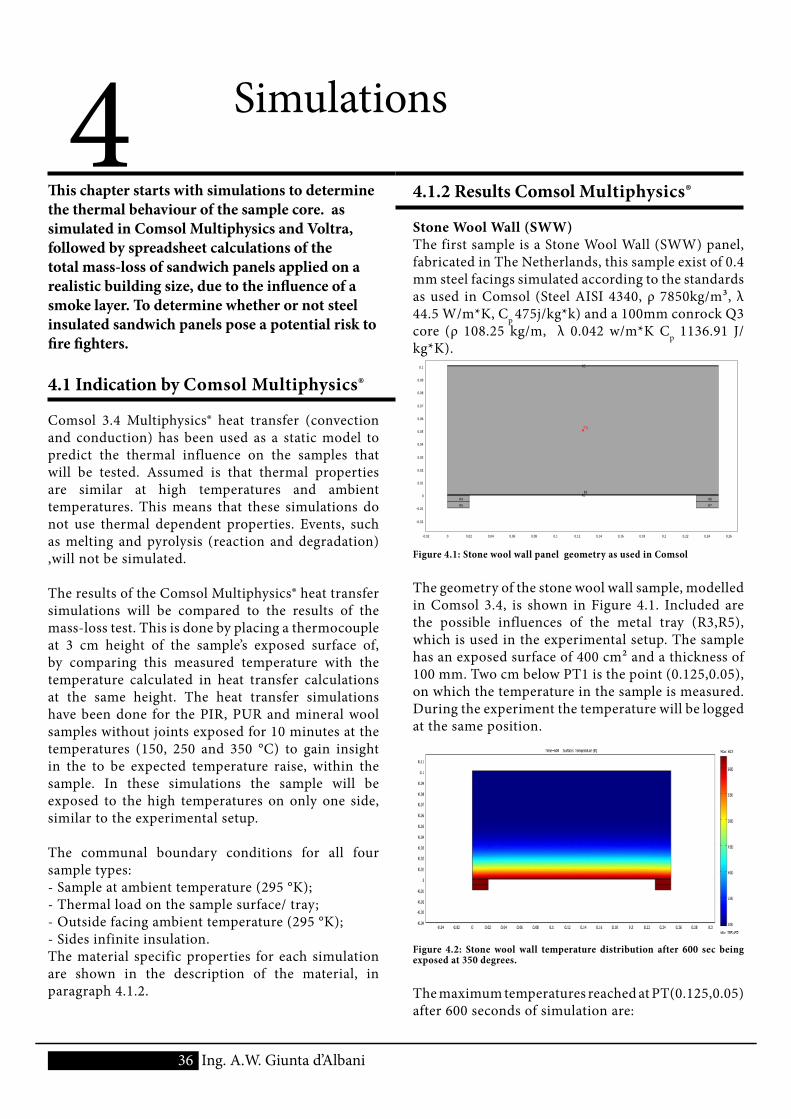
4 Simulations
36 Ing. A.W. Giunta d’Albani
This chapter starts with simulations to determine the thermal behaviour of the sample core. as simulated in Comsol Multiphysics and Voltra, followed by spreadsheet calculations of the total mass-loss of sandwich panels applied on a realistic building size, due to the influence of a smoke layer. To determine whether or not steel insulated sandwich panels pose a potential risk to fire fighters.
4.1 Indication by Comsol Multiphysics®
Comsol 3.4 Multiphysics® heat transfer (convection and conduction) has been used as a static model to predict the thermal influence on the samples that will be tested. Assumed is that thermal properties are similar at high temperatures and ambient temperatures. This means that these simulations do not use thermal dependent properties. Events, such as melting and pyrolysis (reaction and degradation) ,will not be simulated.
The results of the Comsol Multiphysics® heat transfer simulations will be compared to the results of the mass-loss test. This is done by placing a thermocouple at 3 cm height of the sample’s exposed surface of, by comparing this measured temperature with the temperature calculated in heat transfer calculations at the same height. The heat transfer simulations have been done for the PIR, PUR and mineral wool samples without joints exposed for 10 minutes at the temperatures (150, 250 and 350 °C) to gain insight in the to be expected temperature raise, within the sample. In these simulations the sample will be exposed to the high temperatures on only one side, similar to the experimental setup. The communal boundary conditions for all four sample types: - Sample at ambient temperature (295 °K);- Thermal load on the sample surface/ tray;- Outside facing ambient temperature (295 °K);- Sides infinite insulation.The material specific properties for each simulation are shown in the description of the material, in paragraph 4.1.2.
4.1.2 Results Comsol Multiphysics®
Stone Wool Wall (SWW)The first sample is a Stone Wool Wall (SWW) panel, fabricated in The Netherlands, this sample exist of 0.4 mm steel facings simulated according to the standards as used in Comsol (Steel AISI 4340, ρ 7850kg/m³, λ 44.5 W/m*K, Cp 475j/kg*k) and a 100mm conrock Q3 core (ρ 108.25 kg/m, λ 0.042 w/m*K Cp 1136.91 J/kg*K).
Figure 4.1: Stone wool wall panel geometry as used in Comsol
The geometry of the stone wool wall sample, modelled in Comsol 3.4, is shown in Figure 4.1. Included are the possible influences of the metal tray (R3,R5), which is used in the experimental setup. The sample has an exposed surface of 400 cm² and a thickness of 100 mm. Two cm below PT1 is the point (0.125,0.05), on which the temperature in the sample is measured. During the experiment the temperature will be logged at the same position.
Figure 4.2: Stone wool wall temperature distribution after 600 sec being exposed at 350 degrees.
The maximum temperatures reached at PT(0.125,0.05) after 600 seconds of simulation are:
R3
R2R1
R4
R5
R6
R7
PT1
-0.02
-0.01
0
0.01
0.02
0.03
0.04
0.05
0.06
0.07
0.08
0.09
0.1
-0.02 0 0.02 0.04 0.06 0.08 0.1 0.12 0.14 0.16 0.18 0.2 0.22 0.24 0.26
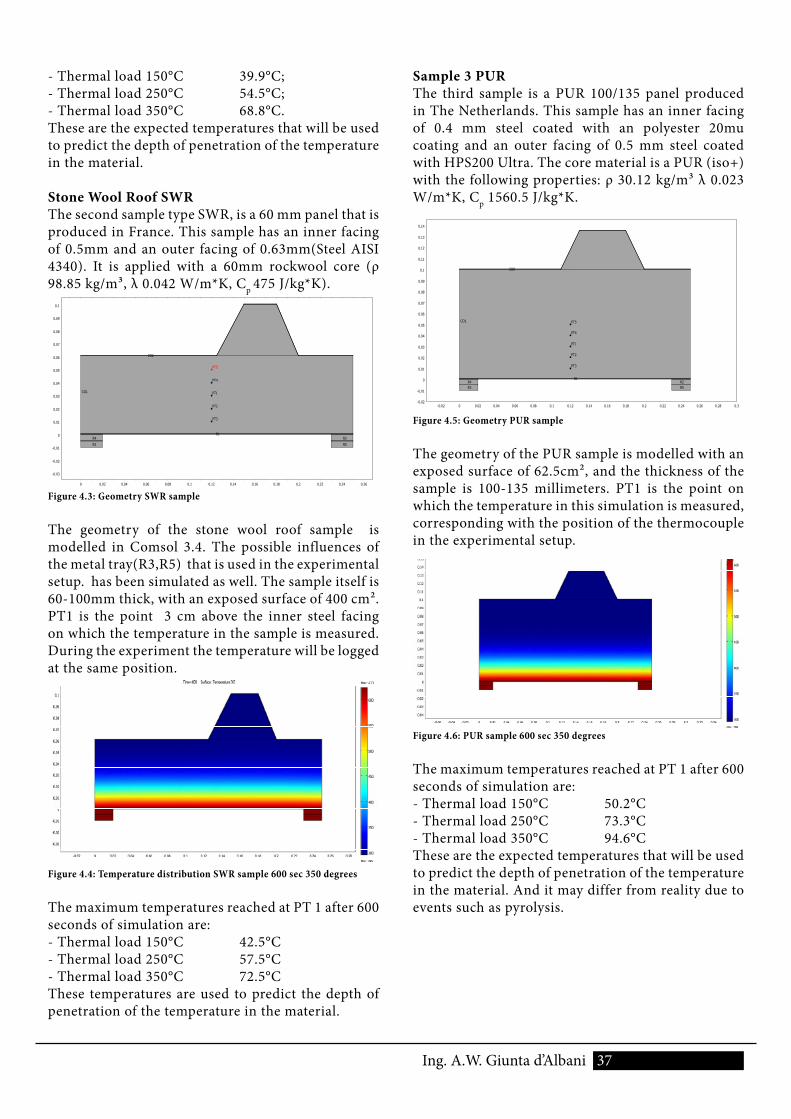
37 Ing. A.W. Giunta d’Albani
Sample 3 PURThe third sample is a PUR 100/135 panel produced in The Netherlands. This sample has an inner facing of 0.4 mm steel coated with an polyester 20mu coating and an outer facing of 0.5 mm steel coated with HPS200 Ultra. The core material is a PUR (iso+) with the following properties: ρ 30.12 kg/m³ λ 0.023 W/m*K, Cp 1560.5 J/kg*K.
Figure 4.5: Geometry PUR sample
The geometry of the PUR sample is modelled with an exposed surface of 62.5cm², and the thickness of the sample is 100-135 millimeters. PT1 is the point on which the temperature in this simulation is measured, corresponding with the position of the thermocouple in the experimental setup.
Figure 4.6: PUR sample 600 sec 350 degrees
The maximum temperatures reached at PT 1 after 600 seconds of simulation are:- Thermal load 150°C 50.2°C- Thermal load 250°C 73.3°C- Thermal load 350°C 94.6°CThese are the expected temperatures that will be used to predict the depth of penetration of the temperature in the material. And it may differ from reality due to events such as pyrolysis.
- Thermal load 150°C 39.9°C;- Thermal load 250°C 54.5°C;- Thermal load 350°C 68.8°C.These are the expected temperatures that will be used to predict the depth of penetration of the temperature in the material.
Stone Wool Roof SWR The second sample type SWR, is a 60 mm panel that is produced in France. This sample has an inner facing of 0.5mm and an outer facing of 0.63mm(Steel AISI 4340). It is applied with a 60mm rockwool core (ρ 98.85 kg/m³, λ 0.042 W/m*K, Cp 475 J/kg*K).
Figure 4.3: Geometry SWR sample
The geometry of the stone wool roof sample is modelled in Comsol 3.4. The possible influences of the metal tray(R3,R5) that is used in the experimental setup. has been simulated as well. The sample itself is 60-100mm thick, with an exposed surface of 400 cm². PT1 is the point 3 cm above the inner steel facing on which the temperature in the sample is measured. During the experiment the temperature will be logged at the same position.
Figure 4.4: Temperature distribution SWR sample 600 sec 350 degrees
The maximum temperatures reached at PT 1 after 600 seconds of simulation are:- Thermal load 150°C 42.5°C- Thermal load 250°C 57.5°C- Thermal load 350°C 72.5°CThese temperatures are used to predict the depth of penetration of the temperature in the material.
R1
PT1
CO2
CO1
R2
R3
R4
R5
PT2
PT3
PT4
PT5
-0.03
-0.02
-0.01
0
0.01
0.02
0.03
0.04
0.05
0.06
0.07
0.08
0.09
0.1
0 0.02 0.04 0.06 0.08 0.1 0.12 0.14 0.16 0.18 0.2 0.22 0.24 0.26
R2R1
R3 R5R4
PT5
PT4
PT3
PT2
PT1
CO8
CO1
-0.02
-0.01
0
0.01
0.02
0.03
0.04
0.05
0.06
0.07
0.08
0.09
0.1
0.11
0.12
0.13
0.14
-0.02 0 0.02 0.04 0.06 0.08 0.1 0.12 0.14 0.16 0.18 0.2 0.22 0.24 0.26 0.28 0.3
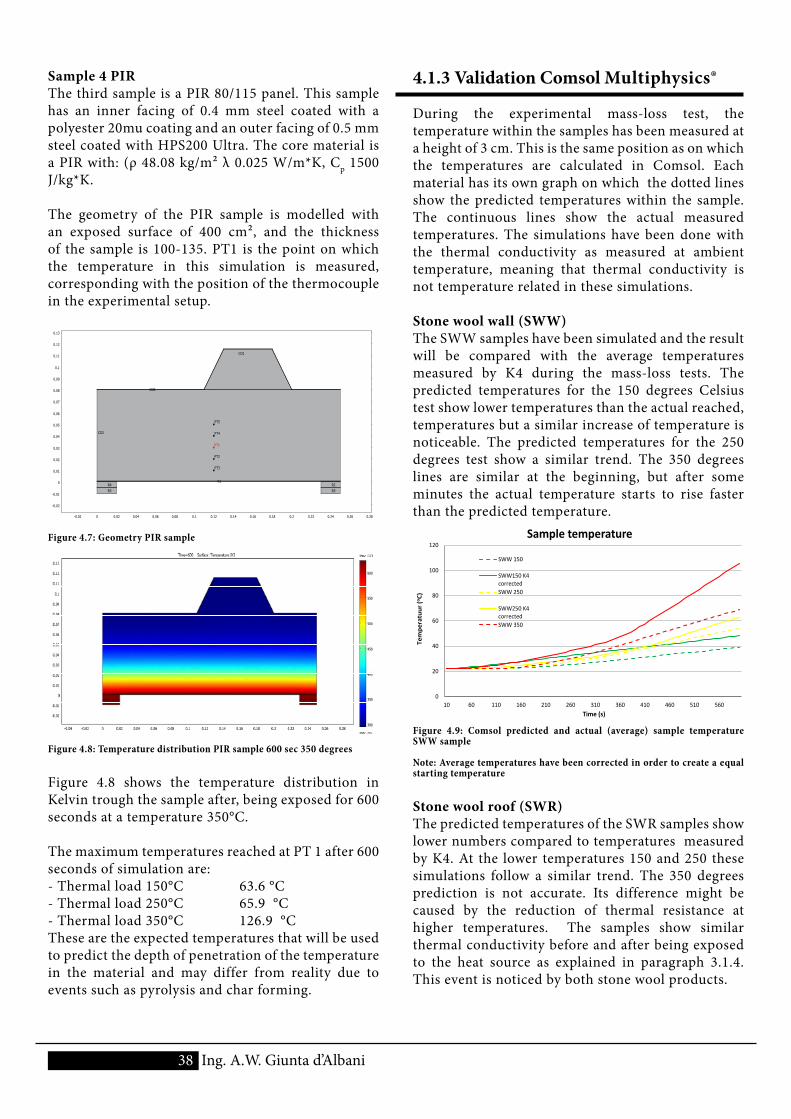
38 Ing. A.W. Giunta d’Albani
Sample 4 PIRThe third sample is a PIR 80/115 panel. This sample has an inner facing of 0.4 mm steel coated with a polyester 20mu coating and an outer facing of 0.5 mm steel coated with HPS200 Ultra. The core material is a PIR with: (ρ 48.08 kg/m² λ 0.025 W/m*K, Cp 1500 J/kg*K.
The geometry of the PIR sample is modelled with an exposed surface of 400 cm², and the thickness of the sample is 100-135. PT1 is the point on which the temperature in this simulation is measured, corresponding with the position of the thermocouple in the experimental setup.
Figure 4.7: Geometry PIR sample
Figure 4.8: Temperature distribution PIR sample 600 sec 350 degrees
Figure 4.8 shows the temperature distribution in Kelvin trough the sample after, being exposed for 600 seconds at a temperature 350°C.
The maximum temperatures reached at PT 1 after 600 seconds of simulation are:- Thermal load 150°C 63.6 °C- Thermal load 250°C 65.9 °C- Thermal load 350°C 126.9 °CThese are the expected temperatures that will be used to predict the depth of penetration of the temperature in the material and may differ from reality due to events such as pyrolysis and char forming.
4.1.3 Validation Comsol Multiphysics®
During the experimental mass-loss test, the temperature within the samples has been measured at a height of 3 cm. This is the same position as on which the temperatures are calculated in Comsol. Each material has its own graph on which the dotted lines show the predicted temperatures within the sample. The continuous lines show the actual measured temperatures. The simulations have been done with the thermal conductivity as measured at ambient temperature, meaning that thermal conductivity is not temperature related in these simulations.
Stone wool wall (SWW)The SWW samples have been simulated and the result will be compared with the average temperatures measured by K4 during the mass-loss tests. The predicted temperatures for the 150 degrees Celsius test show lower temperatures than the actual reached, temperatures but a similar increase of temperature is noticeable. The predicted temperatures for the 250 degrees test show a similar trend. The 350 degrees lines are similar at the beginning, but after some minutes the actual temperature starts to rise faster than the predicted temperature.
0
20
40
60
80
100
120
10 60 110 160 210 260 310 360 410 460 510 560
Tem
pera
tuur
(o C)
Time (s)
Sample temperature
SWW 150
SWW150 K4correctedSWW 250
SWW250 K4correctedSWW 350
Figure 4.9: Comsol predicted and actual (average) sample temperature SWW sample
Note: Average temperatures have been corrected in order to create a equal starting temperature
Stone wool roof (SWR)The predicted temperatures of the SWR samples show lower numbers compared to temperatures measured by K4. At the lower temperatures 150 and 250 these simulations follow a similar trend. The 350 degrees prediction is not accurate. Its difference might be caused by the reduction of thermal resistance at higher temperatures. The samples show similar thermal conductivity before and after being exposed to the heat source as explained in paragraph 3.1.4. This event is noticed by both stone wool products.
CO2
R2
CO8
CO1
R1
R3 R5
R4
PT5
PT4
PT3
PT2
PT1
-0.02
-0.01
0
0.01
0.02
0.03
0.04
0.05
0.06
0.07
0.08
0.09
0.1
0.11
0.12
0.13
-0.02 0 0.02 0.04 0.06 0.08 0.1 0.12 0.14 0.16 0.18 0.2 0.22 0.24 0.26 0.28
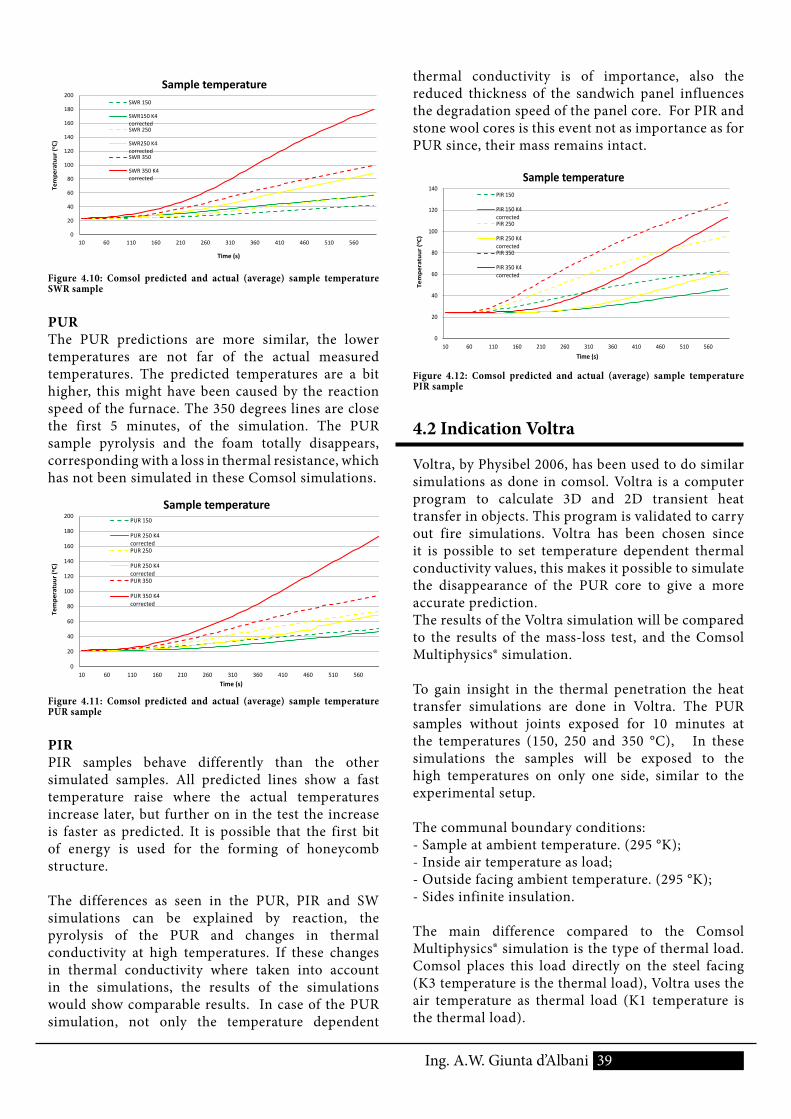
39Ing. A.W. Giunta d’Albani
0
20
40
60
80
100
120
140
160
180
200
10 60 110 160 210 260 310 360 410 460 510 560
Tem
pera
tuur
(o C)
Time (s)
Sample temperature SWR 150
SWR150 K4correctedSWR 250
SWR250 K4correctedSWR 350
SWR 350 K4corrected
Figure 4.10: Comsol predicted and actual (average) sample temperature SWR sample
PURThe PUR predictions are more similar, the lower temperatures are not far of the actual measured temperatures. The predicted temperatures are a bit higher, this might have been caused by the reaction speed of the furnace. The 350 degrees lines are close the first 5 minutes, of the simulation. The PUR sample pyrolysis and the foam totally disappears, corresponding with a loss in thermal resistance, which has not been simulated in these Comsol simulations.
0
20
40
60
80
100
120
140
160
180
200
10 60 110 160 210 260 310 360 410 460 510 560
Tem
pera
tuur
(o C)
Time (s)
Sample temperature PUR 150
PUR 250 K4correctedPUR 250
PUR 250 K4correctedPUR 350
PUR 350 K4corrected
Figure 4.11: Comsol predicted and actual (average) sample temperature PUR sample
PIRPIR samples behave differently than the other simulated samples. All predicted lines show a fast temperature raise where the actual temperatures increase later, but further on in the test the increase is faster as predicted. It is possible that the first bit of energy is used for the forming of honeycomb structure.
The differences as seen in the PUR, PIR and SW simulations can be explained by reaction, the pyrolysis of the PUR and changes in thermal conductivity at high temperatures. If these changes in thermal conductivity where taken into account in the simulations, the results of the simulations would show comparable results. In case of the PUR simulation, not only the temperature dependent
thermal conductivity is of importance, also the reduced thickness of the sandwich panel influences the degradation speed of the panel core. For PIR and stone wool cores is this event not as importance as for PUR since, their mass remains intact.
0
20
40
60
80
100
120
140
10 60 110 160 210 260 310 360 410 460 510 560
Tem
pera
tuur
(o C)
Time (s)
Sample temperature PIR 150
PIR 150 K4correctedPIR 250
PIR 250 K4correctedPIR 350
PIR 350 K4corrected
Figure 4.12: Comsol predicted and actual (average) sample temperature PIR sample
4.2 Indication Voltra
Voltra, by Physibel 2006, has been used to do similar simulations as done in comsol. Voltra is a computer program to calculate 3D and 2D transient heat transfer in objects. This program is validated to carry out fire simulations. Voltra has been chosen since it is possible to set temperature dependent thermal conductivity values, this makes it possible to simulate the disappearance of the PUR core to give a more accurate prediction. The results of the Voltra simulation will be compared to the results of the mass-loss test, and the Comsol Multiphysics® simulation.
To gain insight in the thermal penetration the heat transfer simulations are done in Voltra. The PUR samples without joints exposed for 10 minutes at the temperatures (150, 250 and 350 °C), In these simulations the samples will be exposed to the high temperatures on only one side, similar to the experimental setup. The communal boundary conditions:- Sample at ambient temperature. (295 °K);- Inside air temperature as load;- Outside facing ambient temperature. (295 °K);- Sides infinite insulation.
The main difference compared to the Comsol Multiphysics® simulation is the type of thermal load.Comsol places this load directly on the steel facing (K3 temperature is the thermal load), Voltra uses the air temperature as thermal load (K1 temperature is the thermal load).
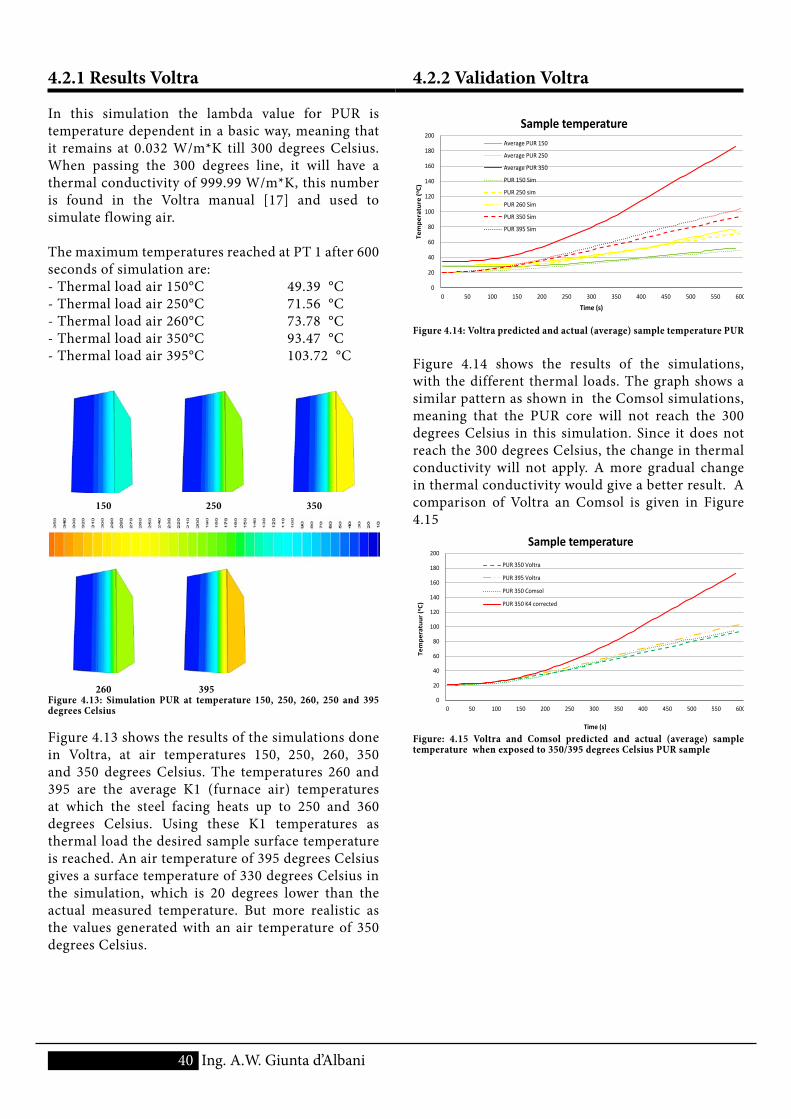
40 Ing. A.W. Giunta d’Albani
4.2.2 Validation Voltra
0
20
40
60
80
100
120
140
160
180
200
0 50 100 150 200 250 300 350 400 450 500 550 600
Tem
pera
ture
(o C)
Time (s)
Sample temperature Average PUR 150
Average PUR 250
Average PUR 350
PUR 150 Sim
PUR 250 sim
PUR 260 Sim
PUR 350 Sim
PUR 395 Sim
Figure 4.14: Voltra predicted and actual (average) sample temperature PUR
Figure 4.14 shows the results of the simulations, with the different thermal loads. The graph shows a similar pattern as shown in the Comsol simulations, meaning that the PUR core will not reach the 300 degrees Celsius in this simulation. Since it does not reach the 300 degrees Celsius, the change in thermal conductivity will not apply. A more gradual change in thermal conductivity would give a better result. A comparison of Voltra an Comsol is given in Figure 4.15
0
20
40
60
80
100
120
140
160
180
200
0 50 100 150 200 250 300 350 400 450 500 550 600
Tem
pera
tuur
(o C)
Time (s)
Sample temperature PUR 350 Voltra
PUR 395 Voltra
PUR 350 Comsol
PUR 350 K4 corrected
Figure: 4.15 Voltra and Comsol predicted and actual (average) sample temperature when exposed to 350/395 degrees Celsius PUR sample
4.2.1 Results Voltra
In this simulation the lambda value for PUR is temperature dependent in a basic way, meaning that it remains at 0.032 W/m*K till 300 degrees Celsius. When passing the 300 degrees line, it will have a thermal conductivity of 999.99 W/m*K, this number is found in the Voltra manual [17] and used to simulate flowing air.
The maximum temperatures reached at PT 1 after 600 seconds of simulation are:- Thermal load air 150°C 49.39 °C- Thermal load air 250°C 71.56 °C- Thermal load air 260°C 73.78 °C- Thermal load air 350°C 93.47 °C- Thermal load air 395°C 103.72 °C
150 250 350
260 395Figure 4.13: Simulation PUR at temperature 150, 250, 260, 250 and 395 degrees Celsius
Figure 4.13 shows the results of the simulations done in Voltra, at air temperatures 150, 250, 260, 350 and 350 degrees Celsius. The temperatures 260 and 395 are the average K1 (furnace air) temperatures at which the steel facing heats up to 250 and 360 degrees Celsius. Using these K1 temperatures as thermal load the desired sample surface temperature is reached. An air temperature of 395 degrees Celsius gives a surface temperature of 330 degrees Celsius in the simulation, which is 20 degrees lower than the actual measured temperature. But more realistic as the values generated with an air temperature of 350 degrees Celsius.
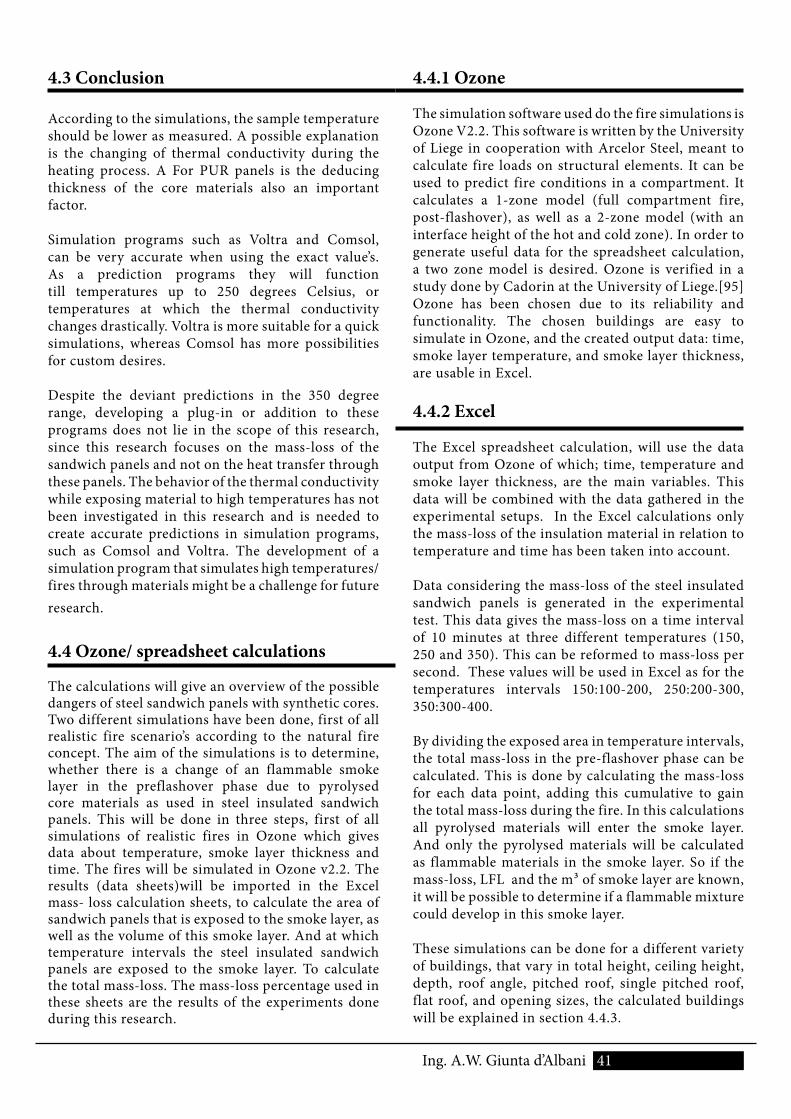
41 Ing. A.W. Giunta d’Albani
4.4.1 Ozone
The simulation software used do the fire simulations is Ozone V2.2. This software is written by the University of Liege in cooperation with Arcelor Steel, meant to calculate fire loads on structural elements. It can be used to predict fire conditions in a compartment. It calculates a 1-zone model (full compartment fire, post-flashover), as well as a 2-zone model (with an interface height of the hot and cold zone). In order to generate useful data for the spreadsheet calculation, a two zone model is desired. Ozone is verified in a study done by Cadorin at the University of Liege.[95]Ozone has been chosen due to its reliability and functionality. The chosen buildings are easy to simulate in Ozone, and the created output data: time, smoke layer temperature, and smoke layer thickness, are usable in Excel.
4.4.2 Excel
The Excel spreadsheet calculation, will use the data output from Ozone of which; time, temperature and smoke layer thickness, are the main variables. This data will be combined with the data gathered in the experimental setups. In the Excel calculations only the mass-loss of the insulation material in relation to temperature and time has been taken into account.
Data considering the mass-loss of the steel insulated sandwich panels is generated in the experimental test. This data gives the mass-loss on a time interval of 10 minutes at three different temperatures (150, 250 and 350). This can be reformed to mass-loss per second. These values will be used in Excel as for the temperatures intervals 150:100-200, 250:200-300, 350:300-400.
By dividing the exposed area in temperature intervals, the total mass-loss in the pre-flashover phase can be calculated. This is done by calculating the mass-loss for each data point, adding this cumulative to gain the total mass-loss during the fire. In this calculations all pyrolysed materials will enter the smoke layer. And only the pyrolysed materials will be calculated as flammable materials in the smoke layer. So if the mass-loss, LFL and the m³ of smoke layer are known, it will be possible to determine if a flammable mixture could develop in this smoke layer.
These simulations can be done for a different variety of buildings, that vary in total height, ceiling height, depth, roof angle, pitched roof, single pitched roof, flat roof, and opening sizes, the calculated buildings will be explained in section 4.4.3.
4.3 Conclusion
According to the simulations, the sample temperature should be lower as measured. A possible explanation is the changing of thermal conductivity during the heating process. A For PUR panels is the deducing thickness of the core materials also an important factor.
Simulation programs such as Voltra and Comsol, can be very accurate when using the exact value’s. As a prediction programs they will function till temperatures up to 250 degrees Celsius, or temperatures at which the thermal conductivity changes drastically. Voltra is more suitable for a quick simulations, whereas Comsol has more possibilities for custom desires.
Despite the deviant predictions in the 350 degree range, developing a plug-in or addition to these programs does not lie in the scope of this research, since this research focuses on the mass-loss of the sandwich panels and not on the heat transfer through these panels. The behavior of the thermal conductivity while exposing material to high temperatures has not been investigated in this research and is needed to create accurate predictions in simulation programs, such as Comsol and Voltra. The development of a simulation program that simulates high temperatures/ fires through materials might be a challenge for future research.
4.4 Ozone/ spreadsheet calculations
The calculations will give an overview of the possible dangers of steel sandwich panels with synthetic cores. Two different simulations have been done, first of all realistic fire scenario’s according to the natural fire concept. The aim of the simulations is to determine, whether there is a change of an flammable smoke layer in the preflashover phase due to pyrolysed core materials as used in steel insulated sandwich panels. This will be done in three steps, first of all simulations of realistic fires in Ozone which gives data about temperature, smoke layer thickness and time. The fires will be simulated in Ozone v2.2. The results (data sheets)will be imported in the Excel mass- loss calculation sheets, to calculate the area of sandwich panels that is exposed to the smoke layer, as well as the volume of this smoke layer. And at which temperature intervals the steel insulated sandwich panels are exposed to the smoke layer. To calculate the total mass-loss. The mass-loss percentage used in these sheets are the results of the experiments done during this research.
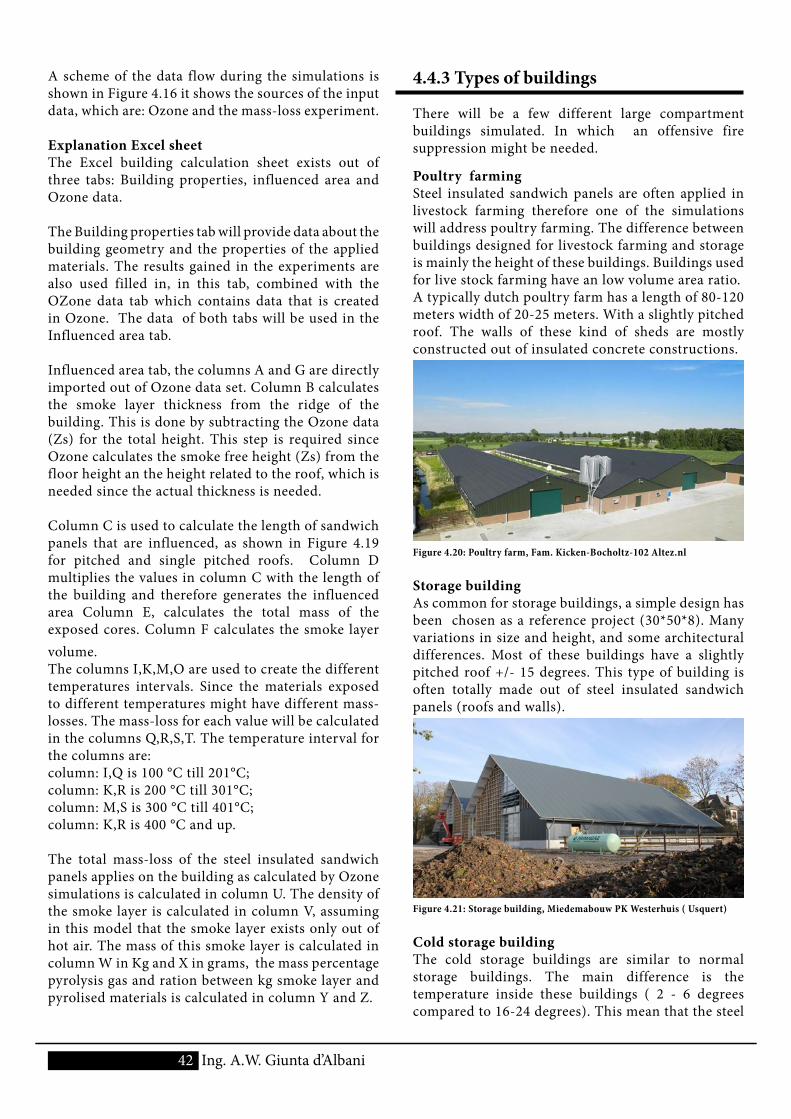
42 Ing. A.W. Giunta d’Albani
A scheme of the data flow during the simulations is shown in Figure 4.16 it shows the sources of the input data, which are: Ozone and the mass-loss experiment.
Explanation Excel sheetThe Excel building calculation sheet exists out of three tabs: Building properties, influenced area and Ozone data.
The Building properties tab will provide data about the building geometry and the properties of the applied materials. The results gained in the experiments are also used filled in, in this tab, combined with the OZone data tab which contains data that is created in Ozone. The data of both tabs will be used in the Influenced area tab.
Influenced area tab, the columns A and G are directly imported out of Ozone data set. Column B calculates the smoke layer thickness from the ridge of the building. This is done by subtracting the Ozone data (Zs) for the total height. This step is required since Ozone calculates the smoke free height (Zs) from the floor height an the height related to the roof, which is needed since the actual thickness is needed.
Column C is used to calculate the length of sandwich panels that are influenced, as shown in Figure 4.19 for pitched and single pitched roofs. Column D multiplies the values in column C with the length of the building and therefore generates the influenced area Column E, calculates the total mass of the exposed cores. Column F calculates the smoke layer volume.The columns I,K,M,O are used to create the different temperatures intervals. Since the materials exposed to different temperatures might have different mass-losses. The mass-loss for each value will be calculated in the columns Q,R,S,T. The temperature interval for the columns are:column: I,Q is 100 °C till 201°C;column: K,R is 200 °C till 301°C;column: M,S is 300 °C till 401°C;column: K,R is 400 °C and up.
The total mass-loss of the steel insulated sandwich panels applies on the building as calculated by Ozone simulations is calculated in column U. The density of the smoke layer is calculated in column V, assuming in this model that the smoke layer exists only out of hot air. The mass of this smoke layer is calculated in column W in Kg and X in grams, the mass percentage pyrolysis gas and ration between kg smoke layer and pyrolised materials is calculated in column Y and Z.
4.4.3 Types of buildings
There will be a few different large compartment buildings simulated. In which an offensive fire suppression might be needed.
Poultry farmingSteel insulated sandwich panels are often applied in livestock farming therefore one of the simulations will address poultry farming. The difference between buildings designed for livestock farming and storage is mainly the height of these buildings. Buildings used for live stock farming have an low volume area ratio. A typically dutch poultry farm has a length of 80-120 meters width of 20-25 meters. With a slightly pitched roof. The walls of these kind of sheds are mostly constructed out of insulated concrete constructions.
Figure 4.20: Poultry farm, Fam. Kicken-Bocholtz-102 Altez.nl
Storage buildingAs common for storage buildings, a simple design has been chosen as a reference project (30*50*8). Many variations in size and height, and some architectural differences. Most of these buildings have a slightly pitched roof +/- 15 degrees. This type of building is often totally made out of steel insulated sandwich panels (roofs and walls).
Figure 4.21: Storage building, Miedemabouw PK Westerhuis ( Usquert)
Cold storage buildingThe cold storage buildings are similar to normal storage buildings. The main difference is the temperature inside these buildings ( 2 - 6 degrees compared to 16-24 degrees). This mean that the steel
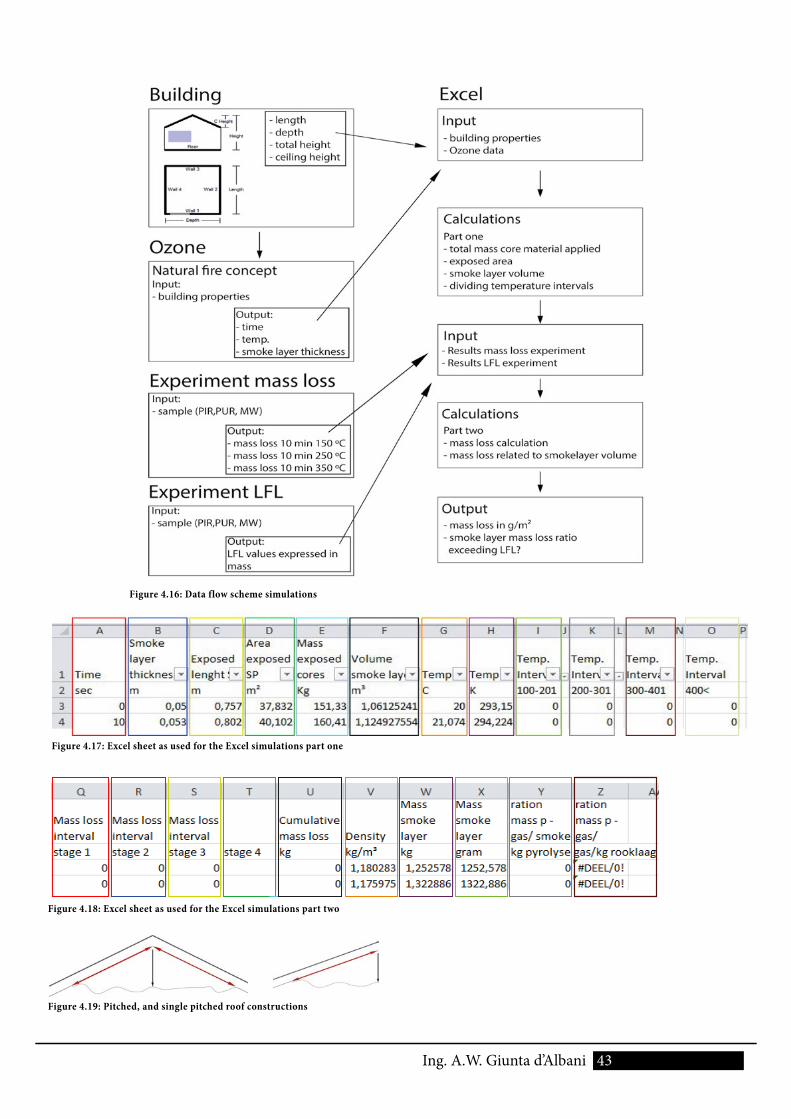
43Ing. A.W. Giunta d’Albani
Figure 4.16: Data flow scheme simulations
Figure 4.17: Excel sheet as used for the Excel simulations part one
Figure 4.18: Excel sheet as used for the Excel simulations part two
Figure 4.19: Pitched, and single pitched roof constructions
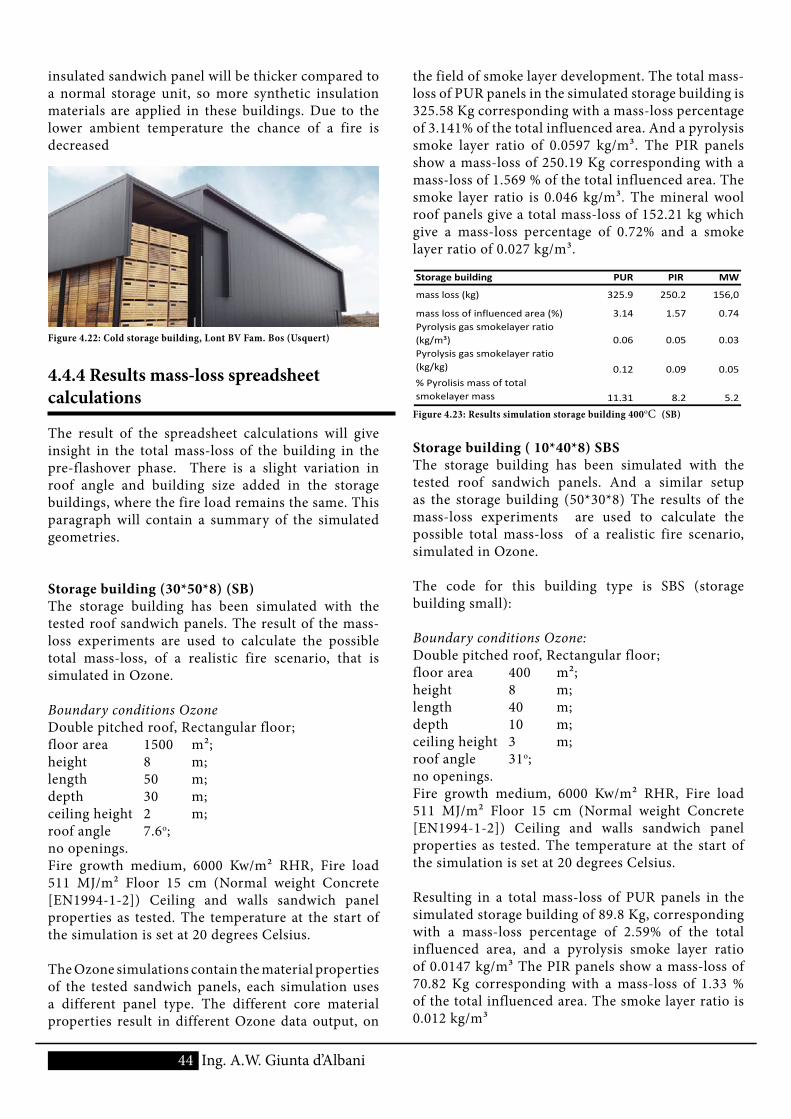
44 Ing. A.W. Giunta d’Albani
insulated sandwich panel will be thicker compared to a normal storage unit, so more synthetic insulation materials are applied in these buildings. Due to the lower ambient temperature the chance of a fire is decreased
Figure 4.22: Cold storage building, Lont BV Fam. Bos (Usquert)
4.4.4 Results mass-loss spreadsheet calculations
The result of the spreadsheet calculations will give insight in the total mass-loss of the building in the pre-flashover phase. There is a slight variation in roof angle and building size added in the storage buildings, where the fire load remains the same. This paragraph will contain a summary of the simulated geometries.
Storage building (30*50*8) (SB)The storage building has been simulated with the tested roof sandwich panels. The result of the mass-loss experiments are used to calculate the possible total mass-loss, of a realistic fire scenario, that is simulated in Ozone.
Boundary conditions OzoneDouble pitched roof, Rectangular floor;floor area 1500 m²;height 8 m;length 50 m;depth 30 m;ceiling height 2 m;roof angle 7.6o;no openings.Fire growth medium, 6000 Kw/m² RHR, Fire load 511 MJ/m² Floor 15 cm (Normal weight Concrete [EN1994-1-2]) Ceiling and walls sandwich panel properties as tested. The temperature at the start of the simulation is set at 20 degrees Celsius.
The Ozone simulations contain the material properties of the tested sandwich panels, each simulation uses a different panel type. The different core material properties result in different Ozone data output, on
the field of smoke layer development. The total mass-loss of PUR panels in the simulated storage building is 325.58 Kg corresponding with a mass-loss percentage of 3.141% of the total influenced area. And a pyrolysis smoke layer ratio of 0.0597 kg/m³. The PIR panels show a mass-loss of 250.19 Kg corresponding with a mass-loss of 1.569 % of the total influenced area. The smoke layer ratio is 0.046 kg/m³. The mineral wool roof panels give a total mass-loss of 152.21 kg which give a mass-loss percentage of 0.72% and a smoke layer ratio of 0.027 kg/m³.
Storage building PUR PIR MW
mass loss (kg) 325.9 250.2 156,0
mass loss of influenced area (%) 3.14 1.57 0.74Pyrolysis gas smokelayer ratio (kg/m³) 0.06 0.05 0.03Pyrolysis gas smokelayer ratio (kg/kg) 0.12 0.09 0.05% Pyrolisis mass of total smokelayer mass 11.31 8.2 5.2
Cold Storage building PUR PIR MW
mass loss (kg) 569.9 430.4 271.5
mass loss of influenced area (%) 5.41 2.66 1.28Pyrolysis gas smokelayer ratio (kg/m³) 0.10 0.08 0.05Pyrolysis gas smokelayer ratio (kg/kg) 0.19 0.15 0.05% Pyrolisis mass of total smokelayer mass 16.23 12.76 8.35
Storage building 10*40*8 PUR PIR MWmass loss (kg) 89.84 70.82 43.31mass loss of influenced area (%) 2.59 1.33 0.53Pyrolysis gas smokelayer ratio (kg/m³) 0.01 0.01 0.01Pyrolysis gas smokelayer ratio (kg/kg) 0.03 0.02 0.01% Pyrolisis mass of total smoklayer mass 2.77 2.2 1.35
Storage building single pitched PUR PIR MWmass loss (kg) 379.1 243.4 155.9mass loss of influenced area (%) 3.67 1.53 0.75Pyrolysis gas smokelayer ratio (kg/m³) 0.07 0.04 0.03Pyrolysis gas smokelayer ratio (kg/kg) 0.13 0.08 0.05% Pyrolisis mass of total smokelayer mass 11.86 7.95 5.17
Poultry farm PUR PIR MWmass loss (kg) 276.9 206.5 126.8mass loss of influenced area (%) 1.57 2.46 1.10Pyrolysis gas smokelayer ratio (kg/m³) 0.24 0.18 0.11
Figure 4.23: Results simulation storage building 400oC (SB)
Storage building ( 10*40*8) SBSThe storage building has been simulated with the tested roof sandwich panels. And a similar setup as the storage building (50*30*8) The results of the mass-loss experiments are used to calculate the possible total mass-loss of a realistic fire scenario, simulated in Ozone.
The code for this building type is SBS (storage building small):
Boundary conditions Ozone:Double pitched roof, Rectangular floor;floor area 400 m²;height 8 m;length 40 m;depth 10 m;ceiling height 3 m;roof angle 31o;no openings.Fire growth medium, 6000 Kw/m² RHR, Fire load 511 MJ/m² Floor 15 cm (Normal weight Concrete [EN1994-1-2]) Ceiling and walls sandwich panel properties as tested. The temperature at the start of the simulation is set at 20 degrees Celsius.
Resulting in a total mass-loss of PUR panels in the simulated storage building of 89.8 Kg, corresponding with a mass-loss percentage of 2.59% of the total influenced area, and a pyrolysis smoke layer ratio of 0.0147 kg/m³ The PIR panels show a mass-loss of 70.82 Kg corresponding with a mass-loss of 1.33 % of the total influenced area. The smoke layer ratio is 0.012 kg/m³
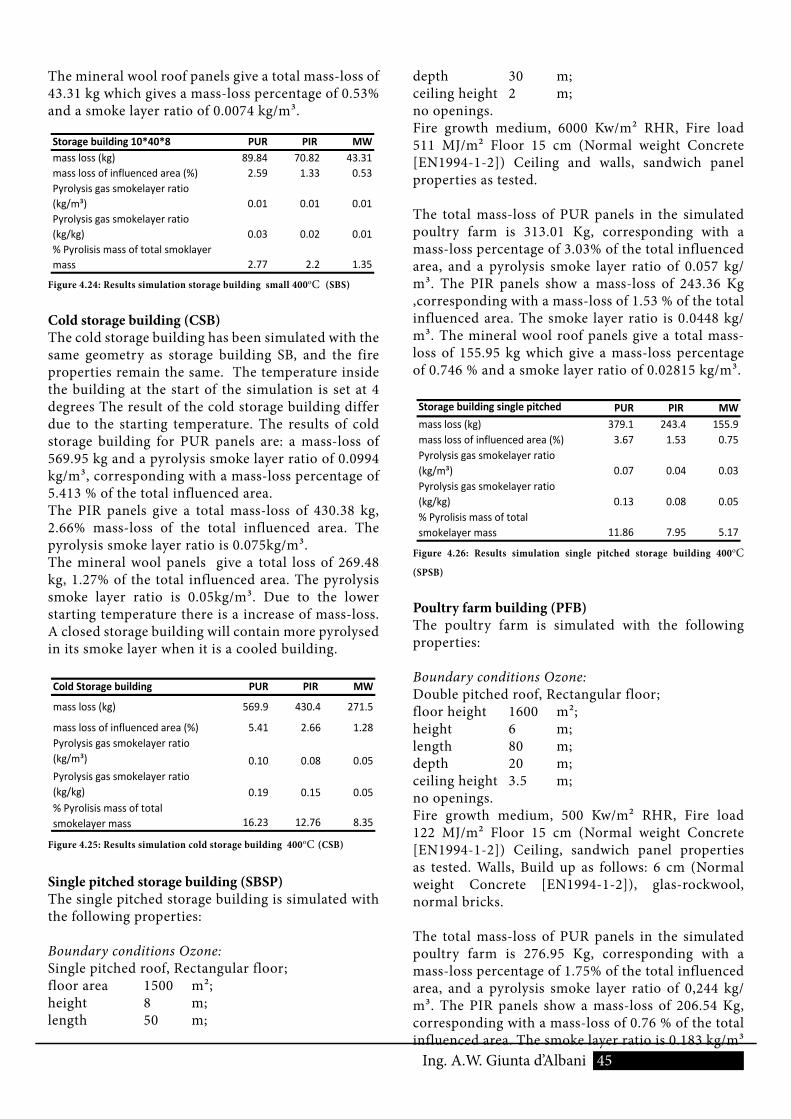
45Ing. A.W. Giunta d’Albani
depth 30 m;ceiling height 2 m;no openings.Fire growth medium, 6000 Kw/m² RHR, Fire load 511 MJ/m² Floor 15 cm (Normal weight Concrete [EN1994-1-2]) Ceiling and walls, sandwich panel properties as tested.
The total mass-loss of PUR panels in the simulated poultry farm is 313.01 Kg, corresponding with a mass-loss percentage of 3.03% of the total influenced area, and a pyrolysis smoke layer ratio of 0.057 kg/m³. The PIR panels show a mass-loss of 243.36 Kg ,corresponding with a mass-loss of 1.53 % of the total influenced area. The smoke layer ratio is 0.0448 kg/m³. The mineral wool roof panels give a total mass-loss of 155.95 kg which give a mass-loss percentage of 0.746 % and a smoke layer ratio of 0.02815 kg/m³.
Storage building PUR PIR MW
mass loss (kg) 325.9 250.2 156,0
mass loss of influenced area (%) 3.14 1.57 0.74Pyrolysis gas smokelayer ratio (kg/m³) 0.06 0.05 0.03Pyrolysis gas smokelayer ratio (kg/kg) 0.12 0.09 0.05% Pyrolisis mass of total smokelayer mass 11.31 8.2 5.2
Cold Storage building PUR PIR MW
mass loss (kg) 569.9 430.4 271.5
mass loss of influenced area (%) 5.41 2.66 1.28Pyrolysis gas smokelayer ratio (kg/m³) 0.10 0.08 0.05Pyrolysis gas smokelayer ratio (kg/kg) 0.19 0.15 0.05% Pyrolisis mass of total smokelayer mass 16.23 12.76 8.35
Storage building 10*40*8 PUR PIR MWmass loss (kg) 89.84 70.82 43.31mass loss of influenced area (%) 2.59 1.33 0.53Pyrolysis gas smokelayer ratio (kg/m³) 0.01 0.01 0.01Pyrolysis gas smokelayer ratio (kg/kg) 0.03 0.02 0.01% Pyrolisis mass of total smoklayer mass 2.77 2.2 1.35
Storage building single pitched PUR PIR MWmass loss (kg) 379.1 243.4 155.9mass loss of influenced area (%) 3.67 1.53 0.75Pyrolysis gas smokelayer ratio (kg/m³) 0.07 0.04 0.03Pyrolysis gas smokelayer ratio (kg/kg) 0.13 0.08 0.05% Pyrolisis mass of total smokelayer mass 11.86 7.95 5.17
Poultry farm PUR PIR MWmass loss (kg) 276.9 206.5 126.8mass loss of influenced area (%) 1.57 2.46 1.10Pyrolysis gas smokelayer ratio (kg/m³) 0.24 0.18 0.11
Figure 4.26: Results simulation single pitched storage building 400oC
(SPSB)
Poultry farm building (PFB)The poultry farm is simulated with the following properties:
Boundary conditions Ozone:Double pitched roof, Rectangular floor;floor height 1600 m²;height 6 m;length 80 m;depth 20 m;ceiling height 3.5 m;no openings.Fire growth medium, 500 Kw/m² RHR, Fire load 122 MJ/m² Floor 15 cm (Normal weight Concrete [EN1994-1-2]) Ceiling, sandwich panel properties as tested. Walls, Build up as follows: 6 cm (Normal weight Concrete [EN1994-1-2]), glas-rockwool, normal bricks.
The total mass-loss of PUR panels in the simulated poultry farm is 276.95 Kg, corresponding with a mass-loss percentage of 1.75% of the total influenced area, and a pyrolysis smoke layer ratio of 0,244 kg/m³. The PIR panels show a mass-loss of 206.54 Kg, corresponding with a mass-loss of 0.76 % of the total influenced area. The smoke layer ratio is 0.183 kg/m³
The mineral wool roof panels give a total mass-loss of 43.31 kg which gives a mass-loss percentage of 0.53% and a smoke layer ratio of 0.0074 kg/m³.
Storage building PUR PIR MW
mass loss (kg) 325.9 250.2 156,0
mass loss of influenced area (%) 3.14 1.57 0.74Pyrolysis gas smokelayer ratio (kg/m³) 0.06 0.05 0.03Pyrolysis gas smokelayer ratio (kg/kg) 0.12 0.09 0.05% Pyrolisis mass of total smokelayer mass 11.31 8.2 5.2
Cold Storage building PUR PIR MW
mass loss (kg) 569.9 430.4 271.5
mass loss of influenced area (%) 5.41 2.66 1.28Pyrolysis gas smokelayer ratio (kg/m³) 0.10 0.08 0.05Pyrolysis gas smokelayer ratio (kg/kg) 0.19 0.15 0.05% Pyrolisis mass of total smokelayer mass 16.23 12.76 8.35
Storage building 10*40*8 PUR PIR MWmass loss (kg) 89.84 70.82 43.31mass loss of influenced area (%) 2.59 1.33 0.53Pyrolysis gas smokelayer ratio (kg/m³) 0.01 0.01 0.01Pyrolysis gas smokelayer ratio (kg/kg) 0.03 0.02 0.01% Pyrolisis mass of total smoklayer mass 2.77 2.2 1.35
Storage building single pitched PUR PIR MWmass loss (kg) 379.1 243.4 155.9mass loss of influenced area (%) 3.67 1.53 0.75Pyrolysis gas smokelayer ratio (kg/m³) 0.07 0.04 0.03Pyrolysis gas smokelayer ratio (kg/kg) 0.13 0.08 0.05% Pyrolisis mass of total smokelayer mass 11.86 7.95 5.17
Poultry farm PUR PIR MWmass loss (kg) 276.9 206.5 126.8mass loss of influenced area (%) 1.57 2.46 1.10Pyrolysis gas smokelayer ratio (kg/m³) 0.24 0.18 0.11
Figure 4.24: Results simulation storage building small 400oC (SBS)
Cold storage building (CSB)The cold storage building has been simulated with the same geometry as storage building SB, and the fire properties remain the same. The temperature inside the building at the start of the simulation is set at 4 degrees The result of the cold storage building differ due to the starting temperature. The results of cold storage building for PUR panels are: a mass-loss of 569.95 kg and a pyrolysis smoke layer ratio of 0.0994 kg/m³, corresponding with a mass-loss percentage of 5.413 % of the total influenced area.The PIR panels give a total mass-loss of 430.38 kg, 2.66% mass-loss of the total influenced area. The pyrolysis smoke layer ratio is 0.075kg/m³.The mineral wool panels give a total loss of 269.48 kg, 1.27% of the total influenced area. The pyrolysis smoke layer ratio is 0.05kg/m³. Due to the lower starting temperature there is a increase of mass-loss. A closed storage building will contain more pyrolysed in its smoke layer when it is a cooled building.
Storage building PUR PIR MW
mass loss (kg) 325.9 250.2 156,0
mass loss of influenced area (%) 3.14 1.57 0.74Pyrolysis gas smokelayer ratio (kg/m³) 0.06 0.05 0.03Pyrolysis gas smokelayer ratio (kg/kg) 0.12 0.09 0.05% Pyrolisis mass of total smokelayer mass 11.31 8.2 5.2
Cold Storage building PUR PIR MW
mass loss (kg) 569.9 430.4 271.5
mass loss of influenced area (%) 5.41 2.66 1.28Pyrolysis gas smokelayer ratio (kg/m³) 0.10 0.08 0.05Pyrolysis gas smokelayer ratio (kg/kg) 0.19 0.15 0.05% Pyrolisis mass of total smokelayer mass 16.23 12.76 8.35
Storage building 10*40*8 PUR PIR MWmass loss (kg) 89.84 70.82 43.31mass loss of influenced area (%) 2.59 1.33 0.53Pyrolysis gas smokelayer ratio (kg/m³) 0.01 0.01 0.01Pyrolysis gas smokelayer ratio (kg/kg) 0.03 0.02 0.01% Pyrolisis mass of total smoklayer mass 2.77 2.2 1.35
Storage building single pitched PUR PIR MWmass loss (kg) 379.1 243.4 155.9mass loss of influenced area (%) 3.67 1.53 0.75Pyrolysis gas smokelayer ratio (kg/m³) 0.07 0.04 0.03Pyrolysis gas smokelayer ratio (kg/kg) 0.13 0.08 0.05% Pyrolisis mass of total smokelayer mass 11.86 7.95 5.17
Poultry farm PUR PIR MWmass loss (kg) 276.9 206.5 126.8mass loss of influenced area (%) 1.57 2.46 1.10Pyrolysis gas smokelayer ratio (kg/m³) 0.24 0.18 0.11
Figure 4.25: Results simulation cold storage building 400oC (CSB)
Single pitched storage building (SBSP)The single pitched storage building is simulated with the following properties:
Boundary conditions Ozone:Single pitched roof, Rectangular floor;floor area 1500 m²;height 8 m;length 50 m;
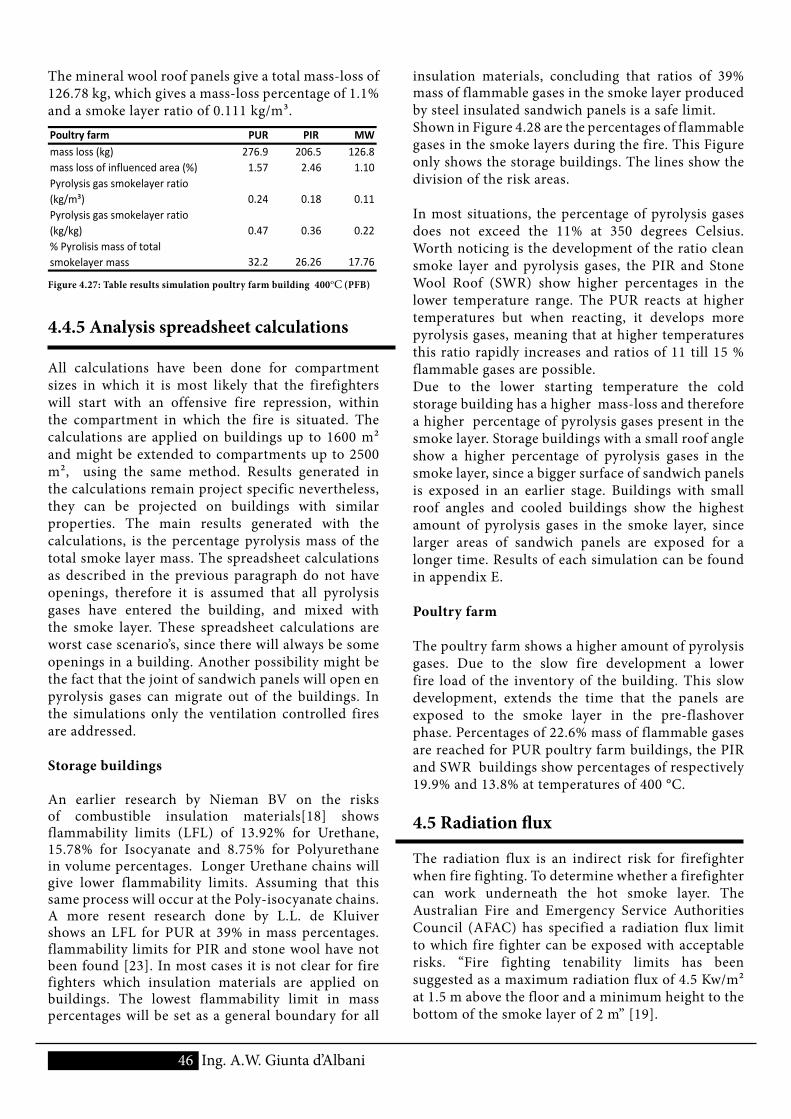
46 Ing. A.W. Giunta d’Albani
insulation materials, concluding that ratios of 39% mass of flammable gases in the smoke layer produced by steel insulated sandwich panels is a safe limit.Shown in Figure 4.28 are the percentages of flammable gases in the smoke layers during the fire. This Figure only shows the storage buildings. The lines show the division of the risk areas.
In most situations, the percentage of pyrolysis gases does not exceed the 11% at 350 degrees Celsius. Worth noticing is the development of the ratio clean smoke layer and pyrolysis gases, the PIR and Stone Wool Roof (SWR) show higher percentages in the lower temperature range. The PUR reacts at higher temperatures but when reacting, it develops more pyrolysis gases, meaning that at higher temperatures this ratio rapidly increases and ratios of 11 till 15 % flammable gases are possible.Due to the lower starting temperature the cold storage building has a higher mass-loss and therefore a higher percentage of pyrolysis gases present in the smoke layer. Storage buildings with a small roof angle show a higher percentage of pyrolysis gases in the smoke layer, since a bigger surface of sandwich panels is exposed in an earlier stage. Buildings with small roof angles and cooled buildings show the highest amount of pyrolysis gases in the smoke layer, since larger areas of sandwich panels are exposed for a longer time. Results of each simulation can be found in appendix E. Poultry farm
The poultry farm shows a higher amount of pyrolysis gases. Due to the slow fire development a lower fire load of the inventory of the building. This slow development, extends the time that the panels are exposed to the smoke layer in the pre-flashover phase. Percentages of 22.6% mass of flammable gases are reached for PUR poultry farm buildings, the PIR and SWR buildings show percentages of respectively 19.9% and 13.8% at temperatures of 400 °C.
4.5 Radiation flux
The radiation flux is an indirect risk for firefighter when fire fighting. To determine whether a firefighter can work underneath the hot smoke layer. The Australian Fire and Emergency Service Authorities Council (AFAC) has specified a radiation flux limit to which fire fighter can be exposed with acceptable risks. “Fire fighting tenability limits has been suggested as a maximum radiation flux of 4.5 Kw/m² at 1.5 m above the floor and a minimum height to the bottom of the smoke layer of 2 m” [19].
The mineral wool roof panels give a total mass-loss of 126.78 kg, which gives a mass-loss percentage of 1.1% and a smoke layer ratio of 0.111 kg/m³.Poultry farm PUR PIR MWmass loss (kg) 276.9 206.5 126.8mass loss of influenced area (%) 1.57 2.46 1.10Pyrolysis gas smokelayer ratio (kg/m³) 0.24 0.18 0.11Pyrolysis gas smokelayer ratio (kg/kg) 0.47 0.36 0.22% Pyrolisis mass of total smokelayer mass 32.2 26.26 17.76
Figure 4.27: Table results simulation poultry farm building 400oC (PFB)
4.4.5 Analysis spreadsheet calculations
All calculations have been done for compartment sizes in which it is most likely that the firefighters will start with an offensive fire repression, within the compartment in which the fire is situated. The calculations are applied on buildings up to 1600 m² and might be extended to compartments up to 2500 m², using the same method. Results generated in the calculations remain project specific nevertheless, they can be projected on buildings with similar properties. The main results generated with the calculations, is the percentage pyrolysis mass of the total smoke layer mass. The spreadsheet calculations as described in the previous paragraph do not have openings, therefore it is assumed that all pyrolysis gases have entered the building, and mixed with the smoke layer. These spreadsheet calculations are worst case scenario’s, since there will always be some openings in a building. Another possibility might be the fact that the joint of sandwich panels will open en pyrolysis gases can migrate out of the buildings. In the simulations only the ventilation controlled fires are addressed.
Storage buildings
An earlier research by Nieman BV on the risks of combustible insulation materials[18] shows flammability limits (LFL) of 13.92% for Urethane, 15.78% for Isocyanate and 8.75% for Polyurethane in volume percentages. Longer Urethane chains will give lower flammability limits. Assuming that this same process will occur at the Poly-isocyanate chains. A more resent research done by L.L. de Kluiver shows an LFL for PUR at 39% in mass percentages. flammability limits for PIR and stone wool have not been found [23]. In most cases it is not clear for fire fighters which insulation materials are applied on buildings. The lowest flammability limit in mass percentages will be set as a general boundary for all
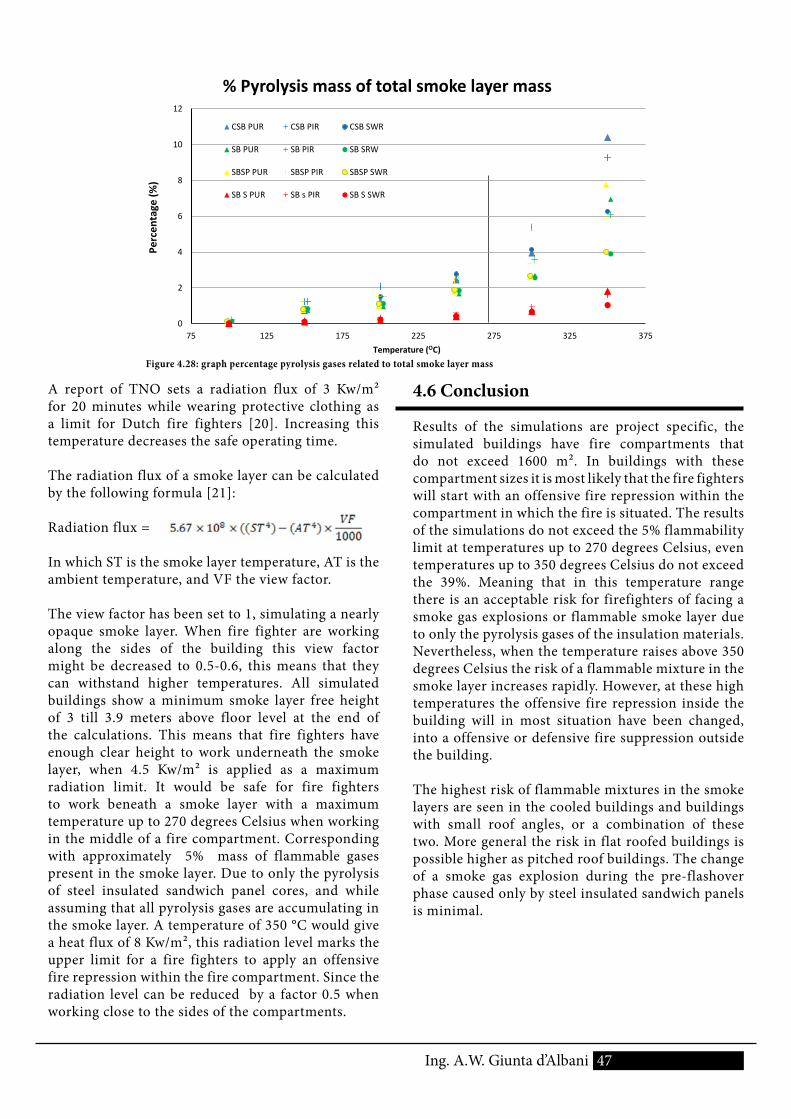
47Ing. A.W. Giunta d’Albani
4.6 Conclusion
Results of the simulations are project specific, the simulated buildings have fire compartments that do not exceed 1600 m². In buildings with these compartment sizes it is most likely that the fire fighters will start with an offensive fire repression within the compartment in which the fire is situated. The results of the simulations do not exceed the 5% flammability limit at temperatures up to 270 degrees Celsius, even temperatures up to 350 degrees Celsius do not exceed the 39%. Meaning that in this temperature range there is an acceptable risk for firefighters of facing a smoke gas explosions or flammable smoke layer due to only the pyrolysis gases of the insulation materials. Nevertheless, when the temperature raises above 350 degrees Celsius the risk of a flammable mixture in the smoke layer increases rapidly. However, at these high temperatures the offensive fire repression inside the building will in most situation have been changed, into a offensive or defensive fire suppression outside the building.
The highest risk of flammable mixtures in the smoke layers are seen in the cooled buildings and buildings with small roof angles, or a combination of these two. More general the risk in flat roofed buildings is possible higher as pitched roof buildings. The change of a smoke gas explosion during the pre-flashover phase caused only by steel insulated sandwich panels is minimal.
A report of TNO sets a radiation flux of 3 Kw/m² for 20 minutes while wearing protective clothing as a limit for Dutch fire fighters [20]. Increasing this temperature decreases the safe operating time.
The radiation flux of a smoke layer can be calculated by the following formula [21]:
Radiation flux =
In which ST is the smoke layer temperature, AT is the ambient temperature, and VF the view factor.
The view factor has been set to 1, simulating a nearly opaque smoke layer. When fire fighter are working along the sides of the building this view factor might be decreased to 0.5-0.6, this means that they can withstand higher temperatures. All simulated buildings show a minimum smoke layer free height of 3 till 3.9 meters above floor level at the end of the calculations. This means that fire fighters have enough clear height to work underneath the smoke layer, when 4.5 Kw/m² is applied as a maximum radiation limit. It would be safe for fire fighters to work beneath a smoke layer with a maximum temperature up to 270 degrees Celsius when working in the middle of a fire compartment. Corresponding with approximately 5% mass of flammable gases present in the smoke layer. Due to only the pyrolysis of steel insulated sandwich panel cores, and while assuming that all pyrolysis gases are accumulating in the smoke layer. A temperature of 350 °C would give a heat flux of 8 Kw/m², this radiation level marks the upper limit for a fire fighters to apply an offensive fire repression within the fire compartment. Since the radiation level can be reduced by a factor 0.5 when working close to the sides of the compartments.
0
2
4
6
8
10
12
75 125 175 225 275 325 375
Perc
enta
ge (%
)
Temperature (OC)
% Pyrolysis mass of total smoke layer mass
CSB PUR CSB PIR CSB SWR
SB PUR SB PIR SB SRW
SBSP PUR SBSP PIR SBSP SWR
SB S PUR SB s PIR SB S SWR
Figure 4.28: graph percentage pyrolysis gases related to total smoke layer mass
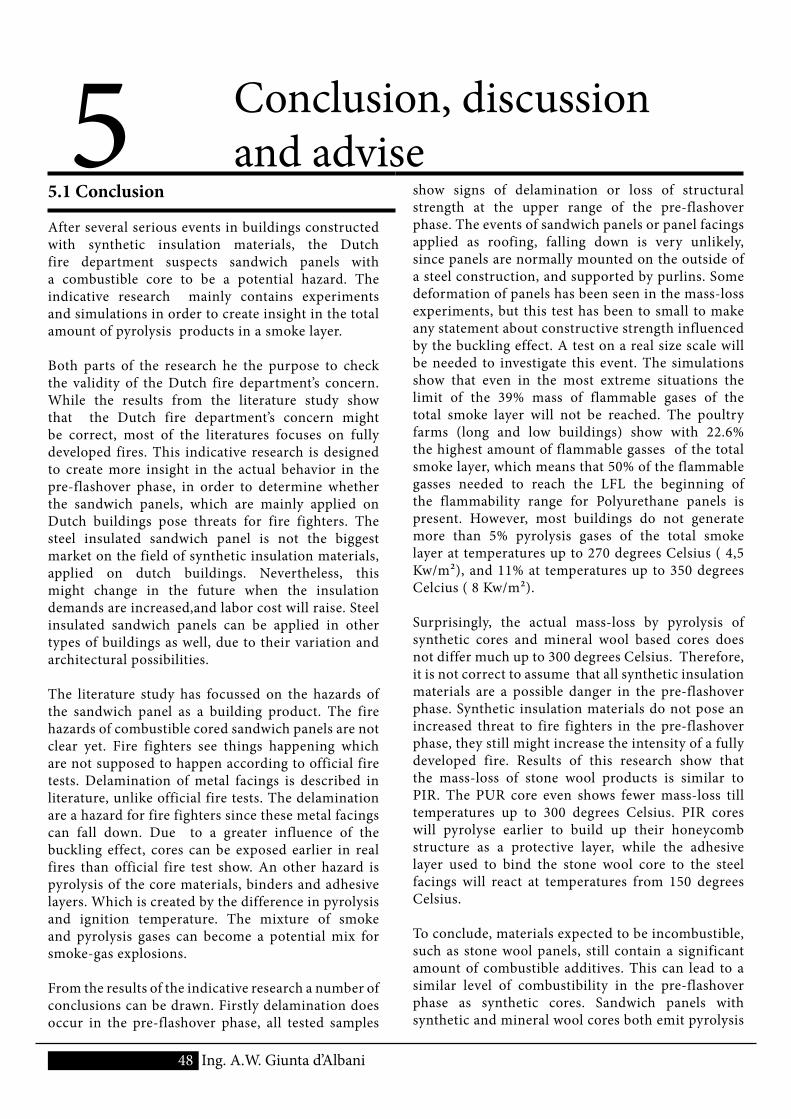
5 Conclusion, discussion and advise
5.1 Conclusion
After several serious events in buildings constructed with synthetic insulation materials, the Dutch fire department suspects sandwich panels with a combustible core to be a potential hazard. The indicative research mainly contains experiments and simulations in order to create insight in the total amount of pyrolysis products in a smoke layer.
Both parts of the research he the purpose to check the validity of the Dutch fire department’s concern. While the results from the literature study show that the Dutch fire department’s concern might be correct, most of the literatures focuses on fully developed fires. This indicative research is designed to create more insight in the actual behavior in the pre-flashover phase, in order to determine whether the sandwich panels, which are mainly applied on Dutch buildings pose threats for fire fighters. The steel insulated sandwich panel is not the biggest market on the field of synthetic insulation materials, applied on dutch buildings. Nevertheless, this might change in the future when the insulation demands are increased,and labor cost will raise. Steel insulated sandwich panels can be applied in other types of buildings as well, due to their variation and architectural possibilities.
The literature study has focussed on the hazards of the sandwich panel as a building product. The fire hazards of combustible cored sandwich panels are not clear yet. Fire fighters see things happening which are not supposed to happen according to official fire tests. Delamination of metal facings is described in literature, unlike official fire tests. The delamination are a hazard for fire fighters since these metal facings can fall down. Due to a greater influence of the buckling effect, cores can be exposed earlier in real fires than official fire test show. An other hazard is pyrolysis of the core materials, binders and adhesive layers. Which is created by the difference in pyrolysis and ignition temperature. The mixture of smoke and pyrolysis gases can become a potential mix for smoke-gas explosions.
From the results of the indicative research a number of conclusions can be drawn. Firstly delamination does occur in the pre-flashover phase, all tested samples
show signs of delamination or loss of structural strength at the upper range of the pre-flashover phase. The events of sandwich panels or panel facings applied as roofing, falling down is very unlikely, since panels are normally mounted on the outside of a steel construction, and supported by purlins. Some deformation of panels has been seen in the mass-loss experiments, but this test has been to small to make any statement about constructive strength influenced by the buckling effect. A test on a real size scale will be needed to investigate this event. The simulations show that even in the most extreme situations the limit of the 39% mass of flammable gases of the total smoke layer will not be reached. The poultry farms (long and low buildings) show with 22.6% the highest amount of flammable gasses of the total smoke layer, which means that 50% of the flammable gasses needed to reach the LFL the beginning of the flammability range for Polyurethane panels is present. However, most buildings do not generate more than 5% pyrolysis gases of the total smoke layer at temperatures up to 270 degrees Celsius ( 4,5 Kw/m²), and 11% at temperatures up to 350 degrees Celcius ( 8 Kw/m²).
Surprisingly, the actual mass-loss by pyrolysis of synthetic cores and mineral wool based cores does not differ much up to 300 degrees Celsius. Therefore, it is not correct to assume that all synthetic insulation materials are a possible danger in the pre-flashover phase. Synthetic insulation materials do not pose an increased threat to fire fighters in the pre-flashover phase, they still might increase the intensity of a fully developed fire. Results of this research show that the mass-loss of stone wool products is similar to PIR. The PUR core even shows fewer mass-loss till temperatures up to 300 degrees Celsius. PIR cores will pyrolyse earlier to build up their honeycomb structure as a protective layer, while the adhesive layer used to bind the stone wool core to the steel facings will react at temperatures from 150 degrees Celsius.
To conclude, materials expected to be incombustible, such as stone wool panels, still contain a significant amount of combustible additives. This can lead to a similar level of combustibility in the pre-flashover phase as synthetic cores. Sandwich panels with synthetic and mineral wool cores both emit pyrolysis
48 Ing. A.W. Giunta d’Albani
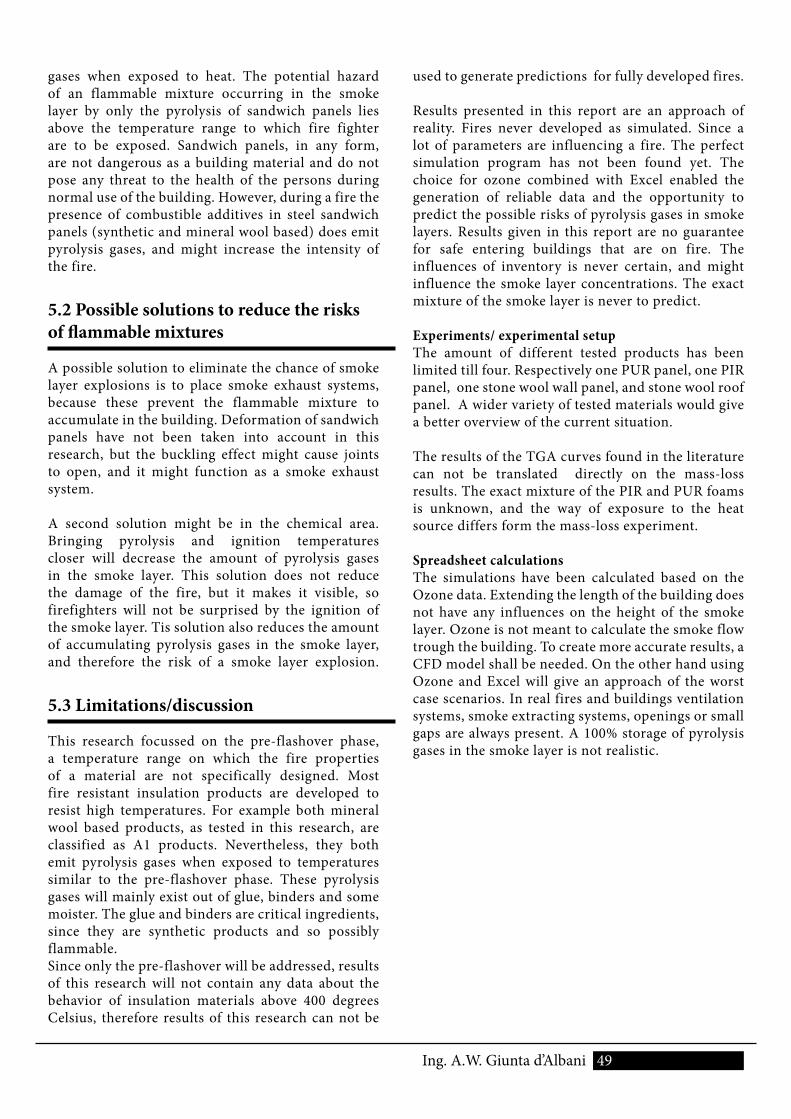
49 Ing. A.W. Giunta d’Albani
used to generate predictions for fully developed fires.
Results presented in this report are an approach of reality. Fires never developed as simulated. Since a lot of parameters are influencing a fire. The perfect simulation program has not been found yet. The choice for ozone combined with Excel enabled the generation of reliable data and the opportunity to predict the possible risks of pyrolysis gases in smoke layers. Results given in this report are no guarantee for safe entering buildings that are on fire. The influences of inventory is never certain, and might influence the smoke layer concentrations. The exact mixture of the smoke layer is never to predict.
Experiments/ experimental setupThe amount of different tested products has been limited till four. Respectively one PUR panel, one PIR panel, one stone wool wall panel, and stone wool roof panel. A wider variety of tested materials would give a better overview of the current situation.
The results of the TGA curves found in the literature can not be translated directly on the mass-loss results. The exact mixture of the PIR and PUR foams is unknown, and the way of exposure to the heat source differs form the mass-loss experiment.
Spreadsheet calculationsThe simulations have been calculated based on the Ozone data. Extending the length of the building does not have any influences on the height of the smoke layer. Ozone is not meant to calculate the smoke flow trough the building. To create more accurate results, a CFD model shall be needed. On the other hand using Ozone and Excel will give an approach of the worst case scenarios. In real fires and buildings ventilation systems, smoke extracting systems, openings or small gaps are always present. A 100% storage of pyrolysis gases in the smoke layer is not realistic.
gases when exposed to heat. The potential hazard of an flammable mixture occurring in the smoke layer by only the pyrolysis of sandwich panels lies above the temperature range to which fire fighter are to be exposed. Sandwich panels, in any form, are not dangerous as a building material and do not pose any threat to the health of the persons during normal use of the building. However, during a fire the presence of combustible additives in steel sandwich panels (synthetic and mineral wool based) does emit pyrolysis gases, and might increase the intensity of the fire.
5.2 Possible solutions to reduce the risks of flammable mixtures
A possible solution to eliminate the chance of smoke layer explosions is to place smoke exhaust systems, because these prevent the flammable mixture to accumulate in the building. Deformation of sandwich panels have not been taken into account in this research, but the buckling effect might cause joints to open, and it might function as a smoke exhaust system.
A second solution might be in the chemical area. Bringing pyrolysis and ignition temperatures closer will decrease the amount of pyrolysis gases in the smoke layer. This solution does not reduce the damage of the fire, but it makes it visible, so firefighters will not be surprised by the ignition of the smoke layer. Tis solution also reduces the amount of accumulating pyrolysis gases in the smoke layer, and therefore the risk of a smoke layer explosion.
5.3 Limitations/discussion
This research focussed on the pre-flashover phase, a temperature range on which the fire properties of a material are not specifically designed. Most fire resistant insulation products are developed to resist high temperatures. For example both mineral wool based products, as tested in this research, are classified as A1 products. Nevertheless, they both emit pyrolysis gases when exposed to temperatures similar to the pre-flashover phase. These pyrolysis gases will mainly exist out of glue, binders and some moister. The glue and binders are critical ingredients, since they are synthetic products and so possibly flammable.Since only the pre-flashover will be addressed, results of this research will not contain any data about the behavior of insulation materials above 400 degrees Celsius, therefore results of this research can not be
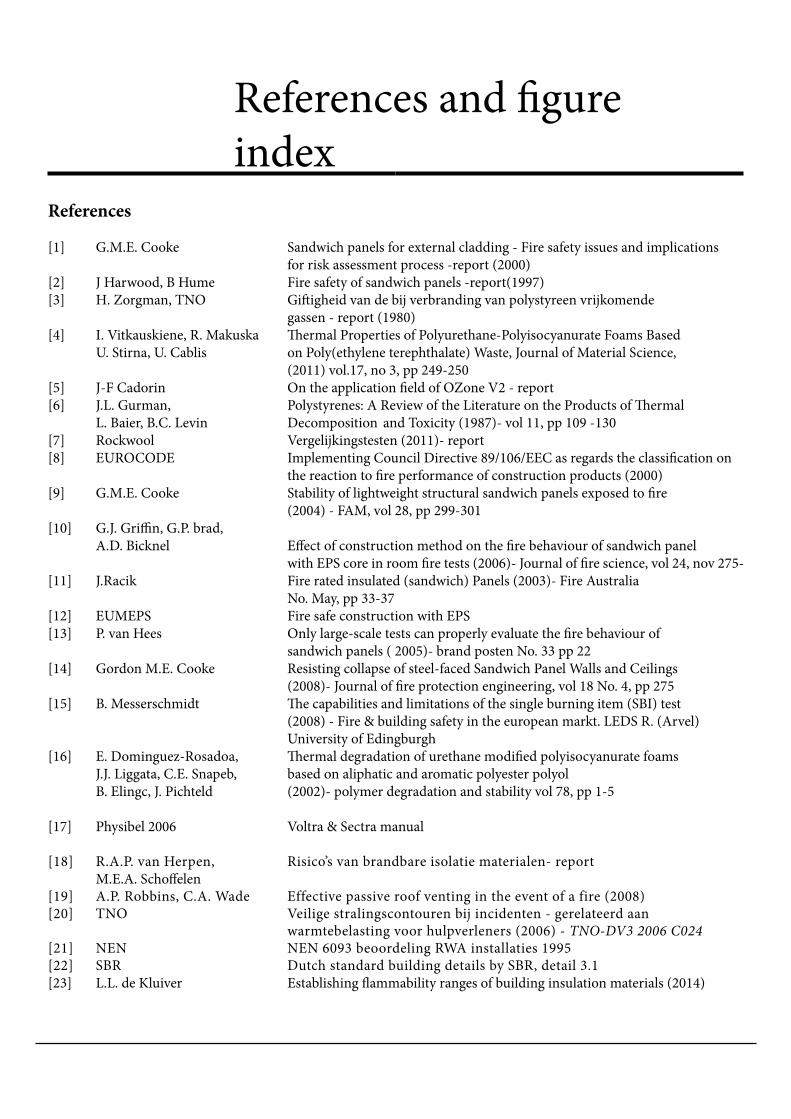
References and figure index
References
[1] G.M.E. Cooke Sandwich panels for external cladding - Fire safety issues and implications for risk assessment process -report (2000)[2] J Harwood, B Hume Fire safety of sandwich panels -report(1997)[3] H. Zorgman, TNO Giftigheid van de bij verbranding van polystyreen vrijkomende gassen - report (1980)[4] I. Vitkauskiene, R. Makuska Thermal Properties of Polyurethane-Polyisocyanurate Foams Based U. Stirna, U. Cablis on Poly(ethylene terephthalate) Waste, Journal of Material Science, (2011) vol.17, no 3, pp 249-250[5] J-F Cadorin On the application field of OZone V2 - report[6] J.L. Gurman, Polystyrenes: A Review of the Literature on the Products of Thermal L. Baier, B.C. Levin Decomposition and Toxicity (1987)- vol 11, pp 109 -130[7] Rockwool Vergelijkingstesten (2011)- report[8] EUROCODE Implementing Council Directive 89/106/EEC as regards the classification on the reaction to fire performance of construction products (2000)[9] G.M.E. Cooke Stability of lightweight structural sandwich panels exposed to fire (2004) - FAM, vol 28, pp 299-301[10] G.J. Griffin, G.P. brad, A.D. Bicknel Effect of construction method on the fire behaviour of sandwich panel with EPS core in room fire tests (2006)- Journal of fire science, vol 24, nov 275-[11] J.Racik Fire rated insulated (sandwich) Panels (2003)- Fire Australia No. May, pp 33-37[12] EUMEPS Fire safe construction with EPS[13] P. van Hees Only large-scale tests can properly evaluate the fire behaviour of sandwich panels ( 2005)- brand posten No. 33 pp 22[14] Gordon M.E. Cooke Resisting collapse of steel-faced Sandwich Panel Walls and Ceilings (2008)- Journal of fire protection engineering, vol 18 No. 4, pp 275[15] B. Messerschmidt The capabilities and limitations of the single burning item (SBI) test (2008) - Fire & building safety in the european markt. LEDS R. (Arvel) University of Edingburgh[16] E. Dominguez-Rosadoa, Thermal degradation of urethane modified polyisocyanurate foams J.J. Liggata, C.E. Snapeb, based on aliphatic and aromatic polyester polyol B. Elingc, J. Pichteld (2002)- polymer degradation and stability vol 78, pp 1-5 [17] Physibel 2006 Voltra & Sectra manual
[18] R.A.P. van Herpen, Risico’s van brandbare isolatie materialen- report M.E.A. Schoffelen[19] A.P. Robbins, C.A. Wade Effective passive roof venting in the event of a fire (2008)[20] TNO Veilige stralingscontouren bij incidenten - gerelateerd aan warmtebelasting voor hulpverleners (2006) - TNO-DV3 2006 C024[21] NEN NEN 6093 beoordeling RWA installaties 1995[22] SBR Dutch standard building details by SBR, detail 3.1 [23] L.L. de Kluiver Establishing flammability ranges of building insulation materials (2014)

Sandwichpanels in LiteratureFigure 1.1: Fire resistance achievable for sandwich panels Taken from Fire Resistance of Sandwich Panel Systems[2]. 15Figure 1.2: Graph of the different ignition temperatures based on the gas temperature of fire room 15Figure 1.3: Fire safety classes as stated in the EUROCODE EUROCODE Council DIrective 89/106/EEC [87] 16Experimental test setupFigure 2.1: Materials properties, samples 20Figure 2.2: Test setup 21Figure 2.3: Heating element 21Figure 2.4: Rails to support the sample tray’s 21Figure 2.5: Sample placed in the tray, without ceramic wool 21Figure 2.6: Technical drawing test setup 23Figure 2.7 Detail 3.1: Taken from SBR[21] 23Figure 2.8: Placing a test sample 7B1 24Figure 2.9: Recovery of the furnace temperature 7B2 24Figure 2.10: Placing the second test sample 7B3 25
Results ExperimentsFigure 3.1: Sample numbers and their aim temperatures as tested 26Figure 3.2: Surface temperatures of all tested samples (thermocouple K3) 26Figure 3.3: Surface temperatures of all tested samples 27Figure 3.4: PUR sample with joint after being exposed to 350 °C 27Figure 3.5: Mass-loss graph PUR samples 27Figure 3.6: Exposure pattern PUR sample 27Figure 3.7: Depth of exposed material graph PUR 27Figure 3.8: Average sample temperatures PUR (during the experiments) 28Figure 3.9: PIR sample with joint after being exposed to 250 °C 28Figure 3.10: PIR sample with joint after being exposed to 350 °C 28Figure 3.11: Mass-loss graph PIR samples 29Figure 3.12: Depth of exposed material graph PIR 29Figure 3.13: Honeycomb structure PIR sample 29Figure 3.14: Average sample temperatures PIR 29Figure 3.15: SWR sample after being exposed to 250 °C 29Figure 3.18: Average sample temperatures SWR during the experiments 30Figure 3.16: SWR sample with joint after being exposed to 350 °C 30Figure 3.17: Mass-loss graph SWR samples 30Figure 3.19: SWW sample after being exposed to 250 °C 30Figure 3.20: SWW sample after being exposed to 350 °C 31Figure 3.21: Mass-loss graph SWW samples 31Figure 3.23: Mass-loss all exposed samples 31Figure 3.22: Average sample temperatures SWW 31Figure 3.24: Average sample weight compared to absolute sample mass-loss 32Figure 3.25: Graph total depth of visually exposed material 32Figure 3.26: Mass-loss in exposed area 350 °C 33Figure 3.27: Graph average sample temperatures (PUR,PIR,SWR) 33Figure 3.28: Graph average sample temperatures (PUR,PIR SWW) 33Figure 3.29: TGA curve of Polyurethane-Polyisocyanurate Foams Based on Poly(ethylene terephthalate) Waste [17} 34
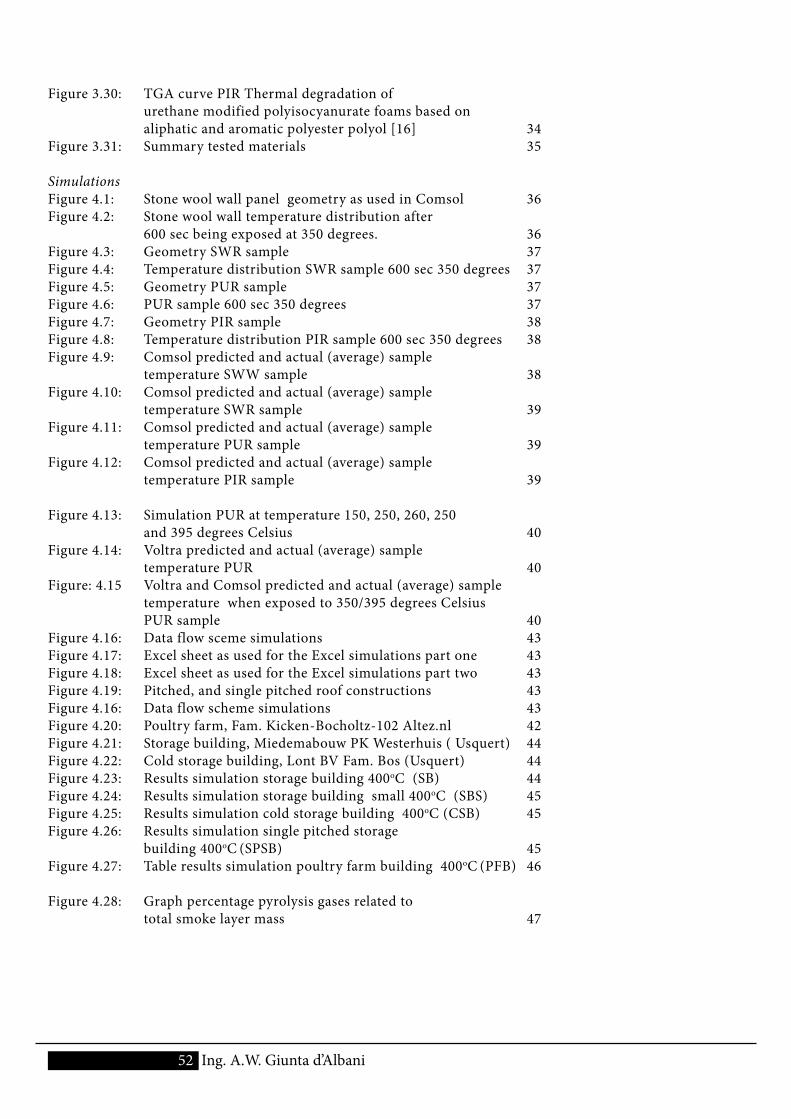
52 Ing. A.W. Giunta d’Albani
Figure 3.30: TGA curve PIR Thermal degradation of urethane modified polyisocyanurate foams based on aliphatic and aromatic polyester polyol [16] 34Figure 3.31: Summary tested materials 35
SimulationsFigure 4.1: Stone wool wall panel geometry as used in Comsol 36Figure 4.2: Stone wool wall temperature distribution after 600 sec being exposed at 350 degrees. 36Figure 4.3: Geometry SWR sample 37Figure 4.4: Temperature distribution SWR sample 600 sec 350 degrees 37Figure 4.5: Geometry PUR sample 37Figure 4.6: PUR sample 600 sec 350 degrees 37Figure 4.7: Geometry PIR sample 38Figure 4.8: Temperature distribution PIR sample 600 sec 350 degrees 38Figure 4.9: Comsol predicted and actual (average) sample temperature SWW sample 38Figure 4.10: Comsol predicted and actual (average) sample temperature SWR sample 39Figure 4.11: Comsol predicted and actual (average) sample temperature PUR sample 39Figure 4.12: Comsol predicted and actual (average) sample temperature PIR sample 39
Figure 4.13: Simulation PUR at temperature 150, 250, 260, 250 and 395 degrees Celsius 40Figure 4.14: Voltra predicted and actual (average) sample temperature PUR 40Figure: 4.15 Voltra and Comsol predicted and actual (average) sample temperature when exposed to 350/395 degrees Celsius PUR sample 40Figure 4.16: Data flow sceme simulations 43Figure 4.17: Excel sheet as used for the Excel simulations part one 43Figure 4.18: Excel sheet as used for the Excel simulations part two 43Figure 4.19: Pitched, and single pitched roof constructions 43Figure 4.16: Data flow scheme simulations 43Figure 4.20: Poultry farm, Fam. Kicken-Bocholtz-102 Altez.nl 42Figure 4.21: Storage building, Miedemabouw PK Westerhuis ( Usquert) 44Figure 4.22: Cold storage building, Lont BV Fam. Bos (Usquert) 44Figure 4.23: Results simulation storage building 400oC (SB) 44Figure 4.24: Results simulation storage building small 400oC (SBS) 45Figure 4.25: Results simulation cold storage building 400oC (CSB) 45Figure 4.26: Results simulation single pitched storage building 400oC (SPSB) 45Figure 4.27: Table results simulation poultry farm building 400oC (PFB) 46
Figure 4.28: Graph percentage pyrolysis gases related to total smoke layer mass 47

53Ing. A.W. Giunta d’Albani

Appendixes
54 Ing. A.W. Giunta d’Albani

55Ing. A.W. Giunta d’Albani
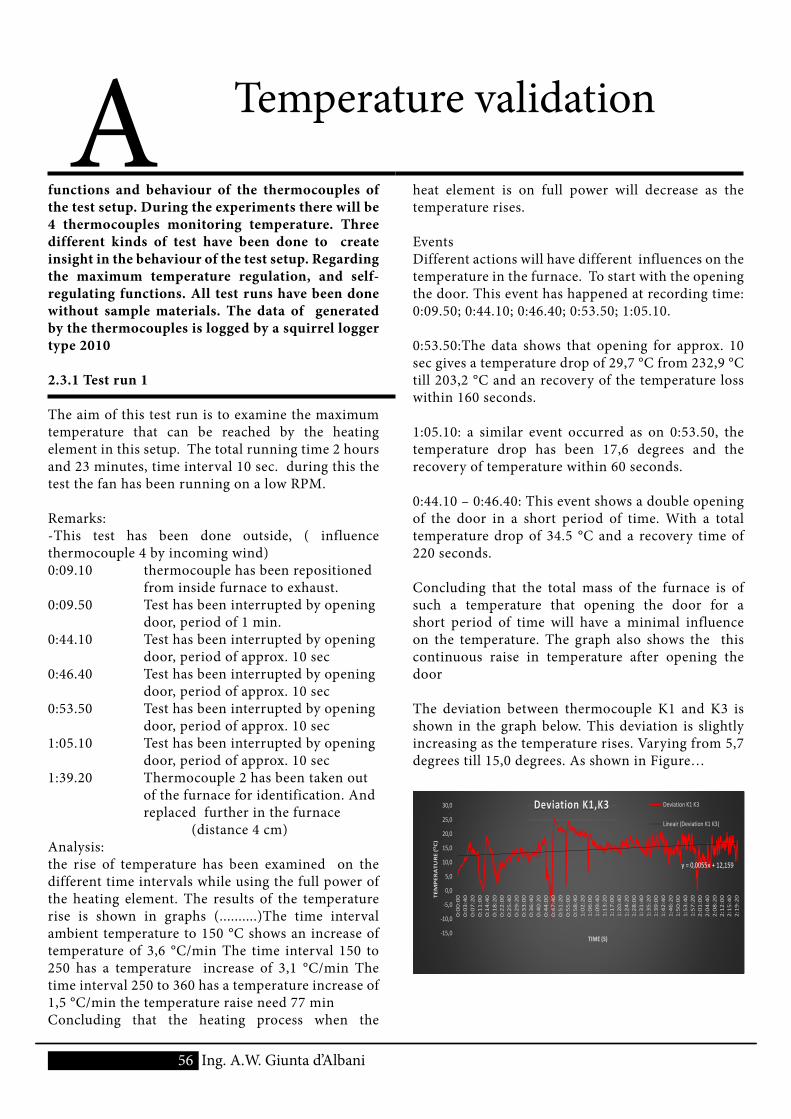
56 Ing. A.W. Giunta d’Albani
A Temperature validation
functions and behaviour of the thermocouples of the test setup. During the experiments there will be 4 thermocouples monitoring temperature. Three different kinds of test have been done to create insight in the behaviour of the test setup. Regarding the maximum temperature regulation, and self-regulating functions. All test runs have been done without sample materials. The data of generated by the thermocouples is logged by a squirrel logger type 2010
2.3.1 Test run 1
The aim of this test run is to examine the maximum temperature that can be reached by the heating element in this setup. The total running time 2 hours and 23 minutes, time interval 10 sec. during this the test the fan has been running on a low RPM.
Remarks: -This test has been done outside, ( influence thermocouple 4 by incoming wind)0:09.10 thermocouple has been repositioned from inside furnace to exhaust.0:09.50 Test has been interrupted by opening door, period of 1 min.0:44.10 Test has been interrupted by opening door, period of approx. 10 sec0:46.40 Test has been interrupted by opening door, period of approx. 10 sec0:53.50 Test has been interrupted by opening door, period of approx. 10 sec1:05.10 Test has been interrupted by opening door, period of approx. 10 sec1:39.20 Thermocouple 2 has been taken out of the furnace for identification. And replaced further in the furnace (distance 4 cm)Analysis:the rise of temperature has been examined on the different time intervals while using the full power of the heating element. The results of the temperature rise is shown in graphs (..........)The time interval ambient temperature to 150 °C shows an increase of temperature of 3,6 °C/min The time interval 150 to 250 has a temperature increase of 3,1 °C/min The time interval 250 to 360 has a temperature increase of 1,5 °C/min the temperature raise need 77 minConcluding that the heating process when the
heat element is on full power will decrease as the temperature rises.
Events Different actions will have different influences on the temperature in the furnace. To start with the opening the door. This event has happened at recording time: 0:09.50; 0:44.10; 0:46.40; 0:53.50; 1:05.10.
0:53.50:The data shows that opening for approx. 10 sec gives a temperature drop of 29,7 °C from 232,9 °C till 203,2 °C and an recovery of the temperature loss within 160 seconds.
1:05.10: a similar event occurred as on 0:53.50, the temperature drop has been 17,6 degrees and the recovery of temperature within 60 seconds.
0:44.10 – 0:46.40: This event shows a double opening of the door in a short period of time. With a total temperature drop of 34.5 °C and a recovery time of 220 seconds.
Concluding that the total mass of the furnace is of such a temperature that opening the door for a short period of time will have a minimal influence on the temperature. The graph also shows the this continuous raise in temperature after opening the door
The deviation between thermocouple K1 and K3 is shown in the graph below. This deviation is slightly increasing as the temperature rises. Varying from 5,7 degrees till 15,0 degrees. As shown in Figure…
y = 0,0055x + 12,159
‐15,0
‐10,0
‐5,0
0,0
5,0
10,0
15,0
20,0
25,0
30,0
0:00:00
0:03:40
0:07:20
0:11:00
0:14:40
0:18:20
0:22:00
0:25:40
0:29:20
0:33:00
0:36:40
0:40:20
0:44:00
0:47:40
0:51:20
0:55:00
0:58:40
1:02:20
1:06:00
1:09:40
1:13:20
1:17:00
1:20:40
1:24:20
1:28:00
1:31:40
1:35:20
1:39:00
1:42:40
1:46:20
1:50:00
1:53:40
1:57:20
2:01:00
2:04:40
2:08:20
2:12:00
2:15:40
2:19:20TEM
PER
ATU
RE (OC)
TIME (S)
Deviation K1,K3 Deviation K1 K3
Lineair (Deviation K1 K3)
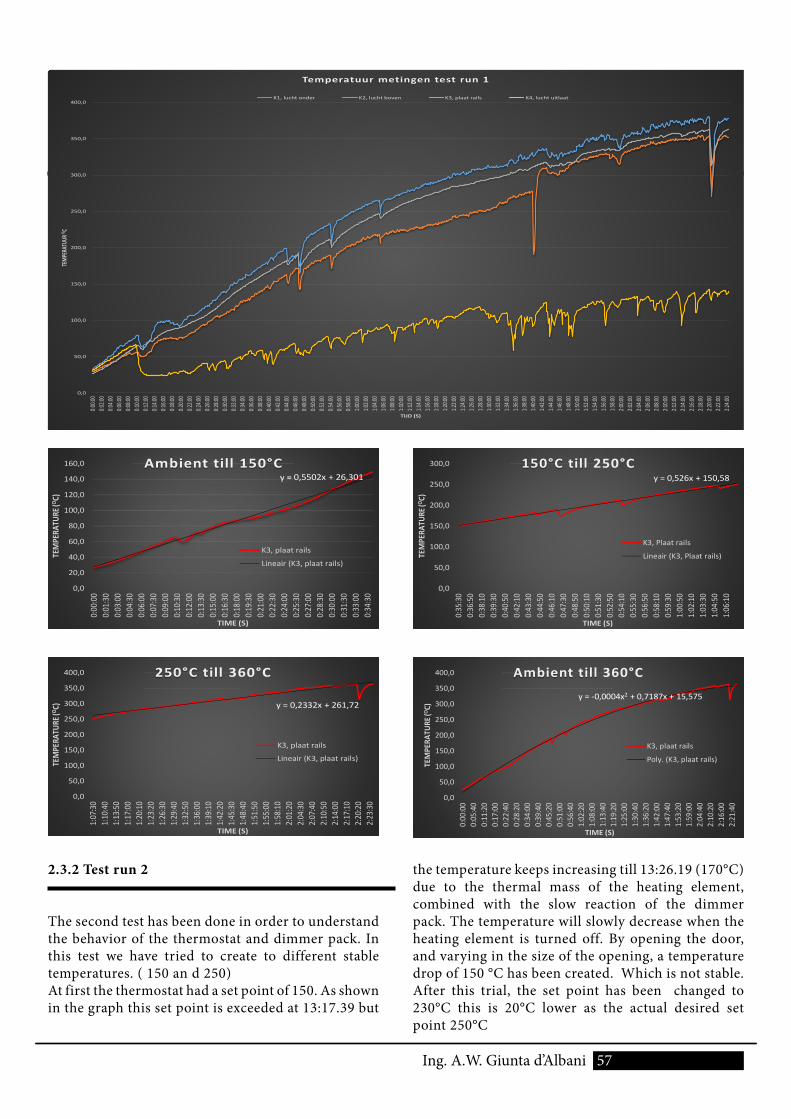
57Ing. A.W. Giunta d’Albani
1.1Introduction
y = 0,5502x + 26,301
0,0
20,0
40,0
60,0
80,0
100,0
120,0
140,0
160,0
0:00
:00
0:01
:30
0:03
:00
0:04
:30
0:06
:00
0:07
:30
0:09
:00
0:10
:30
0:12
:00
0:13
:30
0:15
:00
0:16
:30
0:18
:00
0:19
:30
0:21
:00
0:22
:30
0:24
:00
0:25
:30
0:27
:00
0:28
:30
0:30
:00
0:31
:30
0:33
:00
0:34
:30
TEMPE
RATU
RE (OC)
TIME (S)
Ambient till 150°C
K3, plaat rails
Lineair (K3, plaat rails)
y = 0,526x + 150,58
0,0
50,0
100,0
150,0
200,0
250,0
300,00:35
:30
0:36
:50
0:38
:10
0:39
:30
0:40
:50
0:42
:10
0:43
:30
0:44
:50
0:46
:10
0:47
:30
0:48
:50
0:50
:10
0:51
:30
0:52
:50
0:54
:10
0:55
:30
0:56
:50
0:58
:10
0:59
:30
1:00
:50
1:02
:10
1:03
:30
1:04
:50
1:06
:10
TEMPE
RATU
RE (OC)
TIME (S)
150°C till 250°C
K3, Plaat rails
Lineair (K3, Plaat rails)
y = 0,2332x + 261,72
0,0
50,0
100,0
150,0
200,0
250,0
300,0
350,0
400,0
1:07
:30
1:10
:40
1:13
:50
1:17
:00
1:20
:10
1:23
:20
1:26
:30
1:29
:40
1:32
:50
1:36
:00
1:39
:10
1:42
:20
1:45
:30
1:48
:40
1:51
:50
1:55
:00
1:58
:10
2:01
:20
2:04
:30
2:07
:40
2:10
:50
2:14
:00
2:17
:10
2:20
:20
2:23
:30
TEMPE
RATU
RE (OC)
TIME (S)
250°C till 360°C
K3, plaat rails
Lineair (K3, plaat rails)
y = ‐0,0004x2 + 0,7187x + 15,575
0,0
50,0
100,0
150,0
200,0
250,0
300,0
350,0
400,0
0:00
:00
0:05
:40
0:11
:20
0:17
:00
0:22
:40
0:28
:20
0:34
:00
0:39
:40
0:45
:20
0:51
:00
0:56
:40
1:02
:20
1:08
:00
1:13
:40
1:19
:20
1:25
:00
1:30
:40
1:36
:20
1:42
:00
1:47
:40
1:53
:20
1:59
:00
2:04
:40
2:10
:20
2:16
:00
2:21
:40
TEMPE
RATU
RE (OC)
TIME (S)
Ambient till 360°C
K3, plaat rails
Poly. (K3, plaat rails)
0,0
50,0
100,0
150,0
200,0
250,0
300,0
350,0
400,0
0:00:0
00:0
2:00
0:04:0
00:0
6:00
0:08:0
00:1
0:00
0:12:0
00:1
4:00
0:16:0
00:1
8:00
0:20:0
00:2
2:00
0:24:0
00:2
6:00
0:28:0
00:3
0:00
0:32:0
00:3
4:00
0:36:0
00:3
8:00
0:40:0
00:4
2:00
0:44:0
00:4
6:00
0:48:0
00:5
0:00
0:52:0
00:5
4:00
0:56:0
00:5
8:00
1:00:0
01:0
2:00
1:04:0
01:0
6:00
1:08:0
01:1
0:00
1:12:0
01:1
4:00
1:16:0
01:1
8:00
1:20:0
01:2
2:00
1:24:0
01:2
6:00
1:28:0
01:3
0:00
1:32:0
01:3
4:00
1:36:0
01:3
8:00
1:40:0
01:4
2:00
1:44:0
01:4
6:00
1:48:0
01:5
0:00
1:52:0
01:5
4:00
1:56:0
01:5
8:00
2:00:0
02:0
2:00
2:04:0
02:0
6:00
2:08:0
02:1
0:00
2:12:0
02:1
4:00
2:16:0
02:1
8:00
2:20:0
02:2
2:00
2:24:0
0
TEM
PERA
TUUR
O C
TIJD (S)
Temperatuur metingen test run 1
K1, lucht onder K2, lucht boven K3, plaat rails K4, lucht uitlaat
2.3.2 Test run 2
The second test has been done in order to understand the behavior of the thermostat and dimmer pack. In this test we have tried to create to different stable temperatures. ( 150 an d 250) At first the thermostat had a set point of 150. As shown in the graph this set point is exceeded at 13:17.39 but
the temperature keeps increasing till 13:26.19 (170°C) due to the thermal mass of the heating element, combined with the slow reaction of the dimmer pack. The temperature will slowly decrease when the heating element is turned off. By opening the door, and varying in the size of the opening, a temperature drop of 150 °C has been created. Which is not stable. After this trial, the set point has been changed to 230°C this is 20°C lower as the actual desired set point 250°C
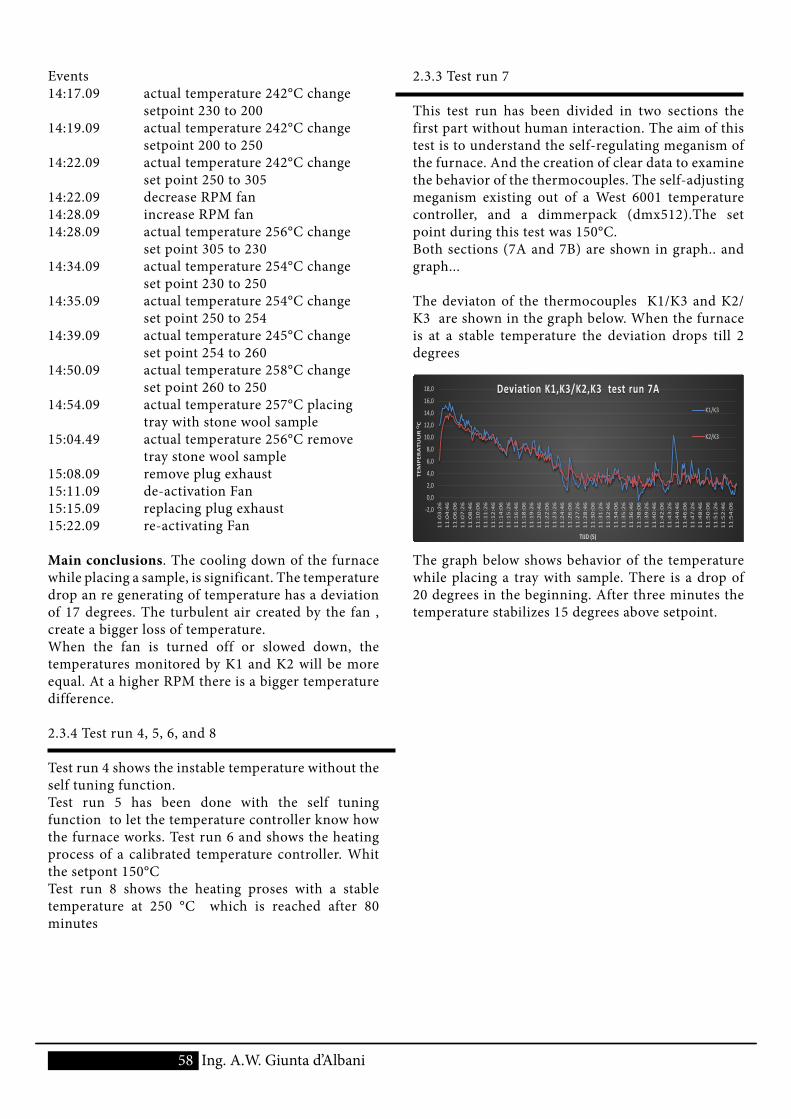
58 Ing. A.W. Giunta d’Albani
Events14:17.09 actual temperature 242°C change setpoint 230 to 20014:19.09 actual temperature 242°C change setpoint 200 to 25014:22.09 actual temperature 242°C change set point 250 to 30514:22.09 decrease RPM fan14:28.09 increase RPM fan14:28.09 actual temperature 256°C change set point 305 to 23014:34.09 actual temperature 254°C change set point 230 to 25014:35.09 actual temperature 254°C change set point 250 to 25414:39.09 actual temperature 245°C change set point 254 to 26014:50.09 actual temperature 258°C change set point 260 to 25014:54.09 actual temperature 257°C placing tray with stone wool sample15:04.49 actual temperature 256°C remove tray stone wool sample15:08.09 remove plug exhaust15:11.09 de-activation Fan15:15.09 replacing plug exhaust15:22.09 re-activating Fan
Main conclusions. The cooling down of the furnace while placing a sample, is significant. The temperature drop an re generating of temperature has a deviation of 17 degrees. The turbulent air created by the fan , create a bigger loss of temperature.When the fan is turned off or slowed down, the temperatures monitored by K1 and K2 will be more equal. At a higher RPM there is a bigger temperature difference.
2.3.4 Test run 4, 5, 6, and 8
Test run 4 shows the instable temperature without the self tuning function.Test run 5 has been done with the self tuning function to let the temperature controller know how the furnace works. Test run 6 and shows the heating process of a calibrated temperature controller. Whit the setpont 150°C Test run 8 shows the heating proses with a stable temperature at 250 °C which is reached after 80 minutes
2.3.3 Test run 7
This test run has been divided in two sections the first part without human interaction. The aim of this test is to understand the self-regulating meganism of the furnace. And the creation of clear data to examine the behavior of the thermocouples. The self-adjusting meganism existing out of a West 6001 temperature controller, and a dimmerpack (dmx512).The set point during this test was 150°C. Both sections (7A and 7B) are shown in graph.. and graph...
The deviaton of the thermocouples K1/K3 and K2/K3 are shown in the graph below. When the furnace is at a stable temperature the deviation drops till 2 degrees
-2,0
0,0
2,0
4,0
6,0
8,0
10,0
12,0
14,0
16,0
18,0
11
:03
:26
11
:04
:46
11
:06
:06
11
:07
:26
11
:08
:46
11
:10
:06
11
:11
:26
11
:12
:46
11
:14
:06
11
:15
:26
11
:16
:46
11
:18
:06
11
:19
:26
11
:20
:46
11
:22
:06
11
:23
:26
11
:24
:46
11
:26
:06
11
:27
:26
11
:28
:46
11
:30
:06
11
:31
:26
11
:32
:46
11
:34
:06
11
:35
:26
11
:36
:46
11
:38
:06
11
:39
:26
11
:40
:46
11
:42
:06
11
:43
:26
11
:44
:46
11
:46
:06
11
:47
:26
11
:48
:46
11
:50
:06
11
:51
:26
11
:52
:46
11
:54
:06
TE
MP
ER
AT
UU
R O
C
TIJD (S)
Deviation K1,K3/K2,K3 test run 7AK1/K3
K2/K3
The graph below shows behavior of the temperature while placing a tray with sample. There is a drop of 20 degrees in the beginning. After three minutes the temperature stabilizes 15 degrees above setpoint.
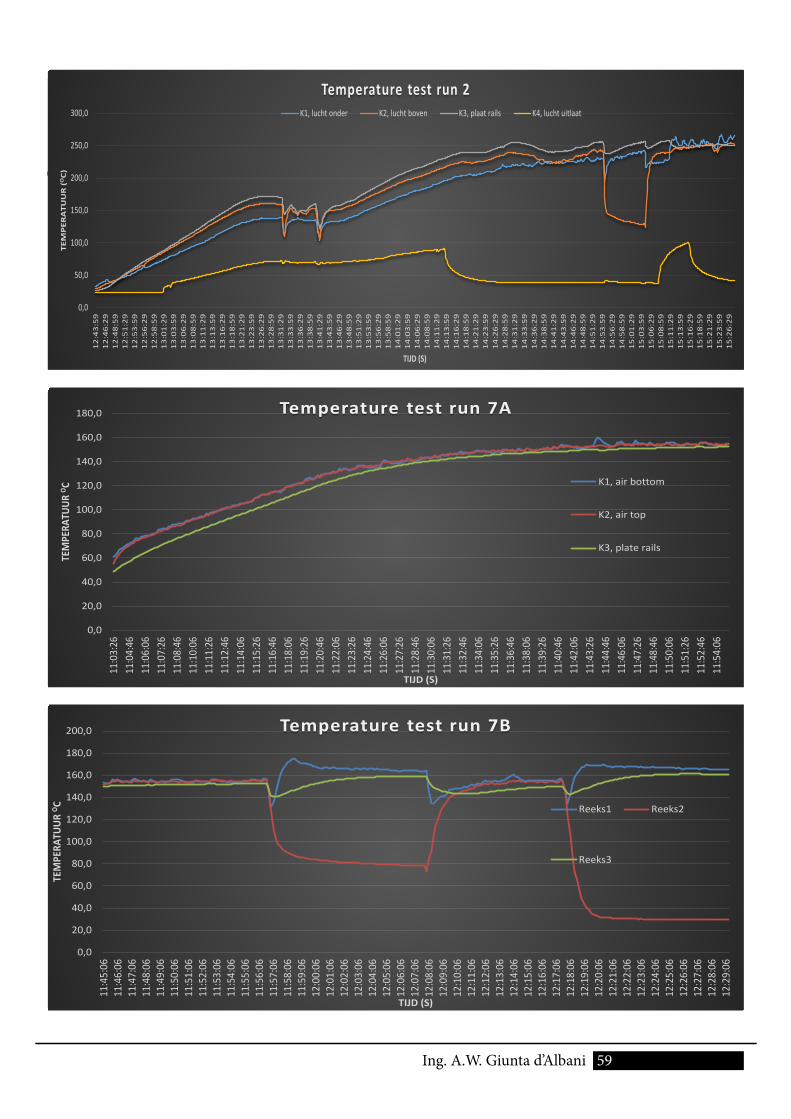
59 Ing. A.W. Giunta d’Albani
1.1Introduction
0,0
50,0
100,0
150,0
200,0
250,0
300,012
:43:59
12:46
:2912
:48:59
12:51
:2912
:53:59
12:56
:2912
:58:59
13:01
:2913
:03:59
13:06
:2913
:08:59
13:11
:2913
:13:59
13:16
:2913
:18:59
13:21
:2913
:23:59
13:26
:2913
:28:59
13:31
:2913
:33:59
13:36
:2913
:38:59
13:41
:2913
:43:59
13:46
:2913
:48:59
13:51
:2913
:53:59
13:56
:2913
:58:59
14:01
:2914
:03:59
14:06
:2914
:08:59
14:11
:2914
:13:59
14:16
:2914
:18:59
14:21
:2914
:23:59
14:26
:2914
:28:59
14:31
:2914
:33:59
14:36
:2914
:38:59
14:41
:2914
:43:59
14:46
:2914
:48:59
14:51
:2914
:53:59
14:56
:2914
:58:59
15:01
:2915
:03:59
15:06
:2915
:08:59
15:11
:2915
:13:59
15:16
:2915
:18:59
15:21
:2915
:23:59
15:26
:29
TEMP
ERAT
UUR (
O C)
TIJD (S)
Temperature test run 2K1, lucht onder K2, lucht boven K3, plaat rails K4, lucht uitlaat
0,0
50,0
100,0
150,0
200,0
250,0
300,0
12
:43
:59
12
:46
:29
12
:48
:59
12
:51
:29
12
:53
:59
12
:56
:29
12
:58
:59
13
:01
:29
13
:03
:59
13
:06
:29
13
:08
:59
13
:11
:29
13
:13
:59
13
:16
:29
13
:18
:59
13
:21
:29
13
:23
:59
13
:26
:29
13
:28
:59
13
:31
:29
13
:33
:59
13
:36
:29
13
:38
:59
13
:41
:29
13
:43
:59
13
:46
:29
13
:48
:59
13
:51
:29
13
:53
:59
13
:56
:29
13
:58
:59
14
:01
:29
14
:03
:59
14
:06
:29
14
:08
:59
14
:11
:29
14
:13
:59
14
:16
:29
14
:18
:59
14
:21
:29
14
:23
:59
14
:26
:29
14
:28
:59
14
:31
:29
14
:33
:59
14
:36
:29
14
:38
:59
14
:41
:29
14
:43
:59
14
:46
:29
14
:48
:59
14
:51
:29
14
:53
:59
14
:56
:29
14
:58
:59
15
:01
:29
15
:03
:59
15
:06
:29
15
:08
:59
15
:11
:29
15
:13
:59
15
:16
:29
15
:18
:59
15
:21
:29
15
:23
:59
15
:26
:29
TEM
PER
ATU
UR
(O
C)
TIJD (S)
Temperature test run 2K1, lucht onder K2, lucht boven K3, plaat rails K4, lucht uitlaat
0,0
20,0
40,0
60,0
80,0
100,0
120,0
140,0
160,0
180,0
11:0
3:26
11:0
4:46
11:0
6:06
11:0
7:26
11:0
8:46
11:1
0:06
11:1
1:26
11:1
2:46
11:1
4:06
11:1
5:26
11:1
6:46
11:1
8:06
11:1
9:26
11:2
0:46
11:2
2:06
11:2
3:26
11:2
4:46
11:2
6:06
11:2
7:26
11:2
8:46
11:3
0:06
11:3
1:26
11:3
2:46
11:3
4:06
11:3
5:26
11:3
6:46
11:3
8:06
11:3
9:26
11:4
0:46
11:4
2:06
11:4
3:26
11:4
4:46
11:4
6:06
11:4
7:26
11:4
8:46
11:5
0:06
11:5
1:26
11:5
2:46
11:5
4:06
TEM
PERA
TUUR
O C
TIJD (S)
Temperature test run 7A
K1, air bottom
K2, air top
K3, plate rails
0,0
20,0
40,0
60,0
80,0
100,0
120,0
140,0
160,0
180,0
200,0
11:4
5:06
11:4
6:06
11:4
7:06
11:4
8:06
11:4
9:06
11:5
0:06
11:5
1:06
11:5
2:06
11:5
3:06
11:5
4:06
11:5
5:06
11:5
6:06
11:5
7:06
11:5
8:06
11:5
9:06
12:0
0:06
12:0
1:06
12:0
2:06
12:0
3:06
12:0
4:06
12:0
5:06
12:0
6:06
12:0
7:06
12:0
8:06
12:0
9:06
12:1
0:06
12:1
1:06
12:1
2:06
12:1
3:06
12:1
4:06
12:1
5:06
12:1
6:06
12:1
7:06
12:1
8:06
12:1
9:06
12:2
0:06
12:2
1:06
12:2
2:06
12:2
3:06
12:2
4:06
12:2
5:06
12:2
6:06
12:2
7:06
12:2
8:06
12:2
9:06
TEM
PERA
TUUR
OC
TIJD (S)
Temperature test run 7B
Reeks1 Reeks2
Reeks3
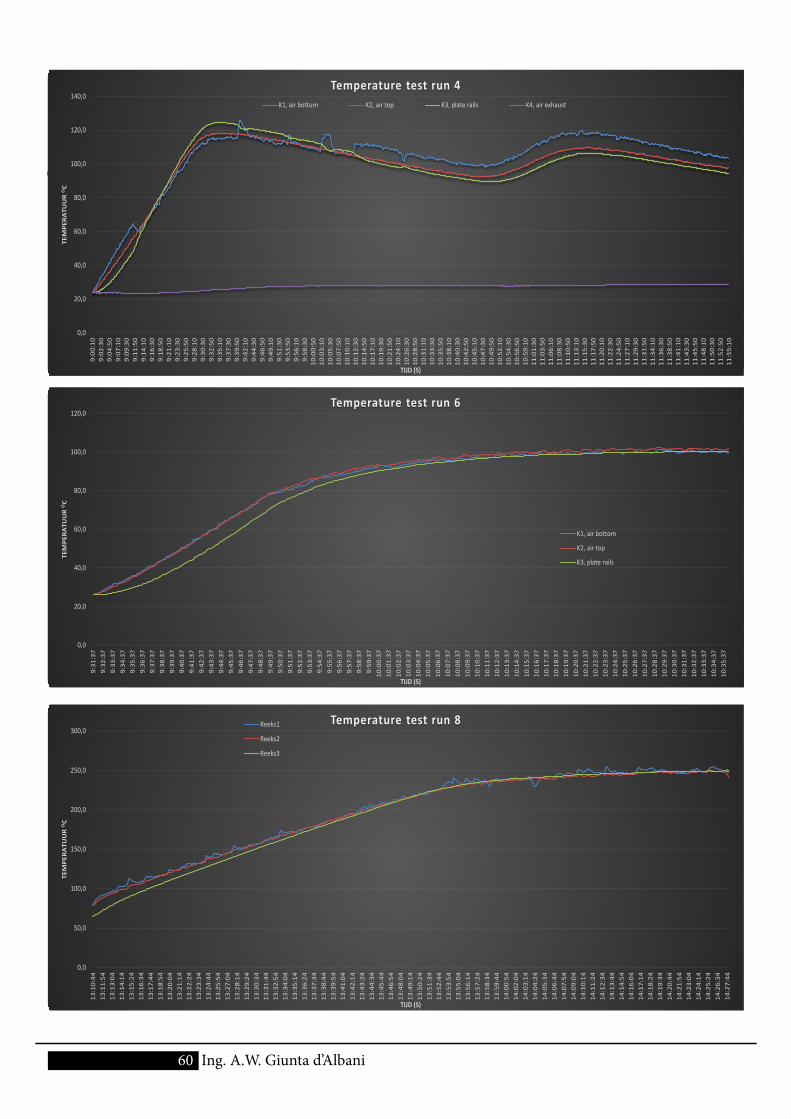
1.1Introduction
60 Ing. A.W. Giunta d’Albani
0,0
20,0
40,0
60,0
80,0
100,0
120,0
140,0
10:3
5:53
10:3
9:23
10:4
2:53
10:4
6:23
10:4
9:53
10:5
3:23
10:5
6:53
11:0
0:23
11:0
3:53
11:0
7:23
11:1
0:53
11:1
4:23
11:1
7:53
11:2
1:23
11:2
4:53
11:2
8:23
11:3
1:53
11:3
5:23
11:3
8:53
11:4
2:23
11:4
5:53
11:4
9:23
11:5
2:53
11:5
6:23
11:5
9:53
12:0
3:23
12:0
6:53
12:1
0:23
12:1
3:53
12:1
7:23
12:2
0:53
12:2
4:23
12:2
7:53
12:3
1:23
12:3
4:53
12:3
8:23
12:4
1:53
12:4
5:23
12:4
8:53
12:5
2:23
12:5
5:53
12:5
9:23
13:0
2:53
13:0
6:23
13:0
9:53
13:1
3:23
13:1
6:53
13:2
0:23
13:2
3:53
13:2
7:23
13:3
0:53
13:3
4:23
13:3
7:53
13:4
1:23
13:4
4:53
13:4
8:23
13:5
1:53
13:5
5:23
13:5
8:53
14:0
2:23
14:0
5:53
14:0
9:23
14:1
2:53
14:1
6:23
TEM
PERA
TUU
R O
C
TIJD (S)
Temperature test run 3K1, air bottum K2, air top K3, plate rails K4, air exhaust
0,0
50,0
100,0
150,0
200,0
250,0
300,0
12
:43
:59
12
:46
:29
12
:48
:59
12
:51
:29
12
:53
:59
12
:56
:29
12
:58
:59
13
:01
:29
13
:03
:59
13
:06
:29
13
:08
:59
13
:11
:29
13
:13
:59
13
:16
:29
13
:18
:59
13
:21
:29
13
:23
:59
13
:26
:29
13
:28
:59
13
:31
:29
13
:33
:59
13
:36
:29
13
:38
:59
13
:41
:29
13
:43
:59
13
:46
:29
13
:48
:59
13
:51
:29
13
:53
:59
13
:56
:29
13
:58
:59
14
:01
:29
14
:03
:59
14
:06
:29
14
:08
:59
14
:11
:29
14
:13
:59
14
:16
:29
14
:18
:59
14
:21
:29
14
:23
:59
14
:26
:29
14
:28
:59
14
:31
:29
14
:33
:59
14
:36
:29
14
:38
:59
14
:41
:29
14
:43
:59
14
:46
:29
14
:48
:59
14
:51
:29
14
:53
:59
14
:56
:29
14
:58
:59
15
:01
:29
15
:03
:59
15
:06
:29
15
:08
:59
15
:11
:29
15
:13
:59
15
:16
:29
15
:18
:59
15
:21
:29
15
:23
:59
15
:26
:29
TEM
PER
ATU
UR
(O
C)
TIJD (S)
Temperature test run 2K1, lucht onder K2, lucht boven K3, plaat rails K4, lucht uitlaat
0,0
50,0
100,0
150,0
200,0
250,0
300,0
13:1
0:44
13:1
1:54
13:1
3:04
13:1
4:14
13:1
5:24
13:1
6:34
13:1
7:44
13:1
8:54
13:2
0:04
13:2
1:14
13:2
2:24
13:2
3:34
13:2
4:44
13:2
5:54
13:2
7:04
13:2
8:14
13:2
9:24
13:3
0:34
13:3
1:44
13:3
2:54
13:3
4:04
13:3
5:14
13:3
6:24
13:3
7:34
13:3
8:44
13:3
9:54
13:4
1:04
13:4
2:14
13:4
3:24
13:4
4:34
13:4
5:44
13:4
6:54
13:4
8:04
13:4
9:14
13:5
0:24
13:5
1:34
13:5
2:44
13:5
3:54
13:5
5:04
13:5
6:14
13:5
7:24
13:5
8:34
13:5
9:44
14:0
0:54
14:0
2:04
14:0
3:14
14:0
4:24
14:0
5:34
14:0
6:44
14:0
7:54
14:0
9:04
14:1
0:14
14:1
1:24
14:1
2:34
14:1
3:44
14:1
4:54
14:1
6:04
14:1
7:14
14:1
8:24
14:1
9:34
14:2
0:44
14:2
1:54
14:2
3:04
14:2
4:14
14:2
5:24
14:2
6:34
14:2
7:44
TEM
PER
ATU
UR
OC
TIJD (S)
Temperature test run 8Reeks1
Reeks2
Reeks3
0,0
20,0
40,0
60,0
80,0
100,0
120,0
9:31
:37
9:32
:37
9:33
:37
9:34
:37
9:35
:37
9:36
:37
9:37
:37
9:38
:37
9:39
:37
9:40
:37
9:41
:37
9:42
:37
9:43
:37
9:44
:37
9:45
:37
9:46
:37
9:47
:37
9:48
:37
9:49
:37
9:50
:37
9:51
:37
9:52
:37
9:53
:37
9:54
:37
9:55
:37
9:56
:37
9:57
:37
9:58
:37
9:59
:37
10:0
0:37
10:0
1:37
10:0
2:37
10:0
3:37
10:0
4:37
10:0
5:37
10:0
6:37
10:0
7:37
10:0
8:37
10:0
9:37
10:1
0:37
10:1
1:37
10:1
2:37
10:1
3:37
10:1
4:37
10:1
5:37
10:1
6:37
10:1
7:37
10:1
8:37
10:1
9:37
10:2
0:37
10:2
1:37
10:2
2:37
10:2
3:37
10:2
4:37
10:2
5:37
10:2
6:37
10:2
7:37
10:2
8:37
10:2
9:37
10:3
0:37
10:3
1:37
10:3
2:37
10:3
3:37
10:3
4:37
10:3
5:37
TEM
PER
ATU
UR
OC
TIJD (S)
Temperature test run 6
K1, air bottom
K2, air top
K3, plate rails
0,0
20,0
40,0
60,0
80,0
100,0
120,0
140,09:
00:1
09:
02:3
09:
04:5
09:
07:1
09:
09:3
09:
11:5
09:
14:1
09:
16:3
09:
18:5
09:
21:1
09:
23:3
09:
25:5
09:
28:1
09:
30:3
09:
32:5
09:
35:1
09:
37:3
09:
39:5
09:
42:1
09:
44:3
09:
46:5
09:
49:1
09:
51:3
09:
53:5
09:
56:1
09:
58:3
010
:00:
5010
:03:
1010
:05:
3010
:07:
5010
:10:
1010
:12:
3010
:14:
5010
:17:
1010
:19:
3010
:21:
5010
:24:
1010
:26:
3010
:28:
5010
:31:
1010
:33:
3010
:35:
5010
:38:
1010
:40:
3010
:42:
5010
:45:
1010
:47:
3010
:49:
5010
:52:
1010
:54:
3010
:56:
5010
:59:
1011
:01:
3011
:03:
5011
:06:
1011
:08:
3011
:10:
5011
:13:
1011
:15:
3011
:17:
5011
:20:
1011
:22:
3011
:24:
5011
:27:
1011
:29:
3011
:31:
5011
:34:
1011
:36:
3011
:38:
5011
:41:
1011
:43:
3011
:45:
5011
:48:
1011
:50:
3011
:52:
5011
:55:
10
TEM
PER
ATU
UR
OC
TIJD (S)
Temperature test run 4K1, air bottum K2, air top K3, plate rails K4, air exhaust
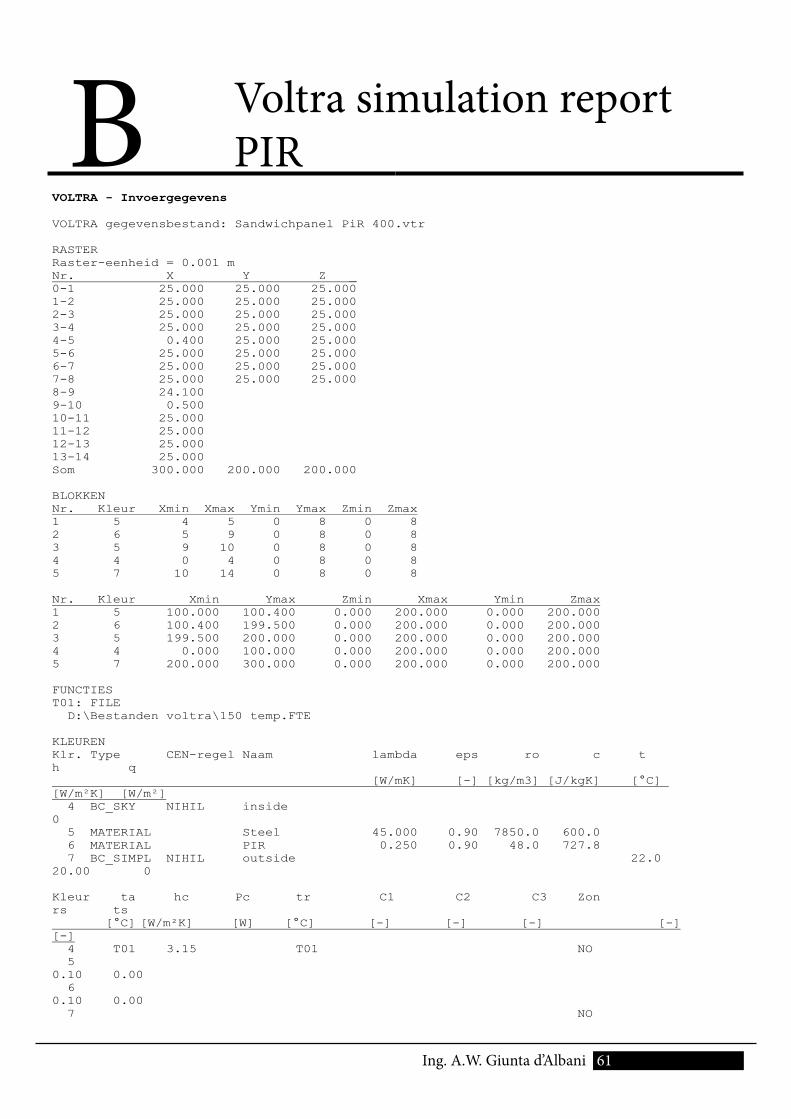
61 Ing. A.W. Giunta d’Albani
B Voltra simulation report PIR
VOLTRA - Invoergegevens
VOLTRA gegevensbestand: Sandwichpanel PiR 400.vtr
RASTERRaster-eenheid = 0.001 m Nr. X Y Z _ 0-1 25.000 25.000 25.000 1-2 25.000 25.000 25.000 2-3 25.000 25.000 25.000 3-4 25.000 25.000 25.000 4-5 0.400 25.000 25.000 5-6 25.000 25.000 25.000 6-7 25.000 25.000 25.000 7-8 25.000 25.000 25.000 8-9 24.1009-10 0.50010-11 25.00011-12 25.00012-13 25.00013-14 25.000Som 300.000 200.000 200.000
BLOKKENNr. Kleur Xmin Xmax Ymin Ymax Zmin Zmax 1 5 4 5 0 8 0 8 2 6 5 9 0 8 0 8 3 5 9 10 0 8 0 8 4 4 0 4 0 8 0 8 5 7 10 14 0 8 0 8
Nr. Kleur Xmin Ymax Zmin Xmax Ymin Zmax 1 5 100.000 100.400 0.000 200.000 0.000 200.000 2 6 100.400 199.500 0.000 200.000 0.000 200.000 3 5 199.500 200.000 0.000 200.000 0.000 200.000 4 4 0.000 100.000 0.000 200.000 0.000 200.000 5 7 200.000 300.000 0.000 200.000 0.000 200.000
FUNCTIEST01: FILE D:\Bestanden voltra\150 temp.FTE
KLEURENKlr. Type CEN-regel Naam lambda eps ro c th q [W/mK] [-] [kg/m3] [J/kgK] [°C] [W/m²K] [W/m²] 4 BC_SKY NIHIL inside0 5 MATERIAL Steel 45.000 0.90 7850.0 600.0 6 MATERIAL PIR 0.250 0.90 48.0 727.8 7 BC_SIMPL NIHIL outside 22.020.00 0
Kleur ta hc Pc tr C1 C2 C3 Zonrs ts [°C] [W/m²K] [W] [°C] [-] [-] [-] [-] [-] 4 T01 3.15 T01 NO 50.10 0.00 60.10 0.00 7 NO
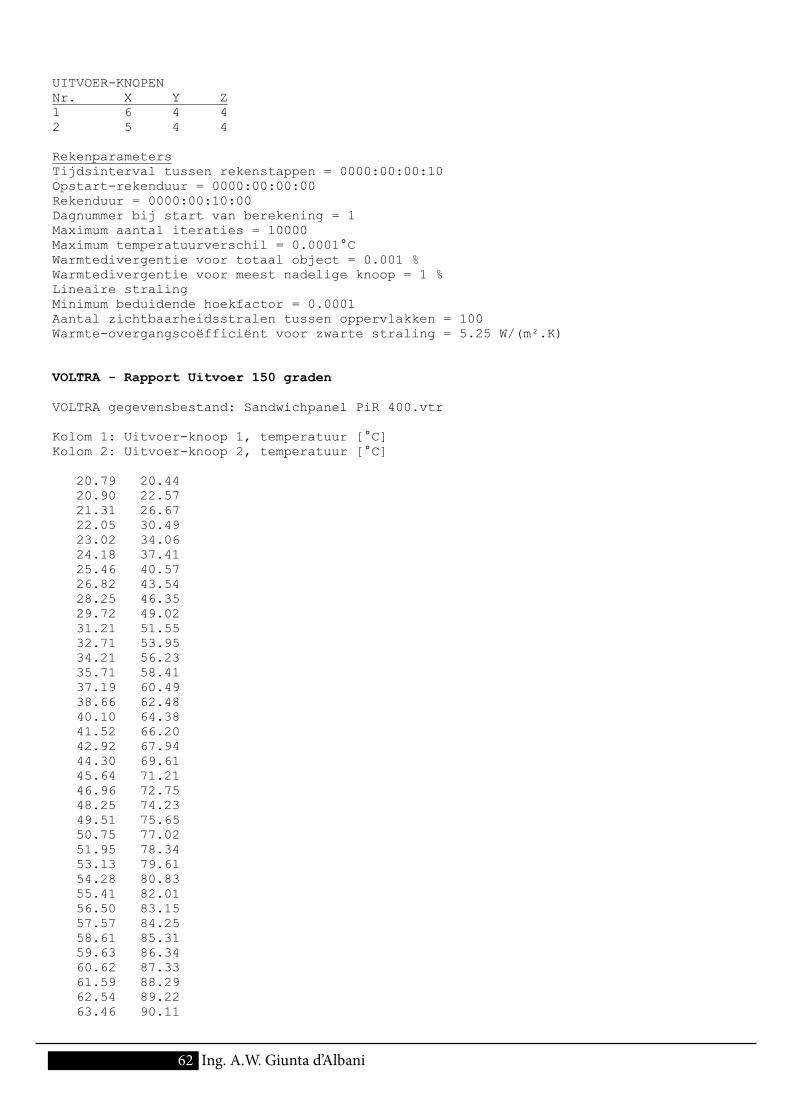
62 Ing. A.W. Giunta d’Albani
UITVOER-KNOPENNr. X Y Z 1 6 4 4 2 5 4 4
RekenparametersTijdsinterval tussen rekenstappen = 0000:00:00:10 Opstart-rekenduur = 0000:00:00:00 Rekenduur = 0000:00:10:00 Dagnummer bij start van berekening = 1 Maximum aantal iteraties = 10000 Maximum temperatuurverschil = 0.0001°C Warmtedivergentie voor totaal object = 0.001 % Warmtedivergentie voor meest nadelige knoop = 1 % Lineaire straling Minimum beduidende hoekfactor = 0.0001 Aantal zichtbaarheidsstralen tussen oppervlakken = 100 Warmte-overgangscoëfficiënt voor zwarte straling = 5.25 W/(m².K)
VOLTRA - Rapport Uitvoer 150 graden
VOLTRA gegevensbestand: Sandwichpanel PiR 400.vtr
Kolom 1: Uitvoer-knoop 1, temperatuur [°C] Kolom 2: Uitvoer-knoop 2, temperatuur [°C]
20.79 20.44 20.90 22.57 21.31 26.67 22.05 30.49 23.02 34.06 24.18 37.41 25.46 40.57 26.82 43.54 28.25 46.35 29.72 49.02 31.21 51.55 32.71 53.95 34.21 56.23 35.71 58.41 37.19 60.49 38.66 62.48 40.10 64.38 41.52 66.20 42.92 67.94 44.30 69.61 45.64 71.21 46.96 72.75 48.25 74.23 49.51 75.65 50.75 77.02 51.95 78.34 53.13 79.61 54.28 80.83 55.41 82.01 56.50 83.15 57.57 84.25 58.61 85.31 59.63 86.34 60.62 87.33 61.59 88.29 62.54 89.22 63.46 90.11
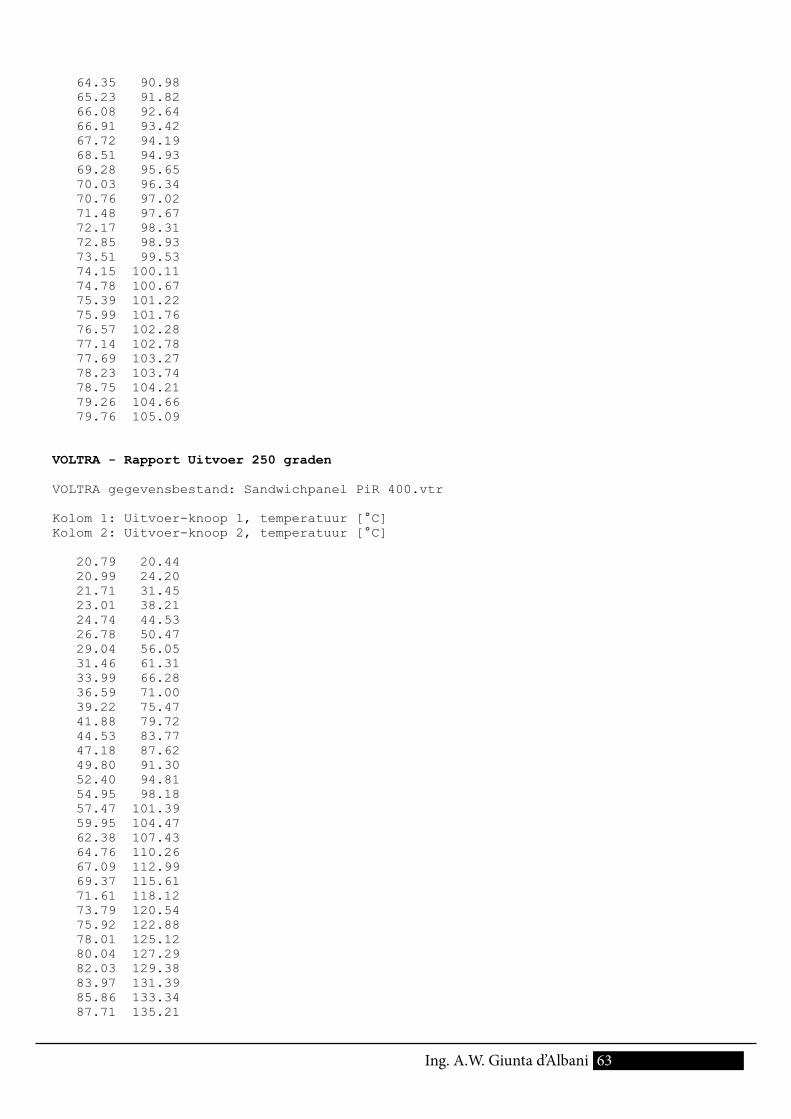
63Ing. A.W. Giunta d’Albani
64.35 90.98 65.23 91.82 66.08 92.64 66.91 93.42 67.72 94.19 68.51 94.93 69.28 95.65 70.03 96.34 70.76 97.02 71.48 97.67 72.17 98.31 72.85 98.93 73.51 99.53 74.15 100.11 74.78 100.67 75.39 101.22 75.99 101.76 76.57 102.28 77.14 102.78 77.69 103.27 78.23 103.74 78.75 104.21 79.26 104.66 79.76 105.09
VOLTRA - Rapport Uitvoer 250 graden
VOLTRA gegevensbestand: Sandwichpanel PiR 400.vtr
Kolom 1: Uitvoer-knoop 1, temperatuur [°C] Kolom 2: Uitvoer-knoop 2, temperatuur [°C]
20.79 20.44 20.99 24.20 21.71 31.45 23.01 38.21 24.74 44.53 26.78 50.47 29.04 56.05 31.46 61.31 33.99 66.28 36.59 71.00 39.22 75.47 41.88 79.72 44.53 83.77 47.18 87.62 49.80 91.30 52.40 94.81 54.95 98.18 57.47 101.39 59.95 104.47 62.38 107.43 64.76 110.26 67.09 112.99 69.37 115.61 71.61 118.12 73.79 120.54 75.92 122.88 78.01 125.12 80.04 127.29 82.03 129.38 83.97 131.39 85.86 133.34 87.71 135.21
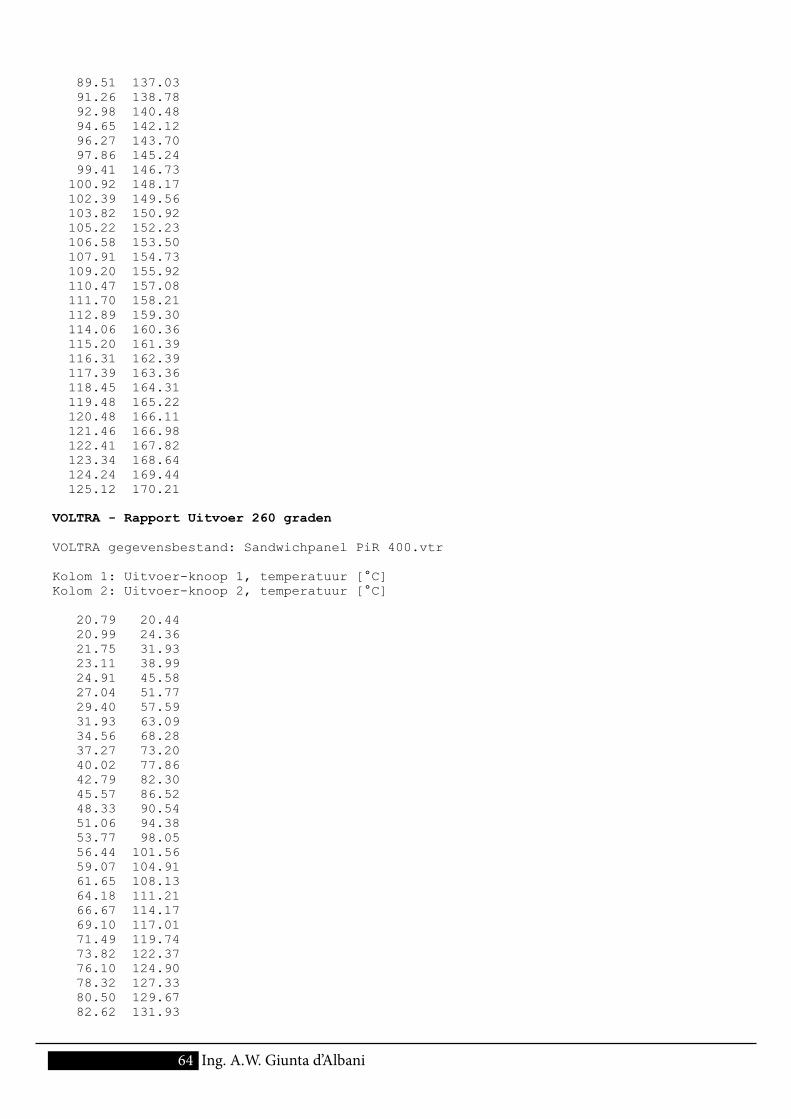
64 Ing. A.W. Giunta d’Albani
89.51 137.03 91.26 138.78 92.98 140.48 94.65 142.12 96.27 143.70 97.86 145.24 99.41 146.73 100.92 148.17 102.39 149.56 103.82 150.92 105.22 152.23 106.58 153.50 107.91 154.73 109.20 155.92 110.47 157.08 111.70 158.21 112.89 159.30 114.06 160.36 115.20 161.39 116.31 162.39 117.39 163.36 118.45 164.31 119.48 165.22 120.48 166.11 121.46 166.98 122.41 167.82 123.34 168.64 124.24 169.44 125.12 170.21
VOLTRA - Rapport Uitvoer 260 graden
VOLTRA gegevensbestand: Sandwichpanel PiR 400.vtr
Kolom 1: Uitvoer-knoop 1, temperatuur [°C] Kolom 2: Uitvoer-knoop 2, temperatuur [°C]
20.79 20.44 20.99 24.36 21.75 31.93 23.11 38.99 24.91 45.58 27.04 51.77 29.40 57.59 31.93 63.09 34.56 68.28 37.27 73.20 40.02 77.86 42.79 82.30 45.57 86.52 48.33 90.54 51.06 94.38 53.77 98.05 56.44 101.56 59.07 104.91 61.65 108.13 64.18 111.21 66.67 114.17 69.10 117.01 71.49 119.74 73.82 122.37 76.10 124.90 78.32 127.33 80.50 129.67 82.62 131.93
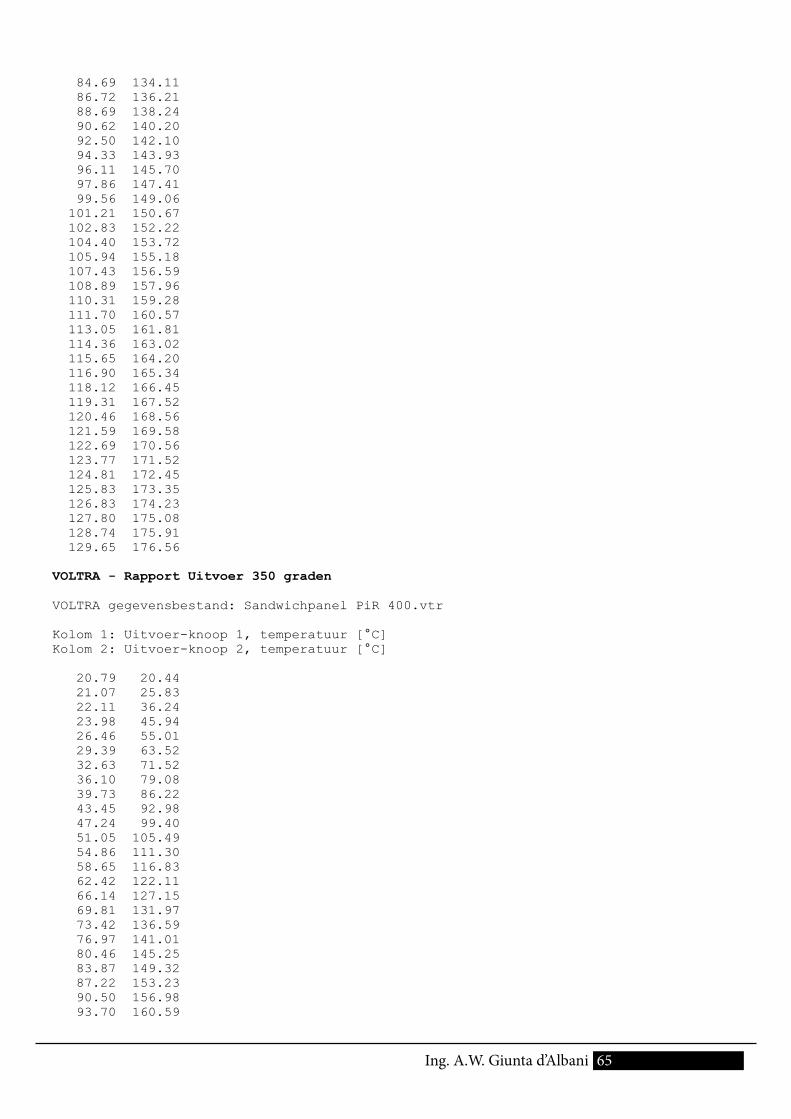
65Ing. A.W. Giunta d’Albani
84.69 134.11 86.72 136.21 88.69 138.24 90.62 140.20 92.50 142.10 94.33 143.93 96.11 145.70 97.86 147.41 99.56 149.06 101.21 150.67 102.83 152.22 104.40 153.72 105.94 155.18 107.43 156.59 108.89 157.96 110.31 159.28 111.70 160.57 113.05 161.81 114.36 163.02 115.65 164.20 116.90 165.34 118.12 166.45 119.31 167.52 120.46 168.56 121.59 169.58 122.69 170.56 123.77 171.52 124.81 172.45 125.83 173.35 126.83 174.23 127.80 175.08 128.74 175.91 129.65 176.56
VOLTRA - Rapport Uitvoer 350 graden
VOLTRA gegevensbestand: Sandwichpanel PiR 400.vtr
Kolom 1: Uitvoer-knoop 1, temperatuur [°C] Kolom 2: Uitvoer-knoop 2, temperatuur [°C]
20.79 20.44 21.07 25.83 22.11 36.24 23.98 45.94 26.46 55.01 29.39 63.52 32.63 71.52 36.10 79.08 39.73 86.22 43.45 92.98 47.24 99.40 51.05 105.49 54.86 111.30 58.65 116.83 62.42 122.11 66.14 127.15 69.81 131.97 73.42 136.59 76.97 141.01 80.46 145.25 83.87 149.32 87.22 153.23 90.50 156.98 93.70 160.59
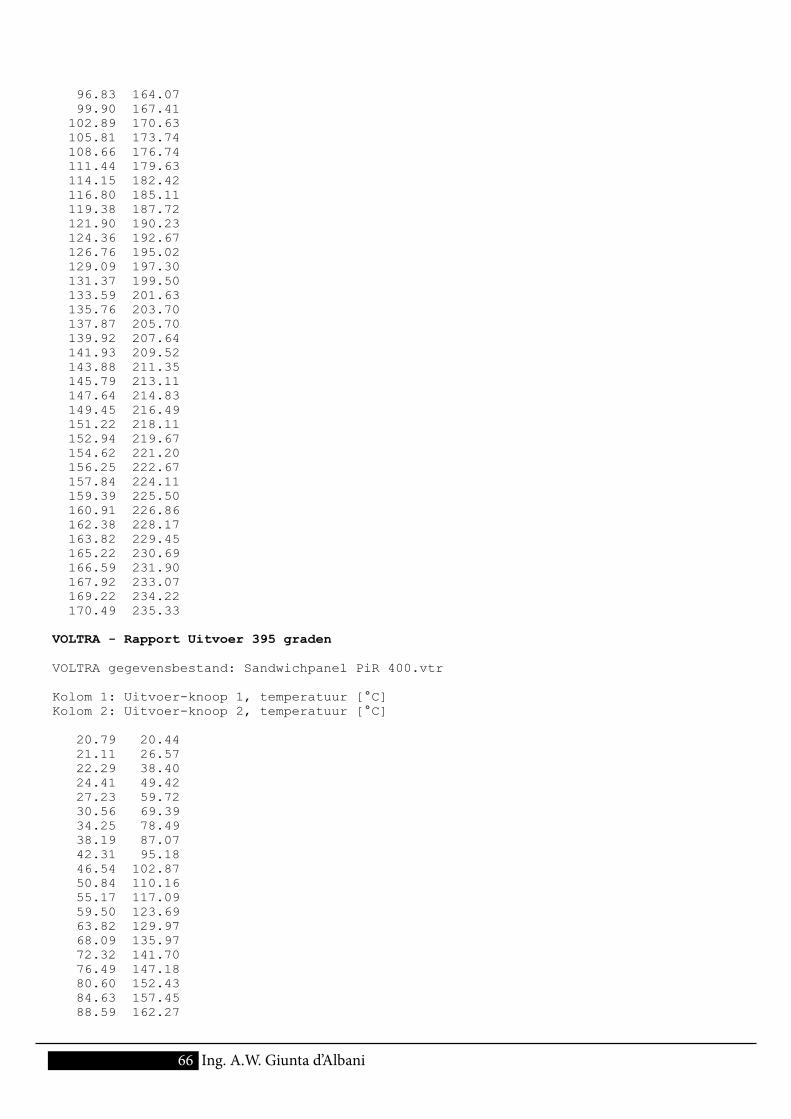
66 Ing. A.W. Giunta d’Albani
96.83 164.07 99.90 167.41 102.89 170.63 105.81 173.74 108.66 176.74 111.44 179.63 114.15 182.42 116.80 185.11 119.38 187.72 121.90 190.23 124.36 192.67 126.76 195.02 129.09 197.30 131.37 199.50 133.59 201.63 135.76 203.70 137.87 205.70 139.92 207.64 141.93 209.52 143.88 211.35 145.79 213.11 147.64 214.83 149.45 216.49 151.22 218.11 152.94 219.67 154.62 221.20 156.25 222.67 157.84 224.11 159.39 225.50 160.91 226.86 162.38 228.17 163.82 229.45 165.22 230.69 166.59 231.90 167.92 233.07 169.22 234.22 170.49 235.33
VOLTRA - Rapport Uitvoer 395 graden
VOLTRA gegevensbestand: Sandwichpanel PiR 400.vtr
Kolom 1: Uitvoer-knoop 1, temperatuur [°C] Kolom 2: Uitvoer-knoop 2, temperatuur [°C]
20.79 20.44 21.11 26.57 22.29 38.40 24.41 49.42 27.23 59.72 30.56 69.39 34.25 78.49 38.19 87.07 42.31 95.18 46.54 102.87 50.84 110.16 55.17 117.09 59.50 123.69 63.82 129.97 68.09 135.97 72.32 141.70 76.49 147.18 80.60 152.43 84.63 157.45 88.59 162.27
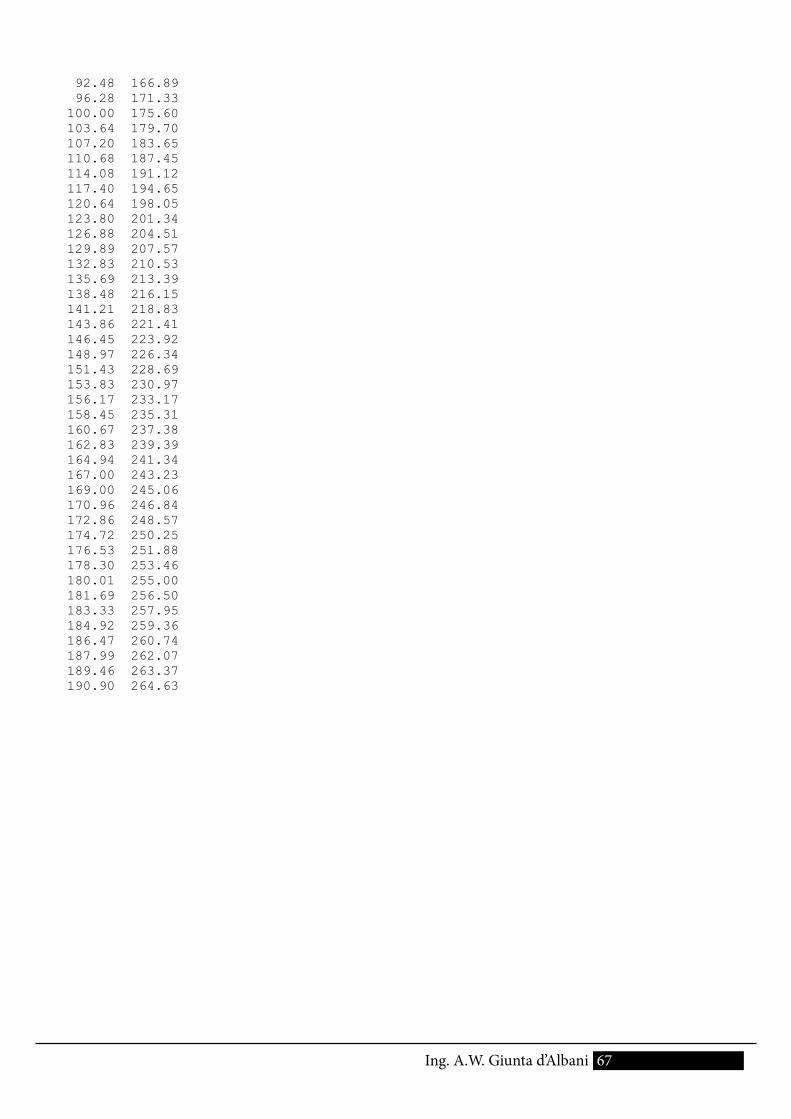
67Ing. A.W. Giunta d’Albani
92.48 166.89 96.28 171.33 100.00 175.60 103.64 179.70 107.20 183.65 110.68 187.45 114.08 191.12 117.40 194.65 120.64 198.05 123.80 201.34 126.88 204.51 129.89 207.57 132.83 210.53 135.69 213.39 138.48 216.15 141.21 218.83 143.86 221.41 146.45 223.92 148.97 226.34 151.43 228.69 153.83 230.97 156.17 233.17 158.45 235.31 160.67 237.38 162.83 239.39 164.94 241.34 167.00 243.23 169.00 245.06 170.96 246.84 172.86 248.57 174.72 250.25 176.53 251.88 178.30 253.46 180.01 255.00 181.69 256.50 183.33 257.95 184.92 259.36 186.47 260.74 187.99 262.07 189.46 263.37 190.90 264.63
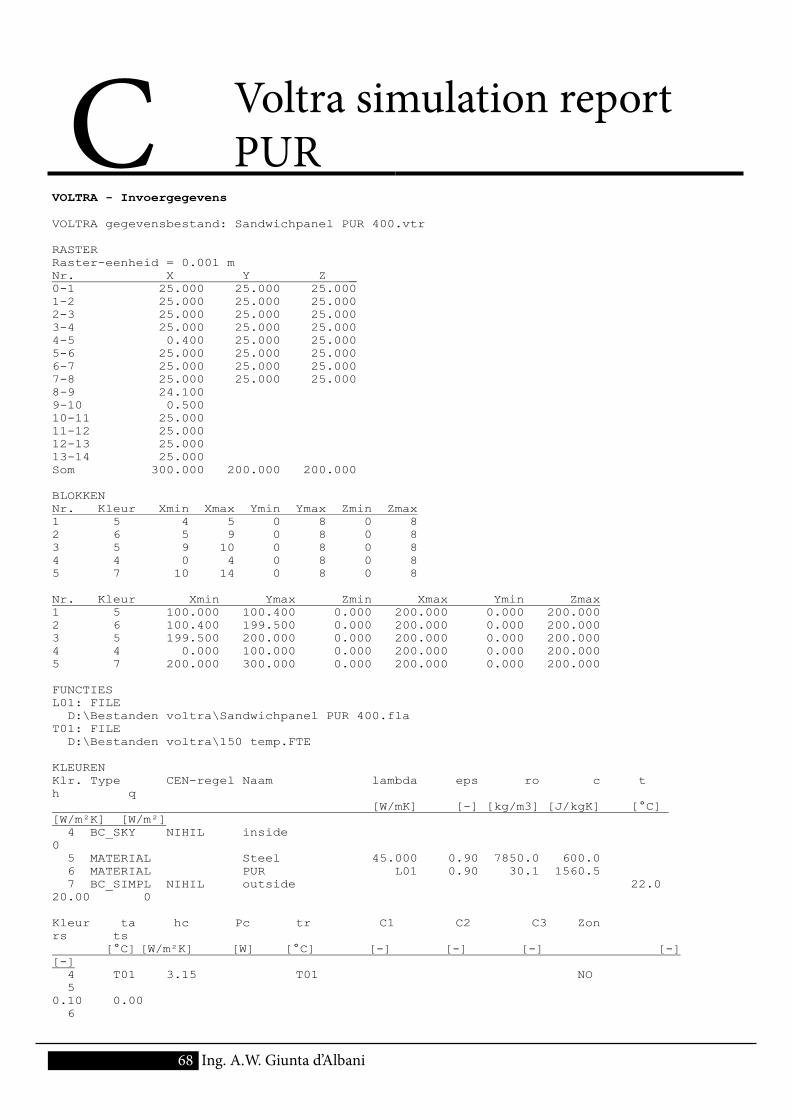
C Voltra simulation report PUR
68 Ing. A.W. Giunta d’Albani
VOLTRA - Invoergegevens
VOLTRA gegevensbestand: Sandwichpanel PUR 400.vtr
RASTERRaster-eenheid = 0.001 m Nr. X Y Z _ 0-1 25.000 25.000 25.000 1-2 25.000 25.000 25.000 2-3 25.000 25.000 25.000 3-4 25.000 25.000 25.000 4-5 0.400 25.000 25.000 5-6 25.000 25.000 25.000 6-7 25.000 25.000 25.000 7-8 25.000 25.000 25.000 8-9 24.1009-10 0.50010-11 25.00011-12 25.00012-13 25.00013-14 25.000Som 300.000 200.000 200.000
BLOKKENNr. Kleur Xmin Xmax Ymin Ymax Zmin Zmax 1 5 4 5 0 8 0 8 2 6 5 9 0 8 0 8 3 5 9 10 0 8 0 8 4 4 0 4 0 8 0 8 5 7 10 14 0 8 0 8
Nr. Kleur Xmin Ymax Zmin Xmax Ymin Zmax 1 5 100.000 100.400 0.000 200.000 0.000 200.000 2 6 100.400 199.500 0.000 200.000 0.000 200.000 3 5 199.500 200.000 0.000 200.000 0.000 200.000 4 4 0.000 100.000 0.000 200.000 0.000 200.000 5 7 200.000 300.000 0.000 200.000 0.000 200.000
FUNCTIESL01: FILE D:\Bestanden voltra\Sandwichpanel PUR 400.fla T01: FILE D:\Bestanden voltra\150 temp.FTE
KLEURENKlr. Type CEN-regel Naam lambda eps ro c th q [W/mK] [-] [kg/m3] [J/kgK] [°C] [W/m²K] [W/m²] 4 BC_SKY NIHIL inside0 5 MATERIAL Steel 45.000 0.90 7850.0 600.0 6 MATERIAL PUR L01 0.90 30.1 1560.5 7 BC_SIMPL NIHIL outside 22.020.00 0
Kleur ta hc Pc tr C1 C2 C3 Zonrs ts [°C] [W/m²K] [W] [°C] [-] [-] [-] [-] [-] 4 T01 3.15 T01 NO 50.10 0.00 6
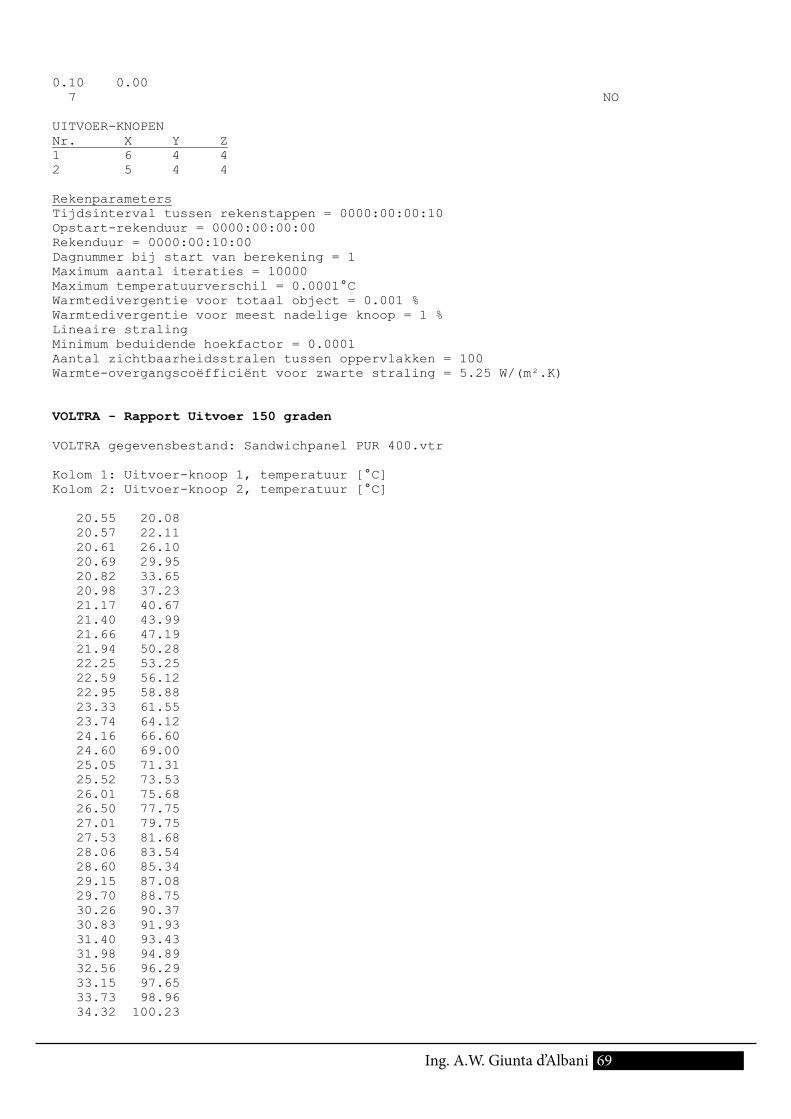
69Ing. A.W. Giunta d’Albani
0.10 0.00 7 NO
UITVOER-KNOPENNr. X Y Z 1 6 4 4 2 5 4 4
RekenparametersTijdsinterval tussen rekenstappen = 0000:00:00:10 Opstart-rekenduur = 0000:00:00:00 Rekenduur = 0000:00:10:00 Dagnummer bij start van berekening = 1 Maximum aantal iteraties = 10000 Maximum temperatuurverschil = 0.0001°C Warmtedivergentie voor totaal object = 0.001 % Warmtedivergentie voor meest nadelige knoop = 1 % Lineaire straling Minimum beduidende hoekfactor = 0.0001 Aantal zichtbaarheidsstralen tussen oppervlakken = 100 Warmte-overgangscoëfficiënt voor zwarte straling = 5.25 W/(m².K)
VOLTRA - Rapport Uitvoer 150 graden
VOLTRA gegevensbestand: Sandwichpanel PUR 400.vtr
Kolom 1: Uitvoer-knoop 1, temperatuur [°C] Kolom 2: Uitvoer-knoop 2, temperatuur [°C]
20.55 20.08 20.57 22.11 20.61 26.10 20.69 29.95 20.82 33.65 20.98 37.23 21.17 40.67 21.40 43.99 21.66 47.19 21.94 50.28 22.25 53.25 22.59 56.12 22.95 58.88 23.33 61.55 23.74 64.12 24.16 66.60 24.60 69.00 25.05 71.31 25.52 73.53 26.01 75.68 26.50 77.75 27.01 79.75 27.53 81.68 28.06 83.54 28.60 85.34 29.15 87.08 29.70 88.75 30.26 90.37 30.83 91.93 31.40 93.43 31.98 94.89 32.56 96.29 33.15 97.65 33.73 98.96 34.32 100.23
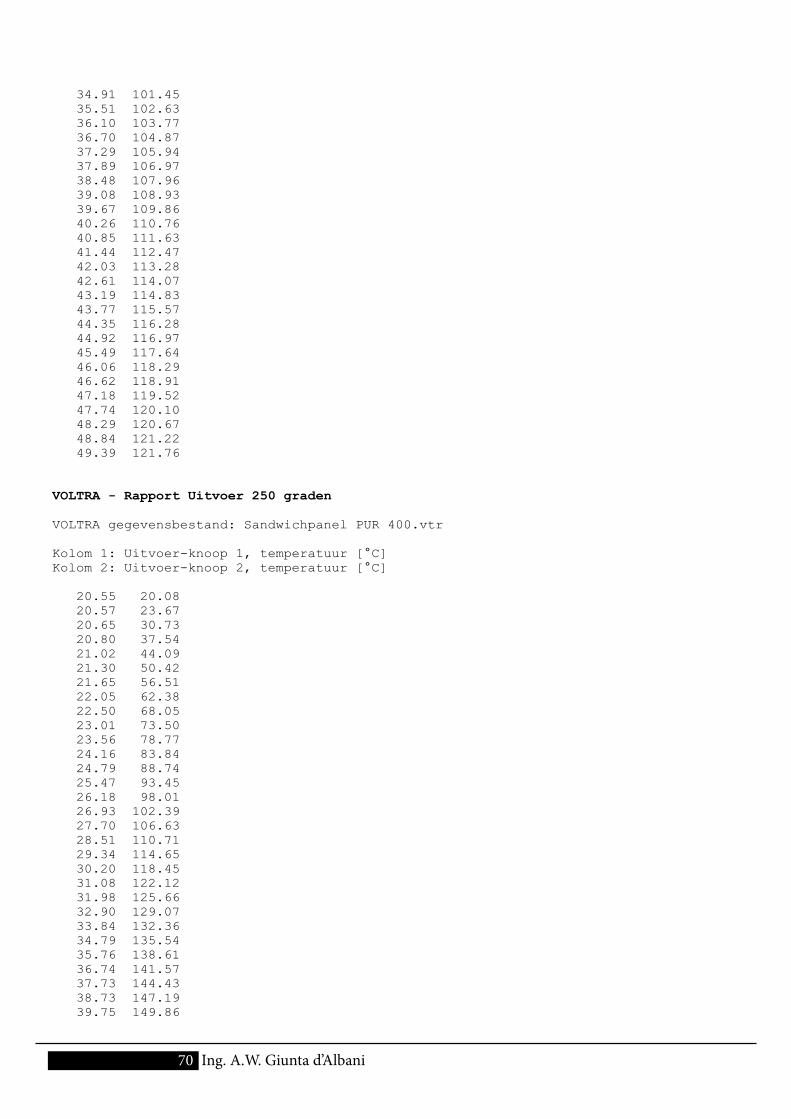
70 Ing. A.W. Giunta d’Albani
34.91 101.45 35.51 102.63 36.10 103.77 36.70 104.87 37.29 105.94 37.89 106.97 38.48 107.96 39.08 108.93 39.67 109.86 40.26 110.76 40.85 111.63 41.44 112.47 42.03 113.28 42.61 114.07 43.19 114.83 43.77 115.57 44.35 116.28 44.92 116.97 45.49 117.64 46.06 118.29 46.62 118.91 47.18 119.52 47.74 120.10 48.29 120.67 48.84 121.22 49.39 121.76
VOLTRA - Rapport Uitvoer 250 graden
VOLTRA gegevensbestand: Sandwichpanel PUR 400.vtr
Kolom 1: Uitvoer-knoop 1, temperatuur [°C] Kolom 2: Uitvoer-knoop 2, temperatuur [°C]
20.55 20.08 20.57 23.67 20.65 30.73 20.80 37.54 21.02 44.09 21.30 50.42 21.65 56.51 22.05 62.38 22.50 68.05 23.01 73.50 23.56 78.77 24.16 83.84 24.79 88.74 25.47 93.45 26.18 98.01 26.93 102.39 27.70 106.63 28.51 110.71 29.34 114.65 30.20 118.45 31.08 122.12 31.98 125.66 32.90 129.07 33.84 132.36 34.79 135.54 35.76 138.61 36.74 141.57 37.73 144.43 38.73 147.19 39.75 149.86
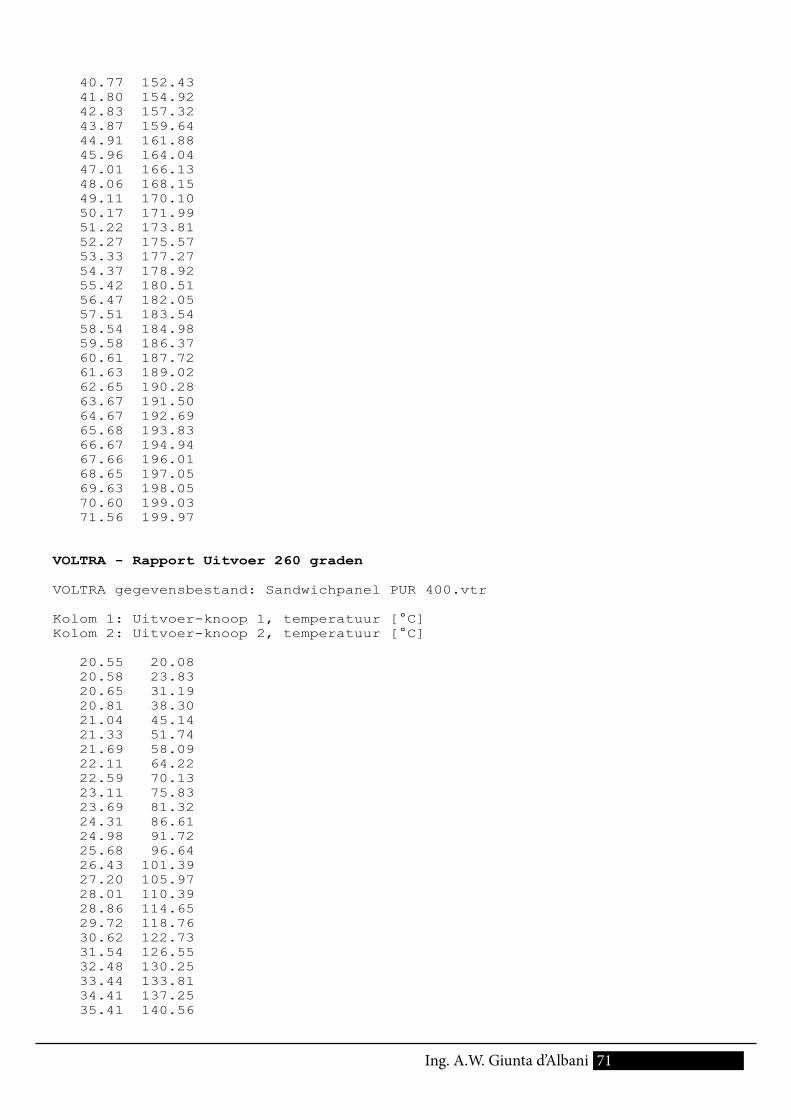
71Ing. A.W. Giunta d’Albani
40.77 152.43 41.80 154.92 42.83 157.32 43.87 159.64 44.91 161.88 45.96 164.04 47.01 166.13 48.06 168.15 49.11 170.10 50.17 171.99 51.22 173.81 52.27 175.57 53.33 177.27 54.37 178.92 55.42 180.51 56.47 182.05 57.51 183.54 58.54 184.98 59.58 186.37 60.61 187.72 61.63 189.02 62.65 190.28 63.67 191.50 64.67 192.69 65.68 193.83 66.67 194.94 67.66 196.01 68.65 197.05 69.63 198.05 70.60 199.03 71.56 199.97
VOLTRA - Rapport Uitvoer 260 graden
VOLTRA gegevensbestand: Sandwichpanel PUR 400.vtr
Kolom 1: Uitvoer-knoop 1, temperatuur [°C] Kolom 2: Uitvoer-knoop 2, temperatuur [°C]
20.55 20.08 20.58 23.83 20.65 31.19 20.81 38.30 21.04 45.14 21.33 51.74 21.69 58.09 22.11 64.22 22.59 70.13 23.11 75.83 23.69 81.32 24.31 86.61 24.98 91.72 25.68 96.64 26.43 101.39 27.20 105.97 28.01 110.39 28.86 114.65 29.72 118.76 30.62 122.73 31.54 126.55 32.48 130.25 33.44 133.81 34.41 137.25 35.41 140.56

72 Ing. A.W. Giunta d’Albani
36.42 143.77 37.44 146.86 38.48 149.84 39.52 152.72 40.58 155.50 41.65 158.19 42.72 160.78 43.80 163.29 44.88 165.71 45.97 168.04 47.07 170.30 48.16 172.48 49.26 174.59 50.36 176.62 51.46 178.59 52.55 180.49 53.65 182.33 54.75 184.11 55.84 185.83 56.94 187.49 58.03 189.09 59.11 190.65 60.20 192.15 61.27 193.60 62.35 195.01 63.42 196.37 64.48 197.68 65.54 198.96 66.59 200.19 67.64 201.38 68.68 202.54 69.71 203.66 70.74 204.74 71.76 205.79 72.77 206.81 73.78 207.63
VOLTRA - Rapport Uitvoer 350 graden
VOLTRA gegevensbestand: Sandwichpanel PUR 400.vtr
Kolom 1: Uitvoer-knoop 1, temperatuur [°C] Kolom 2: Uitvoer-knoop 2, temperatuur [°C]
20.55 20.08 20.58 25.23 20.69 35.36 20.91 45.13 21.22 54.54 21.63 63.61 22.12 72.35 22.70 80.78 23.35 88.90 24.07 96.73 24.87 104.28 25.72 111.57 26.64 118.59 27.61 125.36 28.63 131.89 29.70 138.18 30.81 144.26 31.97 150.12 33.16 155.77 34.39 161.22
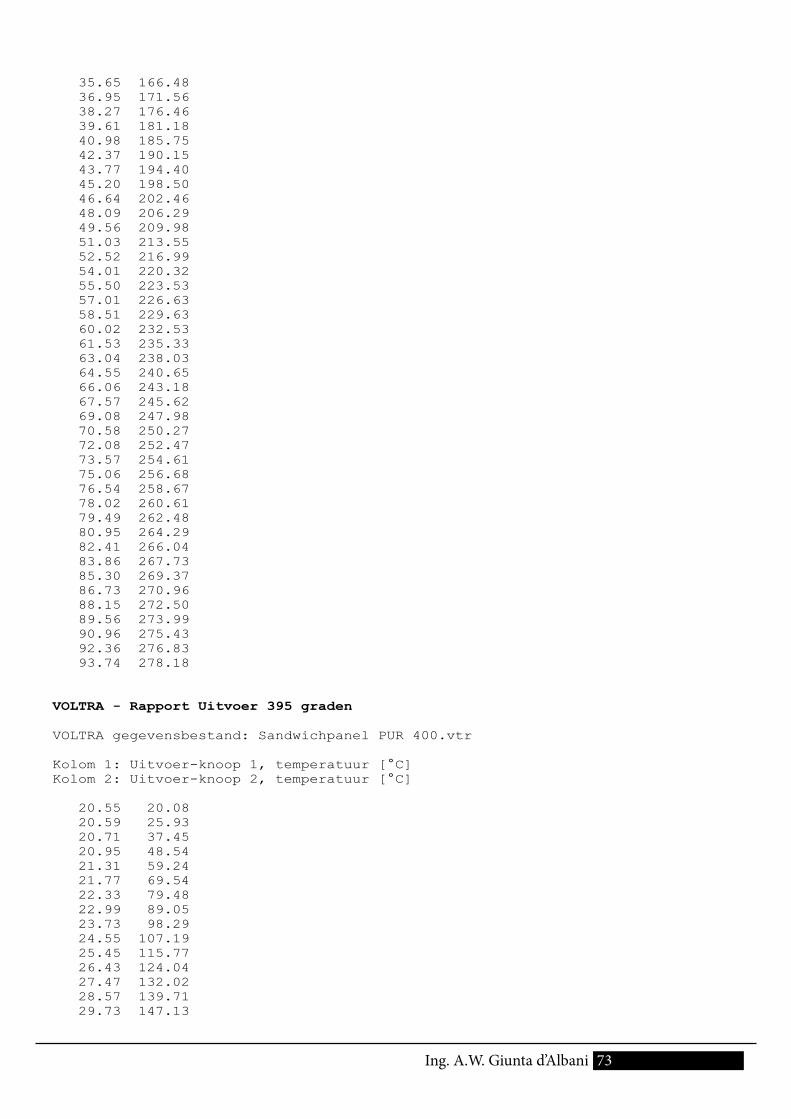
73Ing. A.W. Giunta d’Albani
35.65 166.48 36.95 171.56 38.27 176.46 39.61 181.18 40.98 185.75 42.37 190.15 43.77 194.40 45.20 198.50 46.64 202.46 48.09 206.29 49.56 209.98 51.03 213.55 52.52 216.99 54.01 220.32 55.50 223.53 57.01 226.63 58.51 229.63 60.02 232.53 61.53 235.33 63.04 238.03 64.55 240.65 66.06 243.18 67.57 245.62 69.08 247.98 70.58 250.27 72.08 252.47 73.57 254.61 75.06 256.68 76.54 258.67 78.02 260.61 79.49 262.48 80.95 264.29 82.41 266.04 83.86 267.73 85.30 269.37 86.73 270.96 88.15 272.50 89.56 273.99 90.96 275.43 92.36 276.83 93.74 278.18
VOLTRA - Rapport Uitvoer 395 graden
VOLTRA gegevensbestand: Sandwichpanel PUR 400.vtr
Kolom 1: Uitvoer-knoop 1, temperatuur [°C] Kolom 2: Uitvoer-knoop 2, temperatuur [°C]
20.55 20.08 20.59 25.93 20.71 37.45 20.95 48.54 21.31 59.24 21.77 69.54 22.33 79.48 22.99 89.05 23.73 98.29 24.55 107.19 25.45 115.77 26.43 124.04 27.47 132.02 28.57 139.71 29.73 147.13
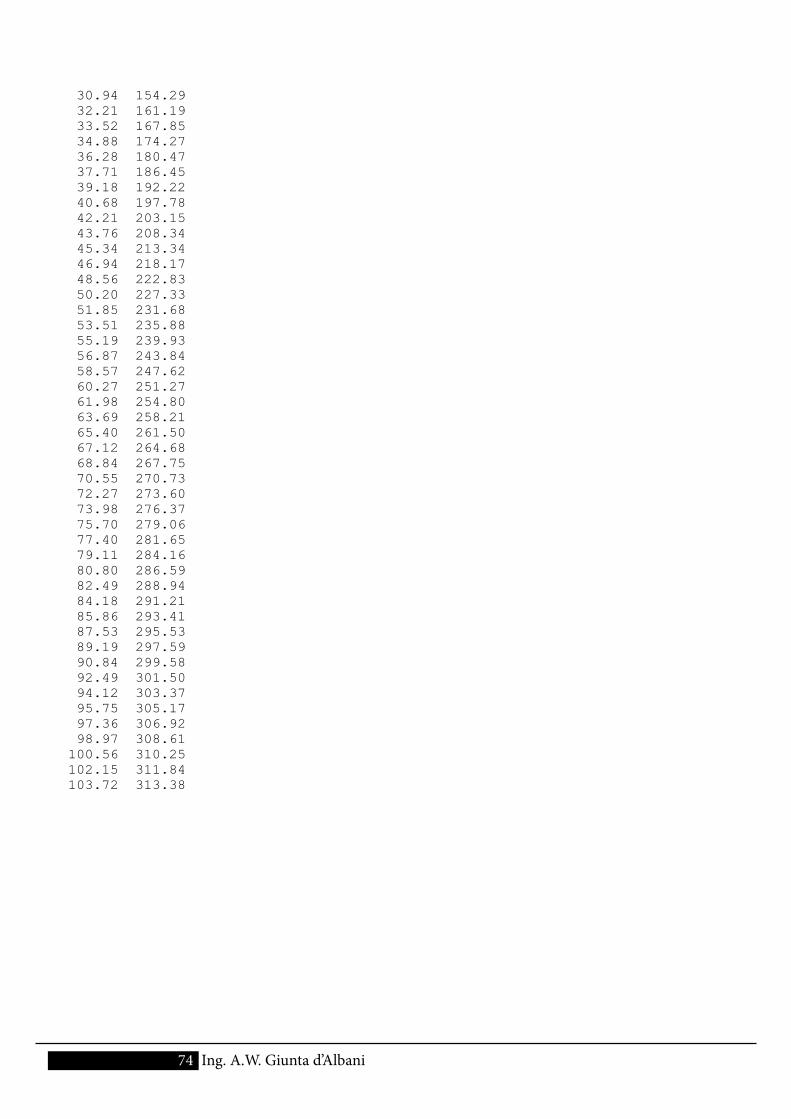
74 Ing. A.W. Giunta d’Albani
30.94 154.29 32.21 161.19 33.52 167.85 34.88 174.27 36.28 180.47 37.71 186.45 39.18 192.22 40.68 197.78 42.21 203.15 43.76 208.34 45.34 213.34 46.94 218.17 48.56 222.83 50.20 227.33 51.85 231.68 53.51 235.88 55.19 239.93 56.87 243.84 58.57 247.62 60.27 251.27 61.98 254.80 63.69 258.21 65.40 261.50 67.12 264.68 68.84 267.75 70.55 270.73 72.27 273.60 73.98 276.37 75.70 279.06 77.40 281.65 79.11 284.16 80.80 286.59 82.49 288.94 84.18 291.21 85.86 293.41 87.53 295.53 89.19 297.59 90.84 299.58 92.49 301.50 94.12 303.37 95.75 305.17 97.36 306.92 98.97 308.61 100.56 310.25 102.15 311.84 103.72 313.38
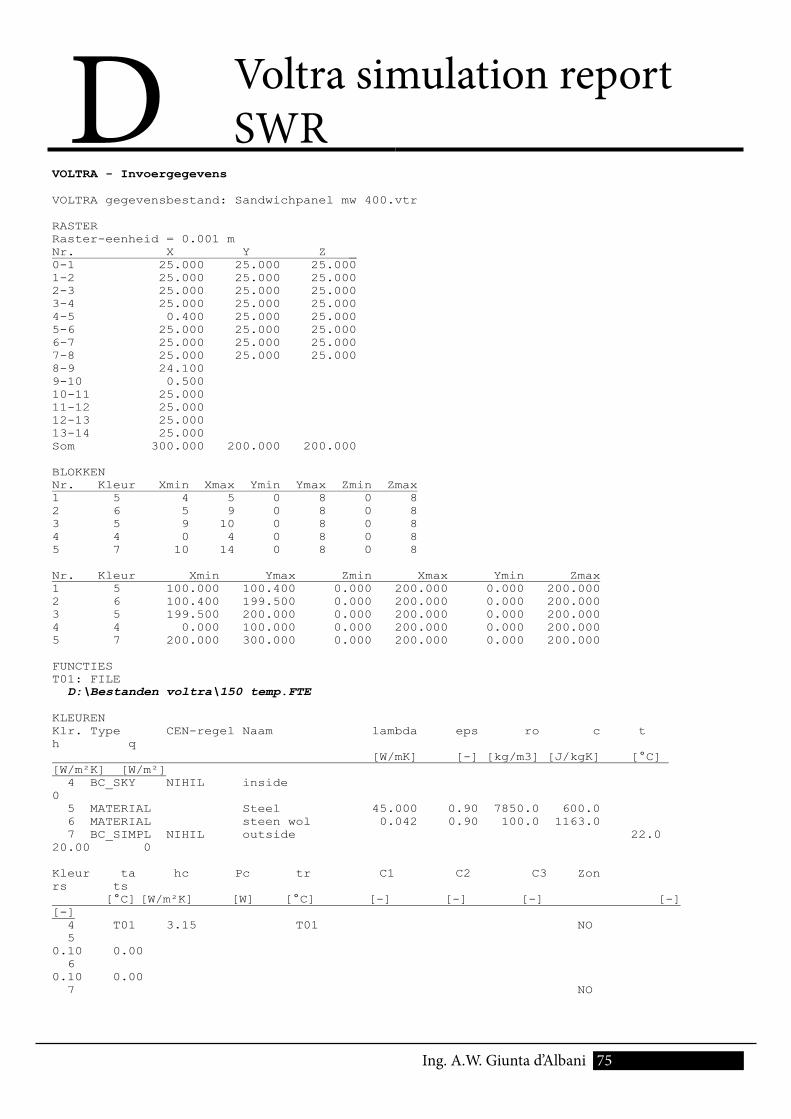
75 Ing. A.W. Giunta d’Albani
D Voltra simulation report SWR
VOLTRA - Invoergegevens
VOLTRA gegevensbestand: Sandwichpanel mw 400.vtr
RASTERRaster-eenheid = 0.001 m Nr. X Y Z _ 0-1 25.000 25.000 25.000 1-2 25.000 25.000 25.000 2-3 25.000 25.000 25.000 3-4 25.000 25.000 25.000 4-5 0.400 25.000 25.000 5-6 25.000 25.000 25.000 6-7 25.000 25.000 25.000 7-8 25.000 25.000 25.000 8-9 24.1009-10 0.50010-11 25.00011-12 25.00012-13 25.00013-14 25.000Som 300.000 200.000 200.000
BLOKKENNr. Kleur Xmin Xmax Ymin Ymax Zmin Zmax 1 5 4 5 0 8 0 8 2 6 5 9 0 8 0 8 3 5 9 10 0 8 0 8 4 4 0 4 0 8 0 8 5 7 10 14 0 8 0 8
Nr. Kleur Xmin Ymax Zmin Xmax Ymin Zmax 1 5 100.000 100.400 0.000 200.000 0.000 200.000 2 6 100.400 199.500 0.000 200.000 0.000 200.000 3 5 199.500 200.000 0.000 200.000 0.000 200.000 4 4 0.000 100.000 0.000 200.000 0.000 200.000 5 7 200.000 300.000 0.000 200.000 0.000 200.000
FUNCTIEST01: FILE D:\Bestanden voltra\150 temp.FTE
KLEURENKlr. Type CEN-regel Naam lambda eps ro c th q [W/mK] [-] [kg/m3] [J/kgK] [°C] [W/m²K] [W/m²] 4 BC_SKY NIHIL inside0 5 MATERIAL Steel 45.000 0.90 7850.0 600.0 6 MATERIAL steen wol 0.042 0.90 100.0 1163.0 7 BC_SIMPL NIHIL outside 22.020.00 0
Kleur ta hc Pc tr C1 C2 C3 Zonrs ts [°C] [W/m²K] [W] [°C] [-] [-] [-] [-] [-] 4 T01 3.15 T01 NO 50.10 0.00 60.10 0.00 7 NO
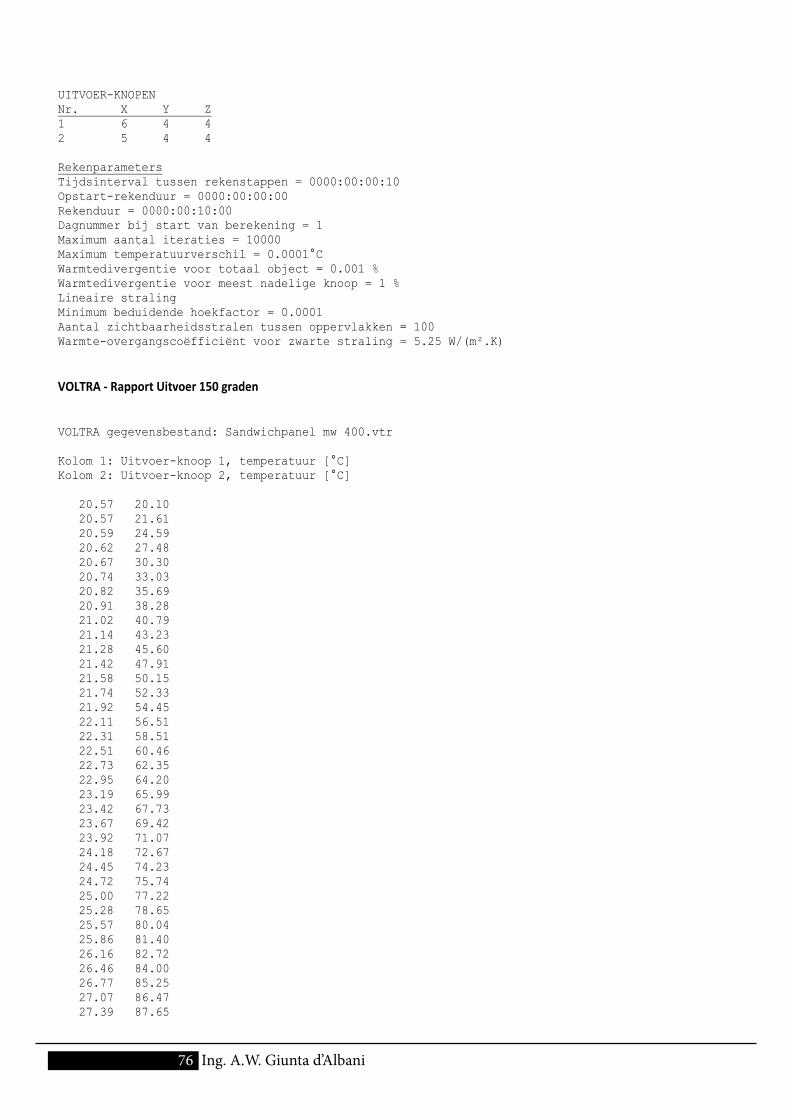
76 Ing. A.W. Giunta d’Albani
UITVOER-KNOPENNr. X Y Z 1 6 4 4 2 5 4 4
RekenparametersTijdsinterval tussen rekenstappen = 0000:00:00:10 Opstart-rekenduur = 0000:00:00:00 Rekenduur = 0000:00:10:00 Dagnummer bij start van berekening = 1 Maximum aantal iteraties = 10000 Maximum temperatuurverschil = 0.0001°C Warmtedivergentie voor totaal object = 0.001 % Warmtedivergentie voor meest nadelige knoop = 1 % Lineaire straling Minimum beduidende hoekfactor = 0.0001 Aantal zichtbaarheidsstralen tussen oppervlakken = 100 Warmte-overgangscoëfficiënt voor zwarte straling = 5.25 W/(m².K)
VOLTRA ‐ Rapport Uitvoer 150 graden
VOLTRA gegevensbestand: Sandwichpanel mw 400.vtr
Kolom 1: Uitvoer-knoop 1, temperatuur [°C] Kolom 2: Uitvoer-knoop 2, temperatuur [°C]
20.57 20.10 20.57 21.61 20.59 24.59 20.62 27.48 20.67 30.30 20.74 33.03 20.82 35.69 20.91 38.28 21.02 40.79 21.14 43.23 21.28 45.60 21.42 47.91 21.58 50.15 21.74 52.33 21.92 54.45 22.11 56.51 22.31 58.51 22.51 60.46 22.73 62.35 22.95 64.20 23.19 65.99 23.42 67.73 23.67 69.42 23.92 71.07 24.18 72.67 24.45 74.23 24.72 75.74 25.00 77.22 25.28 78.65 25.57 80.04 25.86 81.40 26.16 82.72 26.46 84.00 26.77 85.25 27.07 86.47 27.39 87.65
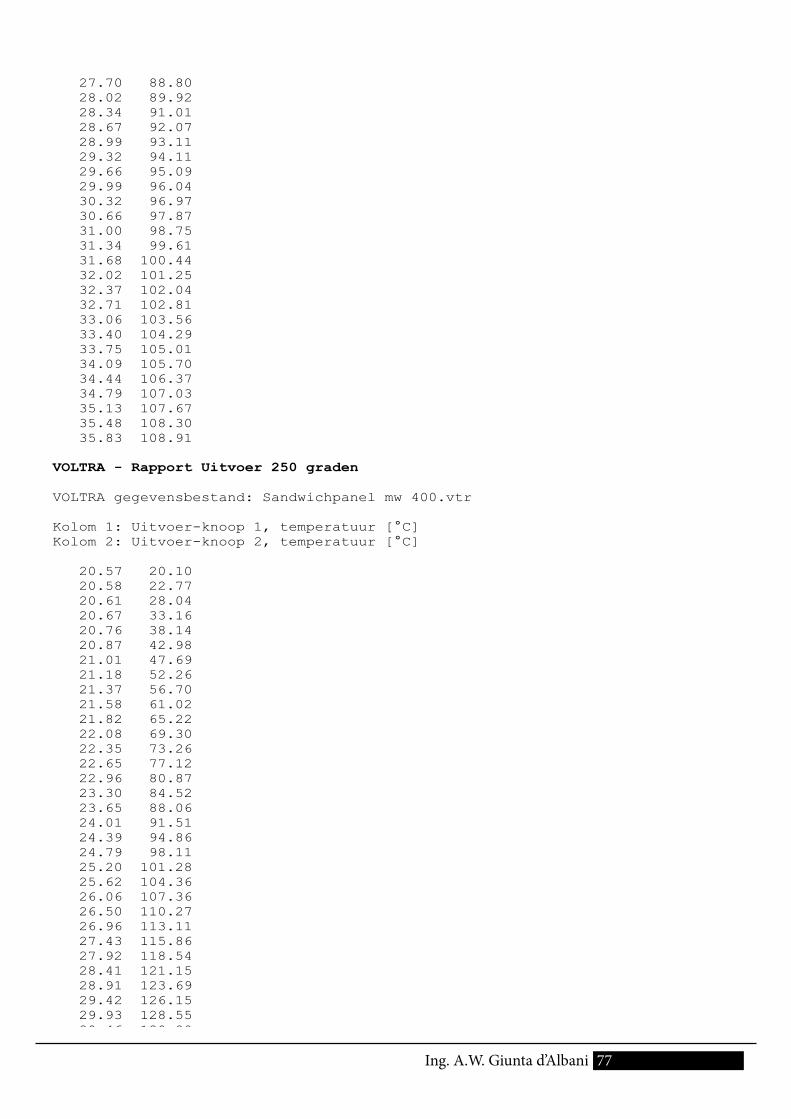
77Ing. A.W. Giunta d’Albani
27.70 88.80 28.02 89.92 28.34 91.01 28.67 92.07 28.99 93.11 29.32 94.11 29.66 95.09 29.99 96.04 30.32 96.97 30.66 97.87 31.00 98.75 31.34 99.61 31.68 100.44 32.02 101.25 32.37 102.04 32.71 102.81 33.06 103.56 33.40 104.29 33.75 105.01 34.09 105.70 34.44 106.37 34.79 107.03 35.13 107.67 35.48 108.30 35.83 108.91
VOLTRA - Rapport Uitvoer 250 graden
VOLTRA gegevensbestand: Sandwichpanel mw 400.vtr
Kolom 1: Uitvoer-knoop 1, temperatuur [°C] Kolom 2: Uitvoer-knoop 2, temperatuur [°C]
20.57 20.10 20.58 22.77 20.61 28.04 20.67 33.16 20.76 38.14 20.87 42.98 21.01 47.69 21.18 52.26 21.37 56.70 21.58 61.02 21.82 65.22 22.08 69.30 22.35 73.26 22.65 77.12 22.96 80.87 23.30 84.52 23.65 88.06 24.01 91.51 24.39 94.86 24.79 98.11 25.20 101.28 25.62 104.36 26.06 107.36 26.50 110.27 26.96 113.11 27.43 115.86 27.92 118.54 28.41 121.15 28.91 123.69 29.42 126.15 29.93 128.55 30.46 130.89
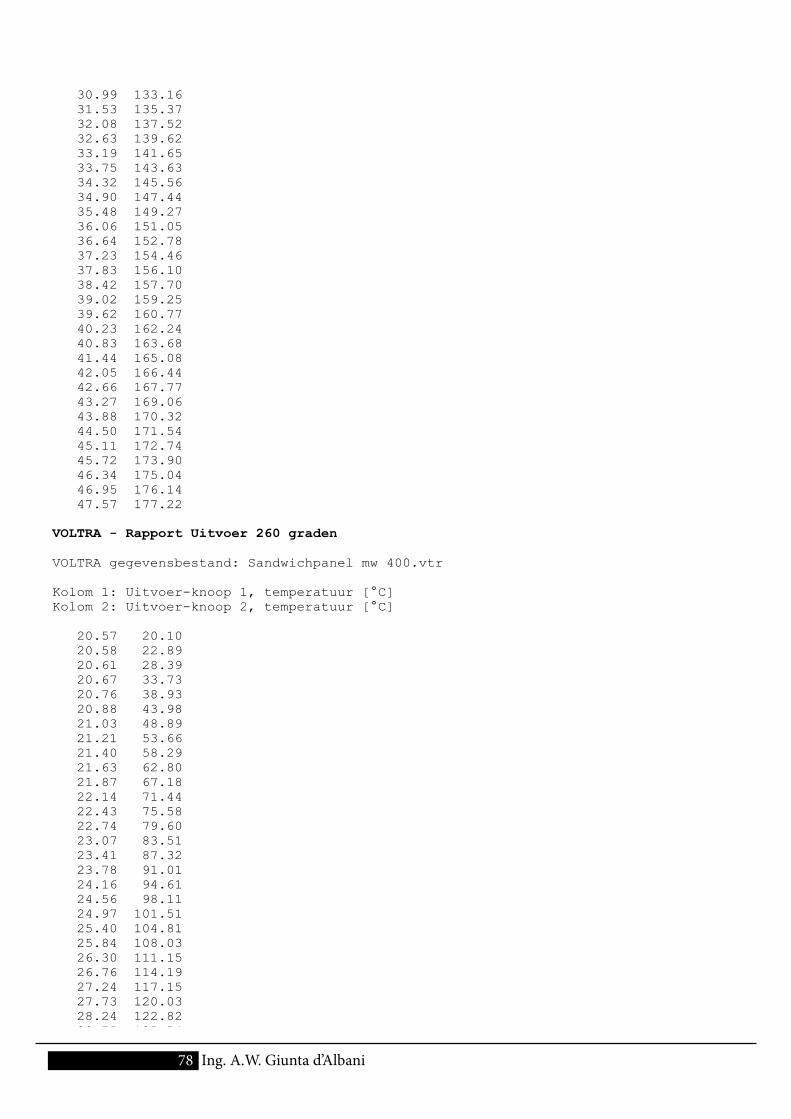
78 Ing. A.W. Giunta d’Albani
30.99 133.16 31.53 135.37 32.08 137.52 32.63 139.62 33.19 141.65 33.75 143.63 34.32 145.56 34.90 147.44 35.48 149.27 36.06 151.05 36.64 152.78 37.23 154.46 37.83 156.10 38.42 157.70 39.02 159.25 39.62 160.77 40.23 162.24 40.83 163.68 41.44 165.08 42.05 166.44 42.66 167.77 43.27 169.06 43.88 170.32 44.50 171.54 45.11 172.74 45.72 173.90 46.34 175.04 46.95 176.14 47.57 177.22
VOLTRA - Rapport Uitvoer 260 graden
VOLTRA gegevensbestand: Sandwichpanel mw 400.vtr
Kolom 1: Uitvoer-knoop 1, temperatuur [°C] Kolom 2: Uitvoer-knoop 2, temperatuur [°C]
20.57 20.10 20.58 22.89 20.61 28.39 20.67 33.73 20.76 38.93 20.88 43.98 21.03 48.89 21.21 53.66 21.40 58.29 21.63 62.80 21.87 67.18 22.14 71.44 22.43 75.58 22.74 79.60 23.07 83.51 23.41 87.32 23.78 91.01 24.16 94.61 24.56 98.11 24.97 101.51 25.40 104.81 25.84 108.03 26.30 111.15 26.76 114.19 27.24 117.15 27.73 120.03 28.24 122.82 28.75 125.54
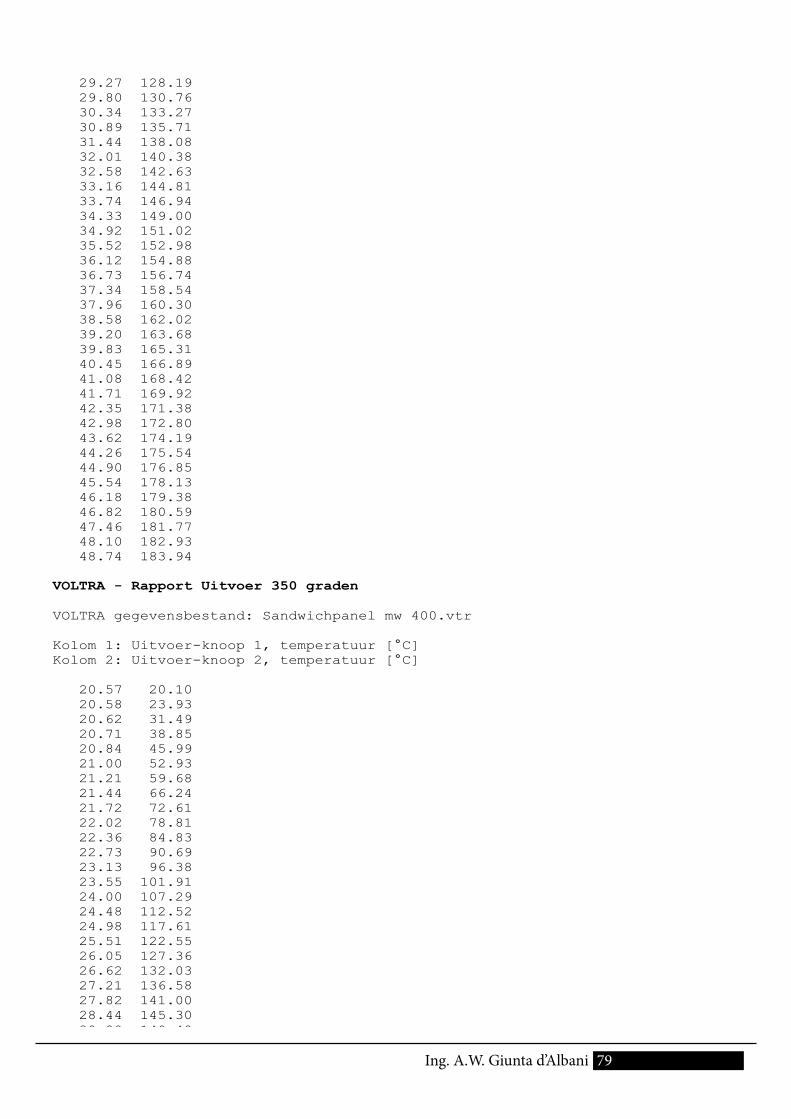
79Ing. A.W. Giunta d’Albani
29.27 128.19 29.80 130.76 30.34 133.27 30.89 135.71 31.44 138.08 32.01 140.38 32.58 142.63 33.16 144.81 33.74 146.94 34.33 149.00 34.92 151.02 35.52 152.98 36.12 154.88 36.73 156.74 37.34 158.54 37.96 160.30 38.58 162.02 39.20 163.68 39.83 165.31 40.45 166.89 41.08 168.42 41.71 169.92 42.35 171.38 42.98 172.80 43.62 174.19 44.26 175.54 44.90 176.85 45.54 178.13 46.18 179.38 46.82 180.59 47.46 181.77 48.10 182.93 48.74 183.94
VOLTRA - Rapport Uitvoer 350 graden
VOLTRA gegevensbestand: Sandwichpanel mw 400.vtr
Kolom 1: Uitvoer-knoop 1, temperatuur [°C] Kolom 2: Uitvoer-knoop 2, temperatuur [°C]
20.57 20.10 20.58 23.93 20.62 31.49 20.71 38.85 20.84 45.99 21.00 52.93 21.21 59.68 21.44 66.24 21.72 72.61 22.02 78.81 22.36 84.83 22.73 90.69 23.13 96.38 23.55 101.91 24.00 107.29 24.48 112.52 24.98 117.61 25.51 122.55 26.05 127.36 26.62 132.03 27.21 136.58 27.82 141.00 28.44 145.30 29.09 149.48
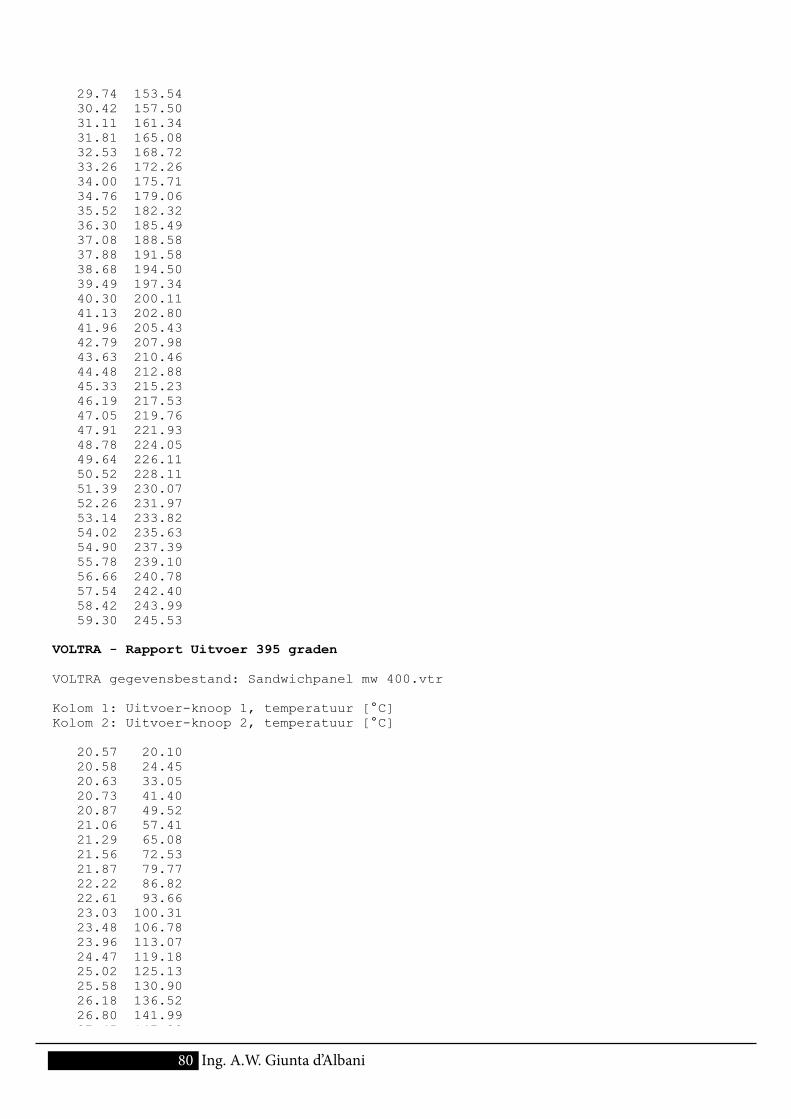
80 Ing. A.W. Giunta d’Albani
29.74 153.54 30.42 157.50 31.11 161.34 31.81 165.08 32.53 168.72 33.26 172.26 34.00 175.71 34.76 179.06 35.52 182.32 36.30 185.49 37.08 188.58 37.88 191.58 38.68 194.50 39.49 197.34 40.30 200.11 41.13 202.80 41.96 205.43 42.79 207.98 43.63 210.46 44.48 212.88 45.33 215.23 46.19 217.53 47.05 219.76 47.91 221.93 48.78 224.05 49.64 226.11 50.52 228.11 51.39 230.07 52.26 231.97 53.14 233.82 54.02 235.63 54.90 237.39 55.78 239.10 56.66 240.78 57.54 242.40 58.42 243.99 59.30 245.53
VOLTRA - Rapport Uitvoer 395 graden
VOLTRA gegevensbestand: Sandwichpanel mw 400.vtr
Kolom 1: Uitvoer-knoop 1, temperatuur [°C] Kolom 2: Uitvoer-knoop 2, temperatuur [°C]
20.57 20.10 20.58 24.45 20.63 33.05 20.73 41.40 20.87 49.52 21.06 57.41 21.29 65.08 21.56 72.53 21.87 79.77 22.22 86.82 22.61 93.66 23.03 100.31 23.48 106.78 23.96 113.07 24.47 119.18 25.02 125.13 25.58 130.90 26.18 136.52 26.80 141.99 27.45 147.30

81Ing. A.W. Giunta d’Albani
28.12 152.46 28.81 157.49 29.52 162.37 30.25 167.12 31.00 171.74 31.76 176.23 32.55 180.60 33.35 184.86 34.16 188.99 34.99 193.01 35.84 196.93 36.69 200.73 37.56 204.44 38.44 208.04 39.33 211.55 40.23 214.96 41.15 218.28 42.07 221.51 42.99 224.66 43.93 227.72 44.87 230.70 45.82 233.60 46.78 236.42 47.74 239.17 48.71 241.84 49.68 244.45 50.66 246.98 51.64 249.45 52.62 251.86 53.61 254.20 54.60 256.48 55.59 258.70 56.59 260.86 57.58 262.97 58.58 265.02 59.58 267.02 60.58 268.97 61.58 270.87 62.58 272.72 63.58 274.52 64.58 276.28
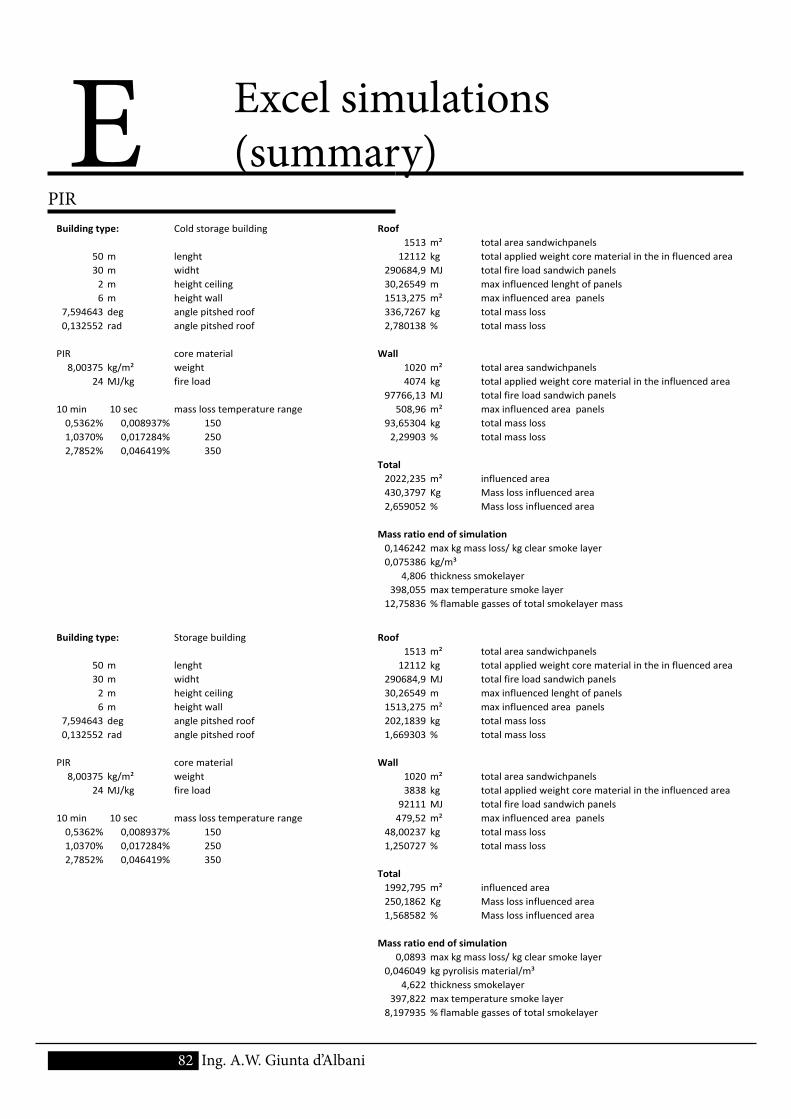
82 Ing. A.W. Giunta d’Albani
E Excel simulations(summary)
Building type: Cold storage building Roof1513 m² total area sandwichpanels
50 m lenght 12112 kg total applied weight core material in the in fluenced area30 m widht 290684,9 MJ total fire load sandwich panels2 m height ceiling 30,26549 m max influenced lenght of panels6 m height wall 1513,275 m² max influenced area panels
7,594643 deg angle pitshed roof 336,7267 kg total mass loss 0,132552 rad angle pitshed roof 2,780138 % total mass loss
PIR core material Wall8,00375 kg/m² weight 1020 m² total area sandwichpanels
24 MJ/kg fire load 4074 kg total applied weight core material in the influenced area97766,13 MJ total fire load sandwich panels
10 min 10 sec mass loss temperature range 508,96 m² max influenced area panels0,5362% 0,008937% 150 93,65304 kg total mass loss 1,0370% 0,017284% 250 2,29903 % total mass loss 2,7852% 0,046419% 350
Total2022,235 m² influenced area430,3797 Kg Mass loss influenced area2,659052 % Mass loss influenced area
Mass ratio end of simulation0,146242 max kg mass loss/ kg clear smoke layer0,075386 kg/m³
4,806 thickness smokelayer398,055 max temperature smoke layer
12,75836 % flamable gasses of total smokelayer mass
Building type: Storage building Roof1513 m² total area sandwichpanels
50 m lenght 12112 kg total applied weight core material in the in fluenced area30 m widht 290684,9 MJ total fire load sandwich panels2 m height ceiling 30,26549 m max influenced lenght of panels6 m height wall 1513,275 m² max influenced area panels
7,594643 deg angle pitshed roof 202,1839 kg total mass loss 0,132552 rad angle pitshed roof 1,669303 % total mass loss
PIR core material Wall8,00375 kg/m² weight 1020 m² total area sandwichpanels
24 MJ/kg fire load 3838 kg total applied weight core material in the influenced area92111 MJ total fire load sandwich panels
10 min 10 sec mass loss temperature range 479,52 m² max influenced area panels0,5362% 0,008937% 150 48,00237 kg total mass loss 1,0370% 0,017284% 250 1,250727 % total mass loss 2,7852% 0,046419% 350
Total1992,795 m² influenced area250,1862 Kg Mass loss influenced area1,568582 % Mass loss influenced area
Mass ratio end of simulation0,0893 max kg mass loss/ kg clear smoke layer
0,046049 kg pyrolisis material/m³4,622 thickness smokelayer
397,822 max temperature smoke layer8,197935 % flamable gasses of total smokelayer
PIR
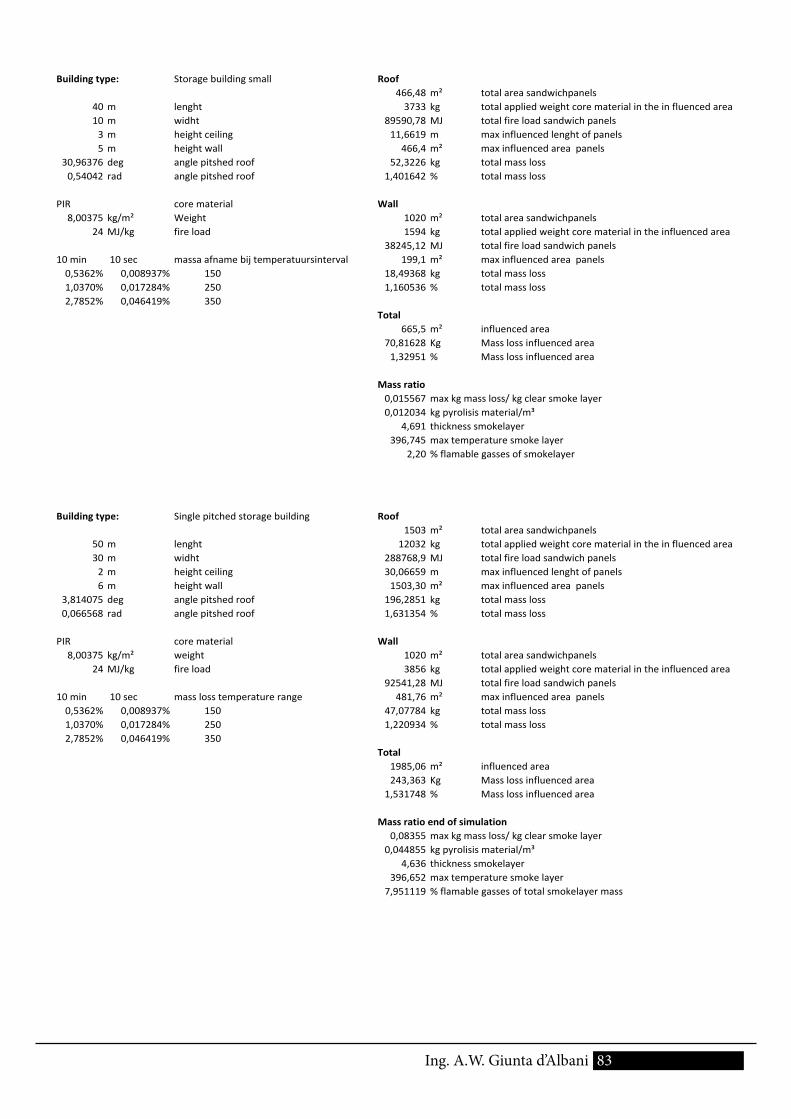
83Ing. A.W. Giunta d’Albani
Building type: Storage building small Roof466,48 m² total area sandwichpanels
40 m lenght 3733 kg total applied weight core material in the in fluenced area10 m widht 89590,78 MJ total fire load sandwich panels3 m height ceiling 11,6619 m max influenced lenght of panels5 m height wall 466,4 m² max influenced area panels
30,96376 deg angle pitshed roof 52,3226 kg total mass loss 0,54042 rad angle pitshed roof 1,401642 % total mass loss
PIR core material Wall8,00375 kg/m² Weight 1020 m² total area sandwichpanels
24 MJ/kg fire load 1594 kg total applied weight core material in the influenced area38245,12 MJ total fire load sandwich panels
10 min 10 sec massa afname bij temperatuursinterval 199,1 m² max influenced area panels0,5362% 0,008937% 150 18,49368 kg total mass loss 1,0370% 0,017284% 250 1,160536 % total mass loss 2,7852% 0,046419% 350
Total665,5 m² influenced area
70,81628 Kg Mass loss influenced area1,32951 % Mass loss influenced area
Mass ratio0,015567 max kg mass loss/ kg clear smoke layer0,012034 kg pyrolisis material/m³
4,691 thickness smokelayer396,745 max temperature smoke layer
2,20 % flamable gasses of smokelayer
Building type: Single pitched storage building Roof1503 m² total area sandwichpanels
50 m lenght 12032 kg total applied weight core material in the in fluenced area30 m widht 288768,9 MJ total fire load sandwich panels2 m height ceiling 30,06659 m max influenced lenght of panels6 m height wall 1503,30 m² max influenced area panels
3,814075 deg angle pitshed roof 196,2851 kg total mass loss 0,066568 rad angle pitshed roof 1,631354 % total mass loss
PIR core material Wall8,00375 kg/m² weight 1020 m² total area sandwichpanels
24 MJ/kg fire load 3856 kg total applied weight core material in the influenced area92541,28 MJ total fire load sandwich panels
10 min 10 sec mass loss temperature range 481,76 m² max influenced area panels0,5362% 0,008937% 150 47,07784 kg total mass loss 1,0370% 0,017284% 250 1,220934 % total mass loss 2,7852% 0,046419% 350
Total1985,06 m² influenced area243,363 Kg Mass loss influenced area
1,531748 % Mass loss influenced area
Mass ratio end of simulation0,08355 max kg mass loss/ kg clear smoke layer
0,044855 kg pyrolisis material/m³4,636 thickness smokelayer
396,652 max temperature smoke layer7,951119 % flamable gasses of total smokelayer mass
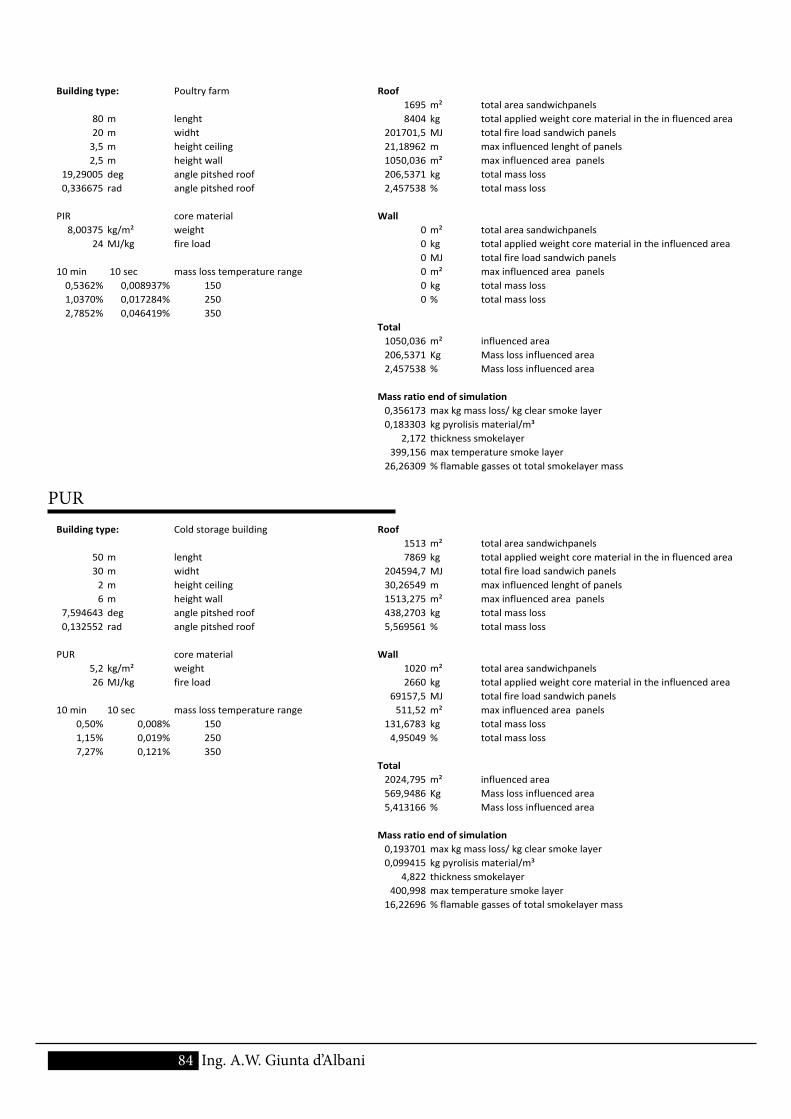
84 Ing. A.W. Giunta d’Albani
Building type: Poultry farm Roof1695 m² total area sandwichpanels
80 m lenght 8404 kg total applied weight core material in the in fluenced area20 m widht 201701,5 MJ total fire load sandwich panels3,5 m height ceiling 21,18962 m max influenced lenght of panels2,5 m height wall 1050,036 m² max influenced area panels
19,29005 deg angle pitshed roof 206,5371 kg total mass loss 0,336675 rad angle pitshed roof 2,457538 % total mass loss
PIR core material Wall8,00375 kg/m² weight 0 m² total area sandwichpanels
24 MJ/kg fire load 0 kg total applied weight core material in the influenced area0 MJ total fire load sandwich panels
10 min 10 sec mass loss temperature range 0 m² max influenced area panels0,5362% 0,008937% 150 0 kg total mass loss 1,0370% 0,017284% 250 0 % total mass loss 2,7852% 0,046419% 350
Total1050,036 m² influenced area206,5371 Kg Mass loss influenced area2,457538 % Mass loss influenced area
Mass ratio end of simulation0,356173 max kg mass loss/ kg clear smoke layer0,183303 kg pyrolisis material/m³
2,172 thickness smokelayer399,156 max temperature smoke layer
26,26309 % flamable gasses ot total smokelayer mass
Building type: Cold storage building Roof1513 m² total area sandwichpanels
50 m lenght 7869 kg total applied weight core material in the in fluenced area30 m widht 204594,7 MJ total fire load sandwich panels2 m height ceiling 30,26549 m max influenced lenght of panels6 m height wall 1513,275 m² max influenced area panels
7,594643 deg angle pitshed roof 438,2703 kg total mass loss 0,132552 rad angle pitshed roof 5,569561 % total mass loss
PUR core material Wall5,2 kg/m² weight 1020 m² total area sandwichpanels 26 MJ/kg fire load 2660 kg total applied weight core material in the influenced area
69157,5 MJ total fire load sandwich panels10 min 10 sec mass loss temperature range 511,52 m² max influenced area panels
0,50% 0,008% 150 131,6783 kg total mass loss 1,15% 0,019% 250 4,95049 % total mass loss 7,27% 0,121% 350
Total2024,795 m² influenced area569,9486 Kg Mass loss influenced area5,413166 % Mass loss influenced area
Mass ratio end of simulation0,193701 max kg mass loss/ kg clear smoke layer0,099415 kg pyrolisis material/m³
4,822 thickness smokelayer400,998 max temperature smoke layer
16,22696 % flamable gasses of total smokelayer mass
PUR
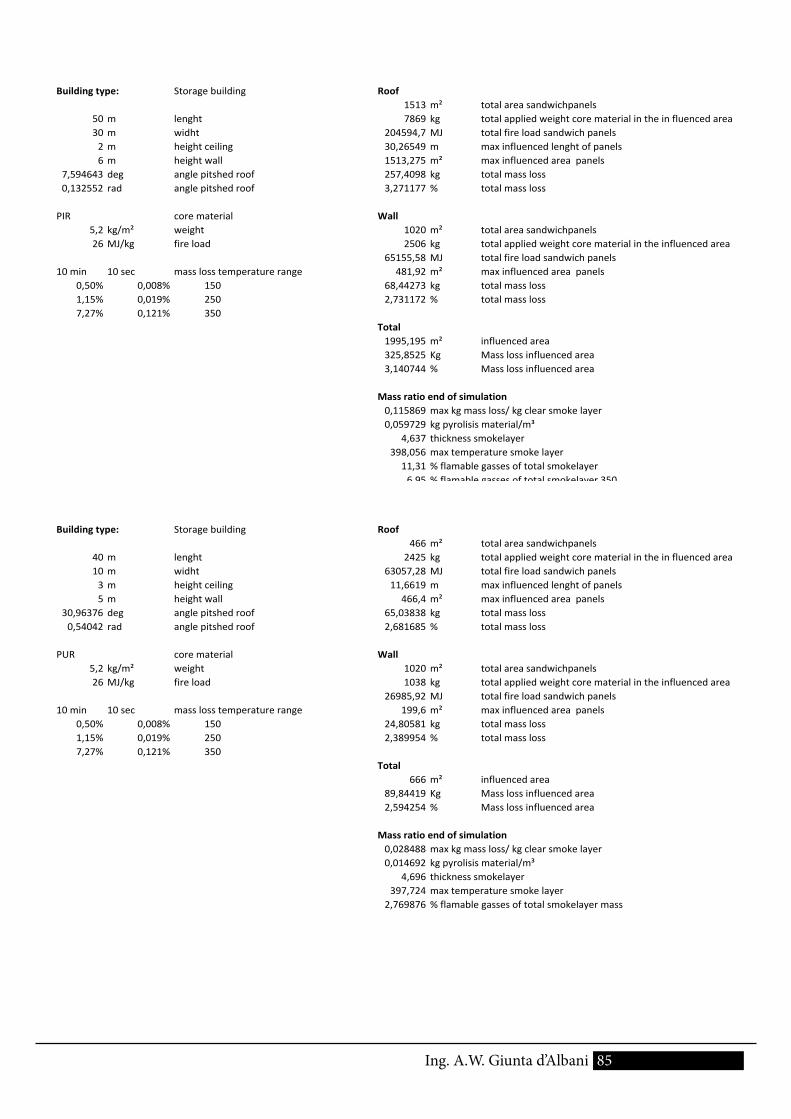
85Ing. A.W. Giunta d’Albani
Building type: Storage building Roof1513 m² total area sandwichpanels
50 m lenght 7869 kg total applied weight core material in the in fluenced area30 m widht 204594,7 MJ total fire load sandwich panels2 m height ceiling 30,26549 m max influenced lenght of panels6 m height wall 1513,275 m² max influenced area panels
7,594643 deg angle pitshed roof 257,4098 kg total mass loss 0,132552 rad angle pitshed roof 3,271177 % total mass loss
PIR core material Wall5,2 kg/m² weight 1020 m² total area sandwichpanels 26 MJ/kg fire load 2506 kg total applied weight core material in the influenced area
65155,58 MJ total fire load sandwich panels10 min 10 sec mass loss temperature range 481,92 m² max influenced area panels
0,50% 0,008% 150 68,44273 kg total mass loss 1,15% 0,019% 250 2,731172 % total mass loss 7,27% 0,121% 350
Total1995,195 m² influenced area325,8525 Kg Mass loss influenced area3,140744 % Mass loss influenced area
Mass ratio end of simulation0,115869 max kg mass loss/ kg clear smoke layer0,059729 kg pyrolisis material/m³
4,637 thickness smokelayer398,056 max temperature smoke layer
11,31 % flamable gasses of total smokelayer6,95 % flamable gasses of total smokelayer 3501,67 % flamable gasses of total smokelayer 2500,75 % flamable gasses of total smokelayer 150
Building type: Storage building Roof466 m² total area sandwichpanels
40 m lenght 2425 kg total applied weight core material in the in fluenced area10 m widht 63057,28 MJ total fire load sandwich panels3 m height ceiling 11,6619 m max influenced lenght of panels5 m height wall 466,4 m² max influenced area panels
30,96376 deg angle pitshed roof 65,03838 kg total mass loss 0,54042 rad angle pitshed roof 2,681685 % total mass loss
PUR core material Wall5,2 kg/m² weight 1020 m² total area sandwichpanels 26 MJ/kg fire load 1038 kg total applied weight core material in the influenced area
26985,92 MJ total fire load sandwich panels10 min 10 sec mass loss temperature range 199,6 m² max influenced area panels
0,50% 0,008% 150 24,80581 kg total mass loss 1,15% 0,019% 250 2,389954 % total mass loss 7,27% 0,121% 350
Total666 m² influenced area
89,84419 Kg Mass loss influenced area2,594254 % Mass loss influenced area
Mass ratio end of simulation0,028488 max kg mass loss/ kg clear smoke layer0,014692 kg pyrolisis material/m³
4,696 thickness smokelayer397,724 max temperature smoke layer
2,769876 % flamable gasses of total smokelayer mass
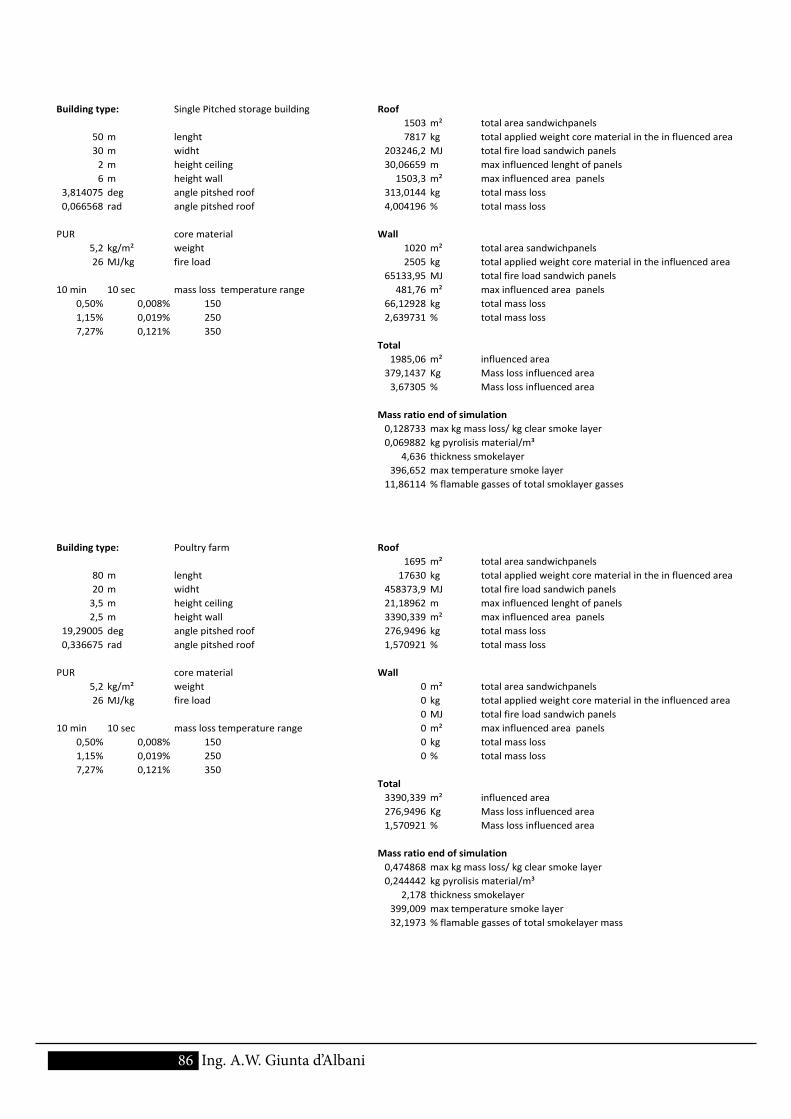
86 Ing. A.W. Giunta d’Albani
Building type: Single Pitched storage building Roof1503 m² total area sandwichpanels
50 m lenght 7817 kg total applied weight core material in the in fluenced area30 m widht 203246,2 MJ total fire load sandwich panels2 m height ceiling 30,06659 m max influenced lenght of panels6 m height wall 1503,3 m² max influenced area panels
3,814075 deg angle pitshed roof 313,0144 kg total mass loss 0,066568 rad angle pitshed roof 4,004196 % total mass loss
PUR core material Wall5,2 kg/m² weight 1020 m² total area sandwichpanels 26 MJ/kg fire load 2505 kg total applied weight core material in the influenced area
65133,95 MJ total fire load sandwich panels10 min 10 sec mass loss temperature range 481,76 m² max influenced area panels
0,50% 0,008% 150 66,12928 kg total mass loss 1,15% 0,019% 250 2,639731 % total mass loss 7,27% 0,121% 350
Total1985,06 m² influenced area
379,1437 Kg Mass loss influenced area3,67305 % Mass loss influenced area
Mass ratio end of simulation0,128733 max kg mass loss/ kg clear smoke layer0,069882 kg pyrolisis material/m³
4,636 thickness smokelayer396,652 max temperature smoke layer
11,86114 % flamable gasses of total smoklayer gasses
Building type: Poultry farm Roof1695 m² total area sandwichpanels
80 m lenght 17630 kg total applied weight core material in the in fluenced area20 m widht 458373,9 MJ total fire load sandwich panels3,5 m height ceiling 21,18962 m max influenced lenght of panels2,5 m height wall 3390,339 m² max influenced area panels
19,29005 deg angle pitshed roof 276,9496 kg total mass loss 0,336675 rad angle pitshed roof 1,570921 % total mass loss
PUR core material Wall5,2 kg/m² weight 0 m² total area sandwichpanels 26 MJ/kg fire load 0 kg total applied weight core material in the influenced area
0 MJ total fire load sandwich panels10 min 10 sec mass loss temperature range 0 m² max influenced area panels
0,50% 0,008% 150 0 kg total mass loss 1,15% 0,019% 250 0 % total mass loss 7,27% 0,121% 350
Total3390,339 m² influenced area276,9496 Kg Mass loss influenced area1,570921 % Mass loss influenced area
Mass ratio end of simulation0,474868 max kg mass loss/ kg clear smoke layer0,244442 kg pyrolisis material/m³
2,178 thickness smokelayer399,009 max temperature smoke layer32,1973 % flamable gasses of total smokelayer mass
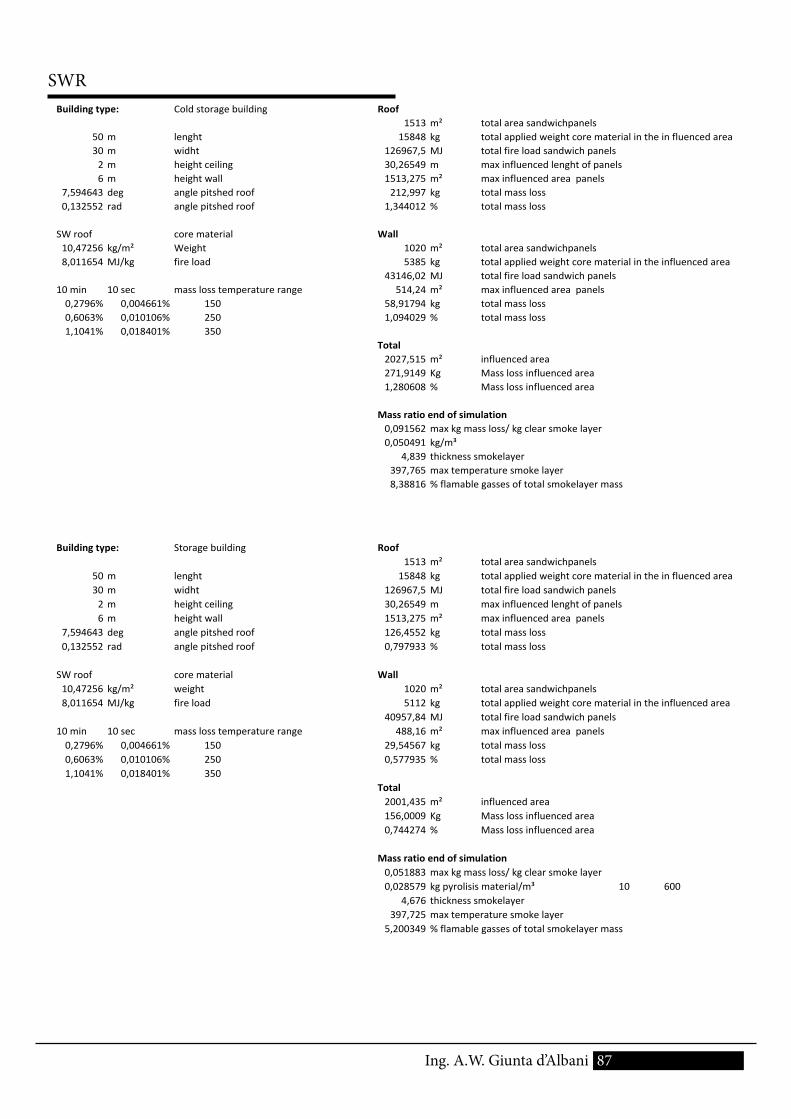
87Ing. A.W. Giunta d’Albani
Building type: Cold storage building Roof1513 m² total area sandwichpanels
50 m lenght 15848 kg total applied weight core material in the in fluenced area30 m widht 126967,5 MJ total fire load sandwich panels2 m height ceiling 30,26549 m max influenced lenght of panels6 m height wall 1513,275 m² max influenced area panels
7,594643 deg angle pitshed roof 212,997 kg total mass loss 0,132552 rad angle pitshed roof 1,344012 % total mass loss
SW roof core material Wall10,47256 kg/m² Weight 1020 m² total area sandwichpanels 8,011654 MJ/kg fire load 5385 kg total applied weight core material in the influenced area
43146,02 MJ total fire load sandwich panels10 min 10 sec mass loss temperature range 514,24 m² max influenced area panels0,2796% 0,004661% 150 58,91794 kg total mass loss 0,6063% 0,010106% 250 1,094029 % total mass loss 1,1041% 0,018401% 350
Total2027,515 m² influenced area271,9149 Kg Mass loss influenced area1,280608 % Mass loss influenced area
Mass ratio end of simulation0,091562 max kg mass loss/ kg clear smoke layer0,050491 kg/m³
4,839 thickness smokelayer397,765 max temperature smoke layer8,38816 % flamable gasses of total smokelayer mass
Building type: Storage building Roof1513 m² total area sandwichpanels
50 m lenght 15848 kg total applied weight core material in the in fluenced area30 m widht 126967,5 MJ total fire load sandwich panels2 m height ceiling 30,26549 m max influenced lenght of panels6 m height wall 1513,275 m² max influenced area panels
7,594643 deg angle pitshed roof 126,4552 kg total mass loss 0,132552 rad angle pitshed roof 0,797933 % total mass loss
SW roof core material Wall10,47256 kg/m² weight 1020 m² total area sandwichpanels 8,011654 MJ/kg fire load 5112 kg total applied weight core material in the influenced area
40957,84 MJ total fire load sandwich panels10 min 10 sec mass loss temperature range 488,16 m² max influenced area panels0,2796% 0,004661% 150 29,54567 kg total mass loss 0,6063% 0,010106% 250 0,577935 % total mass loss 1,1041% 0,018401% 350
Total2001,435 m² influenced area156,0009 Kg Mass loss influenced area0,744274 % Mass loss influenced area
Mass ratio end of simulation0,051883 max kg mass loss/ kg clear smoke layer0,028579 kg pyrolisis material/m³ 10 600
4,676 thickness smokelayer397,725 max temperature smoke layer
5,200349 % flamable gasses of total smokelayer mass
SWR
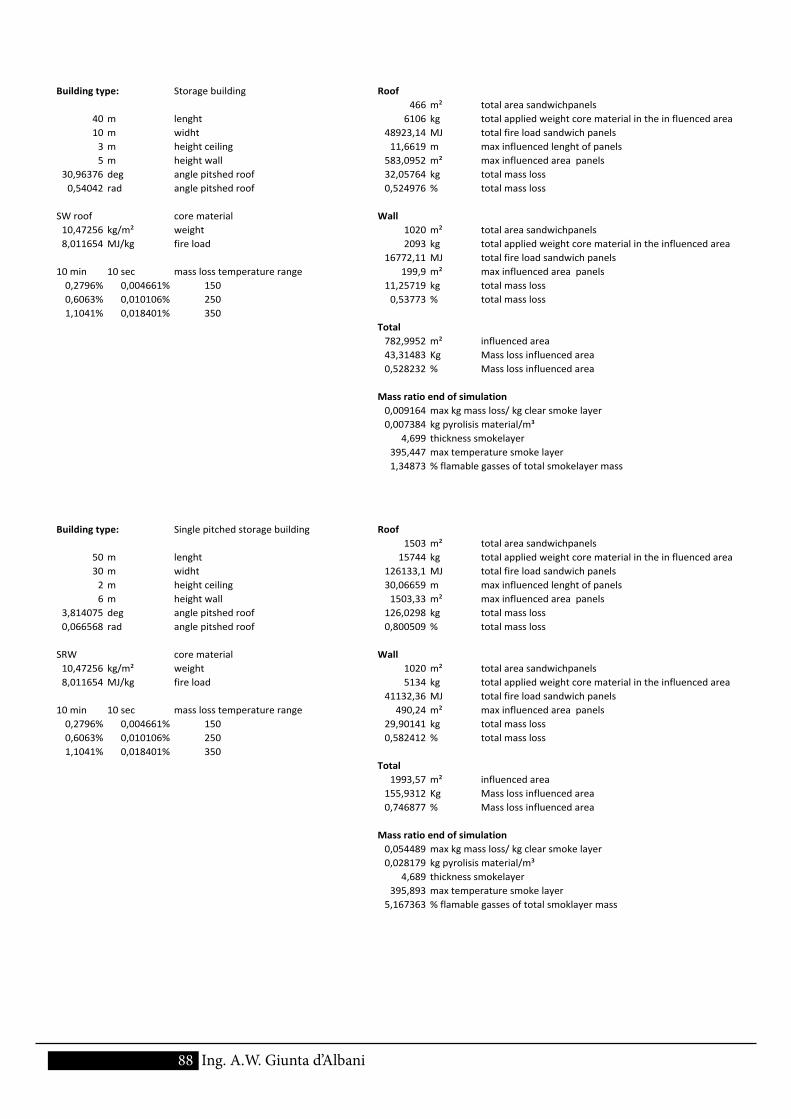
88 Ing. A.W. Giunta d’Albani
Building type: Storage building Roof466 m² total area sandwichpanels
40 m lenght 6106 kg total applied weight core material in the in fluenced area10 m widht 48923,14 MJ total fire load sandwich panels3 m height ceiling 11,6619 m max influenced lenght of panels5 m height wall 583,0952 m² max influenced area panels
30,96376 deg angle pitshed roof 32,05764 kg total mass loss 0,54042 rad angle pitshed roof 0,524976 % total mass loss
SW roof core material Wall10,47256 kg/m² weight 1020 m² total area sandwichpanels 8,011654 MJ/kg fire load 2093 kg total applied weight core material in the influenced area
16772,11 MJ total fire load sandwich panels10 min 10 sec mass loss temperature range 199,9 m² max influenced area panels0,2796% 0,004661% 150 11,25719 kg total mass loss 0,6063% 0,010106% 250 0,53773 % total mass loss 1,1041% 0,018401% 350
Total782,9952 m² influenced area43,31483 Kg Mass loss influenced area0,528232 % Mass loss influenced area
Mass ratio end of simulation0,009164 max kg mass loss/ kg clear smoke layer0,007384 kg pyrolisis material/m³
4,699 thickness smokelayer395,447 max temperature smoke layer1,34873 % flamable gasses of total smokelayer mass
Building type: Single pitched storage building Roof1503 m² total area sandwichpanels
50 m lenght 15744 kg total applied weight core material in the in fluenced area30 m widht 126133,1 MJ total fire load sandwich panels2 m height ceiling 30,06659 m max influenced lenght of panels6 m height wall 1503,33 m² max influenced area panels
3,814075 deg angle pitshed roof 126,0298 kg total mass loss 0,066568 rad angle pitshed roof 0,800509 % total mass loss
SRW core material Wall10,47256 kg/m² weight 1020 m² total area sandwichpanels 8,011654 MJ/kg fire load 5134 kg total applied weight core material in the influenced area
41132,36 MJ total fire load sandwich panels10 min 10 sec mass loss temperature range 490,24 m² max influenced area panels0,2796% 0,004661% 150 29,90141 kg total mass loss 0,6063% 0,010106% 250 0,582412 % total mass loss 1,1041% 0,018401% 350
Total1993,57 m² influenced area
155,9312 Kg Mass loss influenced area0,746877 % Mass loss influenced area
Mass ratio end of simulation0,054489 max kg mass loss/ kg clear smoke layer0,028179 kg pyrolisis material/m³
4,689 thickness smokelayer395,893 max temperature smoke layer
5,167363 % flamable gasses of total smoklayer mass
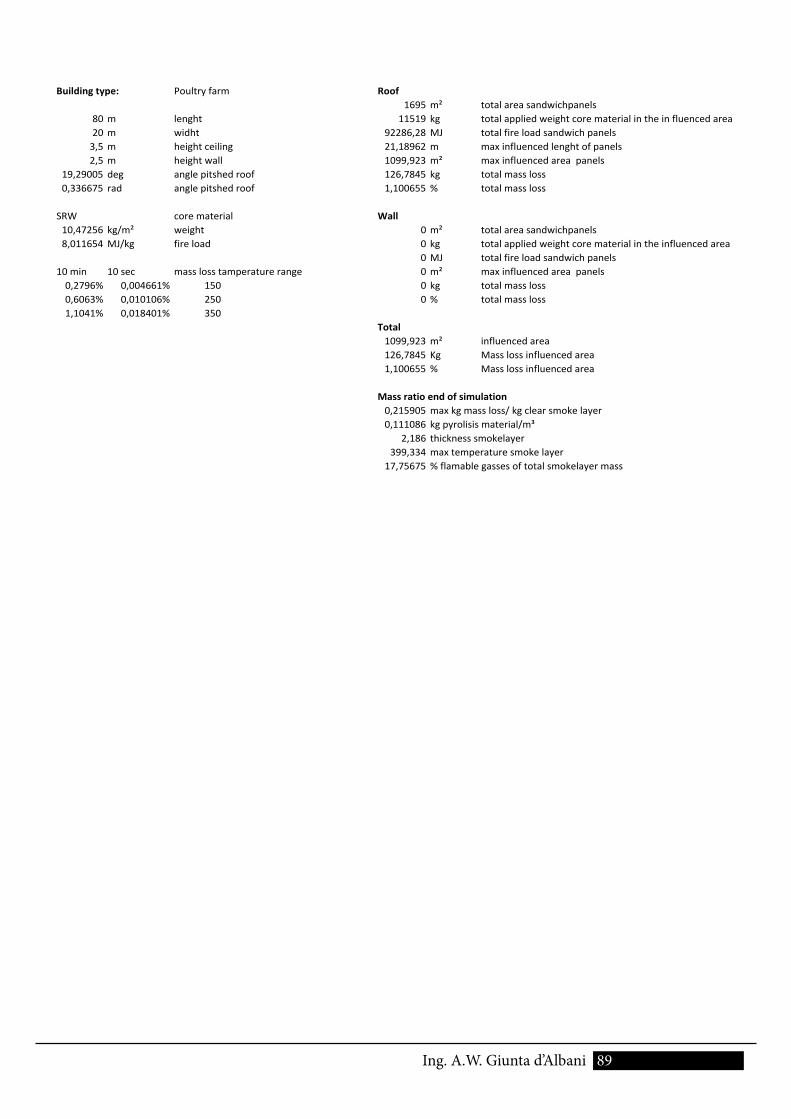
89Ing. A.W. Giunta d’Albani
Building type: Poultry farm Roof1695 m² total area sandwichpanels
80 m lenght 11519 kg total applied weight core material in the in fluenced area20 m widht 92286,28 MJ total fire load sandwich panels3,5 m height ceiling 21,18962 m max influenced lenght of panels2,5 m height wall 1099,923 m² max influenced area panels
19,29005 deg angle pitshed roof 126,7845 kg total mass loss 0,336675 rad angle pitshed roof 1,100655 % total mass loss
SRW core material Wall10,47256 kg/m² weight 0 m² total area sandwichpanels 8,011654 MJ/kg fire load 0 kg total applied weight core material in the influenced area
0 MJ total fire load sandwich panels10 min 10 sec mass loss tamperature range 0 m² max influenced area panels0,2796% 0,004661% 150 0 kg total mass loss 0,6063% 0,010106% 250 0 % total mass loss 1,1041% 0,018401% 350
Total1099,923 m² influenced area126,7845 Kg Mass loss influenced area1,100655 % Mass loss influenced area
Mass ratio end of simulation0,215905 max kg mass loss/ kg clear smoke layer0,111086 kg pyrolisis material/m³
2,186 thickness smokelayer399,334 max temperature smoke layer
17,75675 % flamable gasses of total smokelayer mass
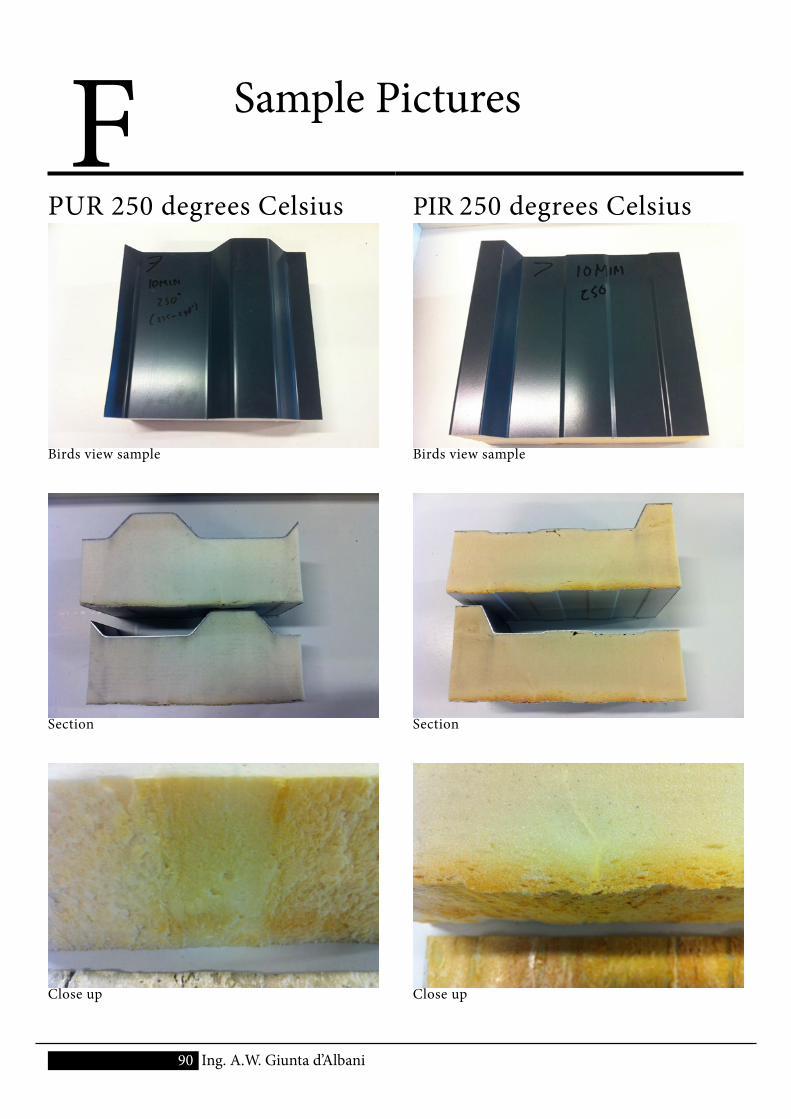
F Sample Pictures
PUR 250 degrees Celsius PIR 250 degrees Celsius
90 Ing. A.W. Giunta d’Albani
Birds view sample
Section
Close up
Birds view sample
Section
Close up
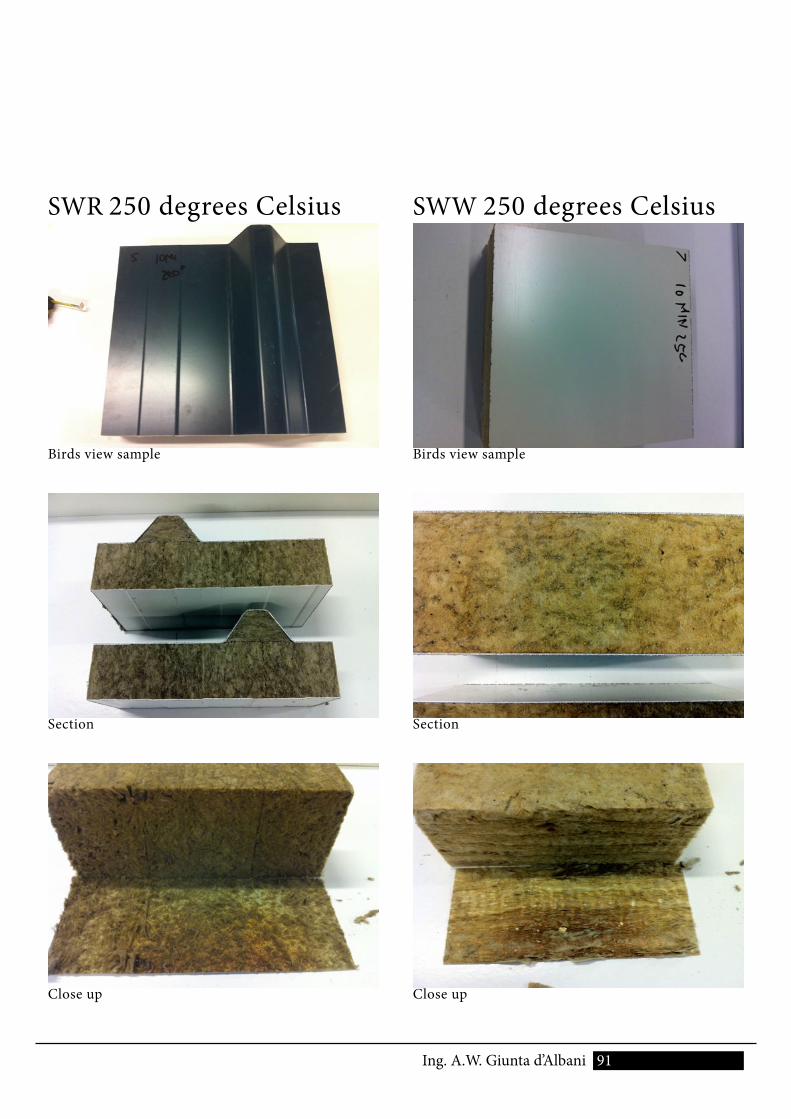
91 Ing. A.W. Giunta d’Albani
SWW 250 degrees CelsiusSWR 250 degrees Celsius
Birds view sample
Section
Close up
Birds view sample
Section
Close up
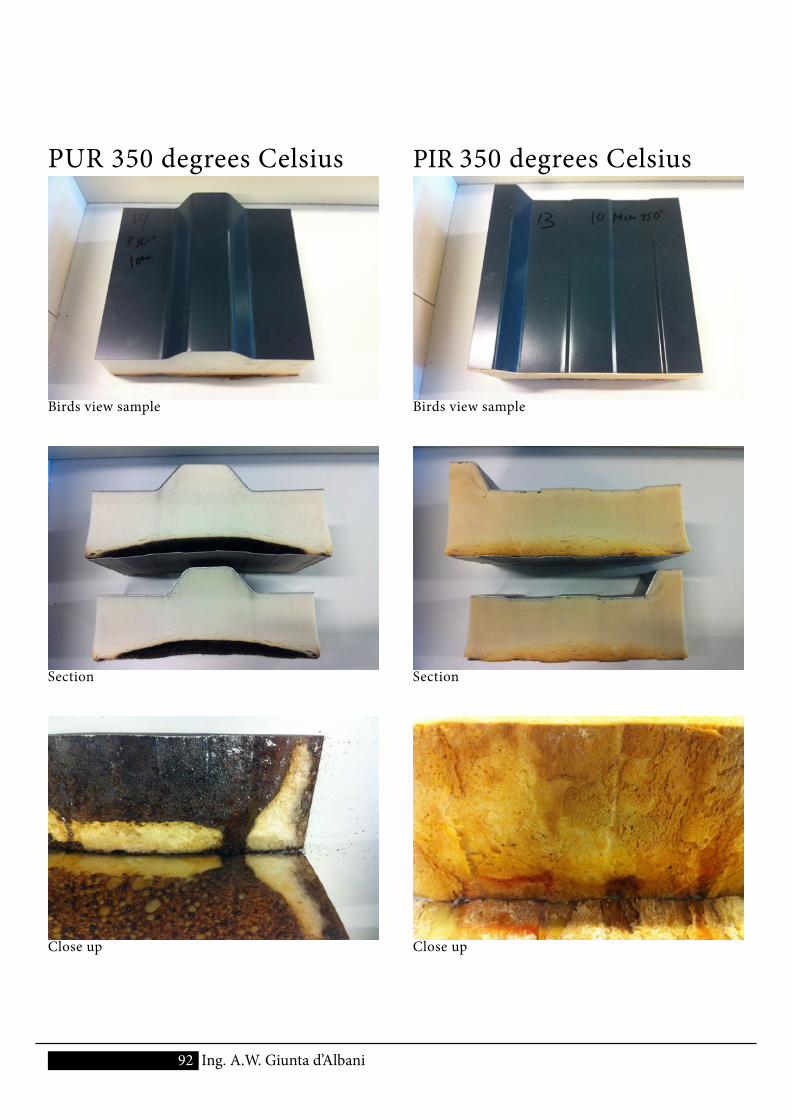
92 Ing. A.W. Giunta d’Albani
PUR 350 degrees Celsius PIR 350 degrees Celsius
Birds view sample
Section
Close up
Birds view sample
Section
Close up
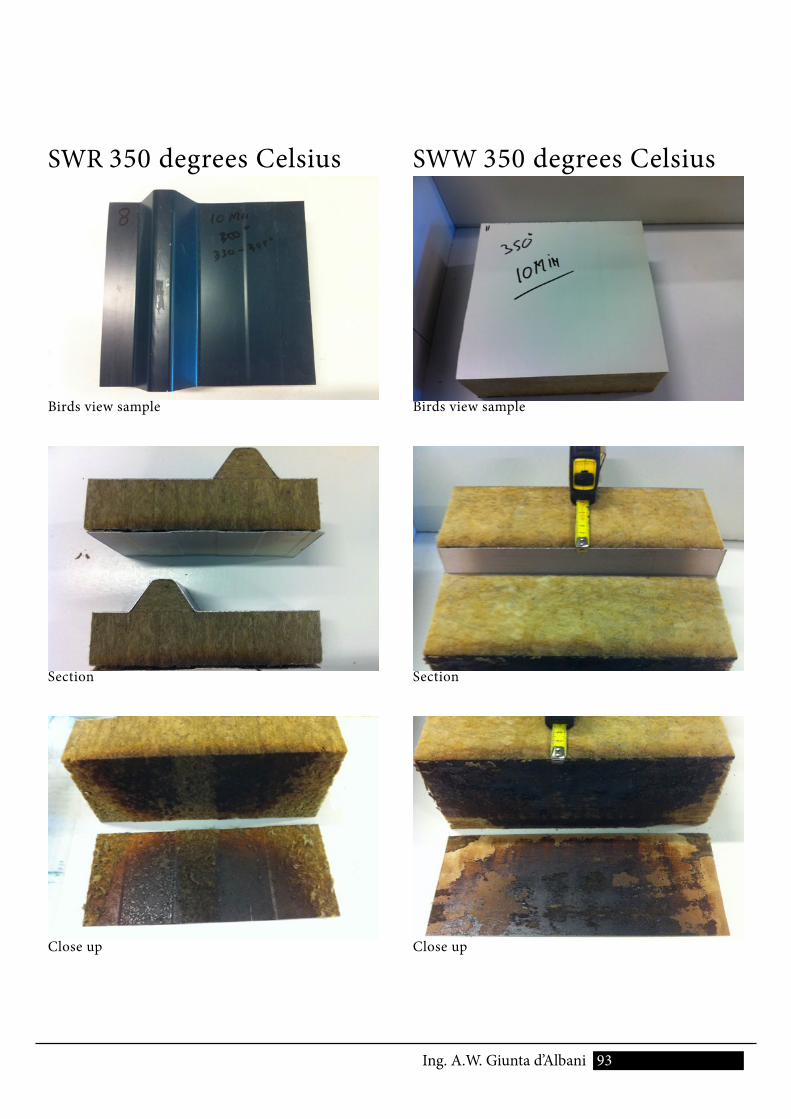
93Ing. A.W. Giunta d’Albani
SWW 350 degrees CelsiusSWR 350 degrees Celsius
Birds view sample
Section
Close up
Birds view sample
Section
Close up
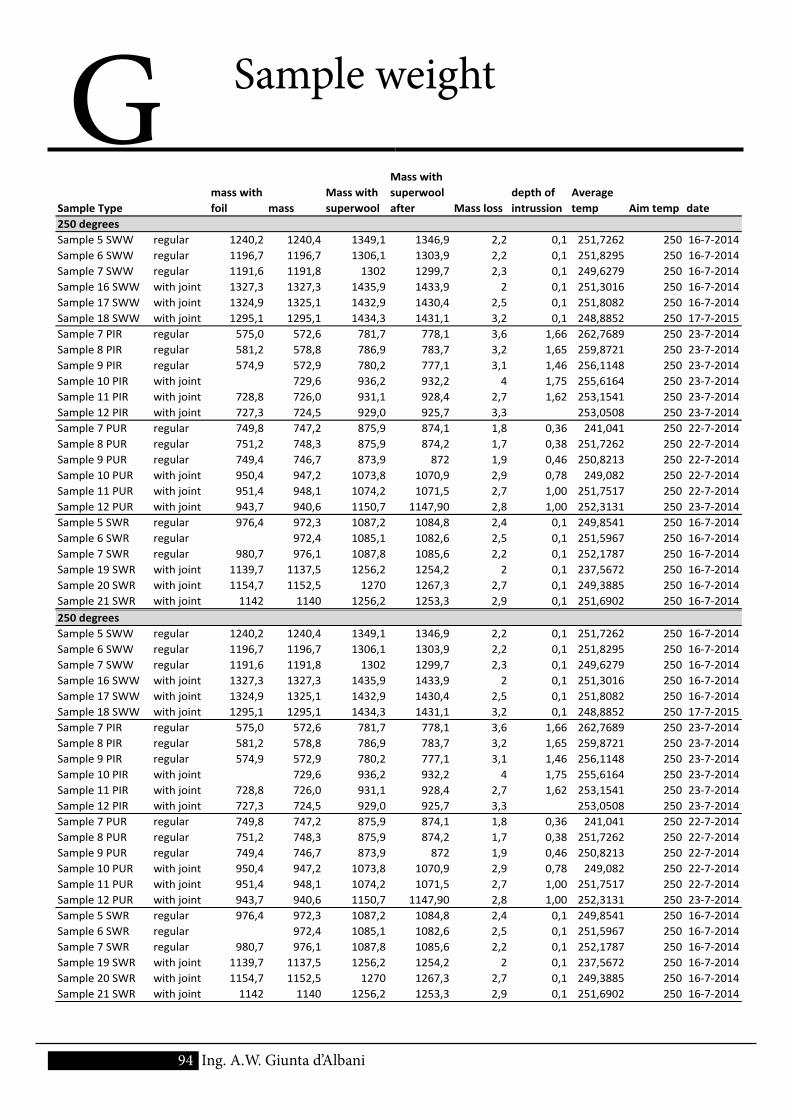
94 Ing. A.W. Giunta d’Albani
G Sample weight
Sample Typemass with foil mass
Mass with superwool
Mass with superwool after Mass loss
depth of intrussion
Average temp Aim temp date
250 degreesSample 5 SWW regular 1240,2 1240,4 1349,1 1346,9 2,2 0,1 251,7262 250 16‐7‐2014Sample 6 SWW regular 1196,7 1196,7 1306,1 1303,9 2,2 0,1 251,8295 250 16‐7‐2014Sample 7 SWW regular 1191,6 1191,8 1302 1299,7 2,3 0,1 249,6279 250 16‐7‐2014Sample 16 SWW with joint 1327,3 1327,3 1435,9 1433,9 2 0,1 251,3016 250 16‐7‐2014Sample 17 SWW with joint 1324,9 1325,1 1432,9 1430,4 2,5 0,1 251,8082 250 16‐7‐2014Sample 18 SWW with joint 1295,1 1295,1 1434,3 1431,1 3,2 0,1 248,8852 250 17‐7‐2015Sample 7 PIR regular 575,0 572,6 781,7 778,1 3,6 1,66 262,7689 250 23‐7‐2014Sample 8 PIR regular 581,2 578,8 786,9 783,7 3,2 1,65 259,8721 250 23‐7‐2014Sample 9 PIR regular 574,9 572,9 780,2 777,1 3,1 1,46 256,1148 250 23‐7‐2014Sample 10 PIR with joint 729,6 936,2 932,2 4 1,75 255,6164 250 23‐7‐2014Sample 11 PIR with joint 728,8 726,0 931,1 928,4 2,7 1,62 253,1541 250 23‐7‐2014Sample 12 PIR with joint 727,3 724,5 929,0 925,7 3,3 253,0508 250 23‐7‐2014Sample 7 PUR regular 749,8 747,2 875,9 874,1 1,8 0,36 241,041 250 22‐7‐2014Sample 8 PUR regular 751,2 748,3 875,9 874,2 1,7 0,38 251,7262 250 22‐7‐2014Sample 9 PUR regular 749,4 746,7 873,9 872 1,9 0,46 250,8213 250 22‐7‐2014Sample 10 PUR with joint 950,4 947,2 1073,8 1070,9 2,9 0,78 249,082 250 22‐7‐2014Sample 11 PUR with joint 951,4 948,1 1074,2 1071,5 2,7 1,00 251,7517 250 22‐7‐2014Sample 12 PUR with joint 943,7 940,6 1150,7 1147,90 2,8 1,00 252,3131 250 23‐7‐2014Sample 5 SWR regular 976,4 972,3 1087,2 1084,8 2,4 0,1 249,8541 250 16‐7‐2014Sample 6 SWR regular 972,4 1085,1 1082,6 2,5 0,1 251,5967 250 16‐7‐2014Sample 7 SWR regular 980,7 976,1 1087,8 1085,6 2,2 0,1 252,1787 250 16‐7‐2014Sample 19 SWR with joint 1139,7 1137,5 1256,2 1254,2 2 0,1 237,5672 250 16‐7‐2014Sample 20 SWR with joint 1154,7 1152,5 1270 1267,3 2,7 0,1 249,3885 250 16‐7‐2014Sample 21 SWR with joint 1142 1140 1256,2 1253,3 2,9 0,1 251,6902 250 16‐7‐2014Sample Type
mass with foil mass
Mass with superwool
Mass with superwool after Mass loss
depth of intrussion
Average temp Aim temp date
250 degreesSample 5 SWW regular 1240,2 1240,4 1349,1 1346,9 2,2 0,1 251,7262 250 16‐7‐2014Sample 6 SWW regular 1196,7 1196,7 1306,1 1303,9 2,2 0,1 251,8295 250 16‐7‐2014Sample 7 SWW regular 1191,6 1191,8 1302 1299,7 2,3 0,1 249,6279 250 16‐7‐2014Sample 16 SWW with joint 1327,3 1327,3 1435,9 1433,9 2 0,1 251,3016 250 16‐7‐2014Sample 17 SWW with joint 1324,9 1325,1 1432,9 1430,4 2,5 0,1 251,8082 250 16‐7‐2014Sample 18 SWW with joint 1295,1 1295,1 1434,3 1431,1 3,2 0,1 248,8852 250 17‐7‐2015Sample 7 PIR regular 575,0 572,6 781,7 778,1 3,6 1,66 262,7689 250 23‐7‐2014Sample 8 PIR regular 581,2 578,8 786,9 783,7 3,2 1,65 259,8721 250 23‐7‐2014Sample 9 PIR regular 574,9 572,9 780,2 777,1 3,1 1,46 256,1148 250 23‐7‐2014Sample 10 PIR with joint 729,6 936,2 932,2 4 1,75 255,6164 250 23‐7‐2014Sample 11 PIR with joint 728,8 726,0 931,1 928,4 2,7 1,62 253,1541 250 23‐7‐2014Sample 12 PIR with joint 727,3 724,5 929,0 925,7 3,3 253,0508 250 23‐7‐2014Sample 7 PUR regular 749,8 747,2 875,9 874,1 1,8 0,36 241,041 250 22‐7‐2014Sample 8 PUR regular 751,2 748,3 875,9 874,2 1,7 0,38 251,7262 250 22‐7‐2014Sample 9 PUR regular 749,4 746,7 873,9 872 1,9 0,46 250,8213 250 22‐7‐2014Sample 10 PUR with joint 950,4 947,2 1073,8 1070,9 2,9 0,78 249,082 250 22‐7‐2014Sample 11 PUR with joint 951,4 948,1 1074,2 1071,5 2,7 1,00 251,7517 250 22‐7‐2014Sample 12 PUR with joint 943,7 940,6 1150,7 1147,90 2,8 1,00 252,3131 250 23‐7‐2014Sample 5 SWR regular 976,4 972,3 1087,2 1084,8 2,4 0,1 249,8541 250 16‐7‐2014Sample 6 SWR regular 972,4 1085,1 1082,6 2,5 0,1 251,5967 250 16‐7‐2014Sample 7 SWR regular 980,7 976,1 1087,8 1085,6 2,2 0,1 252,1787 250 16‐7‐2014Sample 19 SWR with joint 1139,7 1137,5 1256,2 1254,2 2 0,1 237,5672 250 16‐7‐2014Sample 20 SWR with joint 1154,7 1152,5 1270 1267,3 2,7 0,1 249,3885 250 16‐7‐2014Sample 21 SWR with joint 1142 1140 1256,2 1253,3 2,9 0,1 251,6902 250 16‐7‐2014
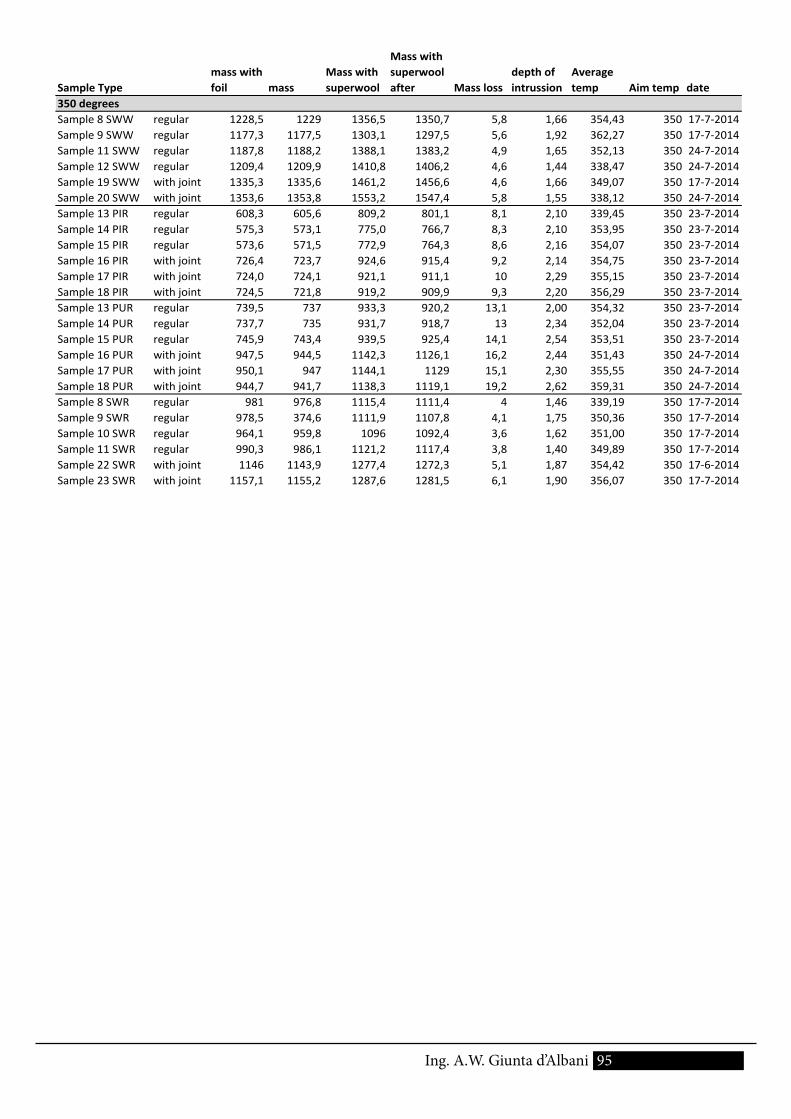
95Ing. A.W. Giunta d’Albani
Sample Typemass with foil mass
Mass with superwool
Mass with superwool after Mass loss
depth of intrussion
Average temp Aim temp date
350 degreesSample 8 SWW regular 1228,5 1229 1356,5 1350,7 5,8 1,66 354,43 350 17‐7‐2014Sample 9 SWW regular 1177,3 1177,5 1303,1 1297,5 5,6 1,92 362,27 350 17‐7‐2014Sample 11 SWW regular 1187,8 1188,2 1388,1 1383,2 4,9 1,65 352,13 350 24‐7‐2014Sample 12 SWW regular 1209,4 1209,9 1410,8 1406,2 4,6 1,44 338,47 350 24‐7‐2014Sample 19 SWW with joint 1335,3 1335,6 1461,2 1456,6 4,6 1,66 349,07 350 17‐7‐2014Sample 20 SWW with joint 1353,6 1353,8 1553,2 1547,4 5,8 1,55 338,12 350 24‐7‐2014Sample 13 PIR regular 608,3 605,6 809,2 801,1 8,1 2,10 339,45 350 23‐7‐2014Sample 14 PIR regular 575,3 573,1 775,0 766,7 8,3 2,10 353,95 350 23‐7‐2014Sample 15 PIR regular 573,6 571,5 772,9 764,3 8,6 2,16 354,07 350 23‐7‐2014Sample 16 PIR with joint 726,4 723,7 924,6 915,4 9,2 2,14 354,75 350 23‐7‐2014Sample 17 PIR with joint 724,0 724,1 921,1 911,1 10 2,29 355,15 350 23‐7‐2014Sample 18 PIR with joint 724,5 721,8 919,2 909,9 9,3 2,20 356,29 350 23‐7‐2014Sample 13 PUR regular 739,5 737 933,3 920,2 13,1 2,00 354,32 350 23‐7‐2014Sample 14 PUR regular 737,7 735 931,7 918,7 13 2,34 352,04 350 23‐7‐2014Sample 15 PUR regular 745,9 743,4 939,5 925,4 14,1 2,54 353,51 350 23‐7‐2014Sample 16 PUR with joint 947,5 944,5 1142,3 1126,1 16,2 2,44 351,43 350 24‐7‐2014Sample 17 PUR with joint 950,1 947 1144,1 1129 15,1 2,30 355,55 350 24‐7‐2014Sample 18 PUR with joint 944,7 941,7 1138,3 1119,1 19,2 2,62 359,31 350 24‐7‐2014Sample 8 SWR regular 981 976,8 1115,4 1111,4 4 1,46 339,19 350 17‐7‐2014Sample 9 SWR regular 978,5 374,6 1111,9 1107,8 4,1 1,75 350,36 350 17‐7‐2014Sample 10 SWR regular 964,1 959,8 1096 1092,4 3,6 1,62 351,00 350 17‐7‐2014Sample 11 SWR regular 990,3 986,1 1121,2 1117,4 3,8 1,40 349,89 350 17‐7‐2014Sample 22 SWR with joint 1146 1143,9 1277,4 1272,3 5,1 1,87 354,42 350 17‐6‐2014Sample 23 SWR with joint 1157,1 1155,2 1287,6 1281,5 6,1 1,90 356,07 350 17‐7‐2014Sample 24 SWR with joint 1146,2 1144,1 1274,7 1269,9 4,8 1,58 331,23 350 17‐7‐2014Sample 25 SWR with joint 1131,6 1129,5 1258,3 1252,8 5,5 1,91 350,50 350 17‐7‐2014