Embed Size (px)
Citation preview
eIMPACTAssessing the Impacts ofIntelligent Vehicle Safety Systems
eIMPACTAssessing the Impacts ofIntelligent Vehicle Safety Systems
Contract no.: 027421
eIMPACT Socio-economic Impact Assessment
of Stand-alone and Co-operative Intelligent Vehicle Safety Systems
(IVSS) in Europe
Report type Deliverable D10 (incl. D9)Report name Final Report and Integration of
Results and Perspectives for market introduction of IVSS
Version number Version 2.0
Dissemination Level PU
Lead contractor TNO
Due date 30.06.2008
Date of preparation 11.08.2008
eIMPACT Partners Netherland’s Organization for Applied Scientific Research (TNO)
University of Cologne (UOC)
DaimlerChrysler AG (DCA)
Centro Ricerche Fiat ScpA (CRF)
BMW Forschung und Technik GmbH (BMW)
Robert Bosch GmbH (BOS)
PTV Planung Transport Verkehr AG (PTV)
Technical Research Centre of Finland (VTT)
Federal Highway Research Institute (BAS)
Dutch Ministry of Transport (RWS)
Transport Research Centre of Czech Republic (CDV)
Movea Trafikkonsult AB (MOV)
Irion Management Consulting GmbH (IMC)
eIMPACT 11.08.2008
Authors
Kerry Malone (TNO)
Isabel Wilmink (TNO)
Gerhard Noecker (DAI)
Konrad Roßrucker (BMW)
Roland Galbas (BOS)
Tom Alkim (RWS)
Project Co-ordinator
K.M. (Kerry) Malone Mobility and Logistics Business Unit of TNO Built Environment and Geosciences Email: [email protected] Phone: +31 15 269 6912 Fax: +31 15 269 6854 Visiting Address: Van Mourik Broekmanweg 6 2628 XE Delft The Netherlands Postal Address: P.O. Box 49 2600 AA Delft The Netherlands http://www.tno.nl
Copyright: eIMPACT Consortium 2008
Copyright on template: Irion Management Consulting GmbH 2008
Deliverable D10 (incl. D9) Version 2.0 ii
eIMPACT 11.08.2008
Revision and history chart
Version Date Reason
0.0 01.06.2008 Draft structure by Gerhard Noecker
0.1 03.06.2008 Revised structure to reflect removal of Exploitation Plan by Kerry Malone
0.2 06.06.2008 Revised structure and executive summary by Kerry Malone
0.3 09.06.2008 Incorporation of inputs from Gerhard, Konrad and Roland by Kerry
0.4 13.06.2008 Incorporation of executive summary of new D7 and D8; revisions to executive summary and chapter 1 based on Isabel’s suggestions; additions of executive summaries of D8 and D7 to chapters 5 and 6, respectively
0.5 15.06.2008 Revisions to all chapter based on feedback from Isabel; modification to road map chapter
0.6 16.06.2008 Deletion of annex 4 and 5; modification to road map chapter
0.7 17.06.2008 Revisions, improvements to chapters 7, 8, 9 by Kerry
0.8 18.06.2008 Review, revision and formatting by Isabel and Marina
0.9 18.06.2008 Incorporation of inputs from Isabel, revision of Chapter 6, last revisions by Kerry
1.0 18.06.2008 Revisions of authors, acknowledgements by Kerry
2.0 07.08.2008 Incorporation of revisions of other deliverables due to comments from final review
Deliverable D10 (incl. D9) Version 2.0 iii
eIMPACT 11.08.2008
Table of contents
Revision and history chart .................................................................. iii Table of contents ................................................................................ iv Executive summary .............................................................................1 1 Introduction ...................................................................................13
1.1 Background information about eIMPACT...............................13 1.2 The scope and structure of the eIMPACT project ..................14 1.3 Structure of the report ............................................................16
2 Inventory and recommendations for in-depth socio-economic impact assessment .......................................................................18
3 Safety and Traffic Impact Assessment of Intelligent Vehicle Safety Systems ........................................................................................23 3.1 Methodology ..........................................................................23 3.2 eIMPACT accident trend........................................................24 3.3 Penetration rates....................................................................25 3.4 Results ...................................................................................27
4 Cost Benefit Analysis ....................................................................32 4.1 Methodology ..........................................................................32 4.2 Results of the Cost-Benefit Analyses.....................................34
5 Stakeholder Assessment ..............................................................42 5.1 Methodology and systems approached in stakeholder
analyses.................................................................................42 5.2 Results of the stakeholder analyses ......................................46
6 Policy recommendations to promote Intelligent Vehicle Safety Systems ........................................................................................49 6.1 Approach................................................................................49 6.2 Results ...................................................................................50
7 eIMPACT and Roadmaps for IVSS (D9).......................................58 7.1 Roadmaps for IVSS with respect to the State-of-the-Art........58 7.2 Basic Conditions for IVSS Introduction ..................................59 7.3 Perspective of supplier and OEMs.........................................61 7.4 Perspective of Users..............................................................63 7.5 Perspective of public authorities ............................................64
8 Project results and achievements .................................................66 8.1 Meeting the project objectives ...............................................66 8.2 Scientific & technological quality and innovations..................66
9 Project outputs ..............................................................................68
Deliverable D10 (incl. D9) Version 2.0 iv
eIMPACT 11.08.2008
9.1 Deliverables ...........................................................................68 9.2 Workshops .............................................................................69 9.3 Dissemination ........................................................................70
9.3.1 Project website .............................................................73 9.3.2 Publishable Results ......................................................74 9.3.3 Integration with other projects.......................................74
10 Conclusions and recommendations..............................................75 10.1 Conclusions ..................................................................75 10.2 Recommendations - outlook .........................................78
Acknowledgements ...........................................................................80 References ........................................................................................81 Annex 1 Keywords ......................................................................87 Annex 2 Glossary........................................................................88 Annex 3 System specifications ...................................................91
Deliverable D10 (incl. D9) Version 2.0 v
eIMPACT 11.08.2008
Executive summary
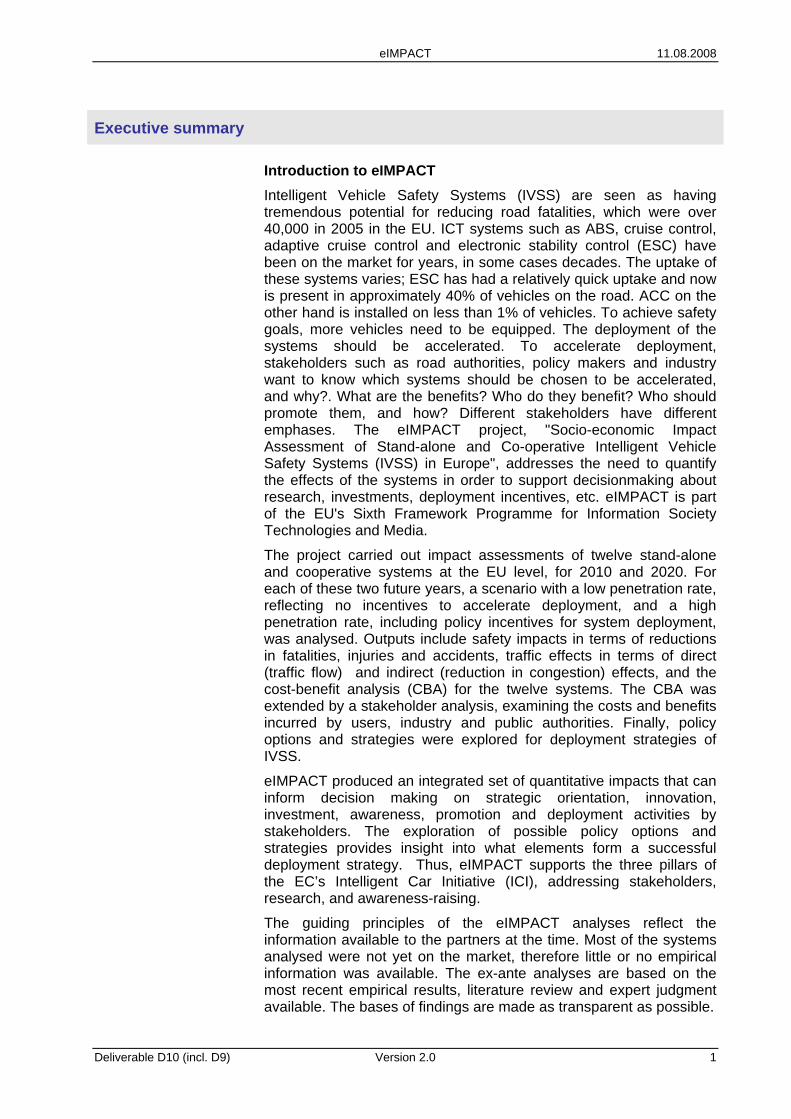
Introduction to eIMPACT Intelligent Vehicle Safety Systems (IVSS) are seen as having tremendous potential for reducing road fatalities, which were over 40,000 in 2005 in the EU. ICT systems such as ABS, cruise control, adaptive cruise control and electronic stability control (ESC) have been on the market for years, in some cases decades. The uptake of these systems varies; ESC has had a relatively quick uptake and now is present in approximately 40% of vehicles on the road. ACC on the other hand is installed on less than 1% of vehicles. To achieve safety goals, more vehicles need to be equipped. The deployment of the systems should be accelerated. To accelerate deployment, stakeholders such as road authorities, policy makers and industry want to know which systems should be chosen to be accelerated, and why?. What are the benefits? Who do they benefit? Who should promote them, and how? Different stakeholders have different emphases. The eIMPACT project, "Socio-economic Impact Assessment of Stand-alone and Co-operative Intelligent Vehicle Safety Systems (IVSS) in Europe", addresses the need to quantify the effects of the systems in order to support decisionmaking about research, investments, deployment incentives, etc. eIMPACT is part of the EU's Sixth Framework Programme for Information Society Technologies and Media.
The project carried out impact assessments of twelve stand-alone and cooperative systems at the EU level, for 2010 and 2020. For each of these two future years, a scenario with a low penetration rate, reflecting no incentives to accelerate deployment, and a high penetration rate, including policy incentives for system deployment, was analysed. Outputs include safety impacts in terms of reductions in fatalities, injuries and accidents, traffic effects in terms of direct (traffic flow) and indirect (reduction in congestion) effects, and the cost-benefit analysis (CBA) for the twelve systems. The CBA was extended by a stakeholder analysis, examining the costs and benefits incurred by users, industry and public authorities. Finally, policy options and strategies were explored for deployment strategies of IVSS.
eIMPACT produced an integrated set of quantitative impacts that can inform decision making on strategic orientation, innovation, investment, awareness, promotion and deployment activities by stakeholders. The exploration of possible policy options and strategies provides insight into what elements form a successful deployment strategy. Thus, eIMPACT supports the three pillars of the EC’s Intelligent Car Initiative (ICI), addressing stakeholders, research, and awareness-raising.
The guiding principles of the eIMPACT analyses reflect the information available to the partners at the time. Most of the systems analysed were not yet on the market, therefore little or no empirical information was available. The ex-ante analyses are based on the most recent empirical results, literature review and expert judgment available. The bases of findings are made as transparent as possible.
Deliverable D10 (incl. D9) Version 2.0 1
eIMPACT 11.08.2008
Most importantly, the results can be improved when new findings from Field Operational Tests (FOTs), driving simulators and test tracks are made available.
Systems Analysed in eIMPACT The twelve systems selected for analysis in eIMPACT reflect a three-step method, where all potentially beneficial systems were considered, the most promising systems were selected and a balanced choice was finally made. Firstly, eIMPACT developed an overview of the potential systems to be considered, based on the findings of EU projects. Secondly, the systems were ranked in a workshop with stakeholders, external experts and representatives of EU research projects on IVSS, using a multi-criteria assessment. The third and final step made use of the portfolio method to reduce the number of systems. In the portfolio method, eIMPACT chose a set of systems such that the set of systems:
• covers a range of time-to-market (present – 2020);
• covers both stand-alone and cooperative systems;
• covers systems addressing different types of functionality (longitudinal, lateral, etc.);
• reflects the ranking from the workshop;
• chooses the highest ranking systems meeting all of the criteria above.
The following twelve systems met the criteria above (in brackets: the 3-letter abbreviation used in tables and figures throughout this report):
1. Electronic Stability Control (ESC)
2. Full Speed Range ACC (FSR)
3. Emergency Braking (EBR)
4. Pre-Crash Protection of Vulnerable Road Users (PCV)
5. Lane Change Assistant (Warning) (LCA)
6. Lane Keeping Support (LKS)
7. NightVisionWarn (NIW)
8. Driver Drowsiness Monitoring and Warning (DDM)
9. eCall (one-way communication) (ECA)
10. Intersection Safety (INS)
11. Wireless Local Danger Warning (WLD)
12. SpeedAlert (SPE)
The Deliverable, “Stand-alone and co-operative Intelligent Vehicle Safety Systems – Inventory and recommendations for in-depth socio-economic impact assessment,” (D2, [Vollmer et al., 2006]) documents the selection process.
Deliverable D10 (incl. D9) Version 2.0 2
eIMPACT 11.08.2008
Main results eIMPACT produced two types of results. Firstly, eIMPACT developed and applied a complete, exhaustive and integrated methodology for impact assessment, cost-benefit analysis, stakeholder analysis, and policy deployment strategies. Secondly, eIMPACT produced quantitative results for impact assessment, benefit-cost ratios and stakeholder analyses.
Methodologies The integrated approach used engineering, demographical, economic, psychological and behavioral views in the analyses.
With respect to the individual analytical approaches:
• The safety impact analysis made use of nine mechanisms to address all possible effects of IVSS. The mechanisms cover exposure, crash risk and consequences, including intended and unintended impacts and “positive” and “negative” impacts. After choosing a main factor out of a possible 6 from the accident data, such as collision type, junction, weather conditions, this information was combined with the frequency of target conditions in the accident data, and applied to the eIMPACT accident trend data for 2010 and 2020 to produce quantified estimates of the reductions in the number of accidents, fatalities and injuries.
• The traffic impact analysis took into account both the direct effects, e.g., changes in speeds and headways, and indirect traffic effects in terms of reduced congestion due to avoided accidents with fatalities and injuries.
• The socio-economic impact assessment is a comprehensive framework which integrated the assessment framework to show the profitability of the IVSS on a societal level.
• The stakeholder analysis extended the results of the cost-benefit analysis by exploring a wider socio-economic perspective on key interest groups: system users, OEMs and suppliers, the insurance industry and public authorities.
• The policy analysis identified the key elements for a successful market introduction. It also developed a methodology for support policy development for accelerated market introduction.
These methodologies were developed and applied to systems not yet on the market. The project demonstrated the usefulness of the approach itself, as well as the potential value of the systems not yet on the market.
Deliverable D10 (incl. D9) Version 2.0 3
eIMPACT 11.08.2008
Results eIMPACT applied the methodologies to produce quantitative results for the safety and traffic impacts and costs and benefits of twelve IVSS for the EU for 2010 and 2020. For this, an estimate of the accident trend for the years 2010 and 2020, as well as the estimation of penetration rates of systems for these years had to be made.
Accident trend No up-to-date forecast of the safety performance (accidents/ casualties) for 2010 and 2020 was available for the EU-25. Consequently, the project produced its own road safety forecast.
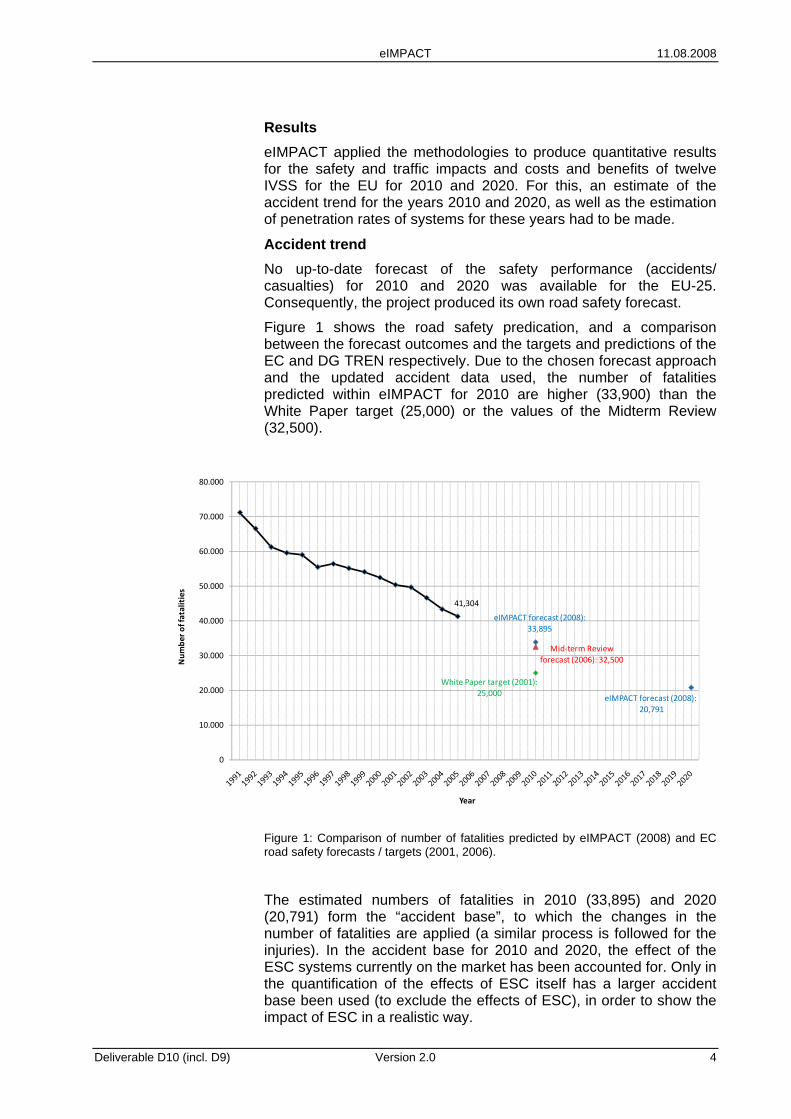
Figure 1 shows the road safety predication, and a comparison between the forecast outcomes and the targets and predictions of the EC and DG TREN respectively. Due to the chosen forecast approach and the updated accident data used, the number of fatalities predicted within eIMPACT for 2010 are higher (33,900) than the White Paper target (25,000) or the values of the Midterm Review (32,500).
41,304
eIMPACT forecast (2008):33,895
eIMPACT forecast (2008):20,791
Mid‐term Reviewforecast (2006): 32,500
White Paper target (2001):25,000
0
10.000
20.000
30.000
40.000
50.000
60.000
70.000
80.000
Num
ber o
f fatalities
Year
Figure 1: Comparison of number of fatalities predicted by eIMPACT (2008) and EC road safety forecasts / targets (2001, 2006).
The estimated numbers of fatalities in 2010 (33,895) and 2020 (20,791) form the “accident base”, to which the changes in the number of fatalities are applied (a similar process is followed for the injuries). In the accident base for 2010 and 2020, the effect of the ESC systems currently on the market has been accounted for. Only in the quantification of the effects of ESC itself has a larger accident base been used (to exclude the effects of ESC), in order to show the impact of ESC in a realistic way.
Deliverable D10 (incl. D9) Version 2.0 4
eIMPACT 11.08.2008
Scenarios & Penetration rates The safety and traffic impacts and benefit-cost ratios (BCRs) of IVSS are related the number of kilometers driven with equipped vehicles on equipped roads. For this reason, eIMPACT undertook a three-step process to determine the number of equipped kilometers that were driven in 2010 and 2020.
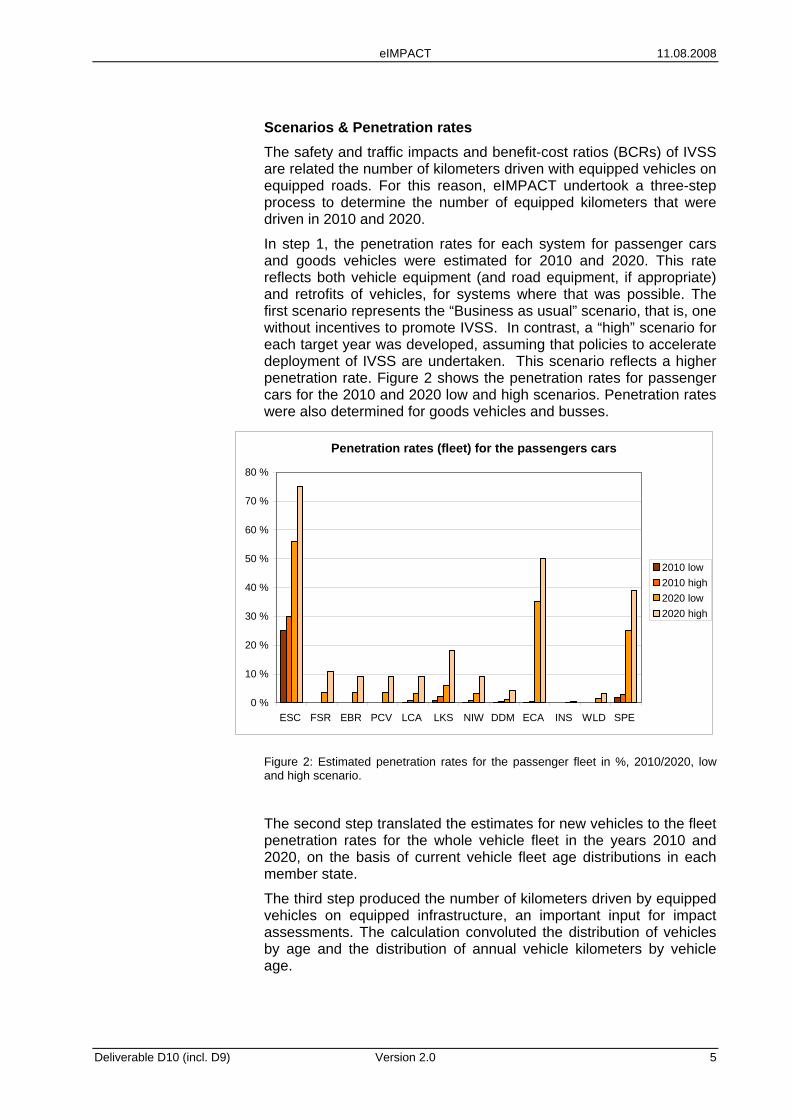
In step 1, the penetration rates for each system for passenger cars and goods vehicles were estimated for 2010 and 2020. This rate reflects both vehicle equipment (and road equipment, if appropriate) and retrofits of vehicles, for systems where that was possible. The first scenario represents the “Business as usual” scenario, that is, one without incentives to promote IVSS. In contrast, a “high” scenario for each target year was developed, assuming that policies to accelerate deployment of IVSS are undertaken. This scenario reflects a higher penetration rate. Figure 2 shows the penetration rates for passenger cars for the 2010 and 2020 low and high scenarios. Penetration rates were also determined for goods vehicles and busses.
Penetration rates (fleet) for the passengers cars
0 %
10 %
20 %
30 %
40 %
50 %
60 %
70 %
80 %
ESC FSR EBR PCV LCA LKS NIW DDM ECA INS WLD SPE
2010 low2010 high2020 low2020 high
Figure 2: Estimated penetration rates for the passenger fleet in %, 2010/2020, low and high scenario.
The second step translated the estimates for new vehicles to the fleet penetration rates for the whole vehicle fleet in the years 2010 and 2020, on the basis of current vehicle fleet age distributions in each member state.
The third step produced the number of kilometers driven by equipped vehicles on equipped infrastructure, an important input for impact assessments. The calculation convoluted the distribution of vehicles by age and the distribution of annual vehicle kilometers by vehicle age.
Deliverable D10 (incl. D9) Version 2.0 5
eIMPACT 11.08.2008
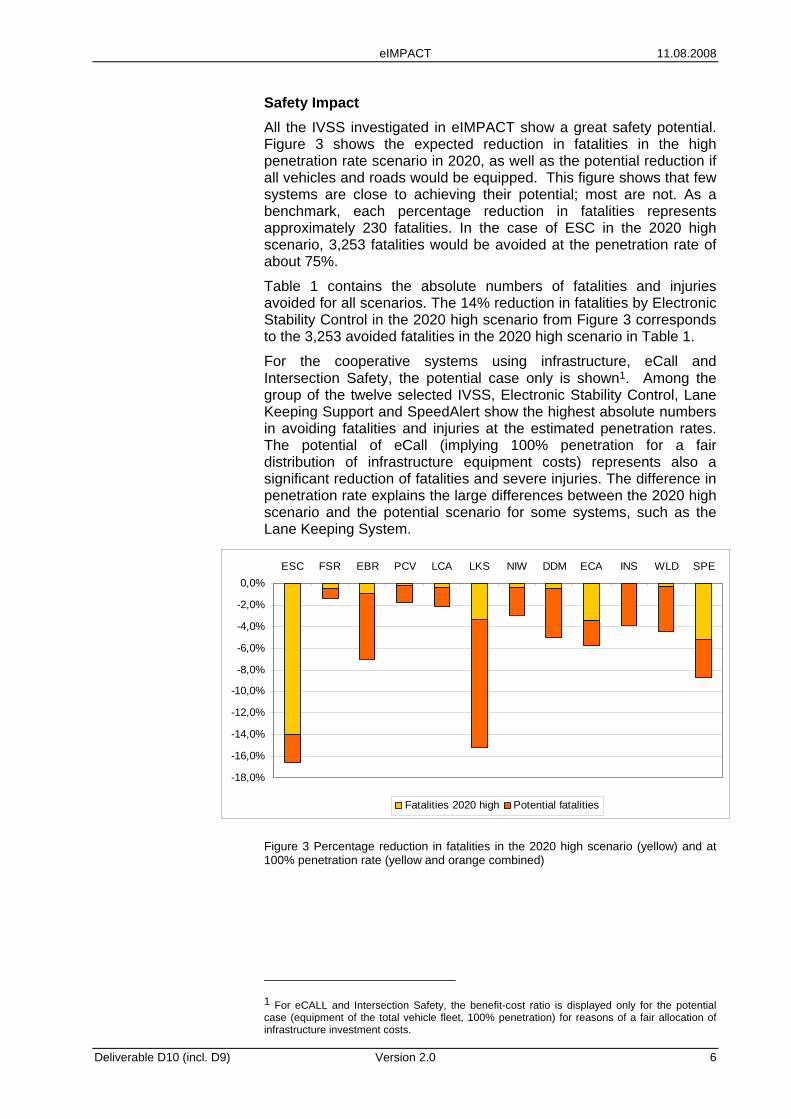
Safety Impact All the IVSS investigated in eIMPACT show a great safety potential. Figure 3 shows the expected reduction in fatalities in the high penetration rate scenario in 2020, as well as the potential reduction if all vehicles and roads would be equipped. This figure shows that few systems are close to achieving their potential; most are not. As a benchmark, each percentage reduction in fatalities represents approximately 230 fatalities. In the case of ESC in the 2020 high scenario, 3,253 fatalities would be avoided at the penetration rate of about 75%.
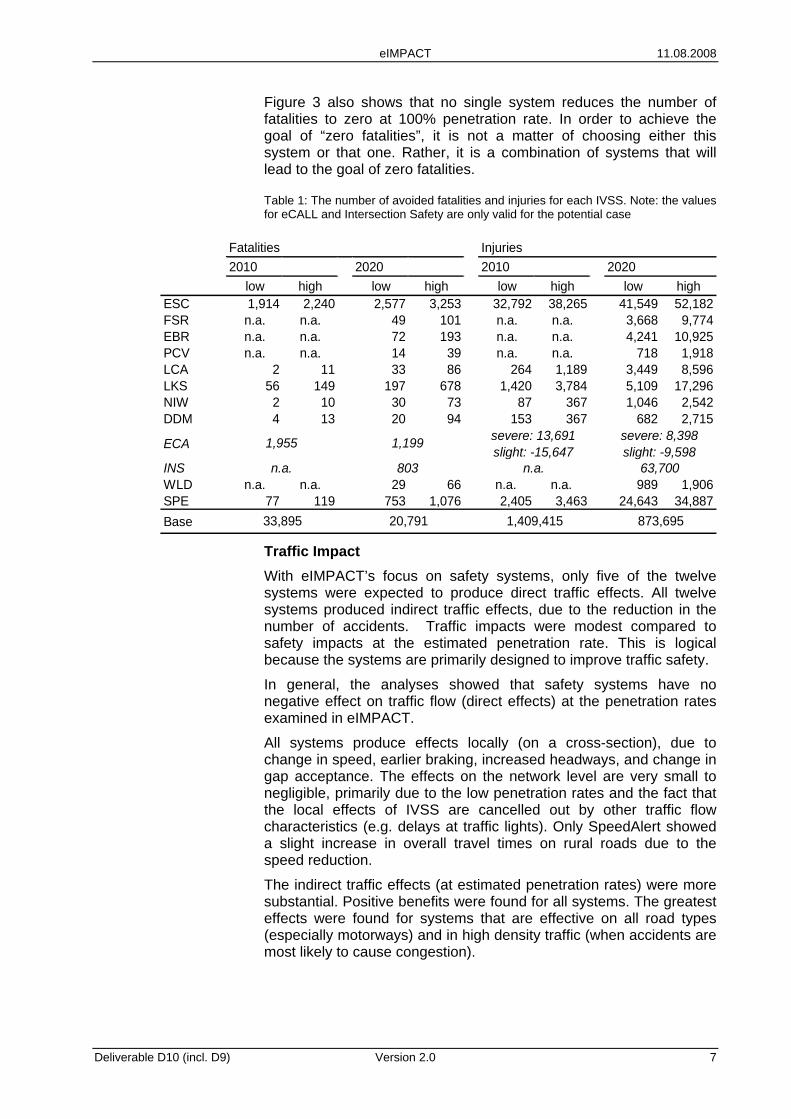
Table 1 contains the absolute numbers of fatalities and injuries avoided for all scenarios. The 14% reduction in fatalities by Electronic Stability Control in the 2020 high scenario from Figure 3 corresponds to the 3,253 avoided fatalities in the 2020 high scenario in Table 1.
For the cooperative systems using infrastructure, eCall and Intersection Safety, the potential case only is shown1. Among the group of the twelve selected IVSS, Electronic Stability Control, Lane Keeping Support and SpeedAlert show the highest absolute numbers in avoiding fatalities and injuries at the estimated penetration rates. The potential of eCall (implying 100% penetration for a fair distribution of infrastructure equipment costs) represents also a significant reduction of fatalities and severe injuries. The difference in penetration rate explains the large differences between the 2020 high scenario and the potential scenario for some systems, such as the Lane Keeping System.
-18,0%
-16,0%
-14,0%
-12,0%
-10,0%
-8,0%
-6,0%
-4,0%
-2,0%
0,0%ESC FSR EBR PCV LCA LKS NIW DDM ECA INS WLD SPE
Fatalities 2020 high Potential fatalities
Figure 3 Percentage reduction in fatalities in the 2020 high scenario (yellow) and at 100% penetration rate (yellow and orange combined)
1 For eCALL and Intersection Safety, the benefit-cost ratio is displayed only for the potential case (equipment of the total vehicle fleet, 100% penetration) for reasons of a fair allocation of infrastructure investment costs.
Deliverable D10 (incl. D9) Version 2.0 6
eIMPACT 11.08.2008
Figure 3 also shows that no single system reduces the number of fatalities to zero at 100% penetration rate. In order to achieve the goal of “zero fatalities”, it is not a matter of choosing either this system or that one. Rather, it is a combination of systems that will lead to the goal of zero fatalities.
Table 1: The number of avoided fatalities and injuries for each IVSS. Note: the values for eCALL and Intersection Safety are only valid for the potential case
Fatalities Injuries2010 2020 2010 2020
low high low high low high low highESC 1,914 2,240 2,577 3,253 32,792 38,265 41,549 52,182FSR n.a. n.a. 49 101 n.a. n.a. 3,668 9,774EBR n.a. n.a. 72 193 n.a. n.a. 4,241 10,925PCV n.a. n.a. 14 39 n.a. n.a. 718 1,918LCA 2 11 33 86 264 1,189 3,449 8,596LKS 56 149 197 678 1,420 3,784 5,109 17,296NIW 2 10 30 73 87 367 1,046 2,542DDM 4 13 20 94 153 367 682 2,715
ECA
INSWLD n.a. n.a. 29 66 n.a. n.a. 989 1,906SPE 77 119 753 1,076 2,405 3,463 24,643 34,887Base 33,895 20,791 1,409,415 873,695
severe: 8,398slight: -9,598
63,700
1,955
n.a.
1,199
803
severe: 13,691slight: -15,647
n.a.
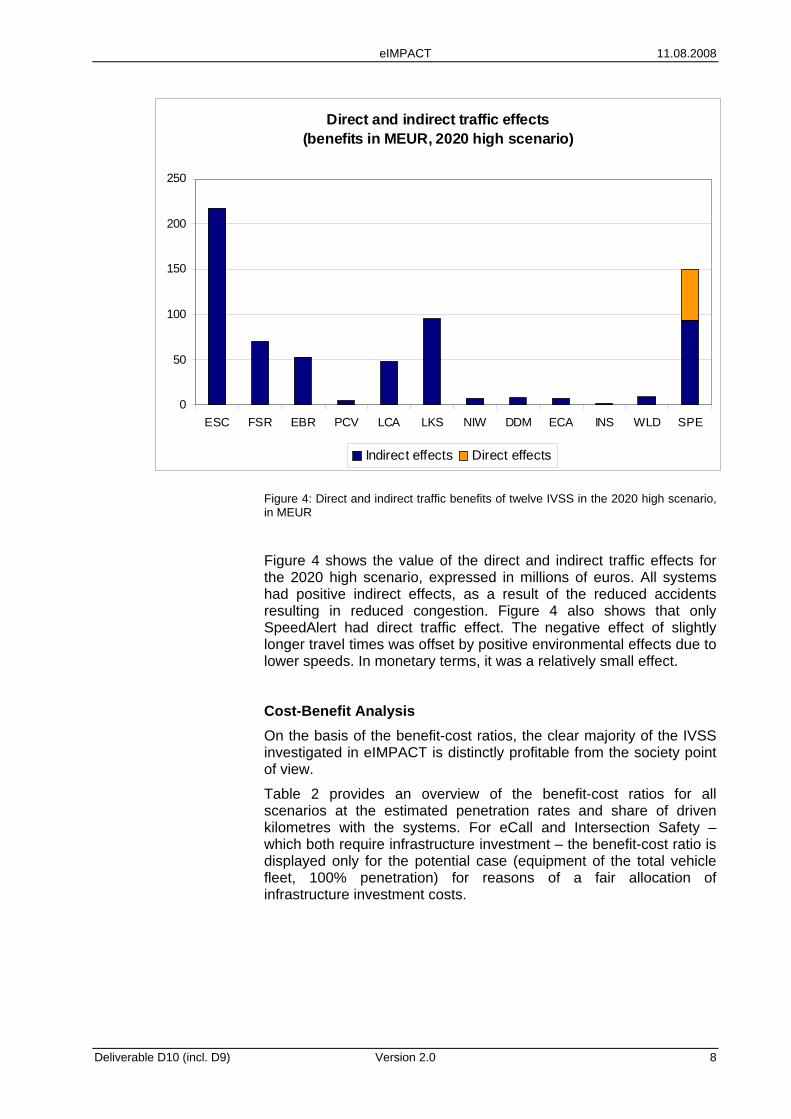
Traffic Impact With eIMPACT’s focus on safety systems, only five of the twelve systems were expected to produce direct traffic effects. All twelve systems produced indirect traffic effects, due to the reduction in the number of accidents. Traffic impacts were modest compared to safety impacts at the estimated penetration rate. This is logical because the systems are primarily designed to improve traffic safety.
In general, the analyses showed that safety systems have no negative effect on traffic flow (direct effects) at the penetration rates examined in eIMPACT.
All systems produce effects locally (on a cross-section), due to change in speed, earlier braking, increased headways, and change in gap acceptance. The effects on the network level are very small to negligible, primarily due to the low penetration rates and the fact that the local effects of IVSS are cancelled out by other traffic flow characteristics (e.g. delays at traffic lights). Only SpeedAlert showed a slight increase in overall travel times on rural roads due to the speed reduction.
The indirect traffic effects (at estimated penetration rates) were more substantial. Positive benefits were found for all systems. The greatest effects were found for systems that are effective on all road types (especially motorways) and in high density traffic (when accidents are most likely to cause congestion).
Deliverable D10 (incl. D9) Version 2.0 7
eIMPACT 11.08.2008
Direct and indirect traffic effects(benefits in MEUR, 2020 high scenario)
0
50
100
150
200
250
ESC FSR EBR PCV LCA LKS NIW DDM ECA INS WLD SPE
Indirect effects Direct effects
Figure 4: Direct and indirect traffic benefits of twelve IVSS in the 2020 high scenario, in MEUR
Figure 4 shows the value of the direct and indirect traffic effects for the 2020 high scenario, expressed in millions of euros. All systems had positive indirect effects, as a result of the reduced accidents resulting in reduced congestion. Figure 4 also shows that only SpeedAlert had direct traffic effect. The negative effect of slightly longer travel times was offset by positive environmental effects due to lower speeds. In monetary terms, it was a relatively small effect.
Cost-Benefit Analysis On the basis of the benefit-cost ratios, the clear majority of the IVSS investigated in eIMPACT is distinctly profitable from the society point of view.
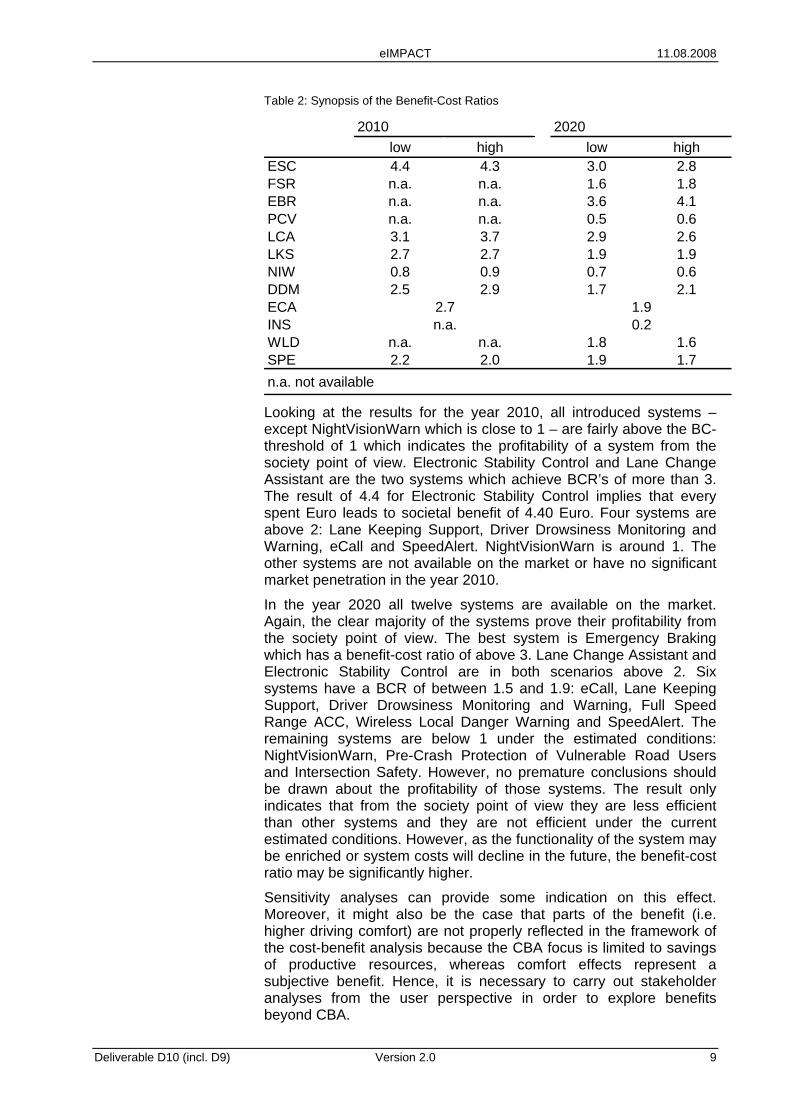
Table 2 provides an overview of the benefit-cost ratios for all scenarios at the estimated penetration rates and share of driven kilometres with the systems. For eCall and Intersection Safety – which both require infrastructure investment – the benefit-cost ratio is displayed only for the potential case (equipment of the total vehicle fleet, 100% penetration) for reasons of a fair allocation of infrastructure investment costs.
Deliverable D10 (incl. D9) Version 2.0 8
eIMPACT 11.08.2008
Table 2: Synopsis of the Benefit-Cost Ratios
2010 2020low high low high
ESC 4.4 4.3 3.0 2.8FSR n.a. n.a. 1.6 1.8EBR n.a. n.a. 3.6 4.1PCV n.a. n.a. 0.5 0.6LCA 3.1 3.7 2.9 2.6LKS 2.7 2.7 1.9 1.9NIW 0.8 0.9 0.7 0.6DDM 2.5 2.9 1.7 2.1ECAINSWLD n.a. n.a. 1.8 1.6SPE 2.2 2.0 1.9 1.7n.a. not available
0.22.7 1.9n.a.
Looking at the results for the year 2010, all introduced systems – except NightVisionWarn which is close to 1 – are fairly above the BC-threshold of 1 which indicates the profitability of a system from the society point of view. Electronic Stability Control and Lane Change Assistant are the two systems which achieve BCR’s of more than 3. The result of 4.4 for Electronic Stability Control implies that every spent Euro leads to societal benefit of 4.40 Euro. Four systems are above 2: Lane Keeping Support, Driver Drowsiness Monitoring and Warning, eCall and SpeedAlert. NightVisionWarn is around 1. The other systems are not available on the market or have no significant market penetration in the year 2010.
In the year 2020 all twelve systems are available on the market. Again, the clear majority of the systems prove their profitability from the society point of view. The best system is Emergency Braking which has a benefit-cost ratio of above 3. Lane Change Assistant and Electronic Stability Control are in both scenarios above 2. Six systems have a BCR of between 1.5 and 1.9: eCall, Lane Keeping Support, Driver Drowsiness Monitoring and Warning, Full Speed Range ACC, Wireless Local Danger Warning and SpeedAlert. The remaining systems are below 1 under the estimated conditions: NightVisionWarn, Pre-Crash Protection of Vulnerable Road Users and Intersection Safety. However, no premature conclusions should be drawn about the profitability of those systems. The result only indicates that from the society point of view they are less efficient than other systems and they are not efficient under the current estimated conditions. However, as the functionality of the system may be enriched or system costs will decline in the future, the benefit-cost ratio may be significantly higher.
Sensitivity analyses can provide some indication on this effect. Moreover, it might also be the case that parts of the benefit (i.e. higher driving comfort) are not properly reflected in the framework of the cost-benefit analysis because the CBA focus is limited to savings of productive resources, whereas comfort effects represent a subjective benefit. Hence, it is necessary to carry out stakeholder analyses from the user perspective in order to explore benefits beyond CBA.
Deliverable D10 (incl. D9) Version 2.0 9
eIMPACT 11.08.2008
Stakeholder Analysis Break-even analyses and the assessment of wider economic effects were used in the stakeholder analysis.
The break-even analyses for system users reveal that the pay-off period of investing in IVSS depends largely on the kilometers driven per year. Since frequent drivers are more exposed to safety risks, systems which avoid driving conflicts or mitigate the consequences are more attractive to them. At least for the 2020 high scenario, all systems reach the break-even point within the average vehicle lifetime which is assumed to 12 years throughout the eIMPACT project.
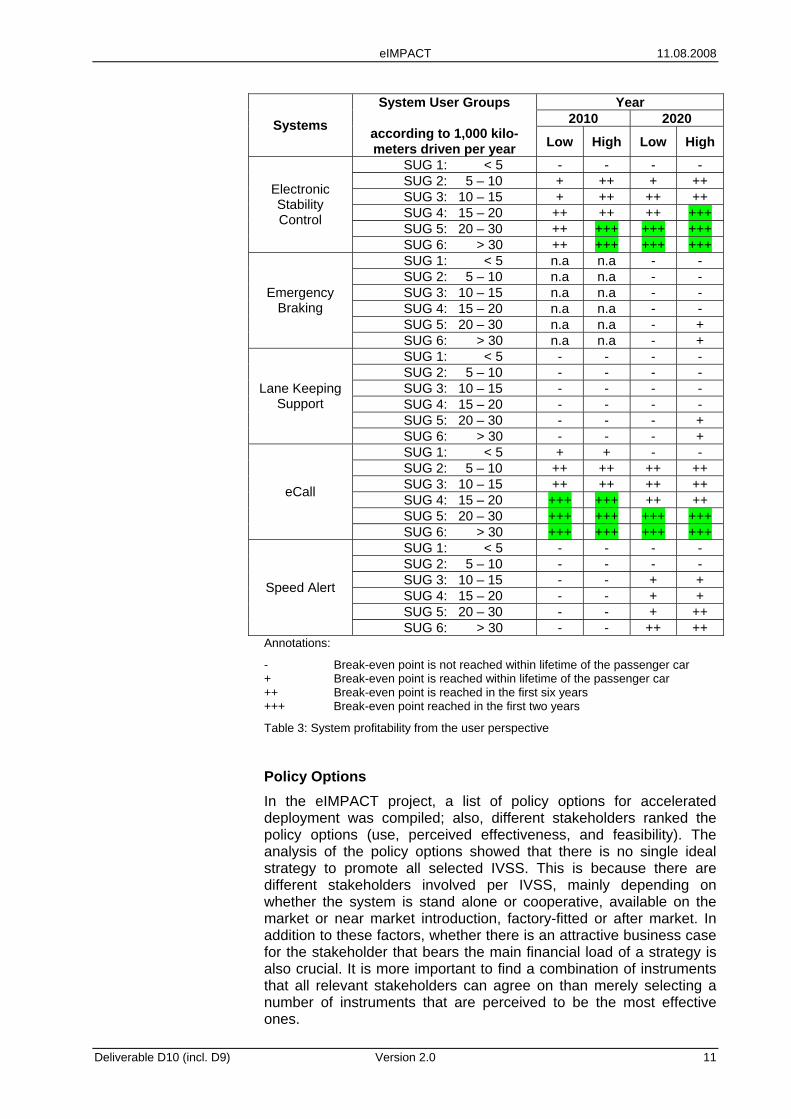
The comparison between IVSS shows that mature systems and systems with rather low market prices (e.g. Electronic Stability Control, eCall) perform better in the break-even analysis than other systems. This is illustrated in Table 3 by the scale ranging from ‘+++’ (indicating that the break-even point is reached within two years after registration) to ‘-‘ (indicating that the break-even point is not reached within twelve years).
The assessment of wider economic impacts (employment, fiscal, and income distribution effects) leads to the following main results:
• The production of Electronic Stability Control represents a considerable employment factor in the national and the European economy. In the year 2010, about 3 million new vehicles will be ESC-equipped in Germany. This corresponds to a sales volume of about 1 bn EUR and a production value (direct and indirect production) of about 2 bn EUR. The direct and indirect effects on employment that result from production and implementation of ESC in the year 2010 amount to about 10,000 employees. As scenarios were also considered here, the range is between 8,800 (scenario low) and 10,500 (scenario high) employees. Scaling up the results to the EU-25 (target year 2010) this would imply employment effects between 27,000 (scenario low) and 40,000 (scenario high) employees.
• The fiscal revenues from the market penetration of Electronic Stability Control and Emergency Braking – which were calculated for the year 2020 – amount to a range between 131 million EUR (scenario low) and 179 million EUR (scenario high). A comparable calculation on European level would end up with a range between 662 million EUR (scenario low) and about 1,026 million EUR (scenario high).
• Concerning income distribution no clear picture of effects can be found. However, it can be shown that especially households with more than one person and an average income receive higher shares of the benefit than they bear through the costs of IVSS.
Deliverable D10 (incl. D9) Version 2.0 10
eIMPACT 11.08.2008
Year 2010 2020 Systems
System User Groups
according to 1,000 kilo-meters driven per year Low High Low High
SUG 1: < 5 - - - - SUG 2: 5 – 10 + ++ + ++ SUG 3: 10 – 15 + ++ ++ ++ SUG 4: 15 – 20 ++ ++ ++ +++ SUG 5: 20 – 30 ++ +++ +++ +++
Electronic Stability Control
SUG 6: > 30 ++ +++ +++ +++ SUG 1: < 5 n.a n.a - - SUG 2: 5 – 10 n.a n.a - - SUG 3: 10 – 15 n.a n.a - - SUG 4: 15 – 20 n.a n.a - - SUG 5: 20 – 30 n.a n.a - +
Emergency Braking
SUG 6: > 30 n.a n.a - + SUG 1: < 5 - - - - SUG 2: 5 – 10 - - - - SUG 3: 10 – 15 - - - - SUG 4: 15 – 20 - - - - SUG 5: 20 – 30 - - - +
Lane Keeping Support
SUG 6: > 30 - - - + SUG 1: < 5 + + - - SUG 2: 5 – 10 ++ ++ ++ ++ SUG 3: 10 – 15 ++ ++ ++ ++ SUG 4: 15 – 20 +++ +++ ++ ++ SUG 5: 20 – 30 +++ +++ +++ +++
eCall
SUG 6: > 30 +++ +++ +++ +++ SUG 1: < 5 - - - - SUG 2: 5 – 10 - - - - SUG 3: 10 – 15 - - + + SUG 4: 15 – 20 - - + + SUG 5: 20 – 30 - - + ++
Speed Alert
SUG 6: > 30 - - ++ ++ Annotations:
- Break-even point is not reached within lifetime of the passenger car + Break-even point is reached within lifetime of the passenger car ++ Break-even point is reached in the first six years +++ Break-even point reached in the first two years
Table 3: System profitability from the user perspective
Policy Options In the eIMPACT project, a list of policy options for accelerated deployment was compiled; also, different stakeholders ranked the policy options (use, perceived effectiveness, and feasibility). The analysis of the policy options showed that there is no single ideal strategy to promote all selected IVSS. This is because there are different stakeholders involved per IVSS, mainly depending on whether the system is stand alone or cooperative, available on the market or near market introduction, factory-fitted or after market. In addition to these factors, whether there is an attractive business case for the stakeholder that bears the main financial load of a strategy is also crucial. It is more important to find a combination of instruments that all relevant stakeholders can agree on than merely selecting a number of instruments that are perceived to be the most effective ones.
Deliverable D10 (incl. D9) Version 2.0 11
eIMPACT 11.08.2008
Recommendations to progress towards a strategy to promote IVSS from the key elements that have been identified are:
• Do not try to create a uniform strategy to promote IVSS.
• Focus on a jointly agreed upon bundle of instruments to be used by all relevant stakeholders for a specific system.
• Round table discussions for stakeholders should take place on a regular basis.
• The methodology described and applied in eIMPACT can serve as a basis, to acquire empirical data regarding evaluation parameters from a stakeholder specific perspective, for the round table discussions.
• One organization or stakeholder should take the lead in organizing this process. A possible organization could be eSAFETY.
Conclusions and Recommendations eIMPACT has contributed valuable knowledge about the types and magnitude of the benefits for twelve IVSS.
eIMPACT developed complete, exhaustive and integrated methodologies for socio-economic impact assessment, exploration of policy options, and extension of the CBA to stakeholder analysis. There were applied successfully in the project to produce an integrated impact assessment of twelve IVSS. The approach can be used in the future to assess other stand-alone and cooperative IVSS as well as other ICT systems. The methodologies can be applied to safety systems as well as systems that may have other primary effects.
New information available in the future can be used to improve the estimates provided by eIMPACT. For example, Field Operational Tests in Europe, Japan and the US can provide valuable empirical data about driver behavior, attitudes, risk, exposure willingness to pay and cost data needed for evidence, improved assessments and systems. Such information can be used to improve the impact assessments of systems such as those addressed by eIMPACT.
Furthermore, the eIMPACT accident trend forms an important input to the safety impact assessment and the CBA. Improved accident forecasts can also produce more accurate safety impact estimates and CBA. Future accident trend forecasts can be improved by continued efforts toward a unified EU general accident database in which definitions (e.g. injuries, road types, etc) are harmonized across the EU. These continued efforts should begin to take into account the potentials of new safety systems in the road safety prognoses.
Note: The assumptions on which the penetration rates and impact assessments were based were obtained from state-of-the-art sources, whether that be literature or discussion with experts. The results presented in the eIMPACT deliverables reflect the knowledge of the partners in the eIMPACT consortium.
Deliverable D10 (incl. D9) Version 2.0 12
eIMPACT 11.08.2008
1 Introduction
1.1 Background information about eIMPACT Intelligent Vehicle Safety Systems (IVSS) are seen as having tremendous potential for reducing road fatalities, which were over 40,000 in 2005 in the EU. ICT systems such as ABS, cruise control, adaptive cruise control and electronic stability control (ESC) have been on the market for years, in some cases decades. The uptake of these systems varies; ESC has had a relatively quick uptake and now is present in approximately 40% of vehicles on the road. ACC on the other hand is installed on less than 1% of vehicles. To achieve safety goals, more vehicles need to be equipped. The deployment of the systems should be accelerated. To accelerate deployment, stakeholders such as road authorities, policy makers and industry want to know which systems should be chosen to be accelerated, and why? What are the benefits? Who do they benefit? Who should promote them, and how? Different stakeholders have different emphases. The eIMPACT project, "Socio-economic Impact Assessment of Stand-alone and Co-operative Intelligent Vehicle Safety Systems (IVSS) in Europe", addresses the need to quantify the effects of the systems in order to support decision making about research, investments, deployment incentives, etc. eIMPACT is part of the EU's Sixth Framework Programme for Information Society Technologies and Media.
The project carried out impact assessments of twelve stand-alone and cooperative systems at the EU level, for 2010 and 2020. For each of these two future years, a scenario with a low penetration rate, reflecting no incentives to accelerate deployment, and a high penetration rate, including policy incentives for system deployment, was analysed. Outputs include safety impacts in terms of reductions in fatalities, injuries and accidents, traffic effects in terms of direct (traffic flow) and indirect (reduction in congestion) effects, and the cost-benefit analysis (CBA) for the twelve systems. The CBA was extended by a stakeholder analysis, examining the costs and benefits incurred by users, industry and public authorities. Finally, policy options and strategies were explored for deployment strategies of IVSS.
eIMPACT produced an integrated set of quantitative impacts that can inform decision making on strategic orientation, innovation, investment, awareness, promotion and deployment activities by stakeholders. The exploration of possible policy options and strategies provides insight into what elements form a successful deployment strategy. Thus, eIMPACT supports the three pillars of the EC’s Intelligent Car Initiative (ICI), addressing stakeholders, research, and awareness-raising.
The guiding principles of the eIMPACT analyses reflect the information available to the partners at the time. Most of the systems analysed were not yet on the market, therefore little or no empirical information was available. The ex-ante analyses are based on the most recent empirical results, literature review and expert judgment available. The bases of findings are made as transparent as possible.
Deliverable D10 (incl. D9) Version 2.0 13
eIMPACT 11.08.2008
Most importantly, the results can be improved when new findings from Field Operational Tests (FOTs), driving simulators and test tracks are made available.
The consortium consists of 13 partners, representing Original Equipment Manufacturers (OEM’s) and suppliers, public authorities, research institutes and universities, covering both the older and newer EU states, and bringing the required perspectives into the project.
The assumptions on which the penetration rates and impact assessments were based were obtained from state-of-the-art sources, whether that be literature or discussion with experts. The results presented in the eIMPACT deliverables reflect the knowledge of the partners in the eIMPACT consortium.
1.2 The scope and structure of the eIMPACT project The main objectives of eIMPACT are:
• To carry out a socio-economic impact assessment of IVSS, based on a description of relevant IVSS, and their expected impacts on traffic safety and efficiency.
• To provide perspectives on the market introduction of IVSS, integrating the input from the impact analysis, policy options and stakeholder roles.
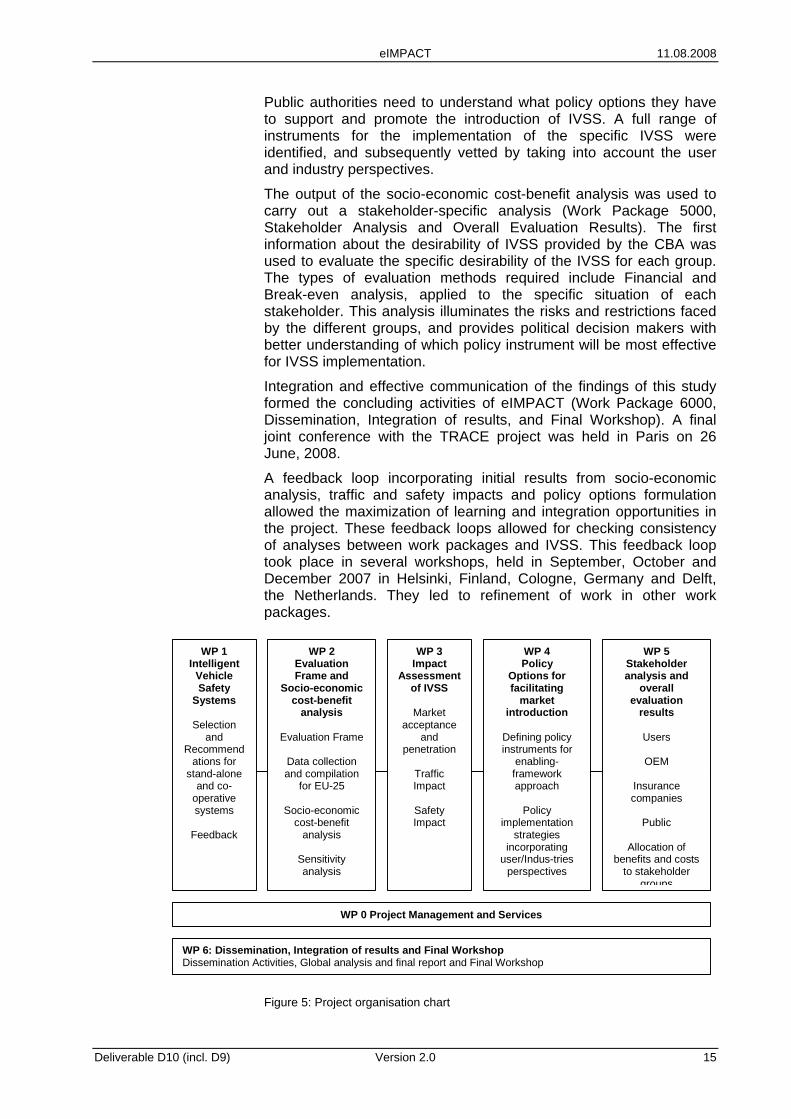
Figure 5 shows the work packages in eIMPACT. We briefly introduce them below.
Input to the assessment included the identification and selection of the most promising stand-alone and co-operative IVSS technologies for in-depth socio-economic assessment (Work Package 1000, Intelligent Vehicle Safety Systems). Systems are in various stages of development. Some are close to or already on the market, while others are in the testing and research and development stages. Considerations of the time frame, up to the year 2020, guided the choice of systems for in-depth socio-economic impact assessment in eIMPACT. The choice provided direct input for the socio-economic analysis, the development of market penetration and acceptance scenarios, traffic and safety impact assessment and the identification of enabling policy options for IVSS implementation.
Input to the socio-economic impact (Work Package 2000, Evaluation Frame and Socio-economic cost-benefit analysis) also included scenarios describing the penetration and acceptance of IVSS for the years 2010 and 2020, and the assessment of the traffic and safety impacts of the IVSS in these scenarios. Advanced micro-simulation traffic models were applied in order to estimate the effects of IVSS on traffic. Indicators for travel time, safety and emissions were quantified to answer these questions (Work Package 3000, Impact Assessment of Intelligent Vehicle Safety Systems). The safety impacts of the IVSS were estimated, making use of the general accident data provided by the Accident Causation Analysis STREP TRACE.
Identification of policy options available for enabling the implementation of IVSS formed an important part of eIMPACT (Work Package 4000, Policy Options for Facilitating Market Introduction).
Deliverable D10 (incl. D9) Version 2.0 14
eIMPACT 11.08.2008
Public authorities need to understand what policy options they have to support and promote the introduction of IVSS. A full range of instruments for the implementation of the specific IVSS were identified, and subsequently vetted by taking into account the user and industry perspectives.
The output of the socio-economic cost-benefit analysis was used to carry out a stakeholder-specific analysis (Work Package 5000, Stakeholder Analysis and Overall Evaluation Results). The first information about the desirability of IVSS provided by the CBA was used to evaluate the specific desirability of the IVSS for each group. The types of evaluation methods required include Financial and Break-even analysis, applied to the specific situation of each stakeholder. This analysis illuminates the risks and restrictions faced by the different groups, and provides political decision makers with better understanding of which policy instrument will be most effective for IVSS implementation.
Integration and effective communication of the findings of this study formed the concluding activities of eIMPACT (Work Package 6000, Dissemination, Integration of results, and Final Workshop). A final joint conference with the TRACE project was held in Paris on 26 June, 2008.
A feedback loop incorporating initial results from socio-economic analysis, traffic and safety impacts and policy options formulation allowed the maximization of learning and integration opportunities in the project. These feedback loops allowed for checking consistency of analyses between work packages and IVSS. This feedback loop took place in several workshops, held in September, October and December 2007 in Helsinki, Finland, Cologne, Germany and Delft, the Netherlands. They led to refinement of work in other work packages.
WP 0 Project Management and Services
WP 1 Intelligent
Vehicle Safety
Systems
Selection and
Recommendations for
stand-alone and co-
operative systems
Feedback
WP 2 Evaluation Frame and
Socio-economic cost-benefit
analysis
Evaluation Frame
Data collection and compilation
for EU-25
Socio-economic cost-benefit
analysis
Sensitivity analysis
WP 5 Stakeholder analysis and
overall evaluation
results
Users
OEM
Insurance companies
Public
Allocation of
benefits and costs to stakeholder
groups
WP 3Impact
Assessment of IVSS
Market
acceptance and
penetration
Traffic Impact
Safety Impact
WP 4 Policy
Options for facilitating
market introduction
Defining policy instruments for
enabling-framework approach
Policy
implementation strategies
incorporating user/Indus-tries
perspectives
WP 6: Dissemination, Integration of results and Final WorkshopDissemination Activities, Global analysis and final report and Final Workshop
Figure 5: Project organisation chart
Deliverable D10 (incl. D9) Version 2.0 15
eIMPACT 11.08.2008
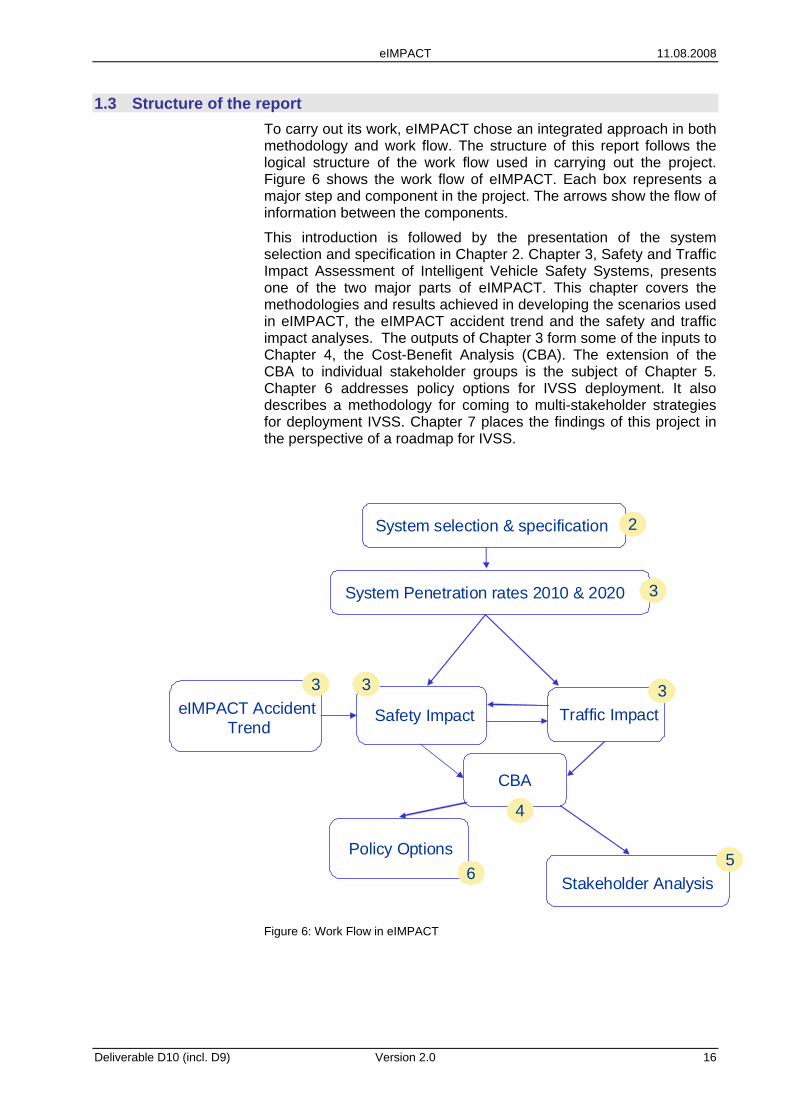
1.3 Structure of the report To carry out its work, eIMPACT chose an integrated approach in both methodology and work flow. The structure of this report follows the logical structure of the work flow used in carrying out the project. Figure 6 shows the work flow of eIMPACT. Each box represents a major step and component in the project. The arrows show the flow of information between the components.
This introduction is followed by the presentation of the system selection and specification in Chapter 2. Chapter 3, Safety and Traffic Impact Assessment of Intelligent Vehicle Safety Systems, presents one of the two major parts of eIMPACT. This chapter covers the methodologies and results achieved in developing the scenarios used in eIMPACT, the eIMPACT accident trend and the safety and traffic impact analyses. The outputs of Chapter 3 form some of the inputs to Chapter 4, the Cost-Benefit Analysis (CBA). The extension of the CBA to individual stakeholder groups is the subject of Chapter 5. Chapter 6 addresses policy options for IVSS deployment. It also describes a methodology for coming to multi-stakeholder strategies for deployment IVSS. Chapter 7 places the findings of this project in the perspective of a roadmap for IVSS.
System selection & specification
System Penetration rates 2010 & 2020
eIMPACT Accident Trend
Traffic ImpactSafety Impact
Policy Options
CBA
Stakeholder Analysis
2
4
333
3
56
Figure 6: Work Flow in eIMPACT
Deliverable D10 (incl. D9) Version 2.0 16
eIMPACT 11.08.2008
The remaining chapters state the eIMPACT project achievements and results (Chapter 8) and outputs (Chapter 9). Finally, Chapter 10 draws conclusions from the project and provides recommendations for future work.
The annexes contain the keywords for the report, a glossary of terms used in this report and the specification of the twelve selected systems.
Deliverable D10 (incl. D9) Version 2.0 17
eIMPACT 11.08.2008
2 Inventory and recommendations for in-depth socio-economic impact assessment
The aim of work package 1100, “Inventory and recommendations for in-depth socio-economic impact assessment”, was to provide an overview of upcoming technologies in the field of IVSS and to recommend the most promising systems for evaluation. The list of recommendations was not strictly obligatory for the following work packages of the project. Methodological issues, the availability and reliability of data and project resources determined the extent to which the systems were analysed. Most but not all of the systems in the list underwent complete in-depth impact analysis. Finally, the system names were modified for clarity and consistency according to developments in the field and recommendations from experts.
The ranking process and the aims were influenced by the interests and points of view of different stakeholders, the need for a clear, comprehensive, understandable and objective selection process and consideration of the aims and possibilities of the project eIMPACT, as well as the capabilities of the methodologies to assess IVSS.
The results of the ranking and selection process lay the basis for the analyses in the rest of the eIMPACT project. Therefore, it was crucial that the applied methodology meet several criteria:
• Firstly, it needed to provide a comprehensive base for system selection,
• Secondly, it needed to enable a ranking of the most promising systems on a transparent methodological base.
• Finally, it needed to recommend a choice of systems for in-depth assessment which was in some way a representative sample of IVSS.
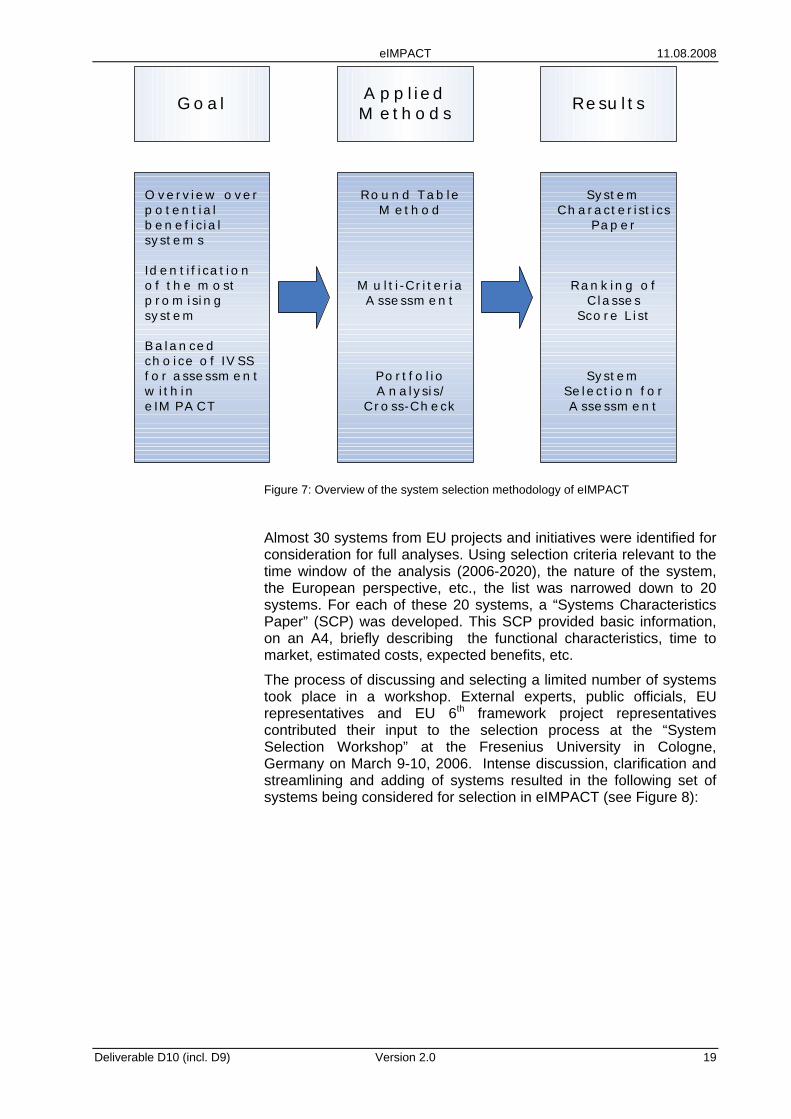
The methodology consisted of three steps which reflected the goals of the system selection process. Each step concluded with a distinct result. Figure 7 provides an overview over the methodology followed in eIMPACT.
Deliverable D10 (incl. D9) Version 2.0 18
eIMPACT 11.08.2008
Deliverable D10 (incl. D9) Version 2.0 19
Figure 7: Overview of the system selection methodology of eIMPACT
Almost 30 systems from EU projects and initiatives were identified for consideration for full analyses. Using selection criteria relevant to the time window of the analysis (2006-2020), the nature of the system, the European perspective, etc., the list was narrowed down to 20 systems. For each of these 20 systems, a “Systems Characteristics Paper” (SCP) was developed. This SCP provided basic information, on an A4, briefly describing the functional characteristics, time to market, estimated costs, expected benefits, etc.
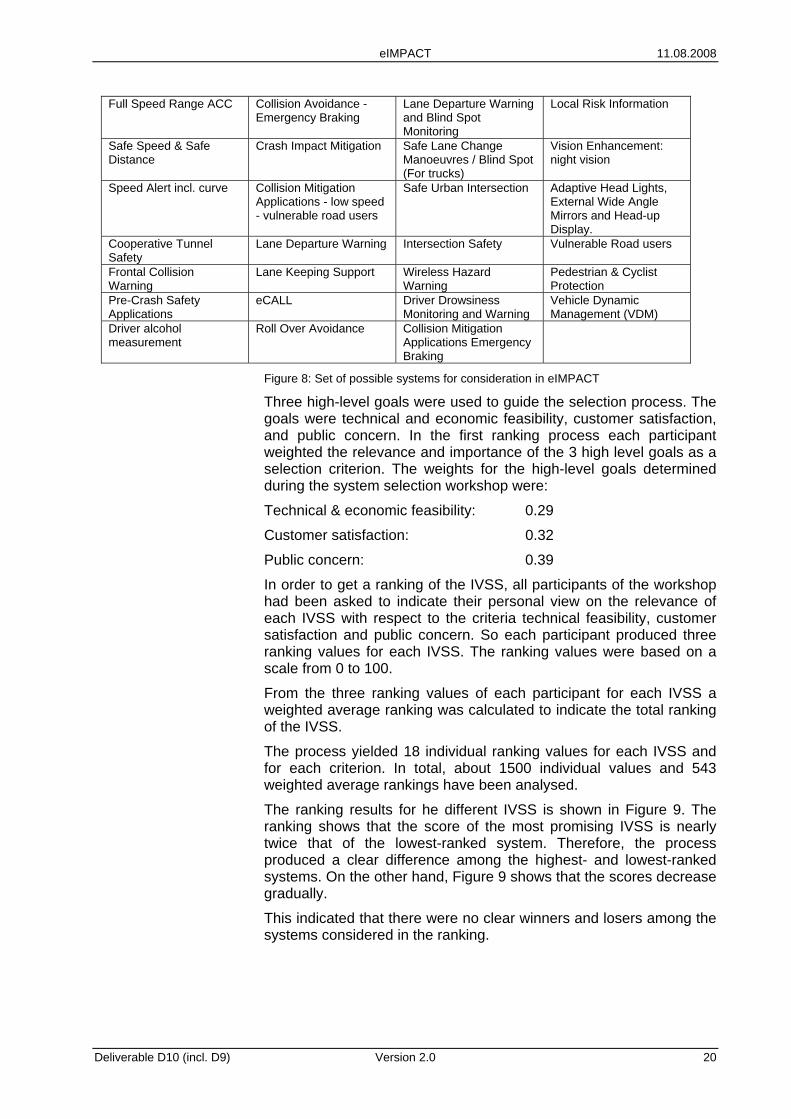
The process of discussing and selecting a limited number of systems took place in a workshop. External experts, public officials, EU representatives and EU 6th framework project representatives contributed their input to the selection process at the “System Selection Workshop” at the Fresenius University in Cologne, Germany on March 9-10, 2006. Intense discussion, clarification and streamlining and adding of systems resulted in the following set of systems being considered for selection in eIMPACT (see Figure 8):
G o a l
O v e r v i e w o v e r p o t e n t i a l b e n e f i c i a l sy st e m s
Id e n t i f i ca t i o n o f t h e m o st p r o m i si n g sy st e m
B a l a n ce d ch o i ce o f IV SS f o r a sse ssm e n t w i t h i n e IM PA CT
A p p l i e d M e t h o d s
Ro u n d Ta b l e M e t h o d
M u l t i -Cr i t e r i a A sse ssm e n t
Po r t f o l i o A n a l y si s/
Cr o ss-Ch e ck
Re su l t s
Sy st e m Ch a r a ct e r i st i cs
Pa p e r
Ra n k i n g o f Cl a sse s
Sco r e L i st
Sy st e m Se l e ct i o n f o r A sse ssm e n t
eIMPACT 11.08.2008
Full Speed Range ACC Collision Avoidance - Emergency Braking
Lane Departure Warning and Blind Spot Monitoring
Local Risk Information
Safe Speed & Safe Distance
Crash Impact Mitigation Safe Lane Change Manoeuvres / Blind Spot (For trucks)
Vision Enhancement: night vision
Speed Alert incl. curve Collision Mitigation Applications - low speed - vulnerable road users
Safe Urban Intersection Adaptive Head Lights, External Wide Angle Mirrors and Head-up Display.
Cooperative Tunnel Safety
Lane Departure Warning Intersection Safety Vulnerable Road users
Frontal Collision Warning
Lane Keeping Support Wireless Hazard Warning
Pedestrian & Cyclist Protection
Pre-Crash Safety Applications
eCALL Driver Drowsiness Monitoring and Warning
Vehicle Dynamic Management (VDM)
Driver alcohol measurement
Roll Over Avoidance Collision Mitigation Applications Emergency Braking
Figure 8: Set of possible systems for consideration in eIMPACT
Three high-level goals were used to guide the selection process. The goals were technical and economic feasibility, customer satisfaction, and public concern. In the first ranking process each participant weighted the relevance and importance of the 3 high level goals as a selection criterion. The weights for the high-level goals determined during the system selection workshop were:
Technical & economic feasibility: 0.29
Customer satisfaction: 0.32
Public concern: 0.39
In order to get a ranking of the IVSS, all participants of the workshop had been asked to indicate their personal view on the relevance of each IVSS with respect to the criteria technical feasibility, customer satisfaction and public concern. So each participant produced three ranking values for each IVSS. The ranking values were based on a scale from 0 to 100.
From the three ranking values of each participant for each IVSS a weighted average ranking was calculated to indicate the total ranking of the IVSS.
The process yielded 18 individual ranking values for each IVSS and for each criterion. In total, about 1500 individual values and 543 weighted average rankings have been analysed.
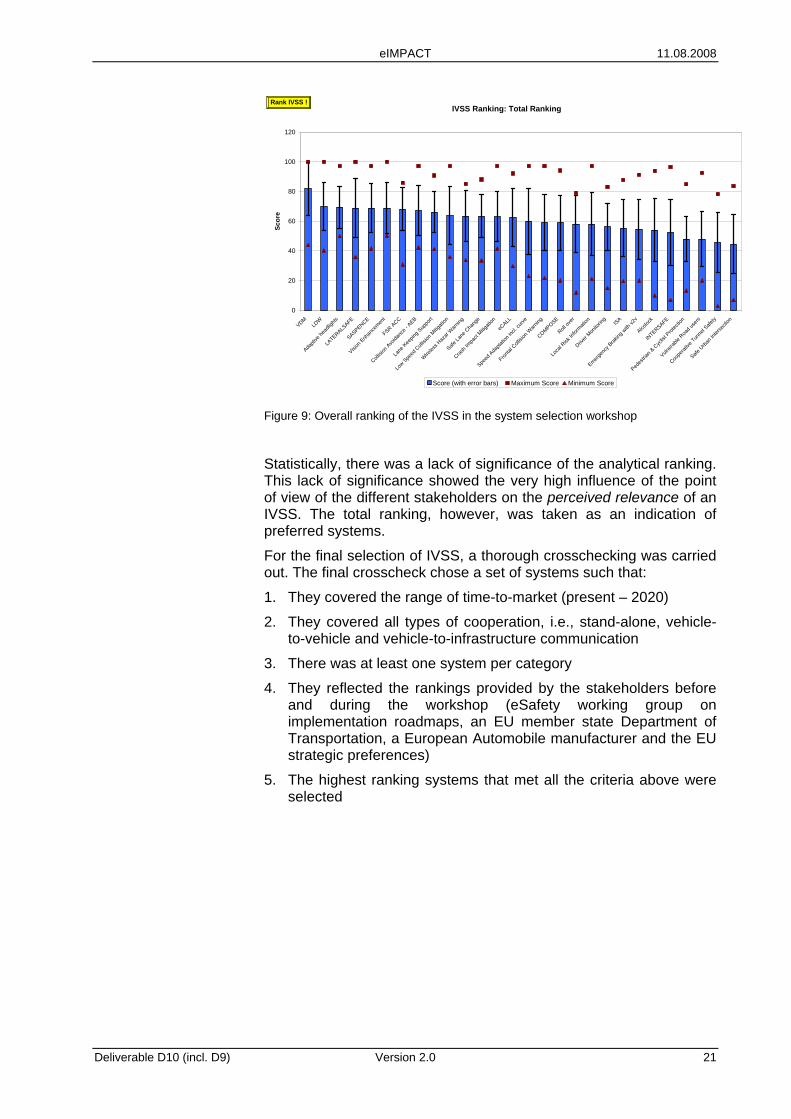
The ranking results for he different IVSS is shown in Figure 9. The ranking shows that the score of the most promising IVSS is nearly twice that of the lowest-ranked system. Therefore, the process produced a clear difference among the highest- and lowest-ranked systems. On the other hand, Figure 9 shows that the scores decrease gradually.
This indicated that there were no clear winners and losers among the systems considered in the ranking.
Deliverable D10 (incl. D9) Version 2.0 20
eIMPACT 11.08.2008
IVSS Ranking: Total Ranking
0
20
40
60
80
100
120
VDMLD
W
Adapti
ve he
adlig
hts
LATERALS
AFE
SASPENCE
Vision E
nhan
cemen
t
FSR ACC
Collisi
on A
voida
nce -
AEB
Lane
Keepin
g Sup
port
Low Spe
ed C
ollisio
n Mitig
ation
Wireles
s Haz
ar W
arning
Safe La
ne C
hang
e
Crash I
mpact
Mitigati
on
eCALL
Speed
Adapta
tion i
ncl. c
urve
Frontal
Coll
ision W
arning
COMPOSE
Roll ov
er
Loca
l Risk
Infor
mation
Driver
Monito
ring
ISA
Emergen
cy Brak
ing w
ith v2
v
Alcoloc
k
INTERSAFE
Pedes
trian &
Cyc
list P
rotec
tion
Vulnera
ble R
oad u
sers
Coope
rative
Tunne
l Safe
ty
Safe U
rban I
nterse
ction
Scor
e
Score (with error bars) Maximum Score Minimum Score
Rank IVSS !
Figure 9: Overall ranking of the IVSS in the system selection workshop
Statistically, there was a lack of significance of the analytical ranking. This lack of significance showed the very high influence of the point of view of the different stakeholders on the perceived relevance of an IVSS. The total ranking, however, was taken as an indication of preferred systems.
For the final selection of IVSS, a thorough crosschecking was carried out. The final crosscheck chose a set of systems such that:
1. They covered the range of time-to-market (present – 2020)
2. They covered all types of cooperation, i.e., stand-alone, vehicle-to-vehicle and vehicle-to-infrastructure communication
3. There was at least one system per category
4. They reflected the rankings provided by the stakeholders before and during the workshop (eSafety working group on implementation roadmaps, an EU member state Department of Transportation, a European Automobile manufacturer and the EU strategic preferences)
5. The highest ranking systems that met all the criteria above were selected
Deliverable D10 (incl. D9) Version 2.0 21
eIMPACT 11.08.2008
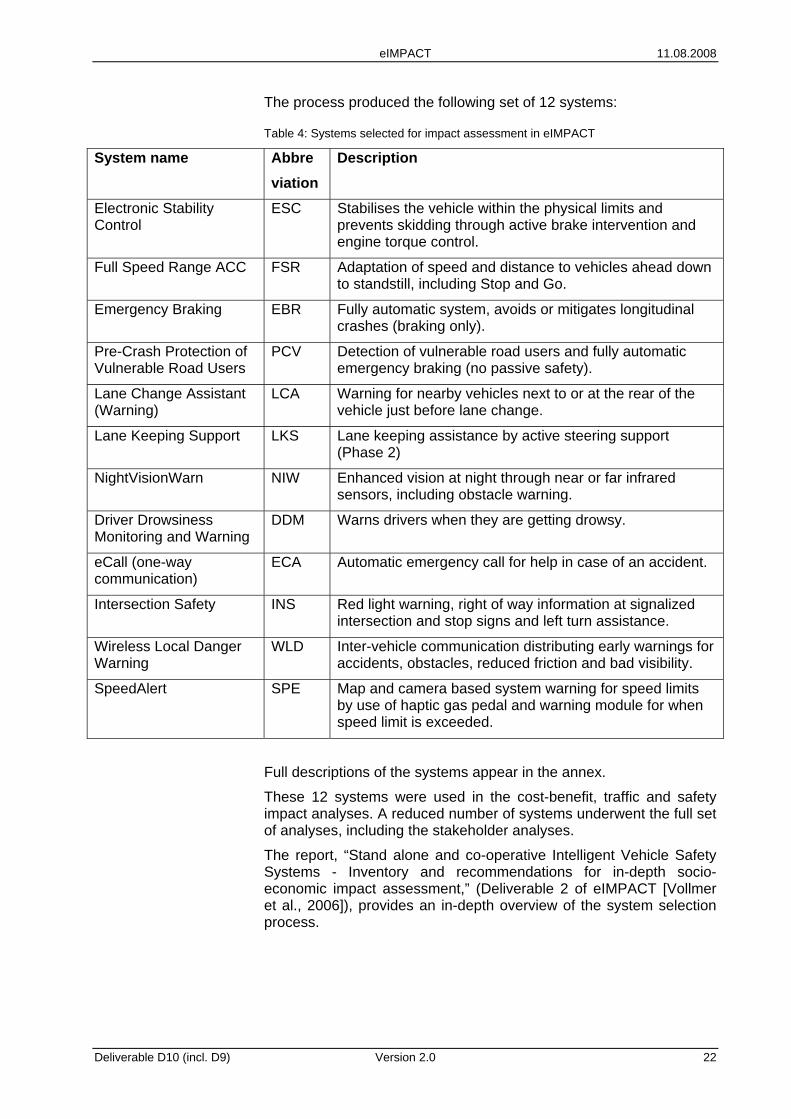
The process produced the following set of 12 systems:
Table 4: Systems selected for impact assessment in eIMPACT
System name Abbre viation
Description
Electronic Stability Control
ESC Stabilises the vehicle within the physical limits and prevents skidding through active brake intervention and engine torque control.
Full Speed Range ACC FSR Adaptation of speed and distance to vehicles ahead down to standstill, including Stop and Go.
Emergency Braking EBR Fully automatic system, avoids or mitigates longitudinal crashes (braking only).
Pre-Crash Protection of Vulnerable Road Users
PCV Detection of vulnerable road users and fully automatic emergency braking (no passive safety).
Lane Change Assistant (Warning)
LCA Warning for nearby vehicles next to or at the rear of the vehicle just before lane change.
Lane Keeping Support LKS Lane keeping assistance by active steering support (Phase 2)
NightVisionWarn NIW Enhanced vision at night through near or far infrared sensors, including obstacle warning.
Driver Drowsiness Monitoring and Warning
DDM Warns drivers when they are getting drowsy.
eCall (one-way communication)
ECA Automatic emergency call for help in case of an accident.
Intersection Safety INS Red light warning, right of way information at signalized intersection and stop signs and left turn assistance.
Wireless Local Danger Warning
WLD Inter-vehicle communication distributing early warnings for accidents, obstacles, reduced friction and bad visibility.
SpeedAlert SPE Map and camera based system warning for speed limits by use of haptic gas pedal and warning module for when speed limit is exceeded.
Full descriptions of the systems appear in the annex.
These 12 systems were used in the cost-benefit, traffic and safety impact analyses. A reduced number of systems underwent the full set of analyses, including the stakeholder analyses.
The report, “Stand alone and co-operative Intelligent Vehicle Safety Systems - Inventory and recommendations for in-depth socio-economic impact assessment,” (Deliverable 2 of eIMPACT [Vollmer et al., 2006]), provides an in-depth overview of the system selection process.
Deliverable D10 (incl. D9) Version 2.0 22
eIMPACT 11.08.2008
3 Safety and Traffic Impact Assessment of Intelligent Vehicle Safety Systems
The report, “Impact assessment of Intelligent Vehicle Safety Systems” (D4, [Wilmink et al., 2008]), provides concrete, unified estimates of traffic and safety effects. Together with “Cost-benefit analyses for stand-alone and co-operative intelligent vehicle safety systems” (D6, [Baum et al., 2008]), summarised in Chapter 4, it forms an integrated estimate of costs and benefits of twelve IVSS. A comprehensive approach was followed to generate the results. The approach made use of scientific and transparent methodologies and state-of-the-art information to generate the results.
The impact assessment provides estimates of effects at realistic penetration rates of the IVSS in 2010 and 2020. For each year, two scenarios were considered: a low scenario, for a ‘business as usual’ situation, and a high scenario, where focused policy incentives are assumed.
The functional and technical descriptions of the systems as specified in the project formed the basis for the impact assessment.
3.1 Methodology Many of the IVSS considered in eIMPACT are future systems. Those that are already on the market tend to have low penetration rates. There is, therefore, not much empirical evidence on the effectiveness and efficiency of the systems considered. With more and more systems on the market, there is a clear need for a transparent and scientifically sound approach to the assessment of IVSS (and similar stand-alone and co-operative systems). The impact assessment approach developed and implemented in eIMPACT covers:
• The estimation of penetration rates (passenger cars, goods vehicles), using information on current fleet composition and mileage, as well as information on the year of market introduction and the (expected) market acceptance of systems.
• The assessment of traffic impacts. The analysis distinguishes between direct and indirect effects:
o direct traffic effects on the traffic flow, e.g. changes in speeds and headways (analysed using micro-simulation);
o indirect traffic effects in terms of reduced congestion, due to avoided accidents with fatalities and injuries.
• The assessment of the safety impacts. The innovative approach followed in eIMPACT covers all possible (intended and unintended) effects of IVSS, using insights into system and driver behaviour. The approach looks at the three components of traffic safety analysis (exposure, risk of collision, and risk of a collision to result in injuries or death). In the analyses, the three main factors of traffic safety were
Deliverable D10 (incl. D9) Version 2.0 23
eIMPACT 11.08.2008
covered by nine behavioural mechanisms as first described in [Draskóczy et al., 1998]. The first five mechanisms are connected to the accident risk:
o Direct in-car modification of the driving task;
o Direct influence by roadside systems;
o Indirect modification of user behaviour;
o Indirect modification of non-user behaviour and
o Modification of interaction between users and non-users.
The second group deals with exposure:
o Modification of road user exposure;
o Modification of modal choice;
o Modification of route choice.
Finally, there is the mechanism that deals with changes in accident consequences:
o Modification of accident consequences.
The approach does justice to the complexity of the analysis of the effects of IVSS. The method for quantifying the safety effects explicitly takes into account the general accident data available from the CARE database, which is a good basis for relevant accident data (such as numbers of fatalities and injuries in many EU countries).
The approach made use of a “reference case” (in terms of the number of accidents) in the considered future years. This is the situation without IVSS. In order to establish the reference cases, the trend for the autonomous decrease in the number of accidents was investigated, resulting in estimates for the number of fatalities and injuries in 2010 and 2020 in the ‘without IVSS’ case.
The results from the impact assessment are used as input in the cost-benefit analysis (reported in Socio-economic impact assessment of stand-alone and co-operative intelligent vehicle safety systems (IVSS) in Europe, by [Baum et al., 2008]), also carried out in the eIMPACT project. Where needed (for the CBA), results for specific areas or conditions are scaled up to EU-25 level. The results are also used as input for the policy options and stakeholder analysis.
The application of the approach in the eIMPACT impact assessment shows that it is a valuable approach that can be replicated. In the future, actual results can be adjusted based on new insights (e.g. FOT results, regarding driving behaviour, new system specifications, etc.).
3.2 eIMPACT accident trend
Deliverable D10 (incl. D9) Version 2.0 24
eIMPACT 11.08.2008
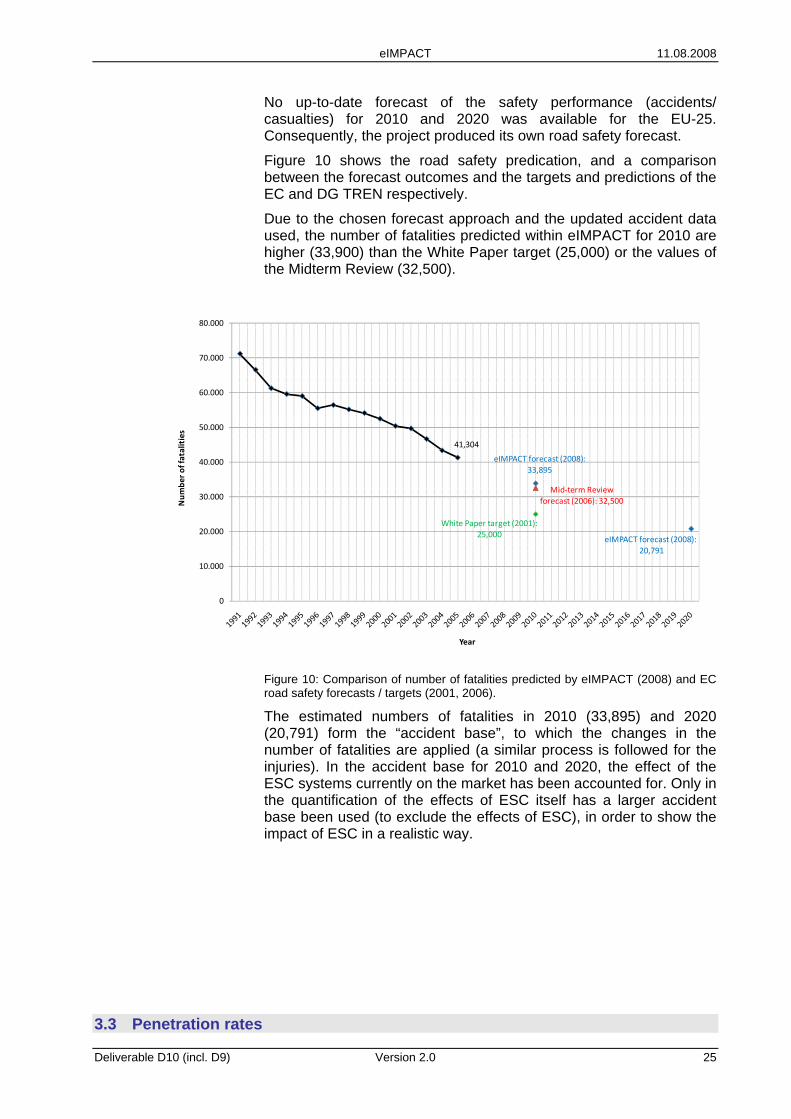
No up-to-date forecast of the safety performance (accidents/ casualties) for 2010 and 2020 was available for the EU-25. Consequently, the project produced its own road safety forecast.
Figure 10 shows the road safety predication, and a comparison between the forecast outcomes and the targets and predictions of the EC and DG TREN respectively.
Due to the chosen forecast approach and the updated accident data used, the number of fatalities predicted within eIMPACT for 2010 are higher (33,900) than the White Paper target (25,000) or the values of the Midterm Review (32,500).
41,304
eIMPACT forecast (2008):33,895
eIMPACT forecast (2008):20,791
Mid‐term Reviewforecast (2006): 32,500
White Paper target (2001):25,000
0
10.000
20.000
30.000
40.000
50.000
60.000
70.000
80.000
Num
ber o
f fatalities
Year
Figure 10: Comparison of number of fatalities predicted by eIMPACT (2008) and EC road safety forecasts / targets (2001, 2006).
The estimated numbers of fatalities in 2010 (33,895) and 2020 (20,791) form the “accident base”, to which the changes in the number of fatalities are applied (a similar process is followed for the injuries). In the accident base for 2010 and 2020, the effect of the ESC systems currently on the market has been accounted for. Only in the quantification of the effects of ESC itself has a larger accident base been used (to exclude the effects of ESC), in order to show the impact of ESC in a realistic way.
3.3 Penetration rates
Deliverable D10 (incl. D9) Version 2.0 25
eIMPACT 11.08.2008
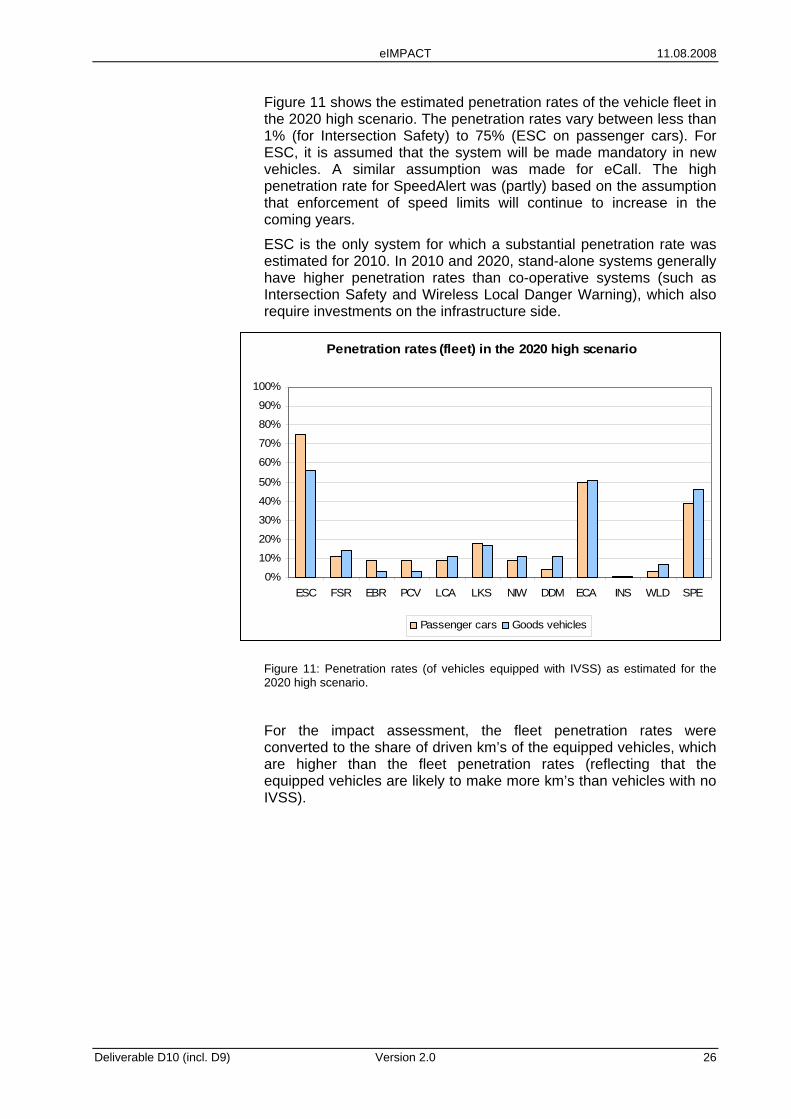
Figure 11 shows the estimated penetration rates of the vehicle fleet in the 2020 high scenario. The penetration rates vary between less than 1% (for Intersection Safety) to 75% (ESC on passenger cars). For ESC, it is assumed that the system will be made mandatory in new vehicles. A similar assumption was made for eCall. The high penetration rate for SpeedAlert was (partly) based on the assumption that enforcement of speed limits will continue to increase in the coming years.
ESC is the only system for which a substantial penetration rate was estimated for 2010. In 2010 and 2020, stand-alone systems generally have higher penetration rates than co-operative systems (such as Intersection Safety and Wireless Local Danger Warning), which also require investments on the infrastructure side.
Penetration rates (fleet) in the 2020 high scenario
0%
10%
20%
30%
40%
50%
60%
70%
80%
90%
100%
ESC FSR EBR PCV LCA LKS NIW DDM ECA INS WLD SPE
Passenger cars Goods vehicles
Figure 11: Penetration rates (of vehicles equipped with IVSS) as estimated for the 2020 high scenario.
For the impact assessment, the fleet penetration rates were converted to the share of driven km’s of the equipped vehicles, which are higher than the fleet penetration rates (reflecting that the equipped vehicles are likely to make more km’s than vehicles with no IVSS).
Deliverable D10 (incl. D9) Version 2.0 26
eIMPACT 11.08.2008
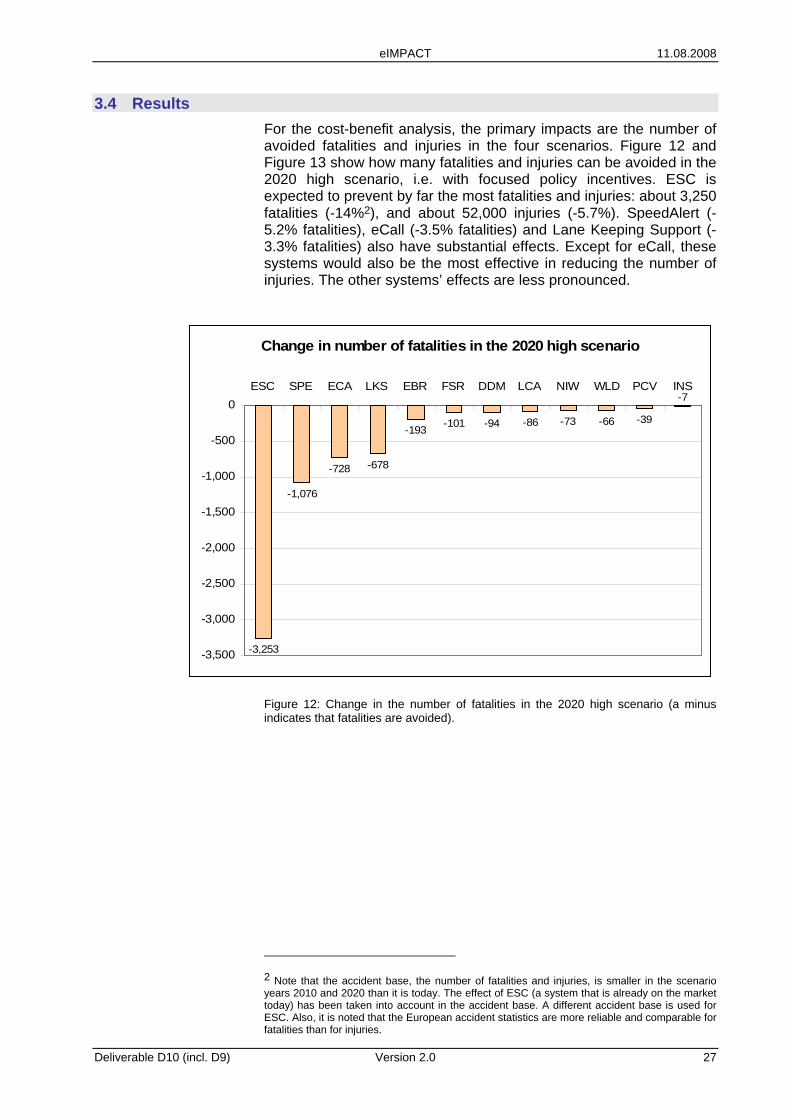
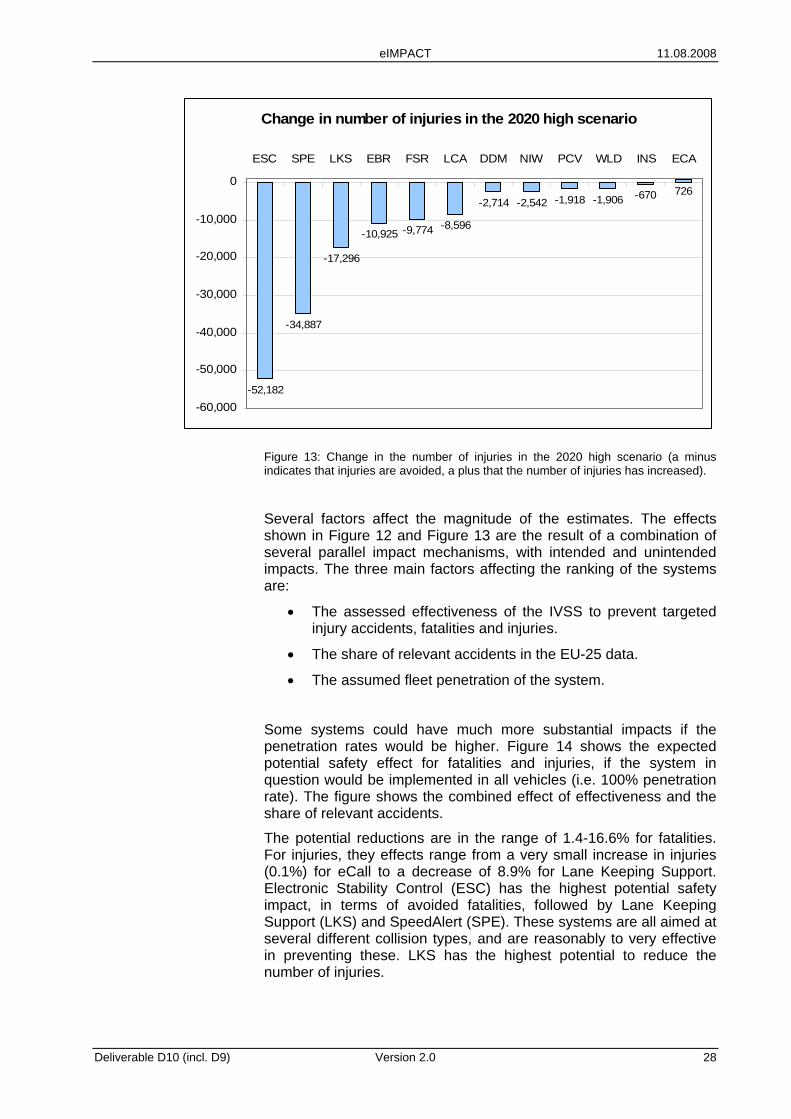
3.4 Results For the cost-benefit analysis, the primary impacts are the number of avoided fatalities and injuries in the four scenarios. Figure 12 and Figure 13 show how many fatalities and injuries can be avoided in the 2020 high scenario, i.e. with focused policy incentives. ESC is expected to prevent by far the most fatalities and injuries: about 3,250 fatalities (-14%2), and about 52,000 injuries (-5.7%). SpeedAlert (-5.2% fatalities), eCall (-3.5% fatalities) and Lane Keeping Support (-3.3% fatalities) also have substantial effects. Except for eCall, these systems would also be the most effective in reducing the number of injuries. The other systems’ effects are less pronounced.
Change in number of fatalities in the 2020 high scenario
-3,253
-1,076
-728 -678
-193 -101 -94 -86 -73 -66 -39
-7
-3,500
-3,000
-2,500
-2,000
-1,500
-1,000
-500
0ESC SPE ECA LKS EBR FSR DDM LCA NIW WLD PCV INS
Figure 12: Change in the number of fatalities in the 2020 high scenario (a minus indicates that fatalities are avoided).
2 Note that the accident base, the number of fatalities and injuries, is smaller in the scenario years 2010 and 2020 than it is today. The effect of ESC (a system that is already on the market today) has been taken into account in the accident base. A different accident base is used for ESC. Also, it is noted that the European accident statistics are more reliable and comparable for fatalities than for injuries.
Deliverable D10 (incl. D9) Version 2.0 27
eIMPACT 11.08.2008
Change in number of injuries in the 2020 high scenario
-52,182
-34,887
-17,296
-10,925 -9,774 -8,596
-2,714 -2,542 -1,918 -1,906 -670 726
-60,000
-50,000
-40,000
-30,000
-20,000
-10,000
0
ESC SPE LKS EBR FSR LCA DDM NIW PCV WLD INS ECA
Figure 13: Change in the number of injuries in the 2020 high scenario (a minus indicates that injuries are avoided, a plus that the number of injuries has increased).
Several factors affect the magnitude of the estimates. The effects shown in Figure 12 and Figure 13 are the result of a combination of several parallel impact mechanisms, with intended and unintended impacts. The three main factors affecting the ranking of the systems are:
• The assessed effectiveness of the IVSS to prevent targeted injury accidents, fatalities and injuries.
• The share of relevant accidents in the EU-25 data.
• The assumed fleet penetration of the system.
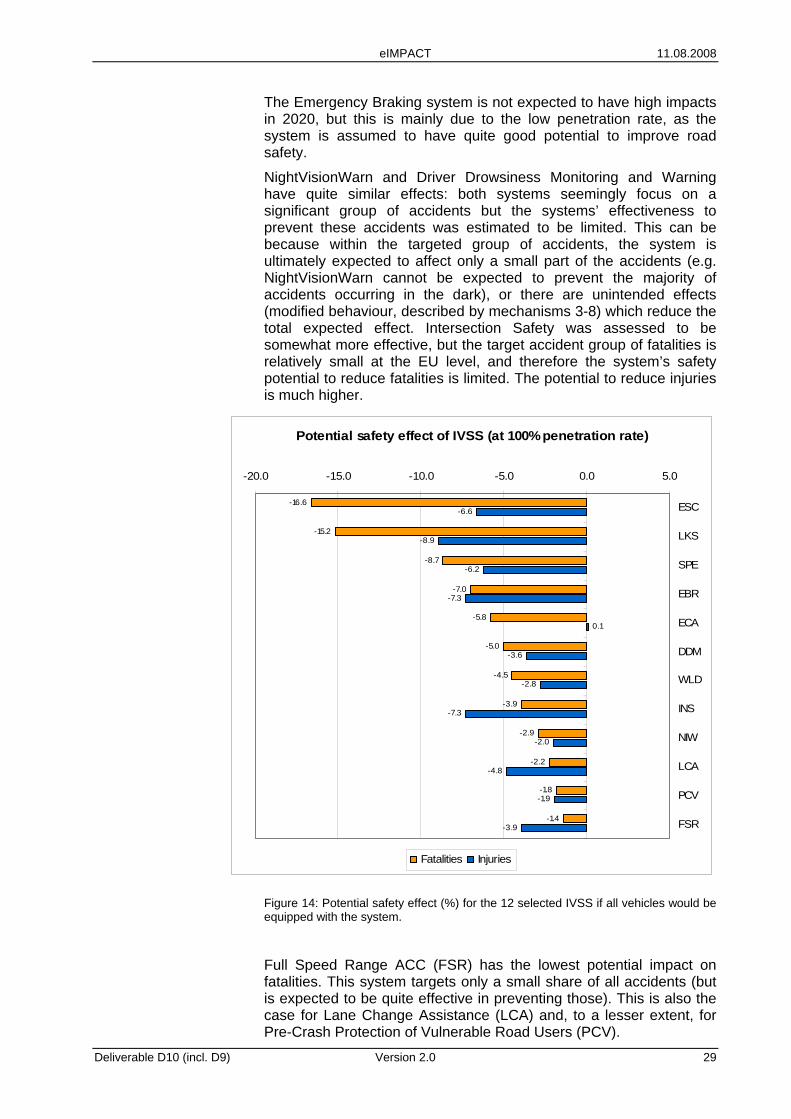
Some systems could have much more substantial impacts if the penetration rates would be higher. Figure 14 shows the expected potential safety effect for fatalities and injuries, if the system in question would be implemented in all vehicles (i.e. 100% penetration rate). The figure shows the combined effect of effectiveness and the share of relevant accidents.
The potential reductions are in the range of 1.4-16.6% for fatalities. For injuries, they effects range from a very small increase in injuries (0.1%) for eCall to a decrease of 8.9% for Lane Keeping Support. Electronic Stability Control (ESC) has the highest potential safety impact, in terms of avoided fatalities, followed by Lane Keeping Support (LKS) and SpeedAlert (SPE). These systems are all aimed at several different collision types, and are reasonably to very effective in preventing these. LKS has the highest potential to reduce the number of injuries.
Deliverable D10 (incl. D9) Version 2.0 28
eIMPACT 11.08.2008
The Emergency Braking system is not expected to have high impacts in 2020, but this is mainly due to the low penetration rate, as the system is assumed to have quite good potential to improve road safety.
NightVisionWarn and Driver Drowsiness Monitoring and Warning have quite similar effects: both systems seemingly focus on a significant group of accidents but the systems’ effectiveness to prevent these accidents was estimated to be limited. This can be because within the targeted group of accidents, the system is ultimately expected to affect only a small part of the accidents (e.g. NightVisionWarn cannot be expected to prevent the majority of accidents occurring in the dark), or there are unintended effects (modified behaviour, described by mechanisms 3-8) which reduce the total expected effect. Intersection Safety was assessed to be somewhat more effective, but the target accident group of fatalities is relatively small at the EU level, and therefore the system’s safety potential to reduce fatalities is limited. The potential to reduce injuries is much higher.
Potential safety effect of IVSS (at 100% penetration rate)
-16.6
-15.2
-8.7
-7.0
-5.8
-5.0
-4.5
-3.9
-2.9
-2.2
-1.8
-1.4
-6.6
-8.9
-6.2
-7.3
0.1
-3.6
-2.8
-7.3
-2.0
-4.8
-1.9
-3.9
-20.0 -15.0 -10.0 -5.0 0.0 5.0
ESC
LKS
SPE
EBR
ECA
DDM
WLD
INS
NIW
LCA
PCV
FSR
Fatalities Injuries
Figure 14: Potential safety effect (%) for the 12 selected IVSS if all vehicles would be equipped with the system.
Full Speed Range ACC (FSR) has the lowest potential impact on fatalities. This system targets only a small share of all accidents (but is expected to be quite effective in preventing those). This is also the case for Lane Change Assistance (LCA) and, to a lesser extent, for Pre-Crash Protection of Vulnerable Road Users (PCV).
Deliverable D10 (incl. D9) Version 2.0 29
eIMPACT 11.08.2008
eCall does not prevent accidents and is relevant only for mitigating the effects of selected collision types. However, eCall has a high penetration rate in the 2020 high scenario, and thus still has a relatively high impact on the number of fatalities.
However, as most of the fatalities are turned into injuries, and not many injuries are avoided, the system will result in a very small increase in the number of injuries.
The primary traffic effects were the changes in speeds and travel times (resulting from changes in the characteristics of the traffic flows, or from less congestion caused by accidents). Compared to the safety effects, the traffic effects are modest. This is not unexpected, as eIMPACT looks at safety systems, but an important conclusion is that the selected IVSS have no negative impacts on traffic flows and travel times.
Only the SpeedAlert system shows (positive) direct traffic effects in monetary terms substantial enough to be noticed at the EU-25 level. Although slightly increased travel times are expected because of reduced speeds, the environmental benefits of the reduction in speed (reduced emissions) outweigh the negative travel time effects.
At cross-sections, the direct traffic effects such as reduced speeds, earlier braking and longer headways can be expected for a number of systems, but this is not substantial enough at the penetration rates examined to produce significant traffic impacts at the network and EU-level. Those effects have, however, been accounted for in the safety analysis.
Indirect traffic effects, i.e. avoided congestion costs resulting from a reduction in the number of accidents with fatalities and injuries, occur for all systems.
The largest effects are found for systems that are effective in high traffic densities (mostly on motorways, in peak periods). The effectiveness of the system on different road types and in different periods of the day was derived from the safety analysis. The ESC system showed the highest reduction in congestion costs. Intersection Safety showed the lowest reduction (mainly due to the low penetration rate).
It should be noted that the impact assessment focused on safety and traffic impacts (and effects on emissions), and did not consider other aspects such as the increased comfort that some of the IVSS considered can bring.
Relationship with other work packages in eIMPACT The impact assessment provided input for the cost-benefit analysis (CBA). The most important input was the reduction in the numbers of fatalities and injuries. Each avoided fatality and injury was assigned a monetary value. Monetary values were also assigned to the traffic effects: changes in travel times and emissions. In the CBA, the total benefits were compared to the total costs of implementing the systems to obtain the benefit-cost ratios (at the estimated penetration rates in 2010 and 2020).
The results also provided insights for the stakeholder analysis and for policy development.
Deliverable D10 (incl. D9) Version 2.0 30
eIMPACT 11.08.2008
The impact assessment results also supported the choice of systems analysed in the stakeholder analysis. However, other characteristics of the system were also relevant in that choice: whether systems were co-operative or stand-alone, and what the time to market is.
Deliverable D10 (incl. D9) Version 2.0 31
eIMPACT 11.08.2008
4 Cost Benefit Analysis
The report, “Cost-Benefit Analyses for stand-alone and co-operative Intelligent Vehicle Safety Systems” (D6, [Baum et al., 2008]), provides concrete, unified results for the socio-economic impact of IVSS. Together with “Impact assessment of Intelligent Vehicle Safety Systems” (D4, [Wilmink et al., 2008]), summarised in Chapter 3, it forms an integrated estimate of costs and benefits of twelve IVSS. A comprehensive approach was followed to generate the results. The approach made use of scientific and transparent methodologies and state-of-the-art information to generate the results.
The cost-benefit analyses for twelve IVSS follow the methodology as presented in the report “Methodological framework and database for socio-economic evaluation of Intelligent Vehicle Safety Systems” (D3, [Assing et al., 2006]). It makes use of a comprehensive framework for socio-economic impact assessment which is based on the findings of the SEiSS study. The framework applies cost-benefit analysis as the most prominent economic assessment tool to prove the profitability of a measure on society level. A wider socio-economic perspective, focused on stakeholder analyses for key interest groups (e.g. system users, OEMs and suppliers, insurance industry and public authorities) is provided in a separate report, “Stakeholder Analyses for Intelligent Vehicle Safety Systems” (D8 [Baum et al., 2008]).
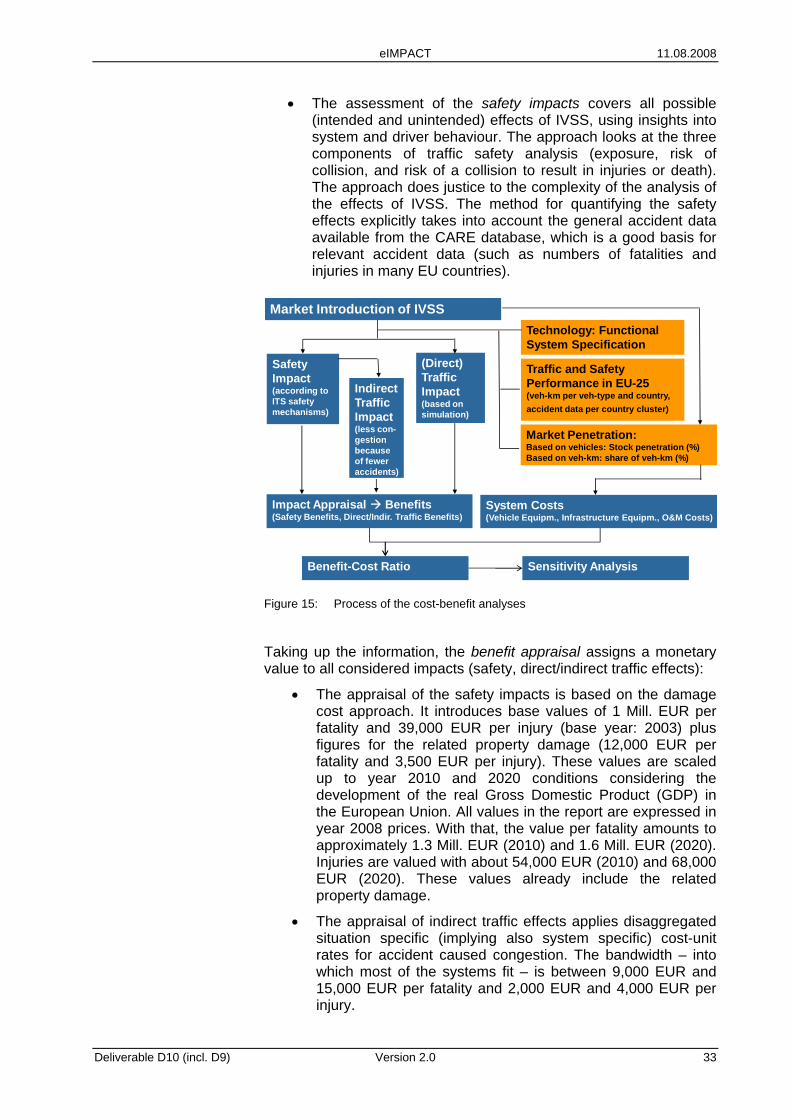
4.1 Methodology The cost-benefit analyses generate cost-benefit results of IVSS looking at the entire EU-25 for the target years 2010 and 2020. For each year, two scenarios were considered: a low scenario, for a ‘business as usual’ situation, and a high scenario, where focused policy incentives are assumed. The CBA from a process perspective is represented in Figure 15. The CBA makes use of several inputs which have been reported in other eIMPACT deliverables (D4, [Wilmink et al., 2008]):
• The socio-economic impact assessment provides estimates of effects at realistic penetration rates for the vehicle stock and – based on this – for the share of driven kilometres of the IVSS in 2010 and 2020.
• The functional and technical descriptions of the systems as specified in the project form the basis for the impact assessment and the cost-benefits analyses, too.
• The forecast for the accident trend provides the basis for Intelligent Vehicle Safety Systems to deploy their benefits.
• The assessment of traffic impacts distinguishes between direct and indirect effects:
o direct traffic effects on the traffic flow, e.g. changes in speeds and headways (analysed using micro-simulation);
o indirect traffic effects in terms of reduced congestion, due to avoided accidents with fatalities and injuries.
Deliverable D10 (incl. D9) Version 2.0 32
eIMPACT 11.08.2008
• The assessment of the safety impacts covers all possible (intended and unintended) effects of IVSS, using insights into system and driver behaviour. The approach looks at the three components of traffic safety analysis (exposure, risk of collision, and risk of a collision to result in injuries or death). The approach does justice to the complexity of the analysis of the effects of IVSS. The method for quantifying the safety effects explicitly takes into account the general accident data available from the CARE database, which is a good basis for relevant accident data (such as numbers of fatalities and injuries in many EU countries).
Safety Impact (according to ITS safety mechanisms)
System Costs (Vehicle Equipm., Infrastructure Equipm., O&M Costs)
Market Introduction of IVSSTechnology: Functional System Specification
Traffic and Safety Performance in EU-25(veh-km per veh-type and country, accident data per country cluster)
Market Penetration:Based on vehicles: Stock penetration (%)Based on veh-km: share of veh-km (%)
Benefit-Cost Ratio
(Direct) Traffic Impact(based on simulation)
Indirect Traffic Impact (less con-gestion because of fewer accidents)
Impact Appraisal Benefits (Safety Benefits, Direct/Indir. Traffic Benefits)
Sensitivity Analysis
Figure 15: Process of the cost-benefit analyses
Taking up the information, the benefit appraisal assigns a monetary value to all considered impacts (safety, direct/indirect traffic effects):
• The appraisal of the safety impacts is based on the damage cost approach. It introduces base values of 1 Mill. EUR per fatality and 39,000 EUR per injury (base year: 2003) plus figures for the related property damage (12,000 EUR per fatality and 3,500 EUR per injury). These values are scaled up to year 2010 and 2020 conditions considering the development of the real Gross Domestic Product (GDP) in the European Union. All values in the report are expressed in year 2008 prices. With that, the value per fatality amounts to approximately 1.3 Mill. EUR (2010) and 1.6 Mill. EUR (2020). Injuries are valued with about 54,000 EUR (2010) and 68,000 EUR (2020). These values already include the related property damage.
• The appraisal of indirect traffic effects applies disaggregated situation specific (implying also system specific) cost-unit rates for accident caused congestion. The bandwidth – into which most of the systems fit – is between 9,000 EUR and 15,000 EUR per fatality and 2,000 EUR and 4,000 EUR per injury.
Deliverable D10 (incl. D9) Version 2.0 33
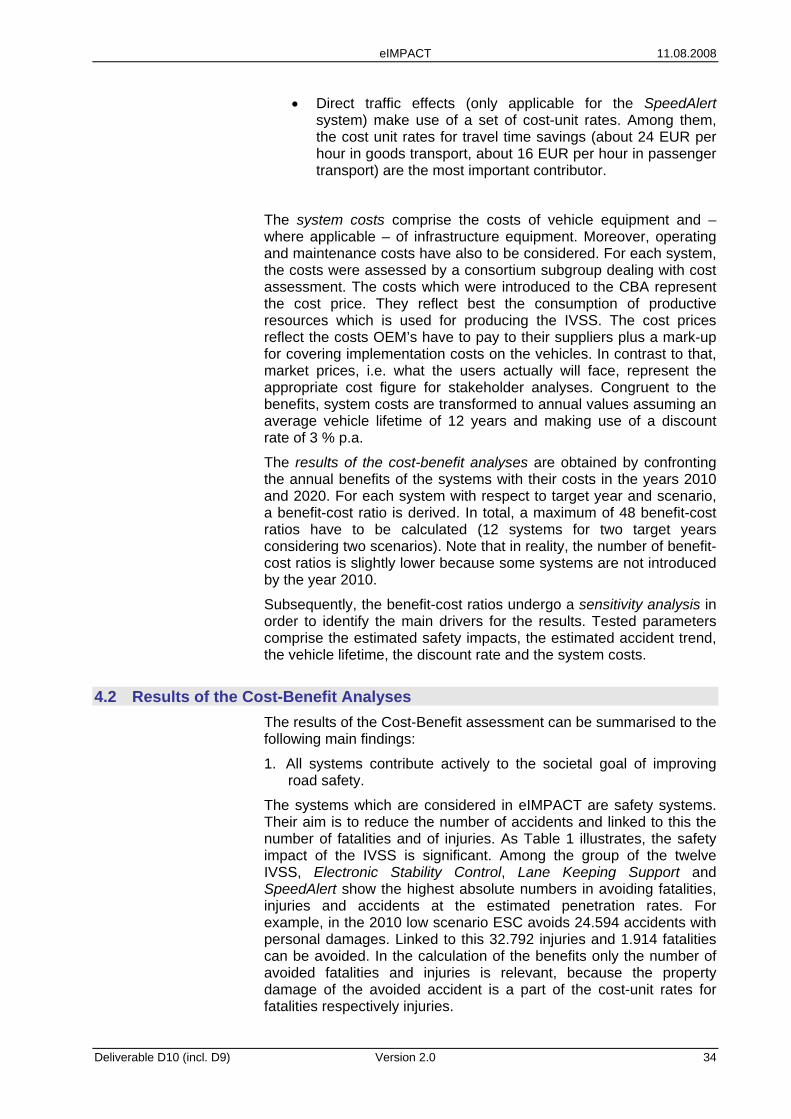
eIMPACT 11.08.2008
• Direct traffic effects (only applicable for the SpeedAlert system) make use of a set of cost-unit rates. Among them, the cost unit rates for travel time savings (about 24 EUR per hour in goods transport, about 16 EUR per hour in passenger transport) are the most important contributor.
The system costs comprise the costs of vehicle equipment and – where applicable – of infrastructure equipment. Moreover, operating and maintenance costs have also to be considered. For each system, the costs were assessed by a consortium subgroup dealing with cost assessment. The costs which were introduced to the CBA represent the cost price. They reflect best the consumption of productive resources which is used for producing the IVSS. The cost prices reflect the costs OEM’s have to pay to their suppliers plus a mark-up for covering implementation costs on the vehicles. In contrast to that, market prices, i.e. what the users actually will face, represent the appropriate cost figure for stakeholder analyses. Congruent to the benefits, system costs are transformed to annual values assuming an average vehicle lifetime of 12 years and making use of a discount rate of 3 % p.a.
The results of the cost-benefit analyses are obtained by confronting the annual benefits of the systems with their costs in the years 2010 and 2020. For each system with respect to target year and scenario, a benefit-cost ratio is derived. In total, a maximum of 48 benefit-cost ratios have to be calculated (12 systems for two target years considering two scenarios). Note that in reality, the number of benefit-cost ratios is slightly lower because some systems are not introduced by the year 2010.
Subsequently, the benefit-cost ratios undergo a sensitivity analysis in order to identify the main drivers for the results. Tested parameters comprise the estimated safety impacts, the estimated accident trend, the vehicle lifetime, the discount rate and the system costs.
4.2 Results of the Cost-Benefit Analyses The results of the Cost-Benefit assessment can be summarised to the following main findings:
1. All systems contribute actively to the societal goal of improving road safety.
The systems which are considered in eIMPACT are safety systems. Their aim is to reduce the number of accidents and linked to this the number of fatalities and of injuries. As Table 1 illustrates, the safety impact of the IVSS is significant. Among the group of the twelve IVSS, Electronic Stability Control, Lane Keeping Support and SpeedAlert show the highest absolute numbers in avoiding fatalities, injuries and accidents at the estimated penetration rates. For example, in the 2010 low scenario ESC avoids 24.594 accidents with personal damages. Linked to this 32.792 injuries and 1.914 fatalities can be avoided. In the calculation of the benefits only the number of avoided fatalities and injuries is relevant, because the property damage of the avoided accident is a part of the cost-unit rates for fatalities respectively injuries.
Deliverable D10 (incl. D9) Version 2.0 34
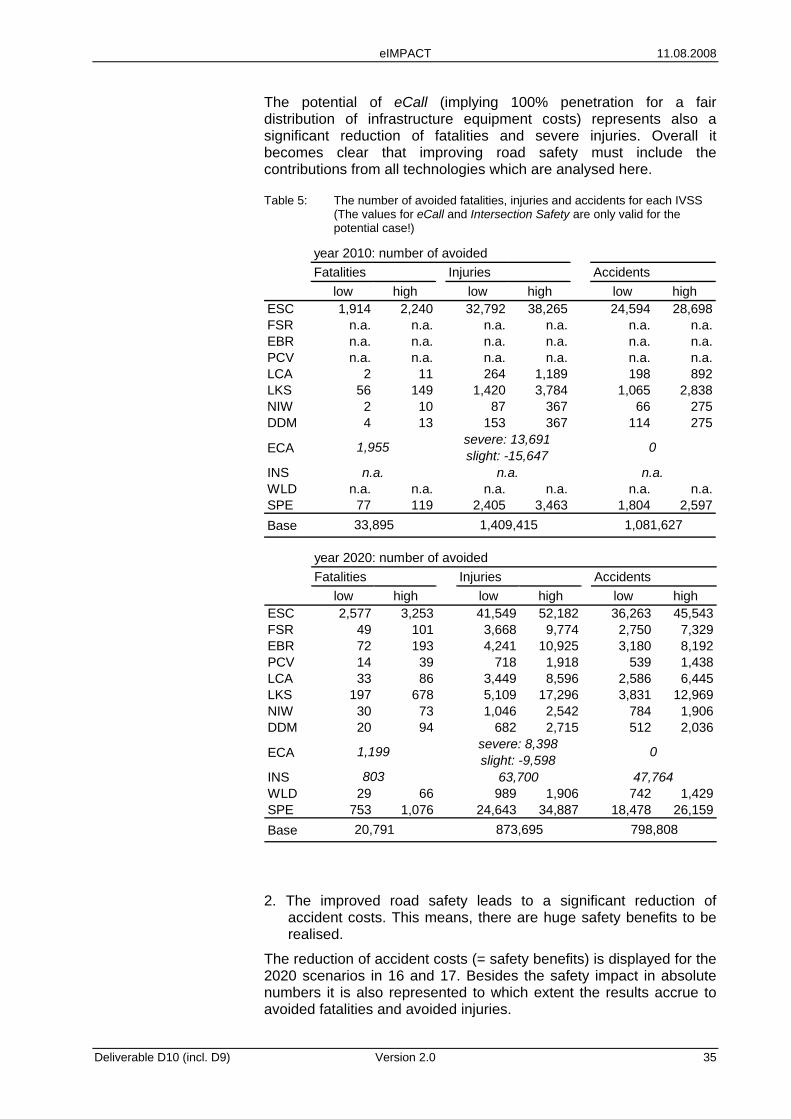
eIMPACT 11.08.2008
The potential of eCall (implying 100% penetration for a fair distribution of infrastructure equipment costs) represents also a significant reduction of fatalities and severe injuries. Overall it becomes clear that improving road safety must include the contributions from all technologies which are analysed here.
Table 5: The number of avoided fatalities, injuries and accidents for each IVSS (The values for eCall and Intersection Safety are only valid for the potential case!)
year 2010: number of avoided Fatalities Injuries Accidents
low high low high low highESC 1,914 2,240 32,792 38,265 24,594 28,698FSR n.a. n.a. n.a. n.a. n.a. n.a.EBR n.a. n.a. n.a. n.a. n.a. n.a.PCV n.a. n.a. n.a. n.a. n.a. n.a.LCA 2 11 264 1,189 198 892LKS 56 149 1,420 3,784 1,065 2,838NIW 2 10 87 367 66 275DDM 4 13 153 367 114 275
ECA
INSWLD n.a. n.a. n.a. n.a. n.a. n.a.SPE 77 119 2,405 3,463 1,804 2,597Base
1,955 severe: 13,691slight: -15,647
n.a. n.a. n.a.
0
33,895 1,409,415 1,081,627
year 2020: number of avoidedFatalities Injuries Accidents
low high low high low highESC 2,577 3,253 41,549 52,182 36,263 45,543FSR 49 101 3,668 9,774 2,750 7,329EBR 72 193 4,241 10,925 3,180 8,192PCV 14 39 718 1,918 539 1,438LCA 33 86 3,449 8,596 2,586 6,445LKS 197 678 5,109 17,296 3,831 12,969NIW 30 73 1,046 2,542 784 1,906DDM 20 94 682 2,715 512 2,036
ECA
INSWLD 29 66 989 1,906 742 1,429SPE 753 1,076 24,643 34,887 18,478 26,159Base
01,199 severe: 8,398slight: -9,598
803 63,700 47,764
20,791 873,695 798,808
2. The improved road safety leads to a significant reduction of accident costs. This means, there are huge safety benefits to be realised.
The reduction of accident costs (= safety benefits) is displayed for the 2020 scenarios in 16 and 17. Besides the safety impact in absolute numbers it is also represented to which extent the results accrue to avoided fatalities and avoided injuries.
Deliverable D10 (incl. D9) Version 2.0 35
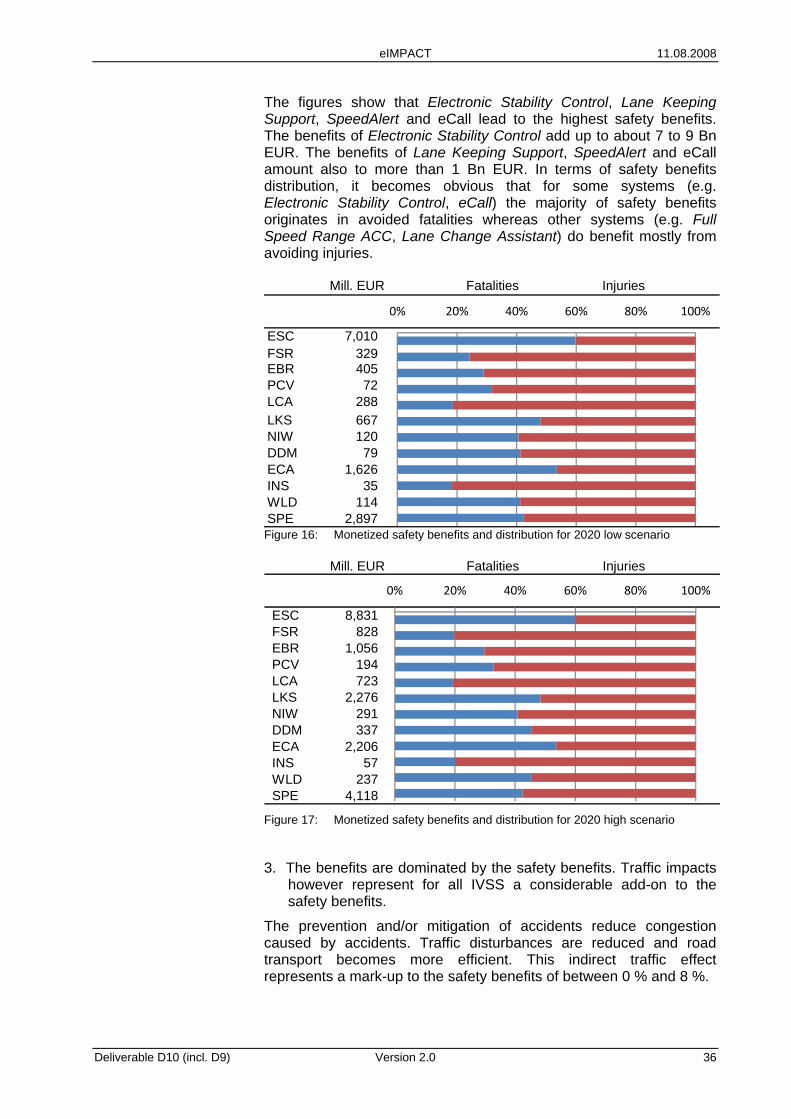
eIMPACT 11.08.2008
The figures show that Electronic Stability Control, Lane Keeping Support, SpeedAlert and eCall lead to the highest safety benefits. The benefits of Electronic Stability Control add up to about 7 to 9 Bn EUR. The benefits of Lane Keeping Support, SpeedAlert and eCall amount also to more than 1 Bn EUR. In terms of safety benefits distribution, it becomes obvious that for some systems (e.g. Electronic Stability Control, eCall) the majority of safety benefits originates in avoided fatalities whereas other systems (e.g. Full Speed Range ACC, Lane Change Assistant) do benefit mostly from avoiding injuries.
Mill. EUR Fatalities Injuries
ESC 7,010 FSR 329 EBR 405 PCV 72 LCA 288 LKS 667 NIW 120 DDM 79 ECA 1,626 INS 35 WLD 114 SPE 2,897
0% 20% 40% 60% 80% 100%
Figure 16: Monetized safety benefits and distribution for 2020 low scenario
Figure 17: Monetized safety benefits and distribution for 2020 high scenario
Mill. EUR Fatalities Injuries
ESC 8,831 FSR 828 EBR 1,056 PCV 194 LCA 723 LKS 2,276 NIW 291 DDM 337 ECA 2,206 INS 57 WLD 237 SPE 4,118
0% 20% 40% 60% 80% 100%
3. The benefits are dominated by the safety benefits. Traffic impacts however represent for all IVSS a considerable add-on to the safety benefits.
The prevention and/or mitigation of accidents reduce congestion caused by accidents. Traffic disturbances are reduced and road transport becomes more efficient. This indirect traffic effect represents a mark-up to the safety benefits of between 0 % and 8 %.
Deliverable D10 (incl. D9) Version 2.0 36
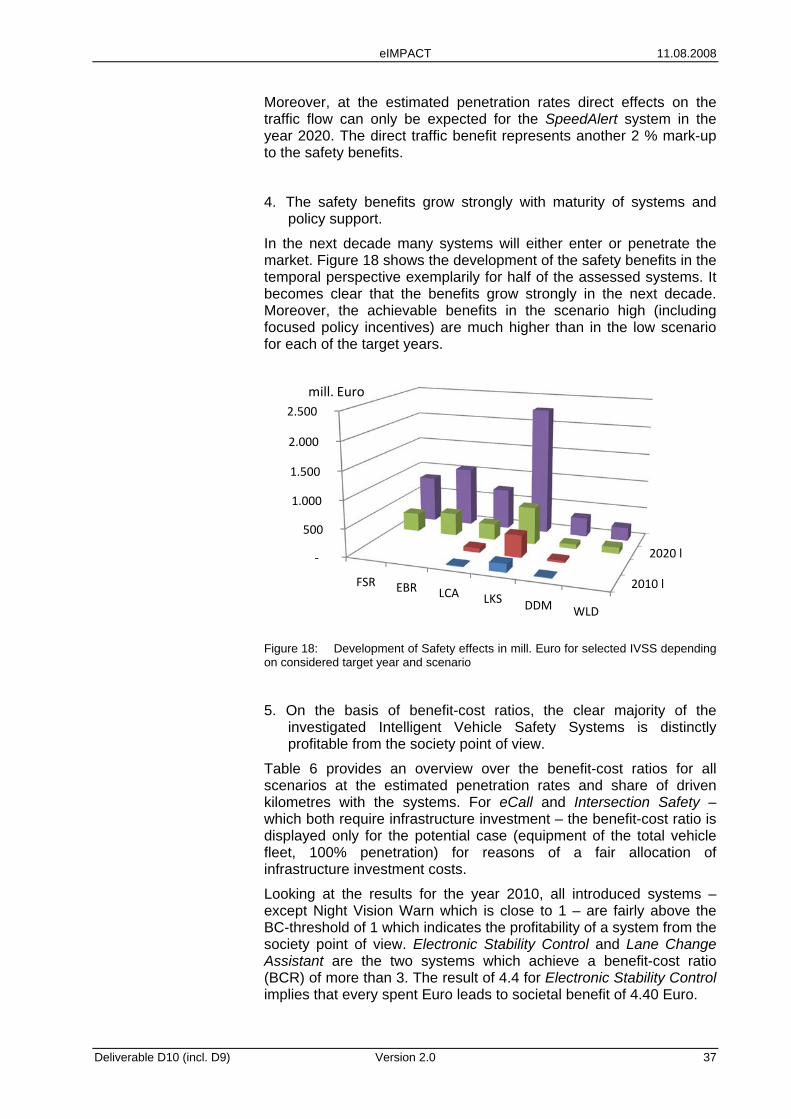
eIMPACT 11.08.2008
Moreover, at the estimated penetration rates direct effects on the traffic flow can only be expected for the SpeedAlert system in the year 2020. The direct traffic benefit represents another 2 % mark-up to the safety benefits.
4. The safety benefits grow strongly with maturity of systems and policy support.
In the next decade many systems will either enter or penetrate the market. Figure 18 shows the development of the safety benefits in the temporal perspective exemplarily for half of the assessed systems. It becomes clear that the benefits grow strongly in the next decade. Moreover, the achievable benefits in the scenario high (including focused policy incentives) are much higher than in the low scenario for each of the target years.
2010 l
2020 l‐
500
1.000
1.500
2.000
2.500
FSR EBR LCA LKS DDM WLD
mill. Euro
Figure 18: Development of Safety effects in mill. Euro for selected IVSS depending on considered target year and scenario
5. On the basis of benefit-cost ratios, the clear majority of the investigated Intelligent Vehicle Safety Systems is distinctly profitable from the society point of view.
Table 6 provides an overview over the benefit-cost ratios for all scenarios at the estimated penetration rates and share of driven kilometres with the systems. For eCall and Intersection Safety – which both require infrastructure investment – the benefit-cost ratio is displayed only for the potential case (equipment of the total vehicle fleet, 100% penetration) for reasons of a fair allocation of infrastructure investment costs.
Looking at the results for the year 2010, all introduced systems – except Night Vision Warn which is close to 1 – are fairly above the BC-threshold of 1 which indicates the profitability of a system from the society point of view. Electronic Stability Control and Lane Change Assistant are the two systems which achieve a benefit-cost ratio (BCR) of more than 3. The result of 4.4 for Electronic Stability Control implies that every spent Euro leads to societal benefit of 4.40 Euro.
Deliverable D10 (incl. D9) Version 2.0 37
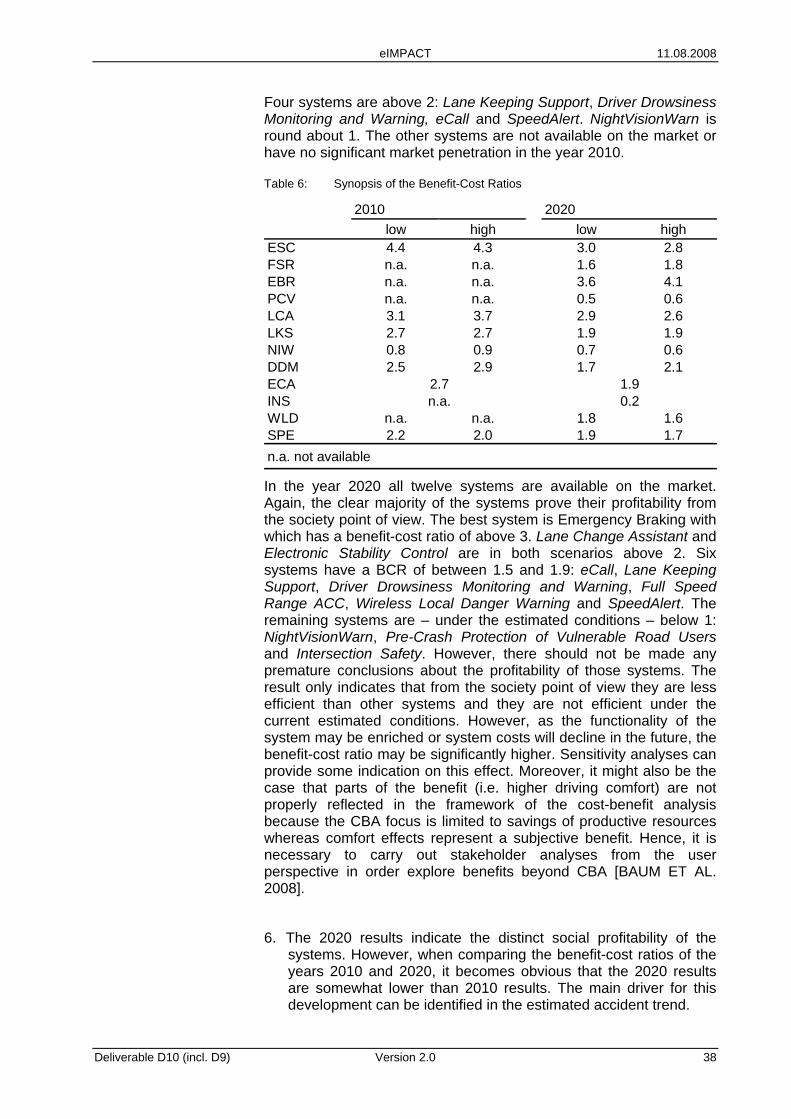
eIMPACT 11.08.2008
Four systems are above 2: Lane Keeping Support, Driver Drowsiness Monitoring and Warning, eCall and SpeedAlert. NightVisionWarn is round about 1. The other systems are not available on the market or have no significant market penetration in the year 2010.
Table 6: Synopsis of the Benefit-Cost Ratios
2010 2020low high low high
ESC 4.4 4.3 3.0 2.8FSR n.a. n.a. 1.6 1.8EBR n.a. n.a. 3.6 4.1PCV n.a. n.a. 0.5 0.6LCA 3.1 3.7 2.9 2.6LKS 2.7 2.7 1.9 1.9NIW 0.8 0.9 0.7 0.6DDM 2.5 2.9 1.7 2.1ECAINSWLD n.a. n.a. 1.8 1.6SPE 2.2 2.0 1.9 1.7n.a. not available
0.22.7 1.9n.a.
In the year 2020 all twelve systems are available on the market. Again, the clear majority of the systems prove their profitability from the society point of view. The best system is Emergency Braking with which has a benefit-cost ratio of above 3. Lane Change Assistant and Electronic Stability Control are in both scenarios above 2. Six systems have a BCR of between 1.5 and 1.9: eCall, Lane Keeping Support, Driver Drowsiness Monitoring and Warning, Full Speed Range ACC, Wireless Local Danger Warning and SpeedAlert. The remaining systems are – under the estimated conditions – below 1: NightVisionWarn, Pre-Crash Protection of Vulnerable Road Users and Intersection Safety. However, there should not be made any premature conclusions about the profitability of those systems. The result only indicates that from the society point of view they are less efficient than other systems and they are not efficient under the current estimated conditions. However, as the functionality of the system may be enriched or system costs will decline in the future, the benefit-cost ratio may be significantly higher. Sensitivity analyses can provide some indication on this effect. Moreover, it might also be the case that parts of the benefit (i.e. higher driving comfort) are not properly reflected in the framework of the cost-benefit analysis because the CBA focus is limited to savings of productive resources whereas comfort effects represent a subjective benefit. Hence, it is necessary to carry out stakeholder analyses from the user perspective in order explore benefits beyond CBA [BAUM ET AL. 2008].
6. The 2020 results indicate the distinct social profitability of the systems. However, when comparing the benefit-cost ratios of the years 2010 and 2020, it becomes obvious that the 2020 results are somewhat lower than 2010 results. The main driver for this development can be identified in the estimated accident trend.
Deliverable D10 (incl. D9) Version 2.0 38
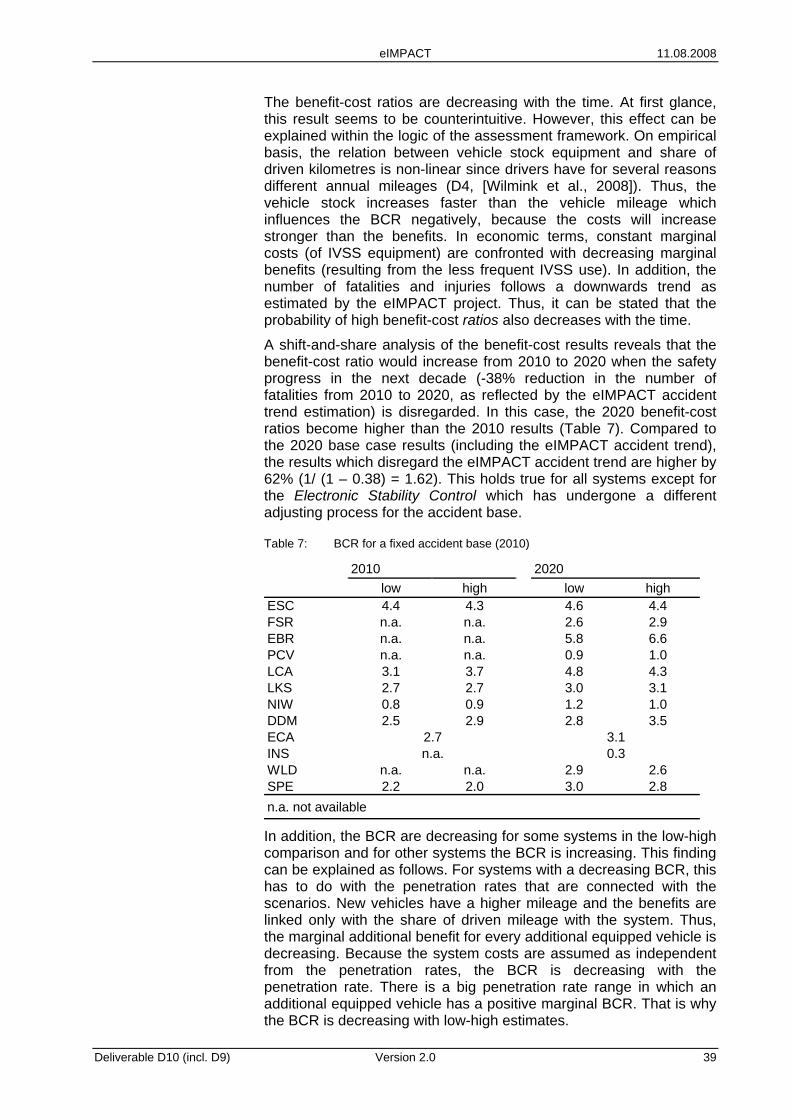
eIMPACT 11.08.2008
The benefit-cost ratios are decreasing with the time. At first glance, this result seems to be counterintuitive. However, this effect can be explained within the logic of the assessment framework. On empirical basis, the relation between vehicle stock equipment and share of driven kilometres is non-linear since drivers have for several reasons different annual mileages (D4, [Wilmink et al., 2008]). Thus, the vehicle stock increases faster than the vehicle mileage which influences the BCR negatively, because the costs will increase stronger than the benefits. In economic terms, constant marginal costs (of IVSS equipment) are confronted with decreasing marginal benefits (resulting from the less frequent IVSS use). In addition, the number of fatalities and injuries follows a downwards trend as estimated by the eIMPACT project. Thus, it can be stated that the probability of high benefit-cost ratios also decreases with the time.
A shift-and-share analysis of the benefit-cost results reveals that the benefit-cost ratio would increase from 2010 to 2020 when the safety progress in the next decade (-38% reduction in the number of fatalities from 2010 to 2020, as reflected by the eIMPACT accident trend estimation) is disregarded. In this case, the 2020 benefit-cost ratios become higher than the 2010 results (Table 7). Compared to the 2020 base case results (including the eIMPACT accident trend), the results which disregard the eIMPACT accident trend are higher by 62% (1/ (1 – 0.38) = 1.62). This holds true for all systems except for the Electronic Stability Control which has undergone a different adjusting process for the accident base.
Table 7: BCR for a fixed accident base (2010)
2010 2020low high low high
ESC 4.4 4.3 4.6 4.4FSR n.a. n.a. 2.6 2.9EBR n.a. n.a. 5.8 6.6PCV n.a. n.a. 0.9 1.0LCA 3.1 3.7 4.8 4.3LKS 2.7 2.7 3.0 3.1NIW 0.8 0.9 1.2 1.0DDM 2.5 2.9 2.8 3.5ECAINSWLD n.a. n.a. 2.9 2.6SPE 2.2 2.0 3.0 2.8n.a. not available
0.32.7 3.1n.a.
In addition, the BCR are decreasing for some systems in the low-high comparison and for other systems the BCR is increasing. This finding can be explained as follows. For systems with a decreasing BCR, this has to do with the penetration rates that are connected with the scenarios. New vehicles have a higher mileage and the benefits are linked only with the share of driven mileage with the system. Thus, the marginal additional benefit for every additional equipped vehicle is decreasing. Because the system costs are assumed as independent from the penetration rates, the BCR is decreasing with the penetration rate. There is a big penetration rate range in which an additional equipped vehicle has a positive marginal BCR. That is why the BCR is decreasing with low-high estimates.
Deliverable D10 (incl. D9) Version 2.0 39
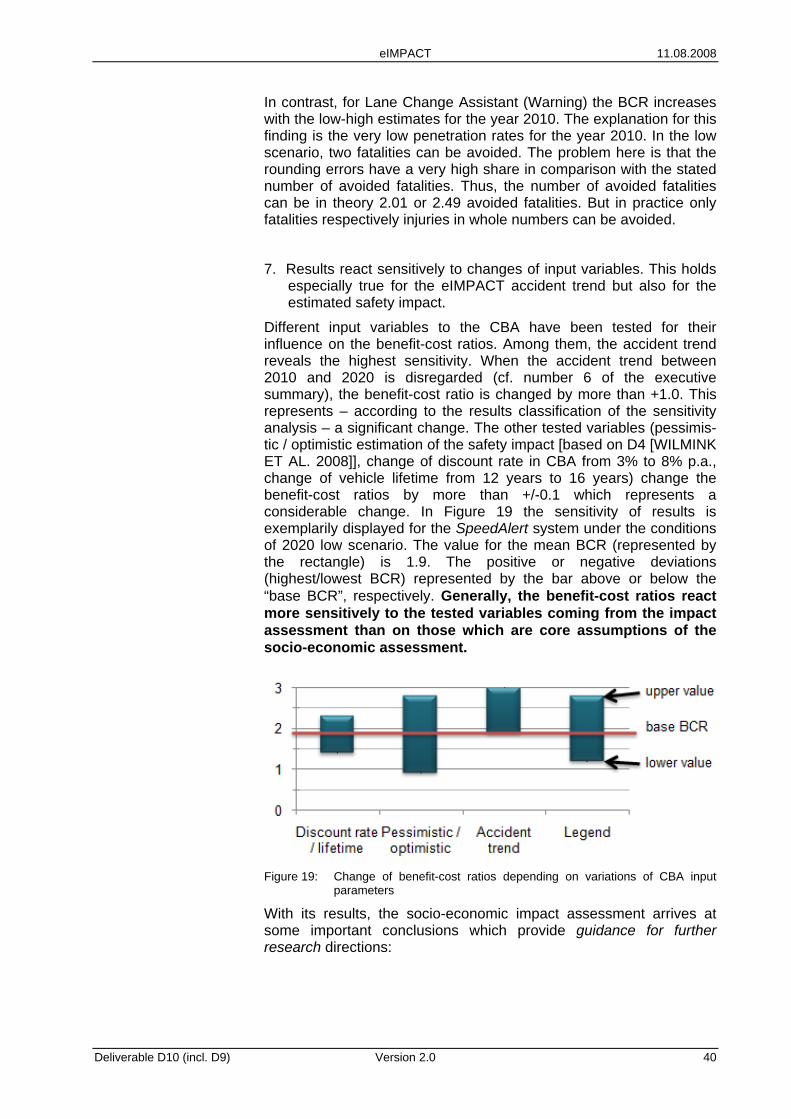
eIMPACT 11.08.2008
In contrast, for Lane Change Assistant (Warning) the BCR increases with the low-high estimates for the year 2010. The explanation for this finding is the very low penetration rates for the year 2010. In the low scenario, two fatalities can be avoided. The problem here is that the rounding errors have a very high share in comparison with the stated number of avoided fatalities. Thus, the number of avoided fatalities can be in theory 2.01 or 2.49 avoided fatalities. But in practice only fatalities respectively injuries in whole numbers can be avoided.
7. Results react sensitively to changes of input variables. This holds especially true for the eIMPACT accident trend but also for the estimated safety impact.
Different input variables to the CBA have been tested for their influence on the benefit-cost ratios. Among them, the accident trend reveals the highest sensitivity. When the accident trend between 2010 and 2020 is disregarded (cf. number 6 of the executive summary), the benefit-cost ratio is changed by more than +1.0. This represents – according to the results classification of the sensitivity analysis – a significant change. The other tested variables (pessimis-tic / optimistic estimation of the safety impact [based on D4 [WILMINK ET AL. 2008]], change of discount rate in CBA from 3% to 8% p.a., change of vehicle lifetime from 12 years to 16 years) change the benefit-cost ratios by more than +/-0.1 which represents a considerable change. In Figure 19 the sensitivity of results is exemplarily displayed for the SpeedAlert system under the conditions of 2020 low scenario. The value for the mean BCR (represented by the rectangle) is 1.9. The positive or negative deviations (highest/lowest BCR) represented by the bar above or below the “base BCR”, respectively. Generally, the benefit-cost ratios react more sensitively to the tested variables coming from the impact assessment than on those which are core assumptions of the socio-economic assessment.
Figure 19: Change of benefit-cost ratios depending on variations of CBA input parameters
With its results, the socio-economic impact assessment arrives at some important conclusions which provide guidance for further research directions:
Deliverable D10 (incl. D9) Version 2.0 40
eIMPACT 11.08.2008
8. In the deployment process of IVSS, bundling strategies will make it possible to realise synergies on the cost side.
Within the eIMPACT project, the socio-economic impact of IVSS was assessed assuming individual systems. A promising approach for the future is the evaluation of system bundles. A possible bundle would be Electronic Stability Control + Full Speed Range ACC + Emergency Braking + Pre-Crash Protection of Vulnerable Road Users. System bundles can share components, leading to cost synergies. With that, a stronger decrease of system costs might be possible. When this effect is strong enough, this would also offset the tendency to lower benefit-cost ratios in the long-term. It should be noted that this analysis has to take into account the path dependency of market introduction. This means, some advanced systems use components from predecessor systems, e.g. Emergency Braking can only be introduced when Electronic Stability Control is on board.
Prerequisite for the analysis of system bundles however is the availability of recent in-depth accident data. Foremost it must be clear how systems interact and what this implies for the safety impact (e.g. the bundle is not the sum of the impacts of individual systems). Hence, the progress in accident causation plays an important role here.
9. The socio-economic assessment of different deployment strategies represents a promising field for future research.
When technologies become mature, the research interest naturally moves from investigating the profitability of a developed system in general to the question of an adequate deployment program. This question is particularly important because IVSS are related to several deployment barriers (involving aspects of market failure such as congruency of beneficiaries and cost bearers, critical mass of systems, hold up problems in the insurance industry, deployment risks and ramping-up effects of the automotive industry). The socio-economic assessment of deployment strategies needs a broader scope than CBA. It has to consider different stakeholder perspectives (cf. D8, [Baum et al. 2008]) in its assessment methodology. Multi criteria analysis could represent an appropriate tool for evaluating deployment programs. Assessment criteria could comprise e.g. the cost-efficiency of the deployment strategy, its practicability, the benefit-cost congruency, the financial resources needed for subsidies by the public, the incentives on industrial R&D etc.
10. The robustness of CBA results can be improved by considering explicitly the occurrence probability of scenarios.
The approach of the risk analysis in eIMPACT was based on scenarios and on sensitivity analysis. This leads to a wide range of possible BCR. To make the BCR values more robust, it is necessary to determine the probability of occurrence for each scenario. With this information it is possible to get a mean and a variance for the BCR and to get the BCR for the value-at-risk, i.e. the BCR which will not be fallen below with a certain probability. An approach to calculate this distribution of BCR is the Monte-Carlo-simulation.
Deliverable D10 (incl. D9) Version 2.0 41
eIMPACT 11.08.2008
5 Stakeholder Assessment
The report, “Stakeholder Analyses for Intelligent Vehicle Safety Systems”, Deliverable 8 of eIMPACT ([Baum et al., 2008]), provides quantitative results for socio-economic impacts of IVSS from the perspective of several stakeholders (users, industry and public authorities). Together with “Impact assessment of Intelligent Vehicle Safety Systems” (D4, [Wilmink et al., 2008]) and “Cost-Benefit Analyses for stand-alone and co-operative Intelligent Vehicle Safety Systems” (D6, [Baum et al., 2008]), it forms an integrated estimate of costs and benefits of twelve IVSS which – in this report – goes beyond cost-benefit analysis (CBA) from the society point of view. A comprehensive approach was followed to generate the results. The approach made use of scientific and transparent methodologies and state-of-the-art information to generate the results.
The stakeholder assessment is also related to the report “Policy recommendations to promote selected Intelligent Vehicle Safety Systems” (D7, [Alkim et al., 2008]). It shares with D7 the distinct stakeholder perspective. However, D7 pays more attention to information collected in interviews and a policy workshop whereas this report is focused on assessing the benefits and costs of IVSS from different stakeholder perspectives.
The stakeholder assessment results follow the methodology as presented in the report “Methodological framework and database for socio-economic evaluation of Intelligent Vehicle Safety Systems” (D3, [Assing et al., 2006]). The methodology makes use of a comprehensive framework for socio-economic impact assessment which is based on the recommendations of the SEiSS study. It offers – beyond social CBA – a wider socio-economic perspective on stakeholder analyses for key interest groups (e.g. system users, OEMs and suppliers, insurance industry and public authorities).
5.1 Methodology and systems approached in stakeholder analyses The assessment scope of eIMPACT is twofold: on society level and stakeholder level. The assessment on society level proves whether the use of a particular IVSS is profitable from the viewpoint of the society in general. Cost-benefit analysis proves whether the welfare of the society is improved or not, regardless of the fact who profits and who does not. In contrast to this position, the assessment on stakeholder level takes into account who (i.e. which societal group) bears the costs and who incurs the upcoming benefits.
Stakeholder analyses can overcome the shortcoming of the aggrega-ted society perspective. It may occur that the benefit-cost ratio (BCR) indicates the system profitability from the society point of view. From the user perspective the picture may be however quite different:
• The costs for the investment in IVSS have to be borne by the users. Then the relevant cost figure is not the cost price (what the OEM has to pay to its supplier) but the market price (what the end user has to pay). As a rule of thumb, it can be stated that cost prices have to be multiplied with factor 3 to come to market prices and vice versa.
Deliverable D10 (incl. D9) Version 2.0 42
eIMPACT 11.08.2008
• In contrast to private investment, benefits apply on society level, at least partially. Consider a system which generates also traffic flow effects (e.g. Adaptive Cruise Control, Speed Alert). When traffic flow becomes more homogeneous, fuel consumption, pollution and CO2-emissions can be reduced. The latter two effects however occur on society level. They originate from private investments but third parties incur the benefits. Hence, it is a case of external effects (my cost – your benefit). Under these conditions the market mechanism does not work properly.
The stakeholder perspective is not only important from the user perspective. There are more factors which are crucial for the success of IVSS deployment:
• Some of the systems, especially cooperative systems, are characterized by the phenomenon of critical mass. Before this threshold is reached, they will not generate benefits.
• In addition, cooperative systems need also investment in roadside infrastructure to ensure communication between vehicles (v2v) and the infrastructure (v2i). This investment has to be made by public authorities or infrastructure operators. Therefore, introducing cooperative systems will become a complicated case for public-private partnership.
• Although the market introduction of IVSS offers business perspectives for OEMs and suppliers, there are also considerable risks. These risks are related to financial issues (payoff of high research and development costs, risk of call back campaigns) and legal constraints (e.g. product liability, tort liability).
• Insurance companies can potentially play an active role in the market introduction process. Lowering insurance premiums can represent a buying incentive for users. It has to be considered that insurance companies usually require ex-post proven reductions of accidents and severities as a prerequisite for premium reductions. Hence, a hold up problem exists for insurance companies. It becomes clear that it is important to address them as a key stakeholder.
The stakeholder analysis has to reflect these problems and make the benefits and costs on individual level transparent. It does so by disaggregating the socio-economic impacts of IVSS to different groups which are key actors in the process of IVSS deployment. To reflect these research needs, it was necessary to develop an extended assessment framework. This was done by incorporating assessment methods suitable for stakeholder analysis. Figure 20 provides an overview over the broader assessment framework.
Deliverable D10 (incl. D9) Version 2.0 43
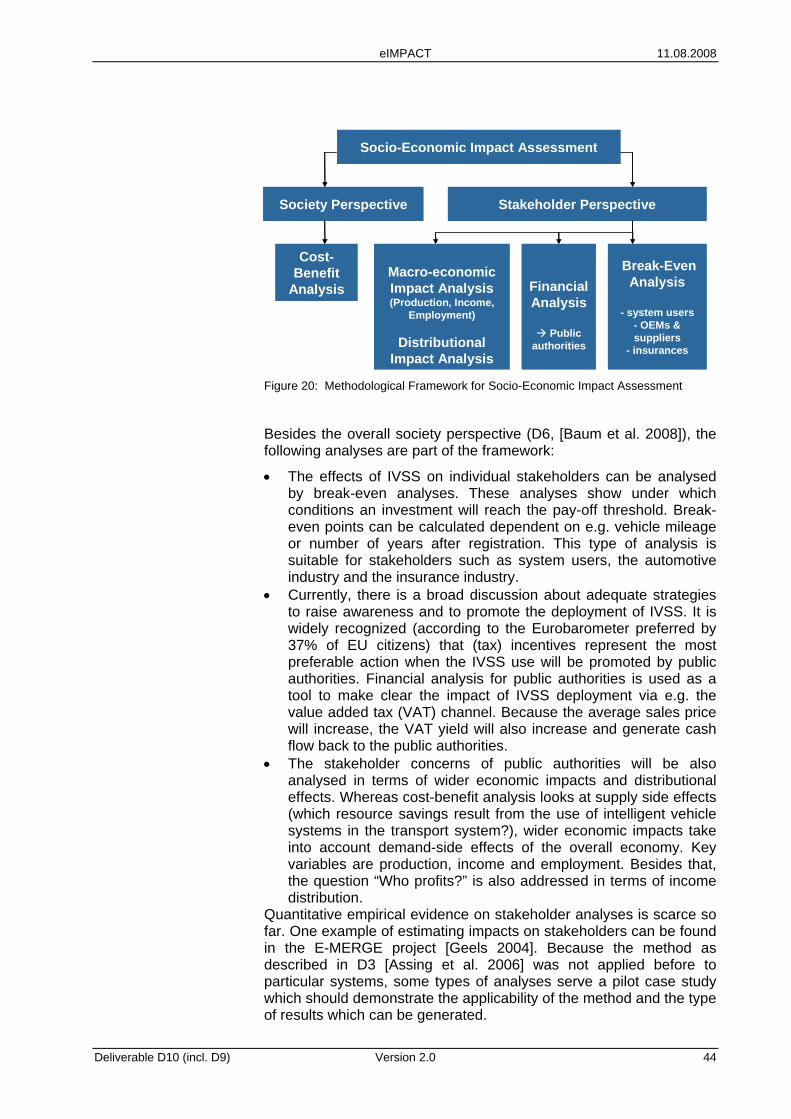
eIMPACT 11.08.2008
Figure 20: Methodological Framework for Socio-Economic Impact Assessment
Besides the overall society perspective (D6, [Baum et al. 2008]), the following analyses are part of the framework:
Society Perspective Stakeholder Perspective
Socio-Economic Impact Assessment
Macro-economic Impact Analysis(Production, Income,
Employment)
Distributional Impact Analysis
Cost-Benefit
Analysis
Break-Even Analysis
- system users- OEMs & suppliers
- insurances
Financial Analysis
Public authorities
Society Perspective Stakeholder Perspective
Socio-Economic Impact Assessment
Macro-economic Impact Analysis(Production, Income,
Employment)
Distributional Impact Analysis
Cost-Benefit
Analysis
Break-Even Analysis
- system users- OEMs & suppliers
- insurances
Financial Analysis
Public authorities
• The effects of IVSS on individual stakeholders can be analysed by break-even analyses. These analyses show under which conditions an investment will reach the pay-off threshold. Break-even points can be calculated dependent on e.g. vehicle mileage or number of years after registration. This type of analysis is suitable for stakeholders such as system users, the automotive industry and the insurance industry.
• Currently, there is a broad discussion about adequate strategies to raise awareness and to promote the deployment of IVSS. It is widely recognized (according to the Eurobarometer preferred by 37% of EU citizens) that (tax) incentives represent the most preferable action when the IVSS use will be promoted by public authorities. Financial analysis for public authorities is used as a tool to make clear the impact of IVSS deployment via e.g. the value added tax (VAT) channel. Because the average sales price will increase, the VAT yield will also increase and generate cash flow back to the public authorities.
• The stakeholder concerns of public authorities will be also analysed in terms of wider economic impacts and distributional effects. Whereas cost-benefit analysis looks at supply side effects (which resource savings result from the use of intelligent vehicle systems in the transport system?), wider economic impacts take into account demand-side effects of the overall economy. Key variables are production, income and employment. Besides that, the question “Who profits?” is also addressed in terms of income distribution.
Quantitative empirical evidence on stakeholder analyses is scarce so far. One example of estimating impacts on stakeholders can be found in the E-MERGE project [Geels 2004]. Because the method as described in D3 [Assing et al. 2006] was not applied before to particular systems, some types of analyses serve a pilot case study which should demonstrate the applicability of the method and the type of results which can be generated.
Deliverable D10 (incl. D9) Version 2.0 44
eIMPACT 11.08.2008
Given these boundary conditions, stakeholder analyses were only carried out for a limited set of systems. In total, five Intelligent Vehicle Safety Systems were selected by the eIMPACT consortium (in the December 2007 consortium meeting) for stakeholder analysis. The selection was done based on several criteria which should ensure a rational based selection. The criteria used were:
• Maturity of systems: because some types of stakeholder analysis require an advanced market penetration in order to show effects,
• Leverage effect – impact per system: system with high safety impact are generally more attractive to users,
• Complexity of market introduction: most interesting and challenging to the analysis are systems with multi-stakeholder involvement in the deployment process.
Guided by these criteria, the following systems were assigned to the different types of stakeholder analysis:
• Break-even analysis: Electronic Stability Control (ESC), Emergency Braking (EBR), Lane Keeping Support (LKS), eCall (ECA) and SpeedAlert (SPE),
• Financial analysis: Electronic Stability Control (ESC), Emergency Braking (EBR),
• Wider economic impacts (employment effects and distributional incidence): Electronic Stability Control (ESC).
In terms of calculation process the break-even analyses are carried out quite similar to the cost-benefit analyses (D6, [Baum et al. 2008]. However, because of the different assessment perspective (i.e. user benefits and costs) there are few remarkable differences to be noted:
• The users are distinguished into six user groups according to the annual kilometres they drive in their vehicles.
• The cost side of the assessment is provided by the market price which end users face instead of the cost price. The industry rule of thumb of about factor 3 between cost prices and market prices is also applied here.
• Benefits result mostly from the reduced risk of getting involved in an injury or fatal accident. As opposed to the CBA where the damage cost approach is applied, the preference to be safer underway is reflected in the safety appraisal by the willingness-to-pay value. Evidence suggests that these values are fundamentally higher than damage cost values.
• Instead of providing a benefit-cost ratio (as is done in CBA) the result is provided as a pay-off period (break-even point in years) or a threshold in terms of vehicle kilometres.
The analysis of wider economic impacts and fiscal effects requires an additional set of information. Crucial for this type of assessment are production values, input-output relations between industries, tax quotas etc. Based on this information it is possible to provide range estimates for the employment, fiscal and distributional effects.
Since this represents pioneering work in the field of IVSS, the results were only calculated for Electronic Stability Control and Emergency Braking (see above).
Deliverable D10 (incl. D9) Version 2.0 45
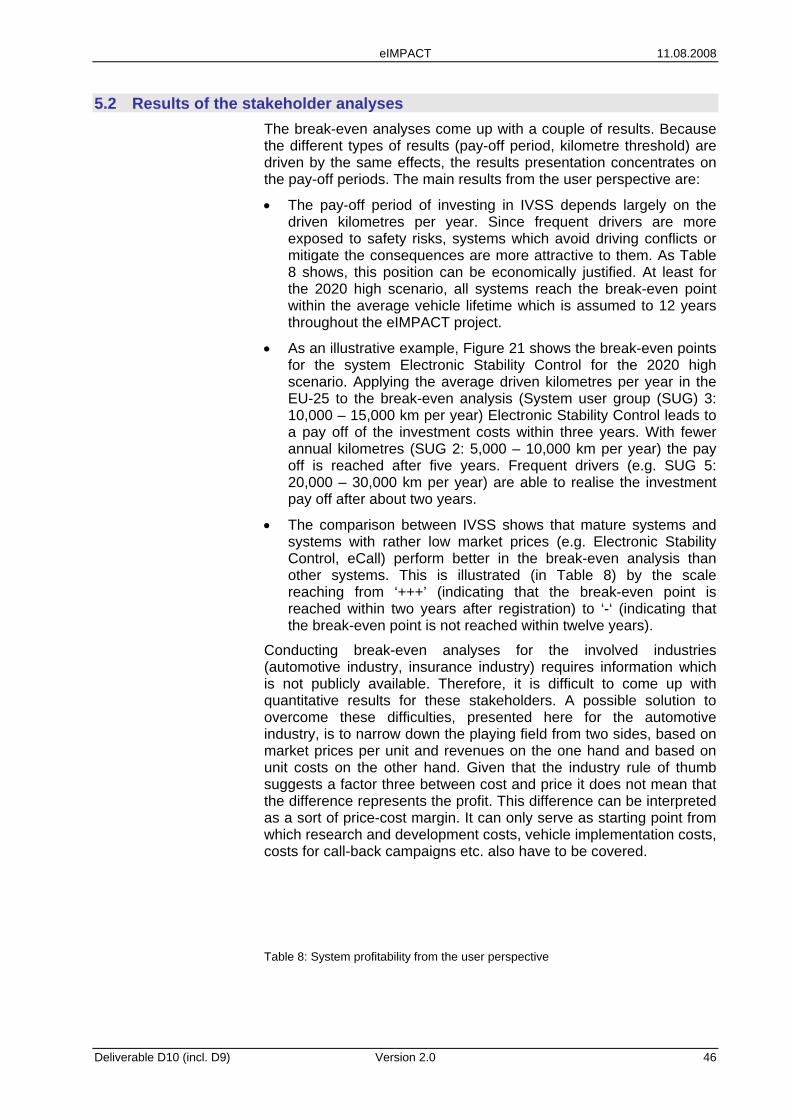
eIMPACT 11.08.2008
5.2 Results of the stakeholder analyses The break-even analyses come up with a couple of results. Because the different types of results (pay-off period, kilometre threshold) are driven by the same effects, the results presentation concentrates on the pay-off periods. The main results from the user perspective are:
• The pay-off period of investing in IVSS depends largely on the driven kilometres per year. Since frequent drivers are more exposed to safety risks, systems which avoid driving conflicts or mitigate the consequences are more attractive to them. As Table 8 shows, this position can be economically justified. At least for the 2020 high scenario, all systems reach the break-even point within the average vehicle lifetime which is assumed to 12 years throughout the eIMPACT project.
• As an illustrative example, Figure 21 shows the break-even points for the system Electronic Stability Control for the 2020 high scenario. Applying the average driven kilometres per year in the EU-25 to the break-even analysis (System user group (SUG) 3: 10,000 – 15,000 km per year) Electronic Stability Control leads to a pay off of the investment costs within three years. With fewer annual kilometres (SUG 2: 5,000 – 10,000 km per year) the pay off is reached after five years. Frequent drivers (e.g. SUG 5: 20,000 – 30,000 km per year) are able to realise the investment pay off after about two years.
• The comparison between IVSS shows that mature systems and systems with rather low market prices (e.g. Electronic Stability Control, eCall) perform better in the break-even analysis than other systems. This is illustrated (in Table 8) by the scale reaching from ‘+++’ (indicating that the break-even point is reached within two years after registration) to ‘-‘ (indicating that the break-even point is not reached within twelve years).
Conducting break-even analyses for the involved industries (automotive industry, insurance industry) requires information which is not publicly available. Therefore, it is difficult to come up with quantitative results for these stakeholders. A possible solution to overcome these difficulties, presented here for the automotive industry, is to narrow down the playing field from two sides, based on market prices per unit and revenues on the one hand and based on unit costs on the other hand. Given that the industry rule of thumb suggests a factor three between cost and price it does not mean that the difference represents the profit. This difference can be interpreted as a sort of price-cost margin. It can only serve as starting point from which research and development costs, vehicle implementation costs, costs for call-back campaigns etc. also have to be covered.
Table 8: System profitability from the user perspective
Deliverable D10 (incl. D9) Version 2.0 46
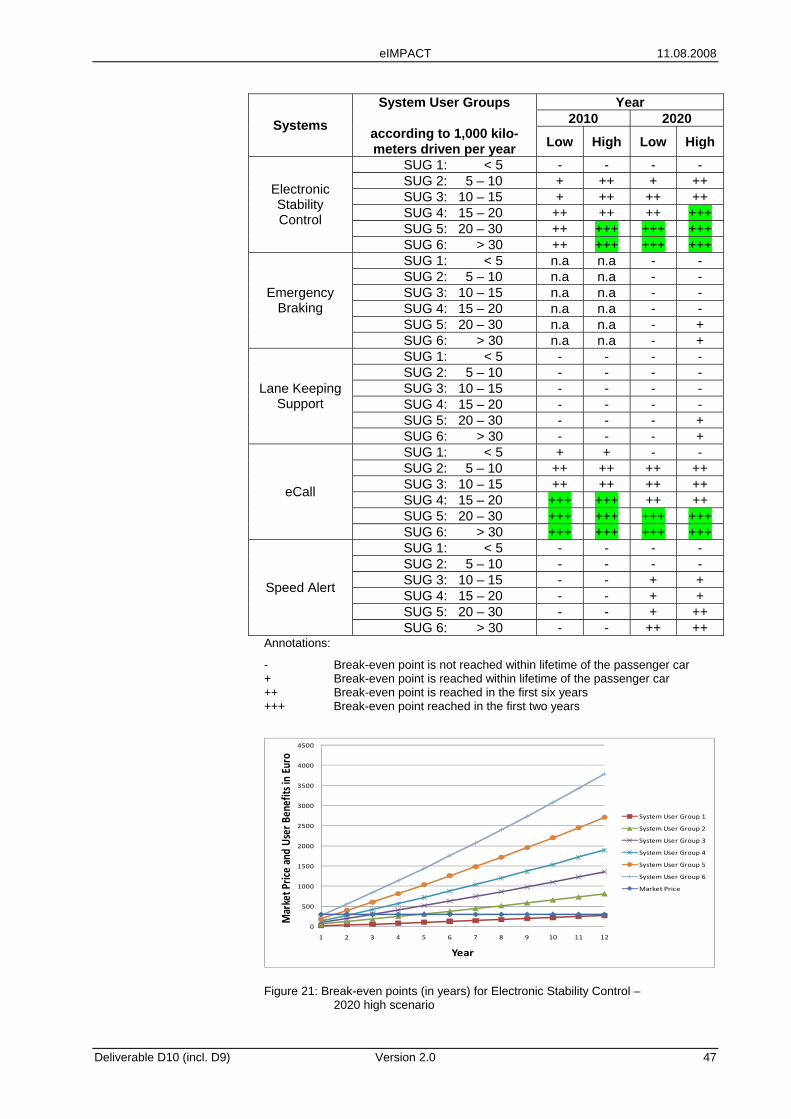
eIMPACT 11.08.2008
Year 2010 2020 Systems
System User Groups
according to 1,000 kilo-meters driven per year Low High Low High
SUG 1: < 5 - - - - SUG 2: 5 – 10 + ++ + ++ SUG 3: 10 – 15 + ++ ++ ++ SUG 4: 15 – 20 ++ ++ ++ +++ SUG 5: 20 – 30 ++ +++ +++ +++
Electronic Stability Control
SUG 6: > 30 ++ +++ +++ +++ SUG 1: < 5 n.a n.a - - SUG 2: 5 – 10 n.a n.a - - SUG 3: 10 – 15 n.a n.a - - SUG 4: 15 – 20 n.a n.a - - SUG 5: 20 – 30 n.a n.a - +
Emergency Braking
SUG 6: > 30 n.a n.a - + SUG 1: < 5 - - - - SUG 2: 5 – 10 - - - - SUG 3: 10 – 15 - - - - SUG 4: 15 – 20 - - - - SUG 5: 20 – 30 - - - +
Lane Keeping Support
SUG 6: > 30 - - - + SUG 1: < 5 + + - - SUG 2: 5 – 10 ++ ++ ++ ++ SUG 3: 10 – 15 ++ ++ ++ ++ SUG 4: 15 – 20 +++ +++ ++ ++ SUG 5: 20 – 30 +++ +++ +++ +++
eCall
SUG 6: > 30 +++ +++ +++ +++ SUG 1: < 5 - - - - SUG 2: 5 – 10 - - - - SUG 3: 10 – 15 - - + + SUG 4: 15 – 20 - - + + SUG 5: 20 – 30 - - + ++
Speed Alert
SUG 6: > 30 - - ++ ++ Annotations:
- Break-even point is not reached within lifetime of the passenger car + Break-even point is reached within lifetime of the passenger car ++ Break-even point is reached in the first six years +++ Break-even point reached in the first two years
0
500
1000
1500
2000
2500
3000
3500
4000
4500
1 2 3 4 5 6 7 8 9 10 11 12
Market P
rice and Us
er Ben
efits in
Euro
Year
System User Group 1
System User Group 2
System User Group 3
System User Group 4
System User Group 5
System User Group 6
Market Price
Figure 21: Break-even points (in years) for Electronic Stability Control – 2020 high scenario
Deliverable D10 (incl. D9) Version 2.0 47
eIMPACT 11.08.2008
The assessment of wider economic impacts (employment, fiscal, and income distribution effects) led to the following main results:
• The production of Electronic Stability Control represents a considerable employment factor in the national and the European economy. In the year 2010, about 3 million new vehicles will be ESC-equipped in Germany. This corresponds to a sales volume of about 1 bn EUR and a production value (direct and indirect production) of about 2 bn EUR. The direct and indirect effects on employment that result from production and implementation of ESC in the year 2010 amount to about 10,000 employees. As scenarios were also considered here, the range is between 8,800 (scenario low) and 10,500 (scenario high) employees. Scaling up the results to the EU-25 (target year 2010) this would imply employment effects between 27,000 (scenario low) and 40,000 (scenario high) employees.
• The fiscal revenues from the market penetration of Electronic Stability Control and Emergency Braking – which were calculated for the year 2020 – amount to a range between 131 million EUR (scenario low) and 179 million EUR (scenario high). A comparable calculation on European level would end up with a range between 662 million EUR (scenario low) and about 1,026 million EUR (scenario high).
• Concerning income distribution no clear picture of effects can be found. However, it can be shown that especially households with more than one person and an average income receive higher shares of the benefit than they bear through the costs of IVSS.
The performance of stakeholder analyses offers some views and perspectives on this type of analysis:
• Generally, stakeholder analyses represent a useful tool for assessing the socio-economic impacts of Intelligent Vehicle Safety Systems. They cannot replace information provided by (social) cost-benefit analysis but complement it. This is helpful in assessing potential barriers to deployment.
• Since many stakeholders play a role in facilitating the IVSS market introduction, it is important to address in the first instance the most important and most proactive stakeholder groups. In this light, it is a more useful approach to look first at the complete picture of stakeholders and in the second step to select the objects for the analysis. More specifically, the in-depth analysis of user perspectives is a clear must. Although there is currently still some lack of awareness, the users are the group who finally has to pay for the systems and services. Therefore, they are in the center of the whole deployment process. The automotive industry will follow their roadmaps to bring these technologies to market anyway. The insurance industry will likely use premium reductions only as a marketing instrument.
The forthcoming Field Operational Tests provide an unique opportunity to collect information also on user perception, willingness-to-pay (specifically for the tested systems but also for safer road transport in general), the value of higher comfort etc. The quality of input data for stakeholder analyses would largely benefit from these accompanying research activities.
Deliverable D10 (incl. D9) Version 2.0 48
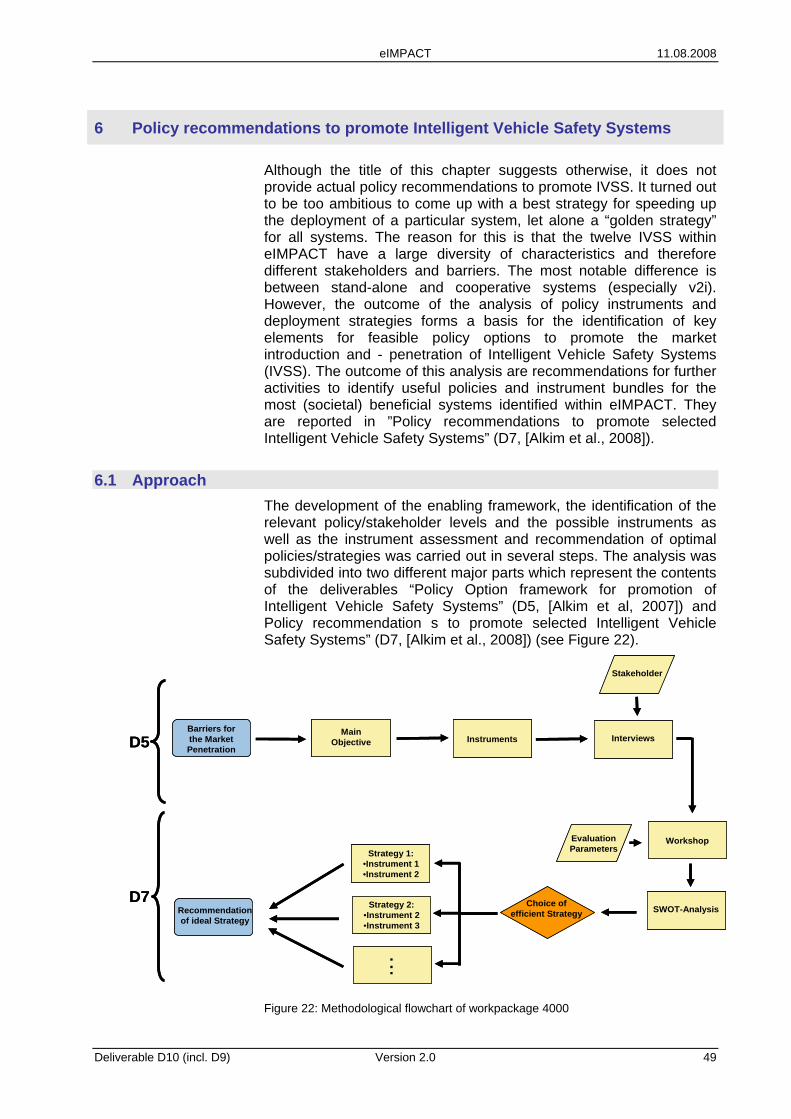
eIMPACT 11.08.2008
6 Policy recommendations to promote Intelligent Vehicle Safety Systems
Although the title of this chapter suggests otherwise, it does not provide actual policy recommendations to promote IVSS. It turned out to be too ambitious to come up with a best strategy for speeding up the deployment of a particular system, let alone a “golden strategy” for all systems. The reason for this is that the twelve IVSS within eIMPACT have a large diversity of characteristics and therefore different stakeholders and barriers. The most notable difference is between stand-alone and cooperative systems (especially v2i). However, the outcome of the analysis of policy instruments and deployment strategies forms a basis for the identification of key elements for feasible policy options to promote the market introduction and - penetration of Intelligent Vehicle Safety Systems (IVSS). The outcome of this analysis are recommendations for further activities to identify useful policies and instrument bundles for the most (societal) beneficial systems identified within eIMPACT. They are reported in ”Policy recommendations to promote selected Intelligent Vehicle Safety Systems” (D7, [Alkim et al., 2008]).
6.1 Approach The development of the enabling framework, the identification of the relevant policy/stakeholder levels and the possible instruments as well as the instrument assessment and recommendation of optimal policies/strategies was carried out in several steps. The analysis was subdivided into two different major parts which represent the contents of the deliverables “Policy Option framework for promotion of Intelligent Vehicle Safety Systems” (D5, [Alkim et al, 2007]) and Policy recommendation s to promote selected Intelligent Vehicle Safety Systems” (D7, [Alkim et al., 2008]) (see Figure 22).
Barriers for the Market Penetration
Main Objective Instruments
Stakeholder
SWOT-Analysis
Evaluation Parameters
Recommendation of ideal Strategy
...
Strategy 1:•Instrument 1•Instrument 2
Strategy 2:•Instrument 2•Instrument 3
Choice of efficient Strategy
Interviews
Workshop
D5
D7
Barriers for the Market Penetration
Main Objective Instruments
Stakeholder
SWOT-Analysis
Evaluation Parameters
Recommendation of ideal Strategy
...
Strategy 1:•Instrument 1•Instrument 2
Strategy 2:•Instrument 2•Instrument 3
Choice of efficient Strategy
Interviews
Workshop
D5
D7
Figure 22: Methodological flowchart of workpackage 4000
Deliverable D10 (incl. D9) Version 2.0 49
eIMPACT 11.08.2008
The process began with the identification of potential barriers for market deployment of IVSS. The inspection of these barriers was necessary to detect the stakeholders who are affected most and to generate a strategy containing adequate measures or instruments to overcome such obstacles. Four different categories of barriers were differentiated here (user related, economic, technological, legal/governmental).
Additionally, the barrier examination provided valuable information about the relevant stakeholders. The main stakeholders involved in the implementation process were described. According to the identified stakeholder and the assignment inside the implementation process, 14 different instruments for boosting the market penetration rate were illustrated on the basis of past application (e.g. awareness campaigns, cooperative research, tax reductions etc.). Initially, each instrument’s general design and functionality was specified. In addition, examples from the past use either in the road safety sector or in similar and transferable application areas are presented.
In order to ensure that the main stakeholders and the appropriate instruments were found, a short questionnaire was composed. On the basis of this questionnaire, 60 stakeholders in eight countries were individually interviewed to investigate their possibilities and experiences with the varying instruments to stimulate and influence the penetration of IVSS on the market. In addition, the stakeholders were asked to rate the suitability of the instruments.
The main findings of the conducted interviews about the variety of instruments, past application experiences as well as the overall perception of the effectiveness provided valuable input for the preparation of a stakeholder workshop. This one day workshop was held in Utrecht, The Netherlands on February 26th where 35 participants from 11 countries worked together to identify key elements for deployment strategies for two specific IVSS, Lane Keeping Support and SpeedAlert. These two systems were chosen because they had high scores in the cost benefit analyses and they represent a lateral and longitudinal support system as well as a stand-alone and a cooperative system.
Based on the findings at the workshop, a SWOT-analysis was conducted in order to point out, for each instrument and/or instrument bundle, its strengths, weaknesses, opportunities and threats. After this analysis, the choice of the most efficient implementation support strategy for certain safety devices was performed.
Finally, recommendations for the ideal implementation strategies to promote and support the market penetration of specific kinds of IVSS regarding the involved stakeholders and their possibilities were set up.
6.2 Results The main stakeholders and the instruments available to them were identified.
The IVSS market is influenced by a variety of stakeholders. The main groups of stakeholders were examined from the supply and demand side.
Deliverable D10 (incl. D9) Version 2.0 50

eIMPACT 11.08.2008
In the case of IVSS, the supply side consists of the OEMs and several suppliers regarding the development and production of the IVSS, the infrastructure equipment and communication issues for cooperative systems. On the demand side, single users, institutional/corporate customers like rental fleet operators or driving schools and public/private infrastructure operators are distinguished. The category supplementary stakeholders including driver associations, road freight organisations, insurance companies, governmental institutions etc. has only indirect effects on the IVSS market since it can influence either the supply or demand side to produce or buy the systems.
Table 9 presents the set of instruments discussed with the stakeholders and used in the workshop. It also provides a brief description of each instrument.
Table 9: Instruments explored in the stakeholder interviews and workshop
Instruments Description
Awareness campaigns Use of different media channels to provide information on benefits and system function in order to improve user awareness and understanding
Advertising media Promotion of system via different media channels
Driver education / training Driver information and education about systems and training how to use them
Cooperative research Research conducted in the cooperation among various organisations in order to achieve more valid results.
Awards Use of awards to label products to convince customers to use or buy the system
Field operational tests To verify the functions and benefits of a specific system under real conditions in large-scale and/or long-term use
System as standard equipment The OEMs voluntarily provide the systems in all vehicles
Discounts Offering the system at a reduced price (due to packaging, large sales volume, etc.) by the industry to consumer
Direct subsidies Public body provides financial support for development or production of the system
Tax reduction Financial compensation in terms of reduced tax by public body to consumer
Insurance premium reduction Financial compensation in terms of reduced premium
Voluntary agreement bilateral or multilateral (nonbinding) agreement between stakeholders to cooperate in the deployment of the systems
Legislative mandatory equipment
The OEMs are obliged by law to provide the systems in a specific type of vehicle
Cooperative support action Multi stakeholder cooperation that is aimed at solving implementation issues (example: eSafety forum, COMeSafety)
A main finding of the stakeholder interviews is that there is a difference between the instrument used by stakeholders and their views of the effectiveness of the instruments. One example of the overall set of findings is:
Deliverable D10 (incl. D9) Version 2.0 51

eIMPACT 11.08.2008
The top 5 of instruments perceived as most effective is:
1. Legislative mandatory equipment
2. System as standard equipment instead of optional
3. Insurance premium reduction
4. Tax reductions
5. Awareness campaigns
Remarkably, this top 5 is quite different from the top 5 of instruments most used by the interviewed stakeholders:
1. Awareness campaigns
2. Cooperative research
3. Driver education – driver training
4. Field Operational Tests
5. Advertising Media
Only awareness campaigns are mentioned in both lists.
The list of instruments formed input to the stakeholder workshop.
The one-day workshop applied a methodology for bringing together all stakeholder groups involved in deployment of IVSS. At the workshop, the stakeholders went through the three-step methodology for identifying elements of a deployment strategy:
1. Rate instruments: per stakeholder group, the suitability of a particular instrument for accelerated deployment of a particular IVSS was rated. The result was the relative perceived suitability of the instrument by stakeholder for each IVSS
2. Select instruments: each stakeholder group selects the instruments that it can use to speed up the deployment of a particular IVSS. The result was a list of available instruments
3. Weigh evaluation parameters and grade instruments: for each stakeholder group, the result is the viability of an instrument for each particular stakeholder group for a particular IVSS
The evaluation parameters were: perceived willingness to pay (of the end-users), price of the system, financial risk of business case, technical interoperability, code of practice, infrastructure investment, organisational aspects.
Table 10 provides an overview of the viability of the different instruments for the Lane Keeping System by stakeholder group.
Deliverable D10 (incl. D9) Version 2.0 52
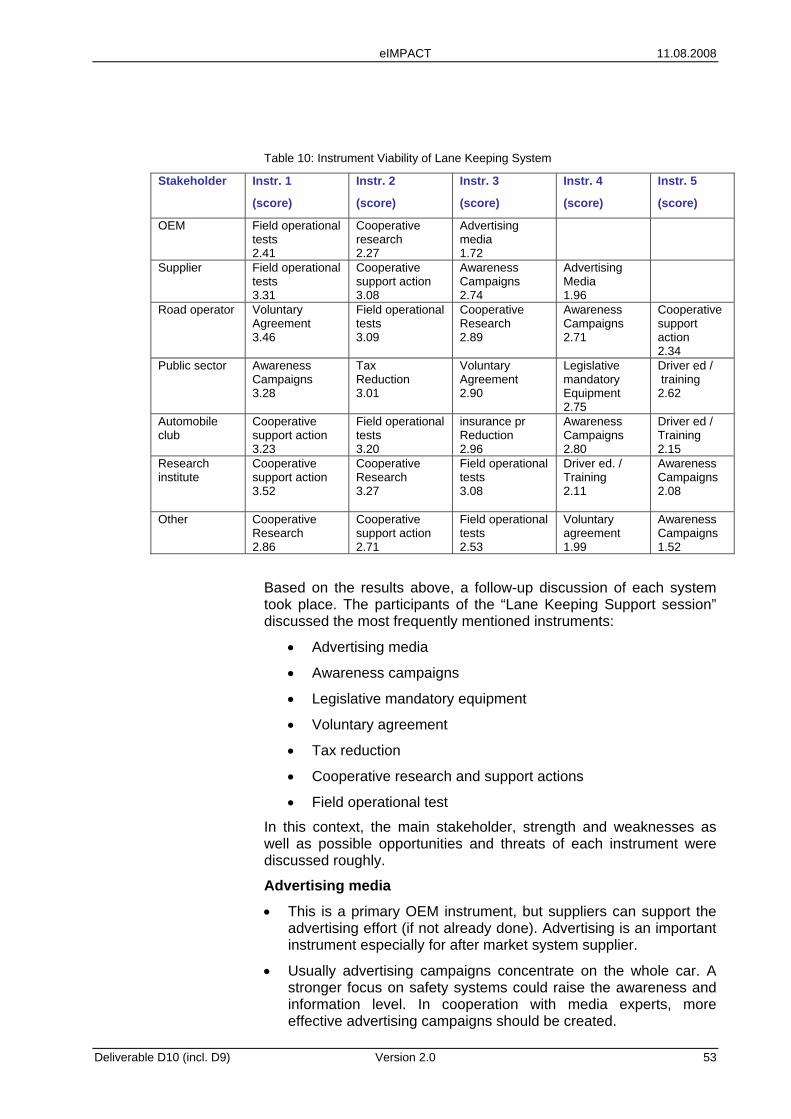
eIMPACT 11.08.2008
Table 10: Instrument Viability of Lane Keeping System
Stakeholder Instr. 1
(score)
Instr. 2
(score)
Instr. 3
(score)
Instr. 4
(score)
Instr. 5
(score)
OEM Field operational tests 2.41
Cooperative research 2.27
Advertising media 1.72
Supplier Field operational tests 3.31
Cooperative support action 3.08
Awareness Campaigns 2.74
Advertising Media 1.96
Road operator Voluntary Agreement 3.46
Field operational tests 3.09
Cooperative Research 2.89
Awareness Campaigns 2.71
Cooperative support action 2.34
Public sector Awareness Campaigns 3.28
Tax Reduction 3.01
Voluntary Agreement 2.90
Legislative mandatory Equipment 2.75
Driver ed / training 2.62
Automobile club
Cooperative support action 3.23
Field operational tests 3.20
insurance pr Reduction 2.96
Awareness Campaigns 2.80
Driver ed / Training 2.15
Research institute
Cooperative support action 3.52
Cooperative Research 3.27
Field operational tests 3.08
Driver ed. / Training 2.11
Awareness Campaigns 2.08
Other Cooperative Research 2.86
Cooperative support action 2.71
Field operational tests 2.53
Voluntary agreement 1.99
Awareness Campaigns 1.52
Based on the results above, a follow-up discussion of each system took place. The participants of the “Lane Keeping Support session” discussed the most frequently mentioned instruments:
• Advertising media
• Awareness campaigns
• Legislative mandatory equipment
• Voluntary agreement
• Tax reduction
• Cooperative research and support actions
• Field operational test
In this context, the main stakeholder, strength and weaknesses as well as possible opportunities and threats of each instrument were discussed roughly.
Advertising media
• This is a primary OEM instrument, but suppliers can support the advertising effort (if not already done). Advertising is an important instrument especially for after market system supplier.
• Usually advertising campaigns concentrate on the whole car. A stronger focus on safety systems could raise the awareness and information level. In cooperation with media experts, more effective advertising campaigns should be created.
Deliverable D10 (incl. D9) Version 2.0 53

eIMPACT 11.08.2008
• Advertising in contrast to awareness campaigns are focused on selling a product. Therefore, advertising is main instrument of the industry.
Awareness campaigns
• “Neutral” organization should establish and provide awareness campaigns.
• In order to guarantee no advertising influence by OEMs and suppliers, the public sector should be the initiator and financier. Information has to be trustworthy from a customers point of view.
• Research institutes can deliver valuable input for selecting the right systems and/or functionalities which should be highlighted and promoted.
• Controversially discussed proposal: a non-profit consumer organisation should be created which is conducting independent tests of different products.
Legislative mandatory equipment
• Representative from public sector found this instrument effective to enhance deployment, but saw a couple of disadvantages for the use of it.
• In general (agreed upon all stakeholders), legislation is the last option to raise the market penetration of IVSS. In a market based society, supply and demand side should decide what is produced and bought respectively.
• Administrative process to create and implement a law takes a long time.
• System benefits and cost have to be very clear before a certain system is declared as mandatory.
• Higher prices due to additional costs for manufacturers could lead to slower renewal of the vehicle fleet if customers decide to use old vehicles longer. This has a bad influence on the overall safety level.
• Finally, for Lane keeping support a legislative mandatory equipment is at least for the next ten years not realistic.
Voluntary agreement
• This instrument is in general a step or method to avoid legislative measures. Therefore, it is used before the legislative mandatory equipment.
• Potential problem is the number of participants in an agreement. Also, industry usually regards their own business case while setting up an agreement.
• Same situation for voluntary agreement as for legislative mandatory equipment: it is too early in the market deployment process to reach such an agreement without having certain standards.
• If voluntary agreement should be reached it would be more useful for trucks in the beginning.
Deliverable D10 (incl. D9) Version 2.0 54

eIMPACT 11.08.2008
Tax reductions
• In general, this instrument has high potential, see example Denmark (tax reductions work better in high-taxation countries). Should be used to improve safety level very quickly.
• More effective for heavy vehicles.
• Application of a tax reduction for Lane Keeping Support will increase the end-user awareness for such a system and safety in general.
• Government needs sound information base of the system and its benefits, in order to guarantee not to waste money. Public budget is limited.
• Tax reductions should be used only for a short period. Long term grant is just waste of money.
Cooperative research and cooperative support action
• These are only supportive measures.
• Public side should take the lead with support by OEMs, suppliers, research institutes…
• Public sector should raise its financial budget for cooperative research and support actions. Support of 50% cost recovery for private (industry) stakeholders is too low.
• Cooperative research should be on a more scientific level and give more than just information, standardization. Cooperative support actions can be carried out like eSafety Forum.
Field operational tests
• FOTs should test the acceptance and the impact of the system on traffic and safety.
• Public sector has to take the leading and conducting role in cooperation with other stakeholders (OEMs, suppliers, automobile clubs).
• Public sector has to carry the main financial burden of FOTs. Therefore, the government should spent more money for the use of this instrument.
• From the results of the stakeholder workshop various strategies can be formulated based on the matrices such as in Table 10. From these results, a strategy could be constructed using a combination of stakeholders and instruments. Arguments for choosing a combination could be, for instance:
- The more often instruments are mentioned, the more likely they are to appear in a strategy,
- The higher the numerical value of an instrument, the more proactive the stakeholder will be
Different strategies which can be applied for a better deployment of Lane Keeping Support can be gathered from the information from the workshop in Utrecht.
A possible deployment strategy could be as follows: first of all, the most strategic stakeholders in the value chain for the deployment of
Deliverable D10 (incl. D9) Version 2.0 55
eIMPACT 11.08.2008
Lane Keeping Support are selected. Successively, the most likely instruments for the stakeholders previously defined are chosen according to the numerical value principle. In fact, it should reflect the stakeholder real pro-activity.
In particular, the construction of a possible strategy for speeding up the deployment of Lane Keeping Support takes into account the active involvement of the following stakeholders:
• stakeholders of supply side:
- system suppliers, since they hold the development and manufacturing of IVSS;
- system producers (i.e. carmakers/OEMs), because they decide for installing IVSS on board of their vehicles or not;
• supplementary stakeholders:
- governmental institutions (e.g. public sectors), since they possess the most powerful instruments as normative, financial and informative instruments;
- driver association (e.g. automobiles club, driving schools), since they can make customers aware of IVSS safety issues and influence their willingness-to-buy;
and the combined use of different instruments according to the Stakeholder Workshop results. In particular, the selection of the most probable instruments to be exploited by each stakeholder has been made taking into account the instrument numerical value on a scale 0-5. The highest value indicates that it is more likely that the stakeholder will proactively use that instrument.
Therefore, a potential strategy for Lane Keeping Support consists of the following instruments (see Table 11):
• field operational tests (initiators: system suppliers, automobile clubs and OEMs): a concerted action among on one hand system suppliers and OEMs, and on the other automobile clubs can increase user awareness, create correct expectations and persuade potential customers about Lane Keeping Support advantages;
• awareness campaigns (initiator: public sector): Ministries or the European Commission can use awareness campaigns to raise knowledge and understanding of Lane Keeping Support functionalities and benefits with the final aim to change public attitudes and perceptions;
• advertising media (initiator: OEMs): despite the lowest numerical value in the case of OEM stakeholder, advertising campaigns directly promoted by carmaker (Alfa Romeo dedicated a summer advertising campaign to the alcohol risk assumption in case of driving) could strongly awaken customers and public opinion to traffic safety themes. The number of equipped vehicles with Lane Keeping Support would grow either directly (customer informational status and willingness to buy raise) or indirectly (supplementary stakeholders start awareness campaigns influencing customers).
Deliverable D10 (incl. D9) Version 2.0 56
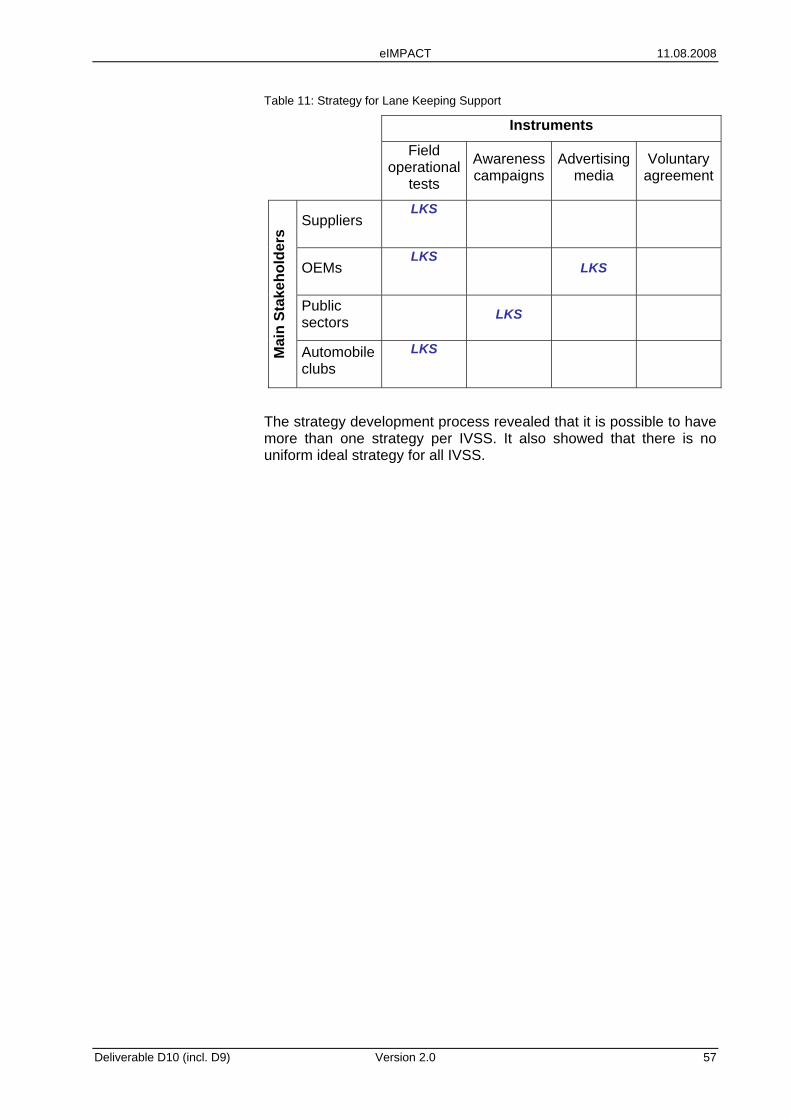
eIMPACT 11.08.2008
Table 11: Strategy for Lane Keeping Support
Instruments
Field operational
tests
Awareness campaigns
Advertising media
Voluntary agreement
Suppliers LKS
OEMs LKS
LKS
Public sectors LKS
Mai
n St
akeh
olde
rs
Automobile clubs
LKS
The strategy development process revealed that it is possible to have more than one strategy per IVSS. It also showed that there is no uniform ideal strategy for all IVSS.
Deliverable D10 (incl. D9) Version 2.0 57
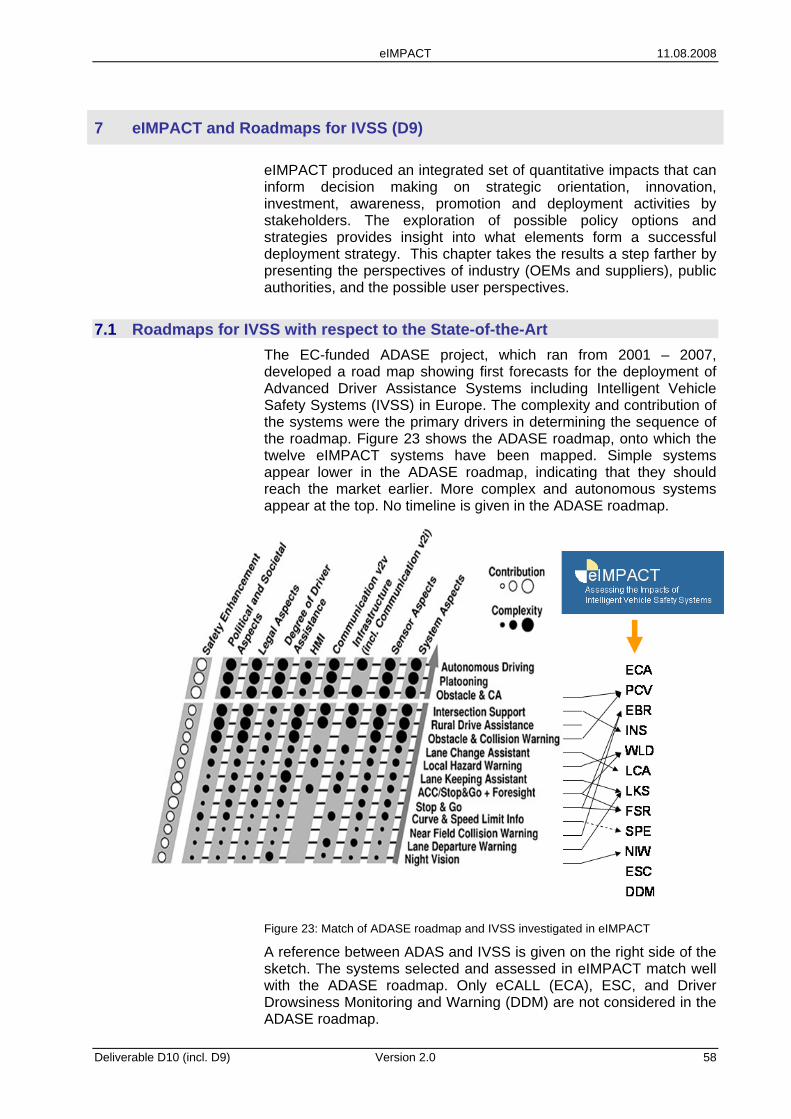
eIMPACT 11.08.2008
7 eIMPACT and Roadmaps for IVSS (D9)
eIMPACT produced an integrated set of quantitative impacts that can inform decision making on strategic orientation, innovation, investment, awareness, promotion and deployment activities by stakeholders. The exploration of possible policy options and strategies provides insight into what elements form a successful deployment strategy. This chapter takes the results a step farther by presenting the perspectives of industry (OEMs and suppliers), public authorities, and the possible user perspectives.
7.1 Roadmaps for IVSS with respect to the State-of-the-Art The EC-funded ADASE project, which ran from 2001 – 2007, developed a road map showing first forecasts for the deployment of Advanced Driver Assistance Systems including Intelligent Vehicle Safety Systems (IVSS) in Europe. The complexity and contribution of the systems were the primary drivers in determining the sequence of the roadmap. Figure 23 shows the ADASE roadmap, onto which the twelve eIMPACT systems have been mapped. Simple systems appear lower in the ADASE roadmap, indicating that they should reach the market earlier. More complex and autonomous systems appear at the top. No timeline is given in the ADASE roadmap.
Figure 23: Match of ADASE roadmap and IVSS investigated in eIMPACT
A reference between ADAS and IVSS is given on the right side of the sketch. The systems selected and assessed in eIMPACT match well with the ADASE roadmap. Only eCALL (ECA), ESC, and Driver Drowsiness Monitoring and Warning (DDM) are not considered in the ADASE roadmap.
Deliverable D10 (incl. D9) Version 2.0 58
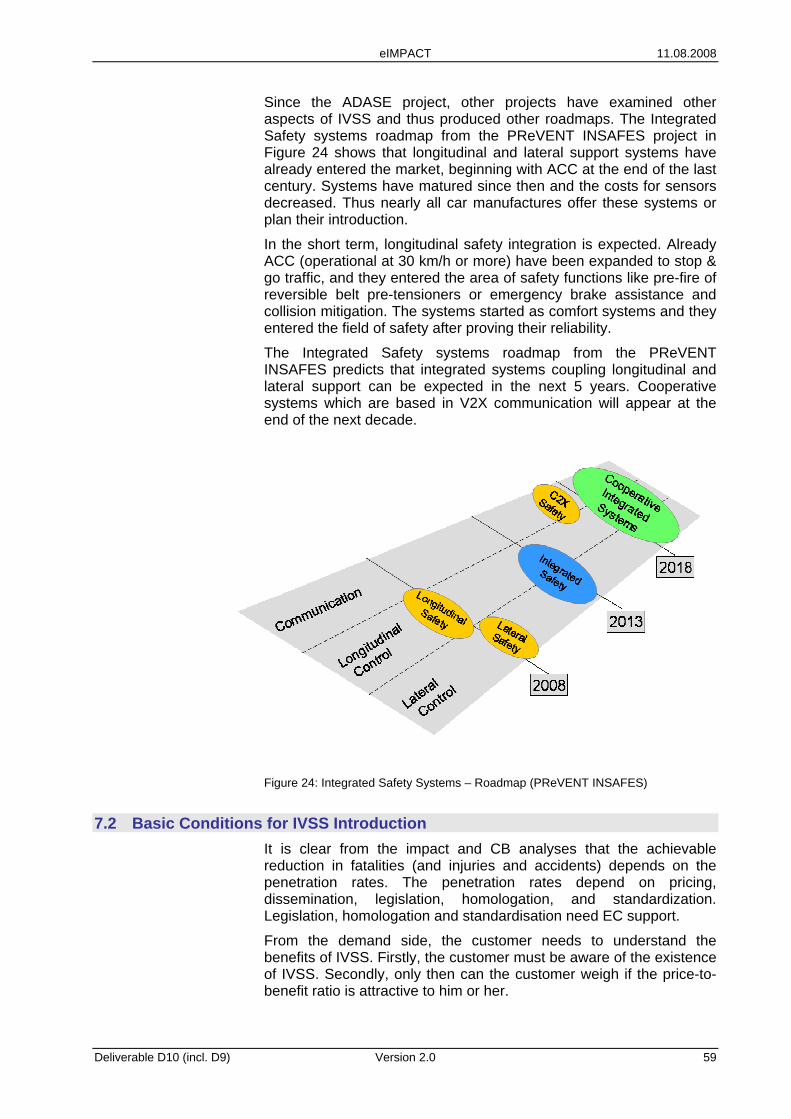
eIMPACT 11.08.2008
Since the ADASE project, other projects have examined other aspects of IVSS and thus produced other roadmaps. The Integrated Safety systems roadmap from the PReVENT INSAFES project in Figure 24 shows that longitudinal and lateral support systems have already entered the market, beginning with ACC at the end of the last century. Systems have matured since then and the costs for sensors decreased. Thus nearly all car manufactures offer these systems or plan their introduction.
In the short term, longitudinal safety integration is expected. Already ACC (operational at 30 km/h or more) have been expanded to stop & go traffic, and they entered the area of safety functions like pre-fire of reversible belt pre-tensioners or emergency brake assistance and collision mitigation. The systems started as comfort systems and they entered the field of safety after proving their reliability.
The Integrated Safety systems roadmap from the PReVENT INSAFES predicts that integrated systems coupling longitudinal and lateral support can be expected in the next 5 years. Cooperative systems which are based in V2X communication will appear at the end of the next decade.
Figure 24: Integrated Safety Systems – Roadmap (PReVENT INSAFES)
7.2 Basic Conditions for IVSS Introduction It is clear from the impact and CB analyses that the achievable reduction in fatalities (and injuries and accidents) depends on the penetration rates. The penetration rates depend on pricing, dissemination, legislation, homologation, and standardization. Legislation, homologation and standardisation need EC support.
From the demand side, the customer needs to understand the benefits of IVSS. Firstly, the customer must be aware of the existence of IVSS. Secondly, only then can the customer weigh if the price-to-benefit ratio is attractive to him or her.
Deliverable D10 (incl. D9) Version 2.0 59
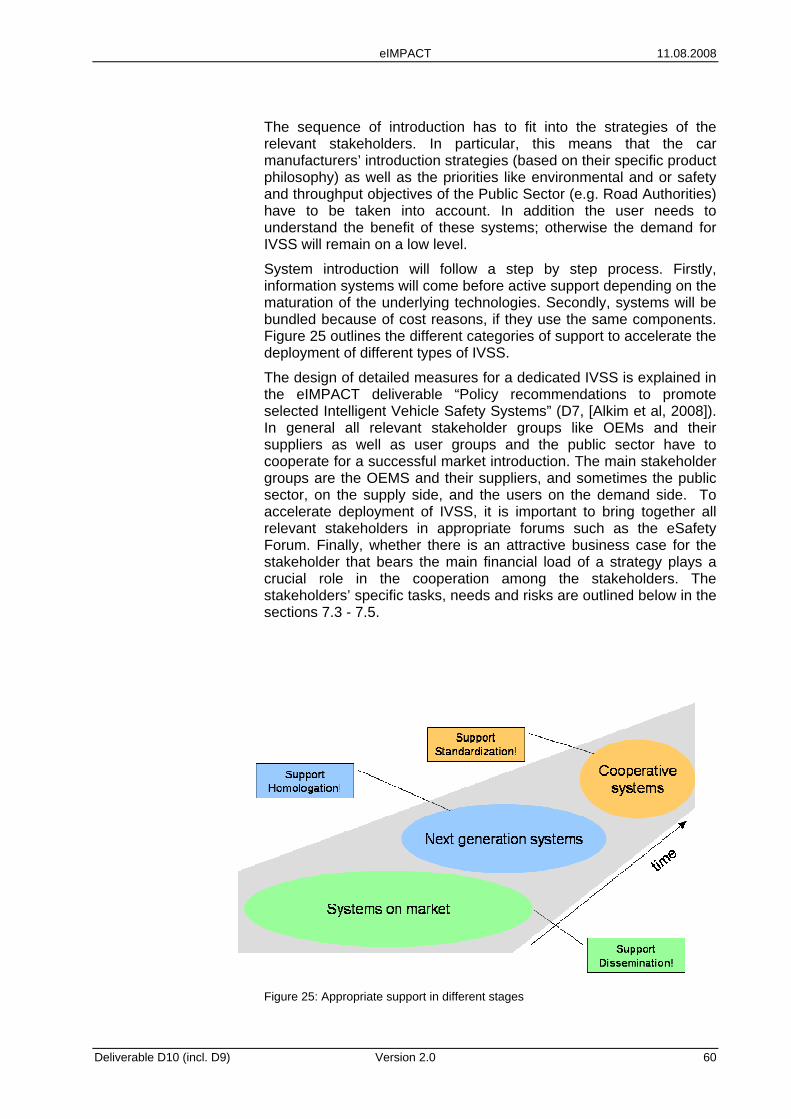
eIMPACT 11.08.2008
The sequence of introduction has to fit into the strategies of the relevant stakeholders. In particular, this means that the car manufacturers’ introduction strategies (based on their specific product philosophy) as well as the priorities like environmental and or safety and throughput objectives of the Public Sector (e.g. Road Authorities) have to be taken into account. In addition the user needs to understand the benefit of these systems; otherwise the demand for IVSS will remain on a low level.
System introduction will follow a step by step process. Firstly, information systems will come before active support depending on the maturation of the underlying technologies. Secondly, systems will be bundled because of cost reasons, if they use the same components. Figure 25 outlines the different categories of support to accelerate the deployment of different types of IVSS.
The design of detailed measures for a dedicated IVSS is explained in the eIMPACT deliverable “Policy recommendations to promote selected Intelligent Vehicle Safety Systems” (D7, [Alkim et al, 2008]). In general all relevant stakeholder groups like OEMs and their suppliers as well as user groups and the public sector have to cooperate for a successful market introduction. The main stakeholder groups are the OEMS and their suppliers, and sometimes the public sector, on the supply side, and the users on the demand side. To accelerate deployment of IVSS, it is important to bring together all relevant stakeholders in appropriate forums such as the eSafety Forum. Finally, whether there is an attractive business case for the stakeholder that bears the main financial load of a strategy plays a crucial role in the cooperation among the stakeholders. The stakeholders’ specific tasks, needs and risks are outlined below in the sections 7.3 - 7.5.
Figure 25: Appropriate support in different stages
Deliverable D10 (incl. D9) Version 2.0 60

eIMPACT 11.08.2008
Depending on the status and degree of market introduction, IVSS need appropriate measures to promote them. Specific measures are outlined below.
Dissemination (for systems already on the market)
o raise of public (customer) awareness
o improvements in driver education and driver safety training
o promotion in motor press
o investigation in infrastructure systems for v2i communication
o tax refunds for safety systems
Homologation on EC level (for next generation systems)
o improvement of EU-wide legislation and homologation
Standardization on EC level (for cooperative systems)
o support of protocol standardization and frequency allocation for v2x communication systems (Recommendations of the eSafety Forum Initiative - Working group Communications are already under preparation)
The safety effects (i.e. avoided fatalities and injuries) and the Benefit Cost Ratios (BCR) calculated in eIMPACT (D4 [Wimink et al., 2008] and D6 [Baum et al., 2008]) could be used to determine for which systems specific measures are effective and efficient.
7.3 Perspective of supplier and OEMs OEMs and their suppliers need to open the market for future IVSS by providing effective systems to affordable prices, but they have to overcome significant liability and introduction risks.
IVSS will increasingly support drivers in complex situations. As a consequence, the functionality of these systems has to cover these events and this increases product liability risks dramatically.
In addition the requirements regarding system performance and availability result in increased development costs for the system components leading to high introductions risks.
Hence, from an OEM and supplier perspective two enabling instruments are crucial to overcome liability risks:
• Homologation and standardisation on EC-level
• Use of a common Code of Practice (CoP) on EC level.
A Common Code of Practice describing the methodological approach to develop a specific IVSS could help to accelerate the development and quality of an IVSS and to support the user acceptance. Such a Common Code of Practice includes
o An agreed set of terms and definitions
o A basic description of the development process (to be refined specifically for each supplier or OEM)
o A set of recommendations on how to prove controllability of the IVSS (e.g. expert panel, naïve users) and requirement gathering
Deliverable D10 (incl. D9) Version 2.0 61

eIMPACT 11.08.2008
The RESPONSE 3 project delivered version 3.0 of such a Common Code of Practice (Oct. 2006). This draft is currently under review of relevant stakeholder groups.
To mitigate the introduction risks OEMs and their suppliers might choose the introduction scenario given below. In addition, they could identify strategies to reduce their production and development costs by standardisation of components for different OEMs (based on common legislation for these components).
Possible introduction scenario Step1: launch of warning functions combined with powerful brake assist
• no automatic system intervention ; this means a lower liability risk
• low system cost; this will improve the willingness-to pay of users
• mature systems already available
• pave the way for automatic systems
Step 2: launch of automatically intervening functions
• improve maturity, performance, availability and reliability
• reduce cost by new technologies
• additional accident mitigation and avoidance potential
Figure 26, an illustration of system dependencies, reveals the technical basis for the possible introduction scenario described above.
The introduction risk of IVSS could also be mitigated by the specific support of already existing organisations. As an example, a possible role of EURO NCAP is briefly outlined. EURO NCAP is actively planning to enlarge its focus by assessing active safety systems (the so-called “Beyond Euro NCAP” initiative by initiating a “star rating program” for active safety systems). This could be a useful platform for industry stakeholders to be actively involved in the design of new rating schemes and rating processes. Furthermore these recommendations of “Beyond Euro NCAP” should balance systems benefits (accident avoidance) and economical aspects and could serve as a frame to compare different IVSS.
Deliverable D10 (incl. D9) Version 2.0 62
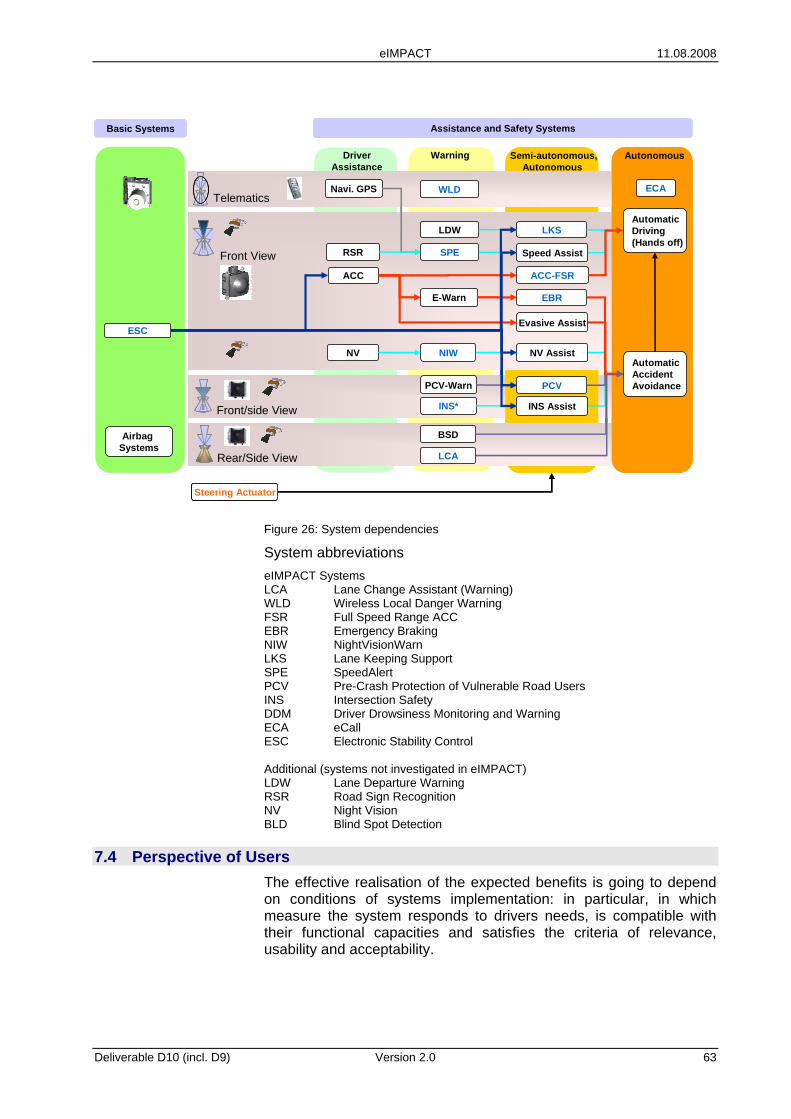
eIMPACT 11.08.2008
Figure 26: System dependencies
System abbreviations eIMPACT Systems LCA Lane Change Assistant (Warning) WLD Wireless Local Danger Warning FSR Full Speed Range ACC EBR Emergency Braking NIW NightVisionWarn LKS Lane Keeping Support SPE SpeedAlert PCV Pre-Crash Protection of Vulnerable Road Users INS Intersection Safety DDM Driver Drowsiness Monitoring and Warning ECA eCall ESC Electronic Stability Control Additional (systems not investigated in eIMPACT) LDW Lane Departure Warning RSR Road Sign Recognition NV Night Vision BLD Blind Spot Detection
Basic Systems
EBR
ACC-FSR
BSD
PCV-Warn
NV NIW
INS* INS Assist
PCV
AutonomousSemi-autonomous,Autonomous
WarningDriver Assistance
LDW LKS
ECA
Automatic Accident Avoidance
Automatic Driving (Hands off)
Evasive Assist
LCA
RSR SPE
Steering Actuator
NV Assist
Speed Assist
Rear/Side View
Navi. GPS
Front/side View
Front View
WLD
Assistance and Safety Systems
ESC
Telematics
E-Warn
ACC
Airbag Systems
7.4 Perspective of Users The effective realisation of the expected benefits is going to depend on conditions of systems implementation: in particular, in which measure the system responds to drivers needs, is compatible with their functional capacities and satisfies the criteria of relevance, usability and acceptability.
Deliverable D10 (incl. D9) Version 2.0 63
eIMPACT 11.08.2008
The expectation of users to use a IVSS can be summarised as follows:
• Optimal safety performance in conjunction with low costs (purchase and maintenance)
• Ease to use with standard interfaces
• Comparability of systems
• Proof of evidence of the benefit of the users.
First of all, the attention of users has to be drawn to the new IVSS by raising their awareness and by provision of support to understand the “personal” benefit of these systems. For these purposes user groups should be encouraged to participate in Field Operational Tests.
This means all measures to promote and deploy a specific IVSS have to consider the user’s needs and focussed user groups should be actively involved in the implementation of these measures.
7.5 Perspective of public authorities In general, all public (road) authorities in Europe have a policy goal in common, to improve traffic flow in terms of safety, throughput, environment and in some countries reliability. For public authorities to reach their policy goals they have several instruments to their disposal, but only one budget. That means that, unless the budget is very large, choices have to be made. The priorities per country and per public authority may differ depending on various criteria. Regarding traffic safety the following order of investments is usually followed. First invest in the basic conditions for traffic safety, than invest in additional measures to even further improve traffic safety.
Basic conditions:
• Building and maintaining the national road network, making sure that the necessary infrastructure to allow safe traffic flows is available.
• Control the quality of the vehicles on this network, making sure that only safe vehicles (mainly regarding passive safety) are allowed to travel these roads
• Provide the necessary training and licensing to make sure that only skilled drivers are allowed to drive their vehicles on the roads
These three criteria should all three be met to guarantee a solid basis for traffic safety because the “triangle” human behaviour (driver) – vehicle – infrastructure, determines the level of traffic safety. If one of these three basic conditions is not met, then there is no reason to invest in other conditions without addressing this lack of minimum criteria first.
Once the aforementioned basic conditions are met, it pays off to invest in additional measures to even further improve traffic safety. One of these additional measures would be to invest in IVSS, either stand-alone or cooperative. The potential of these systems is to increase traffic safety, provided that the basic preconditions are met.
Deliverable D10 (incl. D9) Version 2.0 64
eIMPACT 11.08.2008
In addition to investing in IVSS, either stand-alone or cooperative to improve traffic safety, there are more reasons for public authorities to invest. Especially for cooperative systems there is a large potential for road operators and public authorities, because these systems provide the possibility to extract information from the traffic flow that is necessary for their primary processes, such as traffic management and maintenance of the road network. For instance, traffic management measures are usually taken on the basis of data collected from loop detectors. Speed, intensity and type of vehicle can be identified by these sensors, but only at specific locations. By means of communication between the vehicle and the infrastructure this type of information and much more could be extracted from the traffic flow without having such loop detectors (and the associated costs and inconvenience from installing and maintaining them). Furthermore, the coverage of the network can be extended largely because cars drive on primary as well as secondary and urban roads, whereas (loop) detectors are usually located only on the primary roads. In addition to extracting information that nowadays is provided by other sensors and is used for traffic management, other types of information could be generated and used for new (to be developed) applications. Retrieving information from the vehicle about current ABS or ESC actions could provide local information about slippery roads for instance.
Since communication is a two-way street, there is another potential benefit next to extracting information from vehicles and that is sending information to vehicles. Public authorities and road operators could start considering the impact of being able to send information to (specific groups of) drivers in their vehicle at a certain location at a certain time instead of posting it on static or dynamic signs, and thereby possible making them obsolete. The time scale of this development however is considerably larger, due to the fact that large penetration rates are necessary and supporting actions to modify traffic regulations and laws might be necessary as well.
Once public authorities are convinced to invest in IVSS, the question is what role they can play in order to promote or speed up the deployment. Possible roles for public authorities and road operators are, for instance, that they can create the legal framework for the production (standardisation and homologation issues) and the use of IVSS. Financial incentives like tax reductions and direct subsidies can influence either the willingness to buy on the demand side and the development/production costs on the supply side. Public authorities and road operators can support the deployment of IVSS by setting up and bringing forward research networks on IVSS and creating awareness through campaigns.
Deliverable D10 (incl. D9) Version 2.0 65
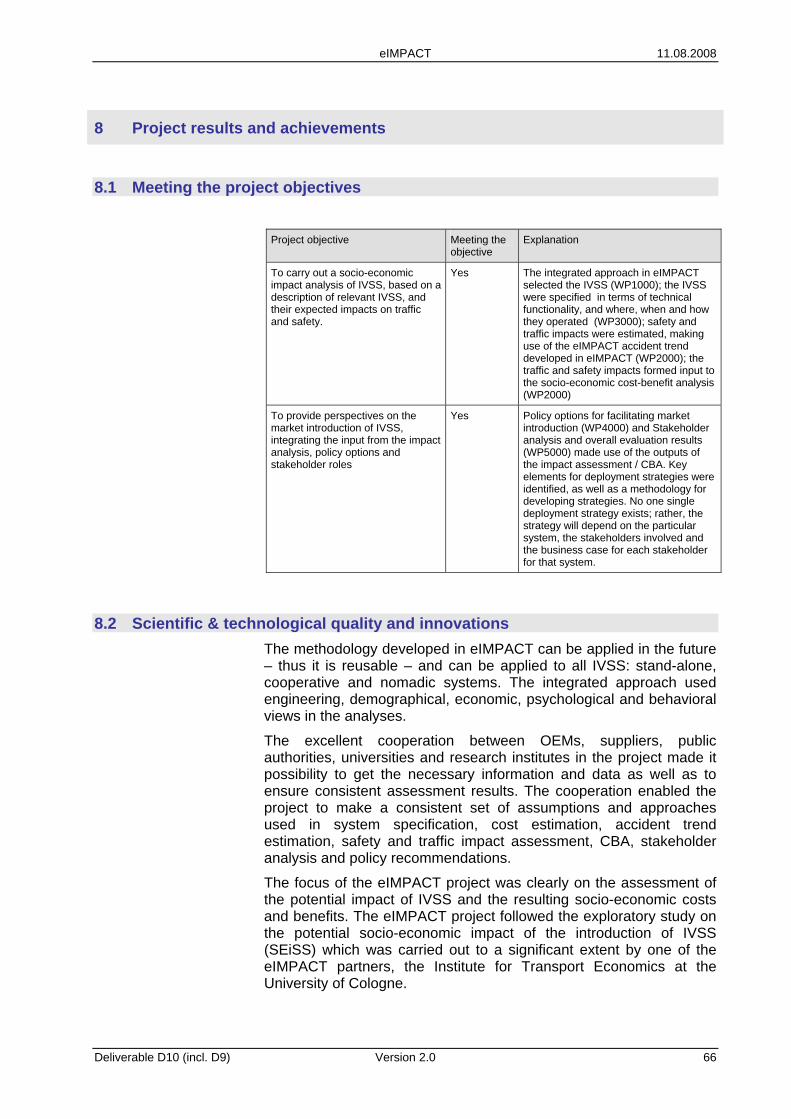
eIMPACT 11.08.2008
8 Project results and achievements
8.1 Meeting the project objectives
Project objective Meeting the objective
Explanation
To carry out a socio-economic impact analysis of IVSS, based on a description of relevant IVSS, and their expected impacts on traffic and safety.
Yes The integrated approach in eIMPACT selected the IVSS (WP1000); the IVSS were specified in terms of technical functionality, and where, when and how they operated (WP3000); safety and traffic impacts were estimated, making use of the eIMPACT accident trend developed in eIMPACT (WP2000); the traffic and safety impacts formed input to the socio-economic cost-benefit analysis (WP2000)
To provide perspectives on the market introduction of IVSS, integrating the input from the impact analysis, policy options and stakeholder roles
Yes Policy options for facilitating market introduction (WP4000) and Stakeholder analysis and overall evaluation results (WP5000) made use of the outputs of the impact assessment / CBA. Key elements for deployment strategies were identified, as well as a methodology for developing strategies. No one single deployment strategy exists; rather, the strategy will depend on the particular system, the stakeholders involved and the business case for each stakeholder for that system.
8.2 Scientific & technological quality and innovations The methodology developed in eIMPACT can be applied in the future – thus it is reusable – and can be applied to all IVSS: stand-alone, cooperative and nomadic systems. The integrated approach used engineering, demographical, economic, psychological and behavioral views in the analyses.
The excellent cooperation between OEMs, suppliers, public authorities, universities and research institutes in the project made it possibility to get the necessary information and data as well as to ensure consistent assessment results. The cooperation enabled the project to make a consistent set of assumptions and approaches used in system specification, cost estimation, accident trend estimation, safety and traffic impact assessment, CBA, stakeholder analysis and policy recommendations.
The focus of the eIMPACT project was clearly on the assessment of the potential impact of IVSS and the resulting socio-economic costs and benefits. The eIMPACT project followed the exploratory study on the potential socio-economic impact of the introduction of IVSS (SEiSS) which was carried out to a significant extent by one of the eIMPACT partners, the Institute for Transport Economics at the University of Cologne.
Deliverable D10 (incl. D9) Version 2.0 66
eIMPACT 11.08.2008
The SEiSS study focused on the development of a methodological framework for socio-economic impact assessment, the workability demonstration of the approach and the verification by exemplary case studies. eIMPACT built on a sound and comprehensive impact assessment framework which is based on cost-benefit analysis.
The socio-economic assessment required reliable IVSS safety and traffic impacts. The safety impact analysis formed an innovative part of eIMPACT. It made use of nine mechanisms to address all possible effects of IVSS ([Draskóczy, 1998]). The mechanisms cover exposure, crash risk and consequences, including intended and unintended impacts and “positive” and “negative” impacts. After choosing a main factor out of a possible 6 from the accident data, such as collision type, junction, weather conditions, this information was combined with the frequency of target conditions in the accident data, and applied to the eIMPACT accident trend data for 2010 and 2020 to produce quantified estimates of the reductions in the number of accidents, fatalities and injuries. One of the challenges in the safety analysis was quantification of all aspects related to the nine mechanisms. Evidence from FOTs, simulators, literature and expert guesses were used.
The traffic impact analysis took into account both the direct effects, e.g., changes in speeds and headways, and indirect traffic effects in terms of reduced congestion due to avoided accidents with fatalities and injuries. State-of-the-art micro-simulation models were used to estimate the direct effects.
A crucial input to the safety impact assessment was the general accident trend in 2010 and 2020. No up-to-date forecast of the safety performance (accidents/ casualties) for 2010 and 2020 was available for the EU-25. Consequently, the project produced its own road safety forecast.
The analysis of traffic effects and, subsequently, their socio-economic impacts also required a comprehensive statistical traffic database for EU-25. Important elements of the EU-25 database were vehicle stock, transport performance (passenger transport: pkm, goods transport: tkm), vehicle kilometres and their distribution within the road network and safety performance indicators (accidents per bill. vehicle kilometres).
The socio-economic impact assessment, which made use of the elements described above, is a comprehensive framework which integrated the assessment framework to show the profitability of the IVSS on a societal level.
The stakeholder analysis extended the results of the cost-benefit analysis by exploring a wider socio-economic perspective on key interest groups: system users, OEMs and suppliers, the insurance industry and public authorities.
The policy analysis identified the key elements for a successful market introduction. It also developed a methodology for support policy development for accelerated market introduction.
The final results of the eIMPACT, e.g., safety results and BCR, are on the one results which stand on their own, but on the other hand form a consistent set of quantitative results and a methodological approach.
Deliverable D10 (incl. D9) Version 2.0 67
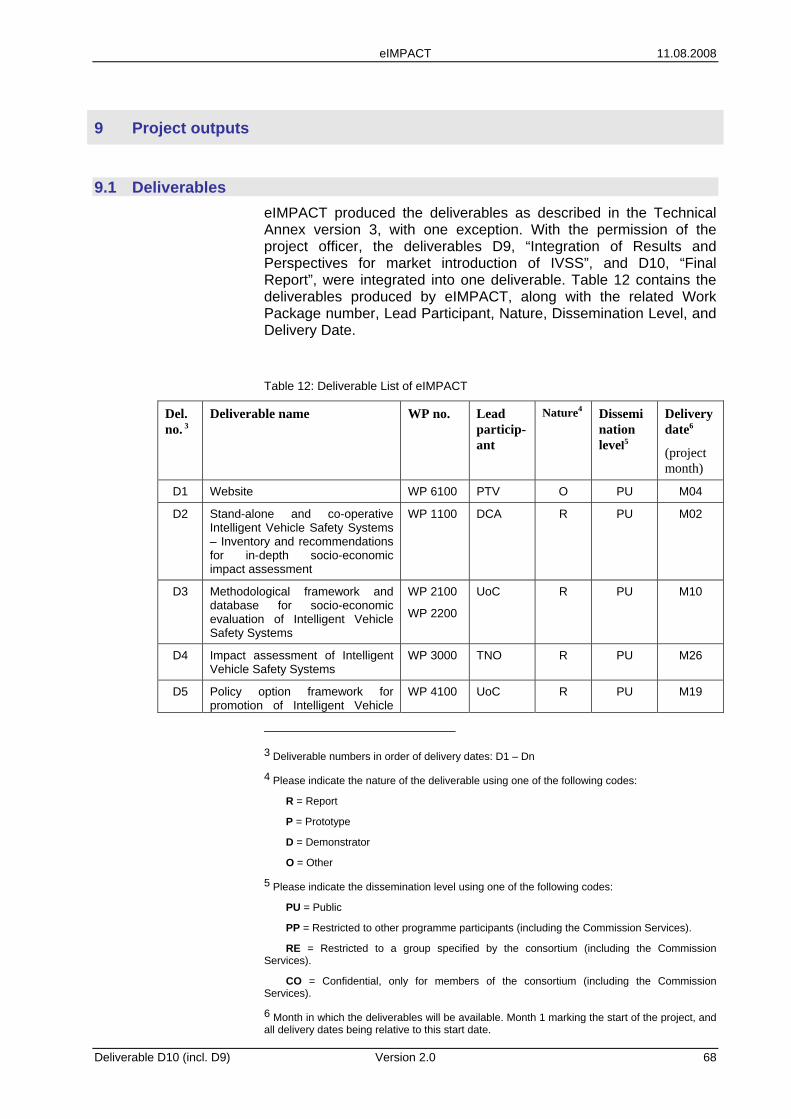
eIMPACT 11.08.2008
9 Project outputs
9.1 Deliverables eIMPACT produced the deliverables as described in the Technical Annex version 3, with one exception. With the permission of the project officer, the deliverables D9, “Integration of Results and Perspectives for market introduction of IVSS”, and D10, “Final Report”, were integrated into one deliverable. Table 12 contains the deliverables produced by eIMPACT, along with the related Work Package number, Lead Participant, Nature, Dissemination Level, and Delivery Date.
Table 12: Deliverable List of eIMPACT
Del. no. 3
Deliverable name WP no. Lead particip-ant
Nature4 Dissemination level5
Delivery date6
(project month)
D1 Website WP 6100 PTV O PU M04
D2 Stand-alone and co-operative Intelligent Vehicle Safety Systems – Inventory and recommendations for in-depth socio-economic impact assessment
WP 1100 DCA R PU M02
D3 Methodological framework and database for socio-economic evaluation of Intelligent Vehicle Safety Systems
WP 2100
WP 2200
UoC R PU M10
D4 Impact assessment of Intelligent Vehicle Safety Systems
WP 3000 TNO R PU M26
D5 Policy option framework for promotion of Intelligent Vehicle
WP 4100 UoC R PU M19
3 Deliverable numbers in order of delivery dates: D1 – Dn
4 Please indicate the nature of the deliverable using one of the following codes:
R = Report
P = Prototype
D = Demonstrator
O = Other
5 Please indicate the dissemination level using one of the following codes:
PU = Public
PP = Restricted to other programme participants (including the Commission Services).
RE = Restricted to a group specified by the consortium (including the Commission Services).
CO = Confidential, only for members of the consortium (including the Commission Services).
6 Month in which the deliverables will be available. Month 1 marking the start of the project, and all delivery dates being relative to this start date.
Deliverable D10 (incl. D9) Version 2.0 68
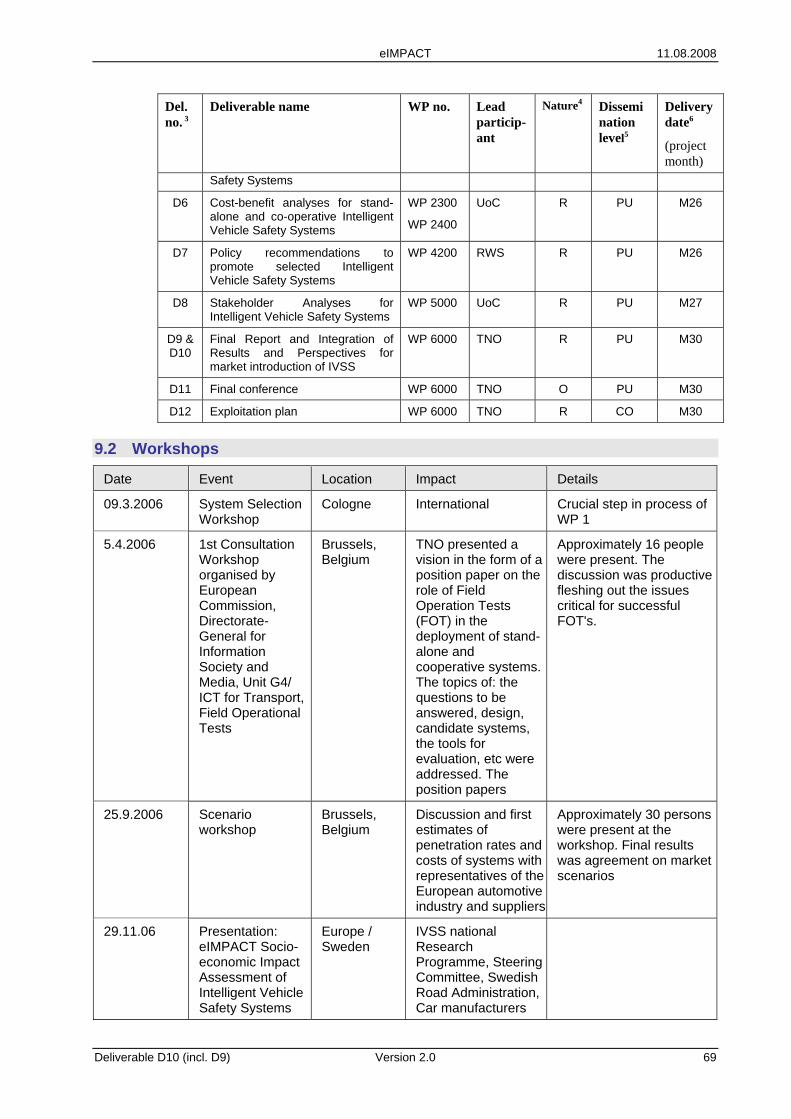
eIMPACT 11.08.2008
Del. no. 3
Deliverable name WP no. Lead particip-ant
Nature4 Dissemination level5
Delivery date6
(project month)
Safety Systems
D6 Cost-benefit analyses for stand-alone and co-operative Intelligent Vehicle Safety Systems
WP 2300
WP 2400
UoC R PU M26
D7 Policy recommendations to promote selected Intelligent Vehicle Safety Systems
WP 4200 RWS R PU M26
D8 Stakeholder Analyses for Intelligent Vehicle Safety Systems
WP 5000 UoC R PU M27
D9 & D10
Final Report and Integration of Results and Perspectives for market introduction of IVSS
WP 6000 TNO R PU M30
D11 Final conference WP 6000 TNO O PU M30
D12 Exploitation plan WP 6000 TNO R CO M30
9.2 Workshops
Date Event Location Impact Details
09.3.2006 System Selection Workshop
Cologne International Crucial step in process of WP 1
5.4.2006 1st Consultation Workshop organised by European Commission, Directorate-General for Information Society and Media, Unit G4/ ICT for Transport, Field Operational Tests
Brussels, Belgium
TNO presented a vision in the form of a position paper on the role of Field Operation Tests (FOT) in the deployment of stand-alone and cooperative systems. The topics of: the questions to be answered, design, candidate systems, the tools for evaluation, etc were addressed. The position papers
Approximately 16 people were present. The discussion was productive fleshing out the issues critical for successful FOT's.
25.9.2006 Scenario workshop
Brussels, Belgium
Discussion and first estimates of penetration rates and costs of systems with representatives of the European automotive industry and suppliers
Approximately 30 persons were present at the workshop. Final results was agreement on market scenarios
29.11.06 Presentation: eIMPACT Socio-economic Impact Assessment of Intelligent Vehicle Safety Systems
Europe / Sweden
IVSS national Research Programme, Steering Committee, Swedish Road Administration, Car manufacturers
Deliverable D10 (incl. D9) Version 2.0 69
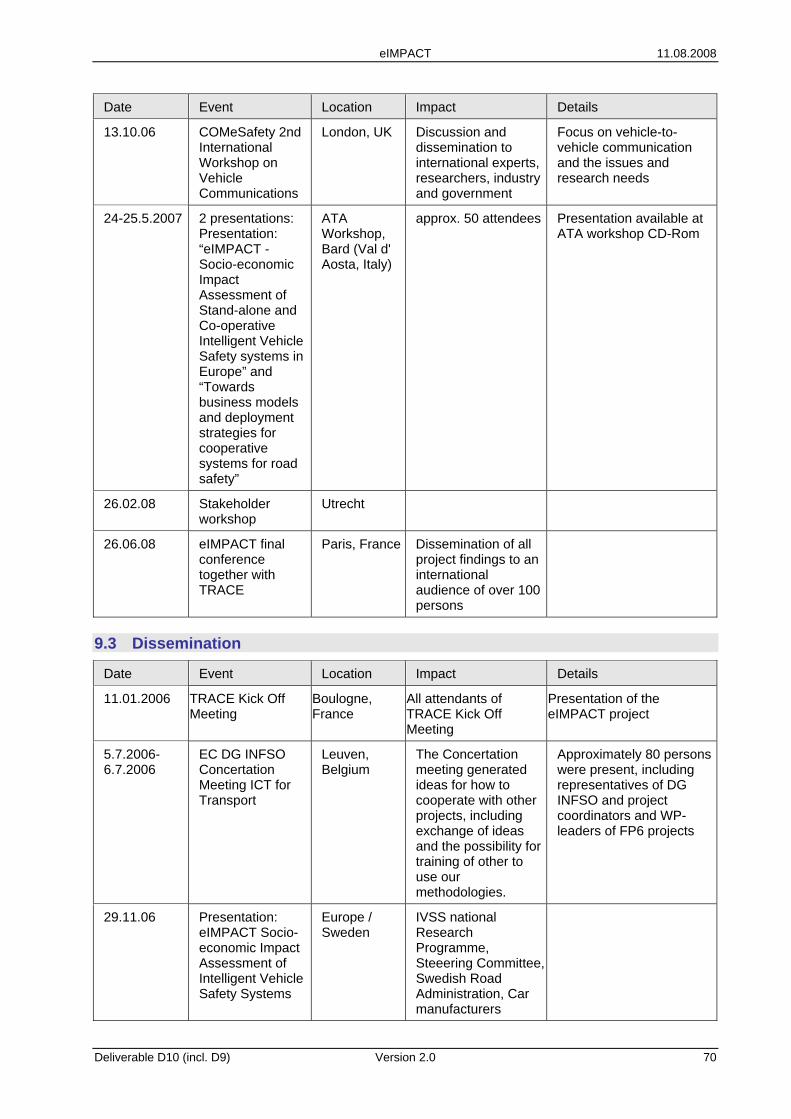
eIMPACT 11.08.2008
Date Event Location Impact Details
13.10.06 COMeSafety 2nd International Workshop on Vehicle Communications
London, UK Discussion and dissemination to international experts, researchers, industry and government
Focus on vehicle-to-vehicle communication and the issues and research needs
24-25.5.2007 2 presentations: Presentation: “eIMPACT - Socio-economic Impact Assessment of Stand-alone and Co-operative Intelligent Vehicle Safety systems in Europe” and “Towards business models and deployment strategies for cooperative systems for road safety”
ATA Workshop, Bard (Val d' Aosta, Italy)
approx. 50 attendees Presentation available at ATA workshop CD-Rom
26.02.08 Stakeholder workshop
Utrecht
26.06.08 eIMPACT final conference together with TRACE
Paris, France Dissemination of all project findings to an international audience of over 100 persons
9.3 Dissemination
Date Event Location Impact Details
11.01.2006 TRACE Kick Off Meeting
Boulogne, France
All attendants of TRACE Kick Off Meeting
Presentation of the eIMPACT project
5.7.2006-6.7.2006
EC DG INFSO Concertation Meeting ICT for Transport
Leuven, Belgium
The Concertation meeting generated ideas for how to cooperate with other projects, including exchange of ideas and the possibility for training of other to use our methodologies.
Approximately 80 persons were present, including representatives of DG INFSO and project coordinators and WP-leaders of FP6 projects
29.11.06 Presentation: eIMPACT Socio-economic Impact Assessment of Intelligent Vehicle Safety Systems
Europe / Sweden
IVSS national Research Programme, Steeering Committee, Swedish Road Administration, Car manufacturers
Deliverable D10 (incl. D9) Version 2.0 70
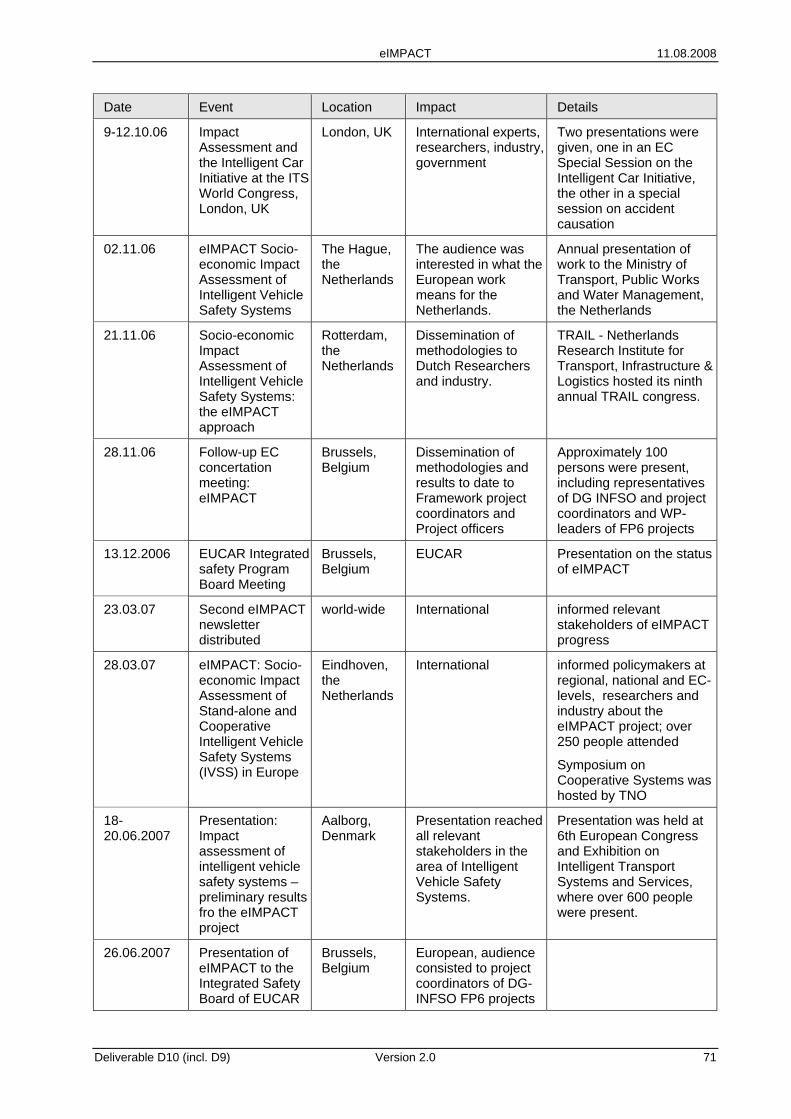
eIMPACT 11.08.2008
Date Event Location Impact Details
9-12.10.06 Impact Assessment and the Intelligent Car Initiative at the ITS World Congress, London, UK
London, UK International experts, researchers, industry, government
Two presentations were given, one in an EC Special Session on the Intelligent Car Initiative, the other in a special session on accident causation
02.11.06 eIMPACT Socio-economic Impact Assessment of Intelligent Vehicle Safety Systems
The Hague, the Netherlands
The audience was interested in what the European work means for the Netherlands.
Annual presentation of work to the Ministry of Transport, Public Works and Water Management, the Netherlands
21.11.06 Socio-economic Impact Assessment of Intelligent Vehicle Safety Systems: the eIMPACT approach
Rotterdam, the Netherlands
Dissemination of methodologies to Dutch Researchers and industry.
TRAIL - Netherlands Research Institute for Transport, Infrastructure & Logistics hosted its ninth annual TRAIL congress.
28.11.06 Follow-up EC concertation meeting: eIMPACT
Brussels, Belgium
Dissemination of methodologies and results to date to Framework project coordinators and Project officers
Approximately 100 persons were present, including representatives of DG INFSO and project coordinators and WP-leaders of FP6 projects
13.12.2006 EUCAR Integrated safety Program Board Meeting
Brussels, Belgium
EUCAR Presentation on the status of eIMPACT
23.03.07 Second eIMPACT newsletter distributed
world-wide International informed relevant stakeholders of eIMPACT progress
28.03.07 eIMPACT: Socio-economic Impact Assessment of Stand-alone and Cooperative Intelligent Vehicle Safety Systems (IVSS) in Europe
Eindhoven, the Netherlands
International informed policymakers at regional, national and EC-levels, researchers and industry about the eIMPACT project; over 250 people attended
Symposium on Cooperative Systems was hosted by TNO
18-20.06.2007
Presentation: Impact assessment of intelligent vehicle safety systems – preliminary results fro the eIMPACT project
Aalborg, Denmark
Presentation reached all relevant stakeholders in the area of Intelligent Vehicle Safety Systems.
Presentation was held at 6th European Congress and Exhibition on Intelligent Transport Systems and Services, where over 600 people were present.
26.06.2007 Presentation of eIMPACT to the Integrated Safety Board of EUCAR
Brussels, Belgium
European, audience consisted to project coordinators of DG-INFSO FP6 projects
Deliverable D10 (incl. D9) Version 2.0 71
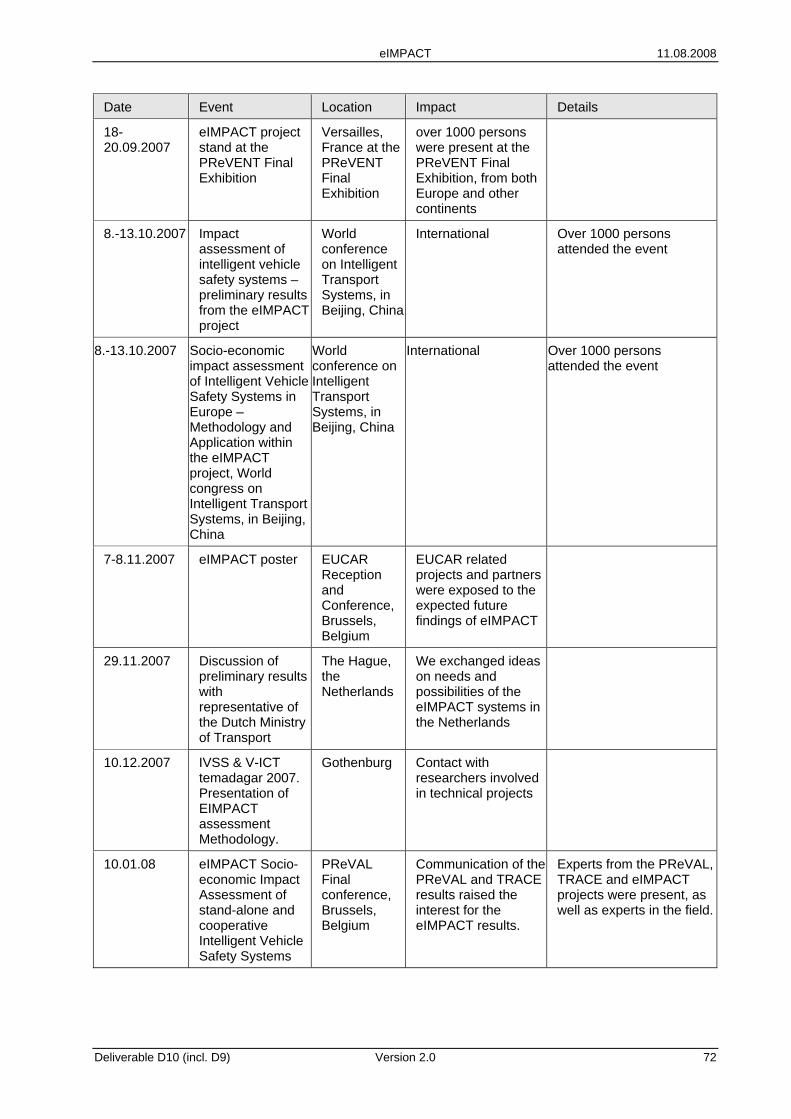
eIMPACT 11.08.2008
Date Event Location Impact Details
18-20.09.2007
eIMPACT project stand at the PReVENT Final Exhibition
Versailles, France at the PReVENT Final Exhibition
over 1000 persons were present at the PReVENT Final Exhibition, from both Europe and other continents
8.-13.10.2007 Impact assessment of intelligent vehicle safety systems – preliminary results from the eIMPACT project
World conference on Intelligent Transport Systems, in Beijing, China
International Over 1000 persons attended the event
8.-13.10.2007 Socio-economic impact assessment of Intelligent Vehicle Safety Systems in Europe – Methodology and Application within the eIMPACT project, World congress on Intelligent Transport Systems, in Beijing, China
World conference on Intelligent Transport Systems, in Beijing, China
International Over 1000 persons attended the event
7-8.11.2007 eIMPACT poster EUCAR Reception and Conference, Brussels, Belgium
EUCAR related projects and partners were exposed to the expected future findings of eIMPACT
29.11.2007 Discussion of preliminary results with representative of the Dutch Ministry of Transport
The Hague, the Netherlands
We exchanged ideas on needs and possibilities of the eIMPACT systems in the Netherlands
10.12.2007 IVSS & V-ICT temadagar 2007. Presentation of EIMPACT assessment Methodology.
Gothenburg Contact with researchers involved in technical projects
10.01.08 eIMPACT Socio-economic Impact Assessment of stand-alone and cooperative Intelligent Vehicle Safety Systems
PReVAL Final conference, Brussels, Belgium
Communication of the PReVAL and TRACE results raised the interest for the eIMPACT results.
Experts from the PReVAL, TRACE and eIMPACT projects were present, as well as experts in the field.
Deliverable D10 (incl. D9) Version 2.0 72
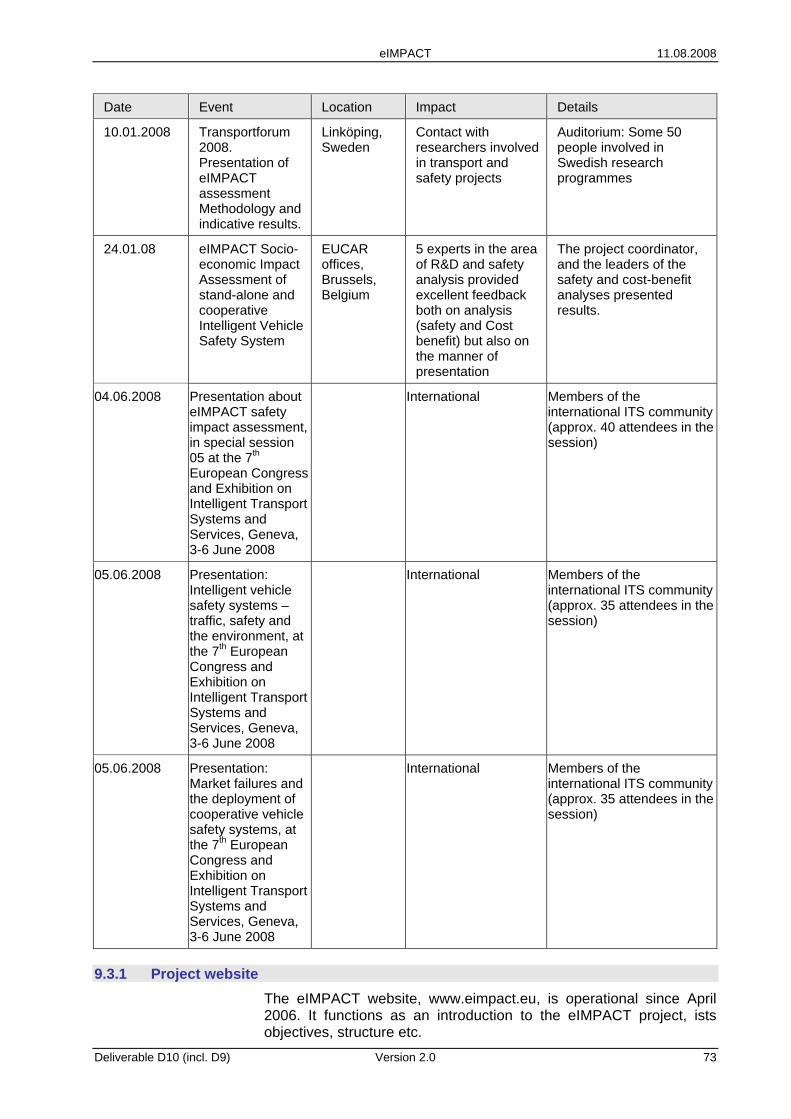
eIMPACT 11.08.2008
Date Event Location Impact Details
10.01.2008 Transportforum 2008. Presentation of eIMPACT assessment Methodology and indicative results.
Linköping, Sweden
Contact with researchers involved in transport and safety projects
Auditorium: Some 50 people involved in Swedish research programmes
24.01.08 eIMPACT Socio-economic Impact Assessment of stand-alone and cooperative Intelligent Vehicle Safety System
EUCAR offices, Brussels, Belgium
5 experts in the area of R&D and safety analysis provided excellent feedback both on analysis (safety and Cost benefit) but also on the manner of presentation
The project coordinator, and the leaders of the safety and cost-benefit analyses presented results.
04.06.2008 Presentation about eIMPACT safety impact assessment, in special session 05 at the 7th European Congress and Exhibition on Intelligent Transport Systems and Services, Geneva, 3-6 June 2008
International Members of the international ITS community (approx. 40 attendees in the session)
05.06.2008 Presentation: Intelligent vehicle safety systems – traffic, safety and the environment, at the 7th European Congress and Exhibition on Intelligent Transport Systems and Services, Geneva, 3-6 June 2008
International Members of the international ITS community (approx. 35 attendees in the session)
05.06.2008 Presentation: Market failures and the deployment of cooperative vehicle safety systems, at the 7th European Congress and Exhibition on Intelligent Transport Systems and Services, Geneva, 3-6 June 2008
International Members of the international ITS community (approx. 35 attendees in the session)
9.3.1 Project website The eIMPACT website, www.eimpact.eu, is operational since April 2006. It functions as an introduction to the eIMPACT project, ists objectives, structure etc.
Deliverable D10 (incl. D9) Version 2.0 73
eIMPACT 11.08.2008
The website contains approved public deliverables, the eIMPACT brochure, newsletters, presentations given at conferences and announcements of workshops. The website also hosted the registration for the eIMPACT and TRACE Final Conference (June 2008) and the Stakeholder Workshop (February 2008).
9.3.2 Publishable Results Late in the second period of the project, exploitable results were achieved. The final versions of the safety and traffic impacts were available in April, 2008; the Cost-benefit Analysis, Stakeholder analyses and Policy Implementation strategies were complete in June 2008. The consortium decided to present the complete set of safety, traffic, CBA and stakeholder results for the first time at the eIMPACT final conference (June 2008). The consortium expects that many results will be published after the completion of the project.
In June, 2008, a article in Traffic Technology International, “Impact Analysis”, with reference to the presentation given at the Geneva ITS Congress appeared. Traffic Technology International is an international publication with an average circulation of 18,085 (2006).
9.3.3 Integration with other projects eIMPACT cooperated with the STREP TRACE (Traffic Accident Causation in Europe). TRACE was also a sixth framework project of DG INFSO. eIMPACT and TRACE worked together in two ways. Firstly, eIMPACT worked in co-operation with the parallel TRACE project, focusing on accident causation analysis. TRACE provided eIMPACT with the accident data needed for the safety impact calculations. The data was based on the CARE database and an internal data enquiry organised among TRACE partners.
During the project, information about the methodological approaches was shared in project meetings and in a workshop. In addition, a common workshop was arranged to discuss the results of the work. In TRACE, the main responsible partner for providing eIMPACT with data was Loughborough University. (National Accident Data for Great Britain is collected by police forces and collated by the UK Department for Transport. The data are made available to the Vehicle Safety Research Centre at Loughborough University by the UK Department for Transport. The Department for Transport and those who carried out the original collection of the data bear no responsibility for the further analysis or interpretation of it.) CDV (eIMPACT and TRACE partner) had responsibility to provide the Central Eastern European accident data. Secondly, eIMPACT and TRACE partners attended each other’s meetings on safety assessment methodology. At these meetings, approaches were presented and explained.
eIMPACT also worked with several PReVENT sub-projects. eIMPACT based the choice of five of the twelve IVSS assessed in the project on the following PReVENT projects: COMPOSE, WILLWARN, Intersection Safety, LATERALSAFE and SAFELANE. eIMPACT also cooperated with PReVAL. PReVAL used the same evaluation methodology used in eIMPACT.
Deliverable D10 (incl. D9) Version 2.0 74
eIMPACT 11.08.2008
10 Conclusions and recommendations
10.1 Conclusions The safety impact analysis carried out in eIMPACT showed that the selected systems have a significant potential to help improve traffic safety. The systems with the highest impacts are ESC and SpeedAlert, which are expected to help reduce approximately 3,250 and 1,100 fatalities, respectively, as well as approximately 52,000 and 35,000 injuries, in the 2020 high scenario7. These systems combine high penetration rates with a large target group of accidents and a high effectiveness of the system to prevent the targeted accidents.
Independent of the penetration rate, the systems with the highest potential to help avoid accidents with fatalities and injuries are ESC, Lane Keeping Support and SpeedAlert. While ESC and SpeedAlert are, in the 2020 high scenario, quite close to realising their potential, this is not yet the case for Lane Keeping Support, which has a low penetration rate.
Several other systems have a quite high potential, but limited to moderate impacts because of (very) low penetration rates. Among these are Emergency Braking, Driver Drowsiness Monitoring and Warning, Wireless Local Danger Warning and Intersection Safety (mainly for injuries). eCall, on the other hand, has a high penetration rate in 2020, and is quite effective in preventing fatalities, but it does not reduce the number of injuries (in fact, as small increase is expected).
Finally, there are some systems that are quite effective to very effective in what they are designed to do, but target only a small share of accidents with fatalities and injuries. These systems (notably Full Speed Range ACC and Lange Change Assistant) therefore have low impacts in terms of the total number of avoided fatalities and injuries.
The potential of some systems (e.g. Lane Change Assistant (Warning) and Lane Keeping Support) can be increased by designing them in such a way that the system is switched on by default (but can still be switched off should the driver want this).
The traffic impact analysis distinguishes between direct and indirect traffic effects. Simulations with microscopic traffic models showed that the selected systems generally have neutral direct traffic impacts, at the penetration rates examined in eIMPACT. The only exception is SpeedAlert, where some negative travel time effects are expected on rural roads.
Because lower speeds are associated with a positive environmental effect, the total direct effects for SpeedAlert are still positive.
7 Note that the reference case in both future years was the situation without IVSS, but taking into account the autonomous, decreasing trend of accident numbers. This means that, if the systems were available today with the same penetration rates as in those future years, the expected impacts in terms of avoided fatalities and injuries would be considerably higher.
Deliverable D10 (incl. D9) Version 2.0 75
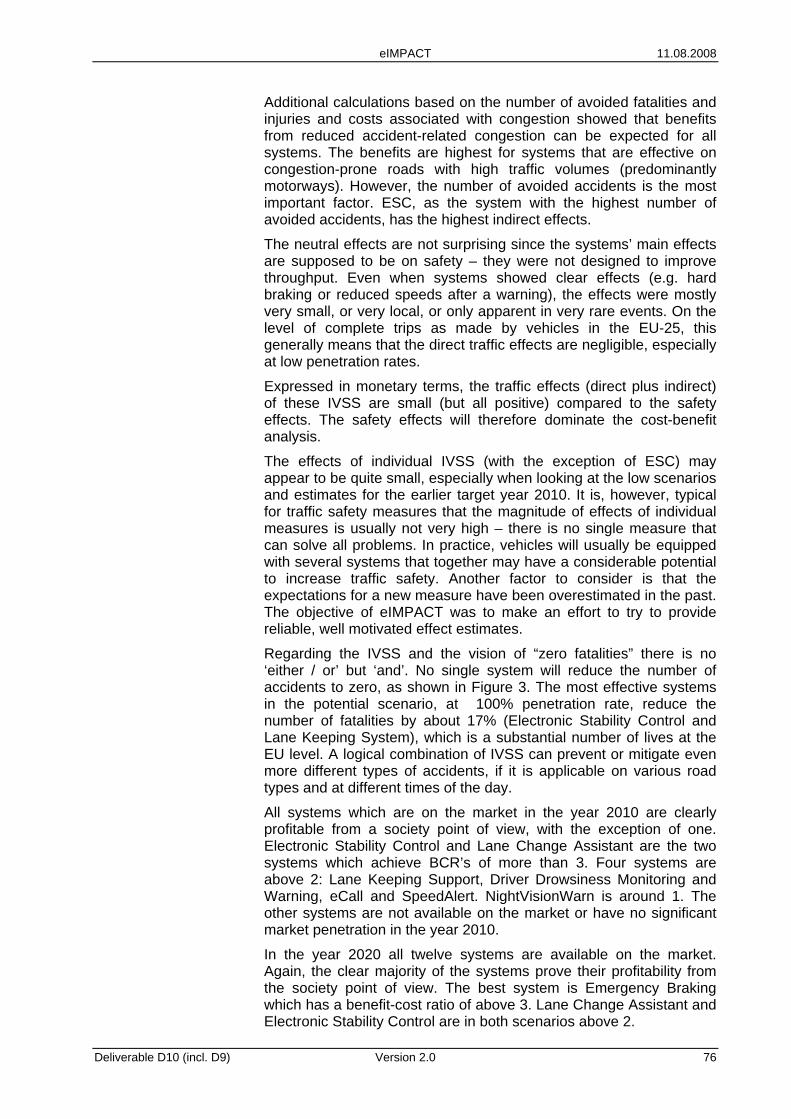
eIMPACT 11.08.2008
Additional calculations based on the number of avoided fatalities and injuries and costs associated with congestion showed that benefits from reduced accident-related congestion can be expected for all systems. The benefits are highest for systems that are effective on congestion-prone roads with high traffic volumes (predominantly motorways). However, the number of avoided accidents is the most important factor. ESC, as the system with the highest number of avoided accidents, has the highest indirect effects.
The neutral effects are not surprising since the systems’ main effects are supposed to be on safety – they were not designed to improve throughput. Even when systems showed clear effects (e.g. hard braking or reduced speeds after a warning), the effects were mostly very small, or very local, or only apparent in very rare events. On the level of complete trips as made by vehicles in the EU-25, this generally means that the direct traffic effects are negligible, especially at low penetration rates.
Expressed in monetary terms, the traffic effects (direct plus indirect) of these IVSS are small (but all positive) compared to the safety effects. The safety effects will therefore dominate the cost-benefit analysis.
The effects of individual IVSS (with the exception of ESC) may appear to be quite small, especially when looking at the low scenarios and estimates for the earlier target year 2010. It is, however, typical for traffic safety measures that the magnitude of effects of individual measures is usually not very high – there is no single measure that can solve all problems. In practice, vehicles will usually be equipped with several systems that together may have a considerable potential to increase traffic safety. Another factor to consider is that the expectations for a new measure have been overestimated in the past. The objective of eIMPACT was to make an effort to try to provide reliable, well motivated effect estimates.
Regarding the IVSS and the vision of “zero fatalities” there is no ‘either / or’ but ‘and’. No single system will reduce the number of accidents to zero, as shown in Figure 3. The most effective systems in the potential scenario, at 100% penetration rate, reduce the number of fatalities by about 17% (Electronic Stability Control and Lane Keeping System), which is a substantial number of lives at the EU level. A logical combination of IVSS can prevent or mitigate even more different types of accidents, if it is applicable on various road types and at different times of the day.
All systems which are on the market in the year 2010 are clearly profitable from a society point of view, with the exception of one. Electronic Stability Control and Lane Change Assistant are the two systems which achieve BCR’s of more than 3. Four systems are above 2: Lane Keeping Support, Driver Drowsiness Monitoring and Warning, eCall and SpeedAlert. NightVisionWarn is around 1. The other systems are not available on the market or have no significant market penetration in the year 2010.
In the year 2020 all twelve systems are available on the market. Again, the clear majority of the systems prove their profitability from the society point of view. The best system is Emergency Braking which has a benefit-cost ratio of above 3. Lane Change Assistant and Electronic Stability Control are in both scenarios above 2.
Deliverable D10 (incl. D9) Version 2.0 76
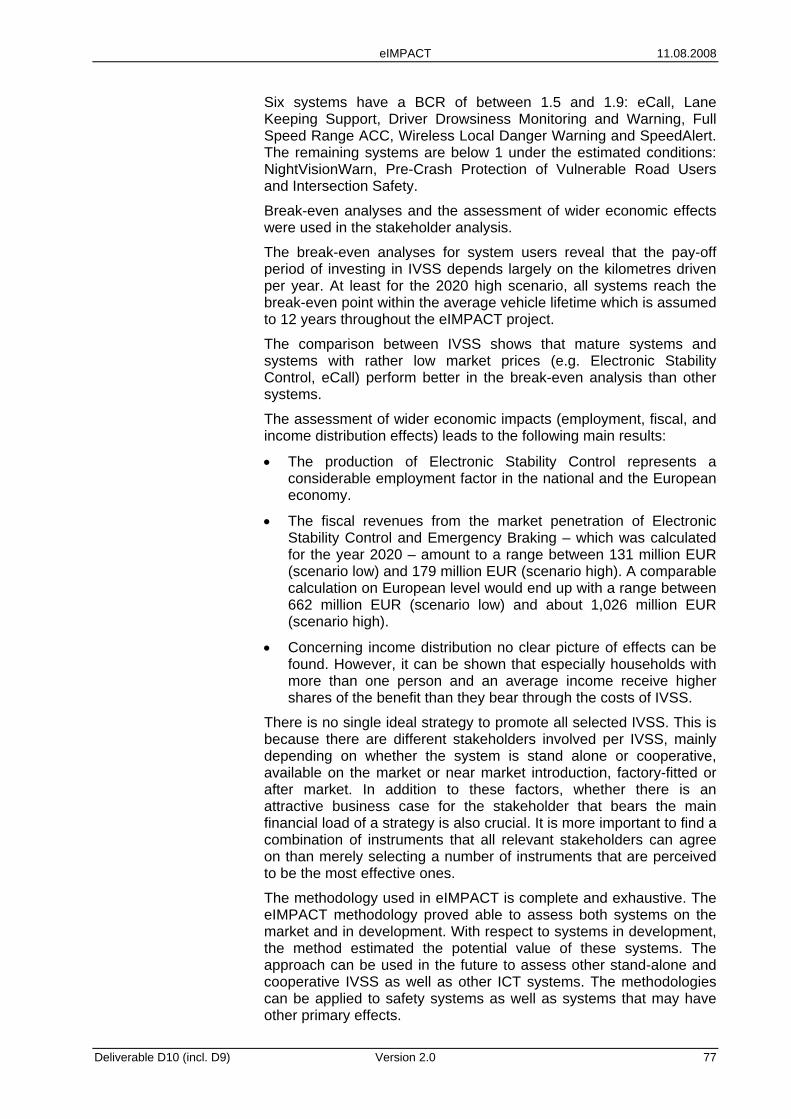
eIMPACT 11.08.2008
Six systems have a BCR of between 1.5 and 1.9: eCall, Lane Keeping Support, Driver Drowsiness Monitoring and Warning, Full Speed Range ACC, Wireless Local Danger Warning and SpeedAlert. The remaining systems are below 1 under the estimated conditions: NightVisionWarn, Pre-Crash Protection of Vulnerable Road Users and Intersection Safety.
Break-even analyses and the assessment of wider economic effects were used in the stakeholder analysis.
The break-even analyses for system users reveal that the pay-off period of investing in IVSS depends largely on the kilometres driven per year. At least for the 2020 high scenario, all systems reach the break-even point within the average vehicle lifetime which is assumed to 12 years throughout the eIMPACT project.
The comparison between IVSS shows that mature systems and systems with rather low market prices (e.g. Electronic Stability Control, eCall) perform better in the break-even analysis than other systems.
The assessment of wider economic impacts (employment, fiscal, and income distribution effects) leads to the following main results:
• The production of Electronic Stability Control represents a considerable employment factor in the national and the European economy.
• The fiscal revenues from the market penetration of Electronic Stability Control and Emergency Braking – which was calculated for the year 2020 – amount to a range between 131 million EUR (scenario low) and 179 million EUR (scenario high). A comparable calculation on European level would end up with a range between 662 million EUR (scenario low) and about 1,026 million EUR (scenario high).
• Concerning income distribution no clear picture of effects can be found. However, it can be shown that especially households with more than one person and an average income receive higher shares of the benefit than they bear through the costs of IVSS.
There is no single ideal strategy to promote all selected IVSS. This is because there are different stakeholders involved per IVSS, mainly depending on whether the system is stand alone or cooperative, available on the market or near market introduction, factory-fitted or after market. In addition to these factors, whether there is an attractive business case for the stakeholder that bears the main financial load of a strategy is also crucial. It is more important to find a combination of instruments that all relevant stakeholders can agree on than merely selecting a number of instruments that are perceived to be the most effective ones.
The methodology used in eIMPACT is complete and exhaustive. The eIMPACT methodology proved able to assess both systems on the market and in development. With respect to systems in development, the method estimated the potential value of these systems. The approach can be used in the future to assess other stand-alone and cooperative IVSS as well as other ICT systems. The methodologies can be applied to safety systems as well as systems that may have other primary effects.
Deliverable D10 (incl. D9) Version 2.0 77
eIMPACT 11.08.2008
The eIMPACT methodology made use of an integrated approach with engineering, demographical, economical, psychological and behavioural views. The safety impact methodology employed nine mechanisms to address all possible effects of the IVSS, both intended and unintended, and then quantified the effects. The traffic impact assessment accounted for direct and indirect traffic effects. The socio-economic impact assessment made use of an integrated assessment framework. The stakeholder analysis extended the results of the cost-benefit analysis by exploring a wider socio-economic perspective on key interest groups: system users, OEMs and suppliers, the insurance industry and public authorities. The policy analysis identified the key elements for a successful market introduction. It also developed a methodology for support policy development for accelerated market introduction. Finally, European data compilation played a key role in producing the results in eIMPACT. The eIMPACT accident trend, market penetration scenarios, cost development, traffic forecasts and breakdown (by road category and country) all formed inputs to the eIMPACT models.
10.2 Recommendations - outlook Some basic conditions for IVSS introduction became clear during the course of the project. Firstly, the customer who may buy an IVSS needs to understand the benefits of IVSS. The customer must first be aware of the existence of these systems, in order to make a balanced judgment as to whether the (price / benefit) ratio is attractive for him or her. Secondly, the sequence of IVSS introduction has to fit into stakeholder strategies, e.g., the car manufacturers’ product philosophy and road authorities’ priorities (environment, safety, throughput). Finally, IVSS introduction will follow maturation of technologies. Systems will be bundled in order to realize synergies on the cost side. System bundles can share components, leading to cost synergies, leading to a stronger decrease of system costs.
eIMPACT carried out a single system analysis. This analysis provided insight into which systems have great potential in terms of safety. In the future, we expect combinations of systems to be offered, for either cost or effectiveness reasons. Future research can address which combinations are most effective in terms of specific impacts. The prerequisite for the analysis of such combinations of systems is the availability of accident data. It must be clear how the systems interact and what this implies for the safety and other impacts of interest – the combination impact is most likely not the same as the sum of the impacts of the individual systems.
Finally, the socio-economic assessment of different deployment strategies represents a promising field of research. When technologies become mature, the research interest naturally moves from investigating the profitability of a developed system in general to the question of an adequate deployment program.
This question is particularly important because IVSS are related to several deployment barriers (involving aspects of market failure such as congruency of beneficiaries and cost bearers, critical mass of systems, hold up problems in the insurance industry, deployment risks and ramping-up effects of the automotive industry.
Deliverable D10 (incl. D9) Version 2.0 78
eIMPACT 11.08.2008
The socio-economic assessment of deployment strategies needs a broader scope than CBA. It has to consider different stakeholder perspectives (cf. D8, [Baum et al. 2008]) in its assessment methodology. Multi criteria analysis could represent an appropriate tool for evaluating deployment programs. Assessment criteria could comprise e.g. the cost-efficiency of the deployment strategy, its practicability, the benefit-cost congruency, the financial resources needed for subsidies by the public, the incentives on industrial R&D etc.
Deliverable D10 (incl. D9) Version 2.0 79
eIMPACT 11.08.2008
Acknowledgements
The work in eIMPACT could not have been done without the support of all the partners in the eIMPACT consortium, and many people outside the consortium. We would like to thank the following people/organisations for their contribution:
• Fabrizio Minarini, eIMPACT project officer at the EC.
• The PReVENT partners and other external parties who provided information on the systems.
• The OEMs and suppliers that took part in the Scenario Workshop.
• The EUCAR working group on safety, for providing feedback on safety results.
• The partners in the TRACE-project that provided the accident data. In TRACE, the main responsible partner for providing eIMPACT with data was Loughborough University. CDV (eIMPACT and TRACE partner) had responsibility to provide the Central Eastern European accident data.
• The stakeholders who were interviewed to identify Policy options for IVSS, as well as the stakeholders who participated in the stakeholder workshop (26-02-2008, Utrecht, The Netherlands)
Deliverable D10 (incl. D9) Version 2.0 80
eIMPACT 11.08.2008
References
eIMPACT deliverables and internal reports: Alkim, T., H. Baum, J.A Bühne, T. Geißler, K. Roßrucker, A. Schirokoff, C. Vitale, and V. Zehnalova (2008), Policy Optin Framework for promotion of Intelligent Vehicle Safety Ssytems, Deliverable D5 of the eIMPACT project, contract no. 027421, 2008.
Alkim, T., H. Baum, J.A Bühne, T. Geißler, K. Roßrucker, E. Aittoniemi, A. Schirokoff, C. Vitale, and V. Hamernikova (2008), Policy recommendations to promote selected Intelligent Vehicle Safety Systems, Deliverable D7 of the eIMPACT project, contract no. 027421, 2008.
Assing, K., H. Baum, J.A. Bühne, T. Geißler, S. Grawenhoff, H. Peters, W. Schulz, U. Westerkamp (2006), Methodological framework and database for socio-economic evaluation of Intelligent Vehicle Safety Systems, Deliverable D3 of the eIMPACT project, contract no. 027421, 2006.
Baum, H., T. Geißler, U. Westerkamp and C. Vitale (2008), Cost-Benefit Analysis for stand-alone and co-operative Intelligent Vehicle Safety Systems, Deliverable D6 of the eIMPACT project, contract no. 027421, 2008.
Kulmala, R., A. Schirokoff, P. Rämä,, Niina Sihvola (2008), Safety Impacts of Stand-alone and Cooperative IVSS, WP3300 internal report of the eIMPACT project, contract no. 027421, 2008.
Schirokoff, A., P. Rämä, N. Sihvola, R. Kulmala (2008), Scenarios for market acceptance and penetration, WP3100 internal report of the eIMPACT project, contract no. 027421, 2008.
Vollmer, D., H. Baum, M. Fausten, T. Geißler, K. Malone, W. Schulz (2006), Stand alone and co-operative Intelligent Vehicle Safety Systems - Inventory and recommendations for in-depth socio-economic impact assessment, Deliverable D2 of the eIMPACT project, contract no. 027421, 2006.
Vollmer, D., H. Grezlikowski & G. Noecker (2007), TCD/ TEDS Proband-Experiment – Analyses, working document, Daimler, January 2007.
Wilmink, I., E. Jonkers, K. Malone, M van Noort, G. Klunder, R. Landman, D. Vollmer, T. Benz, (2008), Traffic impacts of stand-alone and cooperative Intelligent Vehicle Safety Systems (IVSS), WP3200 internal report of the eIMPACT project, contract no. 027421, 2008.
Wilmink, I., W. Janssen, E. Jonkers, K. Malone, M van Noort, G. Klunder, P, Rämä, N. Sihvola, R. Kulmala, A. Schirokoff, G. Lind, T. Benz, H. Peters and S. Schönebeck, Impact Assessment of Intelligent Vehicle Safety Systems, Deliverable D4 of the eIMPACT project, contract no. 027421, 2008.
Other references:
Deliverable D10 (incl. D9) Version 2.0 81
eIMPACT 11.08.2008
Van Arem, B., C.J.G. Van Driel & R. Visser (2006), The Impact of Cooperative Adaptive Cruise Control on Traffic-Flow Characteristics, IEEE Transactions on Intelligent Transport Systems, Vol. 7, no. 4, pp. 429-436, 2006.
Abele J., C. Kerlen, S. Krueger, H. Baum, T. Geißler, S. Grawenhoff, J. Schneider & W.H. Schulz (2005). Exploratory study on the potential socio-economic impact of the introduction of intelligent safety systems in road vehicles. SEiSS. VDI/VDE In-novation + Technik GmbH and Institute for Transport Economics at the University of Cologne, 2005.
AIDE Deliverable D 2.1.4. (2006). Specification of AIDE Methodology, AIDE project, 2006.
Aga, M, Okada A. (2003). Analysis of vehicle stability control (VSC) ´s effectiveness from crash data. ESV paper 541.18th ESV Conference. Nagoya, Toyota, Japan, 2003.
Alkim, T., G. Bootsma & Pierre Looman (2007), The assisted driver, Rijkswaterstaat, Roads to the Future, Delft, April 2007.
André, M., U. Hammerström & I. Reynaud (1999), Driving statistics for the assessment of pollutant emissions from road transport, Deliverable 15, MEET project, Contract no. ST-96-SC.204, INRETS report LTE 9906, February 1999.
AWAKE (2004). Deliverable 10.2: Project Final Report, AWAKE project, 2004.
Bayly, M., B. Fildes, M. Regan & K. Young (2007). Review of crash effectiveness of Intelligent Transport Systems. TRACE Deliverable D4.1.1-D6.2, 2007.
BMW (2006), Willwarn simulations, working paper, München, BMW, 2006.
Bouler Y. (2005). Overview of available studies on proven or assessed benefits of e-Call. Clarification paper – BC 1, Ekonomisk värdering av eCall i Sverige. eSafety Forum, 27.8.2005. Available at http://www.esafetysupport.org/download/socio_economic_studies/papersocioeconomicstudy.pdf
Dingus, T. A., S.G. Klauer, V.L. Neale, A. Petersen, S.E. Lee, J. Sudweeks, M.A. Perez, J. Hankey, D. Ramsey, S. Gupta, C. Bucher, Z.R. Doerzaph, J. Jermeland, & R.R. Knipling (2006). The 100-Car Naturalistic Driving Study. Phase II – Results of the 100-Car Field Experiment. NHTSA, DOT HS 810 593, 2006.
Draskóczy, M., O.M.J. Carsten & R. Kulmala (1998). Road Safety Guidelines. CODE Project, Telematics Application Programme, Deliverable B5.2, 1998.
Driel, C.J.G. van (2007), Driver Support in Congestion, TRAIL Thesis Series, The Netherlands, 2007.
EC (2001). White Paper: European transport policy for 2010: time to decide. European Commision, COM(2001) 370, September 2001.
ECORYS (2006). Cost-benefit assessment and prioritisation of vehicle safety technologies. Final Report for DG-TREN, 2006.
Ellinghaus, D. & J. Steinbrecher, Verfall der Sitten? Eine Untersuchung über die Entwicklung der Verkehrsmoral der letzten Jahrzehnte, Köln/Hannover, November 2000.
Deliverable D10 (incl. D9) Version 2.0 82
eIMPACT 11.08.2008
Elvik, R. & T. Vaa (2004). The handbook of road safety measures. Amsterdam, Elsevier, 2004.
eSAfety Forum (2005). Draft Final Report and Recommendations of the Implementaion Road Map Working Group, 2005.
EU (2005), European Union in figures, energy & transport 2005. Part 3: Transport in co-operation with Eurostat. European Commission Directorate-General for Energy and Transport. Statistical pocketbook 2005.
Fuerstenberg (2005). Pedestrian Protection based on Laserscanners. In: Porceedings of the 12th World Congress on ITS, San Fransisco, 2005.
Garder (2004). Traffic signal safety strategies: analysis of red-light running in Maine. University of Maine, Report No. ME 02-1, 2004.
Gayko, J. & T. Tsuji (2006). Honda night vision system with pedestrian detection – a system concept for Japanese driving situations. Workshop Fahrerassistenzsysteme, 2006, p. 104-111.
Geels A. (2004). E-MERGE: compiled evaluation results. E-MERGE Final report, deliverable 6.3. Cap Gemini Ernst & Young. Available at: http://www.gstforum.org/download/rescue/e-merge%20deliverables/E-MERGE%20compiled%20validation%20results.pdf.
Grömping,U., S. Menzler & U. Weimann (2004). Split Register Study: A New Method for Estimating the Impact of Rare Exposure on Population Accident Risk, based on Accident Register Dat.; ESAR-Conference, Hannover, September 2004.
Hakamies-Blomqvist (1994). Older drivers in Finland: traffic safety and behaviour. Reports from Liikenneturva (The central organisation of traffic safety), 1984.
Heidemann, D. & P. Wimber (1982), Typisierung von Verkehrsstärkeganglinien durch clusteranalytische Verfahren, Schriftenreihe „Straßenverkehrszählungen“, Heft 26, Köln, 1982.
Hogema, J. H., & A.R.A. Van der Horst (1997). Evaluation of A16 motorway fog-signalling system with respect to driving behaviour. Washington, Transportation Research Record, 1573, pp 63–67, 1997.
ICF Consulting, Ltd. & Imperial College Centre for Transport Studies (2003), Road Safety Improvements, Final Report, London, UK, 12 June 2003.
Janssen, W.H., R.F.T. Brouwer, & Y. Huang (2006). Risk trade-offs between driving behaviour and driver state. AIDE Deliverable D.2.3.2, 2006.
Koziol, J., Inman, V., Carter, M., Hitz, J., Najm, W., Chen, S., Lam, A., Penic, M., Jensen, M., Baker, M., Robinson, M. & Goodspeed, C. (1999). Evaluation of the Intelligent Cruise Control System Volume I - Study Results. U.S. Department of Transportation, Research and Special Programs Administration; John A. Volpe National Transportation Systems Center. DOT-VNTSC-NHTSA-98-3. October 1999.
Deliverable D10 (incl. D9) Version 2.0 83
eIMPACT 11.08.2008
Kulmala, R. (1995). Safety at rural three- and four-arm junctions. Development and application of accident prediction models. Espoo, Technical Research Centre of Finland, VTT Publications 233, 1995.
Langwieder, K. (2005). Wissenschaftlicher Erkenntnisstand zu ESP. 10 Jahre ESP, Berlin, February 23, 2005.
Lawrence, G.J.L., B.J. Hardy, J.A. Carroll, W.M.S. Donaldson, C. Visvikis C & D.A. Peel (2004). A study on the feasibility of measures relating to the protection of pedestrians and other vulnerable road users. Final report. EC Contract No. FIF.20030937, 2004.
Lindholm R. (2004). A Pan-European Automatic Emergency Call (eCall). Aalborg University, 2004.
Luoma, J. (1984). Autonkuljettajan visuaalisen informaation hankinta: merkityksellisen ja merkityksettömän informaation vuorovaikutus. Helsinki: Liikenneturva. Liikenneturvan tutkimuksia 64, ISSN 0782-2421, 1984, 206 p.
Malone, K., M. van Noort, T. van Rooijen & W. Savenije (2007), Traffic effects of WILLWARN, PReVENT SP WILLWARN Internal report, Report Number PR-22620-IR-070131-v10-TNO_Traffic_Simulations, January 2007.
Meinecke , M.M. & M.A. Obojski. (2005) Potentials and Limitations of Pre-Crash Systems for Pedestrian Protection. 2nd International Workshop on Intelligent Transportation, Hamburg, 2005.
National Agency for Automotive Safety & Victims’ Aid (2005), Japan, 2005.
Nilsson, G. (2004), Traffic Safety Dimensions and the Power Model to describe the effect of speed and safety. Bulletin 221. Department of Technology and Society. Lund University. Sweden.
Noecker, G., M. Strassberger, S. Mammar, A. Hiller, W. Kronjaeger, W. Seibert, H-J. Hilt, A. Hinsberger, I. Karanasiou, G. Mitropoulos, H-J. Reumerman, D. Verburg, K. Malone & D. Willemsen (2007). WILLWARN Final report. PReVENT SP Deliverable, document PR-22100-SPD-070131-v13_WILLWARN_Final_Report.pdf, 2007.
Nouvier, J. (2007) Speed management in urban areas. An international approach. 14th World Congress and Exhibition on ITS. Beijing, China, October 2007.
OECD (2003). Road safety: Impact of new technologies. Paris, France, Organisation for Economic Cooperation and Development, 2003.
Owens, D.A. & M. Sivak (1996). Differentiation of visibility and alcohol as contributors to twilight road fatalities. Human Factors, 1996(38), 680-689.
Page, B., Y-L. Foret-Bruno & S. Cuny (2005). Are expected and observed effectiveness of Emergency Brake Assist in preventing road injury accidents consistent? The 19th International Technical Conference on the Enhanced Safety of Vehicles (ESV) - Washington D.C. June 6-9, 2005.
Page and Cuny (2006) Is electronic stability program effective on French roads? Accident Analysis and Prevention 38. Volume 38, Issue 2, March 2006, Pages 357-364.
Deliverable D10 (incl. D9) Version 2.0 84
eIMPACT 11.08.2008
PROSPER (2006). Final Report: Speed management methods assessment. D1.3 Final report of the PROSPER project, contract number GRD2/2000/30217/S12.342799, 2006.
Rämä P. (2001). Effects of weather-controlled variable message signing on driver behaviour. VTT Publications 447, 2001.
Rämä, P., J. Raitio, V. Anttila & A. Schirokoff (2001). The effects of weather controlled speed limits on driver behaviour. In: Proceedings of the International Conference on Traffic Safety on Three Continents. Moscow, Ministry of Transport of the Russian Federation,2001.
Retting, R.A., A.F. Williams, D.F. Preusser, & H.B. Weinstein (1995). Classifying urban crashes for countermeasure development. Accident Analysis and Prevention 27:283-94.
Ridder, S.N. de & M. Hoedemaeker (2003). LDWA 1: Behavioral effects of Lane Departure Warning Assistance (LDWA) systems in a field operational test. Soesterberg, TNO Human Factors, Report TM-03-C034, 2003.
SafetyNet (2007), Annual Statistical Report 2006 - based on data from CARE/EC (EU-14), SafetyNet Deliverable No: D 1.9, SafetyNet, 31 January 2007
Scholliers, J., R. Kutzner, J. Luoma, N. Sihvola, S. Leanderson, M. Netto, J.M. Blosseville, M. van Noort, F. Tango, S. Koskinen, S. Joshi, G. Noecker, M. Ljung, J. Chen & M. Gemou (2008). IP_D12/D16.4 Project final report and recommendations for future assessments. PReVAL / PReVENT, 2008.
Sferco, R., Y. Page, J.Y. LeCoz, P. Fay (2001). Potential Effectiveness of the Electronic Stability Programs (ESP – What European Field Studies Tell Us), 17th International ESV Conference, Amsterdam, June 2001.
Shinar, D. (2007). Traffic safety and human behaviour. Amsterdam, Elsevier, 2007.
SRA (2002) Intelligent speed adaptation. Results of large-scale trials in Borlänge, Lidköping, Lund and Umeå during the period 1999-2002, Swedish Road Administration, 2002.
Thomas, P. (2007) Effectiveness of Electronic Stability Control Systems in Great Britain. PPAD 9/33/99 (C), Vehicle Safety Research Centre Loughborough University, 2007.
Tingvall C, M. Krafft, A. Kullgren & A. Lie (2003). The effectiveness of ESC (Electronic Stability Programme) in reducing real life accidents. ESV paper 261. 18th ESV Conference. Nagoya 2003 and Traffic Injury Prevention Vol 5 p 37-41.
Tsimhoni, O., J. Bärgman, T. Minoda & M.J. Flannagan (2004). Pedestrian detection with near and far infrared night vision enhancement. Report UMTRI 2004-38.
Tsimhoni, O., M.J. Flannagan & T. Minoda (2005). Pedestrian detection with night vision systems enhanced by automatic warnings. Report UMTRI 2005-23.
Tsuji, T., H. Hashimoto, N. Nagaoka & I. Takatsudo (2006). Development of a nighttime pedestrian recognition assistance system. 2006 SAE World Congress.
Deliverable D10 (incl. D9) Version 2.0 85
eIMPACT 11.08.2008
Virtanen, N., A. Schirokoff, J. Luoma & R. Kulmala (2006). Impacts of an automatic emergency call system on accident consequences. Downloaded from http://europa.eu.int/information_society/activities/esafety/doc/esafety_forum/ecall/ecall_safety_effects_finland_summary.pdf [referred 18.9.2006]. 15 p.
Vincent, A., I. Noy, & A. Laing (1998). Behavioural adaptation to fatigue warning systems. In: Proceedings of the 16th International Technical Conference on the Enhanced Safety of Vehicles, Windsor, Canada, 1998.
Uhler, W. (2006), Nachtsichtunterstützung, BAIKA Kooperationsforum, 06.04.2006.
Websites consulted: Eurostat (2007). http://epp.eurostat.ec.europa.eu/, Website with European statistics, consulted in 2007.
Thomas P. (2006) The accident reduction effectiveness of ESC equipped cars in Great Britain. Article downloaded from: http://www.chooseesc.eu/download/studies/esc_uk.pdf
Tingvall C, M. Krafft, A. Kullgren & A. Lie (2005). The effectiveness of ESC (Electronic Stability Control) in reducing real life crashes and injuries. Article downloaded from: http://www-nrd.nhtsa.dot.gov/pdf/nrd-01/esv/esv19/05-0135-O.pdf
Deliverable D10 (incl. D9) Version 2.0 86
eIMPACT 11.08.2008
Annex 1 Keywords
intelligent vehicle safety systems, impact assessment, penetration rates, traffic impacts, traffic safety impacts, accident causation, fatalities, injuries, congestion costs, methodology.
Deliverable D10 (incl. D9) Version 2.0 87
eIMPACT 11.08.2008
Annex 2 Glossary
The selected systems:
ESC Electronic Stability Control
FSR Full Speed Range ACC
EBR Emergency Braking
PCV Pre-Crash Protection of Vulnerable Road Users
LCA Lane Change Assistant (Warning)
LKS Lane Keeping Support
NIW NightVisionWarn
DDM Driver Drowsiness Monitoring and Warning
ECA eCall (one-way communication)
INS Intersection Safety
WLD Wireless Local Danger Warning
SPE SpeedAlert
Terms used in the safety impact analysis: accidents all accidents involving personal injury.
bus (or coach)
Motor vehicle with at least four wheels, used for transporting people. Public or private use. Type DK driving licence required (BE, GB, IE, NI). Includes bus, more than 8 and 16 seats, minibus, trolley-bus (except LU), scheduled bus, unscheduled bus, school bus.
CARE Community Road Accident Database. CARE is a Community database on road accidents resulting in death or injury (no statistics on damage – only accidents). The major difference between CARE and most other existing international databases is the high level of disaggregation, i.e. CARE comprises detailed data on individual accidents as collected by the Member States
E112 Calls made to the emergency number 112 containing location information.
FARS The Fatality Analysis Reporting System (FARS) contains data on all vehicle crashes in the United
Deliverable D10 (incl. D9) Version 2.0 88
eIMPACT 11.08.2008
States that occur on a public roadway and involve a fatality.
fatality death within 30 days of accident, except ES (24 hours), FR (6 days), IT (7 days), PT (24 hours). Suicide not included (except DK, ES, FR). Natural death not included (except LU, SE).
goods vehicle
Heavy goods vehicle: motor vehicle with at least four wheels, with a permissible gross weight of over 3.5 tons, used only for the transport of goods. With or without a trailer. Type C driving licence required. Includes road tractor, road tractor with semi trailer, lorry >3.5t, tanker.
Lorry up to 3.5 tons and van: motor vehicle with a permissible gross weight of up to 3.5 tons, used only for the transport of goods. Type BE driving licence required. Includes vans.
injured Injured in a road accident. Hospitalization or medical treatment not necessarily required (except FR). Self declaration of injury (DK if slight, FI, GB, IT, IE, NI). Opinion of the police.
Seriously injured: Injured in a road accident. Hospitalized at least 6 days (FR). Hospitalized at least 24 hours (BE, DK, ES, GR, LU, PT). Hospitalized as in-patient (DK, NL). Not hospitalized, hospitalized for observation or as in-patient (GB, IE, NI). No reference to hospitalization (AT, SE). Opinion of the police (except BE, ES, FR, LU, NL, PT). Police guidance provided (DK, GB, IE, NI). Persons died 30 days after accident included (except FR, LU, PT).
Slightly injured: Injured in a road accident. Hospitalized 6 days or less (FR). Hospitalized less than 24 hours (BE, DK, ES, GR, PT). Not hospitalized (DK, GB, IE, NI, NL). Medical treatment required (DK, FR, LU, PT). Police guidance provided (DK, GB, IE, NI). Opinion of the police.
passenger car (or taxi)
Passenger car or taxi: motor vehicle with three or four wheels, used to transport only or mainly people. Seating for no more than 8 passengers. Type BE driving licence required. Includes minibus (GB, NI). Motor vehicle with four wheels for public use in the transport of people.
PReVENT PReVENTive and Active Safety Applications. The Integrated Project PReVENT is a European automotive industry activity co-funded by the European Commission to contribute to road safety by developing
Deliverable D10 (incl. D9) Version 2.0 89
eIMPACT 11.08.2008
and demonstrating preventive safety applications and technologies.
PReVAL The PReVAL subproject provided the PReVENT project with a harmonised evaluation framework, define a methodology to be used in the impact assessment of various applications and apply the methodology to a set of given use cases.
TRACE TRaffic Accident Causation In Europe. The TRACE project looks into accident causation and the evaluation of the safety benefits of technologies.
Terms used in the traffic impact analysis:
headway
The headway between vehicles in is the amount of time that elapses between two vehicles passing the same point travelling in the same direction on a given route.
intended speed
The intended, or desired speed, is the speed that drivers choose when they are not influenced by any vehicle ahead of them.
micro-simulation
Micro-simulation models are computer models where the movements of individual vehicles travelling around road networks are determined by using car following, lane changing and gap acceptance rules.
time-to-collision
The time-to-collision is the time that remains until a collision between two vehicles would have occurred if the collision course and speed difference are maintained.
Deliverable D10 (incl. D9) Version 2.0 90
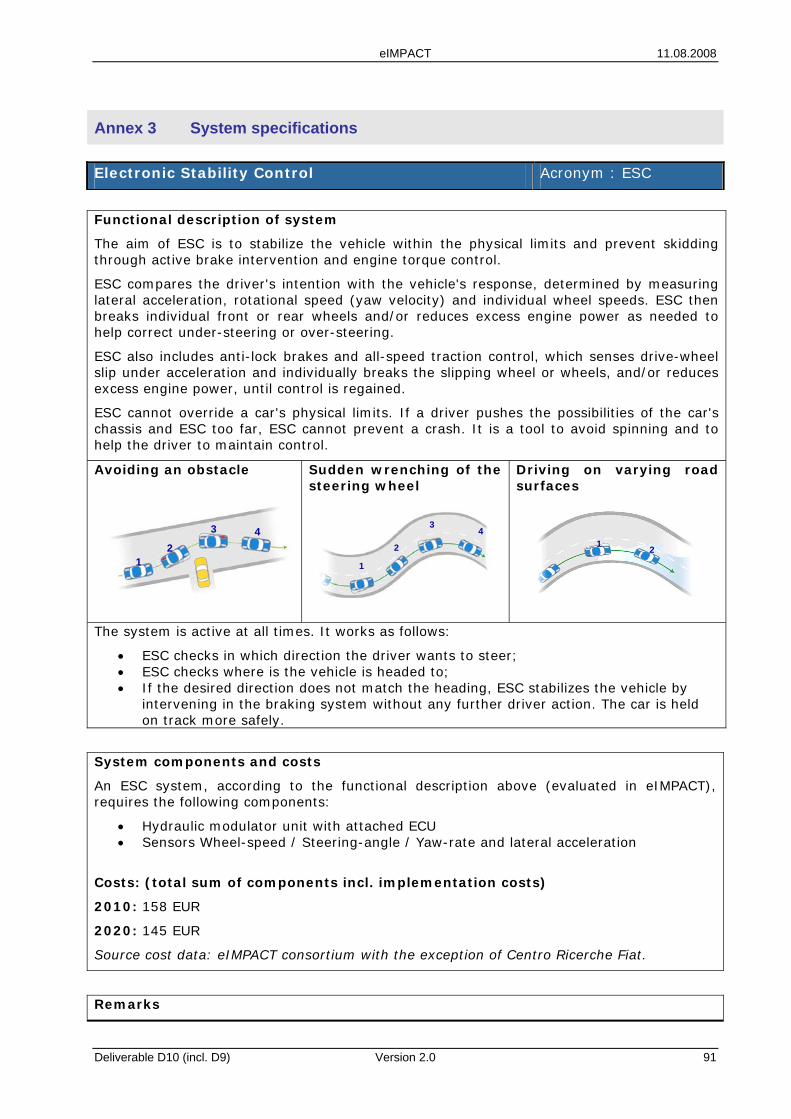
eIMPACT 11.08.2008
Annex 3 System specifications
Electronic Stability Control Acronym : ESC
Functional description of system
The aim of ESC is to stabilize the vehicle within the physical limits and prevent skidding through active brake intervention and engine torque control.
ESC compares the driver's intention with the vehicle's response, determined by measuring lateral acceleration, rotational speed (yaw velocity) and individual wheel speeds. ESC then breaks individual front or rear wheels and/or reduces excess engine power as needed to help correct under-steering or over-steering.
ESC also includes anti-lock brakes and all-speed traction control, which senses drive-wheel slip under acceleration and individually breaks the slipping wheel or wheels, and/or reduces excess engine power, until control is regained.
ESC cannot override a car's physical limits. If a driver pushes the possibilities of the car's chassis and ESC too far, ESC cannot prevent a crash. It is a tool to avoid spinning and to help the driver to maintain control.
Avoiding an obstacle Sudden wrenching of the steering wheel
Driving on varying road surfaces
The system is active at all times. It works as follows:
• ESC checks in which direction the driver wants to steer; • ESC checks where is the vehicle is headed to; • If the desired direction does not match the heading, ESC stabilizes the vehicle by
intervening in the braking system without any further driver action. The car is held on track more safely.
12
3 4
12
3 41 21 2
11
2
34
11
2
34
System components and costs
An ESC system, according to the functional description above (evaluated in eIMPACT), requires the following components:
• Hydraulic modulator unit with attached ECU • Sensors Wheel-speed / Steering-angle / Yaw-rate and lateral acceleration
Costs: (total sum of components incl. implementation costs)
2010: 158 EUR
2020: 145 EUR
Source cost data: eIMPACT consortium with the exception of Centro Ricerche Fiat.
Remarks
Deliverable D10 (incl. D9) Version 2.0 91
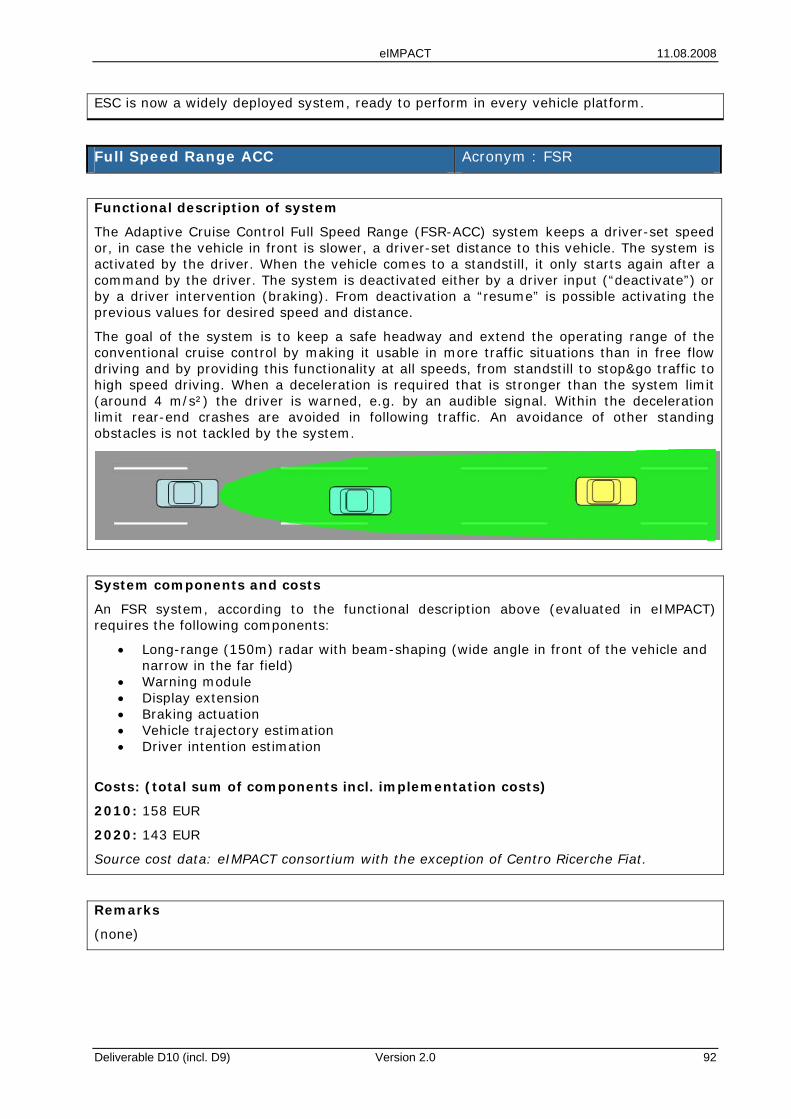
eIMPACT 11.08.2008
ESC is now a widely deployed system, ready to perform in every vehicle platform.
Full Speed Range ACC Acronym : FSR
Functional description of system
The Adaptive Cruise Control Full Speed Range (FSR-ACC) system keeps a driver-set speed or, in case the vehicle in front is slower, a driver-set distance to this vehicle. The system is activated by the driver. When the vehicle comes to a standstill, it only starts again after a command by the driver. The system is deactivated either by a driver input (“deactivate”) or by a driver intervention (braking). From deactivation a “resume” is possible activating the previous values for desired speed and distance.
The goal of the system is to keep a safe headway and extend the operating range of the conventional cruise control by making it usable in more traffic situations than in free flow driving and by providing this functionality at all speeds, from standstill to stop&go traffic to high speed driving. When a deceleration is required that is stronger than the system limit (around 4 m/s²) the driver is warned, e.g. by an audible signal. Within the deceleration limit rear-end crashes are avoided in following traffic. An avoidance of other standing obstacles is not tackled by the system.
System components and costs
An FSR system, according to the functional description above (evaluated in eIMPACT) requires the following components:
• Long-range (150m) radar with beam-shaping (wide angle in front of the vehicle and narrow in the far field)
• Warning module • Display extension • Braking actuation • Vehicle trajectory estimation • Driver intention estimation
Costs: (total sum of components incl. implementation costs)
2010: 158 EUR
2020: 143 EUR
Source cost data: eIMPACT consortium with the exception of Centro Ricerche Fiat.
Remarks
(none)
Deliverable D10 (incl. D9) Version 2.0 92
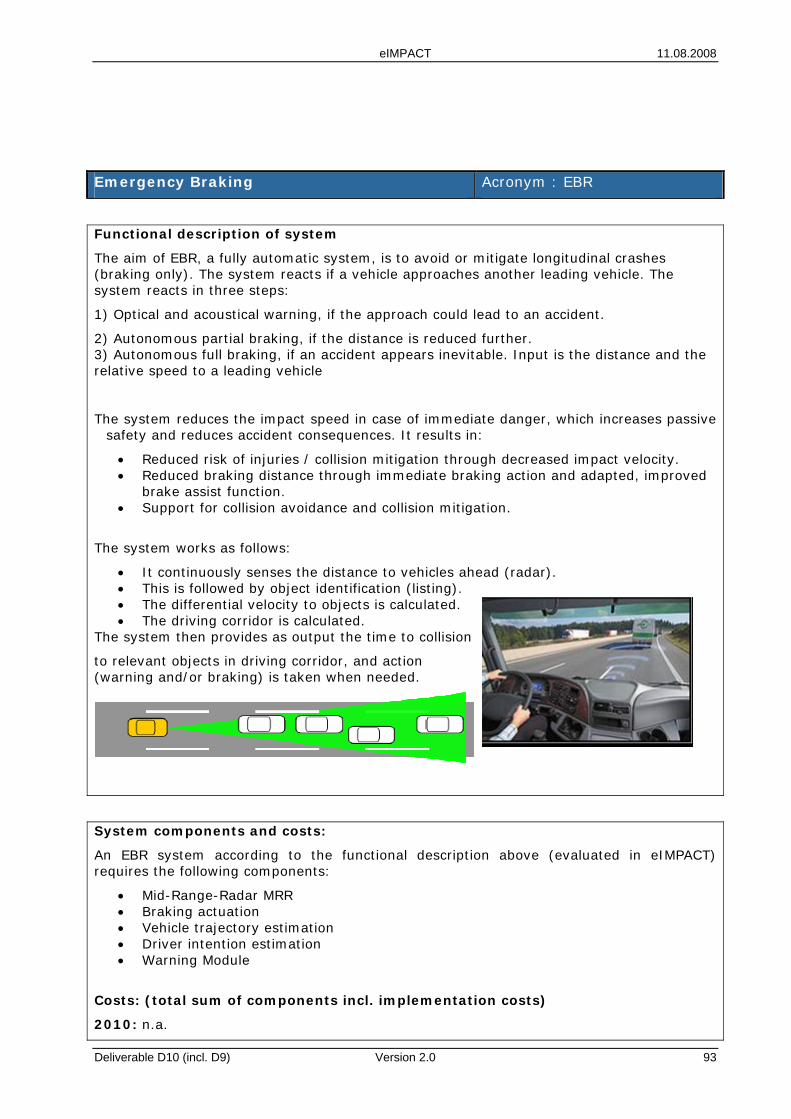
eIMPACT 11.08.2008
Emergency Braking Acronym : EBR
Functional description of system
The aim of EBR, a fully automatic system, is to avoid or mitigate longitudinal crashes (braking only). The system reacts if a vehicle approaches another leading vehicle. The system reacts in three steps:
1) Optical and acoustical warning, if the approach could lead to an accident.
2) Autonomous partial braking, if the distance is reduced further. 3) Autonomous full braking, if an accident appears inevitable. Input is the distance and the relative speed to a leading vehicle
The system reduces the impact speed in case of immediate danger, which increases passive safety and reduces accident consequences. It results in:
• Reduced risk of injuries / collision mitigation through decreased impact velocity. • Reduced braking distance through immediate braking action and adapted, improved
brake assist function. • Support for collision avoidance and collision mitigation.
The system works as follows:
• It continuously senses the distance to vehicles ahead (radar). • This is followed by object identification (listing). • The differential velocity to objects is calculated. • The driving corridor is calculated.
The system then provides as output the time to collision
to relevant objects in driving corridor, and action (warning and/or braking) is taken when needed.
System components and costs:
An EBR system according to the functional description above (evaluated in eIMPACT) requires the following components:
• Mid-Range-Radar MRR • Braking actuation • Vehicle trajectory estimation • Driver intention estimation • Warning Module
Costs: (total sum of components incl. implementation costs)
2010: n.a.
Deliverable D10 (incl. D9) Version 2.0 93
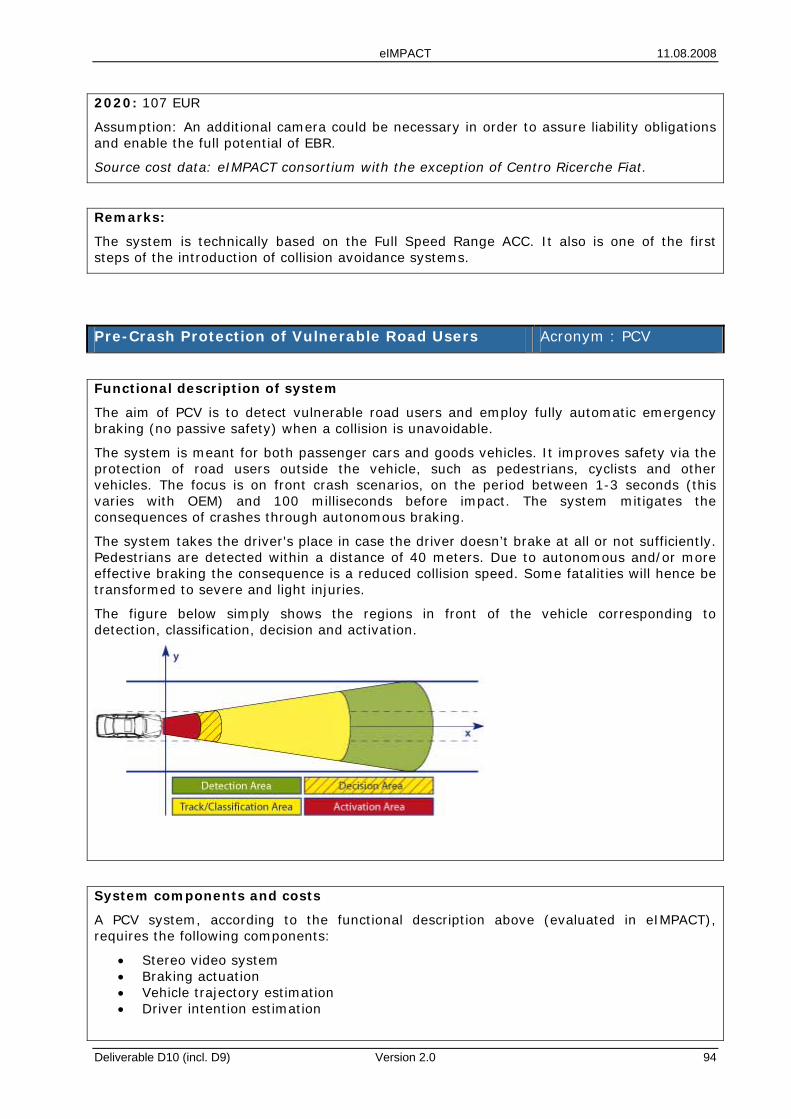
eIMPACT 11.08.2008
2020: 107 EUR
Assumption: An additional camera could be necessary in order to assure liability obligations and enable the full potential of EBR.
Source cost data: eIMPACT consortium with the exception of Centro Ricerche Fiat.
Remarks:
The system is technically based on the Full Speed Range ACC. It also is one of the first steps of the introduction of collision avoidance systems.
Pre-Crash Protection of Vulnerable Road Users Acronym : PCV
Functional description of system
The aim of PCV is to detect vulnerable road users and employ fully automatic emergency braking (no passive safety) when a collision is unavoidable.
The system is meant for both passenger cars and goods vehicles. It improves safety via the protection of road users outside the vehicle, such as pedestrians, cyclists and other vehicles. The focus is on front crash scenarios, on the period between 1-3 seconds (this varies with OEM) and 100 milliseconds before impact. The system mitigates the consequences of crashes through autonomous braking.
The system takes the driver's place in case the driver doesn’t brake at all or not sufficiently. Pedestrians are detected within a distance of 40 meters. Due to autonomous and/or more effective braking the consequence is a reduced collision speed. Some fatalities will hence be transformed to severe and light injuries.
The figure below simply shows the regions in front of the vehicle corresponding to detection, classification, decision and activation.
System components and costs
A PCV system, according to the functional description above (evaluated in eIMPACT), requires the following components:
• Stereo video system • Braking actuation • Vehicle trajectory estimation • Driver intention estimation
Deliverable D10 (incl. D9) Version 2.0 94
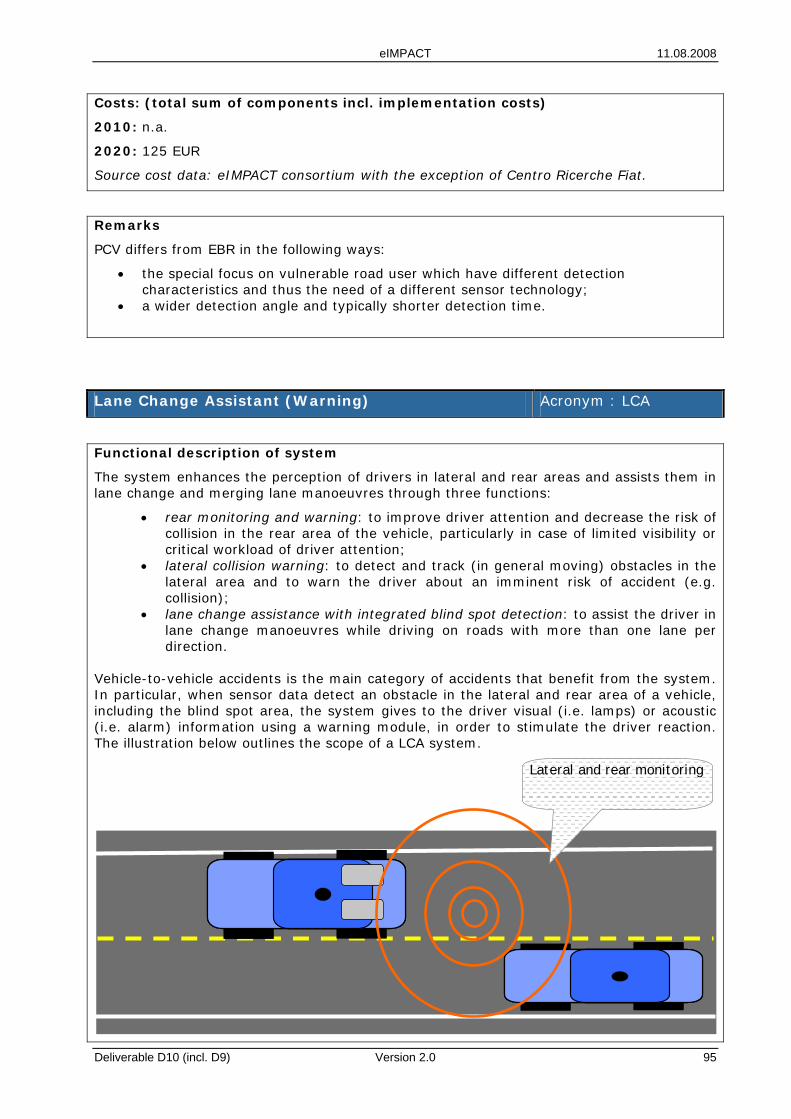
eIMPACT 11.08.2008
Costs: (total sum of components incl. implementation costs)
2010: n.a.
2020: 125 EUR
Source cost data: eIMPACT consortium with the exception of Centro Ricerche Fiat.
Remarks
PCV differs from EBR in the following ways:
• the special focus on vulnerable road user which have different detection characteristics and thus the need of a different sensor technology;
• a wider detection angle and typically shorter detection time.
Lane Change Assistant (Warning) Acronym : LCA
Functional description of system
The system enhances the perception of drivers in lateral and rear areas and assists them in lane change and merging lane manoeuvres through three functions:
• rear monitoring and warning: to improve driver attention and decrease the risk of collision in the rear area of the vehicle, particularly in case of limited visibility or critical workload of driver attention;
• lateral collision warning: to detect and track (in general moving) obstacles in the lateral area and to warn the driver about an imminent risk of accident (e.g. collision);
• lane change assistance with integrated blind spot detection: to assist the driver in lane change manoeuvres while driving on roads with more than one lane per direction.
Vehicle-to-vehicle accidents is the main category of accidents that benefit from the system. In particular, when sensor data detect an obstacle in the lateral and rear area of a vehicle, including the blind spot area, the system gives to the driver visual (i.e. lamps) or acoustic (i.e. alarm) information using a warning module, in order to stimulate the driver reaction. The illustration below outlines the scope of a LCA system.
Lateral and rear monitoring
Deliverable D10 (incl. D9) Version 2.0 95
eIMPACT 11.08.2008
Lane Change System Overview.
Two MRR components looking sidewise and backwards in conjunction and a warning module to display information are regarded as sufficient for an LCA system. A third radar looking directly backwards to monitor the rear would improve the system, but this would increase the costs of the system.
System components and costs:
An LCA system according to the functional description above (evaluated in eIMPACT) requires the following components:
• Warning Module • 2 Mid Range Radar (MRR – in the rear)
Costs: (total sum of components)
2010 : 130 EUR
2020: 103 EUR
Source cost data: eIMPACT consortium with the exception of Centro Ricerche Fiat.
Remarks
• The LCA system evaluated in eIMPACT is assumed to be active all the time and if a minimum velocity is exceeded. In addition, an LCA System could basically be designed such, that a driver could switch it off, but such a feature is not recommended.
• Including a haptic steering wheel could improve a driver´s reaction, but such a feature increases price and complexity. Hence, the eIMPACT LCA system description does not include this functionality.
Deliverable D10 (incl. D9) Version 2.0 96
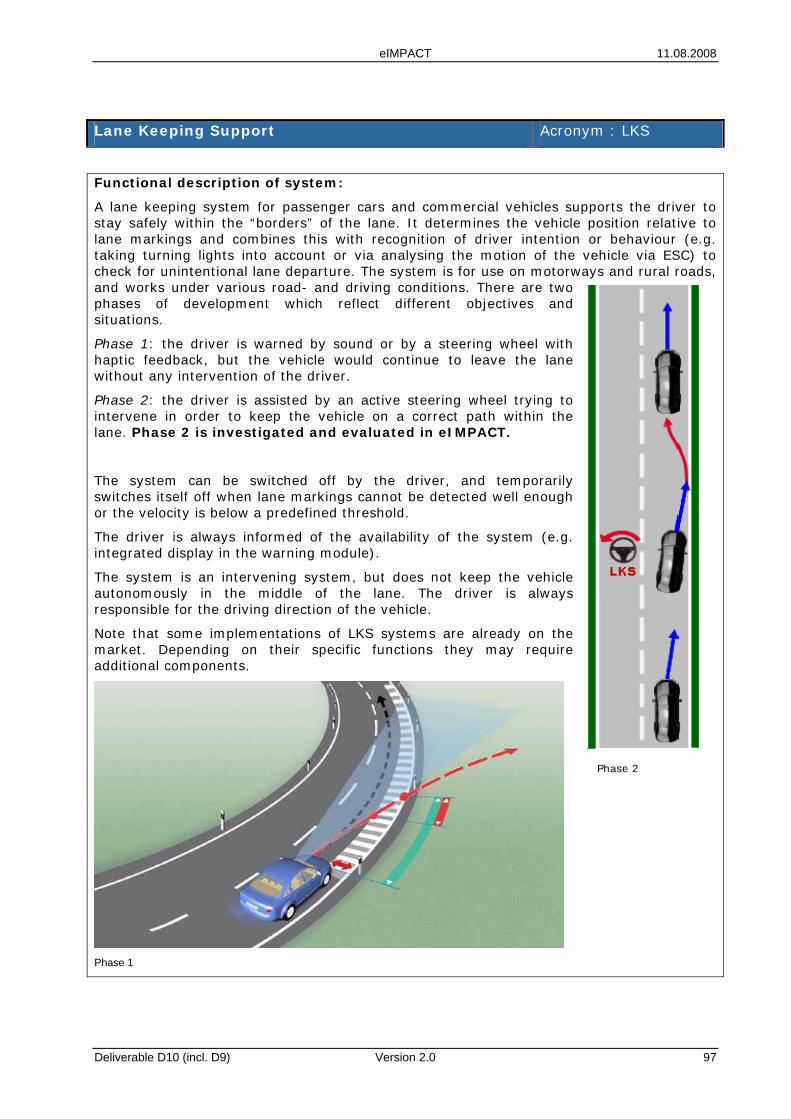
eIMPACT 11.08.2008
Lane Keeping Support Acronym : LKS
Functional description of system:
A lane keeping system for passenger cars and commercial vehicles supports the driver to stay safely within the “borders” of the lane. It determines the vehicle position relative to lane markings and combines this with recognition of driver intention or behaviour (e.g. taking turning lights into account or via analysing the motion of the vehicle via ESC) to check for unintentional lane departure. The system is for use on motorways and rural roads, and works under various road- and driving conditions. There are two phases of development which reflect different objectives and situations.
Phase 1: the driver is warned by sound or by a steering wheel with haptic feedback, but the vehicle would continue to leave the lane without any intervention of the driver.
Phase 2: the driver is assisted by an active steering wheel trying to intervene in order to keep the vehicle on a correct path within the lane. Phase 2 is investigated and evaluated in eIMPACT.
The system can be switched off by the driver, and temporarily switches itself off when lane markings cannot be detected well enough or the velocity is below a predefined threshold.
The driver is always informed of the availability of the system (e.g. integrated display in the warning module).
The system is an intervening system, but does not keep the vehicle autonomously in the middle of the lane. The driver is always responsible for the driving direction of the vehicle.
Note that some implementations of LKS systems are already on the market. Depending on their specific functions they may require additional components.
Phase 1
Phase 2
Deliverable D10 (incl. D9) Version 2.0 97
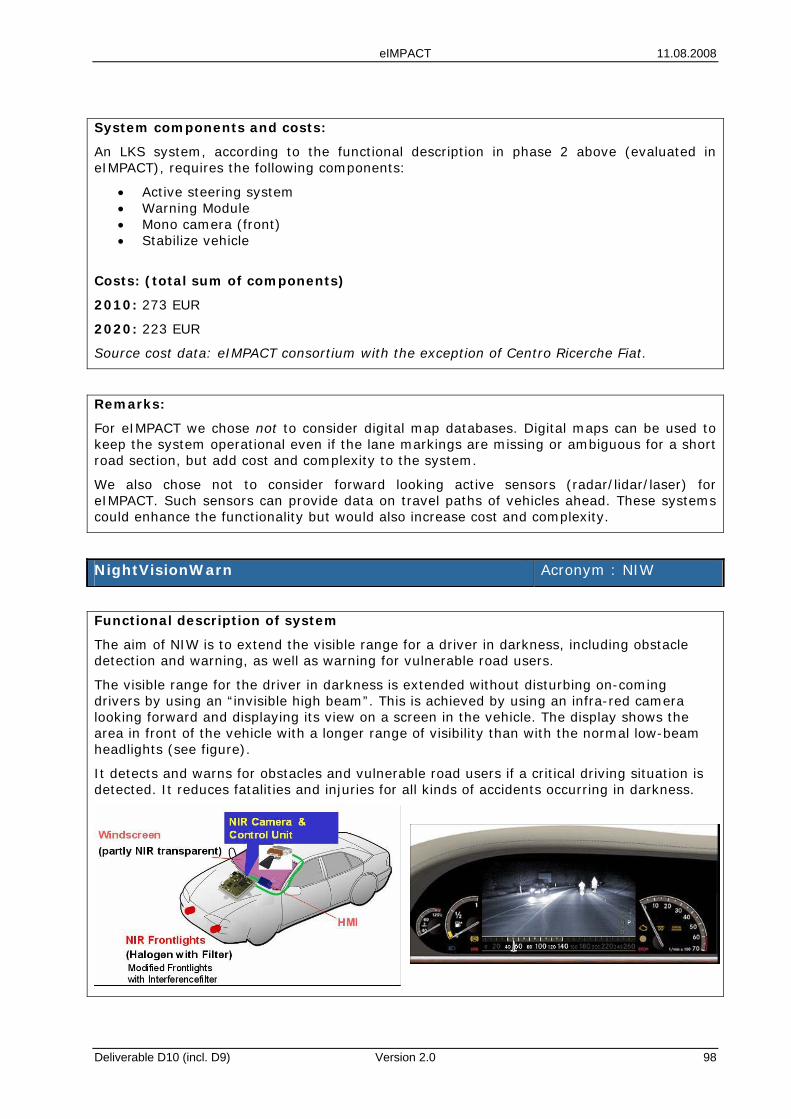
eIMPACT 11.08.2008
System components and costs:
An LKS system, according to the functional description in phase 2 above (evaluated in eIMPACT), requires the following components:
• Active steering system • Warning Module • Mono camera (front) • Stabilize vehicle
Costs: (total sum of components)
2010: 273 EUR
2020: 223 EUR
Source cost data: eIMPACT consortium with the exception of Centro Ricerche Fiat.
Remarks:
For eIMPACT we chose not to consider digital map databases. Digital maps can be used to keep the system operational even if the lane markings are missing or ambiguous for a short road section, but add cost and complexity to the system.
We also chose not to consider forward looking active sensors (radar/lidar/laser) for eIMPACT. Such sensors can provide data on travel paths of vehicles ahead. These systems could enhance the functionality but would also increase cost and complexity.
NightVisionWarn Acronym : NIW
Functional description of system
The aim of NIW is to extend the visible range for a driver in darkness, including obstacle detection and warning, as well as warning for vulnerable road users.
The visible range for the driver in darkness is extended without disturbing on-coming drivers by using an “invisible high beam”. This is achieved by using an infra-red camera looking forward and displaying its view on a screen in the vehicle. The display shows the area in front of the vehicle with a longer range of visibility than with the normal low-beam headlights (see figure).
It detects and warns for obstacles and vulnerable road users if a critical driving situation is detected. It reduces fatalities and injuries for all kinds of accidents occurring in darkness.
Deliverable D10 (incl. D9) Version 2.0 98
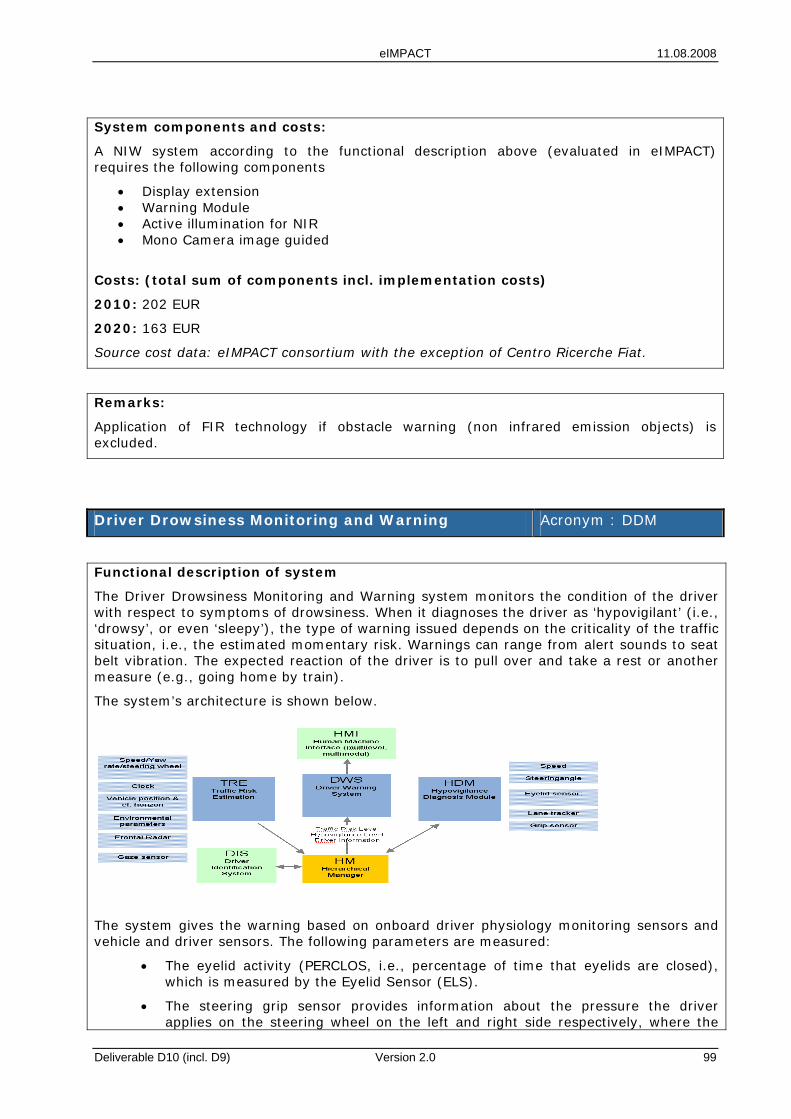
eIMPACT 11.08.2008
System components and costs:
A NIW system according to the functional description above (evaluated in eIMPACT) requires the following components
• Display extension • Warning Module • Active illumination for NIR • Mono Camera image guided
Costs: (total sum of components incl. implementation costs)
2010: 202 EUR
2020: 163 EUR
Source cost data: eIMPACT consortium with the exception of Centro Ricerche Fiat.
Remarks:
Application of FIR technology if obstacle warning (non infrared emission objects) is excluded.
Driver Drowsiness Monitoring and Warning Acronym : DDM
Functional description of system
The Driver Drowsiness Monitoring and Warning system monitors the condition of the driver with respect to symptoms of drowsiness. When it diagnoses the driver as ‘hypovigilant’ (i.e., ‘drowsy’, or even ‘sleepy’), the type of warning issued depends on the criticality of the traffic situation, i.e., the estimated momentary risk. Warnings can range from alert sounds to seat belt vibration. The expected reaction of the driver is to pull over and take a rest or another measure (e.g., going home by train).
The system’s architecture is shown below.
The system gives the warning based on onboard driver physiology monitoring sensors and vehicle and driver sensors. The following parameters are measured:
• The eyelid activity (PERCLOS, i.e., percentage of time that eyelids are closed), which is measured by the Eyelid Sensor (ELS).
• The steering grip sensor provides information about the pressure the driver applies on the steering wheel on the left and right side respectively, where the
Deliverable D10 (incl. D9) Version 2.0 99
eIMPACT 11.08.2008
variation of the steering grip pressure as a function of time is related to state of vigilance. This is combined with the PERCLOS measure to obtain a final physiological classification of drowsiness level.
• Lateral position measurement relative to the edge line of lane (using a camera); steering wheel parameters; speed and speed variability.
• Environmental parameters: road geometry, presence and location of surrounding vehicles (video-based), GPS-derived measures.
The Driver Drowsiness Monitoring and Warning system works in all lighting conditions and basically at all allowed speed ranges. The system works at all road types, although it works best on motorways because of the quality of lane markings for lateral position measurement. The limitation of the system is that lane markings should be of reasonable quality.
System components and costs
A DDM system, according to the functional description above (evaluated in eIMPACT) requires the following components:
• Warning module • Steering grip sensor • Driver monitoring camera • Mono camera for line monitoring
Costs: (total sum of components incl. implementation costs)
2010: 118 EUR
2020: 98 EUR
Source cost data: eIMPACT consortium with the exception of Centro Ricerche Fiat.Source cost data: eIMPACT consortium with the exception of Centro Ricerche Fiat.
Remarks
(none)
eCall (one-way communication) Acronym : ECA
Functional description of system
The Pan-European in-vehicle emergency call system is known as eCall. The eCall system is based on either the automatic detection of an accident with a sensor or a manual emergency call made by pushing a button. The eCall system includes both functions. In both cases a normal voice communication is opened to the emergency centre after a small delay, and accident vehicle location and identification as well as possible accident severity information is transmitted automatically. The automatic detection of an accident is based on the vehicle's sensors or the sensors built into the eCall device. The in-vehicle sensors can detect e.g. the triggering of an airbag, intense deceleration, vehicle roll-over or a sudden temperature increase. The data of the vehicle location and direction at the time of the accident is obtained from satellite positioning.
Deliverable D10 (incl. D9) Version 2.0 100
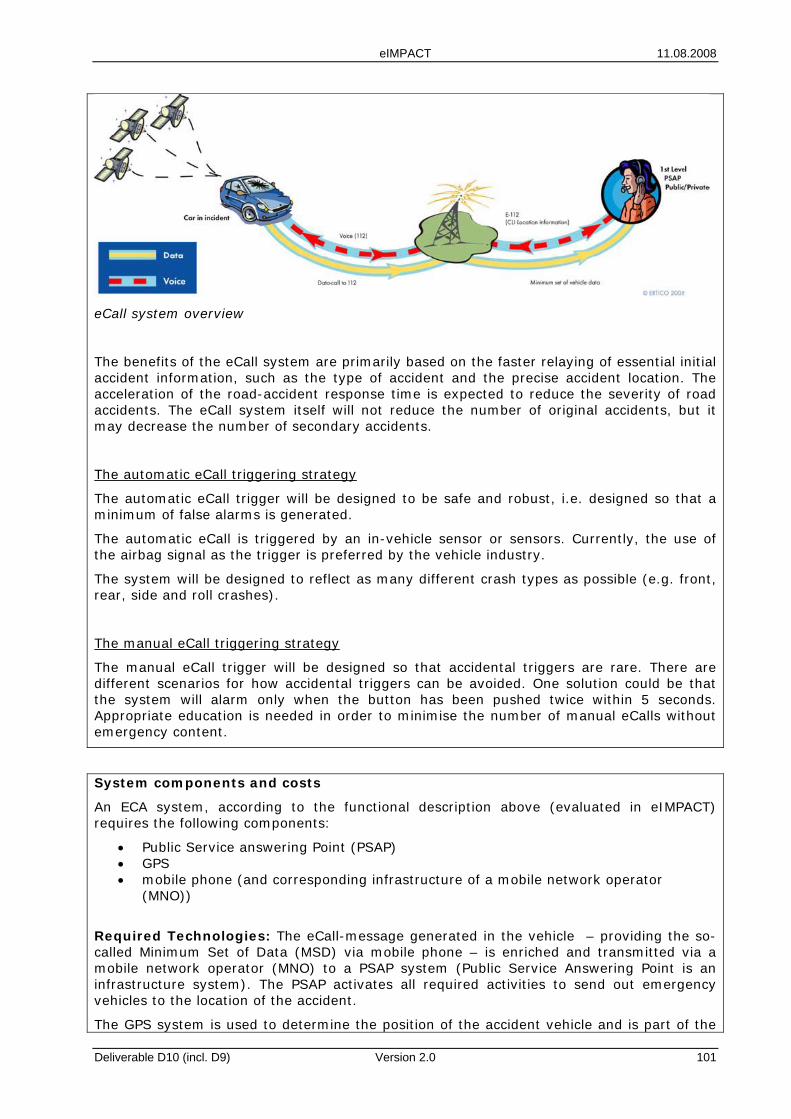
eIMPACT 11.08.2008
eCall system overview
The benefits of the eCall system are primarily based on the faster relaying of essential initial accident information, such as the type of accident and the precise accident location. The acceleration of the road-accident response time is expected to reduce the severity of road accidents. The eCall system itself will not reduce the number of original accidents, but it may decrease the number of secondary accidents.
The automatic eCall triggering strategy
The automatic eCall trigger will be designed to be safe and robust, i.e. designed so that a minimum of false alarms is generated.
The automatic eCall is triggered by an in-vehicle sensor or sensors. Currently, the use of the airbag signal as the trigger is preferred by the vehicle industry.
The system will be designed to reflect as many different crash types as possible (e.g. front, rear, side and roll crashes).
The manual eCall triggering strategy
The manual eCall trigger will be designed so that accidental triggers are rare. There are different scenarios for how accidental triggers can be avoided. One solution could be that the system will alarm only when the button has been pushed twice within 5 seconds. Appropriate education is needed in order to minimise the number of manual eCalls without emergency content.
System components and costs
An ECA system, according to the functional description above (evaluated in eIMPACT) requires the following components:
• Public Service answering Point (PSAP) • GPS • mobile phone (and corresponding infrastructure of a mobile network operator
(MNO))
Required Technologies: The eCall-message generated in the vehicle – providing the so-called Minimum Set of Data (MSD) via mobile phone – is enriched and transmitted via a mobile network operator (MNO) to a PSAP system (Public Service Answering Point is an infrastructure system). The PSAP activates all required activities to send out emergency vehicles to the location of the accident.
The GPS system is used to determine the position of the accident vehicle and is part of the
Deliverable D10 (incl. D9) Version 2.0 101
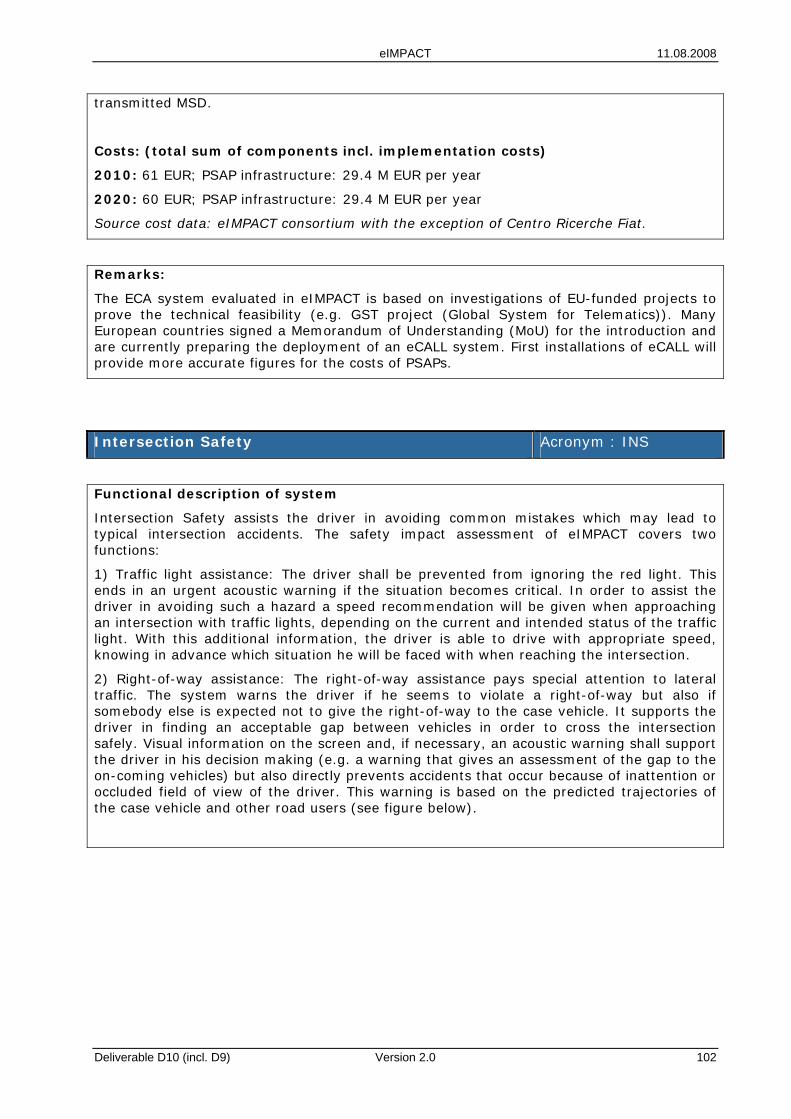
eIMPACT 11.08.2008
transmitted MSD.
Costs: (total sum of components incl. implementation costs)
2010: 61 EUR; PSAP infrastructure: 29.4 M EUR per year
2020: 60 EUR; PSAP infrastructure: 29.4 M EUR per year
Source cost data: eIMPACT consortium with the exception of Centro Ricerche Fiat.
Remarks:
The ECA system evaluated in eIMPACT is based on investigations of EU-funded projects to prove the technical feasibility (e.g. GST project (Global System for Telematics)). Many European countries signed a Memorandum of Understanding (MoU) for the introduction and are currently preparing the deployment of an eCALL system. First installations of eCALL will provide more accurate figures for the costs of PSAPs.
Intersection Safety Acronym : INS
Functional description of system
Intersection Safety assists the driver in avoiding common mistakes which may lead to typical intersection accidents. The safety impact assessment of eIMPACT covers two functions:
1) Traffic light assistance: The driver shall be prevented from ignoring the red light. This ends in an urgent acoustic warning if the situation becomes critical. In order to assist the driver in avoiding such a hazard a speed recommendation will be given when approaching an intersection with traffic lights, depending on the current and intended status of the traffic light. With this additional information, the driver is able to drive with appropriate speed, knowing in advance which situation he will be faced with when reaching the intersection.
2) Right-of-way assistance: The right-of-way assistance pays special attention to lateral traffic. The system warns the driver if he seems to violate a right-of-way but also if somebody else is expected not to give the right-of-way to the case vehicle. It supports the driver in finding an acceptable gap between vehicles in order to cross the intersection safely. Visual information on the screen and, if necessary, an acoustic warning shall support the driver in his decision making (e.g. a warning that gives an assessment of the gap to the on-coming vehicles) but also directly prevents accidents that occur because of inattention or occluded field of view of the driver. This warning is based on the predicted trajectories of the case vehicle and other road users (see figure below).
Deliverable D10 (incl. D9) Version 2.0 102
eIMPACT 11.08.2008
3) Left-turn assistance: The left-turn assistance warns the drivers about potential collision with other vehicles with crossing path. The left-turn assistance pays special attention to oncoming traffic during the left turn. According to speed and distance to conflict area of both vehicles, the controller checks the risk of the situation and presents visually a risk level (green, yellow, red) to driver. The risk level is presented with a continuous manner for the time of an identified risky situation. It supports the driver in finding an acceptable gap between vehicles in order to cross the intersection safely. Also an acoustic warning is given if the situation is dangerous (no safe left turn). Visual information on the screen and in the end acoustic warning shall support the driver in his decision making (e.g. warning that gives an assessment of the gap to the on-coming vehicles) and the system might also be able to prevent accidents that occur because of inattention or occluded field of view of the driver.
System components and costs
An INS system, according to the functional description above (evaluated in eIMPACT) requires the following components:
• V2X communication unit • Locally high resolution positioning • Digital intersection maps on lane level • Warning module
Hazardous intersections need to be equipped with a traffic status and forecast unit for all the traffic lights of the intersection.
Costs: (total sum of components incl. implementation costs)
2010: n.a.
2020: 960 EUR; infrastructure equipment: 35.2 M EUR per year
Source cost data: eIMPACT consortium with the exception of Centro Ricerche Fiat.
Remarks
INS is supposed to be a fully cooperative approach. Nevertheless, the collision avoidance function can profit from additional autonomous sensor based functions.
Wireless Local Danger Warning Acronym : WLD
Deliverable D10 (incl. D9) Version 2.0 103
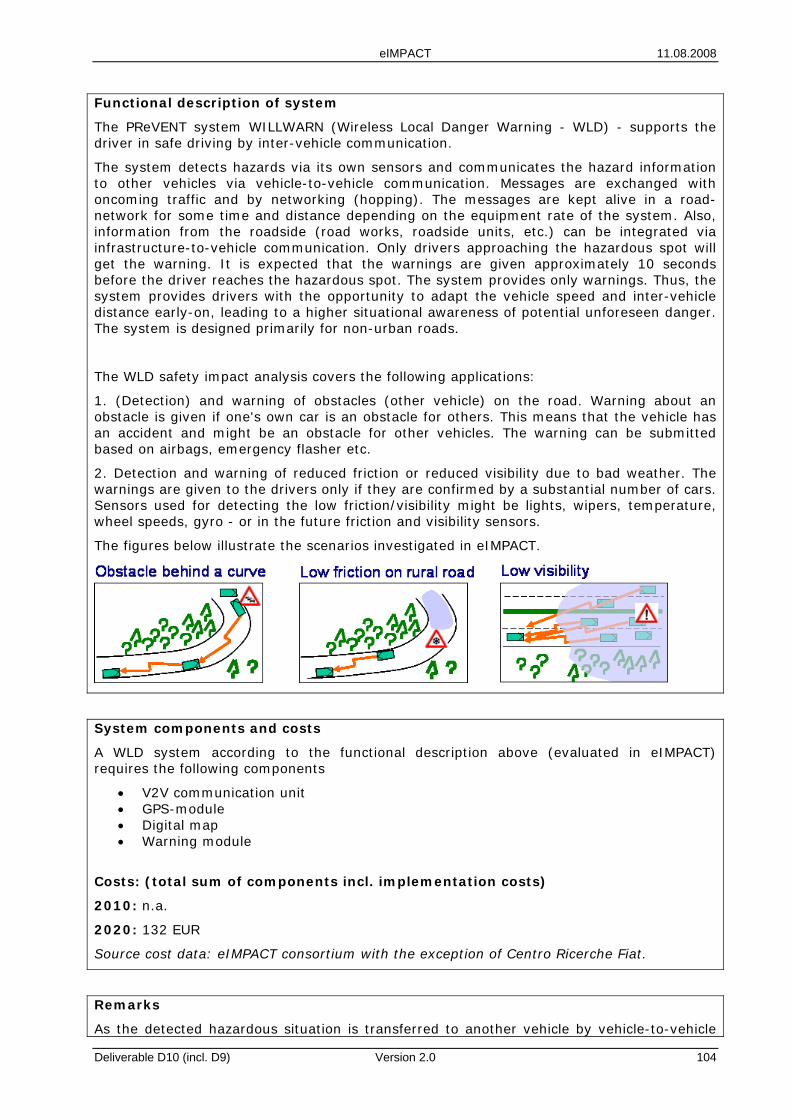
eIMPACT 11.08.2008
Functional description of system
The PReVENT system WILLWARN (Wireless Local Danger Warning - WLD) - supports the driver in safe driving by inter-vehicle communication.
The system detects hazards via its own sensors and communicates the hazard information to other vehicles via vehicle-to-vehicle communication. Messages are exchanged with oncoming traffic and by networking (hopping). The messages are kept alive in a road-network for some time and distance depending on the equipment rate of the system. Also, information from the roadside (road works, roadside units, etc.) can be integrated via infrastructure-to-vehicle communication. Only drivers approaching the hazardous spot will get the warning. It is expected that the warnings are given approximately 10 seconds before the driver reaches the hazardous spot. The system provides only warnings. Thus, the system provides drivers with the opportunity to adapt the vehicle speed and inter-vehicle distance early-on, leading to a higher situational awareness of potential unforeseen danger. The system is designed primarily for non-urban roads.
The WLD safety impact analysis covers the following applications:
1. (Detection) and warning of obstacles (other vehicle) on the road. Warning about an obstacle is given if one's own car is an obstacle for others. This means that the vehicle has an accident and might be an obstacle for other vehicles. The warning can be submitted based on airbags, emergency flasher etc.
2. Detection and warning of reduced friction or reduced visibility due to bad weather. The warnings are given to the drivers only if they are confirmed by a substantial number of cars. Sensors used for detecting the low friction/visibility might be lights, wipers, temperature, wheel speeds, gyro - or in the future friction and visibility sensors.
The figures below illustrate the scenarios investigated in eIMPACT.
System components and costs
A WLD system according to the functional description above (evaluated in eIMPACT) requires the following components
• V2V communication unit • GPS-module • Digital map • Warning module
Costs: (total sum of components incl. implementation costs)
2010: n.a.
2020: 132 EUR
Source cost data: eIMPACT consortium with the exception of Centro Ricerche Fiat.
Remarks
As the detected hazardous situation is transferred to another vehicle by vehicle-to-vehicle
Deliverable D10 (incl. D9) Version 2.0 104
eIMPACT 11.08.2008
communication, not only the traffic density, but also the penetration level of WLD vehicles needs to be high enough to be able to achieve the maximum safety effects of the system. The concept of warning dissemination and transport in the car used in WLD enables a high benefit even at low equipment rates.
SpeedAlert Acronym : SPE
Functional description of system
Speed Alert is a map and camera based system warning for speed limits by use of a haptic gas pedal and a warning module for when the speed limit is exceeded. The goal is to reduce the number of accidents due to speeding. The system informs about static, temporary and variable speed limits. The driver remains responsible for maintaining a safe and proper speed. The system does not monitor the conditions of the road, tires, etc.
The system is introduced in 2 phases:
• Phase 1: Stand-alone system that gives speed limit advice based only on static and fixed time dependent speed limits. This system will be operational in 2010.
• Phase 2: Cooperative system that also takes into account information broadcast by traffic centres, VMS-es and beacons, and gives speed advice not only based on speed limits but also based on recommended speeds. In particular, the system dynamically recommends speeds in curves, near work zones and schools, on slopes and bridges, and for events, weather and traffic. This system will be operational in 2020.
A display informs the driver of the present speed and numeric speed limit, with additional colour coding (green = below speed limit, yellow = slightly above, red = far above). A special symbol is used if there is insufficient data. We propose to use separate symbols to distinguish between speed limits and advisory speeds (e.g., a red circle for speed limits and a blue background for advisory speeds). If the speed limit is exceeded by a certain margin for a prolonged time (in the order of seconds), the driver is warned by an additional audio signal, optionally combined with a haptic signal through the accelerator. The margin is in the 0 – 20 km/h range, for example 10 km/h if speed enforcement is unlikely, and 5 km/h if likely. This can be set by the driver.
The system can be switched off by the driver.
It is assumed that it will take some time to deploy full coverage of speed limits on digital maps by map providers. Improvement of the speed limit data update process will improve the data quality by 2010. Provision of variable and temporary speed limits is included in the 2020 system.
System components and costs
A SPE system according to the functional description above (evaluated in eIMPACT) requires the following components
• Positioning system (GPS/GNSS) • Digital maps with static speed limit • mono camera (front) • Display extension
Deliverable D10 (incl. D9) Version 2.0 105
eIMPACT 11.08.2008
• Haptic gas pedal • DAB (digital audio broad-cast) (2020) • SRC (sample rate conversion) (2020) • GPRS (general packet radio service) (2020)
Costs: (total sum of components incl. implementation costs)
2010: 233 EUR
2020: 200 EUR
Source cost data: eIMPACT consortium with the exception of Centro Ricerche Fiat.
Remarks
The Speed Alert system evaluated in eIMPACT is based on the technological concept developed by the SpeedAlert consortium.
The maps are updated once per year (through CD/DVD) from 2010 onwards, and on-the-fly from 2020 onwards.
In 2010 the maps will have 90% coverage of main roads (motorways, national highways) and 20% coverage of urban and rural roads. In 2020 these figures are 100% and 80%, respectively.
Deliverable D10 (incl. D9) Version 2.0 106