Embed Size (px)
Citation preview


E I M 2 0 1 5
ContEnt 2 P r e s i d e n t ’s L e t t e r
6 A m e r i c a n E l e c t r i c P o w e r
8 E x e l o n
1 0 S o u t h e r n C o m p a n y
1 2 W G L
1 4 F i n a n c i a l s
3 0 E I M D i r e c t o r s
3 2 B o a r d C o m m i t t e e s
3 3 I n s u r a n c e A d v i s o r y C o m m i t t e e
3 4 o f f i c e r s
3 6 M e m b e r s
3 7 C o m p a n y L o c a t i o n s
A n n u A L r E P o r t E I M 2 0 1 5

EMBrACInG A StronG EntErPrISE rISk CuLturE.FroM thE PrESIDEnt AnD ChIEF ExECutIvE oFFICEr
Energy Insurance Mutual will commemorate its 30-year anniversary in 2016, and, in recognition of this milestone, the Company celebrated the theme of “Standing the Test of Time” at its February Risk Managers Information Meeting.
Over the last three decades, EIM members have seen the Company grow from a founding membership of 17 utility companies with $75 million in capital to a company with 166 Members and $972 million in policyholders’ surplus.
As EIM’s Chairman, Ben Fowke, noted in his opening comments at the February conference, “Standing the test of time is not something that simply happens. It takes a solid foundation, ongoing commitment and an unwavering dedication to excellence.”
EIM’s ability to stand the test of time is reflected in its capacity to manage volatility and respond to tail events occasioned by catastrophic or systemic losses. 2015 offered a telling example of EIM’s ability to withstand significant loss activity while still increasing policyholders’ surplus.
In the face of $238 million in gross losses and a turbulent investment environment, EIM was able to grow policyholders’ surplus by $14 million while achieving a net loss ratio of 96%, returning 2% on its investment portfolio, and maintaining a net expense ratio under 8%.
The underlying dynamics allowing EIM to absorb and rebound from active loss years revolve around a number of factors, including a solid enterprise risk management framework, a strong capital base, prudent investment and underwriting practices, and consistent Member Company support.
SoLID EntErPrISE rISk MAnAGEMEntThe foundation for any organization built to stand the test of time is an enterprise risk management (ERM) process designed to identify, monitor and manage the varied risks attendant to its business activities.
ENER
GY IN
SURA
NCE M
UTUA
L – AN
NUAL
REP
ORT
2

EIM regularly assesses key risks and tracks 19 metrics intended to determine whether key risk exposures remain within the Company’s stated risk tolerance.
Encompassing underwriting, investment, operations, finance, and capital adequacy measures, the ERM process increases the probability of stable operating results over extended periods of time. With a stated risk tolerance of operating to no more than a 10% likelihood of losing 20% of policyholders’ surplus in any one fiscal year, EIM employs the ERM process to highlight any areas of key risk that may jeopardize this objective. This commitment to a conservative risk management approach, anchored by a disciplined ERM process, permeates all aspects of EIM’s operating philosophy.
A StronG CAPItAL BASE While generating $216 million in gross written premium, EIM maintains surplus of $972 million. With most commercial insurer premium to surplus ratios running in the neighborhood of 1:1, EIM maintains a highly conservative ratio of 1:3.84. Equally important, EIM is committed to maintaining sufficient surplus to withstand a 1:200 tail value at risk (TVaR) event and still maintain an “A” rating from A.M. Best. EIM defines this benchmark as its “risk capacity.”
At year-end 2015, EIM’s risk capacity stood at 130%. By maintaining substantial capital and surplus, EIM is not only able to withstand significant loss activity in any given calendar or underwriting year, but also rebound strongly from “down” years.
This strong capital base enabled EIM to provide a $20 million distribution to member companies in 2015, bringing total distributions over the last four years to $78 million.
standing the test of time
3

A key component to a strong capital base is EIM’s core reinsurance program. During its 30-year history, EIM has enjoyed a strong relationship with longstanding reinsurance partners who backstop years where substantial losses are incurred. With aggregate combined General Liability and Directors and Officers reinsured limits of $327 million, EIM has less than a 1% likelihood of experiencing losses that exhaust its reinsurance protection. Equally important, EIM’s current reinsurance structure enables the Company to benefit from strong underwriting years while protecting against years where loss activity spikes.
PruDEnt InvEStMEnt AnD unDErWrItInGEIM’s commitment to a strong capital base is further reflected in the Company’s prudent investment and underwriting practices. In recent years, EIM has pared the equity exposure in its investment portfolio to less than 25% of its invested assets and moved approximately 10% of its portfolio into alternative investments that include high yield bank loans and real estate trusts. As a result, EIM’s $1.5 billion investment portfolio is predominately fixed income assets, balanced by equity and alternative components that offset the risk of inflation or rising interest rates. EIM routinely subjects its investment portfolio to stress testing to determine the impact of tail events on portfolio performance and overall value.
This testing has enabled EIM to tailor its portfolio allocations to achieve marginally higher returns without increasing overall risk. In 2015, where investments provided a total return of 2% in a highly volatile equity market, the portfolio was bolstered by strong alternative investment performance.
EIM is cognizant of the significant limits it offers through its General Liability ($100 million) and Directors and Officers ($50 million) policies and carefully monitors both price and attachment points for each line of business.
Where EIM has determined that risk might outstrip potential return, it has regularly taken steps to reduce exposure. In 2008, when California wildfire activity dramatically increased, EIM sub-limited this exposure to $25 million. The Company continues to review not only California wildfire exposure but wildfire activity outside of California as well. EIM’s recent entry into cyber liability coverage includes an annual aggregate limit of $50 million, and its newly-formed cyber partnership with Nuclear Electric Insurance Limited contains aggregate caps. Likewise, EIM’s property portfolio includes an aggregate limit of $25 million for wind and quake exposures. In short, by carefully assessing the underlying characteristics of its underwriting portfolio, EIM is able to offer consistent pricing in the face of a cyclical commercial market and, where necessary, can adjust limits, attachment points or net retentions to ensure that premium is reflective of risk.
ENER
GY IN
SURA
NCE M
UTUA
L – AN
NUAL
REP
ORT
4

Scott K. GoodellPRESIDENT AND ChIEF ExECuTIVE OFFICER
ConSIStEnt MEMBEr CoMPAny SuPPortA key element of EIM’s ongoing stability is Member Company support.
Despite continued industry consolidation in 2015, EIM achieved a 98% retention rate (exclusive of merged companies) and welcomed seven new Members.
Without the continued loyalty of Member Companies, EIM could not have enjoyed the success it has experienced over the last three decades, nor could it have provided the stable capacity and substantial loss payments that have defined the Company since its founding.
Integral to Member Company support is the leadership and insight provided by EIM Board members, together with the guidance and feedback provided by the Insurance Advisory Committee and Member Company risk managers. EIM is only as strong as the allegiance of its membership. Equally important is the exceptional performance of EIM, Energy Insurance Services, Inc. and Energy Captive Management, LLC staff who so effectively carry out the Member Company vision and mission.
For 30 years, these four defining characteristics have enabled EIM to consistently grow surplus, offer meaningful excess of loss insurance limits and pay more than $1.9 billion in losses to Member Companies, while returning $258 million in capital in the form of annual distributions.
As EIM enters the final year of its current three-year strategic plan, the Company is poised to exceed $1 billion in policyholders’ surplus, almost 4% higher than projected at the strategic plan’s inception in 2014.
The three-year net loss ratio is on track to better the 90% target, while EIM’s net expense ratio and net written premium are also expected to beat forecast. These results are a testament to the strong enterprise risk culture embraced by EIM and the steadfast support provided by Members Companies, traits that provide a solid foundation on which to continue standing the test of time.
standing the test of time
5

AMErICAn ELECtrIC PoWErMorE thAn A CEntury oF InnovAtIvE SoLutIonS.
For American Electric Power (AEP), standing the test of time hasn’t meant sticking to established processes or timeworn technologies. The electric utility company has embraced innovation for 110 years—developing breakthroughs to enhance the quality of life for customers, create consistent value for investors and provide groundbreaking solutions for the industry. It is how AEP lives up to its promise as America’s Energy Partner.
A BoLD MovE toWArD EnErGy EFFICIEnCyBOLDTM Transmission is an ideal example of AEP’s forward thinking. AEP engineers developed the next-generation transmission line design with BOLD™ (Breakthrough Overhead Line Design) to address the challenges of siting large
infrastructure. BOLD’s lower profile tower is a preferred design because of its electrical efficiencies that can reduce right-of-way land needs. BOLD’s value is significant, especially to replace aging infrastructure throughout the united States. BOLD Transmission, which holds patents in the u.S. and Canada, has patents pending in Mexico, South Korea, China and the European union, and is being marketed globally.
It is how AEP lives up to its promise, as America’s Energy Partner.
EnGAGInG EMPLoyEESAEP believes a strong and healthy culture is essential to helping its employees understand how they contribute to the company’s ability to achieve its goals. AEP’s focus on culture is fostered by collaborative, supportive leaders who provide timely feedback and recognition, and continuously engage their employees. One way AEP engages employees is through continuous improvement initiatives that lead to process changes, waste elimination and cost savings that have sustainable positive bottom line impacts.
ENER
GY IN
SURA
NCE M
UTUA
L – AN
NUAL
REP
ORT
6

rEPoSItIonInG For thE FuturE Technology and having a balanced, affordable energy mix are essential to a reliable, secure supply of electricity. AEP is transforming its resource mix to be more diverse by adding natural gas and renewable generation. Experienced at owning, operating and maintaining large-scale energy infrastructure, Indiana Michigan Power Company is building four new universal solar facilities in Indiana—a first for AEP. The four facilities will have a combined capacity of 14.7 megawatts. AEP has contracted for over 3000 MWs of wind and solar via power purchase agreements (PPAs) and plans to own more in the future.
AEP’s commitment to enhancing the customer experience includes its interactions with customers. AEP is developing a long-term plan to increase its online presence that would allow for expanded monitoring, reporting and analysis of the communication channels used by customers. For four years in a row, the J.D. Power utility Website Evaluation Study ranked AEP’s customer websites as the best in the industry.
AEP’s smart grid initiative is the foundation for providing advanced grid infrastructure that is needed to realize the potential benefits of a modern grid. AEP is deploying smart grid technologies across its service territory. AEP has installed more than 1.6 million smart meters across its system with plans to install an approximately 900,000 additional meters.
rISk MAnAGEMEnt ADvAnCES ForWArD-thInkInGAccording to Lisa Groff, Managing Director Risk and Insurance Management, “AEP’s objective is to be able to make investments and grow the business and not be forced to respond to unexpected losses by dipping into capital reserves or other financial resources
which impact our strategy. Also, AEP is developing the capability to analyze the data to make the retain/transfer/mitigate decisions with complete information and transfer the risks to others when economic and efficient to do so.” Lisa has more
than 20 years of experience in risk management in the energy industry including 15 years in AEP’s Credit Risk Group, supporting trading and marketing activities.
GIvInG BACk throuGh CorPorAtE GIvInGCorporate giving is an important part of building strong communities. AEP’s main areas of focus are education, basic human needs, such as hunger and housing, safety and health, and the environment. In 2015, AEP and the American Electric Power Foundation donated approximately $13.5 million to support 1,800 community organizations. AEP’s signature program—Credits CountSM—is a five-year dual enrollment program to help high school students pursue college-level STEM (Science, Technology, Engineering, Mathematics) education and careers while completing their high school diploma. Since launching in 2013, the AEP Foundation has committed more than $11 million over multiple years in five states.
Lisa Groff
standing the test of time
7

ExELonA SoLID FuturE BuILt on A SuCCESSFuL PASt.
Exelon is a leading u.S. competitive energy provider with one of the nation’s cleanest, lowest-cost generation fleets and some of the largest competitive retail and regulated customer bases in the united States. The company’s core businesses—power generation, energy sales and utilities—have provided a stable base for exploring promising new opportunities like wind and solar. In addition, a careful balance of regulated and unregulated businesses has enabled Exelon to build a strong business model for growth and diversity.
EMBrACInG ChAnGE CoMPAny-WIDEExelon’s culture of shared principles remains dedicated to four key areas, where well-timed changes help it maintain industry leadership:
Safety – Exelon has made an ironclad commitment to send every employee home safely each night. A recently revamped safety program has delivered a consistent decline in OShA incident rates.
Excellence – Performance records back up Exelon’s commitment to promoting a culture that helps people excel—whether that means achieving consistent, industry-leading availability factors at nuclear power plants or modernizing the electric grid.
Innovation – Reliable and affordable power has now become the bare minimum for customer satisfaction. To give customers the power to choose, Exelon has expanded its offerings to include options for money-saving, customization and reducing the carbon footprint.
An Inclusive and Diverse Team – Exelon’s values are lived by the company’s diverse, but inclusive team of 34,000 employees. Team members draw from varied individual backgrounds to help Exelon effectively weather current economic challenges, while planning for the future.
ACCELErAtInG FuturE SuCCESSIn 2015, Exelon businesses delivered impressive results. Each of its utilities maintained top-quartile performance for its customers. In addition, the company earned placement on the Dow Jones Sustainability Index for North America for the 10th consecutive year, and has been named to the Carbon Disclosure Project’s Leadership Index for climate change transparency for six consecutive years.
Exelon hopes to build on this success to accelerate the transition to clean energy. The company is also investing in emerging markets and technologies to enable it to thrive as the industry undergoes EN
ERGY
INSU
RANC
E MUT
UAL –
ANNU
AL R
EPOR
T
8

fundamental changes. At the same time, Exelon continues to invest in core markets, bringing together top-performing electric and gas utilities to create the leading mid-Atlantic energy provider.
MAkInG rISk MAnAGEMEnt PArt oF thE PLAnAs the company continues to invest in new technologies, risk management becomes a key enabler. According to Michael Mee, Director, Insurance, “Exelon’s Enterprise Risk Management Group integrates risk analytics into the company’s strategic and
business planning process. This ensures the preservation of core assets as we expand into promising and more diversified ventures.”
Simply put, the more efficiently the company mitigates risks, the greater it succeeds in meeting its ongoing diversification objectives.
A hIStory oF GEnEroSItyExelon has a solid history of promoting quality of life initiatives in education, the environment, arts and culture. In 2015, Exelon volunteers contributed more than 129,000 hours to charitable causes and Exelon gave $36.7 million to nonprofits companywide.
Its efforts have included a $5 million contribution to Chicago’s 606, an old rail line converted to green space, along with a grant used to design educational programs for the 25 schools located along the line. In a joint effort with ComEd and the united Way of Metropolitan Chicago, Exelon has helped fund the Stay in School Initiative since 2005.
Employee volunteers have also contributed their time for one-on-one mentoring through the program.
For Exelon, bridging a solid past with an equally promising future has been a win-win proposition for both the company and the communities it serves.
Michael Mee
9
StAnDInG thE tESt oF tIME

SouthErn CoMPAnyMEEtInG thE rEGIon’S nEEDS, “SouthErn StyLE.”
A unique set of behavior and values has earned Atlanta-based Southern Company more than 4.5 million customers, approximately 46,000 megawatts of generating capacity and bragging rights as the premier energy company serving the Southeast through its subsidiaries. The company owns electric utilities in four states, a growing competitive generation company, as well as fiber optics and wireless communications. It credits its long-term success to excellent customer service, high reliability, affordable prices and something it dubs, its unique “Southern Style.”
According to Ed holland, President and CEO of Southern Company holdings, Sr. Vice President of Southern Company Services and
current director of EIM,“Southern Company is an industry leader in providing clean, safe, reliable and affordable energy. By developing the full portfolio of energy resources — including nuclear, 21st century coal, natural gas, renewables and energy efficiency —and creating new products and services, Southern Company is inventing America’s energy future for the benefit of customers.”
InvEntInG AMErICA’S EnErGy FuturEusing industry-leading innovation, Southern Company subsidiaries are inventing America’s energy future through a diverse portfolio of energy resources. These include nuclear, 21st century coal, natural gas, renewables, as well as a number of new products and services. The company’s four-pronged approach emphasizes clean, safe, reliable and affordable energy; reduction of its environmental impact; good stewardship; and a substantial investment in its employees.
The latter has earned Southern Company a long list of accolades. Among them, distinction as a top military employer by the u.S. Department of Defense and G.I. Jobs magazine, a spot on Black Enterprise magazine’s list of 40 Best Companies for Diversity and hispanic Network distinction as one of the 2014 Top Employers for hispanics.
Additionally, the company’s commitment to nuclear development has merited the 2014 National Award of Nuclear Science and history from the National Atomic Museum Foundation. Most notably, Fortune magazine has named Southern Company to its 2016 “World’s Most Admired Companies” list, marking the seventh consecutive year the company has earned recognition among the publication’s top three utilities worldwide. Fortune
Ed Holland
ENER
GY IN
SURA
NCE M
UTUA
L – AN
NUAL
REP
ORT
10

recognized Southern Company as an industry leader for its quality of management, value as a long-term investment, the quality of products/services offered and its innovation.
A SouthErn StyLE CuLturEBelieving that the actions of its people are integral to its reputation, Southern Company has created a culture of unquestionable trust, superior performance and total commitment to employee success. To this end, the company has made substantial investments in the areas of safety, opportunity, stability, challenge and diversity.
Southern Company employees seem to appreciate the company’s efforts. The current employee tenure rate averages an impressive 17 years.
EnErGIzInG thE rEGIonGenerating electricity to 4.5 million people makes Southern Company a key influencer in the region it serves. The company considers this an important responsibility. It works hard to keep electricity costs manageable, particularly for businesses requiring solutions to lower operating costs. Overall, the company’s affordable options play a key role in keeping the entire region globally competitive.
Southern Company’s success has also resulted in corporate and foundation support for a wide range of community causes. These include arts and culture, health and human services, civic and community projects, safety, education and the environment. Total giving, including all company subsidiaries, exceeded $41 million in 2014. Conservation of the environment alone has received nearly $11.6 million over the past decade.
Overall, the company’s affordable options play a key role in keeping the
entire region globally competitive.
LIGhtInG thE WAy to A BrIGhtEr FuturESouthern Company continually evaluates risk scenarios involving interrelated factors such as fuel market conditions and prices, as well as environmental requirements, including possible climate change regulation. This information helps the company work with regulators to develop action plans addressing both short- and long-term implications.
The process ensures reliable, affordable service as the company adapts to changing conditions. It’s a strategy that has successfully served Southern Company and its subsidiaries—and even more important, their customers, employees, investors and communities—for well over a century.
standing the test of time
11

WGLthE EnErGy to ChAnGE WIth thE tIMES.
WGL has not only recognized industry change, it has embraced it. The company has worked hard to effectively align its utility-based strengths with evolving customer needs, adopting new technology to give customers greater control over energy use. A diverse portfolio of solutions includes natural gas, electricity, green power, carbon reduction, distributed generation and energy efficiency.
GroWth rootED In CorE ExPErtISEAlthough WGL began as a natural gas provider 167 years ago, it has since branched out through WGL Energy Systems, providing distributed gener-ation and energy efficiency solutions for commercial, campus and govern-ment accounts; WGL Energy Services for natural gas, electricity, wind/renewable energy credits and carbon offsets in competitive energy markets; and WGL Midstream, a natural gas storage and transportation business serving the wholesale market.
While these businesses deal in diverse types of energy, they all remain true to the company’s core expertise—the ownership and effective management of energy infrastructure. WGL maintains its commitment to an asset-based growth strategy, designed to provide the best solutions for customers and predictable, steady returns for shareholders.
MAkInG EnErGy EASyWGL’s corporate culture is built for the safe delivery of clean, efficient energy solutions at a value. A key part of this strategy lies in making energy easy for customers, employees and communities.
Simplicity hinges on:
1. Diversity of energy solutions, people and markets
2. Innovation to drive performance, safety and reliability
3. Outstanding service to build trust and preference
4. Sustainability of its business, customers, communities and the environment
5. Performance in the delivery of clean, efficient solutions that are both visible and valued
ENER
GY IN
SURA
NCE M
UTUA
L – AN
NUAL
REP
ORT
12

PASt AnD FuturE SuCCESSSafe delivery of natural gas and other energy services remained the company’s primary focus in 2015. In a year of record cold, WGL’s utility business, Washington Gas, delivered strong safety performance, including system maintenance and construction, pipeline integrity and personnel safety.
To address the evolving needs of the industry, WGL has introduced Distributed ImpactTM, an approach that integrates multiple sources of energy to provide solutions for different customer requirements. Distributed ImpactTM draws from natural gas infrastructure, power and gas distribution, solar and wind power, and other resource combinations such as carbon offsets, storage and energy efficiency.
Distributed ImpactTM allows WGL to support its customers’ profitability, sustainability and environ-mental goals while drawing on its own foundational strength. WGL believes Distributed Impact™ has the potential to shape the way entire communities are powered, changing energy from a cost to an asset.
PoWErInG thE GrEAtEr GooDEvery year, WGL employees enthusiastically extend their own energy to help worthwhile causes in the areas of health, education and the environment. The company consistently places in the top 25 of the Washington Business Journal’s annual corporate philanthropy rankings based on employee volunteer hours.
Programs include long-time support of Junior Achievement, the Washington Area Fuel Fund, a groundbreaking $1 million cumulative contribution to the Capital Area’s Light the Night Walk for the Leukemia and Lymphoma Society (LLS), and Day of Weatherization, a volunteer effort to weatherize area homes—some with solar power.
By anticipating and responding to future changes and generously
sustaining the communities it serves, WGL has remained relevant to its
customers for close to two centuries. By anticipating and responding to future changes and generously sustaining the communities it serves, WGL has remained relevant to its customers for close to two centuries. Time has done little to erase its corporate edge. Instead, it has become a tool for carefully honing the company’s future.
standing the test of time
13

Report of Independent AuditorsTo the Audit Committee of the Board of Directors
Energy Insurance Mutual Limited
Report on the Financial Statements We have audited the accompanying financial statements of Energy Insurance Mutual Limited (“the Company”) which comprise the balance sheets as of December 31, 2015 and 2014 and the related statements of income and comprehensive income, changes in policyholders’ surplus and cash flows for the years then ended and the related notes to the financial statements.
Management’s Responsibility for the Financial StatementsManagement is responsible for the preparation and fair presentation of these financial statements in accordance with accounting principles generally accepted in the united States of America; this includes the design, implementation, and maintenance of internal controls relevant to the preparation and fair presentation of financial statements that are free from material misstatement, whether due to fraud or error.
Auditor’s ResponsibilityOur responsibility is to express an opinion on these financial statements based on our audits. We conducted our audits in accordance with auditing standards generally accepted in the united States of America. Those standards require that we plan and perform the audits to obtain reasonable assurance about whether the financial statements are free from material misstatement.
An audit involves performing procedures to obtain audit evidence about the amounts and disclosures in the financial statements. The procedures selected depend on the auditor’s judgment, including the assessment of the risks of material misstatement of the financial statements, whether due to fraud or error. In making those risk assessments, the auditor considers internal controls relevant to the entity’s preparation and fair presentation of the financial statements in order to design audit procedures that are appropriate in the circumstances, but not for the purpose of expressing an opinion on the effectiveness of the entity’s internal controls. Accordingly, we express no such opinion. An audit also includes evaluating the appropriateness of accounting policies used and the reasonableness of significant accounting estimates made by management, as well as evaluating the overall presentation of the financial statements.
We believe that the audit evidence we have obtained is sufficient and appropriate to provide a basis for our audit opinion.
OpinionIn our opinion, the financial statements referred to above present fairly, in all material respects, the financial position of Energy Insurance Mutual Limited at December 31, 2015 and 2014, and the results of its operations and its cash flows for the years then ended in conformity with accounting principles generally accepted in the united States of America.
Jacksonville, Florida
March 10, 2016
FInAnCIALS AnD notES to thE FInAnCIALSThe financial statements to this Annual Report have been approved by the Board of Directors of Energy Insurance Mutual Limited.
Ben Fowke | Chairman of the Board
March 10, 2016
ENER
GY IN
SURA
NCE M
UTUA
L – AN
NUAL
REP
ORT
14

As of December 31, 2015 2014
Liabilities and policyholders’ surplus
Liabilities:
Reserve for losses and loss adjustment expenses $ 839,222 $ 712,316
unearned and advance premiums 120,975 114,216
Reinsurance premiums payable and funds held for reinsurers 20,131 31,491
Net deferred tax liability 67,697 76,900
Policyholder distributions payable 20,000 20,000
Accounts payable and accrued expenses 12,210 12,457
Payables for securities purchased 5,891 53
Due to subsidiaries 129 3,200
Income taxes payable - 13,256
Total liabilities 1,086,255 983,889
Policyholders’ surplus:
Accumulated other comprehensive income 164,930 177,403
Members’ account balance 807,516 780,897
Total policyholders’ surplus 972,446 958,300
Total liabilities and policyholder’s surplus $ 2,058,701 $ 1,942,189
As of December 31, 2015 2014
Assets
Investments, available-for-sale $ 1,361,051 $ 1,417,001
Alternative investments 150,141 45,338
Investment in subsidiaries 3,159 2,307
Total investments 1,514,351 1,464,646
Cash and cash equivalents 76,025 88,857
Reinsurance recoverables on unpaid losses 402,203 330,856
Reinsurance recoverables on paid losses 37 757
Prepaid reinsurance premiums 43,634 40,223
Accrued investment income 7,953 8,349
Receivables for securities sold 3,543 800
Premiums receivable 7,446 6,009
Deferred policy acquisition costs 1,051 880
Income taxes recoverable 1,837 -
Other assets 621 812
Total assets $ 2,058,701 $ 1,942,189
See accompanying notes to financial statements.
Energy Insurance Mutual LimitedBalance Sheets
(Expressed in Thousands of U.S. Dollars)
standing the test of time
15

Years ended December 31, 2015 2014
Years ended December 31, 2015 2014
$ 209,306
(72,680)
136,626
2,121
138,747
238,871
(107,726)
131,145
1,823
10,681
143,649
$ (4,902)
$ 207,983
(74,021)
133,962
2,450
136,412
101,972
(10,629)
91,343
1,959
11,957
105,259
$ 31,153
underwriting revenue
Net premiums earned
Direct and assumed premiums earned
Ceded premiums earned
Net premiums earned
Ceding commission income
Total underwriting revenue
underwriting expenses
Net losses and loss adjustment expenses
Gross and assumed losses and loss
adjustment expenses
Ceded losses and loss adjustment expenses
Net losses and loss adjustment expenses
Policy acquisition costs
Administrative expenses
Total underwriting expenses
(Loss) income from underwriting
Investment income
Net realized gain on investments sold
Net investment income
Total investment income
Income before policyholders’ distributionand income taxes
Distributions to policyholders’
Income before income taxes
Income tax benefit (expense)
Current income tax benefit (expense)
Deferred income tax benefit (expense)
Total income tax benefit (expense)
Net income
Comprehensive income
Net income
Net unrealized (losses) gains on available-for- sale securities, net of income taxes of $(4,348) and $20,327, respectively
Less: reclassification adjustment for net gains realized in net income, net of income taxes of $2,368 and $1,549, respectively
Other comprehensive (loss) income, net of tax
Comprehensive income
$ 6,767
41,572
48,339
43,437
(20,000)
23,437
696
2,486
3,182
$ 26,619
$ 26,619
(8,074)
(4,399) (12,473)
$ 14,146
$ 4,427
38,294
42,721
73,874
(20,000)
53,874
(19,446)
(676)
(20,122)
$ 33,752
$ 33,752
37,750
(2,878)
34,872
$ 68,624
See accompanying notes to financial statements.
Energy Insurance Mutual LimitedStatements of Income and Comprehensive Income(Expressed in Thousands of U.S. Dollars)
ENER
GY IN
SURA
NCE M
UTUA
L – AN
NUAL
REP
ORT
16

Accumulated Other Members’ Total Comprehensive Income Account Balance Policyholders’ Surplus
Balance at January 1, 2014 $ 142,531 $ 747,145 $ 889,676
Other comprehensive income, net of tax 34,872 - 34,872
Net income - 33,752 33,752
Balance at December 31, 2014 177,403 780,897 958,300
Other comprehensive loss, net of tax (12,473) - (12,473)
Net income - 26,619 26,619
Balance at December 31, 2015 $ 164,930 $ 807,516 $ 972,446
See accompanying notes to financial statements.
Energy Insurance Mutual LimitedStatements of Changes in Policyholders’ Surplus
(Expressed in Thousands of U.S. Dollars)
standing the test of time
17

Years ended December 31, 2015 2014
Net income $ 26,619 $ 33,752
Cash flows from operating activities:
Depreciation 179 238
Amortization of bond premium or discount 6,179 6,914
Net realized investment gain (6,767) (4,427)
Deferred income taxes (2,486) 676
Changes in operating assets and liabilities:
Reinsurance recoverables on unpaid and paid losses (70,627) 67,944
Prepaid reinsurance premiums (3,412) 3,862
Due to subsidiaries (3,071) 7,967
Premiums receivable (1,437) (1,215)
Other assets 331 -
Reserve for losses and loss adjustment expenses 126,906 (9,626)
unearned and advance premiums 6,759 1,993
Reinsurance premiums payable (11,360) (8,087)
Accounts payable and accrued expenses (247) 1,887
Income taxes (recoverable) payable (15,093) 27,193
Net cash from operations $ 52,473 $ 129,071
Years ended December 31, 2015 2014
Cash flows from investing activities:
Cost of investments purchased $ (500,504) $ (604,256)
Proceeds from sales of investments 409,136 440,614
Proceeds from maturities of investments 28,255 41,498
Change in payable from purchase
of investments 3,095 2,191
Income from alternative investments (4,341) (1,116)
Equity in earnings of subsidiaries (852) (188)
Purchases of fixed assets (94) (81)
Net cash from investing (65,305) (121,338)
Cash flows from financing activities:
Draws on line of credit 13,800 35,000
Repayments on line of credit (13,800) (35,000)
Net cash from financing - -
Net change in cash and cash equivalents (12,832) 7,733
Cash and cash equivalents,
beginning of year 88,857 81,124
Cash and cash equivalents,
end of year $ 76,025 $ 88,857
Supplemental disclosure of
cash flow information: Income taxes paid $ 27,050 $ 6,150
See accompanying notes to financial statements.
Energy Insurance Mutual LimitedStatements of Cash Flows(Expressed in Thousands of U.S. Dollars)
ENER
GY IN
SURA
NCE M
UTUA
L – AN
NUAL
REP
ORT
18

OrganizationEnergy Insurance Mutual Limited (the “Company” or “EIM”) was incorporated under the Companies Act of Barbados on June 13, 1986. EIM obtained a license to engage in exempt insurance business in accordance with the provisions of the Exempt Insurance Act of Barbados, 1983. On August 12, 2003, the Company applied for, and was granted a license to operate as a Qualifying Insurance Company under the Insurance Act 1992-2 of Barbados.
The Company is a mutual insurance company with membership available to any utility or member of the energy services industry that meets EIM’s underwriting standards. The Company provides excess general liability, excess fiduciary liability and excess directors and officers liability policies written on a claims first made basis. In addition, to a lesser extent the Company writes property insurance for its members. All members have casualty policies in place, approximately one-third of those members have property policies as well. During 2015, the Company started providing cyber liability coverage to its members.
Basis of ReportingThe accompanying financial statements have been prepared in accordance with accounting principles generally accepted in the united States (“GAAP”) promulgated by the Financial Accounting Standards Board Accounting Standards Codification (“ASC” or “the guidance”). Preparation of financial statements in accordance with GAAP requires management to make estimates and assumptions that affect the reported amounts of assets and liabilities and disclosure of contingent assets and liabilities at the date of the financial statements, and the reported amounts of revenues and expenses during the reporting period. Actual results could differ from those estimates.
Investment in SubsidiariesThe Company is the sponsor and 100% common stockholder of Energy Insurance Services, Inc. (“EIS”), a sponsored cell captive insurance company domiciled in South Carolina. As a sponsored captive, EIS allows EIM members, known as Mutual Business Programs (“MBP”), to insure or reinsure the risks of their sponsoring organizations, including property, general and environmental liability, asbestos, workers’ compensation and retiree medical stop loss. Through Participation Agreements with the MBPs, the insurance risks underwritten by the MBPs are contractually limited to the funds available in the individual cell’s account and neither EIS or EIM has any obligation to absorb losses of the MBP’s. Likewise, EIS has no right to the capital and accumulated
profits of the MBP cells. EIM does not have the power to direct the activities of the MBP’s which most significantly impact economic performance.
As of December 31, 2015, EIS has assets (exclusive of assets held in MBPs) of approximately $3.4 million, shareholder’s equity of $2.3 million and net loss of approximately $36,000. As of December 31, 2014, EIS had assets (exclusive of assets held in MBPs) of approximately $6.3 million, shareholder’s equity of $2.3 million and a net income of approximately $188,000.
The Company considers EIS a variable interest entity, which is not consolidated due to the lack of obligations, rights and powers described above. EIM accounts for its investment in EIS using the equity method of accounting because EIM is not the primary beneficiary of EIS’ operations.
During 2015, EIM formed Energy Captive Management, LLC (“ECM”) in the State of South Carolina to provide captive management services to EIS. As of December 31, 2015, ECM has assets of approximately $1 million, member’s surplus of $700,000 and net loss of approximately $200,000.
InvestmentsManagement determines the appropriate classification of marketable fixed-maturity and equity securities at the time of purchase. The Company’s policy is to hold securities for investment purposes and, as such, has reported all securities as available-for-sale. Available-for-sale securities are carried at fair value, with the unrealized gains and losses, net of tax, reported in a separate component of policyholders’ surplus. Interest and dividends on securities classified as available-for-sale are included in net investment income. Declines in value judged to be other-than-temporary are included as realized losses in the statement of income. The cost of securities sold is based on the specific identification method.
Alternative investments include interests in shares of investment funds, limited partnership funds, and real estate funds (“the Funds”), which are considered non-marketable. Alternative investments are structured such that the Company holds interest in the Funds and not the underlying holdings of such Funds. The Company’s ownership does not provide for control over the related investees, and financial risk is limited to the funded and unfunded commitment for each investment. These Funds are stated at fair value, which is from the most recently reported net asset value as reported by their investment managers or administrators. The use of net asset value as an estimate of the fair value for investments in certain entities that calculate the net asset value is a permitted practical expedient. Changes in the fair value are recorded directly to net investment income on the statement of income and comprehensive income.
Note A - Organization and Significant Accounting Policies
Energy Insurance Mutual LimitedNotes to Financial Statements
Years ended December 31, 2015 and 2014
standing the test of time
19

These alternative investment funds give investors the right, subject to predetermined redemption procedures, to redeem their investments at net asset value. Since there is no active market, the estimated fair values are subject to judgment and uncertainty.
The financial statements of the Funds are audited annually by independent auditors, although the timing for reporting the results of such audits may not coincide with the Company’s financial reporting.
Cash and Cash EquivalentsThe Company considers all highly liquid investments with original maturities of three months or less to be cash equivalents. The Company maintains certain cash and cash equivalent balances that are not subject to FDIC insurance. Management does not believe these balances represent a significant credit risk to the Company.
Losses And Loss Adjustment Expense ReservesThe reserve for losses and loss adjustment expenses represents the estimated ultimate gross cost of all reported and unreported losses unpaid through December 31. Since the Company provides principally high level excess of loss coverage to its members, it is exposed to severe but infrequent claims. Therefore, standard actuarial methods, such as paid loss development, are inappropriate to use. Losses are determined based on projecting average loss and expected number of claims after reviewing historical known losses and claim counts and understanding how exposures to loss have changed over policy periods.
Case reserves represent the estimated future payments on reported losses. Case reserves are continually reviewed and updated; however, given the uncertainty regarding the extent of the Company’s ultimate liability, a significant additional liability could develop. Supplemental reserves (e.g., IBNR) are recorded based on actuarial projections. Although considerable variability is inherent in these estimates, particularly due to the limited number of claims to date, management believes that the aggregate reserve for losses and loss adjustment expenses is adequate. These estimates are periodically reviewed and adjusted as experience develops or new information becomes known. Such adjustments are included in current operations.
PremiumsDirect and assumed premiums are recognized as revenue on a pro-rata basis over the policy term. The portion of premiums that will be earned in the future is deferred and reported as unearned premiums. The Company pays commissions on assumed business, which is initially capitalized and expensed over the life of the policy.
ReinsuranceIn the normal course of business, the Company seeks to reduce the loss that may arise from large claims, catastrophes or other events by reinsuring certain levels of risk in various areas of exposure with other insurance companies. Reinsurance premiums, loss reimbursement and reserves related to reinsured claims are accounted for on a basis consistent with that used in accounting for the original policies or claims.
Deferred Policy Acquisition CostsCommissions and other costs of acquiring insurance that are directly related to the successful acquisition of new and renewal business are deferred and amortized over the life of the policy to which they relate. These costs are deferred, net of related ceding commissions, to the extent recoverable, and are amortized over the period during which the related premiums are earned.
Income TaxesDeferred tax assets and liabilities are recognized for the future tax consequences attributable to differences between the financial statement carrying amounts of existing assets and liabilities and their respective tax basis. Deferred tax assets and liabilities are measured using enacted tax rates expected to apply to taxable income in the years in which those temporary differences are expected to be recovered or settled.
The Company and its subsidiaries file a consolidated federal income tax return. Income taxes are allocated based on separate return calculations.
Policyholder DistributionsAs a mutual insurer, EIM is owned by its policyholders. Policyholder distributions are charged to income when declared by the Board of Directors. During 2015 and 2014, the Board of Directors approved the declaration of policyholder distributions in the amount of $20 million.
ReclassificationsCertain balances in the 2014 financial statements have been reclassified to conform to the 2015 presentation.
Subsequent EventsThe Company has evaluated subsequent events for disclosure and recognition through March 10, 2016, the date on which these financial statements were available to be issued.
Note A - Organization & Significant Accounting Policies (Continued)
Energy Insurance Mutual LimitedNotes to Financial Statements (Continued)
ENER
GY IN
SURA
NCE M
UTUA
L – AN
NUAL
REP
ORT
20

Note B - Insurance ActivityPremium activity for 2015 and 2014 is summarized as follows (in Thousands of U.S. Dollars):
2015 Direct Assumed Ceded Net
Premiums written $ 213,999 $ 2,449 $ (69,269) $ 147,179
Change in unearned premiums (7,296) 154 (3,411) (10,553)
Premiums earned $ 206,703 $ 2,603 $ (72,680) $ 136,626
2014 Direct Assumed Ceded Net
Premiums written $ 207,362 $ 2,980 $ (77,883) $ 132,459
Change in unearned premiums (2,188) (171) 3,862 1,503
Premiums earned $ 205,174 $ 2,809 $ (74,021) $ 133,962
Activity in the liability for losses and loss adjustment expenses is summarized as follows (in Thousands of U.S. Dollars):
2015 2014
Gross balance, beginning of year $ 712,316 $ 721,942
Less: reinsurance recoverables on unpaid losses (330,856) (397,130)
Net balance, beginning of year 381,460 324,812
Incurred related to:
Current year 155,727 108,032
Prior years (24,582) (16,689)
Total incurred 131,145 91,343
Paid related to:
Current year 695 1,451
Prior years 74,891 33,244
Total paid 75,586 34,695
Net balance, end of year 437,019 381,460
Plus: reinsurance recoverables on unpaid losses 402,203 330,856
Gross balance, end of year $ 839,222 $ 712,316
Energy Insurance Mutual LimitedNotes to Financial Statements (Continued)
standing the test of time
21

During 2015, incurred losses and loss adjustment expenses attributable to events of prior years decreased by approximately $24.6 million. The favorable development relates to accident years 2009, 2011, 2012, and 2014, which decreased by approximately $79.4 million. Remaining favorable development of approximately $9.9 million was due to all other accident years with varying redundancies with the exception of accident years 2005 and 2013 which experienced unfavorable development of approximately $64.7 million due to case development on six general liability claims.
For the year ended December 31, 2014, incurred losses and loss adjustment expenses attributable to events of prior years decreased $16.7 million. The 2014 decrease relates primarily to favorable development of IBNR reserves on general liability coverage from the 2009, 2011 and 2013 accident years, which experienced less than expected claim development.
The Company uses excess of loss reinsurance to protect the Company from severe losses on the directors and officers, general partner, general liability and fiduciary liability books of business. After certain deductibles or retentions have been satisfied, the maximum amount that could be recoverable under the 2015 and 2014 reinsurance treaties is $240,000,000, with respect to general liability and $87,000,000 with respect to directors and officers, general partner and fiduciary liability.
During 2003, the Company entered into a reinsurance arrangement with Nuclear Electric Insurance Limited (“NEIL”) whereby NEIL provides excess of loss reinsurance on the directors and officers and general partner book of business for 80% of $20,000,000 in excess of $30,000,000.
The property book of business is primarily reinsured by NEIL. In addition, the Company also has an arrangement with NEIL whereby its non-nuclear property book of business is fronted by EIM.
During 2009, EIM entered into a Reinsurance Treaty Trust Account Agreement (“Trust”) with NEIL to collateralize the losses and loss adjustment expenses due to EIM under reinsurance agreements. EIM has been listed as the beneficiary of the Trust. As of December 31, 2015 and 2014, the total fair value of the assets held in the Trust were $1,097,368,000 and $1,225,143,000, which collateralized $85,858,000 and $102,627,000 in reinsurance recoverables on losses and loss adjustment expenses, respectively.
During 2015 and 2014, EIM entered into a reinsurance agreement with Oil Casualty Insurance Limited (“OCIL”) whereby OCIL provides coverage for 60%
of $25,000,000 in excess of $75,000,000 for all general liability policies issued during the year. OCIL secures its obligations through funds held and trust arrangements. As of December 31, 2015 and 2014, the total amount of the funds held account was $13,291,000 and $25,996,000, respectively, and the total fair value of the assets held in the trust were $30,055,000 and $17,469,000, respectively. Together, the funds held and trust collateralized $46,024,000 and $36,448,000, respectively, in reinsurance recoverables on losses and loss adjustment expenses.
Beginning in 2015, the Company writes directly and assumes certain members’ cyber liability risk. A portion of this business is ceded to NEIL.
Reinsurance ceded contracts do not relieve the Company from its obligations to policyholders. The Company remains liable to its policyholders for the portion reinsured to the extent that the reinsurer does not meet the obligations assumed under the reinsurance agreement. The reinsurance recoverable on paid and unpaid losses is substantially due from NEIL and various Lloyds syndicates, comprising 21% and 22%, respectively, of the balance at December 31, 2015 and 31% and 22%, respectively, at December 31, 2014. The remaining balance is comprised of amounts due from various reinsurers, each not exceeding 12% and 11% of the total for 2015 and 2014, respectively.
Management periodically reviews the financial condition of its existing reinsurers and concludes as to whether any allowance for uncollectible reinsurance is required. At December 31, 2015 and 2014, no such allowances were deemed necessary.
Note B - Insurance Activity (Continued)
Energy Insurance Mutual LimitedNotes to Financial Statements (Continued)
ENER
GY IN
SURA
NCE M
UTUA
L – AN
NUAL
REP
ORT
22
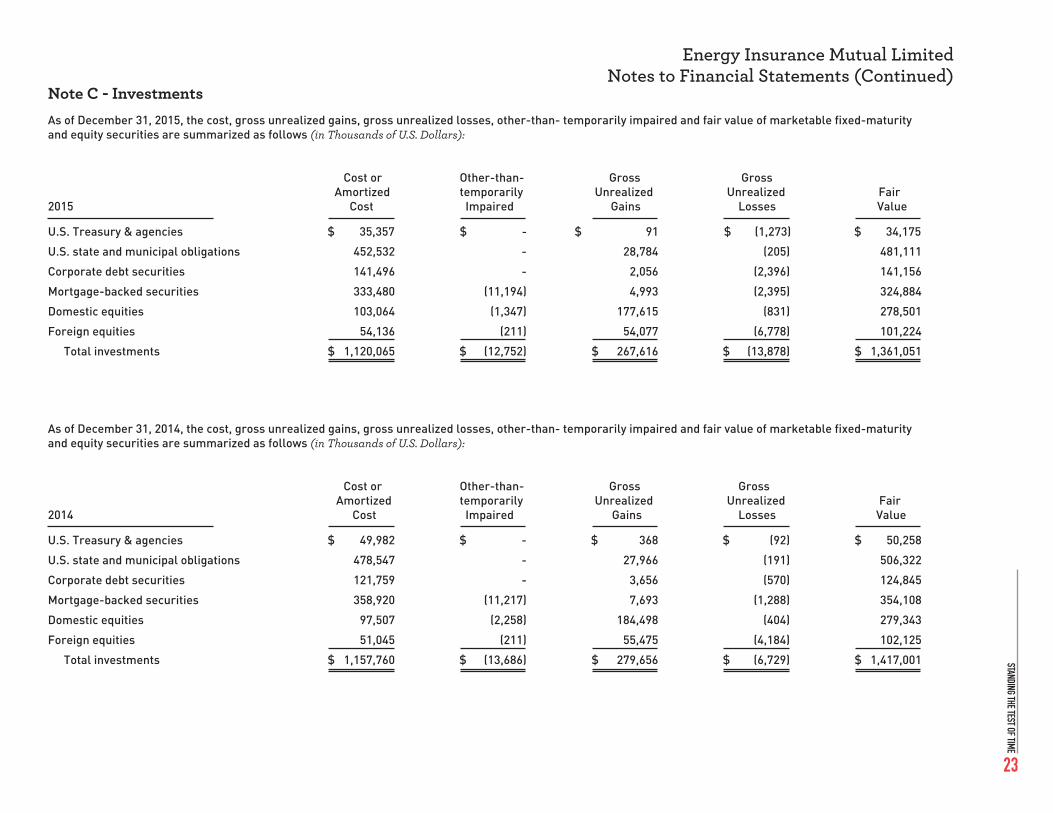
Note C - InvestmentsAs of December 31, 2015, the cost, gross unrealized gains, gross unrealized losses, other-than- temporarily impaired and fair value of marketable fixed-maturity and equity securities are summarized as follows (in Thousands of U.S. Dollars):
Cost or Other-than- Gross Gross Amortized temporarily unrealized unrealized Fair2015 Cost Impaired Gains Losses Value
u.S. Treasury & agencies $ 35,357 $ - $ 91 $ (1,273) $ 34,175
u.S. state and municipal obligations 452,532 - 28,784 (205) 481,111
Corporate debt securities 141,496 - 2,056 (2,396) 141,156
Mortgage-backed securities 333,480 (11,194) 4,993 (2,395) 324,884
Domestic equities 103,064 (1,347) 177,615 (831) 278,501
Foreign equities 54,136 (211) 54,077 (6,778) 101,224
Total investments $ 1,120,065 $ (12,752) $ 267,616 $ (13,878) $ 1,361,051
As of December 31, 2014, the cost, gross unrealized gains, gross unrealized losses, other-than- temporarily impaired and fair value of marketable fixed-maturity and equity securities are summarized as follows (in Thousands of U.S. Dollars):
Cost or Other-than- Gross Gross Amortized temporarily unrealized unrealized Fair2014 Cost Impaired Gains Losses Value
u.S. Treasury & agencies $ 49,982 $ - $ 368 $ (92) $ 50,258
u.S. state and municipal obligations 478,547 - 27,966 (191) 506,322
Corporate debt securities 121,759 - 3,656 (570) 124,845
Mortgage-backed securities 358,920 (11,217) 7,693 (1,288) 354,108
Domestic equities 97,507 (2,258) 184,498 (404) 279,343
Foreign equities 51,045 (211) 55,475 (4,184) 102,125
Total investments $ 1,157,760 $ (13,686) $ 279,656 $ (6,729) $ 1,417,001
Energy Insurance Mutual LimitedNotes to Financial Statements (Continued)
standing the test of time
23

The Company’s investment guidelines require that no more than 5% of all debt securities may have a below investment-grade bond rating by at least one nationally recognized credit rating agency or the equivalent to the extent possible to determine.
The Company’s investment objective for equities is to emulate the returns of the S&P 900 and the MSCI EAFE index for its domestic and international equity portfolios, respectively.
As of December 31, 2015 and 2014, the Company is in compliance with its investment guidelines other than the securities deemed to be other-than-temporarily impaired (“OTTI”).
The cost and estimated fair value of fixed-maturity securities at December 31, 2015, by contractual maturity, are summarized below (in Thousands of U.S. Dollars). Expected maturities will differ from contractual maturities because borrowers may have the right to call or prepay obligations with or without call or prepayment penalties. Mortgage-backed securities have been aged by their respective maturity dates.
Gross gains of approximately $13,174,000 and $13,541,000 and gross losses of ($6,407,000) and ($9,114,000), during 2015 and 2014 respectively, were realized on sales.
The Company regularly reviews its fixed-maturity and equity securities portfolios to evaluate the necessity of recording impairment losses for other-than-temporary declines in the fair value. In evaluating potential impairment, management considers, among other criteria: (i) the current fair
value compared to amortized cost or cost, as appropriate; (ii) the length of time the security’s fair value has been below amortized cost or cost; (iii) specific credit issues related to the issuer such as changes in credit rating, reduction or elimination of dividends or non-payment of scheduled interest payments; (iv) management’s intent and ability to retain the investment for a period of time sufficient to allow for any anticipated recovery in value to cost; (v) specific cash flow estimations for certain mortgage-backed securities; and (vi) current economic conditions.
Impaired securities are assessed when the decline in fair value is below the amortized cost basis for a specified duration. OTTI losses are recorded in the statement of income and comprehensive income as net realized losses on investments, and result in a permanent reduction of the cost basis of the underlying investment. The determination of OTTI is a subjective process, and different judgments and assumptions could affect the timing of loss realization. For the years ended December 31, 2015 and 2014, the Company determined that no investments were other-than-temporarily impaired.
Cost or Amortized Cost Fair Value
Maturity:
In 2016 $ 16,988 $ 17,047
In 2017-2020 153,080 154,937
In 2021-2025 152,025 155,715
Due after 2025 640,772 653,627
Total fixed-maturity securities $ 962,865 $ 981,326
Note C - Investments (Continued)
Energy Insurance Mutual LimitedNotes to Financial Statements (Continued)
ENER
GY IN
SURA
NCE M
UTUA
L – AN
NUAL
REP
ORT
24

Note C - Investments (Continued)The following tables show gross unrealized losses and fair values of investments, aggregated by investment category, and the length of time that individual investments have been in a continuous unrealized loss position, at December 31, 2015 (in Thousands of U.S. Dollars):
unrealized unrealized unrealized Fair Value Losses Fair Value Losses Fair Value Losses
u.S. Treasury & agencies $ 31,947 $ (1,273) $ - $ - $ 31,947 $ (1,273)
u.S. state and municipal obligations 19,237 (67) 2,936 (138) 22,173 (205)
Corporate debt securities 64,202 (2,321) 3,738 (75) 67,940 (2,396)
Mortgage-backed securities 160,753 (1,502) 35,959 (893) 196,712 (2,395)
Domestic equities 7,806 (680) 963 (151) 8,769 (831)
Foreign equities 77,783 (5,279) 23,441 (1,499) 101,224 (6,778)
Total temporarily impaired securities $ 361,728 $ (11,122) $ 67,037 $ (2,756) $ 428,765 $ (13,878)
The following tables show gross unrealized losses and fair values of investments, aggregated by investment category, and the length of time that individual investments have been in a continuous unrealized loss position, at December 31, 2014 (in Thousands of U.S. Dollars):
unrealized unrealized unrealized Fair Value Losses Fair Value Losses Fair Value Losses
u.S. Treasury & agencies $ 11,385 $ (62) $ 935 $ (30) $ 12,320 $ (92)
u.S. state and municipal obligations 33,430 (97) 3,946 (94) 37,376 (191)
Corporate debt securities 34,921 (307) 9,389 (263) 44,310 (570)
Mortgage-backed securities 99,347 (615) 39,764 (673) 139,111 (1,288)
Domestic equities 1,649 (73) 3,083 (331) 4,732 (404)
Foreign equities 4,897 (231) 96,785 (3,953) 101,682 (4,184)
Total temporarily impaired securities $ 185,629 $ (1,385) $ 153,902 $ (5,344) $ 339,531 $ (6,729)
Less than one year One year or more Total
Less than one year One year or more Total
Energy Insurance Mutual LimitedNotes to Financial Statements (Continued)
standing the test of time
25

Note C - Investments (Continued)As of December 31, 2015, the Company had 470 fixed-maturity securities with unrealized losses. This included nine with aggregate unrealized losses of $831,000, which were 20% or greater than the cost. As of December 31, 2014, the Company had 337 fixed-maturity securities with unrealized losses. This included five with aggregate unrealized losses of $55,000, which were 20% or greater than the cost. The Company has evaluated these fixed-maturity securities and believes the unrealized losses are due primarily to temporary market and sector-related factors rather than to issuer specific-factors. Management does not intend to sell, and it is more likely than not that the Company will not be required to sell the securities before recovery. The Company does not consider these securities to be other-than-temporarily impaired.
Of the 1,807 equity securities with unrealized losses, 659 with unrealized losses of $5,115,000 were 20% or greater than the cost and have been in a continuous loss position for longer than a year at December 31, 2015. Of the 1,284 equity securities with unrealized losses, 267 with unrealized losses of $2,337,000 were 20% or greater than the cost and have been in a continuous loss position for longer than a year at December 31, 2014. The Company has evaluated these securities based on past earnings trends, analysts’ reports and analysts’ earnings expectations. Management does not intend to sell, and it is more likely than not that the Company will not be required to sell the securities before recovery. The Company does not consider these securities to be other-than-temporarily impaired.
The composition of net investment income is summarized below (in Thousands of U.S. Dollars):
The Company has adopted the accounting guidance for Fair Value Measurements and Disclosures. This statement provides guidance for measuring assets and liabilities at fair value. The market approach was the valuation technique used to measure fair value of the investment portfolio. The market approach was used to value EIM’s equity and fixed-maturity securities.
The Company’s estimates of fair value for financial assets and financial liabilities are based on the framework established in the Fair Value Measurements and Disclosures accounting guidance. The framework is based on the inputs used in valuation and requires that observable inputs be used in the valuations when available. The disclosure of fair value estimates in the fair value accounting guidance includes a hierarchy based on whether significant valuation inputs are observable. In determining the level of the hierarchy in which the estimate is disclosed, the highest priority is given to unadjusted quoted prices in active markets and the lowest priority to unobservable inputs that reflect the Company’s significant market assumptions. The three levels of the hierarchy are as follows:
Level 1 – Inputs to the valuation methodology are quoted prices (unadjusted) for identical assets or liabilities traded in active markets. Included are those investments traded on an active exchange, such as the NASDAQ Global Select Market.
Level 2 – Inputs to the valuation methodology include quoted prices for similar assets or liabilities in active markets, quoted prices for identical or similar assets or liabilities in markets that are not active, inputs other than quoted prices that are observable for the asset or liability and market-corroborated inputs. Included are investments in u.S. Treasury securities and obligations of u.S. government agencies, together with municipal bonds, corporate debt securities, commercial mortgage and asset-backed securities, certain residential mortgage-backed securities that are generally investment grade and certain equity securities.
Level 3 – Inputs to the valuation methodology are unobservable for the asset or liability and are significant to the fair value measurement. Material assumptions and factors considered in pricing investment securities may include projected cash flows, collateral performance including delinquencies, defaults and recoveries, and any market clearing activity or liquidity circumstances in the security or similar securities that may have occurred since the prior pricing period.
Fair values are based on quoted market prices when available (Level 1). The Company receives the quoted market prices from a third party, nationally recognized pricing service (“pricing service”). When market prices are not
2015 2014
Interest income $ 29,084 $ 30,892
Dividend income 10,847 9,253
Income from subsidiary (89) 188
Income from alternative investments 6,262 1,116
Other (495) 388
Gross investment income 45,609 41,837
Investment management fees (3,853) (3,096)
Interest expense (184) (447)
Net investment income $ 41,572 $ 38,294
Energy Insurance Mutual LimitedNotes to Financial Statements (Continued)
ENER
GY IN
SURA
NCE M
UTUA
L – AN
NUAL
REP
ORT
26

available, the Company utilizes a pricing service to determine an estimate of fair value, which is mainly used for its fixed-maturity investments’ fair value. The fair value is generally estimated using current market inputs for similar financial instruments with comparable terms and credit quality, commonly referred to as matrix pricing (Level 2). In instances where there is little or no market activity for the same or similar instruments, the Company estimates fair value using methods, models and assumptions that management believes are relevant to the particular asset or liability. This may include discounted cash flow analysis or other income based approaches (Level 3). These valuation techniques involve some level of management estimation and judgment. Where appropriate, adjustments are included to reflect the risk inherent in a particular methodology, model or input used and are reflective of the assumptions that market participants would use in valuing assets or liabilities.
The following table presents the Company’s investment securities within the fair value hierarchy, and the related inputs used to measure those securities at December 31, 2015 (in Thousands of U.S. Dollars):
There were no transfers between fair value levels during 2015 and 2014.
Several of EIM’s policyholders are companies represented in the S&P 900. Consequently, at December 31, 2015 and 2014, EIM holds investments with a total fair value of approximately $37.4 and $19.6 million, respectively, in issuers who are also policyholders.
Note C - Investments (Continued)
Total Level 1 Level 2 Level 3
Fixed-maturity $ 981,326 $ - $ 981,326 $ -
Equities 379,725 379,725 - -
Total $1,361,051 $ 379,725 $ 981,326 $ -
Energy Insurance Mutual LimitedNotes to Financial Statements (Continued)
standing the test of time
27

The alternative investment funds include the following as of December 31 (in Thousands of U.S. Dollars):
The catastrophe reinsurance class includes funds with investments primarily in portfolios of traditional reinsurance and other insurance based investment instruments that have returns tied to property and casualty catastrophe risk. In addition, this class may hold cash, treasury bills and money market funds. The investments in this class have limited redemption rights and may be suspended from time to time.
The high yield bank loan class includes funds that invest in a diversified portfolio consisting primarily of direct or indirect interests in noninvestment grade, floating rate bank loans.
The real estate class includes two real estate funds that invest primarily in industrial, retail, office and multifamily housing.
The fair values of all alternative investment fund classes have been estimated using the net asset value per share of investments, with the exception of one fund in 2014. This fund was accounted for under the equity method and valued at $7.8 million as of December 31, 2014. under the equity method, the Company records its proportionate share of investee earnings or losses as a component of net investment income. In 2015, this fund was liquidated.
As of December 31, 2015, the Company did not have any unfunded commitments. As of December 31, 2014, the Company had $71 million in unfunded commitments related to the real estate funds, which were funded in 2015.
Note D - Federal Income TaxesThe tax effects of temporary differences that give rise to significant portions of the deferred tax assets and deferred tax liabilities at December 31 are as follows (in Thousands of U.S. Dollars):
The provision for federal income tax differs from the amount derived by applying the statutory federal tax rates to pretax income for financial reporting purposes due primarily to tax exempt investment income.
The Company is required to establish a “valuation allowance” for any portion of the deferred tax asset that management believes will not be realized. The Company has historically been a taxpayer, and in the opinion of management, will continue to be in the future. Management believes that it is more likely than not that the Company will realize the benefit of the deferred tax assets, therefore no valuation allowance has been established.
During 2003, the Company applied for, and was granted an exemption from Barbados income tax by the Minister of Finance under the Duties, Taxes and Other Payment (Exemption) Act. Federal income taxes incurred by the Company are determined in accordance with the provisions of the Internal Revenue Code.
Note C - Investments (Continued)
2015 2014 Redemption Notice Fair Value Fair Value Frequency Period
Catastrophe reinsurance $ 8,198 $ 12,838 Quarterly 45 days
high yield bank loan 64,339 32,500 Monthly 30 days
Real estate 77,604 - Quarterly 45 days
Total $ 150,141 $ 45,338
2015 2014Deferred tax assets:
unpaid losses and loss adjustment expenses $ 9,420 $ 8,904
unearned premiums 5,414 5,206
Accrued expenses 3,309 3,019
Other than temporary impairments 4,550 4,790
Total deferred tax assets 22,693 21,919
Deferred tax liabilities:
unrealized capital gains (88,808) (95,525)
Premium amortization (1,244) (2,420)
Other (338) (874)
Total deferred tax liabilities (90,390) (98,819)
Net deferred tax liability $ (67,697) $ (76,900)
Energy Insurance Mutual LimitedNotes to Financial Statements (Continued)
ENER
GY IN
SURA
NCE M
UTUA
L – AN
NUAL
REP
ORT
28
Redemption

At December 31, 2015 and 2014, the Company determined there are no material unrecognized tax benefits, and no adjustments to liabilities or operations were required.
Note E - Related Party TransactionsAs described in Note A, the Company has two subsidiaries; EIS and ECM. During 2015 and 2014, EIM provided reinsurance to certain EIS cells. For the years ended December 31, 2015 and 2014, premiums earned included $716,000 and $680,000 of premium assumed from EIS, respectively. During 2015, EIM provided ECM with initial capital of $500,000 plus contributed additional capital of $380,000 during the year. EIS reimburses ECM for certain expenses incurred related to administration of EIS, plus a service fee.
Note F - Commitments and ContingenciesThe Company is named as defendant in various legal actions arising in the normal course of business from claims made under insurance policies and contracts. These actions are considered by the Company in estimating the loss and loss adjustment expense reserves. The Company’s management believes that the resolution of these actions will not have a material adverse effect on the Company’s financial position or results of operations.
Note G - Trust Funds and DepositsThe Company has established a trust fund with a federally insured depository. This trust fund serves as security for policyholders and third-party claimants to satisfy requirements of being listed as an alien surplus lines insurer by the National Association of Insurance Commissioners. The Company is required to maintain a minimum amount of the lesser of $150,000,000 or $5,400,000 plus 30% for liabilities arising from business on or after January 1, 1998. At December 31, 2015 and 2014, the required balance was $150,000,000. In addition, the State of Florida has required the Company to deposit $300,000 as security for the Company’s policyholders and creditors. The trust funds and deposit balances have been included in the accompanying balance sheets as available-for-sale investments, including both fixed-maturity securities and equities.
Note H - Line of CreditA line of credit was established during 2011 in the amount of $50,000,000. The letter of credit is used solely to fund claim payments that are subject to reinsurance recovery. There were no amounts outstanding as of December 31, 2015 and 2014 on the line of credit. Draws and subsequent repayments on the
line of credit amounted to $13,800,000 and $35,000,000, during 2015 and 2014, respectively.
Note I - Retiree Medical BenefitsThe Company provides employees with a Post-Retirement Medical, Dental and Vision Plan (“the Plan”). The Plan is available to retirees (upon fulfilling eligibility requirements), their spouses and dependents as a continuation of the healthcare plan available to active employees. Currently the benefits are self insured, with a third party stop-loss reinsurance arrangement. Retirees are not required to make contributions for coverage. The Plan is unfunded.
The assumed discount rate used to determine the benefit obligation is 4.4% for 2015. The assumed healthcare cost trend rate is 6.8% for 2016, trending to 4.5% by 2027. The Company recognized a liability representing the actuarially determined accumulated post-retirement benefit obligation in the amount of $9,455,000 and $8,627,000 as of December 31, 2015 and 2014, respectively, which is included in accounts payable and accrued expenses.
Note J - Margin of SolvencyIn order to meet the requirements of a Qualifying Insurance Company under the Insurance Act 1992-2 of Barbados, the Company must have contributed reserves of approximately $12 million. The policyholders’ surplus provided an excess margin of solvency of approximately $960 million at December 31, 2015.
Note D - Federal Income Taxes (Continued)
Energy Insurance Mutual LimitedNotes to Financial Statements (Continued)
standing the test of time
29

EIM DIrECtorSAs of December 31, 2015
Darryl M. Bradford
Executive Vice President and General Counsel
Exelon Corporation, Chicago, Illinois
Trevor A. Carmichael
Barrister-at-Law
Chancery house, Chancery Chambers, Bridgetown, Barbados
Marian M. Durkin
Senior Vice President, General Counsel, and Chief Compliance Officer
Avista Corporation, Spokane, Washington
Willard S. Evans, Jr.
Retired
Peoples Gas and North Shore Gas, Chicago, Illinois
Benjamin G. S. Fowke, III
Chairman, President, and Chief Executive Officer
xcel Energy Inc., Minneapolis, Minnesota
Scott K. Goodell
President and Chief Executive Officer
Energy Insurance Mutual, Tampa, Florida
Darryl M. Bradford Trevor A. Carmichael
Marian M. Durkin Willard S. Evans, Jr.
Benjamin G.S. Fowke, III Scott K. Goodell
ENER
GY IN
SURA
NCE M
UTUA
L – AN
NUAL
REP
ORT
30

EIM DIrECtorSAs of December 31, 2015
James R. Hatfield
Executive Vice President and Chief Financial Officer
Pinnacle West Capital Corporation, Phoenix, Arizona
G. Edison Holland, Jr.
Chairman and Chief Executive Officer
Mississippi Power Company, Gulfport, Mississippi
Darren J. Olagues
President
Cleco Power LLC, Pineville, Louisiana
Carter M. Reid
SVP-Chief Administrative and Compliance Officer & Corporate Secretary
Dominion Resources Services, Inc., Richmond, Virginia
Joseph M. Rigby
Chairman, President, and Chief Executive Officer
Pepco holdings, Inc., Washington, D.C.
Brian X. Tierney
Executive Vice President & Chief Financial Officer
American Electric Power Service Corporation, Columbus, Ohio
James R. Hatfield G. Edison Holland, Jr.
Darren J. Olagues Carter M. Reid
Joseph M. Rigby Brian X. Tierney
standing the test of time
31

BoArD CoMMIttEESAs of December 31, 2015
AUDIT COMMITTEE
Willard S. Evans, Jr. (Chairman)
Darryl M. Bradford (Vice Chairman)
G. Edison holland, Jr. | Darren J. Olagues | Brian x. Tierney
CLAIMS COMMITTEE
Darryl M. Bradford (Chairman)
Carter M. Reid (Vice Chairman)
Marian M. Durkin | Willard S. Evans, Jr. | Joseph M. Rigby
EXECUTIVE COMMITTEE
Benjamin G. S. Fowke, III (Chairman)
Marian M. Durkin (Vice Chairman)
Scott K. Goodell | G. Edison holland, Jr. | Darren J. Olagues
INVESTMENT COMMITTEE
Darren J. Olagues (Chairman)
James R. hatfield (Vice Chairman)
Benjamin G. S. Fowke, III | Carter M. Reid | Brian x. Tierney
NOMINATING COMMITTEE
Joseph M. Rigby (Chairman)
Darryl M. Bradford (Vice Chairman)
Marian M. Durkin | Scott K. Goodell | Brian x. Tierney
REINSURANCE COMMITTEE
Carter M. Reid (Chairman)
James R. hatfield (Vice Chairman)
Scott K. Goodell | Darren J. Olagues | Joseph M. Rigby
STRATEGIC PLANNING COMMITTEE
Joseph M. Rigby (Chairman)
G. Edison holland, Jr. (Vice Chairman)
Darryl M. Bradford | Marian M. Durkin | Willard S. Evans, Jr.
Deborah S. Gaffney | James R. hatfield | Dean R. Jobko
Carter M. Reid
ENER
GY IN
SURA
NCE M
UTUA
L – AN
NUAL
REP
ORT
32

InSurAnCE ADvISory CoMMIttEEAs of December 31, 2015
Dean R. Jobko, Director, Risk Management & Insurance NRG Energy, Houston, Texas
Edsel L. Carlson, Risk Manager TECO Energy, Inc., Tampa, Florida
Robert W. Dillard, Vice President, Risk Management/Insurance Kinder Morgan, Inc., Houston, Texas
Cynthia J. Fee, Senior Risk Management Analyst Sacramento Municipal Utility District, Sacramento, California
Julie R. Jackson, Sr. Director, Risk Management & Insurance Targa Resources Corp., Houston, Texas
Jerry E. Rhoades, ARM, Manager, Insurance & Claims Risk Management Portland General Electric Company, Portland, Oregon
Roni A. Salo, Risk Manager Insurance Services ALLETE, Inc. , Duluth, Minnesota
Jeremy L. Stephens, CRM, ARM , Manager, Insurance & Risk Management The AES Corporation, Indianapolis, Indiana
Richard N. Stevens, Director of Finance Avista Corporation, Spokane, Washington
Forrest L. Strachan, Risk Manager PJM Interconnection, LLC , Norristown, Pennsylvania
Dean R. Jobko, Edsel L. Carlson, Robert W. Dillard Cynthia J. Fee
Julie R. Jackson Jerry E. Rhoades Roni A. Salo
Richard N. StevensJeremy L. Stephens
Forrest L. Strachan
Chairman Vice Chairman
standing the test of time
33

EIM oFFICErSAs of December 31, 2015
Energy Insurance Mutual Limited (EIM)
Benjamin G. S. Fowke, IIIChairman of the Board
Marian M. DurkinVice Chairman of the Board
Scott K. GoodellPresident and Chief Executive Officer
G. Thomas Bolton, IIIVice President - Chief Financial Officer and Corporate Secretary
Jill C. DominguezVice President-Chief underwriting Officer
Robert P. SchmidVice President-Subsidiary Operations
Ann M. JoslinVice President-Claims
Taniyka D. RaglandAssistant Corporate Secretary
Trevor A. CarmichaelAssistant Corporate Secretary
Benjamin G. S. Fowke, III Marian M. Durkin
Scott K. Goodell
G. Thomas Bolton, III
Jill C. Dominguez
Robert P. Schmid
Trevor A. Carmichael
Ann M. Joslin
Taniyka D. Ragland
ENER
GY IN
SURA
NCE M
UTUA
L – AN
NUAL
REP
ORT
34

EIS AnD ECM oFFICErSAs of December 31, 2015
Randall L. Martin Tobias P. Burke Jeffrey M. Tkacz
Energy Insurance Services, Inc. (EIS)
Benjamin G. S. Fowke, IIIChairman
Marian M. DurkinVice Chairman
Scott K. GoodellPresident and CEO
Randall L. MartinVice President-Chief Operating Officer
G. Thomas Bolton, IIIVice President-Chief Financial Officer and Secretary
Robert P. SchmidVice President
Taniyka D. RaglandAssistant Secretary
Energy Captive Management, LLC (ECM)
Benjamin G. S. Fowke, IIIChairman
Marian M. DurkinVice Chairman
Scott K. GoodellPresident and CEO
Tobias P. BurkeVice President-Chief Accounting Officer
G. Thomas Bolton, IIIVice President-Chief Financial Officer and Secretary
Randall L. MartinVice President-Chief Operating Officer
Robert P. SchmidVice President
Jeffrey M. TkaczController and Corporate Secretary
Taniyka D. RaglandAssistant Secretary
standing the test of time
35

EIM MEMBErSAs of December 31, 2015
AES Corporation (The)AGL Resources Inc.
Algonquin Power & utilities Corp.ALLETE, Inc.
Alliant Energy CorporationAmerican Electric Power Service Corporation
American Transmission Company LLCApache Corporation
Associated Electric Cooperative, Inc.Atmos Energy Corporation
Avista CorporationBasin Electric Power Cooperative
Berkshire hathaway Energy Company (MidAmerican Energy holdings Co.)Bicent Power, LLC
Black hills CorporationBritish Columbia hydro and Power Authority
California Independent System Operator CorporationCalpine Corp.
CenterPoint Energy, Inc.Central Arizona Water Conservation District
Chesapeake Energy CorporationChugach Electric Association, Inc.
Citizens Energy GroupCity of Richmond, Department of Public utilities
City Public Service of San Antonio, TexasCity utilities of Springfield, Missouri
Cleco CorporationCMS Energy CorporationColorado Springs utilities
Columbia Pipeline Group, Inc.Consolidated Edison Company of New York, Inc.
Crestwood holdings Partners LLCDairyland Power Cooperative
Deseret Generation & Transmission CooperativeDevon Energy CorporationDominion Resources, Inc.
Doyon utilities, LLCDQE holdings LLC
DTE Energy CompanyDuke Energy Corporation
Dynegy Inc.East Kentucky Power Cooperative, Inc.
Edison InternationalEl Paso Electric Company
Electric Reliability Council of Texas, Inc.Emera Incorporated
Empire District Electric Company (The)Empire Gen holdings, Inc.
Enable Midstream Partners, LPEnbridge Inc.
Energen CorporationEnergy Future holdings Corp.Energy Transfer Equity, L.P.
Entergy Services, Inc.EOG Resources, Inc.
EQT Corporation
Eversource EnergyExelon CorporationFirstEnergy Corp.
Florida Municipal Power AgencyFortisuS Inc.
Gaz Metro Inc.Great Plains Energy Incorporated
Great River Energyhawaiian Electric Industries, Inc.
hoosier Energy Rural Electric Cooperative Inc.hydro One Inc.hydro-Quebec
Iberdrola uSA Networks, Inc.IDACORP, Inc.
Imperial Irrigation DistrictIntermountain Power Agency/Intermountain Power Service Corporation
Iroquois Gas Transmission System, LPISO New England Inc.
ITC holdings Corp.JEA and FPL d/b/a St. Johns River Power Park
Kinder Morgan, Inc.Laclede Group, Inc. (The)
LDC Funding LLCLong Island Power Authority
Los Angeles Dept. of Water and PowerMagellan Midstream Partners, LP
MarkWest Energy Partners, L.P. and MarkWest Energy GP, L.L.C.MDu Resources Group, Inc.
Metropolitan Water District of Southern CaliforniaMGE Energy, Inc.
Midcontinent Independent System Operator, Inc.Missouri Basin Municipal Power Agency (Missouri River Energy Services)
Modesto Irrigation DistrictMountaineer Gas CompanyNational Fuel Gas Company
National Grid plcNational Grid uSA
New Jersey Resources CorporationNew York Independent System Operator, Inc.
New York Power AuthorityNextEra Energy, Inc.
NiSource Inc.Northern California Power AgencyNorthwest Natural Gas Company
NorthWestern CorporationNRG Energy, Inc.NRG Yield, Inc.
OGE Energy Corp.Oglethorpe Power Corporation
Ohio Gas CompanyOhio Valley Electric Corporation
Old Dominion Electric CooperativeOncor Electric Delivery holdings Company LLC
ONE Gas, Inc.ONEOK, Inc.
Ontario Power Generation Inc.
Orlando utilities CommissionOtter Tail CorporationPepco holdings, Inc.PG&E Corporation
Philadelphia Gas WorksPiedmont Natural Gas Company, Inc.
Pinnacle West Capital CorporationPJM Interconnection, LLC
Plains All American Pipeline, L.P.PNM Resources, Inc.
Portland General Electric CompanyPowerSouth Energy Cooperative
PPL CorporationPublic Service Enterprise Group Incorporated
Public utility District No. 2 of Grant County, WAPublic utility District No.1 of Douglas County
Public utility Risk Management Services Joint Self Insurance FundPuget holdings LLCQEP Resources, Inc.Questar CorporationRGC Resources, Inc.
Sacramento Municipal utility DistrictSalt River Project Agricultural Improvement and Power District
SCANA CorporationSEMCO holding Corporation
Seminole Electric Cooperative, Inc.Sempra Energy
Seventy Seven Energy Inc.Sharyland utilities, L.P.
South Carolina Public Service Authority (Santee Cooper)South Mississippi Electric Power Association
Southern CompanySouthern Star Central Corp.Southwest Gas CorporationSouthwest Power Pool, Inc.
Spectra Energy CorpSummit utilities, Inc.
Talen Energy CorporationTallgrass Energy holdings, LLC
Targa Resources Corp.TECO Energy, Inc.
Tennessee Valley AuthorityTransCanada Corporation
Tri-State Generation and Transmission Association, Inc.uGI Corporation
uIL holdings CorporationVectren Corporation
Vermont Electric Power Company, Inc.WEC Energy Group, Inc.
Westar Energy, Inc.WGL holdings, Inc.
Williams Companies, Inc. (The)WPx Energy, Inc.xcel Energy Inc.
ENER
GY IN
SURA
NCE M
UTUA
L – AN
NUAL
REP
ORT
36

Energy Insurance Mutual Limitedwww.eimltd.com
Bayport Plaza, 3000 Bayport Drive, Suite 550, Tampa, Florida 33607-8418
Telephone: 813-287-2117 or 800-446-2270 • Facsimile: 813-874-2523
CONTACT
Scott Goodell, [email protected]
Tommy Bolton, [email protected]
Jill Dominguez, [email protected]
Energy Insurance Services, Inc.409 King Street, Suite 201, Charleston, South Carolina 29403-6407
Telephone: 843-718-3107 • Facsimile: 800-341-6801
CONTACT
Randy Martin, [email protected]
Energy Captive Management, LLC.409 King Street, Suite 201, Charleston, South Carolina 29403-6407
Telephone: 843-718-2965 • Facsimile: 800-341-6801
CONTACT
Tobias Burke, [email protected]
standing the test of time
37

2015 Annual Report


![510 Closed Exam B Rev8[1]](https://img.pdfslide.us/doc/110x75/55cf9ca0550346d033aa7970/510-closed-exam-b-rev81.jpg)


