Embed Size (px)
Citation preview
Eight-Step Global Kinetic Mechanism on MethaneOxidation with Nitric Oxide Formation for Lean-
Premixed Combustion Turbines
Igor V. Novosselov
A thesis submitted in partial fulfillment of the requirement for thedegree of
Master of Science in Mechanical Engineering
University of Washington
2001
Program Authorized to offer Degree: Mechanical Engineering
University of Washington
Graduate School
This is to certify that I have examined this copy of a master’s thesis by
Igor V. Novosselov
and have found that it is complete and satisfactory in all respects,and that any and all revisions required by the final
examining committee have been made.
Committee Members:
____________________________________________Philip C. Malte
____________________________________________John C. Kramlich
____________________________________________David G. Nicol
Date: _____________________

I presenting this thesis in partial fulfillment of the requirements for a Master’s degree atthe University of Washington, I agree that the library shall make its copies freely
available for inspection. I further agree that extensive copying of this thesis is allowableonly for scholarly purposes, consistent with “fail use” as prescribed in the U.S. Copyright
Law. Any other reproduction for any purposes or by any means shall not be allowedwithout my written permission.
Signature_________________________
Date_____________________________
University of Washington
Abstract
Eight-Step Global Kinetic Mechanism on Methane Oxidation with Nitric
Oxide Formation for Lean-Premixed Combustion Turbines
Igor V. Novosselov
Chair of supervisory committee:
Professor Philip C. Malte
An eight-step, pressure-sensitive global mechanism for methane oxidation with nitric
oxide formation for CFD simulation of lean-premixed combustion is developed and
validated in the present thesis. The global mechanism is based on the detailed
chemical kinetic mechanism GRI 3.0 and covers the pressure range from 5 to 20
atmospheres and the fuel-air equivalence ratio range from 0.45 to 0.8. The
mechanism includes: three reactions for hydrocarbon oxidation, two reactions for
nitric oxide formation via non-equilibrium free radical chemistry, and three reactions
for NO formation in zones of the equilibrium free radical chemistry. The four major
pathways of NO formation are simulated by the global mechanism: NNH, prompt,
nitrous oxide, and Zeldovich.
The new eight step global mechanism is validated by comparing results obtained with
it in chemical reactor modeling against the experimental data for high-pressure jet-
stirred reactors. The comparison shows that the eight-step global mechanism provides
good agreement with GRI 3.0 and with the experimental data for the cases with
preheated inlet air (an assumption used in the development of the global mechanism).
Additional validation of the eight-step global mechanism is obtained by employing it
in a chemical reactor network simulation of a gas turbine combustor. The eight-step

global mechanism is also tested in the CFD simulation of the gas turbine combustor.
The results of the CFD modeling show good agreement of CO and NO exit plane
emission with the experimental data for premixer fuel-air equivalence ratios in the
vicinity of 0.6.
i
TABLE OF CONTENTS
List of Figures ............................................................................................................iiiList of Tables .............................................................................................................ix
Chapter 1Introduction and Objectives
1.1 Introduction.............................................................................................. 11.2 Objectives................................................................................................. 11.3 Approach and Validation......................................................................... 2
Chapter 2Modeling of the Combustor A
2.1 Turbulent Combustion............................................................................. 32.2 CFD Modeling of Turbulent Combustion................................................ 32.3 Chemical Reactor Modeling..................................................................... 62.4 Determining the Coefficients for Mixing Controlled Reaction Rates .. 112.5 Comparison to the Experimental Data................................................... 13
Chapter 3Development of 8-step global mechanism
3.1 Introduction............................................................................................ 153.2 Methodology.......................................................................................... 163.3 Development of Three-Step Pressure-Sensitive Global Mechanism for
Hydrocarbon Oxidation.......................................................................... 173.3.1 Reaction 1 .................................................................................. 173.3.2 Reactions 2 and 3 ....................................................................... 25
3.4 Development of the global mechanism for the formation ofNitrogen Oxide....................................................................................... 31
3.4.1 Introduction................................................................................ 313.4.2 Zeldovich Mechanism ............................................................... 353.4.3 Nitrous oxide mechanism of NO formation............................... 363.4.4 Reaction 4 ................................................................................. 403.4.5 NNH mechanism of NO formation ........................................... 443.4.6 Prompt NO ................................................................................ 443.4.7 Reaction 5 .................................................................................. 46
3.5 Summary of the eight-step global mechanism ...................................... 48
ii
Chapter 4Validation of 8-step Global Mechanism
4.1 Introduction............................................................................................ 524.2 Modeling and Discussion of the Results for the Bengtsson’s Reactor .. 534.3 Modeling and Discussion of the Results for Rutar’s Reactor ............... 584.4 Validation of the Eight-Step Global Mechanism via CFD of
Combustor A 58.........................................................................................
Chapter 5Conclusion and Recommendations
5.1 Conclusions ........................................................................................................ 785.2 Recommendations .............................................................................................. 79
Bibliography......................................................................................................... 80
iii
LIST OF FIGURES
Figure 2.1. Computational domain for CFD modeling of combustor A........................4
Figure 2.2. Velocity vectors colored by temperature, inlet temperature 645K.
Maximum temperature - 1780 K .................................................................5
Figure 2.3. Velocity vectors colored by CO mole fraction. Maximum CO -
10e+4 ppm (1%) CO at the outlet ~3.5 ppm................................................5
Figure 2.4. Simplified Chemical Reactor Model of the Combustor A..........................7
Figure 2.5. Detailed CRM of Combustor A...................................................................9
Figure 2.6. Flow rates in the center recirculation zone, dome recirculation zone,
and the stream from the premixer (“jet”) for the Combustor A
operated with premixer fuel-air equivalence ratio of 0.49. The
distance from the front of the combustor = x.............................................10
Figure 2.7 Same as figure 2.6, except the premixer Φ = 0.61 .....................................10
Figure 2.8 Same as figure 2.6, except the premixer Φ = 0.87 .....................................11
Figure 2.9 Emission index of NO as a function of the fuel-air equivalence ratio
for the Combustor A LP Base 1, Operating pressure 9.9 atm. Inlet
temperature 646K. Air flow rate = 1.19kg/s ..............................................13
Figure 2.10 Experimental dependency of NOx emissions as a function of peak
flame temperature in the combustor...........................................................14
Figure 3.3.1 From Glassman (1996). Composition, temperature, and heat
release rate profiles for a stoichiometric methane-air laminar flame
at 1 atm and T0=298K................................................................................20
Figure 3.3.2 From Glassman (1996). Radical distribution profiles for Figure 3.3.1 ...20
Figure 3.3.3 Net rate of methane destruction in the flame zone modeled as a
PSR; inlet temperature: 5 atm – 483 K, 10 atm – 592 K, 20 atm –
716 K; residence time varied from blowout to 2 ms; reactor
temperatures correspond to adiabatic PSR.................................................22
Figure 3.3.4 Net rate of methane destruction in the recirculation zone modeled
as adiabatic PSR following a short PSR representing the flame
iv
zone. The PSR-PSR reactor arrangement is not included in the database for
the reaction 1. Residence time in the first PSR: 5 atm –1.0 ms, 10
atm –0.5 ms, 20 atm – 0.25 ms; residence time in the second PSR
varied from 2 ms to 15 ms. ........................................................................22
Figure 3.3.5 Net rate of methane destruction in the post-flame zone modeled as
adiabatic PFR following short adiabatic PSR representing the flame
zone. Residence time in the first PSR: 5 atm –1.0 ms, 10 atm –0.5
ms, 20 atm – 0.25 ms; residence time in the PFR varied from 0.5
ms to time needed to reduced methane mole fraction to ~ 10-6.................23
Figure 3.3.6 Rate of carbon monoxide destruction in the PSR; inlet
temperature: 5 atm – 483K, 10 atm –592 K, 20 atm – 716 K,
residence time varied from blowout to 2 ms; reactor temperature
corresponds to adiabatic temperature in PSR............................................28
Figure 3.3.7 Rate of carbon monoxide destruction in the second PSR. Inlet
temperature: 5 atm – 483K, 10 atm –592 K, 20 atm – 716 K; first
PSR residence time: 5 atm – 2 ms, 10 atm –1.0 ms, 20 atm – 0.5
ms; second PSR residence time varied from 2 to 15 ms; reactor
temperature corresponds to adiabatic PSR.................................................28
Figure 3.3.8 Rate of carbon monoxide destruction in the adiabatic PFR. Inlet
temperature: 5 atm – 483K, 10 atm –592 K, 20 atm – 716 K; PSR
residence time: 5 atm – 2 ms, 10 atm –1.0 ms, 20 atm – 0.5 ms;
PFR residence time varied from 0.5 to 10 ms............................................29
Figure 3.3.9 Rate of carbon monoxide destruction in the PFR with cooling air
added. Inlet temperature: 5 atm – 483K, 10 atm –592 K, 20 atm –
716 K; PSR residence time: 5 atm – 2 ms, 10 atm –1.0 ms, 20 atm –
0.5 ms; PFR residence time varied from 2 to 20 ms..................................29
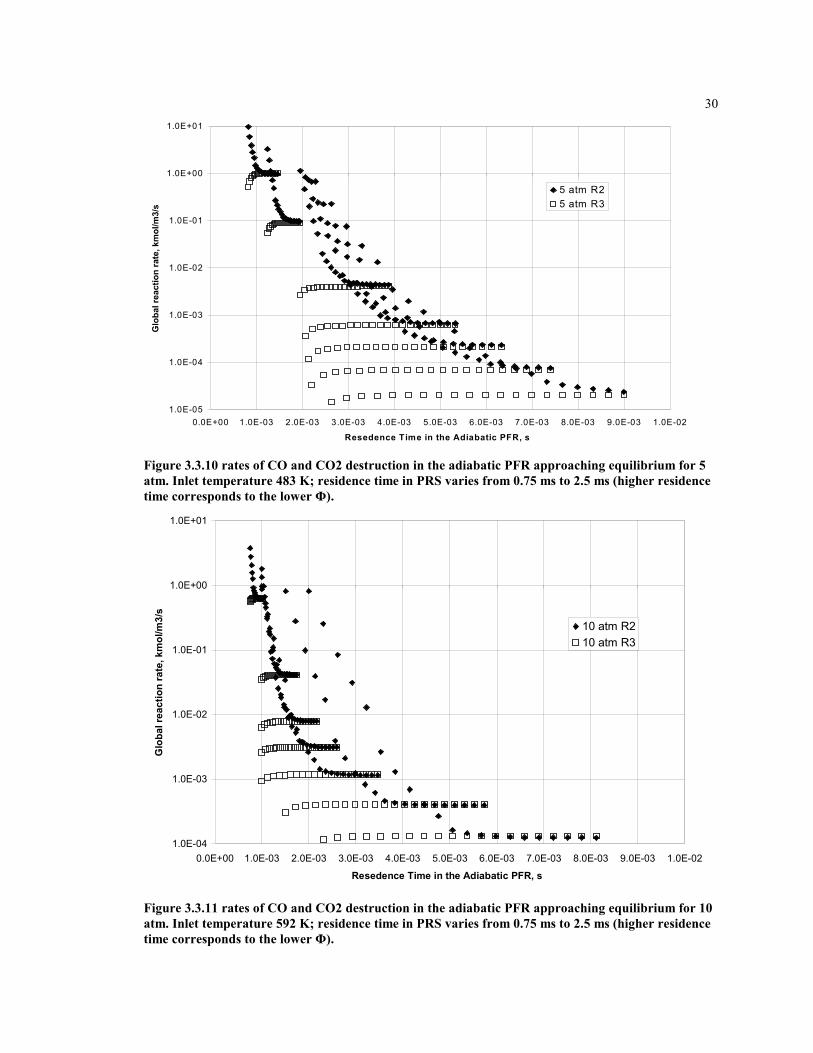
Figure 3.3.10 rates of CO and CO2 destruction in the adiabatic PFR
approaching equilibrium for 5 atm. Inlet temperature 483 K;
residence time in PRS varies from 0.75 ms to 2.5 ms (higher
residence time corresponds to the lower F)...............................................30
v
Figure 3.3.11 rates of CO and CO2 destruction in the adiabatic PFR approaching
equilibrium for 10 atm. Inlet temperature 592 K; residence time in
PRS varies from 0.75 ms to 2.5 ms (higher residence time
corresponds to the lower F).......................................................................30
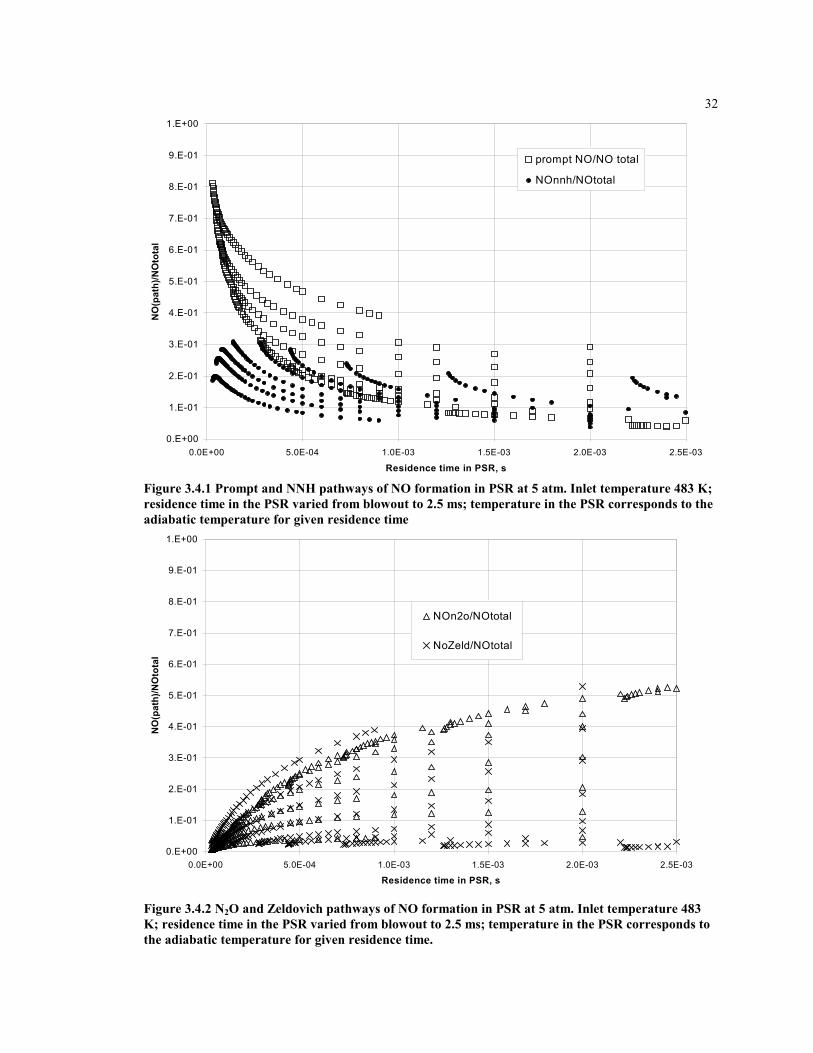
Figure 3.4.1 Prompt and NNH pathways of NO formation in PSR at 5 atm.
Inlet temperature 483 K; residence time in the PSR varied from
blowout to 2.5 ms; temperature in the PSR corresponds to the
adiabatic temperature for given residence time .........................................32
Figure 3.4.2 N2O and Zeldovich pathways of NO formation in PSR at 5 atm.
Inlet temperature 483 K; residence time in the PSR varied from
blowout to 2.5 ms; temperature in the PSR corresponds to the
adiabatic temperature for given residence time. ........................................32
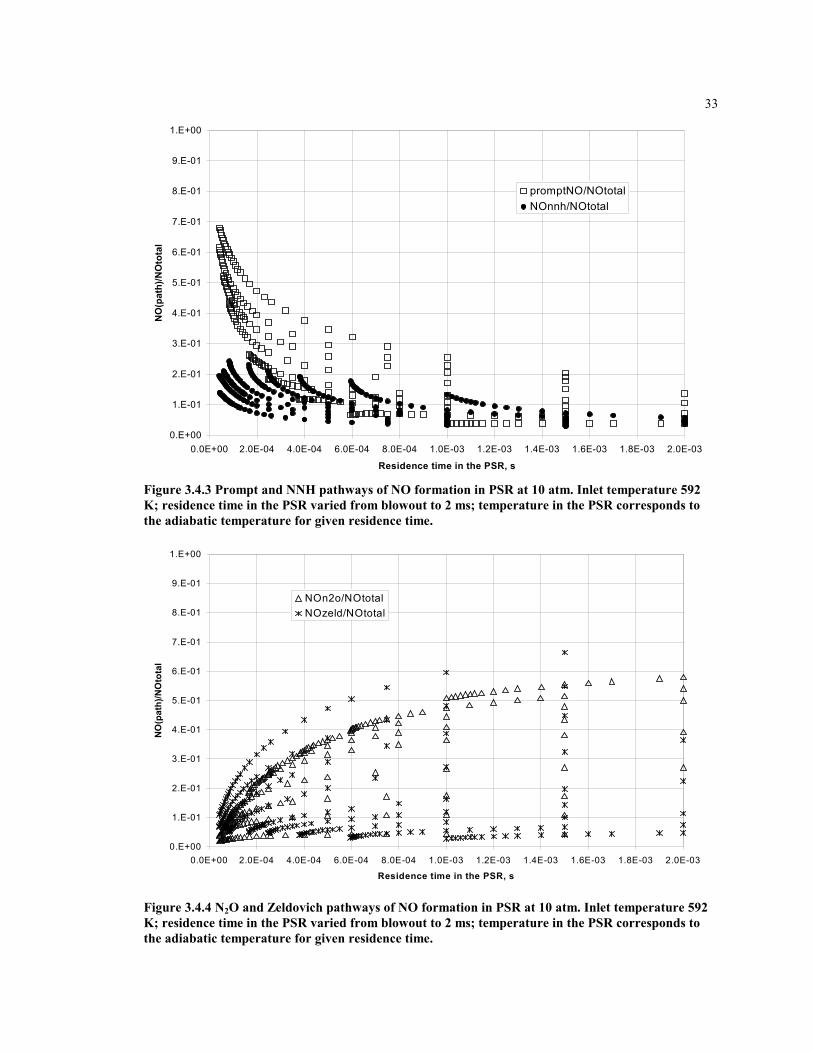
Figure 3.4.3 Prompt and NNH pathways of NO formation in PSR at 10 atm.
Inlet temperature 592 K; residence time in the PSR varied from
blowout to 2 ms; temperature in the PSR corresponds to the
adiabatic temperature for given residence time. ........................................33
Figure 3.4.4 N2O and Zeldovich pathways of NO formation in PSR at 10 atm.
Inlet temperature 592 K; residence time in the PSR varied from
blowout to 2 ms; temperature in the PSR corresponds to the
adiabatic temperature for given residence time. ........................................33
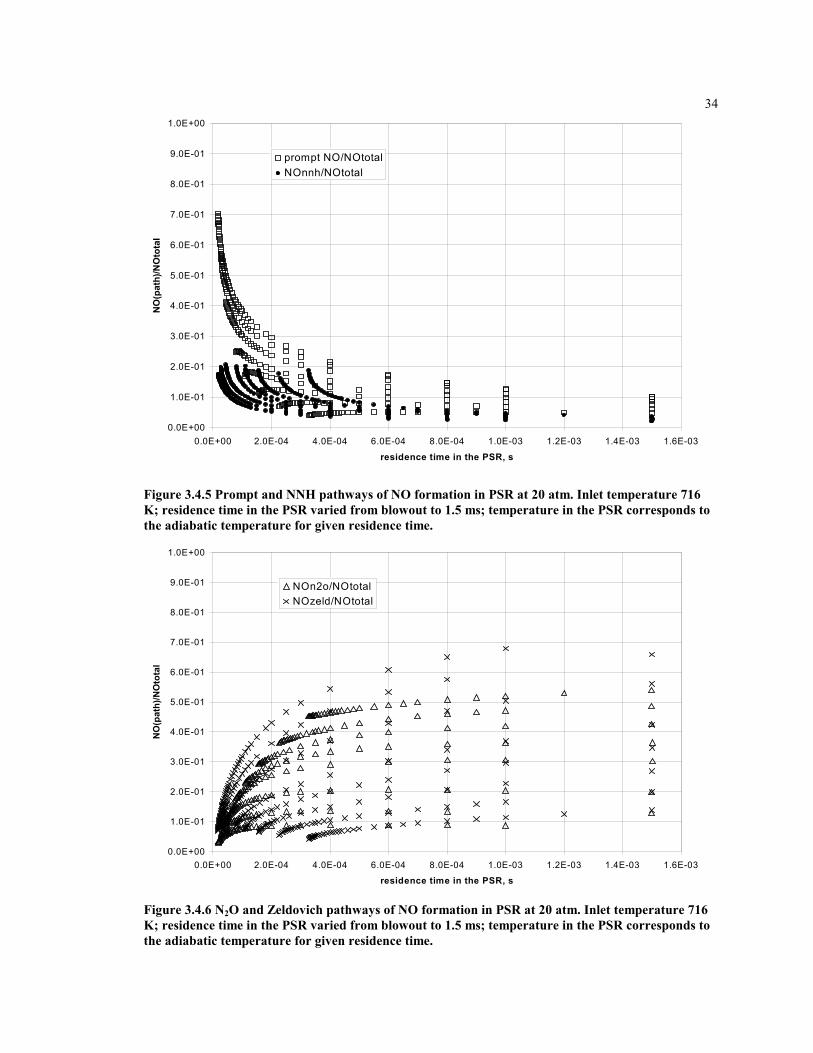
Figure 3.4.5 Prompt and NNH pathways of NO formation in PSR at 20 atm.
Inlet temperature 716 K; residence time in the PSR varied from
blowout to 1.5 ms; temperature in the PSR corresponds to the
adiabatic temperature for given residence time. ........................................34
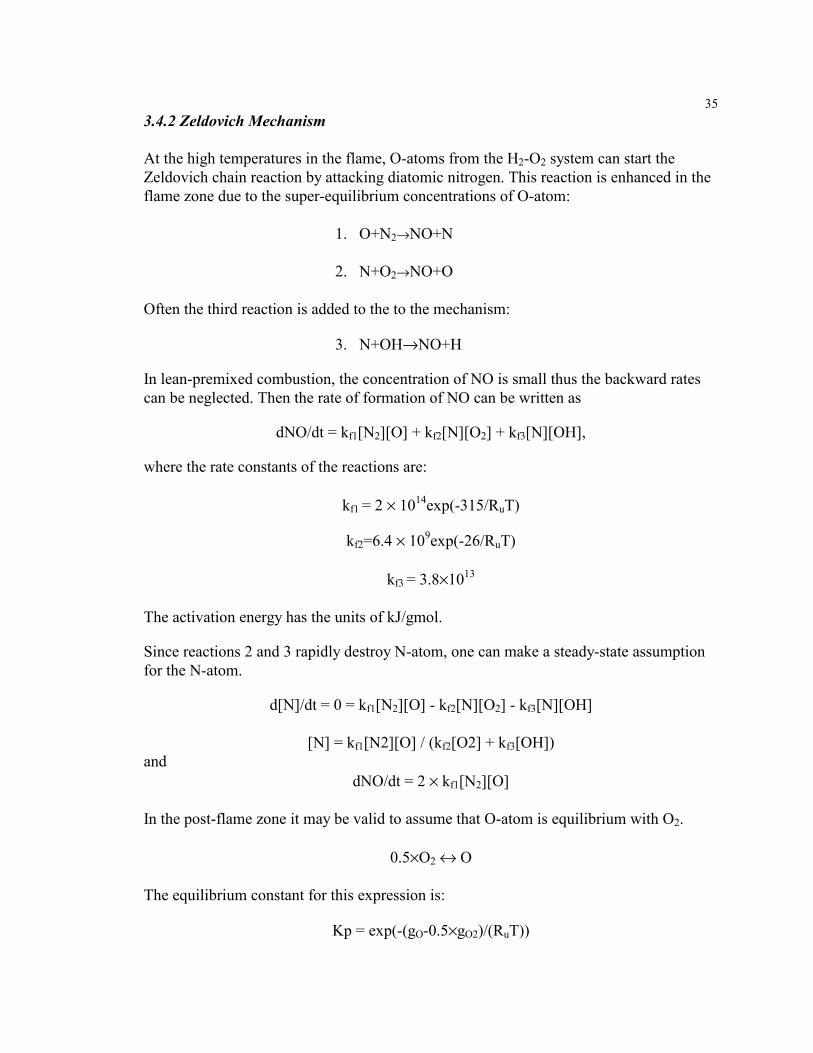
Figure 3.4.6 N2O and Zeldovich pathways of NO formation in PSR at 20 atm.
Inlet temperature 716 K; residence time in the PSR varied from
blowout to 1.5 ms; temperature in the PSR corresponds to the
adiabatic temperature for given residence time. ........................................34
vi
Figure 3.4.7 Formation of NO via N2O and thermal N2O mechanisms in adiabatic PFR
at 5 atm. Inlet temperature 483 K; residence time in PSR 2 ms. ...............39
Figure 3.4.8 Formation of NO via N2O and thermal N2O mechanisms in
adiabatic PFR at 10 atm. Inlet temperature 592 K; residence time in
PSR 1.5 ms.................................................................................................39
Figure 3.4.9 Formation of NO in the flame (modeled as PSR) via N2O and
Zeldovich mechanisms without thermal NO versus global reaction
4. Inlet temperature: 5 atm –483 K, 10 atm – 592 K, 20 atm – 716
K; temperature in the PSR corresponds to the adiabatic flame
temperature. Residence time in the PSR varies from the blowout to
2.5 ms.........................................................................................................42
Figure 3.4.10 Formation of NO in the recirculation zone (modeled as PSR2)
via N2O and Zeldovich mechanisms without thermal NO versus
global reaction 4. Inlet temperature: 5 atm –483 K, 10 atm – 592 K,
20 atm – 716 K; temperature in the PSR corresponds to the
adiabatic flame temperature. Residence time in the adiabatic PSR2
varied from 2 ms to 20ms. .........................................................................42
Figure 3.4.11 Formation of NO in the post-flame zone (modeled as adiabatic
PFR) via N2O and Zeldovich mechanism without thermal NO
versus global reaction 4. Inlet temperature: 5 atm –483 K, 10 atm –
592 K, 20 atm – 716 K; temperature in the PSR corresponds to the
adiabatic flame temperature. Residence time in the adiabatic PFR
varies from 2 ms to 20ms...........................................................................43
Figure 3.4.12 Formation of NO in the flame (modeled as PSR) via NNH and
prompt mechanisms versus global reaction 5. Inlet temperature: 5
atm –483 K, 10 atm – 592 K, 20 atm – 716 K; temperature in the
PSR corresponds to the adiabatic flame temperature. Residence
time in the PSR varies from the blowout to 2.5 ms. ..................................47
Figure 3.5.1 Formation of NO by the global mechanism versus total rate of NO
production by GRI 3.0 in the flame (modeled as PSR). Inlet
vii
temperature: 5 atm –483 K, 10 atm – 592 K, 20 atm – 716 K; temperature in
the PSR corresponds to the adiabatic flame temperature. Residence
time in the PSR varies from the blowout to 2.5 ms. ..................................50
Figure 3.5.2 Formation of NO by global mechanism versus total rate of NO
production by GRI 3.0 in the recirculation zone (modeled as PSR2).
Inlet temperature: 5 atm –483 K, 10 atm – 592 K, 20 atm – 716 K;
temperature in the PSR corresponds to the adiabatic flame
temperature. Residence time in the adiabatic PSR2 varies from 2 ms
to 20ms.......................................................................................................50
Figure 3.5.3 Formation of NO by global mechanism versus net rate of NO
production by GRI 3.0 in the post-flame zone (modeled as adiabatic
PFR followed by a PSR). Inlet temperature: 5 atm –483 K, 10 atm –
592 K, 20 atm – 716 K; temperature in the PSR corresponds to the
adiabatic flame temperature. Residence time in the adiabatic PFR
varies from 2 ms to 20ms...........................................................................51
Figure 4.1 Mole fraction of CO in the PSR of the modeled Bengtsson reactor ..........54
Figure 4.2 Mole fraction of NO formed by different pathways for the 5 bar
cases in the PSR of the modeled Bengtsson reactor ..................................55
Figure 4.3 Mole fraction of NO formed by different pathways for the 10 bar
cases in the PSR of the modeled Bengtsson reactor ..................................55
Figure 4.4 CO mole fractions at the exit of Bengtsson reactor as a function of
pressure ......................................................................................................57
Figure 4.5 NOx mole fractions at the exit of Bengtsson reactor as a function of
pressure ......................................................................................................57
Figure 4.6 CO formation in the PSR for the unheated inlet, 4.7 atm...........................61
Figure 4.7 CO formation in the PSR for the unheated inlet, 6.5 atm...........................61
Figure 4.8 CO formation in the PSR for the heated inlet, 6.5 atm...............................62
Figure 4.9 NO formation in the PSR for the unheated inlet, 4.7 atm..........................62
Figure 4.10 NO formation in the PSR for the unheated inlet, 6.5 atm........................63
Figure 4.11 NO formation in the PSR for the heated inlet, 6.5 atm............................63
viii
Figure 4.12 CO mole fraction in the recirculation zone of Rutar’s JSR for unheated inlet,
4.7 atm........................................................................................................64
Figure 4.13 CO mole fraction in the recirculation zone of Rutar’s JSR for
unheated inlet, 6.5 atm...............................................................................64
Figure 4.14 CO mole fraction in the recirculation zone of Rutar’s JSR for
heated inlet, 6.5 atm...................................................................................65
Figure 4.15 NO mole fraction for the recirculation zone of Rutar’s JSR for
unheated inlet, 4.7 atm...............................................................................65
Figure 4.16 NO mole fraction for the recirculation zone of Rutar’s JSR for
unheated inlet, 6.5 atm................................................................................ 66
Figure 4.17 NO mole fraction for the recirculation zone of Rutar’s JSR for heated
inlet, 6.5 atm Figure 4.18 Carbon monoxide emissions at the exit plane
of Combustor A. Operating conditions: pressure – 10 atm, inlet
temperature - 650 K. ................................................................................... 66
Figure 4.18 Carbon monoxide emissions at the exit plane of Combustor A.
Operating conditions: pressure – 10 atm, inlet temperature - 650 K.......... 71
Figure 4.19 NO emissions at the exit plane of Combustor A. Operating
conditions: pressure – 10 atm, inlet temperature - 650 K........................... 71
Figure 4.20 Velocity vectors colored by temperature for the CFD simulation using
k-epsilon momentum closure model, 8-step global kinetic mechanism.
Operating conditions: Pressure = 9.9 atm, Inlet temperature = 650 K,
Fuel-Air equivalence ratio premixer = 0.61. Eddy break up model
coefficients for reaction 1 are A=1000, B=0.01. Maximum temperature
in the combustor = 1967 K. ........................................................................ 72
Figure 4.21 Velocity vectors colored by temperature for the CFD simulation using
k-epsilon momentum closure model, 5-step, 8-atm global kinetic
mechanism. Operating conditions: Pressure = 9.9 atm, Inlet
temperature = 650 K, Fuel-Air equivalence ratio premixer = 0.61.
Eddy break up model coefficients for the reaction 1 are A=1000,
B=0.01.Maximum temperature in the combustor = 1966 K....................... 72
ix
Figure 4.22 Velocity vectors colored by CO mole fraction for Fig. 4.20 (8-step global).
). Maximum CO mole fraction = 1.3%....................................................... 73
Figure 4.23 Velocity vectors colored by CO mole fraction for Fig. 4.21 (5-step
global). Maximum CO mole fraction = 1.25%........................................... 73
Figure 4.24 Velocity vectors colored by NO mole fraction for Fig. 4.20 (8-step
global). Maximum NO mole fraction = 7.25e-5......................................... 74
Figure 4.25 Velocity vectors colored by NO mole fraction for Fig. 4.21 (5-step
global). Maximum NO mole fraction = 3.16e-5........................................ 74
Figure 4.26 Contours of rate reaction 4 of 8-step global mechanism – NO
formation via non-thermal N2O and Zeldovich for Fig. 4.20 ..................... 75
Figure 4.27 Contours rate reaction 5 of 8-step global mechanism – NO formation
via prompt and NNH mechanisms for Fig. 4.20......................................... 75
Figure 4.28 Contours of rate of non-thermal NO formation of 5-step global
mechanism for Fig 4.21 .............................................................................. 76
Figure 4.29 Velocity vectors colored by CO mole fraction for the CFD simulation
using k-epsilon momentum closure model, 8-step global kinetic
mechanism. Operating conditions: Pressure = 9.9 atm, Inlet
temperature = 650 K, Fuel-Air equivalence ratio premixer = 0.48.
Eddy break up model coefficients for reaction 1 are A=1000, B=0.01.
Maximum CO mole fraction = 1.61% ........................................................ 76
Figure 4.30 Velocity vectors colored by CO mole fraction for the CFD simulation
using k-epsilon momentum closure model, 5-step global kinetic
mechanism. Operating conditions: Pressure = 9.9 atm, Inlet
temperature = 650 K, Fuel-Air equivalence ratio premixer = 0.48.
Eddy break up model coefficients for reaction 1 are A=1000, B=0.01.
Maximum CO mole fraction = 1.61% ........................................................ 77
x
LIST OF TABLES
Table 4.1 Results of the PSR-PFR modeling for the Bengtsson reactor. The
species mole fractions are taken in the PSR, the inlet temperature is
varied to obtain the measured temperature at the exit tube of the
reactor. The first PSR is 88% of the total JSR volume. The PFR is
12 % plus 16% of the JSR volume for the exit tube. .................................56
Table 4.2 Results of the PSR modeling for Rutar’s JSR. ............................................59
Table 4.3 Modeling results for the two PSR arrangement of Rutar’s JSR. The
exit and sampling location of the reactor is presented by PSR2 ................60
Table 4.4 Main characteristics of CFD simulation using 5-step and 8-step
global mechanisms for Combustor A with fuel-air equivalence ratio
of 0.61. .......................................................................................................70
xi
Acknowledgments
We wish to acknowledge and express appreciation for the financial support and
encouragement provided for this research by Ansaldo Ricerche s. r. l., especially Dr.
Giulio Mori, and by Solar Turbines, Inc., especially Dr. Kenneth O. Smith. Also thanked
are Dr. David G. Nicol and Professor John C. Kramlich for advising on the MSME
committee of Mr. Igor V. Novosselov.
1Chapter 1
Introduction and Objectives
1.1 Introduction
In light of increasing environmental concerns on one hand and growing energyconsumption on the other, human society is moving towards technologies that can beacceptable in the future. While searching for new energy sources, the use of fossil fuelsseems to be unavoidable, developing of new energy conversion technologies is also veryimportant.
Land-based gas turbine (GT) engines operate on natural gas and are considered one of thecleanest combustion technologies. Among the fossil fuels that are used today, natural gasthe highest hydrogen to carbon ratio, thus produces the least amount of carbon dioxide.Though the carbon dioxide is not viewed as a pollutant by current standards, it is a greenhouse gas that contributes to global warming. There are other environmental advantagesof natural gas over the other fossil fuels. In particular, the absence of sulfur in natural gasimplies that there are practically no sulfur dioxide emissions present. Sulfur dioxide is aknown precursor to acid rain. The other advantage of gas turbine is its high efficiency.The current efficiencies of combined cycle gas turbine (CCGT) approach 60%.
However, the high temperatures associated with combustion can lead to high levels ofnitrogen oxides (NOx) emissions. Reducing the NOx without compromising the low COlevels is one of the main concerns in the design of GT combustors. One of the techniquesin reducing nitrogen oxide emission is lean premixed (LP) combustion. By burning themixture lean, the combustor can avoid high local fuel-air equivalence ratios that increasethe flame temperature.
Different methods have been presented in the literature for modeling the combustionprocess associated with turbulent phenomena. However, there are no computer modelsavailable that incorporate the full set of chemical kinetic reactions coupled with turbulentflow modeling. Attempts have been made to include the complex chemistry in turbulentmodels, but such models are limited to rather simple systems and still require greatamounts of computer time (i.e., H2 combustion, Borghi (1988)). To model the morecomplex combustion system various simplified global kinetic mechanisms have beendeveloped (see Chapter 2). These mechanisms are limited by their the operating conditionand may fail to predict CO and NO emissions accurately out of their range.
1.2 Objectives
The objective of this work is to develop and validate a pressure sensitive globalmechanism for methane oxidation with NO formation for lean premixed (LP) combustionin gas turbine engines. In order to model the combustion more accurately all known
2mechanisms of NO formation are considered, and the global mechanism is applied tovariable pressure.
1.3 Approach and Validation
The global kinetic mechanism is based on the detailed chemical kinetic mechanism GRI3.0. The research and validation are done in the following order:
1. Study the Computational Fluid Dynamics (CFD) results of Nicol and Malte (2000) todetermine typical conditions for the GT combustor; i.e. the sizes and location of themain reaction zones, including flame zone, post-flame zone, and recirculation zone;and the characteristic parameters of the zones, including equivalence ratios,temperatures, residence times, turbulence parameters, and species concentrations.
2. Using the full chemistry of GRI 3.0 in Chemical Reactor Modeling (CRM)representative of the reaction zones, develop a computer-generated database ofspecies concentrations, rates of reactions for various reactor arrangements, pressures,equivalence ratios, and temperatures that are applicable to LP combustion in gasturbine.
3. Perform the regression analysis for the database to obtain the global rate expressionsfor methane oxidation and nitric oxide formation.
4. Compare the CRM results obtained with global rate expressions versus the full kineticmechanism GRI 3.0.
5. Validate the global rate expressions in CRM against jet-stirred reactor databases ofTeodora Rutar (2000) and Karin U. M. Bengtsson (1998).
6. Validate the global rate expressions using the gas turbine Combustor A database fromNicol and Malte (2000). Combustor A is simulated using a CRM consisting of twelvezones, and a CFD model with k-ε momentum equation closure. In both simulations,the global rate expressions provide the chemical kinetic data.
3Chapter 2
Modeling of the Combustor A
2.1 Turbulent Combustion
In industrial applications, combustion is normally associated with turbulence. Large flowrates, enhancing mixing designs, and heat release during combustion increase theturbulence.
Combustion systems can be divided into premixed, partially premixed, and non-premixed. Examples for premixed combustion are the carbureted and post-injectedinternal combustion engine with spark ignition and the LP combustor for the GT engine.In the GT application, the fuel and air come to the combustor premixed. Turbulence isnecessary for such mixing. Partially premixed combustion can be observed in directinjection internal combustion engines. Non-premixed combustion takes place in dieselengines and the other applications where the fuel is injected separately from the air, andin cases where solid or liquid fuels are used.
The rate of chemical reaction during the combustion process depends on the type ofcombustion and the conditions in the combustor. One can distinguish two different ratesat which combustion occurs: the mixing rate, in which case the fuel reacts as fast as themixing occurs, and the chemical kinetic rate, which assumes that mixing is infinitely fastand the chemistry is slow. This division is described by Damkohler number (Da), whichis defined as chemical time divided by mixing time.
2.2 CFD Modeling of Turbulent Combustion
There are a number of ways to model turbulent combustion. CFD modeling has ability toprovide valuable insight on the flow and temperature fields of the combustor, which aredifficult to obtain experimentally. While CFD is a valuable tool for predicting the flowand temperature fields, this method cannot incorporate complicated chemistry of detailedchemical kinetic mechanisms. Thus CFD cannot always accurately predict the exhaustemissions. CFD solves the Reynolds-averaged Navier-Stokes (RANS) equations coupledwith energy and species equations. The commercial CFD package FLUENT is used in thesimulations. The momentum equations are closed using standard k-ε, renormalized group(RNG) k-ε, and the Reynolds stress model (RSM). The can-type combustor simulated,hereafter referred as Combustor A, is modeled as a 2-D axi-symmetric flow with swirl.The computational domain is divided into finite volumes, 190 x 81, as depicted in figure2.1. The previously developed 5-step, 8-atm global mechanism of Nicol (1995) is used asa starting point for the CFD simulations. FLUENT is also able to incorporate mixingcontrolled reaction rates, by employing the Magnussen and Hjertager model (1976),which is based on the eddy break-up model of Spalding (1970). The code automaticallychooses the slower rate of two (chemical or mixing) and defines it as a limiting rate forthe reaction.
4
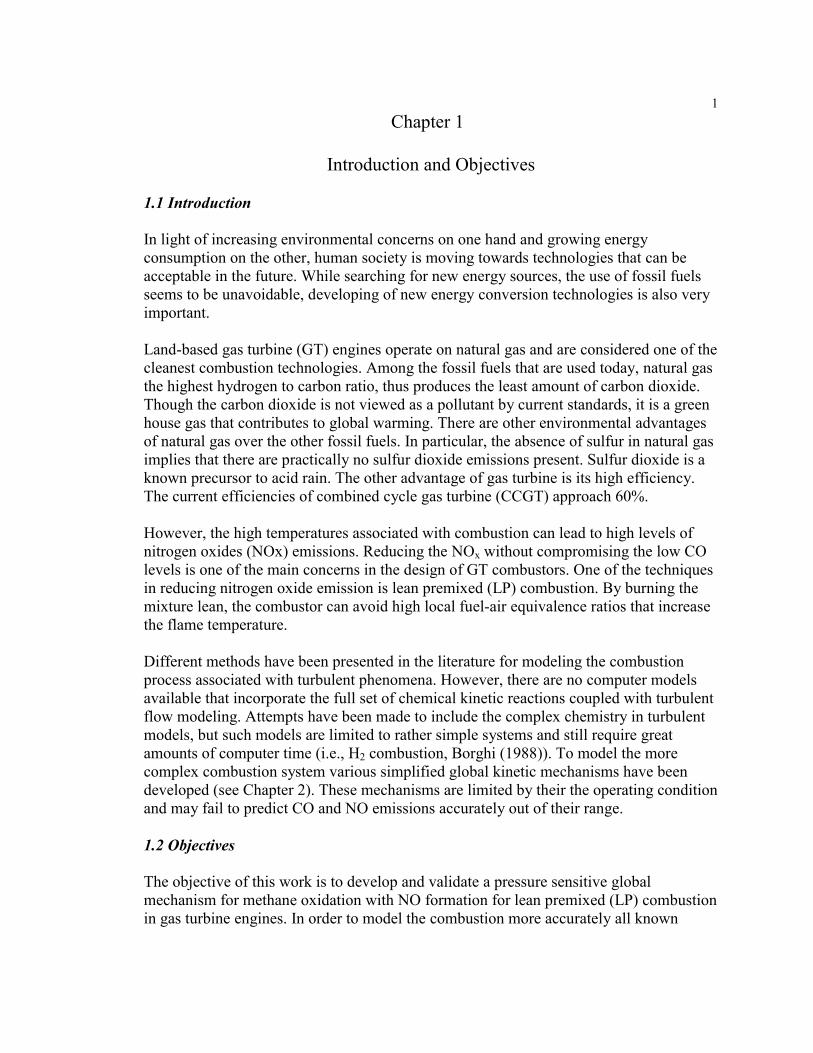
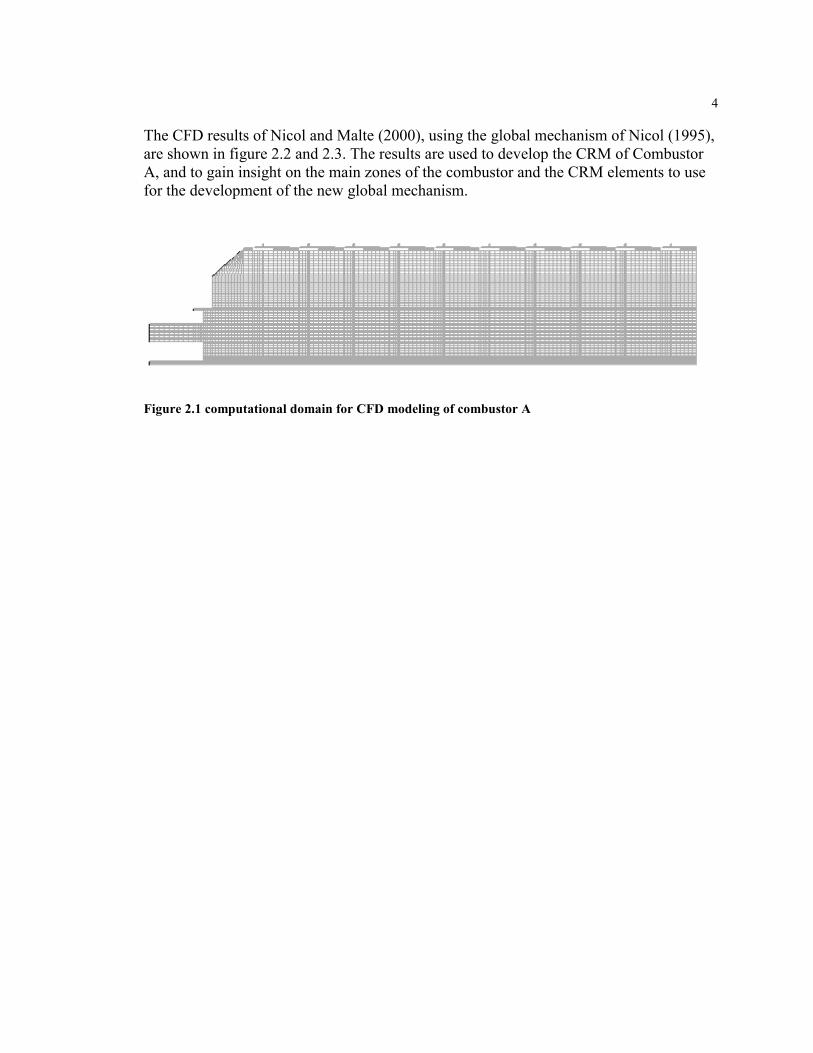
The CFD results of Nicol and Malte (2000), using the global mechanism of Nicol (1995),are shown in figure 2.2 and 2.3. The results are used to develop the CRM of CombustorA, and to gain insight on the main zones of the combustor and the CRM elements to usefor the development of the new global mechanism.
Figure 2.1 computational domain for CFD modeling of combustor A
5
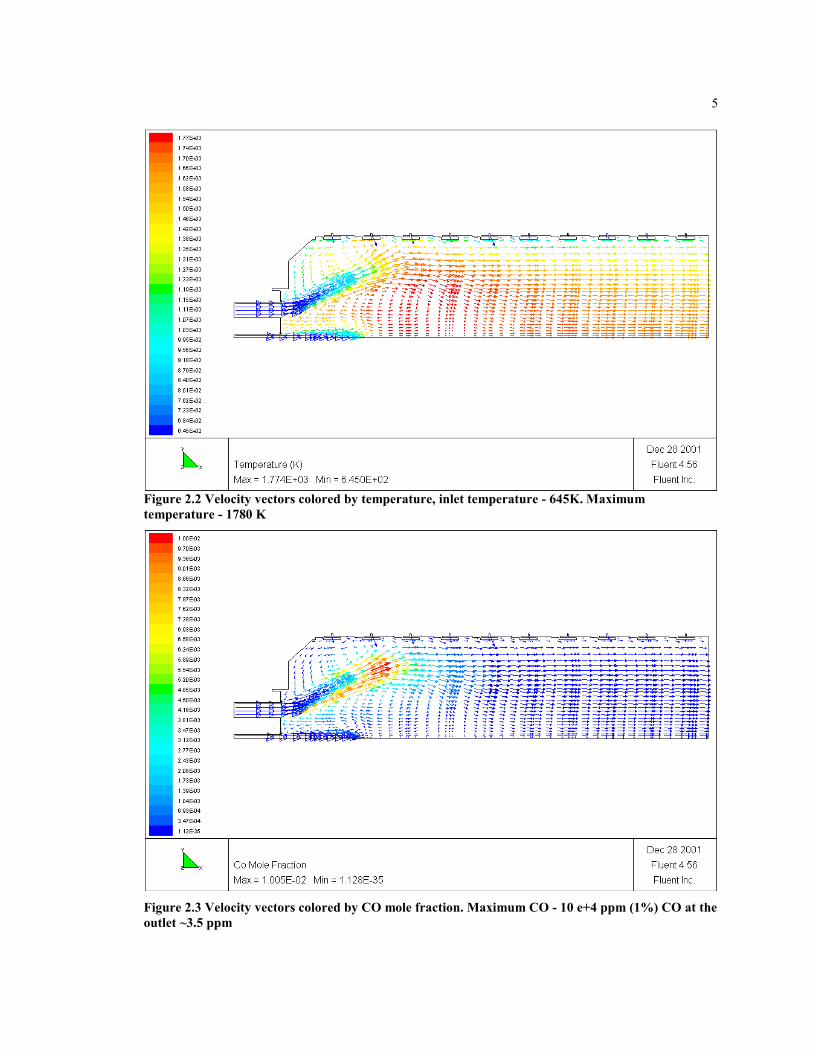
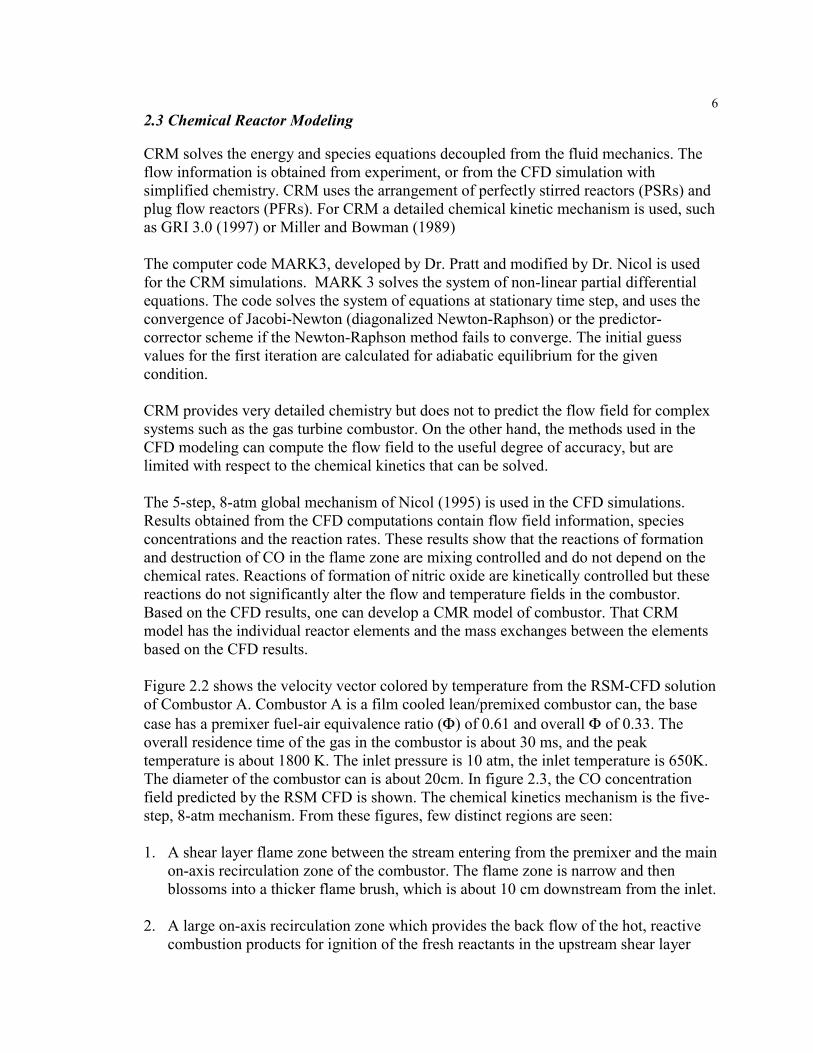
Figure 2.2 Velocity vectors colored by temperature, inlet temperature - 645K. Maximumtemperature - 1780 K
Figure 2.3 Velocity vectors colored by CO mole fraction. Maximum CO - 10 e+4 ppm (1%) CO at theoutlet ~3.5 ppm
62.3 Chemical Reactor Modeling
CRM solves the energy and species equations decoupled from the fluid mechanics. Theflow information is obtained from experiment, or from the CFD simulation withsimplified chemistry. CRM uses the arrangement of perfectly stirred reactors (PSRs) andplug flow reactors (PFRs). For CRM a detailed chemical kinetic mechanism is used, suchas GRI 3.0 (1997) or Miller and Bowman (1989)
The computer code MARK3, developed by Dr. Pratt and modified by Dr. Nicol is usedfor the CRM simulations. MARK 3 solves the system of non-linear partial differentialequations. The code solves the system of equations at stationary time step, and uses theconvergence of Jacobi-Newton (diagonalized Newton-Raphson) or the predictor-corrector scheme if the Newton-Raphson method fails to converge. The initial guessvalues for the first iteration are calculated for adiabatic equilibrium for the givencondition.
CRM provides very detailed chemistry but does not to predict the flow field for complexsystems such as the gas turbine combustor. On the other hand, the methods used in theCFD modeling can compute the flow field to the useful degree of accuracy, but arelimited with respect to the chemical kinetics that can be solved.
The 5-step, 8-atm global mechanism of Nicol (1995) is used in the CFD simulations.Results obtained from the CFD computations contain flow field information, speciesconcentrations and the reaction rates. These results show that the reactions of formationand destruction of CO in the flame zone are mixing controlled and do not depend on thechemical rates. Reactions of formation of nitric oxide are kinetically controlled but thesereactions do not significantly alter the flow and temperature fields in the combustor.Based on the CFD results, one can develop a CMR model of combustor. That CRMmodel has the individual reactor elements and the mass exchanges between the elementsbased on the CFD results.
Figure 2.2 shows the velocity vector colored by temperature from the RSM-CFD solutionof Combustor A. Combustor A is a film cooled lean/premixed combustor can, the basecase has a premixer fuel-air equivalence ratio (Φ) of 0.61 and overall Φ of 0.33. Theoverall residence time of the gas in the combustor is about 30 ms, and the peaktemperature is about 1800 K. The inlet pressure is 10 atm, the inlet temperature is 650K.The diameter of the combustor can is about 20cm. In figure 2.3, the CO concentrationfield predicted by the RSM CFD is shown. The chemical kinetics mechanism is the five-step, 8-atm mechanism. From these figures, few distinct regions are seen:
1. A shear layer flame zone between the stream entering from the premixer and the mainon-axis recirculation zone of the combustor. The flame zone is narrow and thenblossoms into a thicker flame brush, which is about 10 cm downstream from the inlet.
2. A large on-axis recirculation zone which provides the back flow of the hot, reactivecombustion products for ignition of the fresh reactants in the upstream shear layer
7between inlet premixed stream and the recirculation zone. The small recirculationzone in the dome region also helps to recirculate hot burnt gas and promote ignitionin the thicker part of the flame zone.
3. Post-flame, burn-out-zone-combustion is located downstream of the large on-axisrecirculation zone as the flow straightens out and flow axially toward the outlet of thecombustor can.
4. Post-flame zone, with cooling air addition, is located along the wall of the combustor
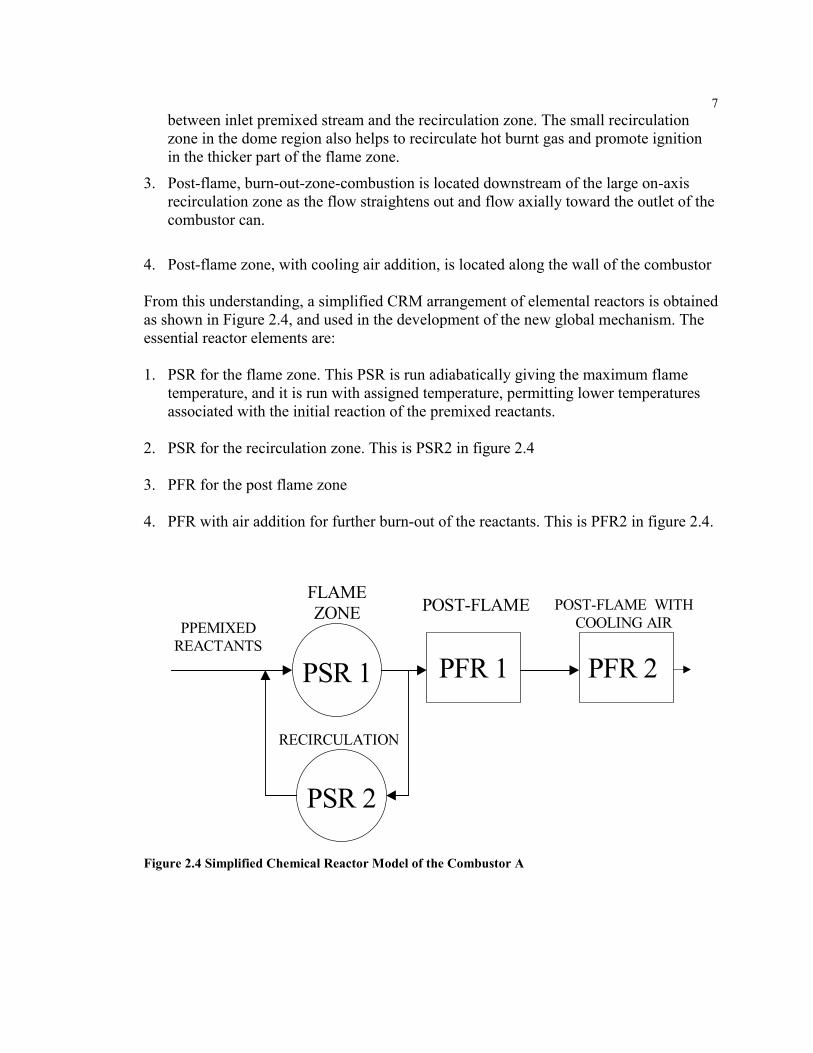
From this understanding, a simplified CRM arrangement of elemental reactors is obtainedas shown in Figure 2.4, and used in the development of the new global mechanism. Theessential reactor elements are:
1. PSR for the flame zone. This PSR is run adiabatically giving the maximum flametemperature, and it is run with assigned temperature, permitting lower temperaturesassociated with the initial reaction of the premixed reactants.
2. PSR for the recirculation zone. This is PSR2 in figure 2.4
3. PFR for the post flame zone
4. PFR with air addition for further burn-out of the reactants. This is PFR2 in figure 2.4.
PFR 1PSR 1
PSR 2
POST-FLAME
RECIRCULATION
FLAMEZONE
PFR 2
POST-FLAME WITHCOOLING AIRPPEMIXED
REACTANTS
Figure 2.4 Simplified Chemical Reactor Model of the Combustor A
8
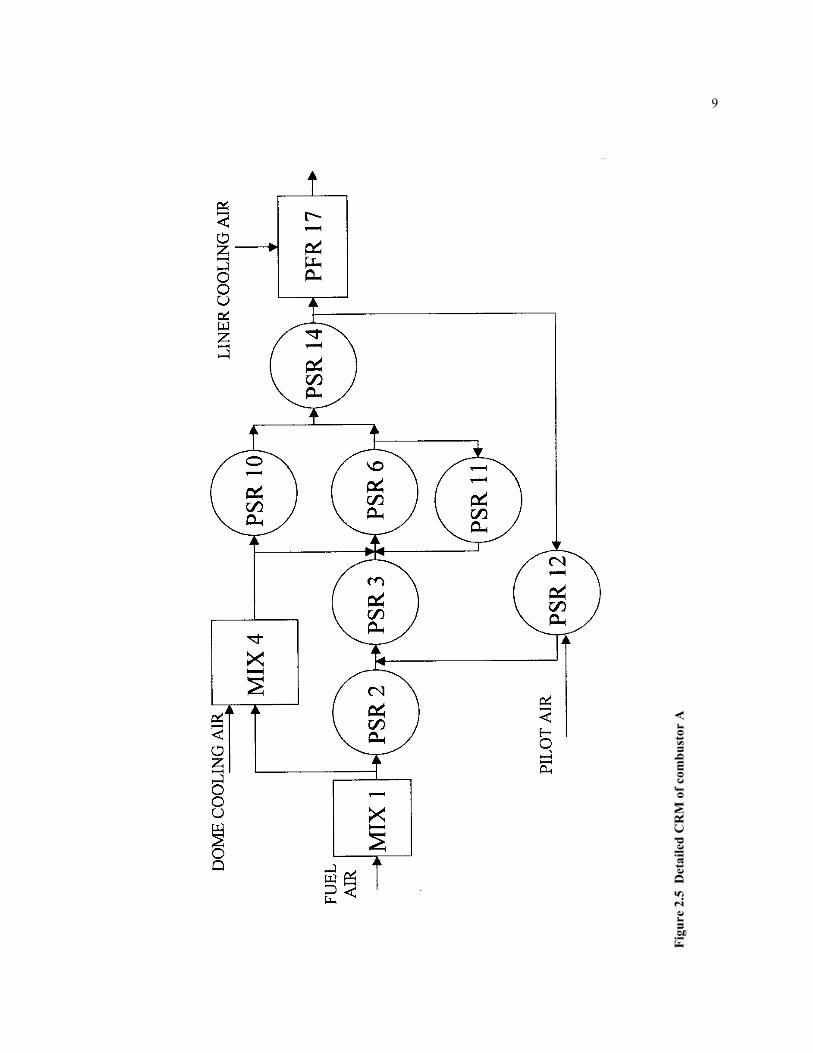
A very detailed CRM arrangement is also obtained for modeling Combustor A. Thecombustor is divided into several chemical reactor elements. The different types of theelements (MIX, PSR, and PFR) represent each region see figure 2.5: the stream frompremixer (MIX 1, PSR2, PSR 3, PSR 6, PSR 10, PSR 14); dome recirculation zone (MIX4); main recirculation zone (PSR 11 and PSR 12); and post-flame zone (PFR 17). Seefigure 2.5. The balance of the numbered elements are the small MIX reactors needed toconnect the functional elements. The volumes of each element are estimated from theCFD results.
The first element in the detailed CRM arrangement is a MIX element, which representthe inlet into the combustor. About 10% of the fresh mix are ignited in the very short PSR2 as hot gas approaches from the on-axis main recirculation zone (PSR 12). The freshlyignited gas mixes with additional recirculated and burnt gas in PSR 3. In PSR 6 theburning mixture receives and burns unburned gas from the dome zone (MIX 4) andadditional hot products from main recirculation element (PSR 11). From PSR 6, part ofthe mixture recycles to PSR 11 in the upper part of the main recirculation zone, the otherpart moves downstream to PSR 14. The other 90% of the fresh methane-air mixture fromMIX 1 does not react immediately, rather it mixes with air in the combustor dome area(element MIX 4). This lean mixture enters PSR 10 where it is ignited and burned. Underthe very lean conditions the reaction in element 10 sustain a CO concentration of 0.5 -1%. The CO is destroyed in PSR 14 where the gas from PSR 10 mixes and burns with theproducts of PSR 6. Part of the gas from element 14 (about 5%) goes to the lower part ofthe central recirculation zone PRS 12. PSR 12 receives some fresh air from the pilot inletand recycles to PSR 3. Most of the flow from PSR 14 enters the PFR 17 where it isdeluded by secondary air and exits the combustor. Note that in this simulation there is nofuel entering the combustor through the centerline pilot, only a small amount of air entersthrough this pilot.
The rates of the flow into the elements and their residence times are estimated from theCFD results. The flow rate in an element computed as follows:
where:ρ = average density in the element, kg/m3
V = average velocity in the element, m/sAc = cross area of the element, m2
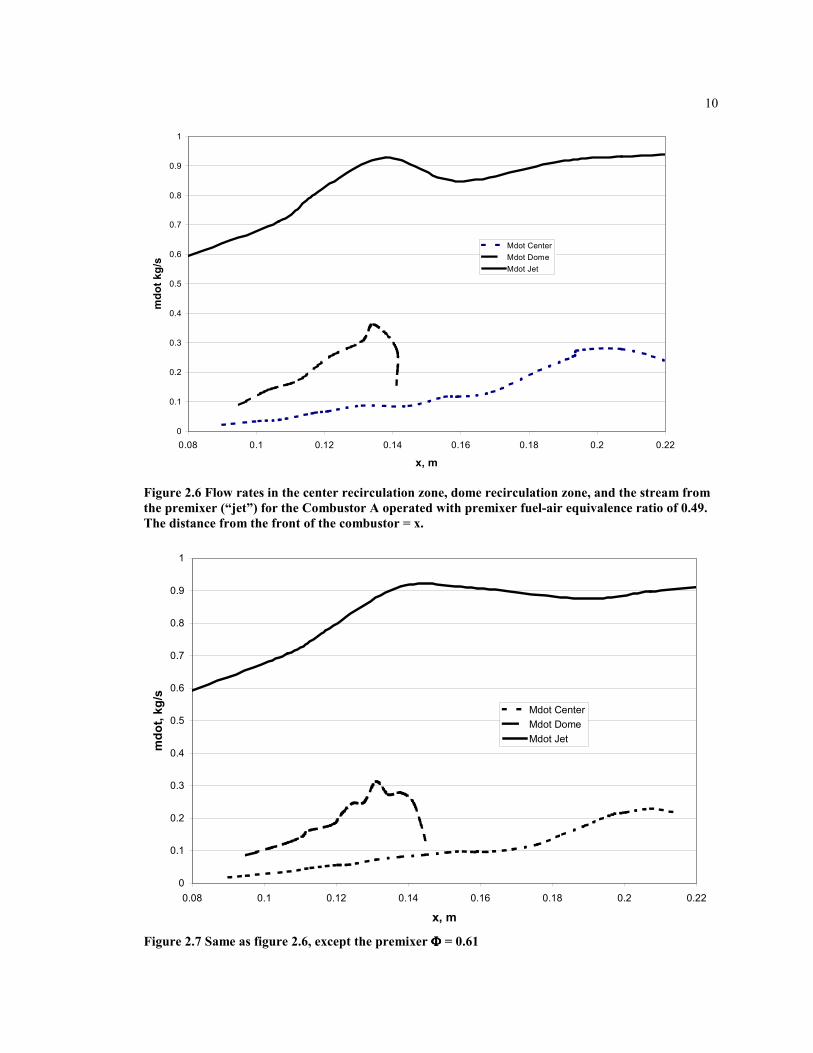
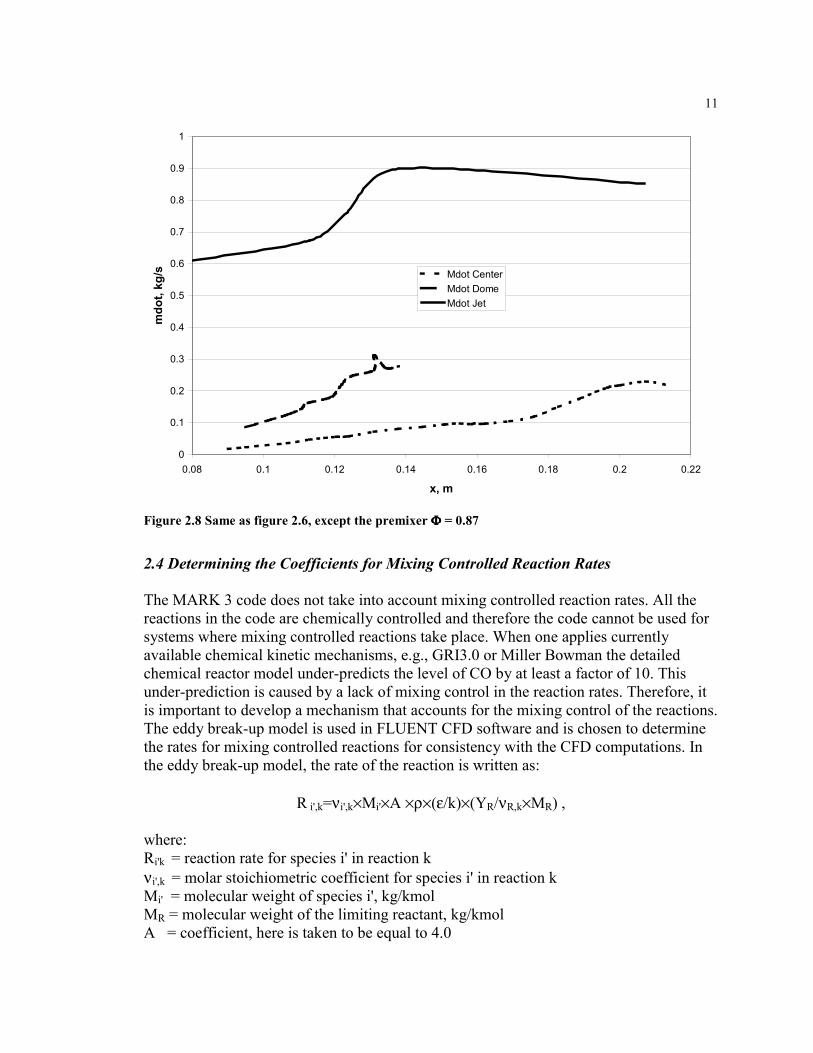
Figures 2.6, 2.7, and 2.8 show the flow rates in the jet and the recirculation zones of theCombustor A calculated for different fuel-air equivalence ratios.
,AVm cdot ××ρ=
9
Figu
re 2
.5 D
etai
led
CR
M o
f com
bust
or A
10
0
0.1
0.2
0.3
0.4
0.5
0.6
0.7
0.8
0.9
1
0.08 0.1 0.12 0.14 0.16 0.18 0.2 0.22
x, m
mdo
t kg/
s
Mdot CenterMdot DomeMdot Jet
Figure 2.6 Flow rates in the center recirculation zone, dome recirculation zone, and the stream fromthe premixer (“jet”) for the Combustor A operated with premixer fuel-air equivalence ratio of 0.49.The distance from the front of the combustor = x.
0
0.1
0.2
0.3
0.4
0.5
0.6
0.7
0.8
0.9
1
0.08 0.1 0.12 0.14 0.16 0.18 0.2 0.22
x, m
mdo
t, kg
/s
Mdot CenterMdot DomeMdot Jet
Figure 2.7 Same as figure 2.6, except the premixer ΦΦΦΦ = 0.61
11
0
0.1
0.2
0.3
0.4
0.5
0.6
0.7
0.8
0.9
1
0.08 0.1 0.12 0.14 0.16 0.18 0.2 0.22
x, m
mdo
t, kg
/s Mdot CenterMdot DomeMdot Jet
Figure 2.8 Same as figure 2.6, except the premixer ΦΦΦΦ = 0.87
2.4 Determining the Coefficients for Mixing Controlled Reaction Rates
The MARK 3 code does not take into account mixing controlled reaction rates. All thereactions in the code are chemically controlled and therefore the code cannot be used forsystems where mixing controlled reactions take place. When one applies currentlyavailable chemical kinetic mechanisms, e.g., GRI3.0 or Miller Bowman the detailedchemical reactor model under-predicts the level of CO by at least a factor of 10. Thisunder-prediction is caused by a lack of mixing control in the reaction rates. Therefore, itis important to develop a mechanism that accounts for the mixing control of the reactions.The eddy break-up model is used in FLUENT CFD software and is chosen to determinethe rates for mixing controlled reactions for consistency with the CFD computations. Inthe eddy break-up model, the rate of the reaction is written as:
R i',k=νi',k×Mi'×A ×ρ×(ε/k)×(YR/νR,k×MR) ,
where:Ri'k = reaction rate for species i' in reaction kνi',k = molar stoichiometric coefficient for species i' in reaction kMi' = molecular weight of species i', kg/kmolMR = molecular weight of the limiting reactant, kg/kmolA = coefficient, here is taken to be equal to 4.0
12ρ = density, kg/m3
ε = turbulent dissipation rate, m2/s3
k = turbulent kinetic energy, m2/s2
YR = mass fraction of reactant R, kgR/kgtotνR,k = molar stoichiometric coefficient for reactant R in reaction k
For the present case, one needs to calculate the mixing controlled reaction rates for thefirst two reactions of the global mechanism.
Reaction 1 CH4+1.5×O2 → CO+2H2O
Reaction 2 CO+0.5×O2 → CO2
The rates for these two reactions must be expressed in the form of the global reaction rateso they can be used in the chemical reactor modeling. The global chemical kineticmechanism reaction rates are written as:
Ri=d[X]/dt=10n×Tm×e-Ea/RT×[X]x×[Y]y ,
where:10n = pre-exponential factorT = temperatureE = activation energy of the reaction[X] = concentration of species X[Y] = concentration of species Y
The eddy break-up rate does not explicitly depend on temperature, on the other hand, thatis it depends only on the concentration of the limiting species to the first power. Thus, theglobal rate of the reaction is simplified as:
Ri=d[X]/dt=10n×[X]=A×[X],
where:A = pre-exponential factor[X] = limiting species concentration
In order, to obtain the pre-exponential term, one needs to analyze the average parametersof the flow field in the specific zone of the combustor: flame front for the reaction 1, andflame brush for the reaction 2. The data (k, epsilon, and the reaction rate) needed forcalculating the pre-exponential term can be obtained from CFD solution. The coefficientA does not change significantly in the flame zone. The pre-exponential factor is found tobe A=10(3.9-4.1) for reaction 1, and A=10(3.5-3.7) for reaction 2. The species of the limiting(smallest) concentration for reaction 1 is CH4, and for reaction 2 it is CO. The mixingrates of the reactions are:
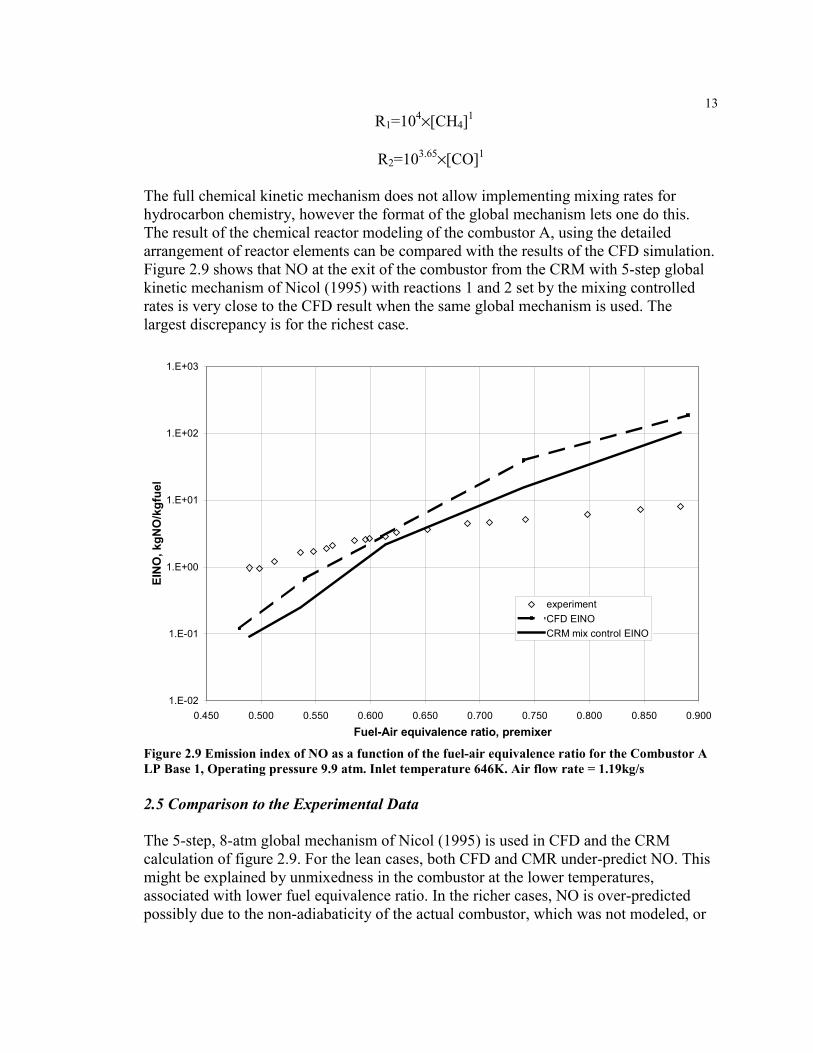
13R1=104×[CH4]1
R2=103.65×[CO]1
The full chemical kinetic mechanism does not allow implementing mixing rates forhydrocarbon chemistry, however the format of the global mechanism lets one do this.The result of the chemical reactor modeling of the combustor A, using the detailedarrangement of reactor elements can be compared with the results of the CFD simulation.Figure 2.9 shows that NO at the exit of the combustor from the CRM with 5-step globalkinetic mechanism of Nicol (1995) with reactions 1 and 2 set by the mixing controlledrates is very close to the CFD result when the same global mechanism is used. Thelargest discrepancy is for the richest case.
1.E-02
1.E-01
1.E+00
1.E+01
1.E+02
1.E+03
0.450 0.500 0.550 0.600 0.650 0.700 0.750 0.800 0.850 0.900Fuel-Air equivalence ratio, premixer
EIN
O, k
gNO
/kgf
uel
experimentCFD EINOCRM mix control EINO
Figure 2.9 Emission index of NO as a function of the fuel-air equivalence ratio for the Combustor ALP Base 1, Operating pressure 9.9 atm. Inlet temperature 646K. Air flow rate = 1.19kg/s
2.5 Comparison to the Experimental Data
The 5-step, 8-atm global mechanism of Nicol (1995) is used in CFD and the CRMcalculation of figure 2.9. For the lean cases, both CFD and CMR under-predict NO. Thismight be explained by unmixedness in the combustor at the lower temperatures,associated with lower fuel equivalence ratio. In the richer cases, NO is over-predictedpossibly due to the non-adiabaticity of the actual combustor, which was not modeled, or
14because of the limitations of the 5-step global mechanism, which was not developed forhigh fuel-air equivalence ratios.
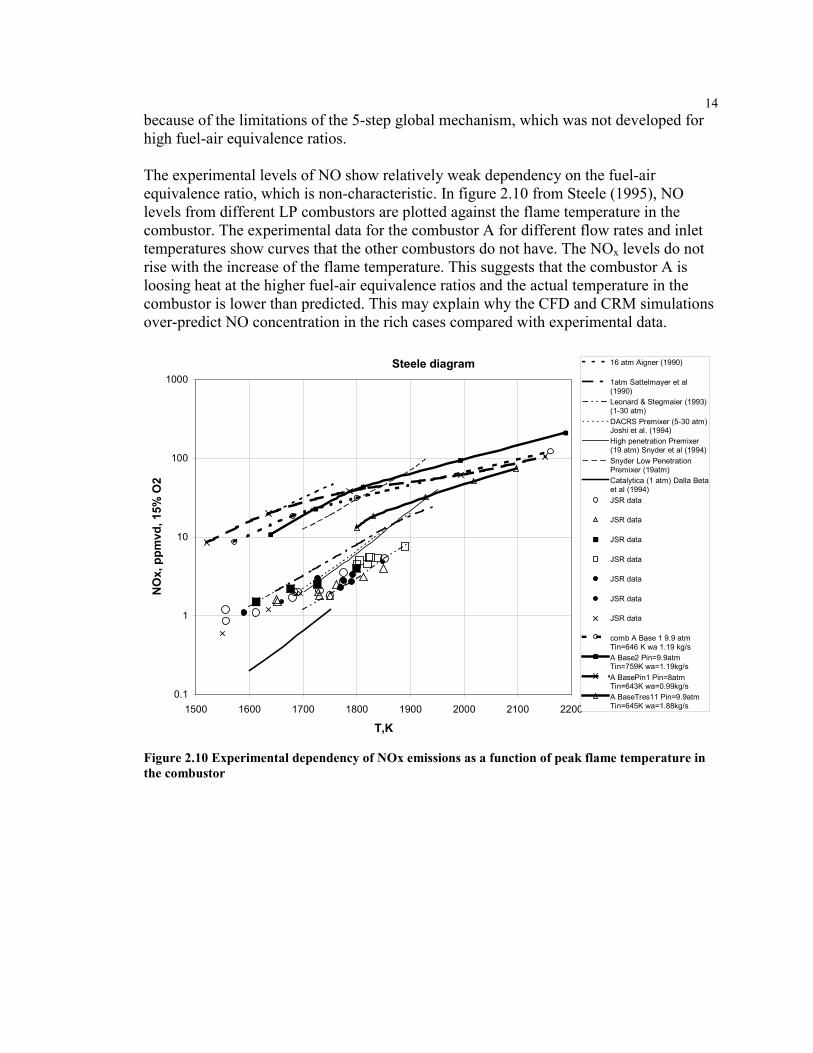
The experimental levels of NO show relatively weak dependency on the fuel-airequivalence ratio, which is non-characteristic. In figure 2.10 from Steele (1995), NOlevels from different LP combustors are plotted against the flame temperature in thecombustor. The experimental data for the combustor A for different flow rates and inlettemperatures show curves that the other combustors do not have. The NOx levels do notrise with the increase of the flame temperature. This suggests that the combustor A isloosing heat at the higher fuel-air equivalence ratios and the actual temperature in thecombustor is lower than predicted. This may explain why the CFD and CRM simulationsover-predict NO concentration in the rich cases compared with experimental data.
Steele diagram
0.1
1
10
100
1000
1500 1600 1700 1800 1900 2000 2100 2200
T,K
NO
x, p
pmvd
, 15%
O2
16 atm Aigner (1990)
1atm Sattelmayer et al(1990)Leonard & Stegmaier (1993)(1-30 atm)DACRS Premixer (5-30 atm)Joshi et al. (1994)High penetration Premixer(19 atm) Snyder et al (1994)Snyder Low PenetrationPremixer (19atm)Catalytica (1 atm) Dalla Betaet al (1994)JSR data
JSR data
JSR data
JSR data
JSR data
JSR data
JSR data
comb A Base 1 9.9 atmTin=646 K wa 1.19 kg/sA Base2 Pin=9.9atmTin=759K wa=1.19kg/sA BasePin1 Pin=8atmTin=643K wa=0.99kg/s A BaseTres11 Pin=9.9atmTin=645K wa=1.88kg/s
Figure 2.10 Experimental dependency of NOx emissions as a function of peak flame temperature inthe combustor
15Chapter 3
Development of 8-step global mechanism
3.1 Introduction
In modeling the turbulent combustion by CFD applications, traditionally various three-step or five-step mechanisms of methane oxidation have been used. In three-stepmechanisms, the first step is the reaction of methane oxidation to carbon monoxide andwater. The second step is the reaction of carbon monoxide oxidation to carbon dioxideand the third step is the carbon dioxide decomposition to carbon monoxide and oxygen.In five-step mechanisms, methane oxidizes to carbon monoxide and diatomic hydrogen.The water-gas shift reaction and the reaction for hydrogen oxidation are added.
There are several global mechanisms developed for methane-air combustion. Most ofthese global mechanisms are based on their agreement with the experimental data fromthe particular flame studies. As shown by Nicol (1995), most of the global reactionmechanisms cannot accurately predict CO and CH4 concentration over wide range ofconditions that can exist in the gas turbine combustors. Furthermore, these mechanismsinvolve only hydrocarbon chemistry and do not predict NO emissions.
In the development of the 5-step global mechanism, Nicol (1995) attempted to capture themechanisms of NO formation. The first three steps of his mechanism are the reactionsthat describe the methane oxidation. The two-steps NO formation take into the accountdifferent NO pathways in both flame and post-flame zones. In the flame zone, non-thermal NO is the concern. Non-thermal NO is formed via the prompt, NNH, nitrousoxide and Zeldovich mechanisms acted upon by super-equilibrium concentrations of freeradicals. These pathways are considered in their total in the first global reaction for NO.In the post-flame zone, thermal NO, that is Zeldovich NO formed in an equilibrium fieldof free radicals becomes important due to the long residence time and relatively hightemperatures. This is taken into account by the second global reaction for NO.
Nitrogen oxide formation in the flame is highly dependent on the concentration of thefree radicals, such as CH, OH, O-atom, H-atom. Since carbon monoxide concentration isindicative of free radicals, several of the global rates are based on the concentration ofCO.
The 5-step global mechanism of Nicol (1995) was developed by regression analysis ofCRM simulations of the combustor using full kinetic mechanisms: Miller and Bowman(1989) and GRI 2.11 (1995) for 1, 8, and 16 atm. In development, a set inlet temperaturewas used, and the fuel equivalence ration was varied from 0.45 to 0.68. The fuel-equivalence ratio range does not allow using the mechanism for cases with pilotedcombustion. The fixed pressure mechanisms do not allow the prediction of combustionfields and NO emissions in the intermediate pressure ranges.
16
The present work considers broader ranges of the fuel-air equivalence ratios and thepressure. The fuel-air equivalence ratio is varied from 0.45 to 0.8 so that modeling thecase with piloted combustion is possible. The pressure variation is from 5 to 20 atm. Theanalysis is based on the GRI 3.0 full kinetic mechanism (1997) that has been shown tomodel lean-premixed high-intensity combustion process accurately, i.e., see Rutar et al.(2001)
3.2 Methodology
The full chemical kinetic mechanism GRI 3.0 has 53 species, most of them are freeradicals, and 325 elementary reactions. The mechanism was specifically developed andoptimized for methane-air combustion. This number of species and equations is too largeto be incorporated in the modeling of the combustion process that is associated withturbulent modeling. The purpose of this work is to minimize the number of reactions to 5-8 and the number of species to about 7 so that the mechanism can be used conveniently inCDF application.
The rates of the reactions are represented in global form; i.e. for the reaction
A+B→C+D
The expression for the reaction rate of formation of species C and D is
Ri= d[C]/dt = d[D]/dt = -d[A]/dt = -d[B]/dt =10n× [A] a× [B] b× [C]c×[D]d×exp(-Ta/T),
where:[A], [B], [C], [D] = species concentrations, kmol/m3
Ta = activation temperature of the reaction, K.
To obtain the global rate, the regression analysis can be performed for the databaseobtained by CRM simulations of the combustion reactors. The database for the matrix ofoperating conditions is gathered using the full kinetic mechanism GRI 3.0. The goal ofthe analysis is to find coefficients “n”, “a”, “b”, “c”, and Ta. To perform the regressionanalysis, the database should have the information about pressure, temperature, speciesconcentration and the reaction rate; e.g. the net rate of production of species “C”.
The exponential term in the rate expression presents the most difficulty. To simplify theproblem, the natural logarithm of the rate expression is taken, then
ln(Ri)=n×ln(10)+a×ln([A])+b×ln([B])+c×ln([C])-Ta×(1/T)
17Now, one can apply the linear least square fit to the equation above to determine theunknown coefficients. The species concentrations, reaction rate, temperature, andpressure are obtained from the database.
Another important part of this project is to make the reaction rates pressure sensitive. Toaccount for pressure, various adjustments have been investigated. There are:
1. Inserting pressure explicitly into the rate expression:
Ri=10nPm[A]a[B]bexp(-Ta/T)
2. Modeling pressure implicitly using surrogate species such as N2:
Ri=10n[N2]m[A]a[B]bexp(-Ta/T)
3. Determining pressure sensitivity for each species and for the activation temperature inthe rate expression:
Ri=10n0+n1×P[A]a0+a1×P[B]b0+b1×Pexp(-(Ta+Ta1×P)/T)
The later approach appears to be more accurate and has the lowest residuals in the leastsquare fit.
3.3 Development of Three-Step Pressure-Sensitive Global Mechanism for HydrocarbonOxidation
The following reactions are chosen for representing the hydrocarbon oxidation:
CH4+1.5×O2→ CO+2×H2O
CO+0.5×O2→CO2
CO2 →CO+0.5×O2
3.3.1 Reaction 1
Determining the reactor arrangement for CMR
Adiabatic PSR
The flame front is a region of large free radical concentrations and rapid oxidation of thefuel. In order to simulate the large free radical concentrations in this region, the PSRmodel is assumed. In the PSR model, mixing is infinitely fast and the gradients do notexist, except at the inlet of PSR. Practical flames are not mixed sufficient to approach thiscondition. Nonetheless, the free radical concentrations in the reaction zone of the
18practical flame are reasonably well simulated by assuming a PSR of appropriately shortresidence time. Furthermore, this is the region where CO and free radicals reach theirpeak concentrations, and thus, where the free radicals have the greatest influence on thereaction chemistry. Thus, the PSR model is used to simulate the flame front
Short PSR followed by PFR
At very lean conditions (Φ<0.5) and for the relatively low operating pressure of 5 atm,not all of the methane is burned in the single PSR with a residence time of twomilliseconds or less. These conditions can be met near the flame front as the domecooling or liner-cooling air is entering into the flame. In this case the unburned methaneenters the post-flame zone where it is quickly consumed. A PSR-PFR arrangement isused to model this situation. A PFR is used to simulate the post-flame zone. Theresidence time in the PSR is short (0.5 ms), and the residence time in the PFR is based onthe concentration of methane. The PFR is long enough to reduce the CH4 concentration tothe point where heat release from the reaction 1 can be neglected, i.e., CH4 mole fraction~10-6. Since the temperature in the adiabatic flame near the recirculation zone is high andthe methane concentration in this case is low, the methane oxidation in the recirculationzone is not considered. Thus, PSR-PSR reactor arrangement is not used in the Reaction 1database.
PSR at assigned temperature.
The main reason for incorporating this reactor is to lower the activation temperature ofthe reaction. It has been observed that if the activation temperature of the reaction is highthe CFD code has difficulty of “igniting” the mixture. Broadening the range of operatingtemperatures reduces the temperature dependency in the reaction rate, which reduces theactivation temperature.
Determining the reaction rate expressions.
As mentioned above the rate expressions are developed in global forms and exponentcoefficients can be obtained via a linear least square fit. The reaction rate of methaneoxidation, CH4+1.5×O2 → CO+2×H2O, is highly dependent on the concentration of freeradicals. The simplified way to show the pathway of methane oxidation is:
CH4+OH→CH3+H2O
CH3+O→CH2O+H
CH2O+OH→HCO+H2O
HCO+O→CO+OH
19Accordingly the elementary rates for these reactions may be expressed as:
Ri=10n×[A]×[B]×exp(-Ta/T)
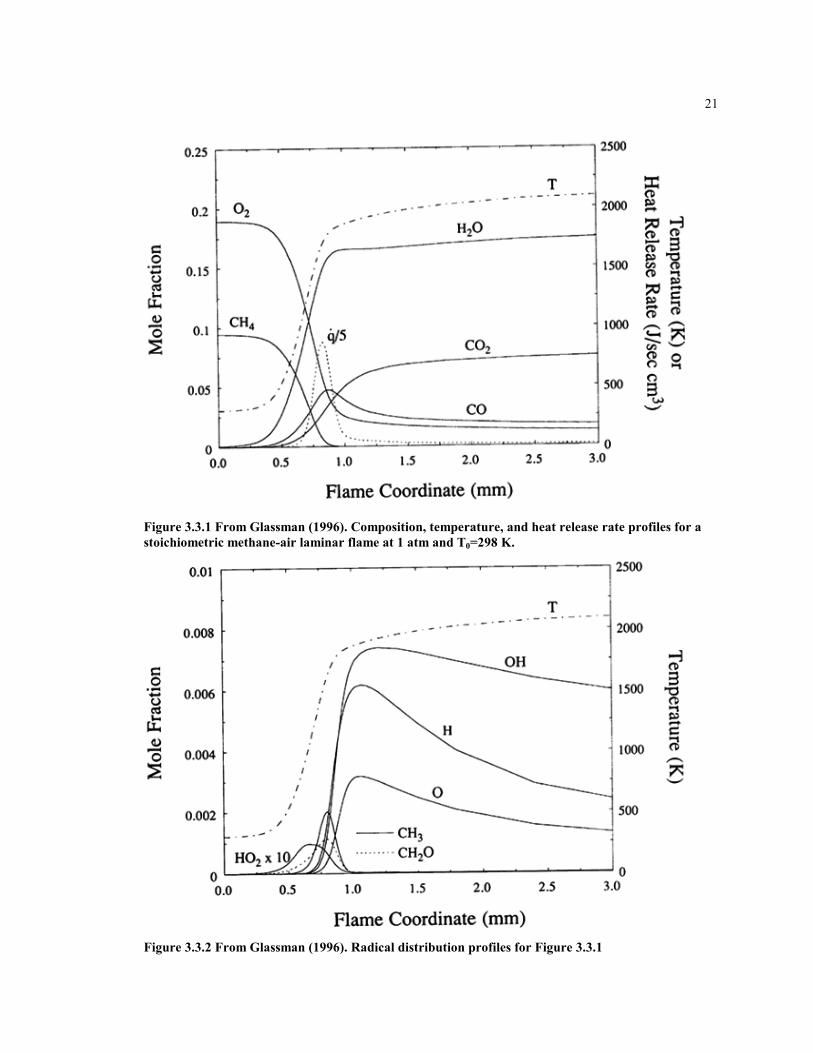
Since many of the species involved are radicals the rate of the Reaction 1 should dependon the concentration of free radicals. The only species that is available in global modelingis CO, which is made in the flame and destroyed, in later combustion. See figures 3.3.1and 3.3.2 from Glassman (1996). From the figures it is seen that CO rises and falls in theflame and post –flame zone similar to the behavior of the H-atom and OH radical. Theabove suggests that including the carbon monoxide in the rate expression for Reaction 1can be beneficial. Besides the CO, the other species to consider for the first rate aremethane and diatomic oxygen, since they both appear on the reactant side of the reaction.
The database for fitting the methane oxidation reaction consists of the CRM results usingthe reactor arrangement described above. GRI 3.0 also predicts some production ofmethane in the flame due to the recombination of free radicals. In some cases the rate ofCH4 production is about 10% of total rate. To account for this, a net rate of methanedestruction is used:
Net Rate of CH4 Destruction = Rate of CH4 Destruction – Rate of CH4 Production
As mentioned above, the activation temperature in the rate expression is a concern, sinceseveral investigators have reported that if the activation energy is too high the CFDsimulation may not ignite. Non-adiabatic (i.e., assigned temperature) PSR is added to thedatabase to increase the operating temperature range. This seams to lessen the reactionsensitivity to temperature and to lower the activation temperature of the reaction. Thefollowing global reaction rate expression gives the best agreement to the CRM databaseobtained with full kinetics of GRI 3.0.
-d[CH4]/dt=1013.354-0.004628×P[CH4]1.3-0.01148×P [O2]0.01426 [CO]0.1987exp (-(21932+269.4×P)/T)
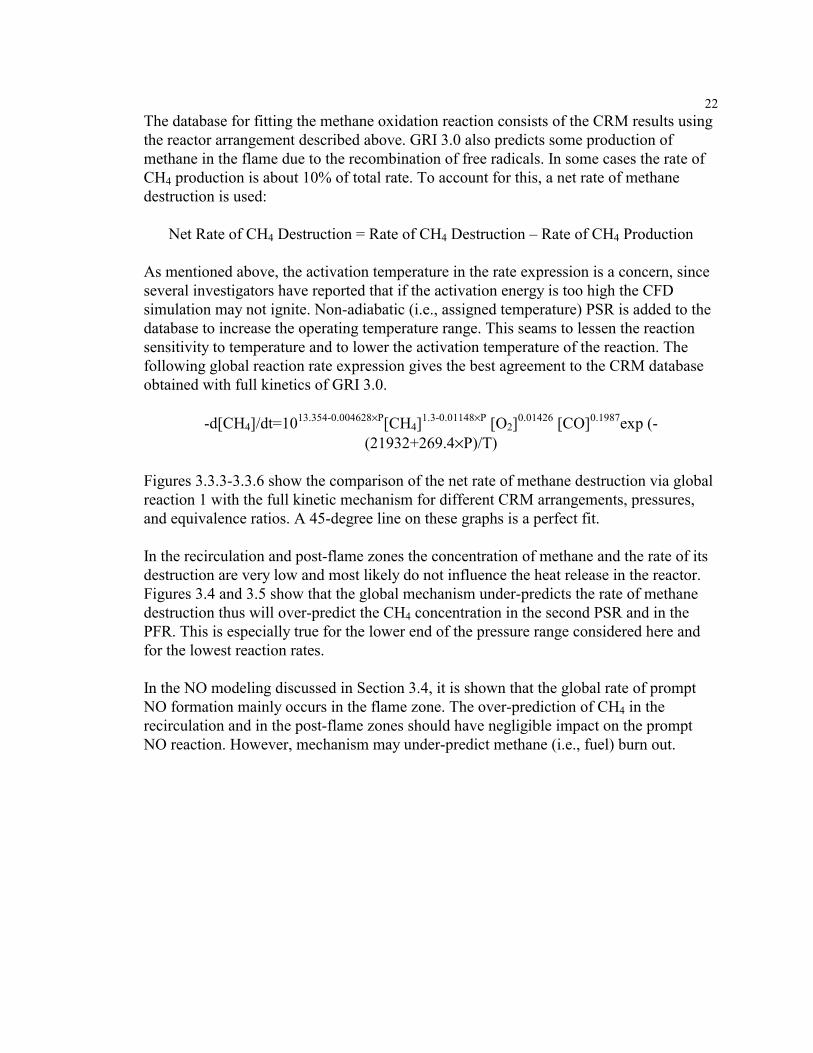
Figures 3.3.3-3.3.6 show the comparison of the net rate of methane destruction via globalreaction 1 with the full kinetic mechanism for different CRM arrangements, pressures,and equivalence ratios. A 45-degree line on these graphs is a perfect fit.
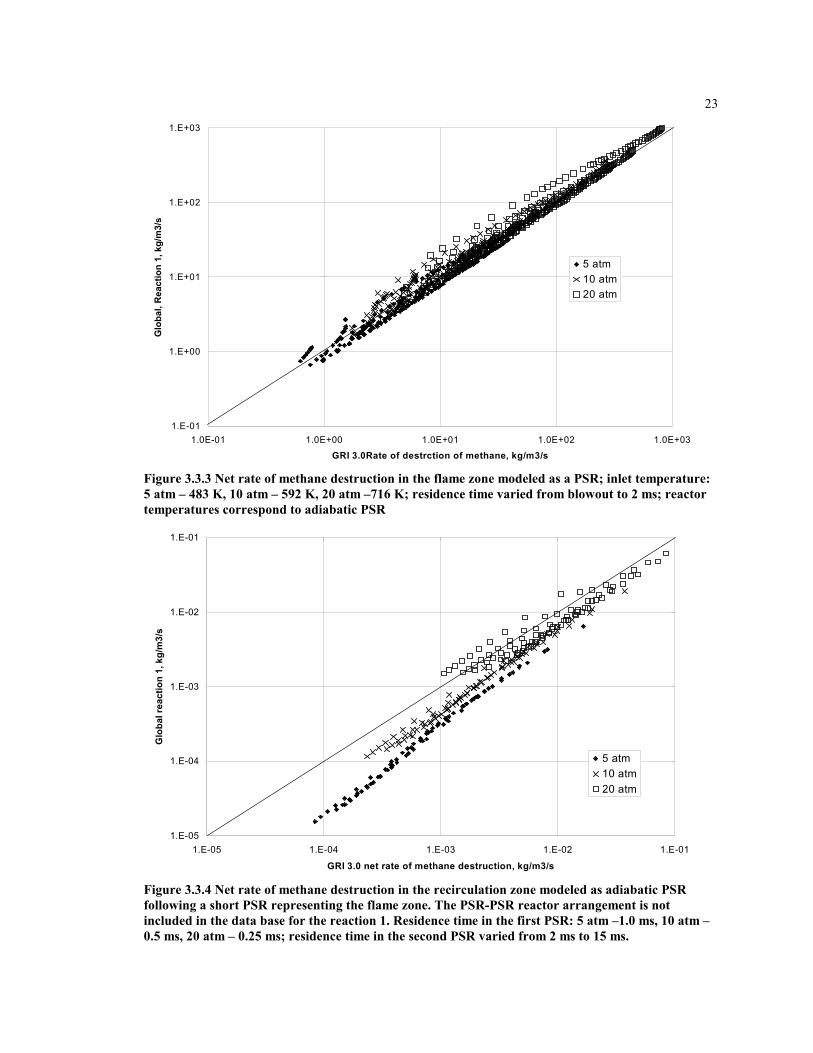
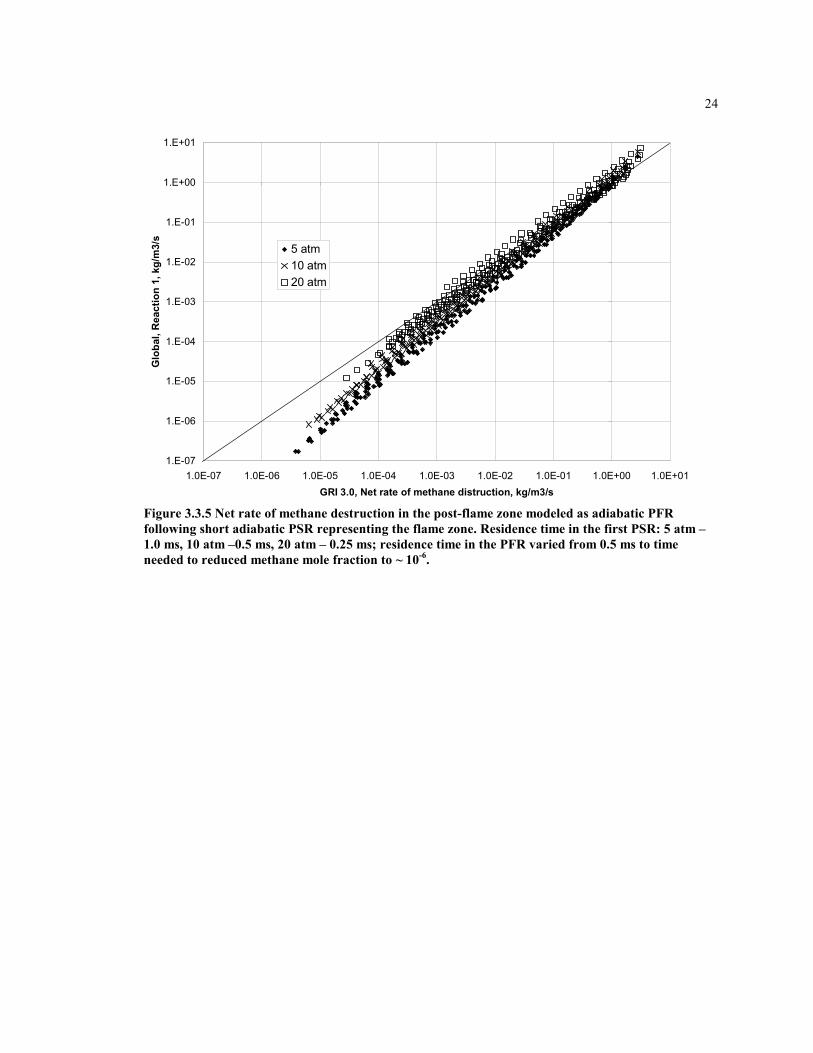
In the recirculation and post-flame zones the concentration of methane and the rate of itsdestruction are very low and most likely do not influence the heat release in the reactor.Figures 3.4 and 3.5 show that the global mechanism under-predicts the rate of methanedestruction thus will over-predict the CH4 concentration in the second PSR and in thePFR. This is especially true for the lower end of the pressure range considered here andfor the lowest reaction rates.

20In the NO modeling discussed in Section 3.4, it is shown that the global rate of promptNO formation mainly occurs in the flame zone. The over-prediction of CH4 in therecirculation and in the post-flame zones should have negligible impact on the promptNO reaction. However, mechanism may under-predict methane (i.e., fuel) burn out.
21
Figure 3.3.1 From Glassman (1996). Composition, temperature, and heat release rate profiles for astoichiometric methane-air laminar flame at 1 atm and T0=298 K.
Figure 3.3.2 From Glassman (1996). Radical distribution profiles for Figure 3.3.1
22The database for fitting the methane oxidation reaction consists of the CRM results usingthe reactor arrangement described above. GRI 3.0 also predicts some production ofmethane in the flame due to the recombination of free radicals. In some cases the rate ofCH4 production is about 10% of total rate. To account for this, a net rate of methanedestruction is used:
Net Rate of CH4 Destruction = Rate of CH4 Destruction – Rate of CH4 Production
As mentioned above, the activation temperature in the rate expression is a concern, sinceseveral investigators have reported that if the activation energy is too high the CFDsimulation may not ignite. Non-adiabatic (i.e., assigned temperature) PSR is added to thedatabase to increase the operating temperature range. This seams to lessen the reactionsensitivity to temperature and to lower the activation temperature of the reaction. Thefollowing global reaction rate expression gives the best agreement to the CRM databaseobtained with full kinetics of GRI 3.0.
-d[CH4]/dt=1013.354-0.004628×P[CH4]1.3-0.01148×P [O2]0.01426 [CO]0.1987exp (-(21932+269.4×P)/T)
Figures 3.3.3-3.3.6 show the comparison of the net rate of methane destruction via globalreaction 1 with the full kinetic mechanism for different CRM arrangements, pressures,and equivalence ratios. A 45-degree line on these graphs is a perfect fit.
In the recirculation and post-flame zones the concentration of methane and the rate of itsdestruction are very low and most likely do not influence the heat release in the reactor.Figures 3.4 and 3.5 show that the global mechanism under-predicts the rate of methanedestruction thus will over-predict the CH4 concentration in the second PSR and in thePFR. This is especially true for the lower end of the pressure range considered here andfor the lowest reaction rates.
In the NO modeling discussed in Section 3.4, it is shown that the global rate of promptNO formation mainly occurs in the flame zone. The over-prediction of CH4 in therecirculation and in the post-flame zones should have negligible impact on the promptNO reaction. However, mechanism may under-predict methane (i.e., fuel) burn out.
23
1.E-01
1.E+00
1.E+01
1.E+02
1.E+03
1.0E-01 1.0E+00 1.0E+01 1.0E+02 1.0E+03
GRI 3.0Rate of destrction of methane, kg/m3/s
Glo
bal,
Rea
ctio
n 1,
kg/
m3/
s
5 atm10 atm20 atm
Figure 3.3.3 Net rate of methane destruction in the flame zone modeled as a PSR; inlet temperature:5 atm – 483 K, 10 atm – 592 K, 20 atm –716 K; residence time varied from blowout to 2 ms; reactortemperatures correspond to adiabatic PSR
1.E-05
1.E-04
1.E-03
1.E-02
1.E-01
1.E-05 1.E-04 1.E-03 1.E-02 1.E-01
GRI 3.0 net rate of methane destruction, kg/m3/s
Glo
bal r
eact
ion
1, k
g/m
3/s
5 atm10 atm20 atm
Figure 3.3.4 Net rate of methane destruction in the recirculation zone modeled as adiabatic PSRfollowing a short PSR representing the flame zone. The PSR-PSR reactor arrangement is notincluded in the data base for the reaction 1. Residence time in the first PSR: 5 atm –1.0 ms, 10 atm –0.5 ms, 20 atm – 0.25 ms; residence time in the second PSR varied from 2 ms to 15 ms.
24
1.E-07
1.E-06
1.E-05
1.E-04
1.E-03
1.E-02
1.E-01
1.E+00
1.E+01
1.0E-07 1.0E-06 1.0E-05 1.0E-04 1.0E-03 1.0E-02 1.0E-01 1.0E+00 1.0E+01GRI 3.0, Net rate of methane distruction, kg/m3/s
Glo
bal,
Rea
ctio
n 1,
kg/
m3/
s
5 atm10 atm20 atm
Figure 3.3.5 Net rate of methane destruction in the post-flame zone modeled as adiabatic PFRfollowing short adiabatic PSR representing the flame zone. Residence time in the first PSR: 5 atm –1.0 ms, 10 atm –0.5 ms, 20 atm – 0.25 ms; residence time in the PFR varied from 0.5 ms to timeneeded to reduced methane mole fraction to ~ 10-6.
253.3.2 Reactions 2 and 3
The reactions of carbon monoxide oxidation and carbon dioxide decomposition can beviewed as a reverse of one another:
CO+0.5×O2 ↔ CO2
However the importance of each reaction varies in the different parts of the combustionprocess.
Determining the Reactor Arrangement for CMR
Reaction 2
Oxidation of carbon monoxide is slower than reaction 1; thus the lifetime of CO is longerthan CH4. This explains the presence of CO in the flame zone, the recirculation zone andthe post-flame zone. Since carbon monoxide is responsible for some of the heat release inthe combustion process, it is important to accurately predict carbon monoxideconcentration throughout the combustor.
Single PSR
Similar to the methane, carbon monoxide releases energy when it is oxidized. Destructionof carbon monoxide determines the flame temperature and the concentration of CO isindicative of the concentration of flame free radicals. Since the CO concentrations areobserved in the flame, the single PSR is an important regime to study. Based on the CFDsimulations of the Combustor A, the residence time in the PSR that represents the flamezone is up to 1.5 ms.
PSR followed by PFR
The post flame zone is where most of the carbon monoxide is converted to CO2. Thus, itis imperative to include the PSR-PFR arrangement in the database for the secondreaction. The residence time in the PSR varies with pressure and can be from 0.5 ms for20 atm to 1.5 ms for 1.5 atm. In the LP combustor, two post-flame conditions can befound:
1. When cooling air mixes with hot products of reaction. In this case, the combustionhappens with fuel-air equivalence ratios less than the premixer Φ.
2. In the case with piloted combustion and on the centerline of the burner, the post-flame zone does not have any cooling air added to the reactants. In this case, shorteradiabatic post-flame zone is used.
26The residence time for each type of post-flame zone are estimated from the CFDsimulations. To model the first condition, a PFR with additional air and residence timesup to 20 ms is used. In the second regime, an adiabatic PFR with a residence time up to 8ms is used.
Two PSRs in series
Since carbon monoxide leaves the flame zone unreacted, it is present in the recirculationzone of the reactor. The residence time in the first PSR in this case is similar to the PSR-PFR arrangement. Based on the results of the CFD compitation, the residence time in thesecond PSR is up to 15 ms.
Reaction 3
At long residence times, carbon dioxide and carbon monoxide come to equilibrium. In thepresent work, the rate of CO2 dissociation is fitted only as the combustion fieldapproaches equilibrium. Thus, a PSR_PFR arrangement is used. One should be awarethat in the flame zone, some of the carbon dioxide is converted back to the CO. For givenresidence times in the PSR, the maximum amount of CO2 decomposition is about 10%.Interestingly, about the same amount of carbon dioxide is made directly fromhydrocarbon material in the flame zone. Both of these flame-zone effects are neglected,however they are in the same order of magnitude and act in the opposite directions,therefore, they tend to offset each other.
Determining the rate expression
Reactions 2 and 3 describe the relation between the same species and can be viewed as areverse of one another. However, reaction 2 is most important in the flame zone wherethe heat release takes place and reaction 3 is not that important until the CO concentrationis rather small and CO2 is high. From the detailed kinetic analysis of the CO2 formation inthe flame zone, one notes that from 5 to 10 percent of CO2 made bypasses the CO and isformed directly from hydrocarbon radicals. The rate of formation of carbon dioxide is notexactly equal to the rate of destruction of carbon monoxide. The rate of CO destruction isused in this analysis. Thus reaction 2 under-predicts the rate of CO2 formation. Since thereaction 3 under-predicts the rate of CO2 dissociation in the flame zone, under-predictingthe rate of CO2 formation in reaction 2 should give the better agreement with the fullchemical kinetic mechanism in the flame zone.
The simplified pathway for oxidation of CO in the moist air can be described using thefollowing elementary reactions:
CO + OH → CO2 + H
H + O2 → OH + O
27
O + H2O → OH +OH
OH + H + M → H2O + M
This simplified mechanism is largely driven by the hydroxyl radical. One may try tomodel the behavior of the OH radical based on equilibrium chemistry.
H2O + 0.5×O2 ↔ 2×OH
Based on the above, the reactions 2 and 3 yield to the best agreement with the full kineticmechanism if the following expressions are used:
R2=1014.338+0.1091×P[CO]1.359-0.0109×P[H2O]0.0912+0.0909×P[O2]0.891+0.0127×Pexp(-(22398+75.1×P)/T)
R3=1015.8144-0.07163×P[CO2] × exp(-(64925.8-334.31×P)/T)
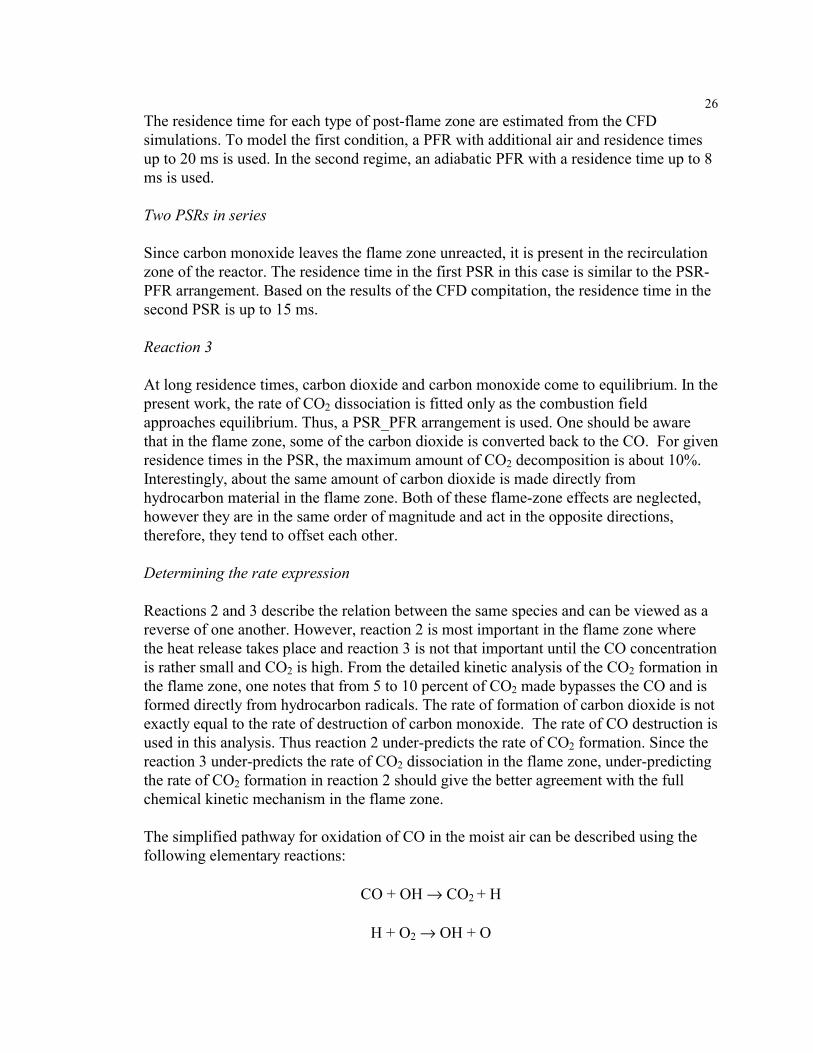
Figures 3.3.6-3.3.9 compare the global rates with the GRI 3.0 mechanism results fordifferent reactor arrangements, pressures, and equivalence ratios. Figures 3.3.10 and3.3.11 show the rates of CO and CO2 destruction in the PFR approaching equilibrium.
28
1.E-01
1.E+00
1.E+01
1.E+02
1.E+03
1.E-01 1.E+00 1.E+01 1.E+02 1.E+03GR3.0, destruction of CO, kg/m3/s
Glo
bal,
reac
tion
2, k
g/m
3/s
5 atm10 atm20 atm
Figure 3.3.6 Rate of carbon monoxide destruction in the PSR; inlet temperature: 5 atm – 483K, 10atm –592 K, 20 atm – 716 K, residence time varied from blowout to 2 ms; reactor temperaturecorresponds to adiabatic temperature in PSR.
1.0E-03
1.0E-02
1.0E-01
1.0E+00
1.0E+01
1.0E+02
1.0E-03 1.0E-02 1.0E-01 1.0E+00 1.0E+01 1.0E+02
GRI 3.0,destrudtion of CO kkg/m3/s
Glo
bal r
eact
ion
2kg/
m3/
s
5atm10atm20atm
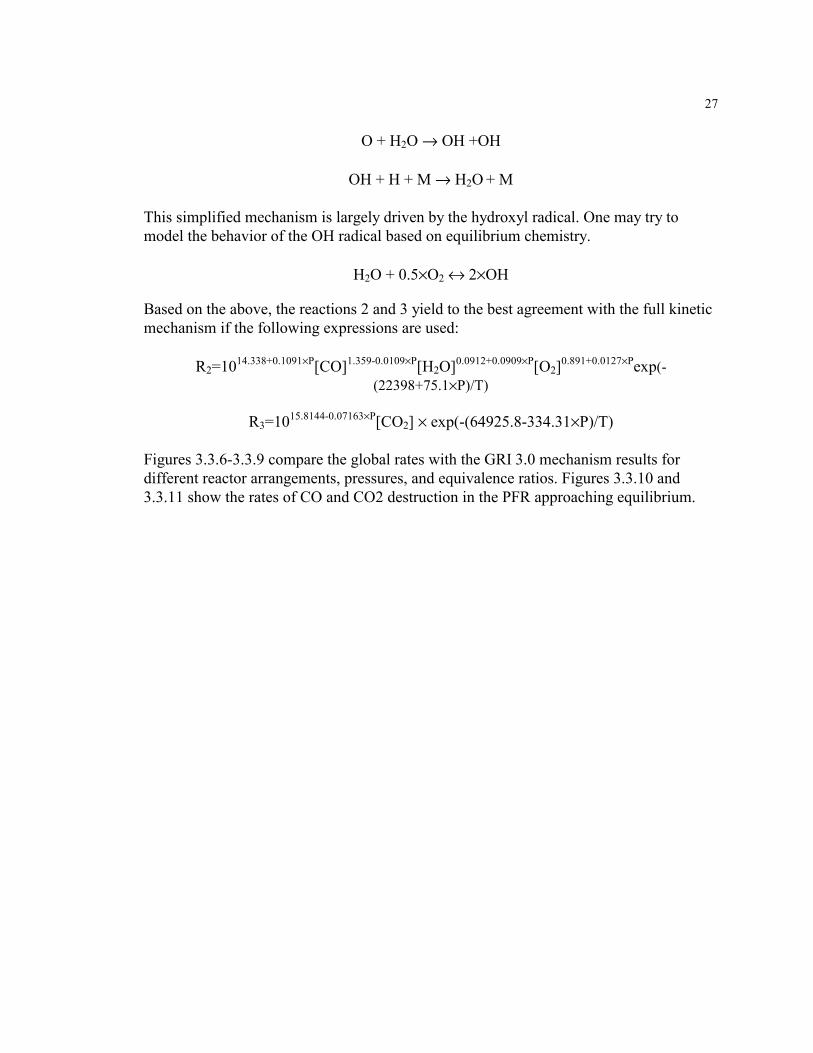
Figure 3.3.7 Rate of carbon monoxide destruction in the second PSR. Inlet temperature: 5 atm –483K, 10 atm –592 K, 20 atm – 716 K; first PSR residence time: 5 atm – 2 ms, 10 atm –1.0 ms, 20 atm– 0.5 ms; second PSR residence time varied from 2 to 15 ms; reactor temperature corresponds toadiabatic PSR.
29
1.E-06
1.E-05
1.E-04
1.E-03
1.E-02
1.E-01
1.E+00
1.E+01
1.E+02
1.E-06 1.E-05 1.E-04 1.E-03 1.E-02 1.E-01 1.E+00 1.E+01 1.E+02
GRI 3.0, destruction of CO, kg/m3/s
Glo
bal,
reac
tion
2, k
g/m
3/s
pfr no air added
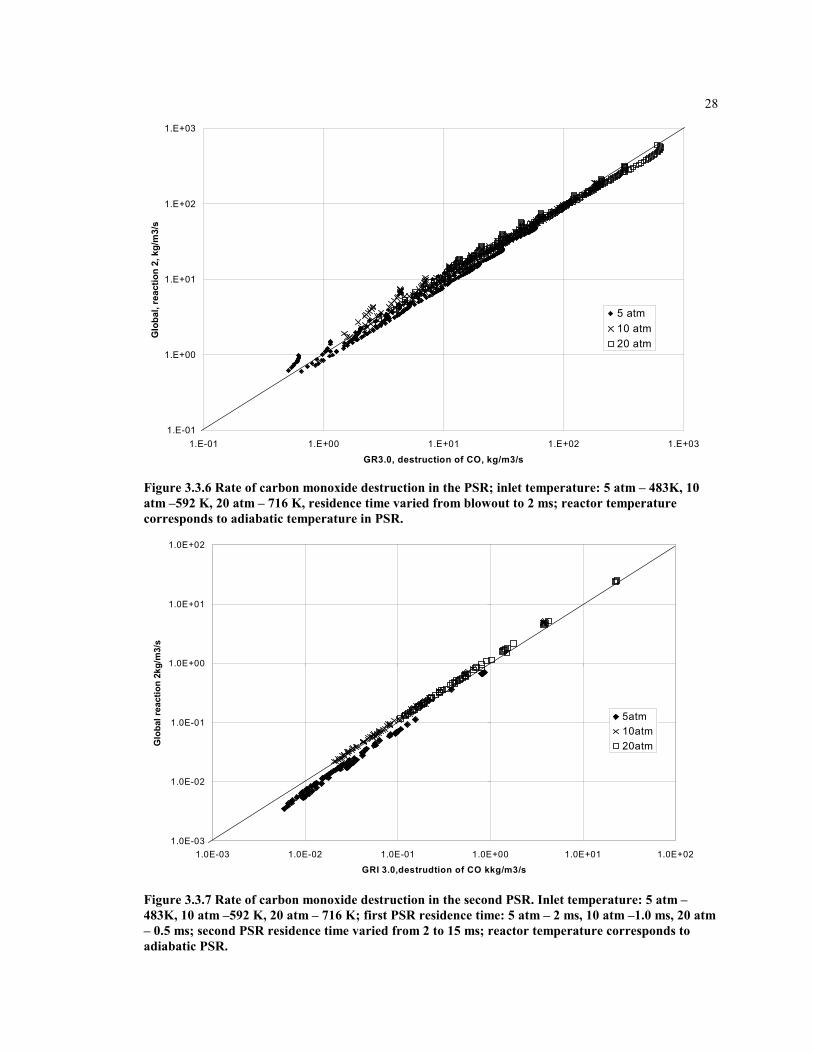
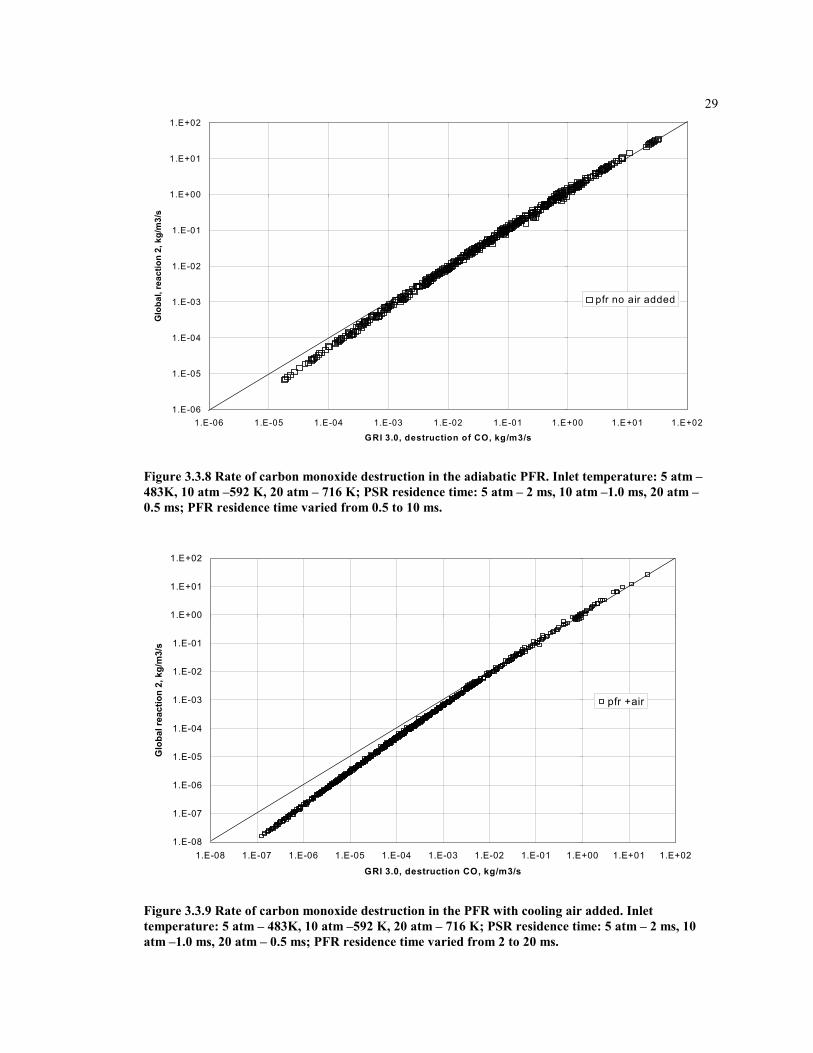
Figure 3.3.8 Rate of carbon monoxide destruction in the adiabatic PFR. Inlet temperature: 5 atm –483K, 10 atm –592 K, 20 atm – 716 K; PSR residence time: 5 atm – 2 ms, 10 atm –1.0 ms, 20 atm –0.5 ms; PFR residence time varied from 0.5 to 10 ms.
1.E-08
1.E-07
1.E-06
1.E-05
1.E-04
1.E-03
1.E-02
1.E-01
1.E+00
1.E+01
1.E+02
1.E-08 1.E-07 1.E-06 1.E-05 1.E-04 1.E-03 1.E-02 1.E-01 1.E+00 1.E+01 1.E+02
GRI 3.0, destruction CO, kg/m3/s
Glo
bal r
eact
ion
2, k
g/m
3/s
pfr +air
Figure 3.3.9 Rate of carbon monoxide destruction in the PFR with cooling air added. Inlettemperature: 5 atm – 483K, 10 atm –592 K, 20 atm – 716 K; PSR residence time: 5 atm – 2 ms, 10atm –1.0 ms, 20 atm – 0.5 ms; PFR residence time varied from 2 to 20 ms.
30
1.0E-05
1.0E-04
1.0E-03
1.0E-02
1.0E-01
1.0E+00
1.0E+01
0.0E+00 1.0E-03 2.0E-03 3.0E-03 4.0E-03 5.0E-03 6.0E-03 7.0E-03 8.0E-03 9.0E-03 1.0E-02
Resedence Time in the Adiabatic PFR, s
Glo
bal r
eact
ion
rate
, km
ol/m
3/s
5 atm R25 atm R3
Figure 3.3.10 rates of CO and CO2 destruction in the adiabatic PFR approaching equilibrium for 5atm. Inlet temperature 483 K; residence time in PRS varies from 0.75 ms to 2.5 ms (higher residencetime corresponds to the lower Φ).
1.0E-04
1.0E-03
1.0E-02
1.0E-01
1.0E+00
1.0E+01
0.0E+00 1.0E-03 2.0E-03 3.0E-03 4.0E-03 5.0E-03 6.0E-03 7.0E-03 8.0E-03 9.0E-03 1.0E-02
Resedence Time in the Adiabatic PFR, s
Glo
bal r
eact
ion
rate
, km
ol/m
3/s
10 atm R210 atm R3
Figure 3.3.11 rates of CO and CO2 destruction in the adiabatic PFR approaching equilibrium for 10atm. Inlet temperature 592 K; residence time in PRS varies from 0.75 ms to 2.5 ms (higher residencetime corresponds to the lower Φ).
31
3.4 Development of the global mechanism for the formation of nitrogen oxide
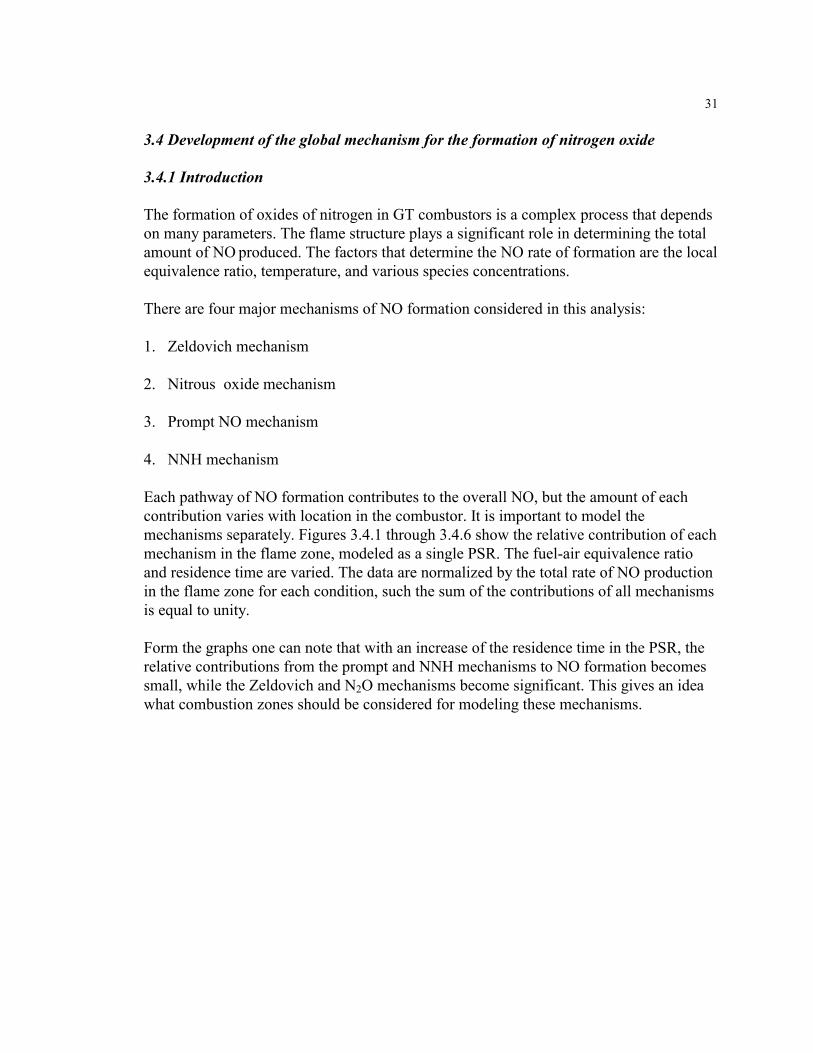
3.4.1 Introduction
The formation of oxides of nitrogen in GT combustors is a complex process that dependson many parameters. The flame structure plays a significant role in determining the totalamount of NO produced. The factors that determine the NO rate of formation are the localequivalence ratio, temperature, and various species concentrations.
There are four major mechanisms of NO formation considered in this analysis:
1. Zeldovich mechanism
2. Nitrous oxide mechanism
3. Prompt NO mechanism
4. NNH mechanism
Each pathway of NO formation contributes to the overall NO, but the amount of eachcontribution varies with location in the combustor. It is important to model themechanisms separately. Figures 3.4.1 through 3.4.6 show the relative contribution of eachmechanism in the flame zone, modeled as a single PSR. The fuel-air equivalence ratioand residence time are varied. The data are normalized by the total rate of NO productionin the flame zone for each condition, such the sum of the contributions of all mechanismsis equal to unity.
Form the graphs one can note that with an increase of the residence time in the PSR, therelative contributions from the prompt and NNH mechanisms to NO formation becomessmall, while the Zeldovich and N2O mechanisms become significant. This gives an ideawhat combustion zones should be considered for modeling these mechanisms.
32
0.E+00
1.E-01
2.E-01
3.E-01
4.E-01
5.E-01
6.E-01
7.E-01
8.E-01
9.E-01
1.E+00
0.0E+00 5.0E-04 1.0E-03 1.5E-03 2.0E-03 2.5E-03
Residence time in PSR, s
NO
(pat
h)/N
Oto
tal
prompt NO/NO total
NOnnh/NOtotal
Figure 3.4.1 Prompt and NNH pathways of NO formation in PSR at 5 atm. Inlet temperature 483 K;residence time in the PSR varied from blowout to 2.5 ms; temperature in the PSR corresponds to theadiabatic temperature for given residence time
0.E+00
1.E-01
2.E-01
3.E-01
4.E-01
5.E-01
6.E-01
7.E-01
8.E-01
9.E-01
1.E+00
0.0E+00 5.0E-04 1.0E-03 1.5E-03 2.0E-03 2.5E-03
Residence time in PSR, s
NO
(pat
h)/N
Oto
tal
NOn2o/NOtotal
NoZeld/NOtotal
Figure 3.4.2 N2O and Zeldovich pathways of NO formation in PSR at 5 atm. Inlet temperature 483K; residence time in the PSR varied from blowout to 2.5 ms; temperature in the PSR corresponds tothe adiabatic temperature for given residence time.
33
0.E+00
1.E-01
2.E-01
3.E-01
4.E-01
5.E-01
6.E-01
7.E-01
8.E-01
9.E-01
1.E+00
0.0E+00 2.0E-04 4.0E-04 6.0E-04 8.0E-04 1.0E-03 1.2E-03 1.4E-03 1.6E-03 1.8E-03 2.0E-03
Residence time in the PSR, s
NO
(pat
h)/N
Oto
tal
promptNO/NOtotalNOnnh/NOtotal
Figure 3.4.3 Prompt and NNH pathways of NO formation in PSR at 10 atm. Inlet temperature 592K; residence time in the PSR varied from blowout to 2 ms; temperature in the PSR corresponds tothe adiabatic temperature for given residence time.
0.E+00
1.E-01
2.E-01
3.E-01
4.E-01
5.E-01
6.E-01
7.E-01
8.E-01
9.E-01
1.E+00
0.0E+00 2.0E-04 4.0E-04 6.0E-04 8.0E-04 1.0E-03 1.2E-03 1.4E-03 1.6E-03 1.8E-03 2.0E-03
Residence time in the PSR, s
NO
(pat
h)/N
Oto
tal
NOn2o/NOtotalNOzeld/NOtotal
Figure 3.4.4 N2O and Zeldovich pathways of NO formation in PSR at 10 atm. Inlet temperature 592K; residence time in the PSR varied from blowout to 2 ms; temperature in the PSR corresponds tothe adiabatic temperature for given residence time.
34
0.0E+00
1.0E-01
2.0E-01
3.0E-01
4.0E-01
5.0E-01
6.0E-01
7.0E-01
8.0E-01
9.0E-01
1.0E+00
0.0E+00 2.0E-04 4.0E-04 6.0E-04 8.0E-04 1.0E-03 1.2E-03 1.4E-03 1.6E-03
residence time in the PSR, s
NO
(pat
h)/N
Oto
tal
prompt NO/NOtotalNOnnh/NOtotal
Figure 3.4.5 Prompt and NNH pathways of NO formation in PSR at 20 atm. Inlet temperature 716K; residence time in the PSR varied from blowout to 1.5 ms; temperature in the PSR corresponds tothe adiabatic temperature for given residence time.
0.0E+00
1.0E-01
2.0E-01
3.0E-01
4.0E-01
5.0E-01
6.0E-01
7.0E-01
8.0E-01
9.0E-01
1.0E+00
0.0E+00 2.0E-04 4.0E-04 6.0E-04 8.0E-04 1.0E-03 1.2E-03 1.4E-03 1.6E-03
residence time in the PSR, s
NO
(pat
h)/N
Oto
tal
NOn2o/NOtotalNOzeld/NOtotal
Figure 3.4.6 N2O and Zeldovich pathways of NO formation in PSR at 20 atm. Inlet temperature 716K; residence time in the PSR varied from blowout to 1.5 ms; temperature in the PSR corresponds tothe adiabatic temperature for given residence time.
353.4.2 Zeldovich Mechanism
At the high temperatures in the flame, O-atoms from the H2-O2 system can start theZeldovich chain reaction by attacking diatomic nitrogen. This reaction is enhanced in theflame zone due to the super-equilibrium concentrations of O-atom:
1. O+N2→NO+N
2. N+O2→NO+O
Often the third reaction is added to the to the mechanism:
3. N+OH→NO+H
In lean-premixed combustion, the concentration of NO is small thus the backward ratescan be neglected. Then the rate of formation of NO can be written as
dNO/dt = kf1[N2][O] + kf2[N][O2] + kf3[N][OH],
where the rate constants of the reactions are:
kf1 = 2 × 10¹⁴exp(-315/RuT)
kf2=6.4 × 10⁹exp(-26/RuT)
kf3 = 3.8×10¹³
The activation energy has the units of kJ/gmol.
Since reactions 2 and 3 rapidly destroy N-atom, one can make a steady-state assumptionfor the N-atom.
d[N]/dt = 0 = kf1[N2][O] - kf2[N][O2] - kf3[N][OH]
[N] = kf1[N2][O] / (kf2[O2] + kf3[OH])and
dNO/dt = 2 × kf1[N2][O]
In the post-flame zone it may be valid to assume that O-atom is equilibrium with O2.
0.5×O2 ↔ O
The equilibrium constant for this expression is:
Kp = exp(-(gO-0.5×gO2)/(RuT))
36Then, with the assumption of O-atom equilibrium the rate of formation of Zeldovich NOcan be written as:
dNO/dt (thermal Zeldovich) = 1014.967[N2][O2] 0.5 × T-0.5exp(-68899/T)
This expression is called the thermal Zeldovich NO formation rate. It is a R8 in the eight-step global mechanism.
3.4.3 Nitrous oxide mechanism of NO formation
In the nitrous oxide mechanism, NO is formed via the intermediate species N2O that isproduced in the flame by the following reaction:
O + N2 + M ↔ N2O + M
Bowman (1992) states that this reaction is important in fuel-lean combustion at lowtemperatures and high pressures. Both conditions are observed in LP combustors for gasturbines. For the combustion process where temperature is greater than 1500K, theaverage lifetime of N2O is calculated to be less than 10 ms. This suggests that N2O shouldnot be significantly found in the combustor exhaust.
The major steps of the N2O mechanism are:
N2O + H → N2 + OH
N2O + O → N2 + O2
N2O + O → NO + NO
N2O + H ↔ NH + NO
O + H2 + M ↔ H2O + M
Two of these reactions form NO. Detailed chemical kinetic modeling using GRI 3.0predicts that at some conditions the N2O mechanism can contribute up to 80% of totalamount of nitrogen oxide produced. Figures 3.4.2, 3.4.4, and 3.4.6 show that the relativeamount of NO produced by both Zeldovich and nitrous oxide mechanisms increases withthe residence time of the mixture in the PSR.
Global modeling of the nitrous oxide mechanism of formation in the combustor presentssome difficulties. While one global reaction rate for the nitrous oxide and Zeldovichmechanism in the flame zone works fine, with representation of the super-equilibriumconcentration of O and H atoms by CO, the same rate fails to predict NO formation in thepost-flame and recirculation zones. The problem is that CO goes to equilibrium faster
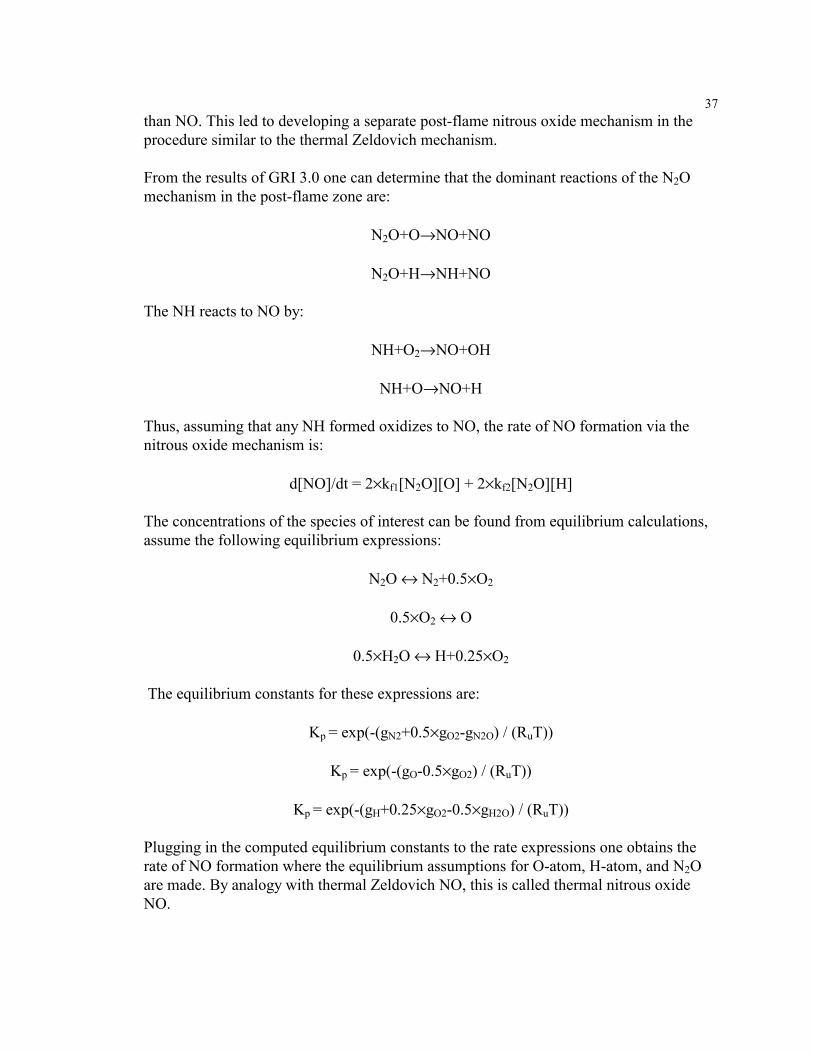
37than NO. This led to developing a separate post-flame nitrous oxide mechanism in theprocedure similar to the thermal Zeldovich mechanism.
From the results of GRI 3.0 one can determine that the dominant reactions of the N2Omechanism in the post-flame zone are:
N2O+O→NO+NO
N2O+H→NH+NO
The NH reacts to NO by:
NH+O2→NO+OH
NH+O→NO+H
Thus, assuming that any NH formed oxidizes to NO, the rate of NO formation via thenitrous oxide mechanism is:
d[NO]/dt = 2×kf1[N2O][O] + 2×kf2[N2O][H]
The concentrations of the species of interest can be found from equilibrium calculations,assume the following equilibrium expressions:
N2O ↔ N2+0.5×O2
0.5×O2 ↔ O
0.5×H2O ↔ H+0.25×O2
The equilibrium constants for these expressions are:
Kp = exp(-(gN2+0.5×gO2-gN2O) / (RuT))
Kp = exp(-(gO-0.5×gO2) / (RuT))
Kp = exp(-(gH+0.25×gO2-0.5×gH2O) / (RuT))
Plugging in the computed equilibrium constants to the rate expressions one obtains therate of NO formation where the equilibrium assumptions for O-atom, H-atom, and N2Oare made. By analogy with thermal Zeldovich NO, this is called thermal nitrous oxideNO.
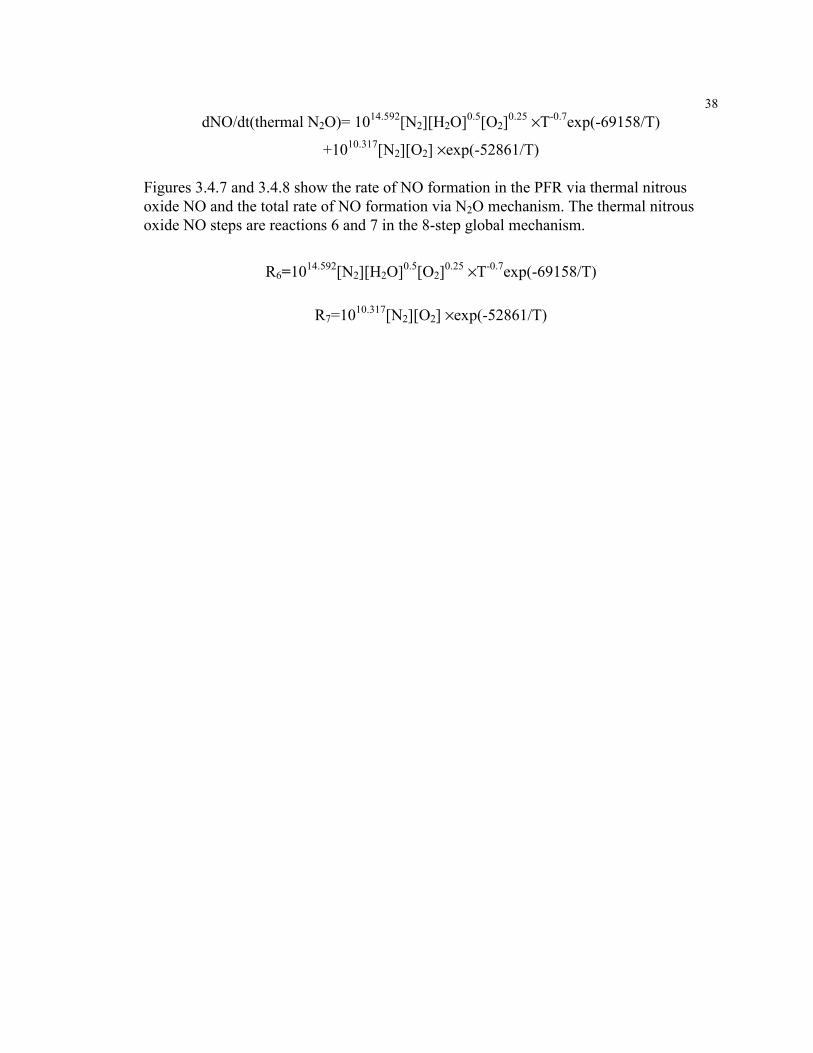
38dNO/dt(thermal N2O)= 1014.592[N2][H2O]0.5[O2]0.25 ×T-0.7exp(-69158/T)
+1010.317[N2][O2] ×exp(-52861/T)
Figures 3.4.7 and 3.4.8 show the rate of NO formation in the PFR via thermal nitrousoxide NO and the total rate of NO formation via N2O mechanism. The thermal nitrousoxide NO steps are reactions 6 and 7 in the 8-step global mechanism.
R6=1014.592[N2][H2O]0.5[O2]0.25 ×T-0.7exp(-69158/T)
R7=1010.317[N2][O2] ×exp(-52861/T)
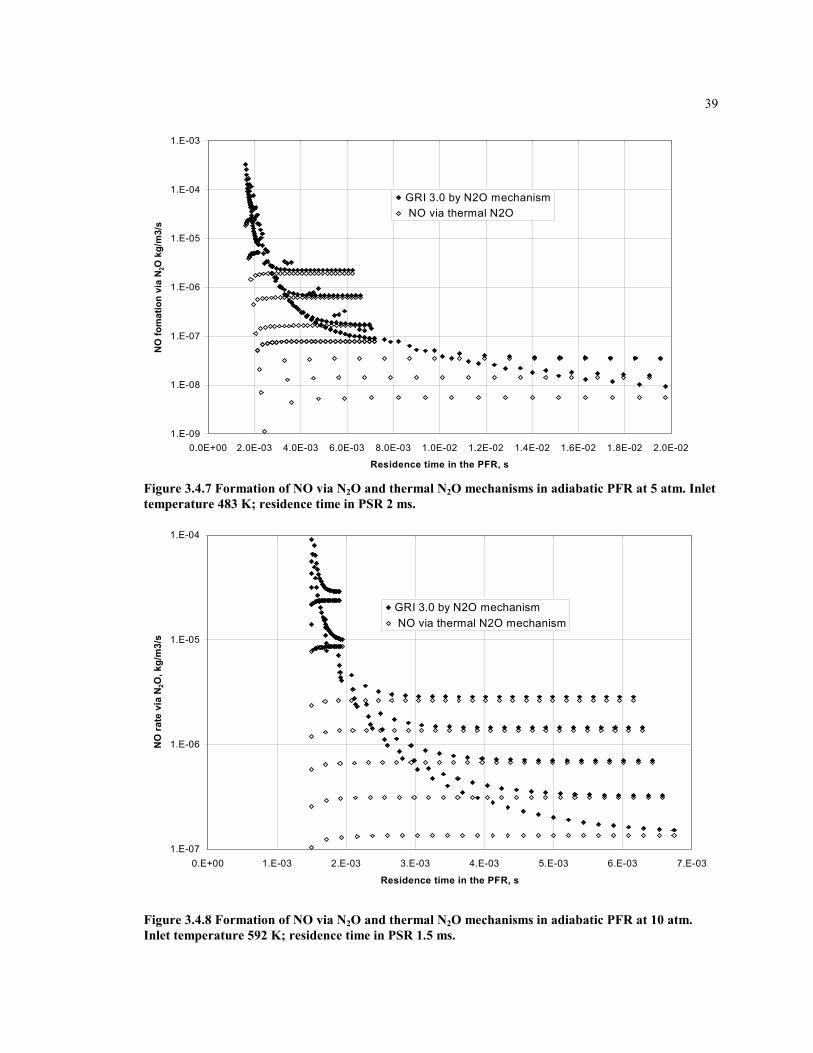
39
1.E-09
1.E-08
1.E-07
1.E-06
1.E-05
1.E-04
1.E-03
0.0E+00 2.0E-03 4.0E-03 6.0E-03 8.0E-03 1.0E-02 1.2E-02 1.4E-02 1.6E-02 1.8E-02 2.0E-02
Residence time in the PFR, s
NO
fom
atio
n vi
a N 2
O k
g/m
3/s
GRI 3.0 by N2O mechanism NO via thermal N2O
Figure 3.4.7 Formation of NO via N2O and thermal N2O mechanisms in adiabatic PFR at 5 atm. Inlettemperature 483 K; residence time in PSR 2 ms.
1.E-07
1.E-06
1.E-05
1.E-04
0.E+00 1.E-03 2.E-03 3.E-03 4.E-03 5.E-03 6.E-03 7.E-03
Residence time in the PFR, s
NO
rate
via
N2O
, kg/
m3/
s
GRI 3.0 by N2O mechanism NO via thermal N2O mechanism
Figure 3.4.8 Formation of NO via N2O and thermal N2O mechanisms in adiabatic PFR at 10 atm.Inlet temperature 592 K; residence time in PSR 1.5 ms.
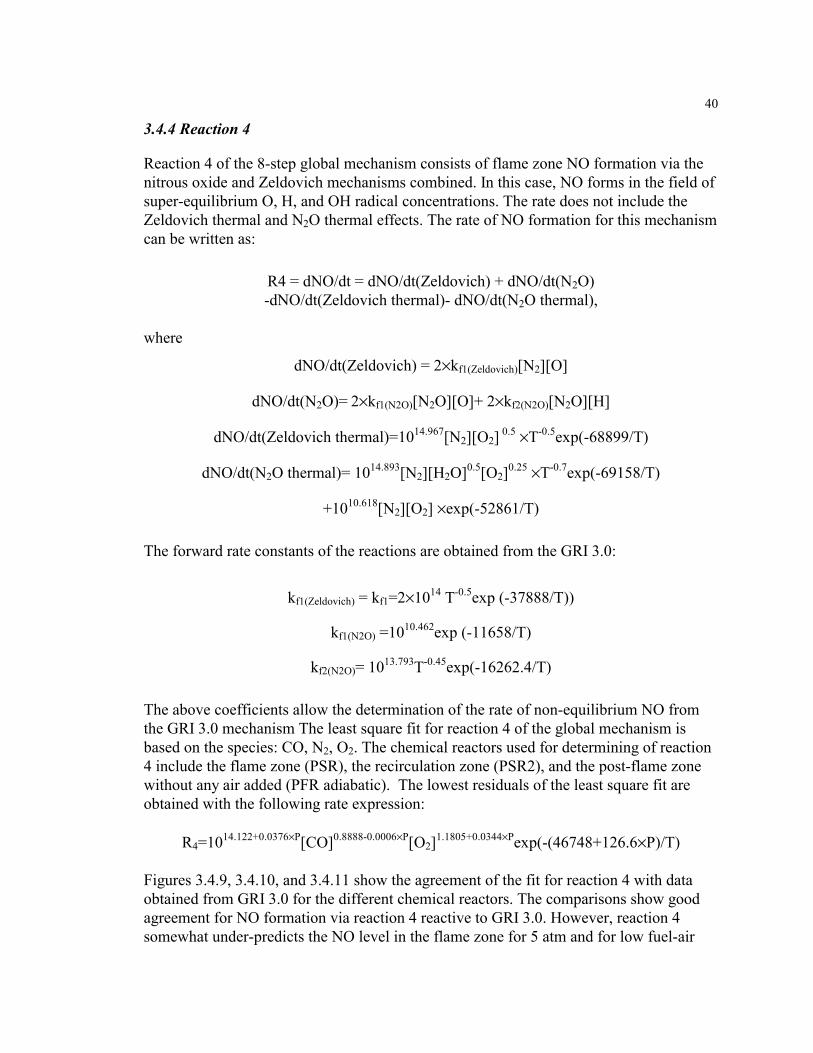
40
3.4.4 Reaction 4
Reaction 4 of the 8-step global mechanism consists of flame zone NO formation via thenitrous oxide and Zeldovich mechanisms combined. In this case, NO forms in the field ofsuper-equilibrium O, H, and OH radical concentrations. The rate does not include theZeldovich thermal and N2O thermal effects. The rate of NO formation for this mechanismcan be written as:
R4 = dNO/dt = dNO/dt(Zeldovich) + dNO/dt(N2O)-dNO/dt(Zeldovich thermal)- dNO/dt(N2O thermal),
where
dNO/dt(Zeldovich) = 2×kf1(Zeldovich)[N2][O]
dNO/dt(N2O)= 2×kf1(N2O)[N2O][O]+ 2×kf2(N2O)[N2O][H]
dNO/dt(Zeldovich thermal)=1014.967[N2][O2] 0.5 ×T-0.5exp(-68899/T)
dNO/dt(N2O thermal)= 1014.893[N2][H2O]0.5[O2]0.25 ×T-0.7exp(-69158/T)
+1010.618[N2][O2] ×exp(-52861/T)
The forward rate constants of the reactions are obtained from the GRI 3.0:
kf1(Zeldovich) = kf1=2×10¹⁴ T-0.5exp (-37888/T))
kf1(N2O) =1010.462exp (-11658/T)
kf2(N2O)= 1013.793T-0.45exp(-16262.4/T)
The above coefficients allow the determination of the rate of non-equilibrium NO fromthe GRI 3.0 mechanism The least square fit for reaction 4 of the global mechanism isbased on the species: CO, N2, O2. The chemical reactors used for determining of reaction4 include the flame zone (PSR), the recirculation zone (PSR2), and the post-flame zonewithout any air added (PFR adiabatic). The lowest residuals of the least square fit areobtained with the following rate expression:
R4=1014.122+0.0376×P[CO]0.8888-0.0006×P[O2]1.1805+0.0344×Pexp(-(46748+126.6×P)/T)
Figures 3.4.9, 3.4.10, and 3.4.11 show the agreement of the fit for reaction 4 with dataobtained from GRI 3.0 for the different chemical reactors. The comparisons show goodagreement for NO formation via reaction 4 reactive to GRI 3.0. However, reaction 4somewhat under-predicts the NO level in the flame zone for 5 atm and for low fuel-air

41equivalence ratios (0.45-0.55). Also the reaction 4 somewhat over-predicts the NOproduction in the recirculation zone.
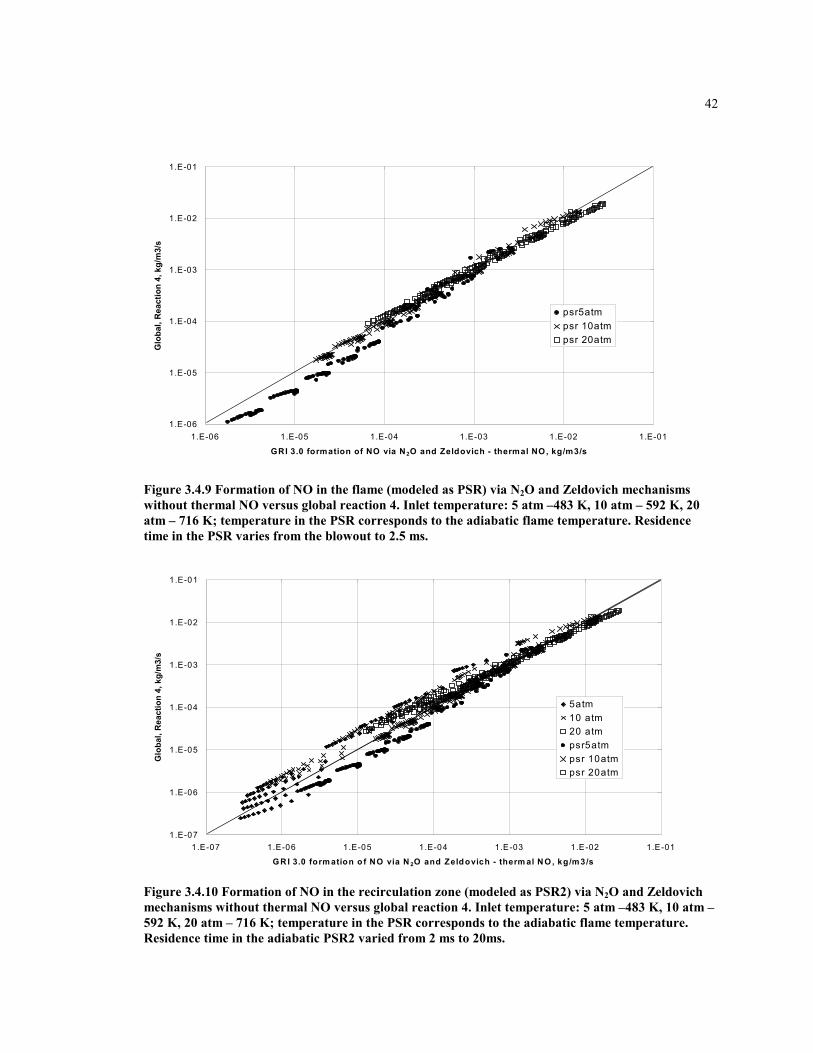
42
1.E-06
1.E-05
1.E-04
1.E-03
1.E-02
1.E-01
1.E-06 1.E-05 1.E-04 1.E-03 1.E-02 1.E-01
GRI 3.0 formation of NO via N2O and Zeldovich - thermal NO, kg/m3/s
Glo
bal,
Rea
ctio
n 4,
kg/
m3/
s
psr5atmpsr 10atmpsr 20atm
Figure 3.4.9 Formation of NO in the flame (modeled as PSR) via N2O and Zeldovich mechanismswithout thermal NO versus global reaction 4. Inlet temperature: 5 atm –483 K, 10 atm – 592 K, 20atm – 716 K; temperature in the PSR corresponds to the adiabatic flame temperature. Residencetime in the PSR varies from the blowout to 2.5 ms.
1.E-07
1.E-06
1.E-05
1.E-04
1.E-03
1.E-02
1.E-01
1.E-07 1.E-06 1.E-05 1.E-04 1.E-03 1.E-02 1.E-01
G R I 3.0 form ation o f NO via N 2O and Zeldovich - therm al N O , kg/m 3/s
Glo
bal,
Rea
ctio
n 4,
kg/
m3/
s
5atm10 atm20 atmpsr5atmpsr 10atmpsr 20atm
Figure 3.4.10 Formation of NO in the recirculation zone (modeled as PSR2) via N2O and Zeldovichmechanisms without thermal NO versus global reaction 4. Inlet temperature: 5 atm –483 K, 10 atm –592 K, 20 atm – 716 K; temperature in the PSR corresponds to the adiabatic flame temperature.Residence time in the adiabatic PSR2 varied from 2 ms to 20ms.
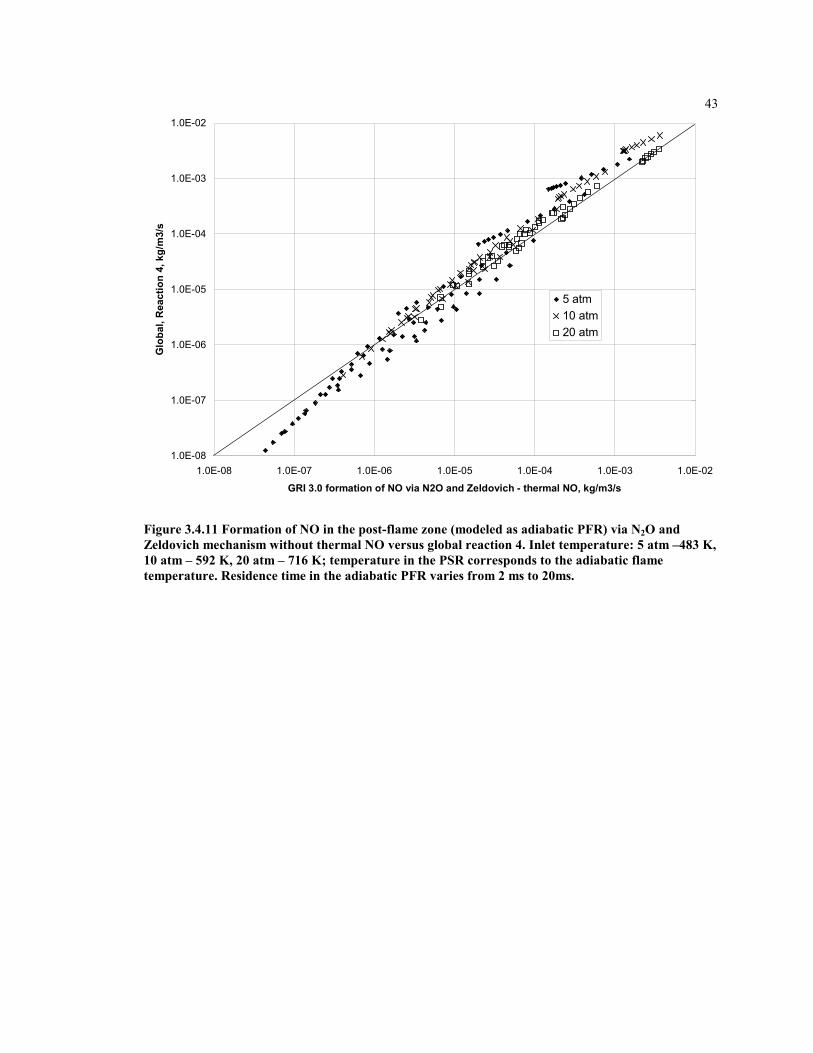
43
1.0E-08
1.0E-07
1.0E-06
1.0E-05
1.0E-04
1.0E-03
1.0E-02
1.0E-08 1.0E-07 1.0E-06 1.0E-05 1.0E-04 1.0E-03 1.0E-02
GRI 3.0 formation of NO via N2O and Zeldovich - thermal NO, kg/m3/s
Glo
bal,
Rea
ctio
n 4,
kg/
m3/
s
5 atm10 atm20 atm
Figure 3.4.11 Formation of NO in the post-flame zone (modeled as adiabatic PFR) via N2O andZeldovich mechanism without thermal NO versus global reaction 4. Inlet temperature: 5 atm –483 K,10 atm – 592 K, 20 atm – 716 K; temperature in the PSR corresponds to the adiabatic flametemperature. Residence time in the adiabatic PFR varies from 2 ms to 20ms.
3.4.5 NNH mechanism of NO formation
Bozzelli and Dean (1995) proposed a mechanism of NO formation in flames via thereaction
NNH+O → NH+NO
Under the lean premixed condition in the GT combustor, NH is oxidized to nitrogenoxide as follows:
NH+O2 → NO+OH
NH+O → NO+H
Harrington et al. (1996) tested the NNH mechanism in a low-pressure flame to minimizethe amount of NO made by other known mechanisms. In their research, though theagreement was imperfect, the NNH mechanism provided the explanation for NOformation at the tested conditions. Therefore, one needs to include this pathway in thecombustion model.
3.4.6 Prompt NO
A number of investigators have tried to capture the mechanism on NO formation in theflame zone. The concentration of free radicals in the flame zone is several magnitudesgreater than in the post-flame. Fenimore (1971) showed that in the flame zone amechanism other than Zeldovich contributes to NO formation. He called the mechanism“prompt NO”. This pathway of NO formation is not found in non-hydrocarbon flames.Fenimore concluded that NO is formed by the reaction of hydrocarbon radicals anddiatomic nitrogen. He suggested that the following reactions could form NO in thehydrocarbon flame.
CH+N2 → HCN+N
C2+N2 → 2×CN
All three products of these reactions tend to form NO when attacked by other freeradicals. The second reaction should not be a strong contributor in methane aircombustion since, C2 species is unlikely to significantly appear in the methane breakdown. On the other hand, CH is known to be present in the methane-air flame.
The N-atom, when colliding with diatomic oxygen follows the Zeldovich pathway:
N+OH → NO+H
N+O2 → NO+O
Nitrogen oxide can be formed from HCN via the following reactions:
HCN+O → NCO+H
NCO+H → NH+CO
NH+(H, OH) → N+(H2, H2O)
N+OH → NO+H
N+O2 → NO+O
NH+O2 → NO+OH
NH+O → NO+H
Detailed analysis of the pathways of NO formation in the typical LP combustor showsthat prompt NO can contribute up to 80% of total nitrogen oxide formed in the flamezone. The biggest contribution from the prompt mechanism comes at lower pressure (5atm) and higher fuel-air equivalence ratio (Φ greater than 0.7). Figures 3.3, 3.4, and 3.5show the normalized rates of NO formation versus residence times in the perfectly stirredreactor.
In the modeling of the Fenimore mechanism, only reaction CH+N2→HCN+N isconsidered with the assumption that all of the products of the reaction eventually end upas NO. Since the global mechanism does not explicitly include any hydrocarbon radicals,a surrogate species must be found to represent the CH radical. The only species that ispresent in the flame zone, similar to the hydrocarbon radicals and available for modeling,is CH4.
Before the prompt reaction occurs, the concentration of methane is high, but there are noradicals present. The concentration of hydrocarbon radicals is rising in the flame zonevery rapidly similar to carbon monoxide. Attempts to insert CO into the global reactionfor prompt NO were not successful, however, probably due to the longevity of carbonmonoxide in the flame.
The rate of formation of nitrogen oxide via the prompt pathway can be simplified to thefollowing expression
dNO/dt = kf × [CH][N2]exp(-Ea / (RuT))
The values for kf and Ea are obtained from GRI 3.0. The concentrations of CH and N2;and temperature are specific to a particular case.
3.4.7 Reaction 5
Figures 3.4.1, 3.4.3, and 3.4.5 show the normalized rate of NO formation by the NNHmechanism for different operating pressures of the combustor. It is decaying rapidly withthe amount of time that the mixture spends in the flame. From the global point of view,the rate exhibits very similar behavior to the prompt mechanism, thus in modeling of theglobal reaction mechanism we combine the NNH and prompt mechanisms together.
The database for the least square fit for the NNH and the prompt NO mechanisms isobtained using a single PSR. The reactor is adiabatic for most cases, however some casesare assigned a temperature less than the adiabatic temperature. Since the promptmechanism is most important at the rich fuel-air equivalence ratios and low pressures,more weight is given to these conditions. The conditions where the prompt mechanismcontributes less than 5% of the total NO are not considered in this analysis, with apurpose of tuning the mechanism in the region of its greatest importance.
Performing the least square fit gives the following form:
R5=10n0+n1×P[CH4]a0+a1×P[O2]b0+b1×Pexp(-(Ta+Ta1×P)/T)
The diatomic nitrogen does not change its concentration sufficiently to influence thereaction rate, thus it is not explicitly included in the reaction. However the pre-exponential factor carries the pressure dependency in it, which is an implicit reference toN2. The least residuals for the reaction rate are given by the formula:
R5=1014.2466+0.10779×P[CH4]2.0886-0.03193×P[O2]-1.6674+0.04122×Pexp(-(48772.3+789.05×P)/T)
Figure 3.4.12 shows the agreement between the full kinetic mechanism and the globalrate of NO formation via the prompt and NNH pathways.
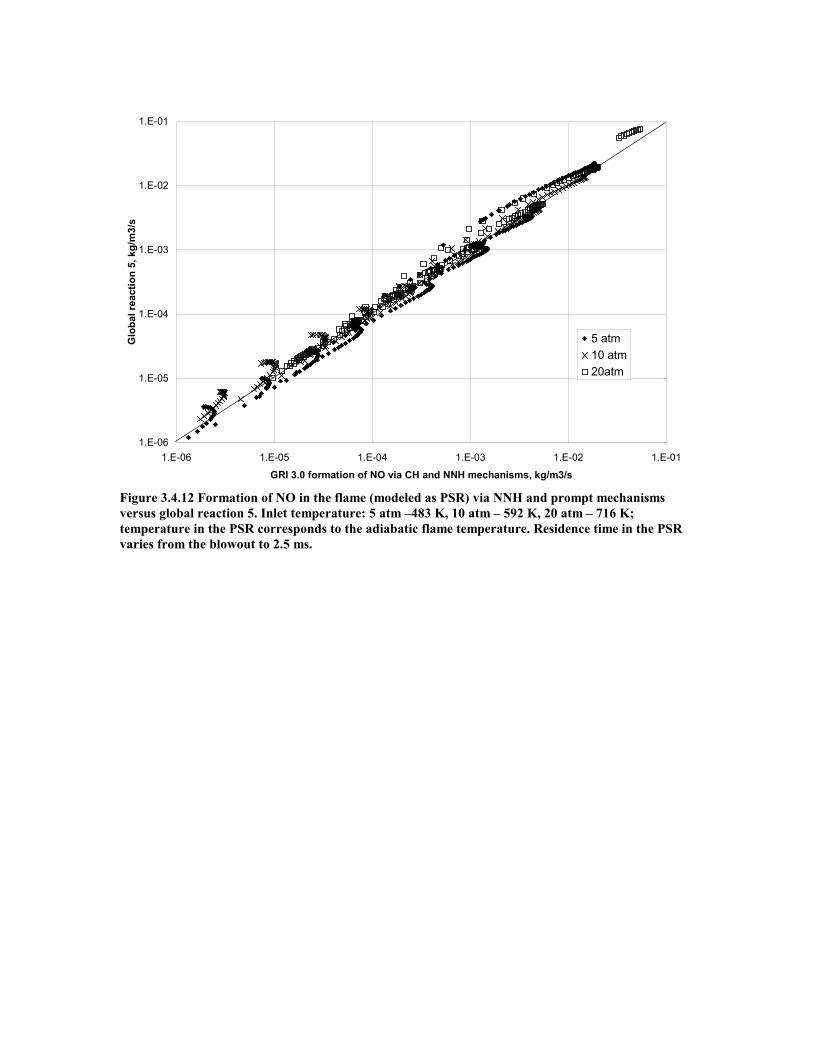
1.E-06
1.E-05
1.E-04
1.E-03
1.E-02
1.E-01
1.E-06 1.E-05 1.E-04 1.E-03 1.E-02 1.E-01
GRI 3.0 formation of NO via CH and NNH mechanisms, kg/m3/s
Glo
bal r
eact
ion
5, k
g/m
3/s
5 atm10 atm20atm
Figure 3.4.12 Formation of NO in the flame (modeled as PSR) via NNH and prompt mechanismsversus global reaction 5. Inlet temperature: 5 atm –483 K, 10 atm – 592 K, 20 atm – 716 K;temperature in the PSR corresponds to the adiabatic flame temperature. Residence time in the PSRvaries from the blowout to 2.5 ms.
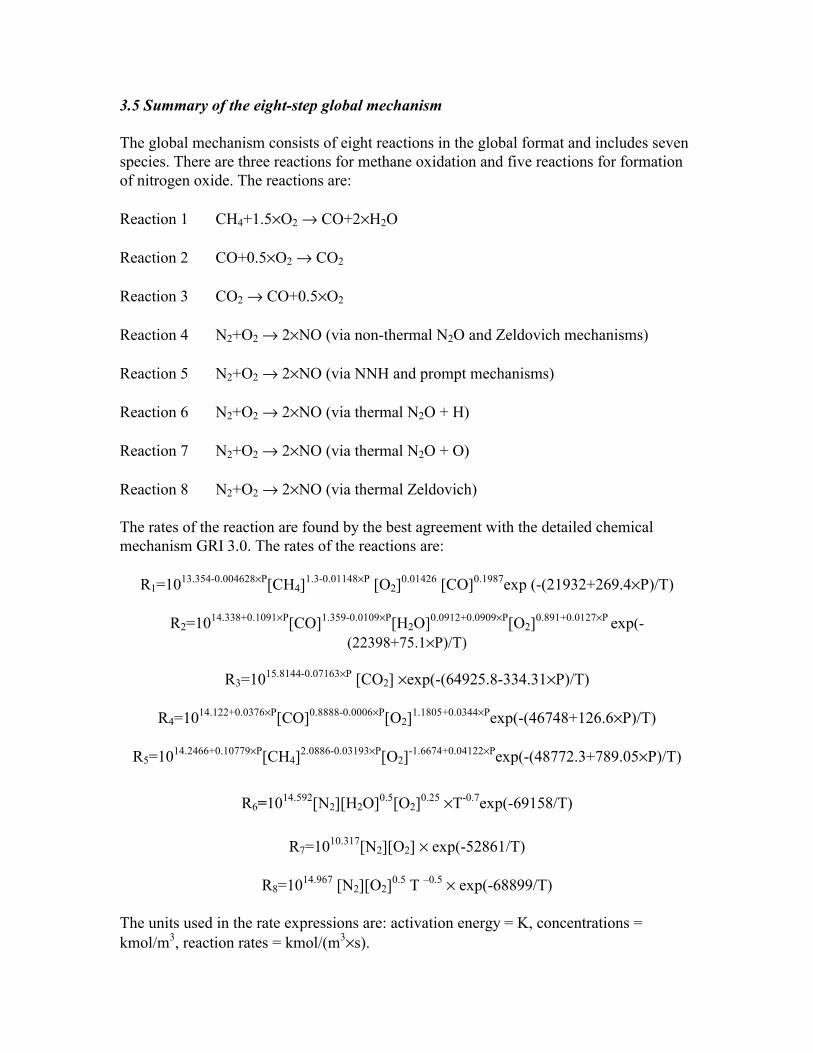
3.5 Summary of the eight-step global mechanism
The global mechanism consists of eight reactions in the global format and includes sevenspecies. There are three reactions for methane oxidation and five reactions for formationof nitrogen oxide. The reactions are:
Reaction 1 CH4+1.5×O2 → CO+2×H2O
Reaction 2 CO+0.5×O2 → CO2
Reaction 3 CO2 → CO+0.5×O2
Reaction 4 N2+O2 → 2×NO (via non-thermal N2O and Zeldovich mechanisms)
Reaction 5 N2+O2 → 2×NO (via NNH and prompt mechanisms)
Reaction 6 N2+O2 → 2×NO (via thermal N2O + H)
Reaction 7 N2+O2 → 2×NO (via thermal N2O + O)
Reaction 8 N2+O2 → 2×NO (via thermal Zeldovich)
The rates of the reaction are found by the best agreement with the detailed chemicalmechanism GRI 3.0. The rates of the reactions are:
R1=1013.354-0.004628×P[CH4]1.3-0.01148×P [O2]0.01426 [CO]0.1987exp (-(21932+269.4×P)/T)
R2=1014.338+0.1091×P[CO]1.359-0.0109×P[H2O]0.0912+0.0909×P[O2]0.891+0.0127×P exp(-(22398+75.1×P)/T)
R3=1015.8144-0.07163×P [CO2] ×exp(-(64925.8-334.31×P)/T)
R4=1014.122+0.0376×P[CO]0.8888-0.0006×P[O2]1.1805+0.0344×Pexp(-(46748+126.6×P)/T)
R5=1014.2466+0.10779×P[CH4]2.0886-0.03193×P[O2]-1.6674+0.04122×Pexp(-(48772.3+789.05×P)/T)
R6=1014.592[N2][H2O]0.5[O2]0.25 ×T-0.7exp(-69158/T)
R7=1010.317[N2][O2] × exp(-52861/T)
R8=1014.967 [N2][O2]0.5 T –0.5 × exp(-68899/T)
The units used in the rate expressions are: activation energy = K, concentrations =kmol/m3, reaction rates = kmol/(m3×s).

Figures 3.5.1 through 3.5.3 show the agreement of the 8 step global mechanism withdetailed chemical kinetic mechanism GRI 3.0 in terms of NO production for differentzones of the combustor.
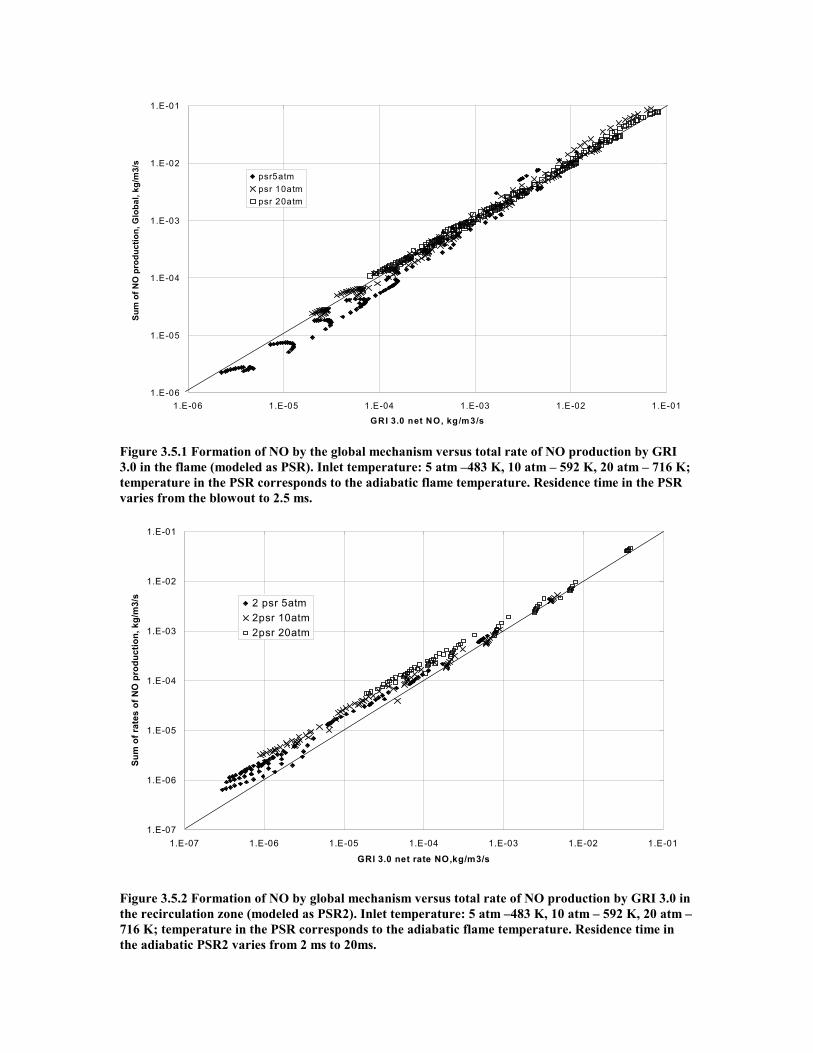
1.E-06
1.E-05
1.E-04
1.E-03
1.E-02
1.E-01
1.E-06 1.E-05 1.E-04 1.E-03 1.E-02 1.E-01
GRI 3.0 net NO, kg/m3/s
Sum
of N
O p
rodu
ctio
n, G
loba
l, kg
/m3/
s
psr5atmpsr 10atmpsr 20atm
Figure 3.5.1 Formation of NO by the global mechanism versus total rate of NO production by GRI3.0 in the flame (modeled as PSR). Inlet temperature: 5 atm –483 K, 10 atm – 592 K, 20 atm – 716 K;temperature in the PSR corresponds to the adiabatic flame temperature. Residence time in the PSRvaries from the blowout to 2.5 ms.
1.E-07
1.E-06
1.E-05
1.E-04
1.E-03
1.E-02
1.E-01
1.E-07 1.E-06 1.E-05 1.E-04 1.E-03 1.E-02 1.E-01
GRI 3.0 net rate NO,kg/m3/s
Sum
of r
ates
of N
O p
rodu
ctio
n, k
g/m
3/s
2 psr 5atm2psr 10atm2psr 20atm
Figure 3.5.2 Formation of NO by global mechanism versus total rate of NO production by GRI 3.0 inthe recirculation zone (modeled as PSR2). Inlet temperature: 5 atm –483 K, 10 atm – 592 K, 20 atm –716 K; temperature in the PSR corresponds to the adiabatic flame temperature. Residence time inthe adiabatic PSR2 varies from 2 ms to 20ms.
1.E-08
1.E-07
1.E-06
1.E-05
1.E-04
1.E-03
1.E-02
1.E-01
1.E-08 1.E-07 1.E-06 1.E-05 1.E-04 1.E-03 1.E-02 1.E-01
GRI 3.0 net NO rate, kg/m3/s
NO
form
atio
n ra
te, G
loba
l,kg/
m3/
s
5 atm10 atm20 atm
Figure 3.5.3 Formation of NO by global mechanism versus net rate of NO production by GRI 3.0 inthe post-flame zone (modeled as adiabatic PFR followed by a PSR). Inlet temperature: 5 atm –483 K,10 atm – 592 K, 20 atm – 716 K; temperature in the PSR corresponds to the adiabatic flametemperature. Residence time in the adiabatic PFR varies from 2 ms to 20ms.
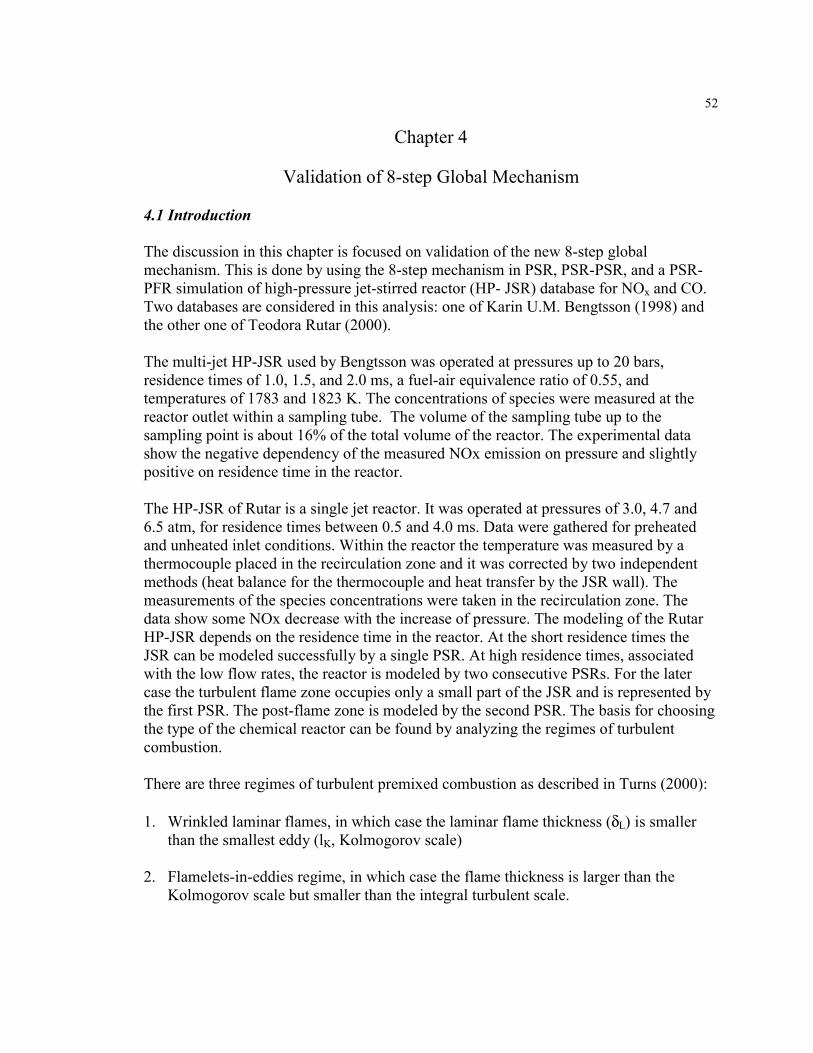
52
Chapter 4
Validation of 8-step Global Mechanism
4.1 Introduction
The discussion in this chapter is focused on validation of the new 8-step globalmechanism. This is done by using the 8-step mechanism in PSR, PSR-PSR, and a PSR-PFR simulation of high-pressure jet-stirred reactor (HP- JSR) database for NOx and CO.Two databases are considered in this analysis: one of Karin U.M. Bengtsson (1998) andthe other one of Teodora Rutar (2000).
The multi-jet HP-JSR used by Bengtsson was operated at pressures up to 20 bars,residence times of 1.0, 1.5, and 2.0 ms, a fuel-air equivalence ratio of 0.55, andtemperatures of 1783 and 1823 K. The concentrations of species were measured at thereactor outlet within a sampling tube. The volume of the sampling tube up to thesampling point is about 16% of the total volume of the reactor. The experimental datashow the negative dependency of the measured NOx emission on pressure and slightlypositive on residence time in the reactor.
The HP-JSR of Rutar is a single jet reactor. It was operated at pressures of 3.0, 4.7 and6.5 atm, for residence times between 0.5 and 4.0 ms. Data were gathered for preheatedand unheated inlet conditions. Within the reactor the temperature was measured by athermocouple placed in the recirculation zone and it was corrected by two independentmethods (heat balance for the thermocouple and heat transfer by the JSR wall). Themeasurements of the species concentrations were taken in the recirculation zone. Thedata show some NOx decrease with the increase of pressure. The modeling of the RutarHP-JSR depends on the residence time in the reactor. At the short residence times theJSR can be modeled successfully by a single PSR. At high residence times, associatedwith the low flow rates, the reactor is modeled by two consecutive PSRs. For the latercase the turbulent flame zone occupies only a small part of the JSR and is represented bythe first PSR. The post-flame zone is modeled by the second PSR. The basis for choosingthe type of the chemical reactor can be found by analyzing the regimes of turbulentcombustion.
There are three regimes of turbulent premixed combustion as described in Turns (2000):
1. Wrinkled laminar flames, in which case the laminar flame thickness (δL) is smallerthan the smallest eddy (lK, Kolmogorov scale)
2. Flamelets-in-eddies regime, in which case the flame thickness is larger than theKolmogorov scale but smaller than the integral turbulent scale.
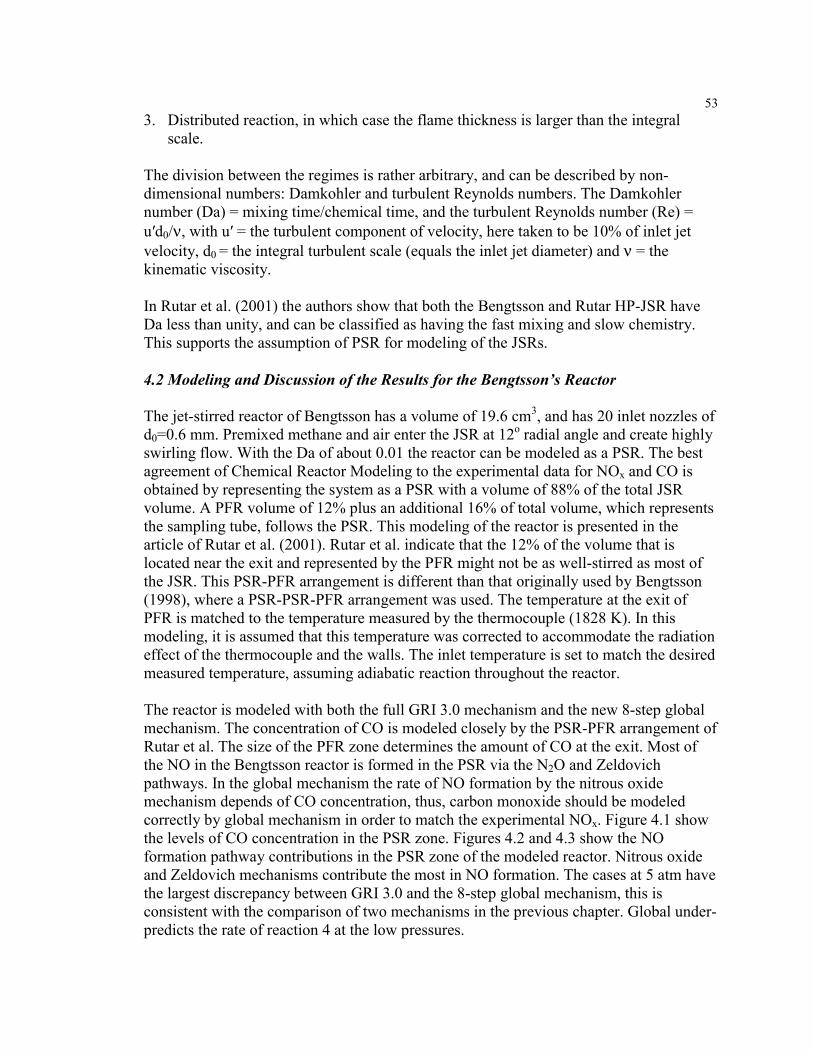
533. Distributed reaction, in which case the flame thickness is larger than the integral
scale.
The division between the regimes is rather arbitrary, and can be described by non-dimensional numbers: Damkohler and turbulent Reynolds numbers. The Damkohlernumber (Da) = mixing time/chemical time, and the turbulent Reynolds number (Re) =u′d0/ν, with u′ = the turbulent component of velocity, here taken to be 10% of inlet jetvelocity, d0 = the integral turbulent scale (equals the inlet jet diameter) and ν = thekinematic viscosity.
In Rutar et al. (2001) the authors show that both the Bengtsson and Rutar HP-JSR haveDa less than unity, and can be classified as having the fast mixing and slow chemistry.This supports the assumption of PSR for modeling of the JSRs.
4.2 Modeling and Discussion of the Results for the Bengtsson’s Reactor
The jet-stirred reactor of Bengtsson has a volume of 19.6 cm3, and has 20 inlet nozzles ofd0=0.6 mm. Premixed methane and air enter the JSR at 12o radial angle and create highlyswirling flow. With the Da of about 0.01 the reactor can be modeled as a PSR. The bestagreement of Chemical Reactor Modeling to the experimental data for NOx and CO isobtained by representing the system as a PSR with a volume of 88% of the total JSRvolume. A PFR volume of 12% plus an additional 16% of total volume, which representsthe sampling tube, follows the PSR. This modeling of the reactor is presented in thearticle of Rutar et al. (2001). Rutar et al. indicate that the 12% of the volume that islocated near the exit and represented by the PFR might not be as well-stirred as most ofthe JSR. This PSR-PFR arrangement is different than that originally used by Bengtsson(1998), where a PSR-PSR-PFR arrangement was used. The temperature at the exit ofPFR is matched to the temperature measured by the thermocouple (1828 K). In thismodeling, it is assumed that this temperature was corrected to accommodate the radiationeffect of the thermocouple and the walls. The inlet temperature is set to match the desiredmeasured temperature, assuming adiabatic reaction throughout the reactor.
The reactor is modeled with both the full GRI 3.0 mechanism and the new 8-step globalmechanism. The concentration of CO is modeled closely by the PSR-PFR arrangement ofRutar et al. The size of the PFR zone determines the amount of CO at the exit. Most ofthe NO in the Bengtsson reactor is formed in the PSR via the N2O and Zeldovichpathways. In the global mechanism the rate of NO formation by the nitrous oxidemechanism depends of CO concentration, thus, carbon monoxide should be modeledcorrectly by global mechanism in order to match the experimental NOx. Figure 4.1 showthe levels of CO concentration in the PSR zone. Figures 4.2 and 4.3 show the NOformation pathway contributions in the PSR zone of the modeled reactor. Nitrous oxideand Zeldovich mechanisms contribute the most in NO formation. The cases at 5 atm havethe largest discrepancy between GRI 3.0 and the 8-step global mechanism, this isconsistent with the comparison of two mechanisms in the previous chapter. Global under-predicts the rate of reaction 4 at the low pressures.
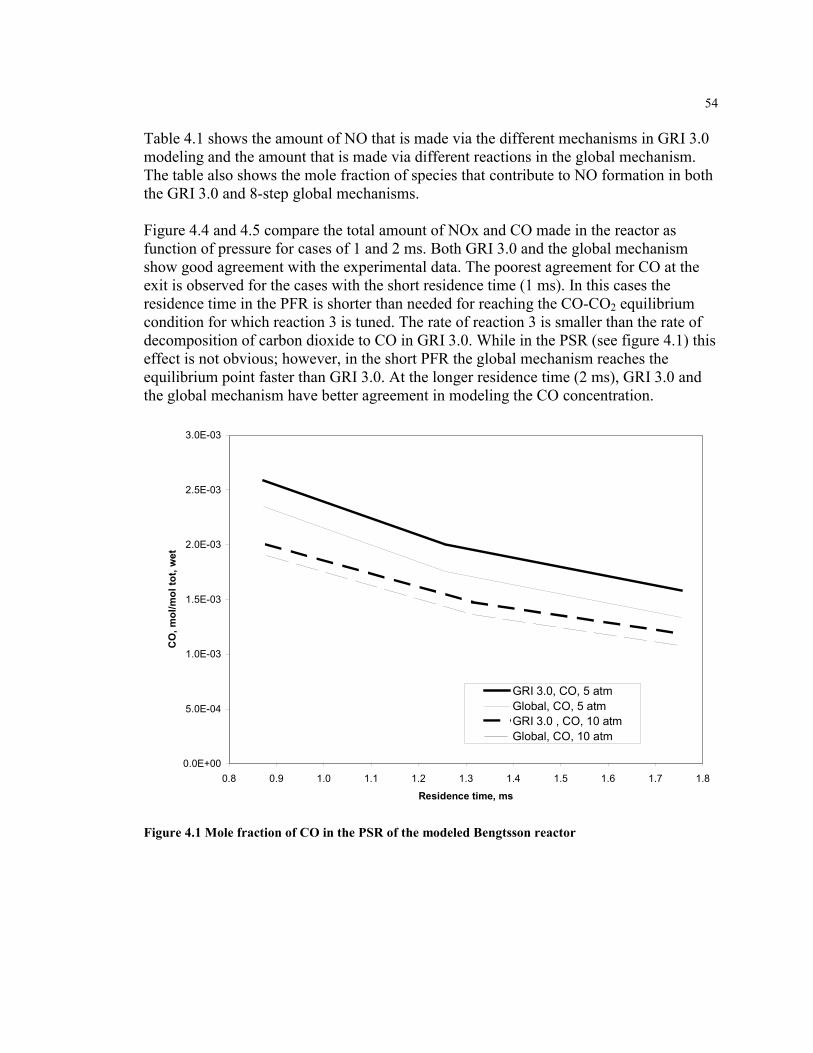
54
Table 4.1 shows the amount of NO that is made via the different mechanisms in GRI 3.0modeling and the amount that is made via different reactions in the global mechanism.The table also shows the mole fraction of species that contribute to NO formation in boththe GRI 3.0 and 8-step global mechanisms.
Figure 4.4 and 4.5 compare the total amount of NOx and CO made in the reactor asfunction of pressure for cases of 1 and 2 ms. Both GRI 3.0 and the global mechanismshow good agreement with the experimental data. The poorest agreement for CO at theexit is observed for the cases with the short residence time (1 ms). In this cases theresidence time in the PFR is shorter than needed for reaching the CO-CO2 equilibriumcondition for which reaction 3 is tuned. The rate of reaction 3 is smaller than the rate ofdecomposition of carbon dioxide to CO in GRI 3.0. While in the PSR (see figure 4.1) thiseffect is not obvious; however, in the short PFR the global mechanism reaches theequilibrium point faster than GRI 3.0. At the longer residence time (2 ms), GRI 3.0 andthe global mechanism have better agreement in modeling the CO concentration.
0.0E+00
5.0E-04
1.0E-03
1.5E-03
2.0E-03
2.5E-03
3.0E-03
0.8 0.9 1.0 1.1 1.2 1.3 1.4 1.5 1.6 1.7 1.8
Residence time, ms
CO
, mol
/mol
tot,
wet
GRI 3.0, CO, 5 atm Global, CO, 5 atm GRI 3.0 , CO, 10 atmGlobal, CO, 10 atm
Figure 4.1 Mole fraction of CO in the PSR of the modeled Bengtsson reactor
55
0.E+00
1.E-06
2.E-06
3.E-06
4.E-06
5.E-06
6.E-06
7.E-06
8.E-06
0.8 0.9 1.0 1.1 1.2 1.3 1.4 1.5 1.6 1.7 1.8
Residence time, ms
NO
x, m
ol/m
ol to
t, w
et
GRI 3.0, 5 atm total NOx GRI 3.0, 5 atm NOx via CH and NNH GRI 3.0, 5 atm NOx via N2O and Zeld Global, 5 atm total NOx Global, 5 atm NOx via CH and NNH Global, 5 atm NOx via N2O and Zeld
Figure 4.2 Mole fraction of NO formed by different pathways for the 5 bar cases in the PSR of themodeled Bengtsson reactor
0.E+00
1.E-06
2.E-06
3.E-06
4.E-06
5.E-06
6.E-06
0.8 0.9 1.0 1.1 1.2 1.3 1.4 1.5 1.6 1.7 1.8Residence time, ms
NO
x, m
ol/m
ol to
t, w
et
GRI 3.0, 10 atm total NOx
GRI 3.0, 10 atm NOx via CH and NNH
GRI 3.0, 10 atm NOx via N2O and Zeld Global, 10 atm total NOx
Global, 10 atm NOx via CH and NNH
Global, 10 atm NOx via N2O and Zeld
Figure 4.3 Mole fraction of NO formed by different pathways for the 10 bar cases in the PSR of themodeled Bengtsson reactor
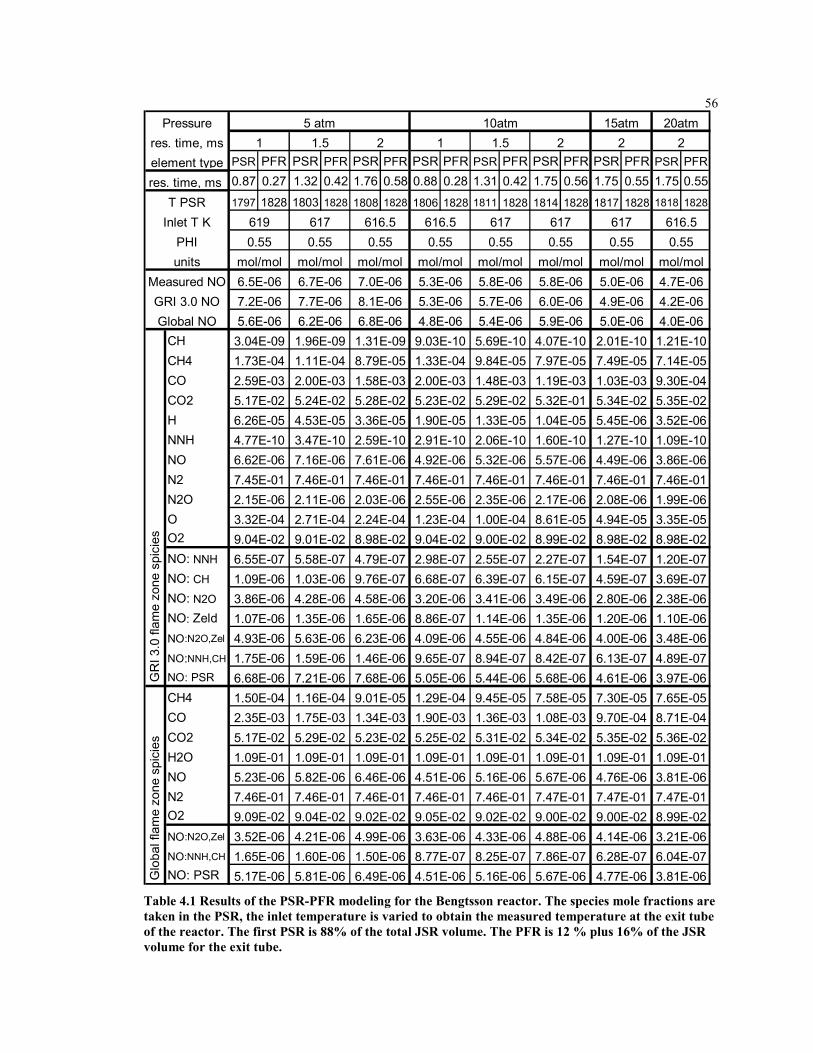
56
PSR PFR PSR PFR PSR PFR PSR PFR PSR PFR PSR PFR PSR PFR PSR PFR0.87 0.27 1.32 0.42 1.76 0.58 0.88 0.28 1.31 0.42 1.75 0.56 1.75 0.55 1.75 0.551797 1828 1803 1828 1808 1828 1806 1828 1811 1828 1814 1828 1817 1828 1818 1828
CHCH4COCO2HNNHNO N2N2OOO2NO: NNH
NO: CH
NO: N2O
NO: ZeldNO:N2O,Zel
NO:NNH,CH
NO: PSR
CH4COCO2H2ONON2O2NO:N2O,Zel
NO:NNH,CH
NO: PSR
units
res. time, ms
Pressureres. time, mselement type
T PSR
Measured NOGRI 3.0 NOGlobal NO
1
Inlet T KPHI
6190.55
6.5E-067.2E-06
3.21E-066.04E-073.81E-06
mol/mol mol/mol mol/mol mol/mol mol/mol mol/mol
1.09E-01
7.47E-018.99E-02
7.65E-058.71E-045.36E-02
3.35E-058.98E-02
2.38E-06
3.81E-06
3.69E-07
3.97E-064.89E-073.48E-061.10E-06
1.20E-07
1.09E-103.86E-067.46E-011.99E-06
7.14E-059.30E-045.35E-023.52E-06
4.77E-06
GR
I 3.0
flam
e zo
ne s
pici
esG
loba
l fla
me
zone
spi
cies
616.50.55
4.7E-064.2E-064.0E-06
1.21E-10
7.47E-019.00E-024.14E-066.28E-07
9.70E-045.35E-021.09E-014.76E-06
4.00E-066.13E-074.61E-067.30E-05
1.54E-074.59E-072.80E-061.20E-06
7.46E-012.08E-064.94E-058.98E-02
5.34E-025.45E-061.27E-104.49E-06
10atm
0.55
5.0E-06mol/mol
21.5 2 1 1.5
4.88E-067.86E-075.67E-06
617
4.9E-065.0E-06
2.01E-107.49E-051.03E-03
1.09E-015.67E-067.47E-019.00E-02
5.68E-067.58E-051.08E-035.34E-02
3.49E-061.35E-064.84E-068.42E-07
8.61E-058.99E-022.27E-076.15E-07
1.60E-105.57E-067.46E-012.17E-06
7.97E-051.19E-035.32E-011.04E-05
4.33E-068.25E-075.16E-06
6170.55
5.8E-066.0E-065.9E-06
4.07E-10
1.09E-015.16E-067.46E-019.02E-02
5.44E-069.45E-051.36E-035.31E-02
3.41E-061.14E-064.55E-068.94E-07
1.00E-049.00E-022.55E-076.39E-07
2.06E-105.32E-067.46E-012.35E-06
9.84E-051.48E-035.29E-021.33E-05
3.63E-068.77E-074.51E-06
6170.55
5.8E-065.7E-065.4E-065.69E-10
1.09E-014.51E-067.46E-019.05E-02
5.05E-061.29E-041.90E-035.25E-02
3.20E-068.86E-074.09E-069.65E-07
1.23E-049.04E-022.98E-076.68E-07
2.91E-104.92E-067.46E-012.55E-06
1.33E-042.00E-035.23E-021.90E-05
4.99E-061.50E-066.49E-06
616.50.55
5.3E-065.3E-064.8E-06
9.03E-10
1.09E-016.46E-067.46E-019.02E-02
7.68E-069.01E-051.34E-035.23E-02
4.58E-061.65E-066.23E-061.46E-06
2.24E-048.98E-024.79E-079.76E-07
2.59E-107.61E-067.46E-012.03E-06
8.79E-051.58E-035.28E-023.36E-05
8.1E-066.8E-061.31E-09
2
9.04E-024.21E-061.60E-065.81E-06
5.29E-021.09E-015.82E-067.46E-01
1.59E-067.21E-061.16E-041.75E-03
1.03E-064.28E-061.35E-065.63E-06
2.11E-062.71E-049.01E-025.58E-07
4.53E-053.47E-107.16E-067.46E-01
1.65E-065.17E-06
1.09E-015.23E-06
9.09E-027.46E-01
5.6E-06
3.52E-06
6.68E-06
2.35E-035.17E-02
3.86E-061.07E-064.93E-061.75E-06
1.50E-04
9.04E-026.55E-071.09E-06
mol/mol
6.62E-067.45E-012.15E-063.32E-04
5.17E-026.26E-05
20atm
3.04E-091.73E-042.59E-03
6.7E-067.7E-066.2E-06
2
1.96E-091.11E-04
4.77E-10
5 atm 15atm
6170.55
616.50.55
7.0E-06
2.00E-035.24E-02
Table 4.1 Results of the PSR-PFR modeling for the Bengtsson reactor. The species mole fractions aretaken in the PSR, the inlet temperature is varied to obtain the measured temperature at the exit tubeof the reactor. The first PSR is 88% of the total JSR volume. The PFR is 12 % plus 16% of the JSRvolume for the exit tube.
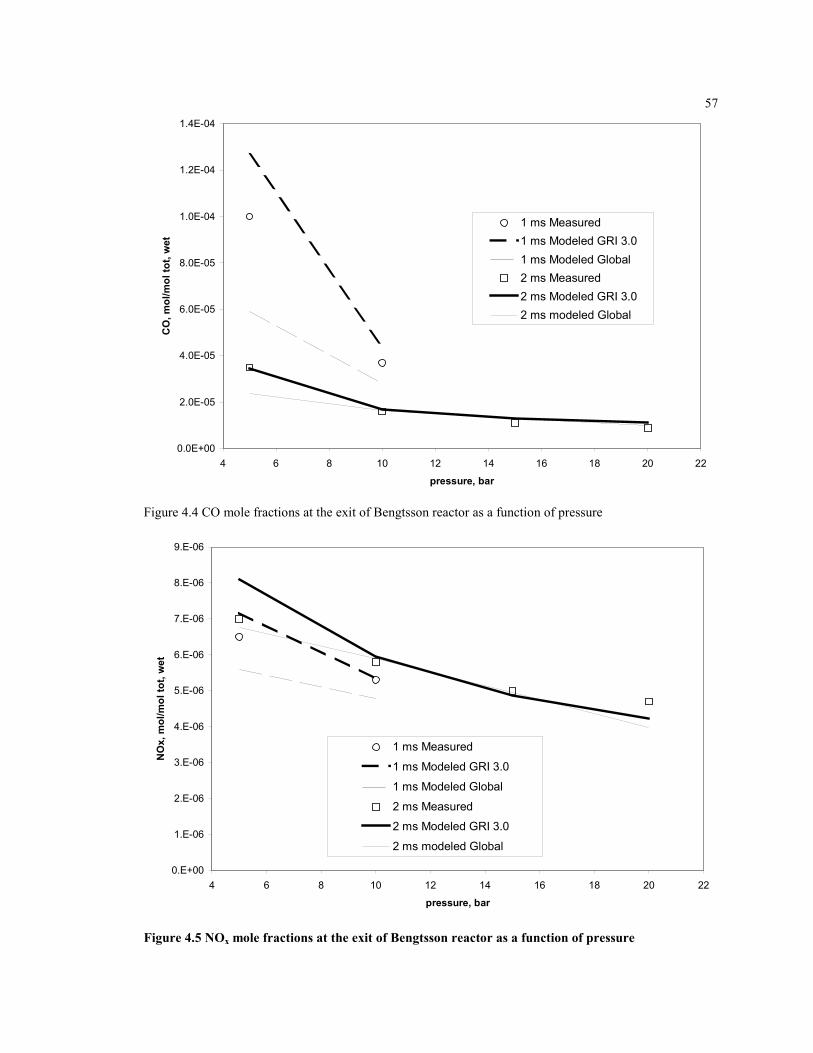
57
0.0E+00
2.0E-05
4.0E-05
6.0E-05
8.0E-05
1.0E-04
1.2E-04
1.4E-04
4 6 8 10 12 14 16 18 20 22
pressure, bar
CO
, mol
/mol
tot,
wet
1 ms Measured1 ms Modeled GRI 3.01 ms Modeled Global2 ms Measured2 ms Modeled GRI 3.02 ms modeled Global
Figure 4.4 CO mole fractions at the exit of Bengtsson reactor as a function of pressure
0.E+00
1.E-06
2.E-06
3.E-06
4.E-06
5.E-06
6.E-06
7.E-06
8.E-06
9.E-06
4 6 8 10 12 14 16 18 20 22
pressure, bar
NO
x, m
ol/m
ol to
t, w
et
1 ms Measured
1 ms Modeled GRI 3.0
1 ms Modeled Global
2 ms Measured2 ms Modeled GRI 3.0
2 ms modeled Global
Figure 4.5 NOx mole fractions at the exit of Bengtsson reactor as a function of pressure
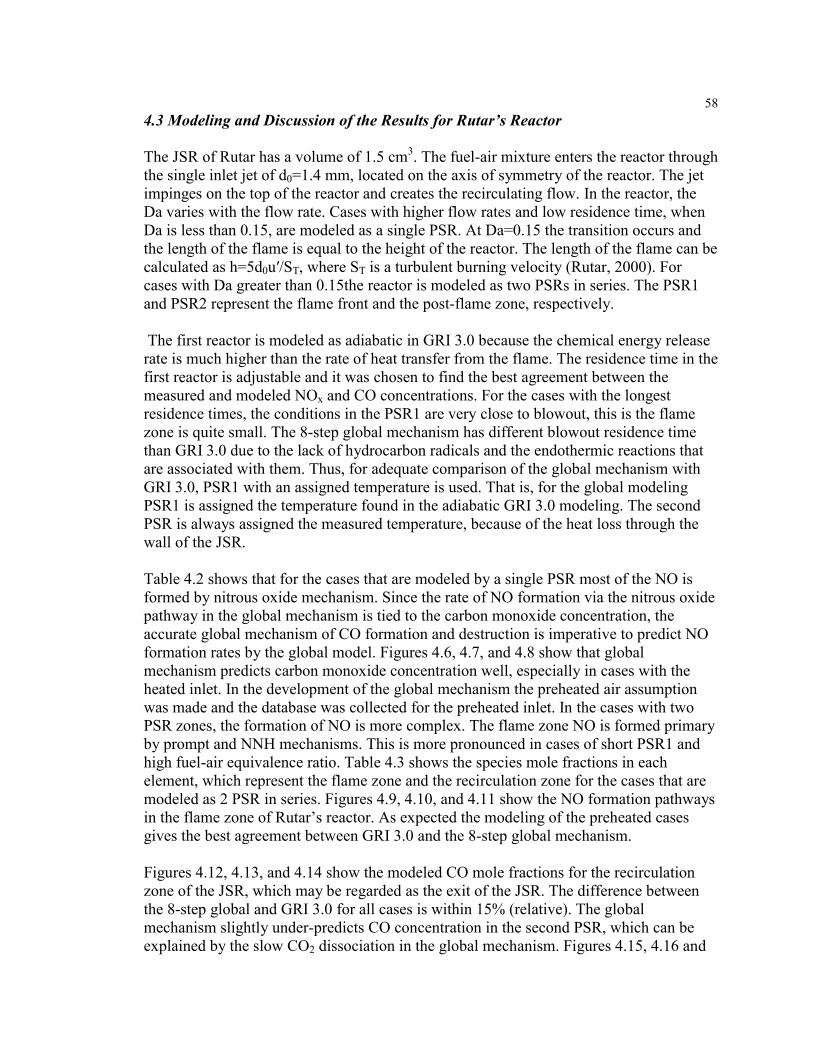
584.3 Modeling and Discussion of the Results for Rutar’s Reactor
The JSR of Rutar has a volume of 1.5 cm3. The fuel-air mixture enters the reactor throughthe single inlet jet of d0=1.4 mm, located on the axis of symmetry of the reactor. The jetimpinges on the top of the reactor and creates the recirculating flow. In the reactor, theDa varies with the flow rate. Cases with higher flow rates and low residence time, whenDa is less than 0.15, are modeled as a single PSR. At Da=0.15 the transition occurs andthe length of the flame is equal to the height of the reactor. The length of the flame can becalculated as h=5d0u′/ST, where ST is a turbulent burning velocity (Rutar, 2000). Forcases with Da greater than 0.15the reactor is modeled as two PSRs in series. The PSR1and PSR2 represent the flame front and the post-flame zone, respectively.
The first reactor is modeled as adiabatic in GRI 3.0 because the chemical energy releaserate is much higher than the rate of heat transfer from the flame. The residence time in thefirst reactor is adjustable and it was chosen to find the best agreement between themeasured and modeled NOx and CO concentrations. For the cases with the longestresidence times, the conditions in the PSR1 are very close to blowout, this is the flamezone is quite small. The 8-step global mechanism has different blowout residence timethan GRI 3.0 due to the lack of hydrocarbon radicals and the endothermic reactions thatare associated with them. Thus, for adequate comparison of the global mechanism withGRI 3.0, PSR1 with an assigned temperature is used. That is, for the global modelingPSR1 is assigned the temperature found in the adiabatic GRI 3.0 modeling. The secondPSR is always assigned the measured temperature, because of the heat loss through thewall of the JSR.
Table 4.2 shows that for the cases that are modeled by a single PSR most of the NO isformed by nitrous oxide mechanism. Since the rate of NO formation via the nitrous oxidepathway in the global mechanism is tied to the carbon monoxide concentration, theaccurate global mechanism of CO formation and destruction is imperative to predict NOformation rates by the global model. Figures 4.6, 4.7, and 4.8 show that globalmechanism predicts carbon monoxide concentration well, especially in cases with theheated inlet. In the development of the global mechanism the preheated air assumptionwas made and the database was collected for the preheated inlet. In the cases with twoPSR zones, the formation of NO is more complex. The flame zone NO is formed primaryby prompt and NNH mechanisms. This is more pronounced in cases of short PSR1 andhigh fuel-air equivalence ratio. Table 4.3 shows the species mole fractions in eachelement, which represent the flame zone and the recirculation zone for the cases that aremodeled as 2 PSR in series. Figures 4.9, 4.10, and 4.11 show the NO formation pathwaysin the flame zone of Rutar’s reactor. As expected the modeling of the preheated casesgives the best agreement between GRI 3.0 and the 8-step global mechanism.
Figures 4.12, 4.13, and 4.14 show the modeled CO mole fractions for the recirculationzone of the JSR, which may be regarded as the exit of the JSR. The difference betweenthe 8-step global and GRI 3.0 for all cases is within 15% (relative). The globalmechanism slightly under-predicts CO concentration in the second PSR, which can beexplained by the slow CO2 dissociation in the global mechanism. Figures 4.15, 4.16 and
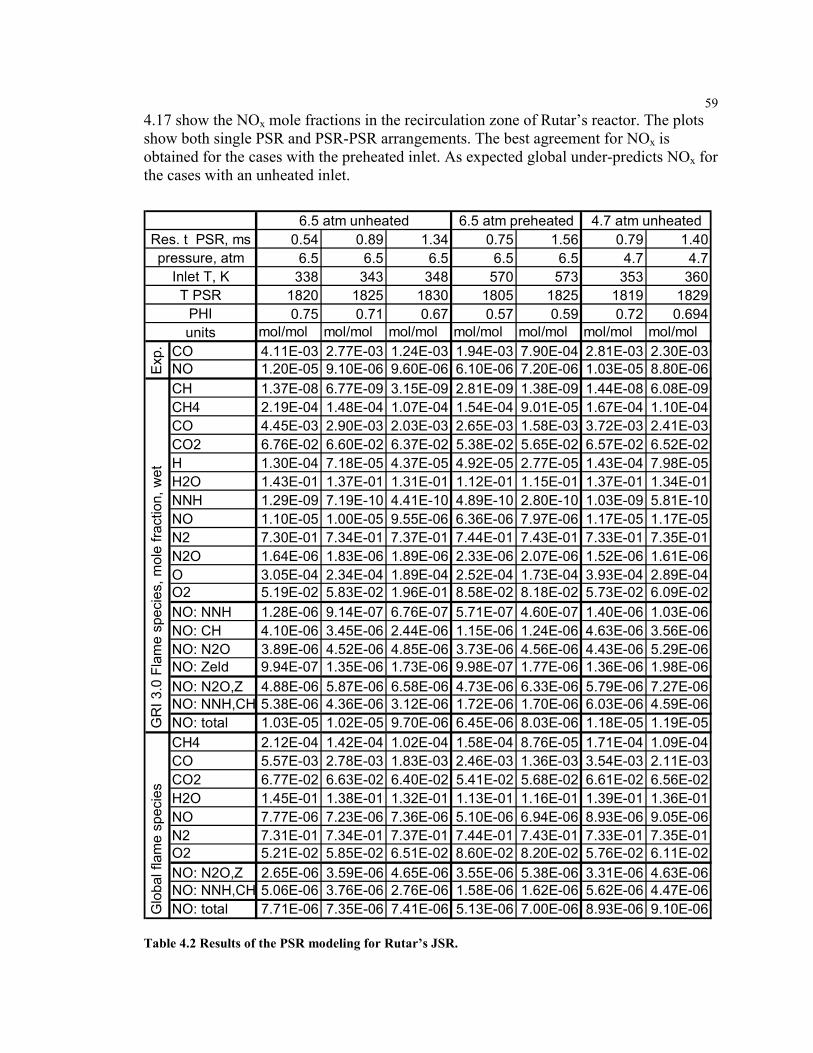
594.17 show the NOx mole fractions in the recirculation zone of Rutar’s reactor. The plotsshow both single PSR and PSR-PSR arrangements. The best agreement for NOx isobtained for the cases with the preheated inlet. As expected global under-predicts NOx forthe cases with an unheated inlet.
0.54 0.89 1.34 0.75 1.56 0.79 1.406.5 6.5 6.5 6.5 6.5 4.7 4.7
338 343 348 570 573 353 3601820 1825 1830 1805 1825 1819 18290.75 0.71 0.67 0.57 0.59 0.72 0.694
mol/mol mol/mol mol/mol mol/mol mol/mol mol/mol mol/molCO 4.11E-03 2.77E-03 1.24E-03 1.94E-03 7.90E-04 2.81E-03 2.30E-03NO 1.20E-05 9.10E-06 9.60E-06 6.10E-06 7.20E-06 1.03E-05 8.80E-06CH 1.37E-08 6.77E-09 3.15E-09 2.81E-09 1.38E-09 1.44E-08 6.08E-09CH4 2.19E-04 1.48E-04 1.07E-04 1.54E-04 9.01E-05 1.67E-04 1.10E-04CO 4.45E-03 2.90E-03 2.03E-03 2.65E-03 1.58E-03 3.72E-03 2.41E-03CO2 6.76E-02 6.60E-02 6.37E-02 5.38E-02 5.65E-02 6.57E-02 6.52E-02H 1.30E-04 7.18E-05 4.37E-05 4.92E-05 2.77E-05 1.43E-04 7.98E-05H2O 1.43E-01 1.37E-01 1.31E-01 1.12E-01 1.15E-01 1.37E-01 1.34E-01NNH 1.29E-09 7.19E-10 4.41E-10 4.89E-10 2.80E-10 1.03E-09 5.81E-10NO 1.10E-05 1.00E-05 9.55E-06 6.36E-06 7.97E-06 1.17E-05 1.17E-05N2 7.30E-01 7.34E-01 7.37E-01 7.44E-01 7.43E-01 7.33E-01 7.35E-01N2O 1.64E-06 1.83E-06 1.89E-06 2.33E-06 2.07E-06 1.52E-06 1.61E-06O 3.05E-04 2.34E-04 1.89E-04 2.52E-04 1.73E-04 3.93E-04 2.89E-04O2 5.19E-02 5.83E-02 1.96E-01 8.58E-02 8.18E-02 5.73E-02 6.09E-02NO: NNH 1.28E-06 9.14E-07 6.76E-07 5.71E-07 4.60E-07 1.40E-06 1.03E-06NO: CH 4.10E-06 3.45E-06 2.44E-06 1.15E-06 1.24E-06 4.63E-06 3.56E-06NO: N2O 3.89E-06 4.52E-06 4.85E-06 3.73E-06 4.56E-06 4.43E-06 5.29E-06NO: Zeld 9.94E-07 1.35E-06 1.73E-06 9.98E-07 1.77E-06 1.36E-06 1.98E-06NO: N2O,Z 4.88E-06 5.87E-06 6.58E-06 4.73E-06 6.33E-06 5.79E-06 7.27E-06NO: NNH,CH 5.38E-06 4.36E-06 3.12E-06 1.72E-06 1.70E-06 6.03E-06 4.59E-06NO: total 1.03E-05 1.02E-05 9.70E-06 6.45E-06 8.03E-06 1.18E-05 1.19E-05CH4 2.12E-04 1.42E-04 1.02E-04 1.58E-04 8.76E-05 1.71E-04 1.09E-04CO 5.57E-03 2.78E-03 1.83E-03 2.46E-03 1.36E-03 3.54E-03 2.11E-03CO2 6.77E-02 6.63E-02 6.40E-02 5.41E-02 5.68E-02 6.61E-02 6.56E-02H2O 1.45E-01 1.38E-01 1.32E-01 1.13E-01 1.16E-01 1.39E-01 1.36E-01NO 7.77E-06 7.23E-06 7.36E-06 5.10E-06 6.94E-06 8.93E-06 9.05E-06N2 7.31E-01 7.34E-01 7.37E-01 7.44E-01 7.43E-01 7.33E-01 7.35E-01O2 5.21E-02 5.85E-02 6.51E-02 8.60E-02 8.20E-02 5.76E-02 6.11E-02NO: N2O,Z 2.65E-06 3.59E-06 4.65E-06 3.55E-06 5.38E-06 3.31E-06 4.63E-06NO: NNH,CH 5.06E-06 3.76E-06 2.76E-06 1.58E-06 1.62E-06 5.62E-06 4.47E-06NO: total 7.71E-06 7.35E-06 7.41E-06 5.13E-06 7.00E-06 8.93E-06 9.10E-06
4.7 atm unheated6.5 atm preheated
Glo
bal f
lam
e sp
ecie
sG
RI 3
.0 F
lam
e sp
ecie
s, m
ole
fract
ion,
wet
Exp.
6.5 atm unheatedRes. t PSR, mspressure, atm
Inlet T, KT PSR
PHIunits
Table 4.2 Results of the PSR modeling for Rutar’s JSR.
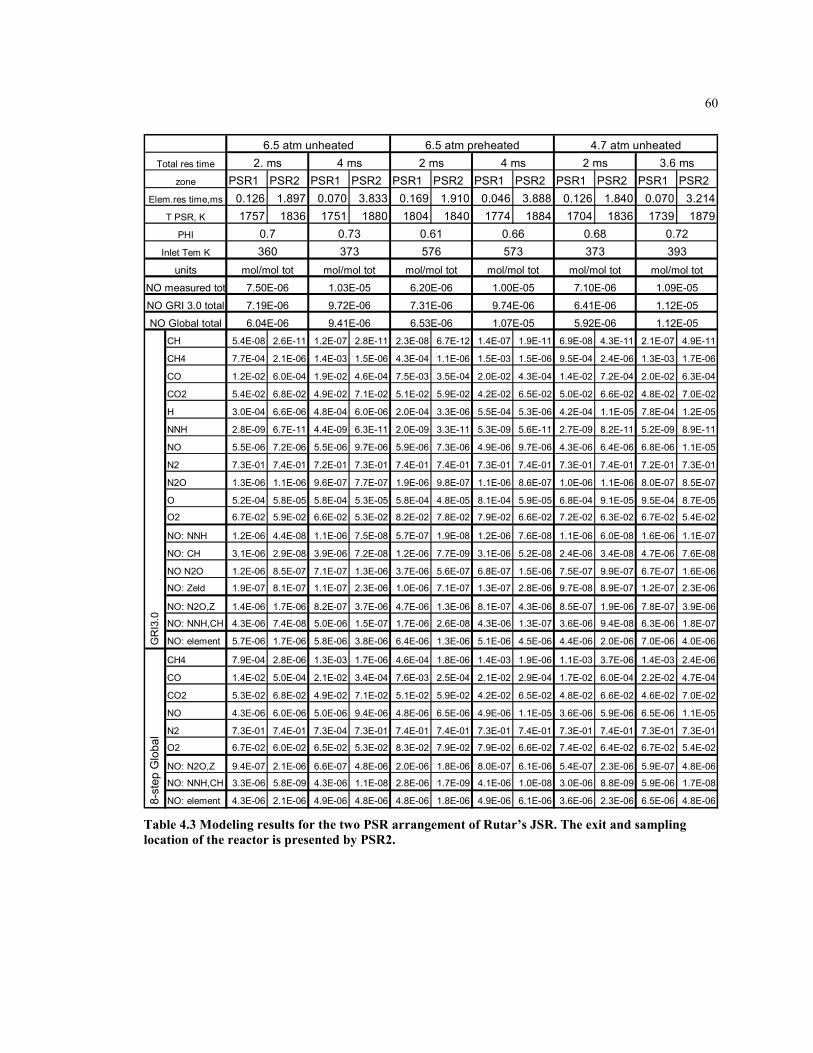
60
PSR1 PSR2 PSR1 PSR2 PSR1 PSR2 PSR1 PSR2 PSR1 PSR2 PSR1 PSR20.126 1.897 0.070 3.833 0.169 1.910 0.046 3.888 0.126 1.840 0.070 3.2141757 1836 1751 1880 1804 1840 1774 1884 1704 1836 1739 1879
CH 5.4E-08 2.6E-11 1.2E-07 2.8E-11 2.3E-08 6.7E-12 1.4E-07 1.9E-11 6.9E-08 4.3E-11 2.1E-07 4.9E-11
CH4 7.7E-04 2.1E-06 1.4E-03 1.5E-06 4.3E-04 1.1E-06 1.5E-03 1.5E-06 9.5E-04 2.4E-06 1.3E-03 1.7E-06
CO 1.2E-02 6.0E-04 1.9E-02 4.6E-04 7.5E-03 3.5E-04 2.0E-02 4.3E-04 1.4E-02 7.2E-04 2.0E-02 6.3E-04
CO2 5.4E-02 6.8E-02 4.9E-02 7.1E-02 5.1E-02 5.9E-02 4.2E-02 6.5E-02 5.0E-02 6.6E-02 4.8E-02 7.0E-02
H 3.0E-04 6.6E-06 4.8E-04 6.0E-06 2.0E-04 3.3E-06 5.5E-04 5.3E-06 4.2E-04 1.1E-05 7.8E-04 1.2E-05
NNH 2.8E-09 6.7E-11 4.4E-09 6.3E-11 2.0E-09 3.3E-11 5.3E-09 5.6E-11 2.7E-09 8.2E-11 5.2E-09 8.9E-11
NO 5.5E-06 7.2E-06 5.5E-06 9.7E-06 5.9E-06 7.3E-06 4.9E-06 9.7E-06 4.3E-06 6.4E-06 6.8E-06 1.1E-05
N2 7.3E-01 7.4E-01 7.2E-01 7.3E-01 7.4E-01 7.4E-01 7.3E-01 7.4E-01 7.3E-01 7.4E-01 7.2E-01 7.3E-01
N2O 1.3E-06 1.1E-06 9.6E-07 7.7E-07 1.9E-06 9.8E-07 1.1E-06 8.6E-07 1.0E-06 1.1E-06 8.0E-07 8.5E-07
O 5.2E-04 5.8E-05 5.8E-04 5.3E-05 5.8E-04 4.8E-05 8.1E-04 5.9E-05 6.8E-04 9.1E-05 9.5E-04 8.7E-05
O2 6.7E-02 5.9E-02 6.6E-02 5.3E-02 8.2E-02 7.8E-02 7.9E-02 6.6E-02 7.2E-02 6.3E-02 6.7E-02 5.4E-02
NO: NNH 1.2E-06 4.4E-08 1.1E-06 7.5E-08 5.7E-07 1.9E-08 1.2E-06 7.6E-08 1.1E-06 6.0E-08 1.6E-06 1.1E-07
NO: CH 3.1E-06 2.9E-08 3.9E-06 7.2E-08 1.2E-06 7.7E-09 3.1E-06 5.2E-08 2.4E-06 3.4E-08 4.7E-06 7.6E-08
NO N2O 1.2E-06 8.5E-07 7.1E-07 1.3E-06 3.7E-06 5.6E-07 6.8E-07 1.5E-06 7.5E-07 9.9E-07 6.7E-07 1.6E-06
NO: Zeld 1.9E-07 8.1E-07 1.1E-07 2.3E-06 1.0E-06 7.1E-07 1.3E-07 2.8E-06 9.7E-08 8.9E-07 1.2E-07 2.3E-06
NO: N2O,Z 1.4E-06 1.7E-06 8.2E-07 3.7E-06 4.7E-06 1.3E-06 8.1E-07 4.3E-06 8.5E-07 1.9E-06 7.8E-07 3.9E-06
NO: NNH,CH 4.3E-06 7.4E-08 5.0E-06 1.5E-07 1.7E-06 2.6E-08 4.3E-06 1.3E-07 3.6E-06 9.4E-08 6.3E-06 1.8E-07
NO: element 5.7E-06 1.7E-06 5.8E-06 3.8E-06 6.4E-06 1.3E-06 5.1E-06 4.5E-06 4.4E-06 2.0E-06 7.0E-06 4.0E-06
CH4 7.9E-04 2.8E-06 1.3E-03 1.7E-06 4.6E-04 1.8E-06 1.4E-03 1.9E-06 1.1E-03 3.7E-06 1.4E-03 2.4E-06
CO 1.4E-02 5.0E-04 2.1E-02 3.4E-04 7.6E-03 2.5E-04 2.1E-02 2.9E-04 1.7E-02 6.0E-04 2.2E-02 4.7E-04
CO2 5.3E-02 6.8E-02 4.9E-02 7.1E-02 5.1E-02 5.9E-02 4.2E-02 6.5E-02 4.8E-02 6.6E-02 4.6E-02 7.0E-02
NO 4.3E-06 6.0E-06 5.0E-06 9.4E-06 4.8E-06 6.5E-06 4.9E-06 1.1E-05 3.6E-06 5.9E-06 6.5E-06 1.1E-05
N2 7.3E-01 7.4E-01 7.3E-04 7.3E-01 7.4E-01 7.4E-01 7.3E-01 7.4E-01 7.3E-01 7.4E-01 7.3E-01 7.3E-01
O2 6.7E-02 6.0E-02 6.5E-02 5.3E-02 8.3E-02 7.9E-02 7.9E-02 6.6E-02 7.4E-02 6.4E-02 6.7E-02 5.4E-02
NO: N2O,Z 9.4E-07 2.1E-06 6.6E-07 4.8E-06 2.0E-06 1.8E-06 8.0E-07 6.1E-06 5.4E-07 2.3E-06 5.9E-07 4.8E-06
NO: NNH,CH 3.3E-06 5.8E-09 4.3E-06 1.1E-08 2.8E-06 1.7E-09 4.1E-06 1.0E-08 3.0E-06 8.8E-09 5.9E-06 1.7E-08
NO: element 4.3E-06 2.1E-06 4.9E-06 4.8E-06 4.8E-06 1.8E-06 4.9E-06 6.1E-06 3.6E-06 2.3E-06 6.5E-06 4.8E-068-st
ep G
loba
lG
RI3
.0
6.04E-06 9.41E-06NO Global total
mol/mol tot mol/mol tot
6.53E-06 1.07E-05 5.92E-06 1.12E-05
mol/mol tot mol/mol tot mol/mol tot mol/mol tot
6.5 atm unheated 6.5 atm preheated 4.7 atm unheated
0.7 0.66360
0.73373
0.61 0.72393
Elem.res time,ms
T PSR, K
PHI
Inlet Tem K 576 5730.68373
3.6 ms2 ms4 ms2 ms4 ms2. ms
units
Total res time
zone
NO measured tot 7.50E-06 1.03E-05 6.20E-06 1.00E-05 7.10E-06 1.09E-05NO GRI 3.0 total 7.19E-06 9.72E-06 7.31E-06 9.74E-06 6.41E-06 1.12E-05
Table 4.3 Modeling results for the two PSR arrangement of Rutar’s JSR. The exit and samplinglocation of the reactor is presented by PSR2.
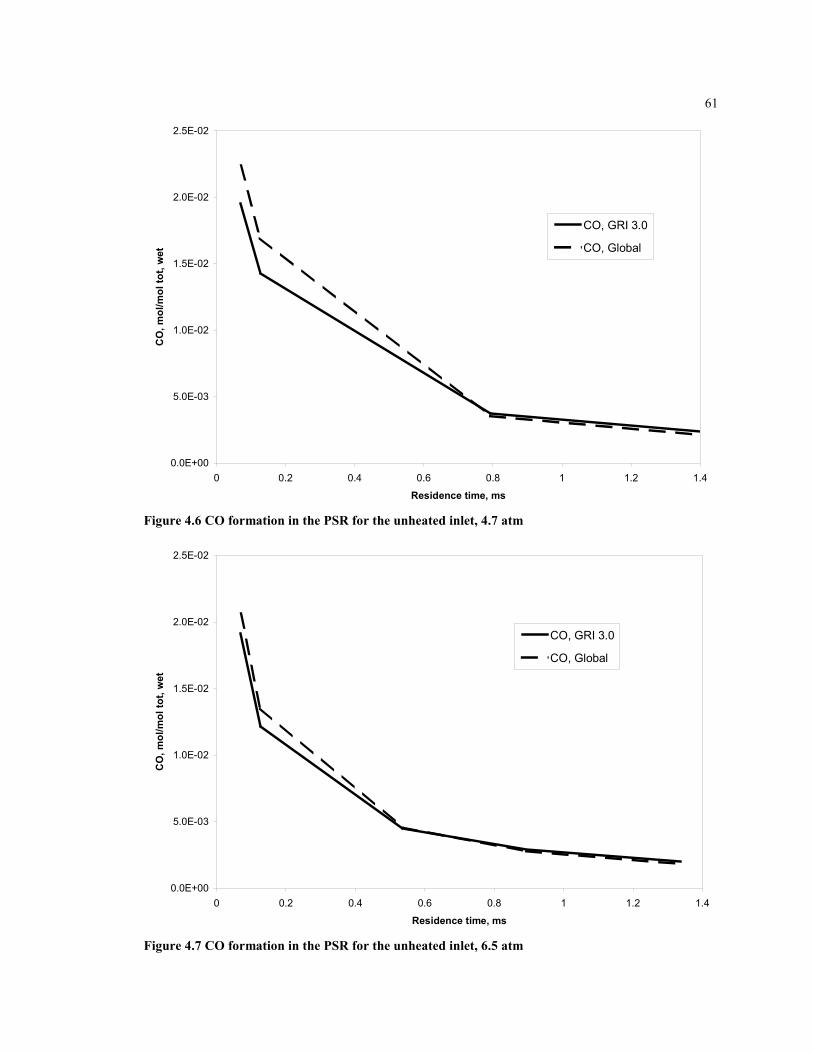
61
0.0E+00
5.0E-03
1.0E-02
1.5E-02
2.0E-02
2.5E-02
0 0.2 0.4 0.6 0.8 1 1.2 1.4
Residence time, ms
CO
, mol
/mol
tot,
wet
CO, GRI 3.0
CO, Global
Figure 4.6 CO formation in the PSR for the unheated inlet, 4.7 atm
0.0E+00
5.0E-03
1.0E-02
1.5E-02
2.0E-02
2.5E-02
0 0.2 0.4 0.6 0.8 1 1.2 1.4
Residence time, ms
CO
, mol
/mol
tot,
wet
CO, GRI 3.0
CO, Global
Figure 4.7 CO formation in the PSR for the unheated inlet, 6.5 atm
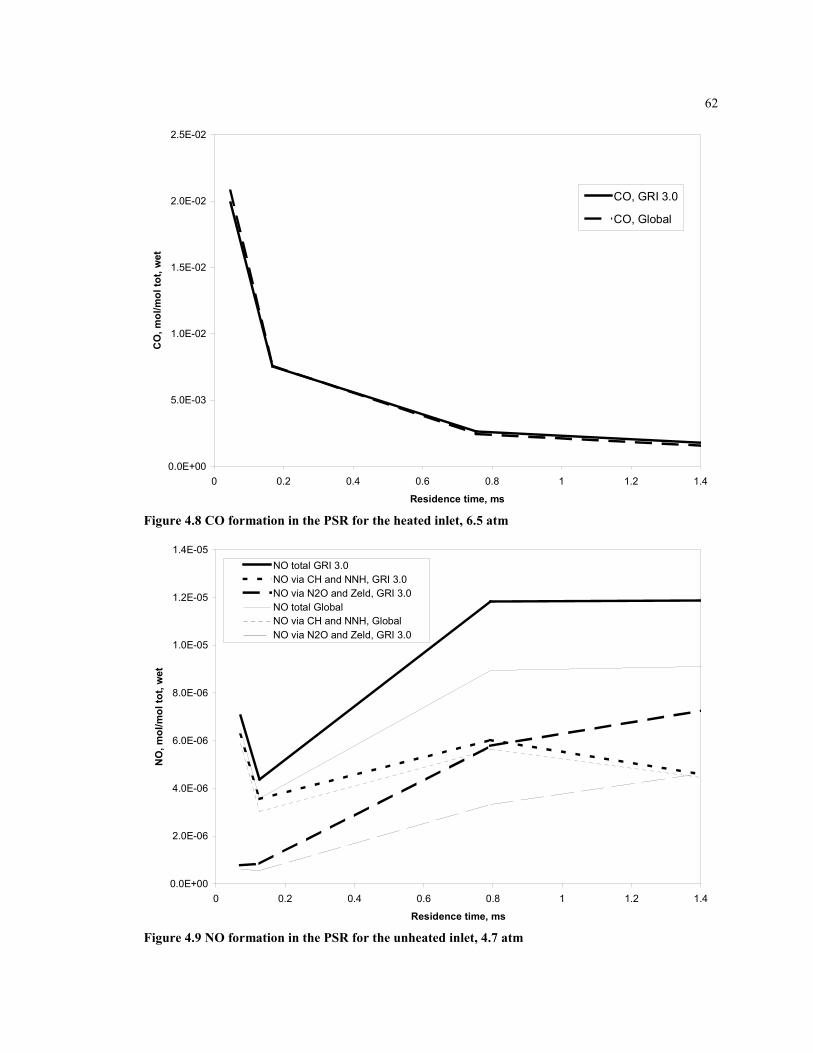
62
0.0E+00
5.0E-03
1.0E-02
1.5E-02
2.0E-02
2.5E-02
0 0.2 0.4 0.6 0.8 1 1.2 1.4
Residence time, ms
CO
, mol
/mol
tot,
wet
CO, GRI 3.0
CO, Global
Figure 4.8 CO formation in the PSR for the heated inlet, 6.5 atm
0.0E+00
2.0E-06
4.0E-06
6.0E-06
8.0E-06
1.0E-05
1.2E-05
1.4E-05
0 0.2 0.4 0.6 0.8 1 1.2 1.4
Residence time, ms
NO
, mol
/mol
tot,
wet
NO total GRI 3.0NO via CH and NNH, GRI 3.0NO via N2O and Zeld, GRI 3.0NO total GlobalNO via CH and NNH, GlobalNO via N2O and Zeld, GRI 3.0
Figure 4.9 NO formation in the PSR for the unheated inlet, 4.7 atm
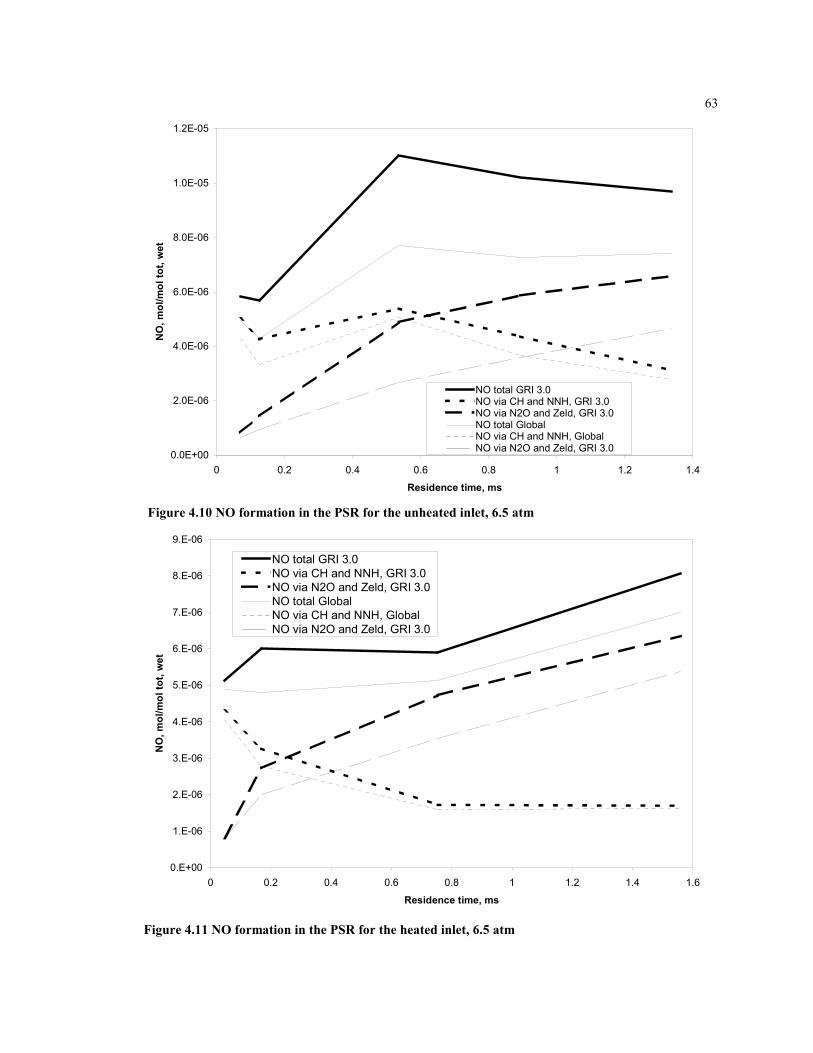
63
0.0E+00
2.0E-06
4.0E-06
6.0E-06
8.0E-06
1.0E-05
1.2E-05
0 0.2 0.4 0.6 0.8 1 1.2 1.4
Residence time, ms
NO
, mol
/mol
tot,
wet
NO total GRI 3.0NO via CH and NNH, GRI 3.0NO via N2O and Zeld, GRI 3.0NO total GlobalNO via CH and NNH, GlobalNO via N2O and Zeld, GRI 3.0
Figure 4.10 NO formation in the PSR for the unheated inlet, 6.5 atm
0.E+00
1.E-06
2.E-06
3.E-06
4.E-06
5.E-06
6.E-06
7.E-06
8.E-06
9.E-06
0 0.2 0.4 0.6 0.8 1 1.2 1.4 1.6
Residence time, ms
NO
, mol
/mol
tot,
wet
NO total GRI 3.0NO via CH and NNH, GRI 3.0NO via N2O and Zeld, GRI 3.0NO total GlobalNO via CH and NNH, GlobalNO via N2O and Zeld, GRI 3.0
Figure 4.11 NO formation in the PSR for the heated inlet, 6.5 atm
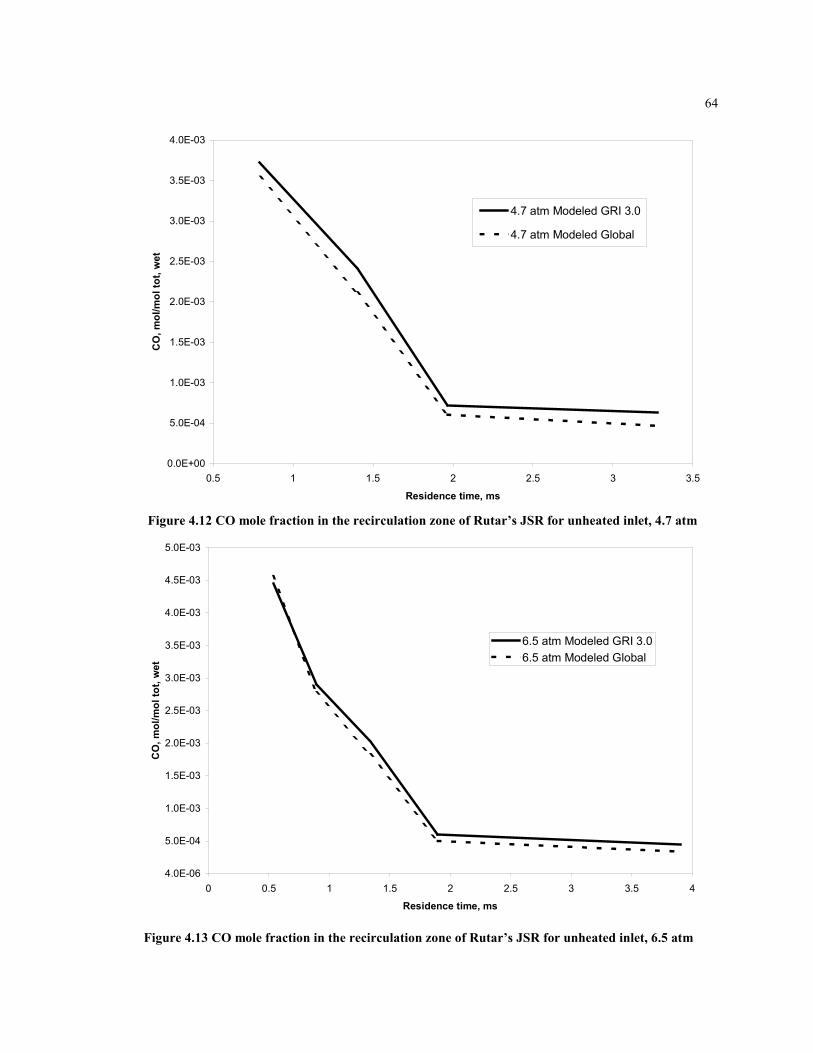
64
0.0E+00
5.0E-04
1.0E-03
1.5E-03
2.0E-03
2.5E-03
3.0E-03
3.5E-03
4.0E-03
0.5 1 1.5 2 2.5 3 3.5
Residence time, ms
CO
, mol
/mol
tot,
wet
4.7 atm Modeled GRI 3.0
4.7 atm Modeled Global
Figure 4.12 CO mole fraction in the recirculation zone of Rutar’s JSR for unheated inlet, 4.7 atm
4.0E-06
5.0E-04
1.0E-03
1.5E-03
2.0E-03
2.5E-03
3.0E-03
3.5E-03
4.0E-03
4.5E-03
5.0E-03
0 0.5 1 1.5 2 2.5 3 3.5 4
Residence time, ms
CO
, mol
/mol
tot,
wet
6.5 atm Modeled GRI 3.06.5 atm Modeled Global
Figure 4.13 CO mole fraction in the recirculation zone of Rutar’s JSR for unheated inlet, 6.5 atm
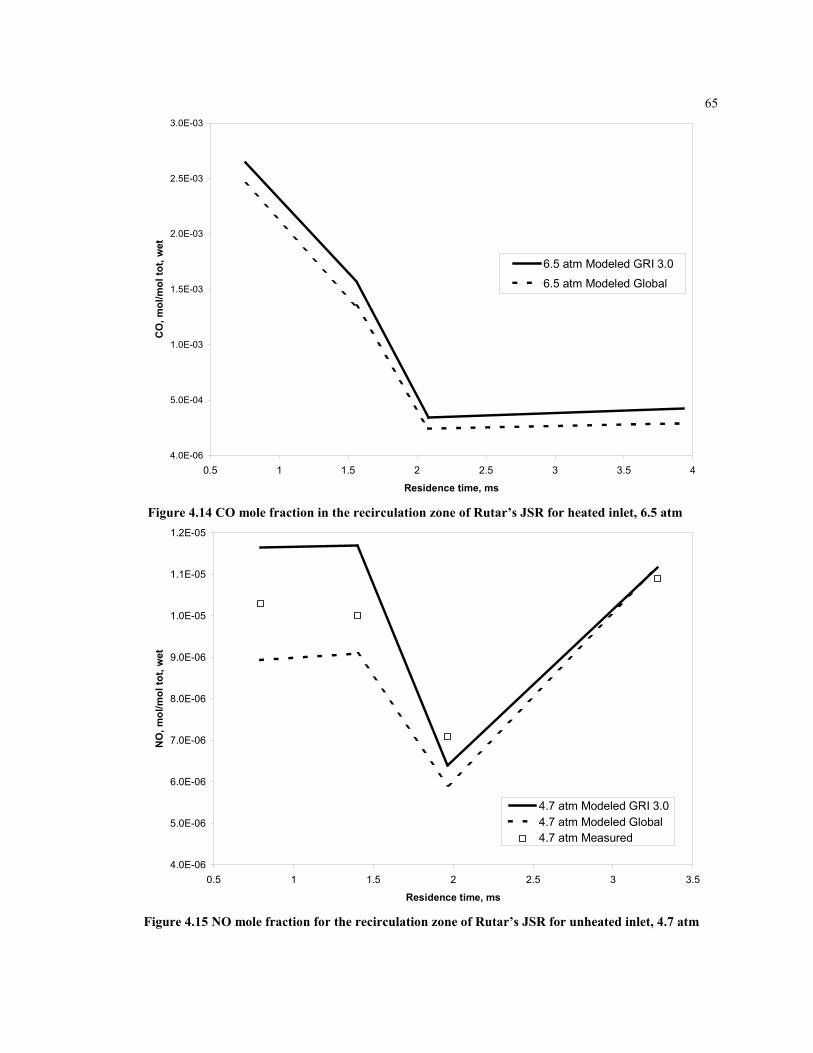
65
4.0E-06
5.0E-04
1.0E-03
1.5E-03
2.0E-03
2.5E-03
3.0E-03
0.5 1 1.5 2 2.5 3 3.5 4
Residence time, ms
CO
, mol
/mol
tot,
wet
6.5 atm Modeled GRI 3.06.5 atm Modeled Global
Figure 4.14 CO mole fraction in the recirculation zone of Rutar’s JSR for heated inlet, 6.5 atm
4.0E-06
5.0E-06
6.0E-06
7.0E-06
8.0E-06
9.0E-06
1.0E-05
1.1E-05
1.2E-05
0.5 1 1.5 2 2.5 3 3.5
Residence time, ms
NO
, mol
/mol
tot,
wet
4.7 atm Modeled GRI 3.04.7 atm Modeled Global4.7 atm Measured
Figure 4.15 NO mole fraction for the recirculation zone of Rutar’s JSR for unheated inlet, 4.7 atm
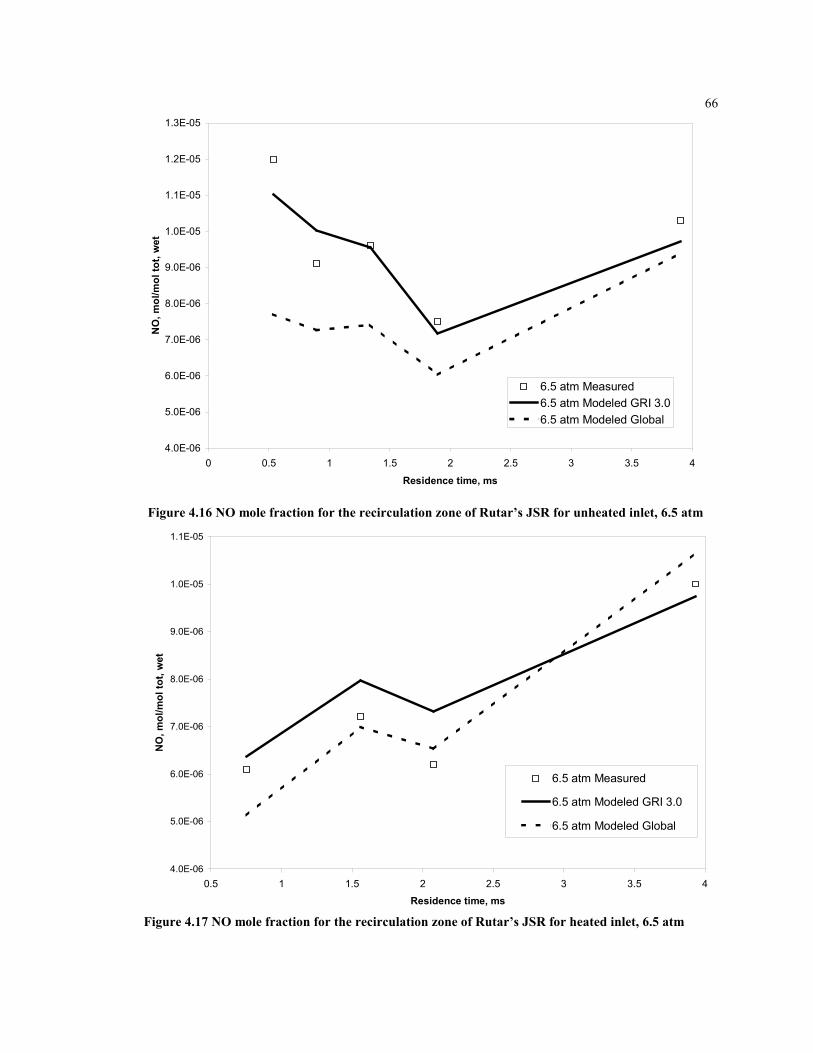
66
4.0E-06
5.0E-06
6.0E-06
7.0E-06
8.0E-06
9.0E-06
1.0E-05
1.1E-05
1.2E-05
1.3E-05
0 0.5 1 1.5 2 2.5 3 3.5 4
Residence time, ms
NO
, mol
/mol
tot,
wet
6.5 atm Measured6.5 atm Modeled GRI 3.06.5 atm Modeled Global
Figure 4.16 NO mole fraction for the recirculation zone of Rutar’s JSR for unheated inlet, 6.5 atm
4.0E-06
5.0E-06
6.0E-06
7.0E-06
8.0E-06
9.0E-06
1.0E-05
1.1E-05
0.5 1 1.5 2 2.5 3 3.5 4Residence time, ms
NO
, mol
/mol
tot,
wet
6.5 atm Measured
6.5 atm Modeled GRI 3.0
6.5 atm Modeled Global
Figure 4.17 NO mole fraction for the recirculation zone of Rutar’s JSR for heated inlet, 6.5 atm
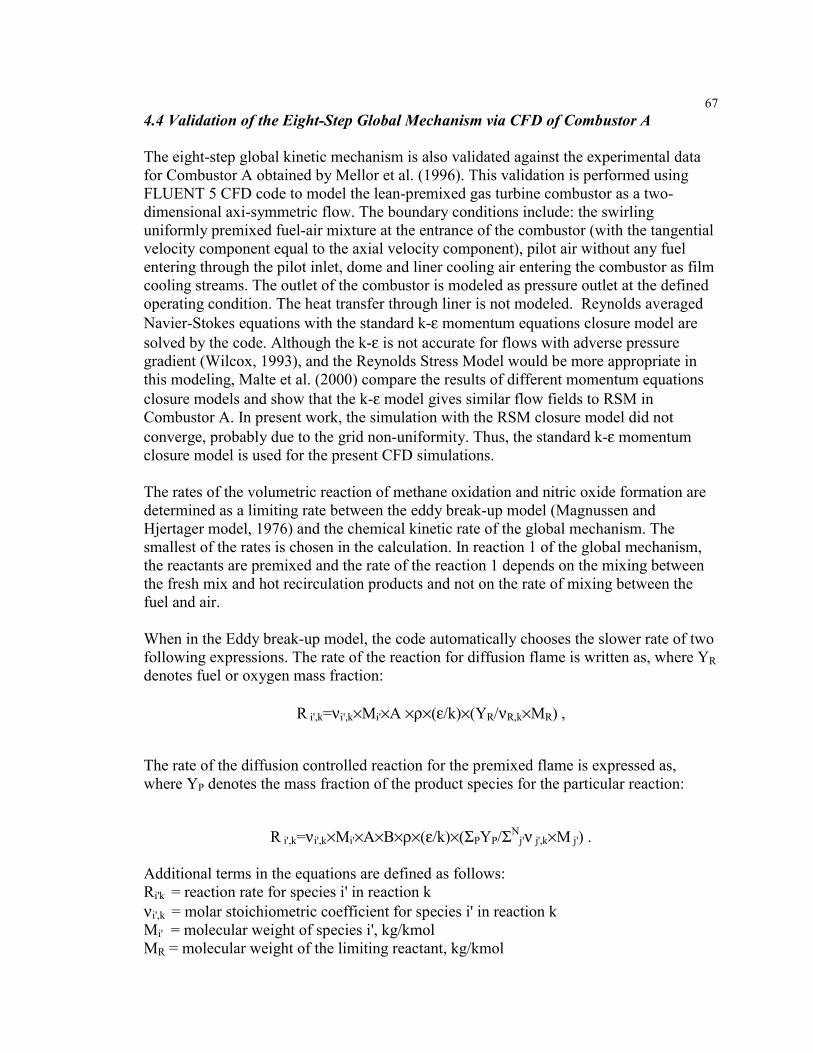
674.4 Validation of the Eight-Step Global Mechanism via CFD of Combustor A
The eight-step global kinetic mechanism is also validated against the experimental datafor Combustor A obtained by Mellor et al. (1996). This validation is performed usingFLUENT 5 CFD code to model the lean-premixed gas turbine combustor as a two-dimensional axi-symmetric flow. The boundary conditions include: the swirlinguniformly premixed fuel-air mixture at the entrance of the combustor (with the tangentialvelocity component equal to the axial velocity component), pilot air without any fuelentering through the pilot inlet, dome and liner cooling air entering the combustor as filmcooling streams. The outlet of the combustor is modeled as pressure outlet at the definedoperating condition. The heat transfer through liner is not modeled. Reynolds averagedNavier-Stokes equations with the standard k-ε momentum equations closure model aresolved by the code. Although the k-ε is not accurate for flows with adverse pressuregradient (Wilcox, 1993), and the Reynolds Stress Model would be more appropriate inthis modeling, Malte et al. (2000) compare the results of different momentum equationsclosure models and show that the k-ε model gives similar flow fields to RSM inCombustor A. In present work, the simulation with the RSM closure model did notconverge, probably due to the grid non-uniformity. Thus, the standard k-ε momentumclosure model is used for the present CFD simulations.
The rates of the volumetric reaction of methane oxidation and nitric oxide formation aredetermined as a limiting rate between the eddy break-up model (Magnussen andHjertager model, 1976) and the chemical kinetic rate of the global mechanism. Thesmallest of the rates is chosen in the calculation. In reaction 1 of the global mechanism,the reactants are premixed and the rate of the reaction 1 depends on the mixing betweenthe fresh mix and hot recirculation products and not on the rate of mixing between thefuel and air.
When in the Eddy break-up model, the code automatically chooses the slower rate of twofollowing expressions. The rate of the reaction for diffusion flame is written as, where YRdenotes fuel or oxygen mass fraction:
R i',k=νi',k×Mi'×A ×ρ×(ε/k)×(YR/νR,k×MR) ,
The rate of the diffusion controlled reaction for the premixed flame is expressed as,where YP denotes the mass fraction of the product species for the particular reaction:
R i',k=νi',k×Mi'×A×B×ρ×(ε/k)×(ΣPYP/ΣNj'ν j',k×M j') .
Additional terms in the equations are defined as follows:Ri'k = reaction rate for species i' in reaction kνi',k = molar stoichiometric coefficient for species i' in reaction kMi' = molecular weight of species i', kg/kmolMR = molecular weight of the limiting reactant, kg/kmol
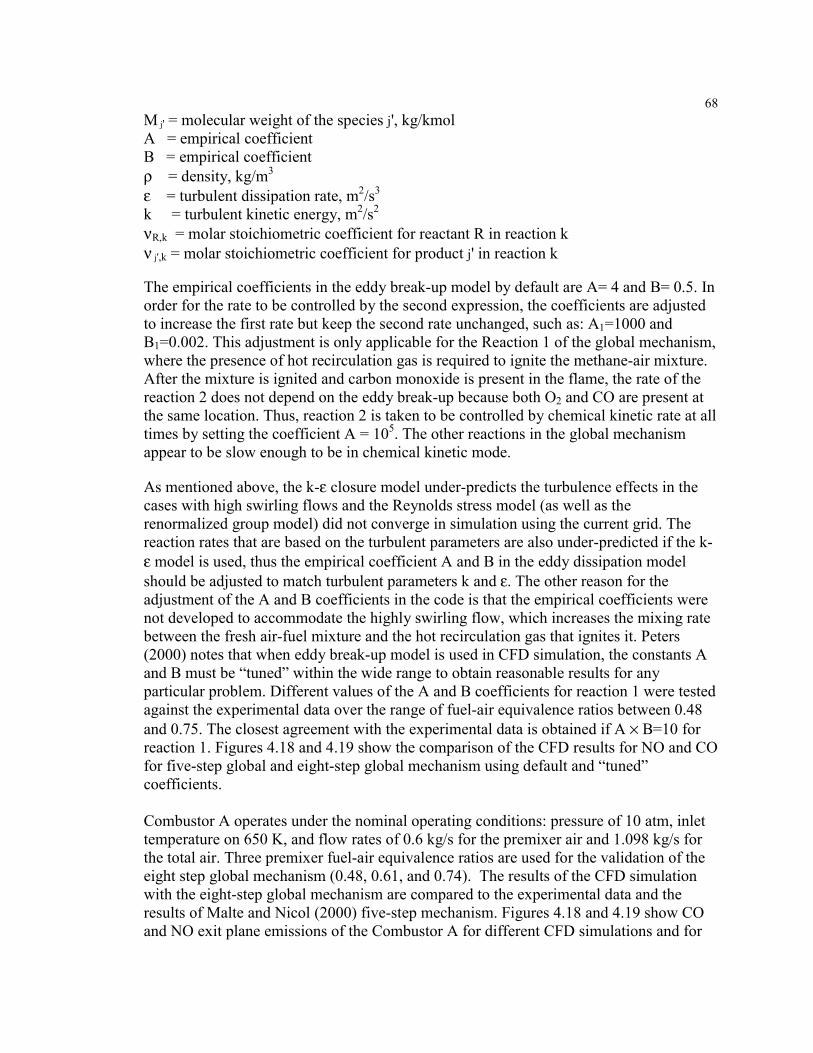
68M j' = molecular weight of the species j', kg/kmolA = empirical coefficientB = empirical coefficientρ = density, kg/m3
ε = turbulent dissipation rate, m2/s3
k = turbulent kinetic energy, m2/s2
νR,k = molar stoichiometric coefficient for reactant R in reaction kν j',k = molar stoichiometric coefficient for product j' in reaction k
The empirical coefficients in the eddy break-up model by default are A= 4 and B= 0.5. Inorder for the rate to be controlled by the second expression, the coefficients are adjustedto increase the first rate but keep the second rate unchanged, such as: A1=1000 andB1=0.002. This adjustment is only applicable for the Reaction 1 of the global mechanism,where the presence of hot recirculation gas is required to ignite the methane-air mixture.After the mixture is ignited and carbon monoxide is present in the flame, the rate of thereaction 2 does not depend on the eddy break-up because both O2 and CO are present atthe same location. Thus, reaction 2 is taken to be controlled by chemical kinetic rate at alltimes by setting the coefficient A = 105. The other reactions in the global mechanismappear to be slow enough to be in chemical kinetic mode.
As mentioned above, the k-ε closure model under-predicts the turbulence effects in thecases with high swirling flows and the Reynolds stress model (as well as therenormalized group model) did not converge in simulation using the current grid. Thereaction rates that are based on the turbulent parameters are also under-predicted if the k-ε model is used, thus the empirical coefficient A and B in the eddy dissipation modelshould be adjusted to match turbulent parameters k and ε. The other reason for theadjustment of the A and B coefficients in the code is that the empirical coefficients werenot developed to accommodate the highly swirling flow, which increases the mixing ratebetween the fresh air-fuel mixture and the hot recirculation gas that ignites it. Peters(2000) notes that when eddy break-up model is used in CFD simulation, the constants Aand B must be “tuned” within the wide range to obtain reasonable results for anyparticular problem. Different values of the A and B coefficients for reaction 1 were testedagainst the experimental data over the range of fuel-air equivalence ratios between 0.48and 0.75. The closest agreement with the experimental data is obtained if A × B=10 forreaction 1. Figures 4.18 and 4.19 show the comparison of the CFD results for NO and COfor five-step global and eight-step global mechanism using default and “tuned”coefficients.
Combustor A operates under the nominal operating conditions: pressure of 10 atm, inlettemperature on 650 K, and flow rates of 0.6 kg/s for the premixer air and 1.098 kg/s forthe total air. Three premixer fuel-air equivalence ratios are used for the validation of theeight step global mechanism (0.48, 0.61, and 0.74). The results of the CFD simulationwith the eight-step global mechanism are compared to the experimental data and theresults of Malte and Nicol (2000) five-step mechanism. Figures 4.18 and 4.19 show COand NO exit plane emissions of the Combustor A for different CFD simulations and for
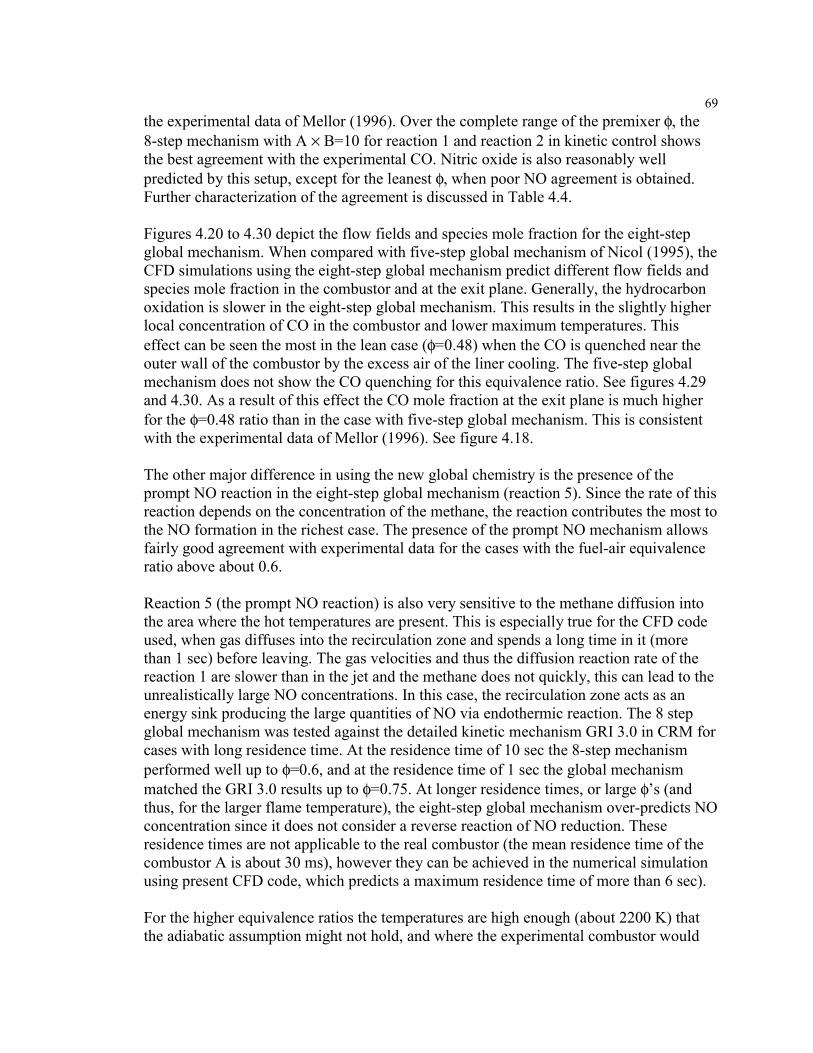
69the experimental data of Mellor (1996). Over the complete range of the premixer φ, the8-step mechanism with A × B=10 for reaction 1 and reaction 2 in kinetic control showsthe best agreement with the experimental CO. Nitric oxide is also reasonably wellpredicted by this setup, except for the leanest φ, when poor NO agreement is obtained.Further characterization of the agreement is discussed in Table 4.4.
Figures 4.20 to 4.30 depict the flow fields and species mole fraction for the eight-stepglobal mechanism. When compared with five-step global mechanism of Nicol (1995), theCFD simulations using the eight-step global mechanism predict different flow fields andspecies mole fraction in the combustor and at the exit plane. Generally, the hydrocarbonoxidation is slower in the eight-step global mechanism. This results in the slightly higherlocal concentration of CO in the combustor and lower maximum temperatures. Thiseffect can be seen the most in the lean case (φ=0.48) when the CO is quenched near theouter wall of the combustor by the excess air of the liner cooling. The five-step globalmechanism does not show the CO quenching for this equivalence ratio. See figures 4.29and 4.30. As a result of this effect the CO mole fraction at the exit plane is much higherfor the φ=0.48 ratio than in the case with five-step global mechanism. This is consistentwith the experimental data of Mellor (1996). See figure 4.18.
The other major difference in using the new global chemistry is the presence of theprompt NO reaction in the eight-step global mechanism (reaction 5). Since the rate of thisreaction depends on the concentration of the methane, the reaction contributes the most tothe NO formation in the richest case. The presence of the prompt NO mechanism allowsfairly good agreement with experimental data for the cases with the fuel-air equivalenceratio above about 0.6.
Reaction 5 (the prompt NO reaction) is also very sensitive to the methane diffusion intothe area where the hot temperatures are present. This is especially true for the CFD codeused, when gas diffuses into the recirculation zone and spends a long time in it (morethan 1 sec) before leaving. The gas velocities and thus the diffusion reaction rate of thereaction 1 are slower than in the jet and the methane does not quickly, this can lead to theunrealistically large NO concentrations. In this case, the recirculation zone acts as anenergy sink producing the large quantities of NO via endothermic reaction. The 8 stepglobal mechanism was tested against the detailed kinetic mechanism GRI 3.0 in CRM forcases with long residence time. At the residence time of 10 sec the 8-step mechanismperformed well up to φ=0.6, and at the residence time of 1 sec the global mechanismmatched the GRI 3.0 results up to φ=0.75. At longer residence times, or large φ’s (andthus, for the larger flame temperature), the eight-step global mechanism over-predicts NOconcentration since it does not consider a reverse reaction of NO reduction. Theseresidence times are not applicable to the real combustor (the mean residence time of thecombustor A is about 30 ms), however they can be achieved in the numerical simulationusing present CFD code, which predicts a maximum residence time of more than 6 sec).
For the higher equivalence ratios the temperatures are high enough (about 2200 K) thatthe adiabatic assumption might not hold, and where the experimental combustor would
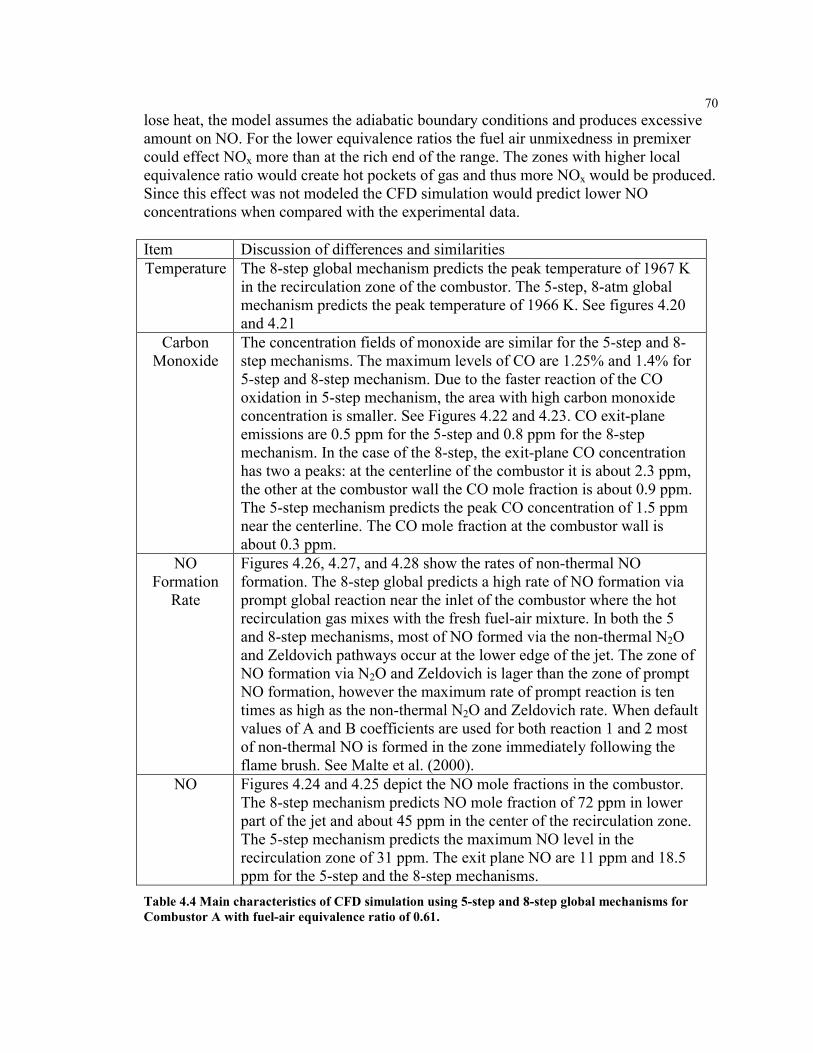
70lose heat, the model assumes the adiabatic boundary conditions and produces excessiveamount on NO. For the lower equivalence ratios the fuel air unmixedness in premixercould effect NOx more than at the rich end of the range. The zones with higher localequivalence ratio would create hot pockets of gas and thus more NOx would be produced.Since this effect was not modeled the CFD simulation would predict lower NOconcentrations when compared with the experimental data.
Item Discussion of differences and similaritiesTemperature The 8-step global mechanism predicts the peak temperature of 1967 K
in the recirculation zone of the combustor. The 5-step, 8-atm globalmechanism predicts the peak temperature of 1966 K. See figures 4.20and 4.21
CarbonMonoxide
The concentration fields of monoxide are similar for the 5-step and 8-step mechanisms. The maximum levels of CO are 1.25% and 1.4% for5-step and 8-step mechanism. Due to the faster reaction of the COoxidation in 5-step mechanism, the area with high carbon monoxideconcentration is smaller. See Figures 4.22 and 4.23. CO exit-planeemissions are 0.5 ppm for the 5-step and 0.8 ppm for the 8-stepmechanism. In the case of the 8-step, the exit-plane CO concentrationhas two a peaks: at the centerline of the combustor it is about 2.3 ppm,the other at the combustor wall the CO mole fraction is about 0.9 ppm.The 5-step mechanism predicts the peak CO concentration of 1.5 ppmnear the centerline. The CO mole fraction at the combustor wall isabout 0.3 ppm.
NOFormation
Rate
Figures 4.26, 4.27, and 4.28 show the rates of non-thermal NOformation. The 8-step global predicts a high rate of NO formation viaprompt global reaction near the inlet of the combustor where the hotrecirculation gas mixes with the fresh fuel-air mixture. In both the 5and 8-step mechanisms, most of NO formed via the non-thermal N2Oand Zeldovich pathways occur at the lower edge of the jet. The zone ofNO formation via N2O and Zeldovich is lager than the zone of promptNO formation, however the maximum rate of prompt reaction is tentimes as high as the non-thermal N2O and Zeldovich rate. When defaultvalues of A and B coefficients are used for both reaction 1 and 2 mostof non-thermal NO is formed in the zone immediately following theflame brush. See Malte et al. (2000).
NO Figures 4.24 and 4.25 depict the NO mole fractions in the combustor.The 8-step mechanism predicts NO mole fraction of 72 ppm in lowerpart of the jet and about 45 ppm in the center of the recirculation zone.The 5-step mechanism predicts the maximum NO level in therecirculation zone of 31 ppm. The exit plane NO are 11 ppm and 18.5ppm for the 5-step and the 8-step mechanisms.
Table 4.4 Main characteristics of CFD simulation using 5-step and 8-step global mechanisms forCombustor A with fuel-air equivalence ratio of 0.61.
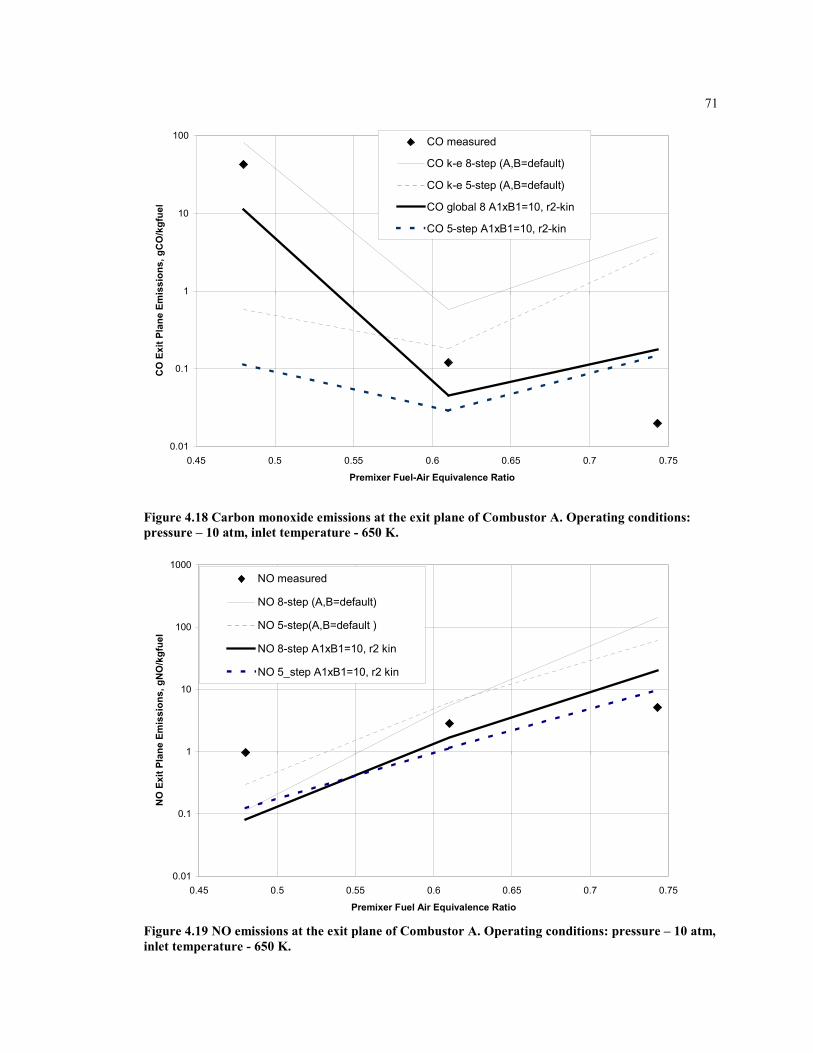
71
0.01
0.1
1
10
100
0.45 0.5 0.55 0.6 0.65 0.7 0.75
Premixer Fuel-Air Equivalence Ratio
CO
Exi
t Pla
ne E
mis
sion
s, g
CO
/kgf
uel
CO measured
CO k-e 8-step (A,B=default)
CO k-e 5-step (A,B=default)
CO global 8 A1xB1=10, r2-kin
CO 5-step A1xB1=10, r2-kin
Figure 4.18 Carbon monoxide emissions at the exit plane of Combustor A. Operating conditions:pressure – 10 atm, inlet temperature - 650 K.
0.01
0.1
1
10
100
1000
0.45 0.5 0.55 0.6 0.65 0.7 0.75
Premixer Fuel Air Equivalence Ratio
NO
Exi
t Pla
ne E
mis
sion
s, g
NO
/kgf
uel
NO measured
NO 8-step (A,B=default)
NO 5-step(A,B=default )
NO 8-step A1xB1=10, r2 kin
NO 5_step A1xB1=10, r2 kin
Figure 4.19 NO emissions at the exit plane of Combustor A. Operating conditions: pressure – 10 atm,inlet temperature - 650 K.
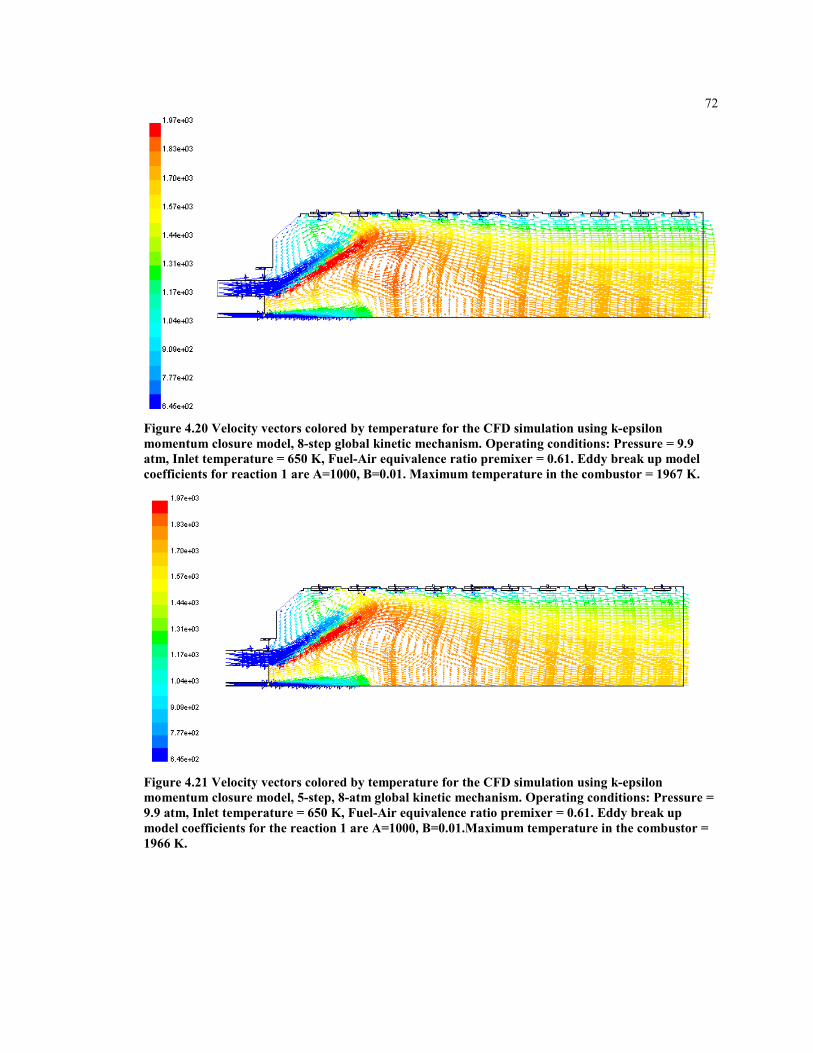
72
Figure 4.20 Velocity vectors colored by temperature for the CFD simulation using k-epsilonmomentum closure model, 8-step global kinetic mechanism. Operating conditions: Pressure = 9.9atm, Inlet temperature = 650 K, Fuel-Air equivalence ratio premixer = 0.61. Eddy break up modelcoefficients for reaction 1 are A=1000, B=0.01. Maximum temperature in the combustor = 1967 K.
Figure 4.21 Velocity vectors colored by temperature for the CFD simulation using k-epsilonmomentum closure model, 5-step, 8-atm global kinetic mechanism. Operating conditions: Pressure =9.9 atm, Inlet temperature = 650 K, Fuel-Air equivalence ratio premixer = 0.61. Eddy break upmodel coefficients for the reaction 1 are A=1000, B=0.01.Maximum temperature in the combustor =1966 K.
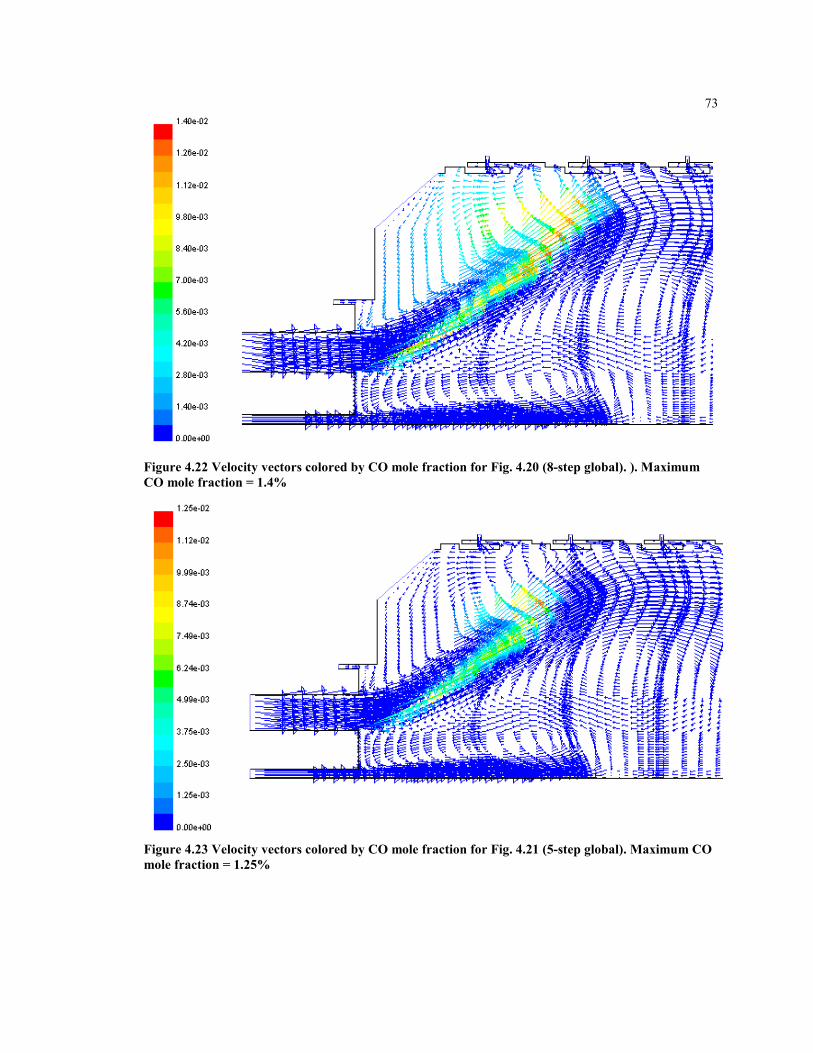
73
Figure 4.22 Velocity vectors colored by CO mole fraction for Fig. 4.20 (8-step global). ). MaximumCO mole fraction = 1.4%
Figure 4.23 Velocity vectors colored by CO mole fraction for Fig. 4.21 (5-step global). Maximum COmole fraction = 1.25%
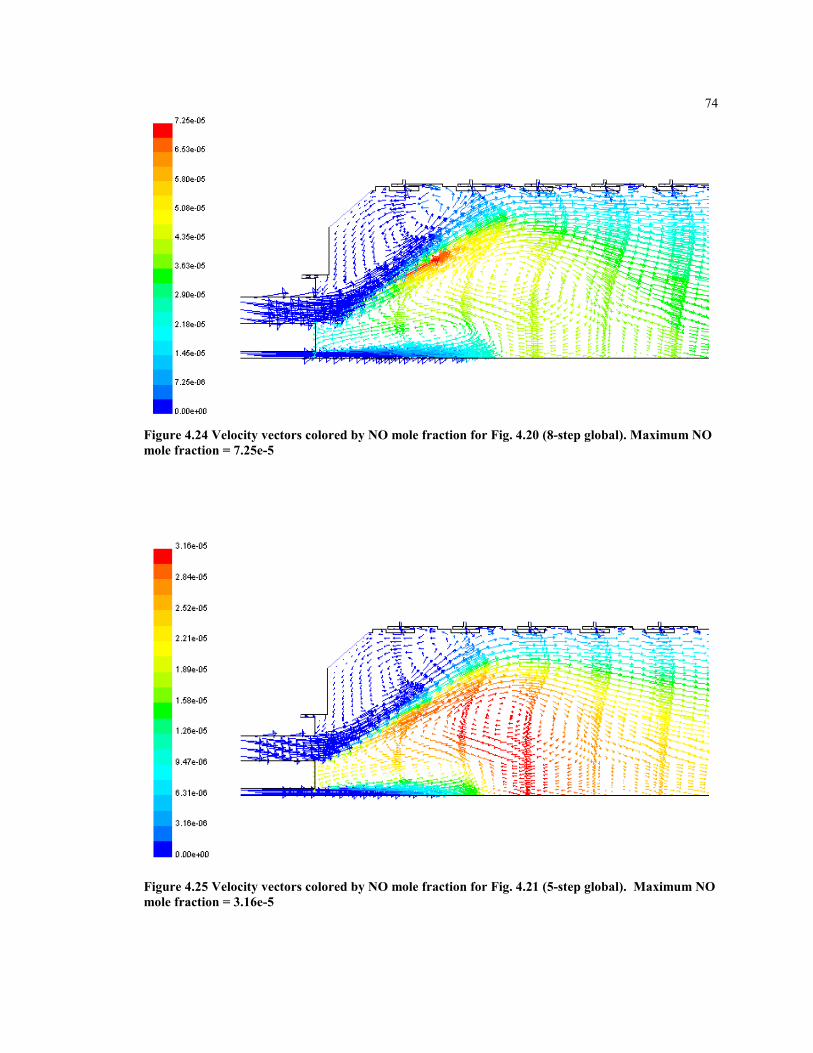
74
Figure 4.24 Velocity vectors colored by NO mole fraction for Fig. 4.20 (8-step global). Maximum NOmole fraction = 7.25e-5
Figure 4.25 Velocity vectors colored by NO mole fraction for Fig. 4.21 (5-step global). Maximum NOmole fraction = 3.16e-5
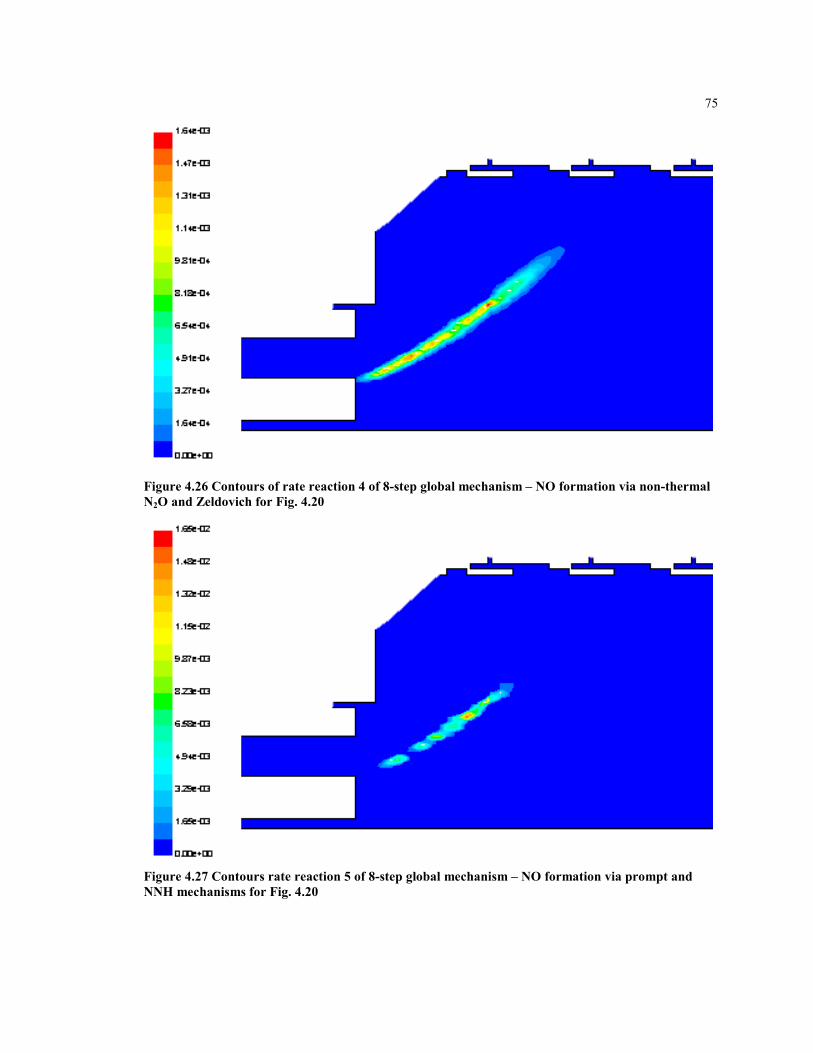
75
Figure 4.26 Contours of rate reaction 4 of 8-step global mechanism – NO formation via non-thermalN2O and Zeldovich for Fig. 4.20
Figure 4.27 Contours rate reaction 5 of 8-step global mechanism – NO formation via prompt andNNH mechanisms for Fig. 4.20
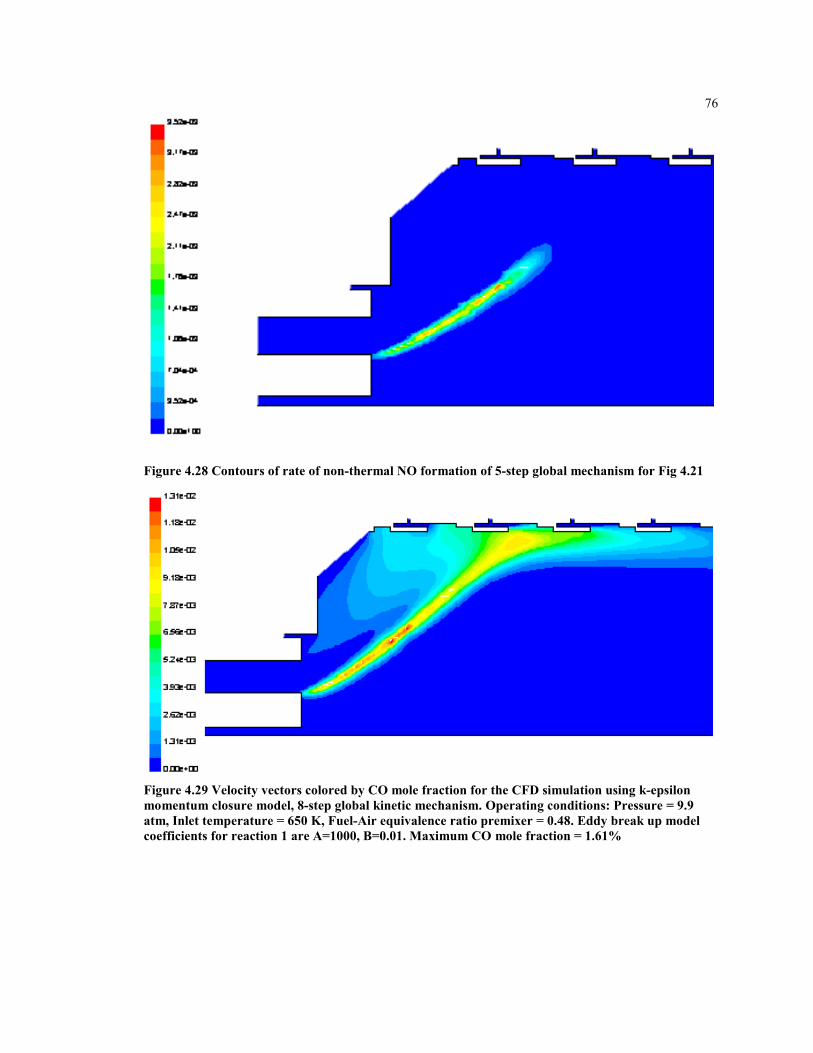
76
Figure 4.28 Contours of rate of non-thermal NO formation of 5-step global mechanism for Fig 4.21
Figure 4.29 Velocity vectors colored by CO mole fraction for the CFD simulation using k-epsilonmomentum closure model, 8-step global kinetic mechanism. Operating conditions: Pressure = 9.9atm, Inlet temperature = 650 K, Fuel-Air equivalence ratio premixer = 0.48. Eddy break up modelcoefficients for reaction 1 are A=1000, B=0.01. Maximum CO mole fraction = 1.61%
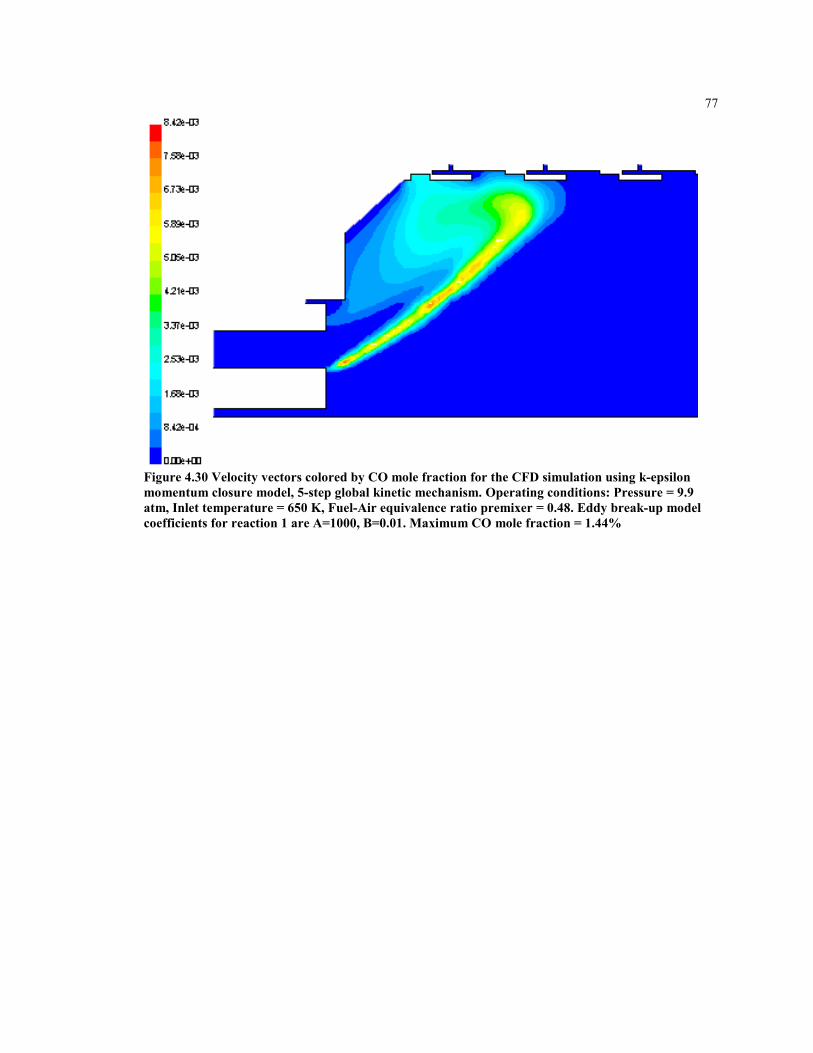
77
Figure 4.30 Velocity vectors colored by CO mole fraction for the CFD simulation using k-epsilonmomentum closure model, 5-step global kinetic mechanism. Operating conditions: Pressure = 9.9atm, Inlet temperature = 650 K, Fuel-Air equivalence ratio premixer = 0.48. Eddy break-up modelcoefficients for reaction 1 are A=1000, B=0.01. Maximum CO mole fraction = 1.44%
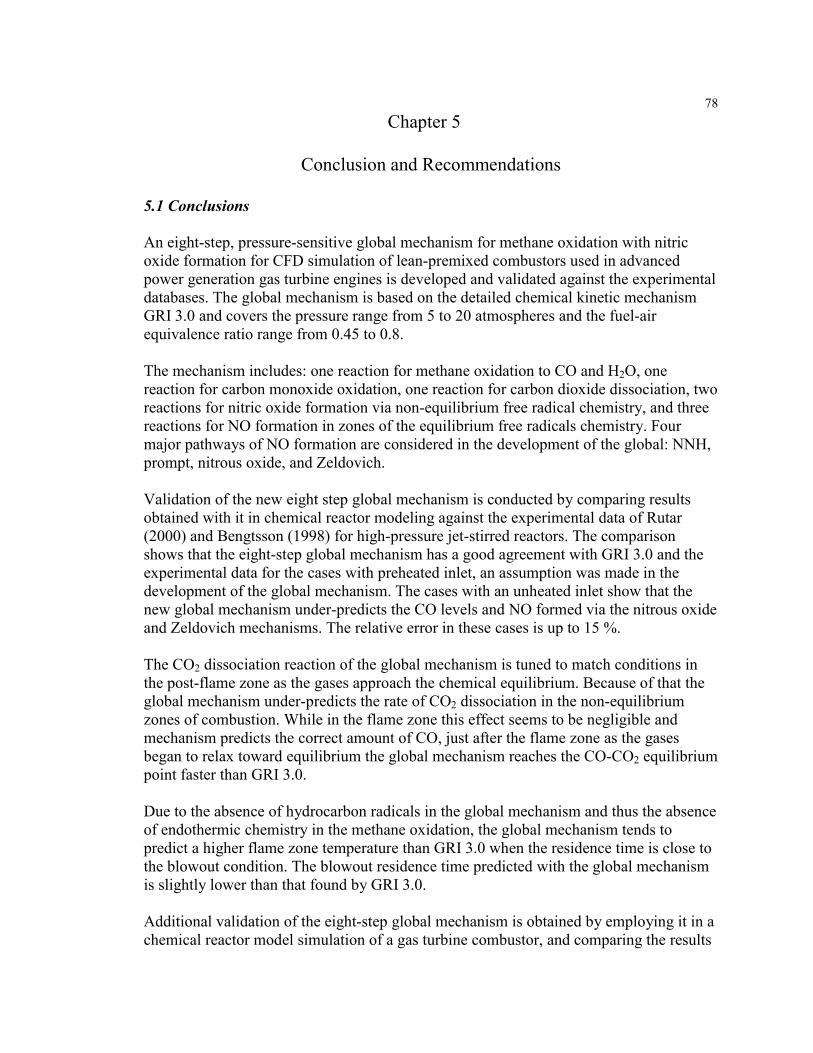
78Chapter 5
Conclusion and Recommendations
5.1 Conclusions
An eight-step, pressure-sensitive global mechanism for methane oxidation with nitricoxide formation for CFD simulation of lean-premixed combustors used in advancedpower generation gas turbine engines is developed and validated against the experimentaldatabases. The global mechanism is based on the detailed chemical kinetic mechanismGRI 3.0 and covers the pressure range from 5 to 20 atmospheres and the fuel-airequivalence ratio range from 0.45 to 0.8.
The mechanism includes: one reaction for methane oxidation to CO and H2O, onereaction for carbon monoxide oxidation, one reaction for carbon dioxide dissociation, tworeactions for nitric oxide formation via non-equilibrium free radical chemistry, and threereactions for NO formation in zones of the equilibrium free radicals chemistry. Fourmajor pathways of NO formation are considered in the development of the global: NNH,prompt, nitrous oxide, and Zeldovich.
Validation of the new eight step global mechanism is conducted by comparing resultsobtained with it in chemical reactor modeling against the experimental data of Rutar(2000) and Bengtsson (1998) for high-pressure jet-stirred reactors. The comparisonshows that the eight-step global mechanism has a good agreement with GRI 3.0 and theexperimental data for the cases with preheated inlet, an assumption was made in thedevelopment of the global mechanism. The cases with an unheated inlet show that thenew global mechanism under-predicts the CO levels and NO formed via the nitrous oxideand Zeldovich mechanisms. The relative error in these cases is up to 15 %.
The CO2 dissociation reaction of the global mechanism is tuned to match conditions inthe post-flame zone as the gases approach the chemical equilibrium. Because of that theglobal mechanism under-predicts the rate of CO2 dissociation in the non-equilibriumzones of combustion. While in the flame zone this effect seems to be negligible andmechanism predicts the correct amount of CO, just after the flame zone as the gasesbegan to relax toward equilibrium the global mechanism reaches the CO-CO2 equilibriumpoint faster than GRI 3.0.
Due to the absence of hydrocarbon radicals in the global mechanism and thus the absenceof endothermic chemistry in the methane oxidation, the global mechanism tends topredict a higher flame zone temperature than GRI 3.0 when the residence time is close tothe blowout condition. The blowout residence time predicted with the global mechanismis slightly lower than that found by GRI 3.0.
Additional validation of the eight-step global mechanism is obtained by employing it in achemical reactor model simulation of a gas turbine combustor, and comparing the results
79to the simulation using the full GRI 3.0 mechanism. The agreement between the globalmechanism and GRI 3.0 is very close in this test
The new global mechanism is also tested in the commercial CFD code FLUENT 5 formodeling the gas turbine combustor. The can-type combustor is represented as a 2-D axi-symmetric flow with swirl. The momentum equations are closed using the standard k-epsilon closure model. The results of the CFD modeling of Combustor A with the eight-step global mechanism show good agreement of CO and NO exit plane emission with theexperimental data for premixer fuel-air equivalence ratio of 0.6. More modeling effortsare required to find the agreement for cases significantly leaner and richer than the φ of0.6.
5.2 Recommendations
The eight-step global mechanism should be used for modeling LP combustion, where thelocal fuel-air equivalence ratio is less that about 0.8. Generally, the mechanism predictsthe CO and NO emissions most accurately for the cases with an operating pressure of 10to 20 atm and a premixer fuel-air equivalence ratio of 0.5-0.65.
A more rigorous examination of the mechanism should be conducted in the CFDapplications. The global mechanism should be tested using different CFD packages. Amomentum closure model of higher order than k-epsilon, that does not assume isentropicturbulence, should be used. A different diffusion controlled reaction rate model should beused for the simulation or at least the coefficients A and B of the eddy break-up modelshould be adjusted.
80Bibliography
Bengtsson K.U.M., Benz, P., Schareren, R., and Frouzakis, C.E. “NyOx Formation inLean Premixed Combustion of Methane in a High Pressure Jet-Stirred Reactor.” Twenty-Seventh Symposium (International) on Combustion, The combustion institute, (1998):1393-1401.
Borghi, R. “ Turbulent Combustion Modeling”. Progress in Energy and CombustionScience, 14, (1988): 245-292.
Boussinesq, J. Theorie de l’ecoulement tourbillant. Mem. Presentes par Divers Savants,1877.
Bozzelli, J.W., Chang, A.Y., and Dean, A.M. “Analysis of the Reactions H + N2O andNH + NO: Pathways and rate Constants Over a wide Range of Temperature andPressure.” Twenty-Fifth Symposium (International) on Combustion, The combustioninstitute, (1994): 965-974.
Chen, J.C., and Lin, C. A. “Computations of strongly swirling flows with second-momentclosures.” Int. J. Numer. Meth. Fl., 30 (5), (1999): 493-508.
Dryer, F. L., and Glassman I. Fourteenth Symposium International on Combustion, TheCombustion Institute, Pittsburg, PA, 1973, p. 987.
DuPont, V., Pourkashanian, M., and Williams. A. Journal of the Institute Of Energy,66:20, (1993).
Glassman, I. Combustion, Academic Press, 1996.
GRI MECH 2.11. World Wide Web Site http://www.me.berkley.edu/gri_mech/, 1995.
GRI MECH 3.0. World Wide Web Site http://www.me.berkley.edu/gri_mech /, 1997.
Hogg, S. and M. A. Leschziner. “Computation of highly swirling confined flow with aReynolds stress turbulence model.” AIAA J. 27 (1), (1989): 57-63.
Jones, W. P., and Lindstedt, R.P. Combustion and Flame, 73:233, (1988).
Malte, P.C., Nicol, D.G. “CFD Modeling of Combustor A with Evaluation of the Five-Step Mechanism for Methane Oxidation with Nitric Oxide Formation.” Report to SolarTurbine, Inc., San Diego, California (2000).
Mellor, A.M., Editor. “NOx and CO Emissions Models for Gas-Fired, Lean PremixedCombustion Turbine: Final Report”, Vanderbilt University (1996).
81Miller, J.A. and Bowman, C.T. Prog. In Energy and Combust. Science, 15:287 (1989).
Nicol, D.G. “A Chemical and Numerical Study of NOx and Pollutant Formation in Low-Emission Combustion.” Ph.D. Dissertation, University of Washington, Seattle, WA,1995.
Peters, N. (2000). Turbulent Combustion. Cambridge University Press.
Pope, S. “PDF methods for turbulent reactive flows.” Progress in Energy andCombustion Science 11, (1985): 119-192.
Rutar-Shuman, T. “ NOx and CO Formation for Lean-Premixed Methane-AirCombustion in a Jet-Stirred Reactor Operated at Elevated Pressure,” Ph.D. Dissertation,University of Washington, Seattle, WA, 2000.
Rutar, T., Malte P.C. “NOx Formation in High-Pressure Jet-Stirred Reactors withSignificance to Lean-Premixed Combustion Turbines.” 2001-GT-0067, (2001)
Steele R.C. “NOx and N2O in Lean-Premixed Jet Stirred Reactors Operated from 1 to 7atm.” Ph.D. Dissertation, University of Washington, Seattle, WA, 1995.
Turns, S.R. An Introduction to Combustion. McGraw-Hill, 2000.
Westbrook, C.K., and Dryer, F.L. Prog. Progress in Energy and Combustion Science,10:1, (1984).
Wilcox, D. C. (1993). Turbulence Modeling for CFD. La Canada, California: DCWIndustries, Inc.